Embed Size (px)
Citation preview

THE POWER OF THE MINE A TRANSFORMATIVE OPPORTUNITY FOR SUB-SAHARAN AFRICA
Sudeshna Ghosh Banerjee, Zayra Romo, Gary McMahon
Perrine Toledano, Peter Robinson
1/24/2014
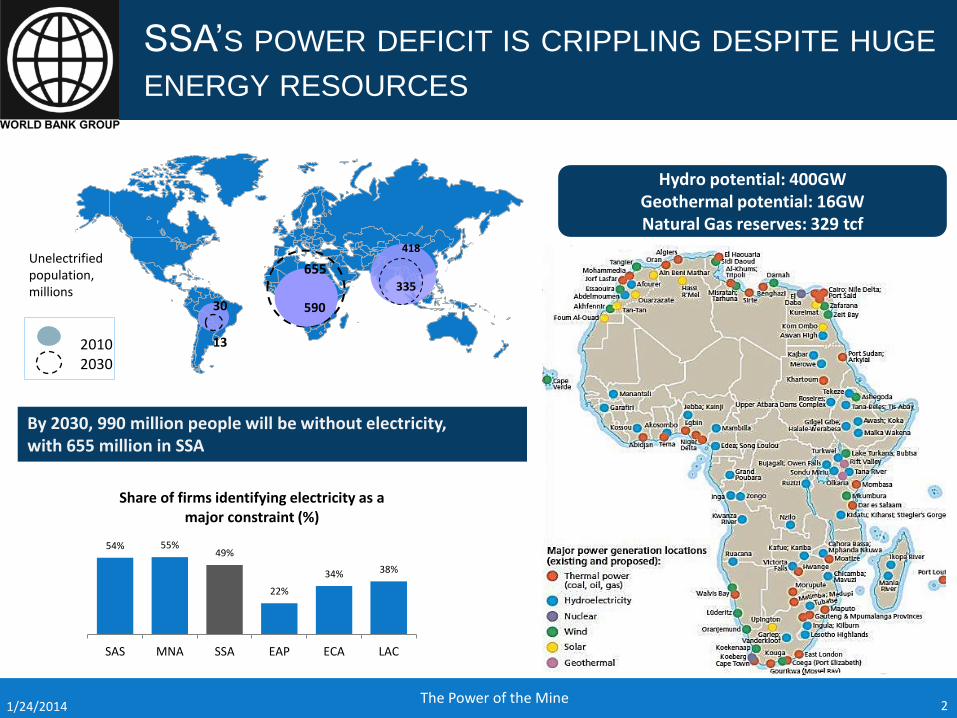
SSA’S POWER DEFICIT IS CRIPPLING DESPITE HUGE
ENERGY RESOURCES
2 The Power of the Mine
2010 2030
13
30 590
655
418
335
Unelectrified population, millions
By 2030, 990 million people will be without electricity, with 655 million in SSA
54% 55% 49%
22%
34% 38%
SAS MNA SSA EAP ECA LAC
Share of firms identifying electricity as a major constraint (%)
Hydro potential: 400GW Geothermal potential: 16GW Natural Gas reserves: 329 tcf
1/24/2014

3 1/24/2014
2.0
11.5
1.25
16.0
10.5
4.0
11.6
3.5
1.5
4.5
5.0
5.0
0 5 10 15 20 25
Burkina Faso
DRC
Ghana
Guinea
Liberia
Mauritania
Mozambique
Namibia
Niger
Sierra Leone
Tanzania
Zambia
Investment, 2000-2012 Forecast Investment, 2013-20 (US$ billions)
Investment and forecasted investment ($ billions)
Forecast investment (2013–20) as a % of GDP, 2012
[Forecasted investment/GDP]
95%
80%
27%
23%
118%
19%
64%
3%
236%
593%
18%
24%
66%
74%
50%
41%
36%
68%
91%
48%
65%
21%
41%
78%
Mining exports as % of total exports
(2010)
11%
na
na
na
6%
12%
2%
25%
na
4%
27%
na
Mining fiscal revenues as % of total revenues
(2010) Mining development
Opportunity for exports
+
Domestic use for growth
+
Anchor for economic and infrastructure development
SSA’S MINING INDUSTRY COULD BE AN OPPORTUNITY TO UNLOCK THESE RESOURCES
The Power of the Mine
SSA is largely unexplored - absolute amount of spending on exploration increased by more than 700% between 2000 and 2012
4 1/24/2014
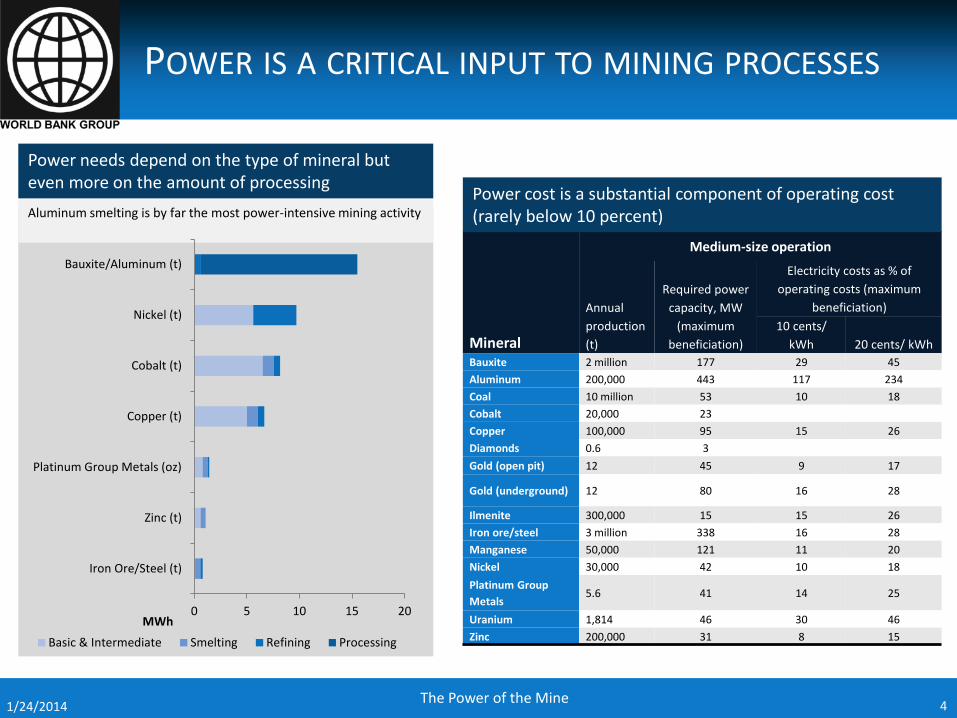
Power needs depend on the type of mineral but even more on the amount of processing
Aluminum smelting is by far the most power-intensive mining activity
Mineral
Medium-size operation
Annual
production
(t)
Required power
capacity, MW
(maximum
beneficiation)
Electricity costs as % of
operating costs (maximum
beneficiation)
10 cents/
kWh 20 cents/ kWh
Bauxite 2 million 177 29 45
Aluminum 200,000 443 117 234
Coal 10 million 53 10 18
Cobalt 20,000 23
Copper 100,000 95 15 26
Diamonds 0.6 3
Gold (open pit) 12 45 9 17
Gold (underground) 12 80 16 28
Ilmenite 300,000 15 15 26
Iron ore/steel 3 million 338 16 28
Manganese 50,000 121 11 20
Nickel 30,000 42 10 18
Platinum Group
Metals 5.6 41 14 25
Uranium 1,814 46 30 46
Zinc 200,000 31 8 15
Power cost is a substantial component of operating cost (rarely below 10 percent)
0 5 10 15 20
Iron Ore/Steel (t)
Zinc (t)
Platinum Group Metals (oz)
Copper (t)
Cobalt (t)
Nickel (t)
Bauxite/Aluminum (t)
MWh
Basic & Intermediate Smelting Refining Processing
POWER IS A CRITICAL INPUT TO MINING PROCESSES
The Power of the Mine
5 1/24/2014
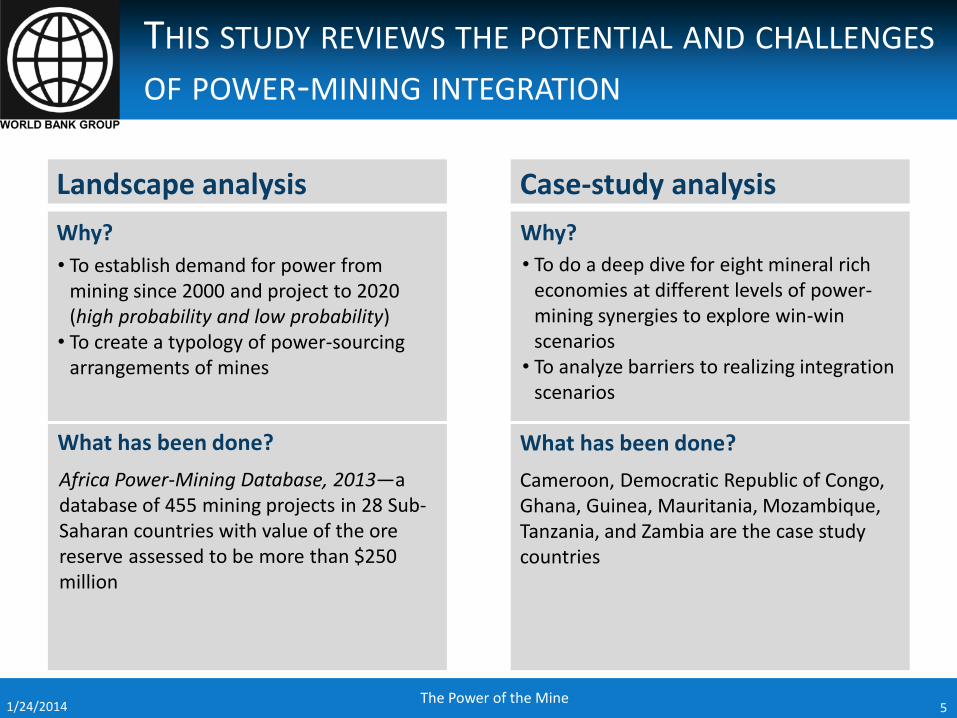
Landscape analysis Case-study analysis
Why?
• To establish demand for power from mining since 2000 and project to 2020 (high probability and low probability) • To create a typology of power-sourcing
arrangements of mines
What has been done?
Africa Power-Mining Database, 2013—a database of 455 mining projects in 28 Sub-Saharan countries with value of the ore reserve assessed to be more than $250 million
Why?
What has been done?
• To do a deep dive for eight mineral rich economies at different levels of power-mining synergies to explore win-win scenarios • To analyze barriers to realizing integration
scenarios
Cameroon, Democratic Republic of Congo, Ghana, Guinea, Mauritania, Mozambique, Tanzania, and Zambia are the case study countries
THIS STUDY REVIEWS THE POTENTIAL AND CHALLENGES OF POWER-MINING INTEGRATION
The Power of the Mine

THE OPPORTUNITY – POTENTIAL OF POWER-MINING INTEGRATION
The Power of the Mine 6 1/24/2014
7 1/24/2014
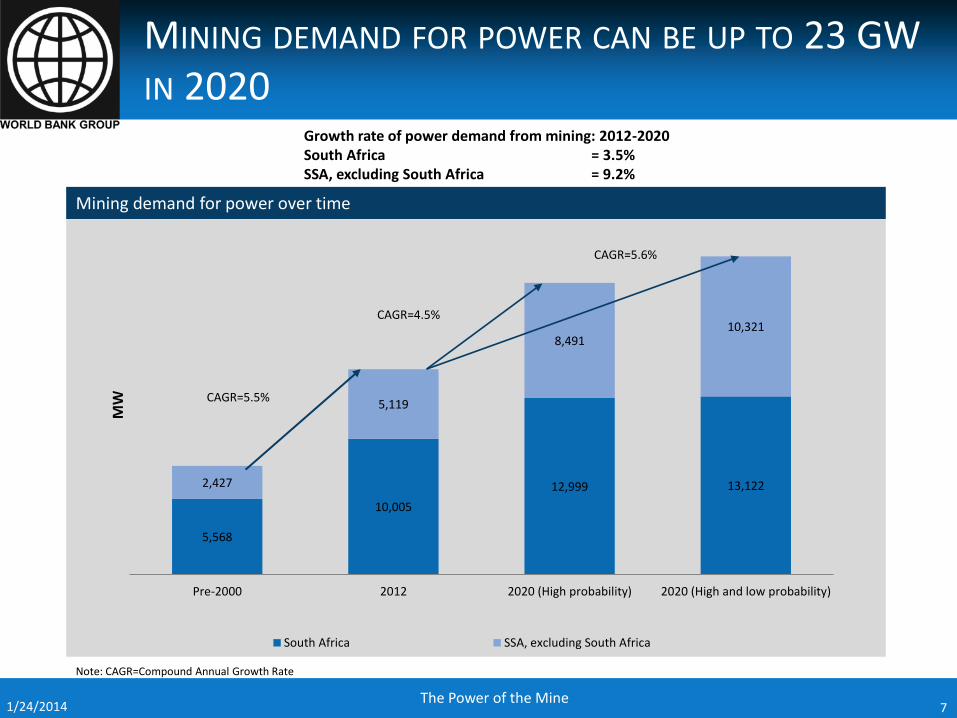
Growth rate of power demand from mining: 2012-2020 South Africa = 3.5% SSA, excluding South Africa = 9.2%
Mining demand for power over time
5,568
10,005
12,999 13,122 2,427
5,119
8,491 10,321
Pre-2000 2012 2020 (High probability) 2020 (High and low probability)
MW
South Africa SSA, excluding South Africa
CAGR=4.5%
CAGR=5.6%
CAGR=5.5%
MINING DEMAND FOR POWER CAN BE UP TO 23 GW IN 2020
The Power of the Mine
Note: CAGR=Compound Annual Growth Rate

8 1/24/2014
A FEW MINERALS AND STAGE OF BENEFICIATION WILL DETERMINE POWER DEMAND FROM MINING
The Power of the Mine
0 500 1,000 1,500 2,000 2,500 3,000
Palladium
Silico-manganese
Manganese
Others
Bauxite
Uranium
Ilmenite
Coal
Iron ore
Platinum
Zirconium
Gold
Chromium
Platinum group metals
Copper
Aluminum
MW
0 5,000 10,000
Separation
Crushed
Intermediate
Processed
Smelted
Refined
MW
Pre-2000
2012
2020 (High probability)
2020 (High and low probability)
Iron ore and PGM will experience the largest increase in power demand Refining and smelting together are almost two-thirds of the total power demand

9 1/24/2014
Comparison of mining and nonmining demand
0
10,000
20,000
30,000
40,000
50,000
60,000
70,000
80,000
90,000
Mining demand Non-mining demand
MW
2012 2020
CAGR 5.7%
CAGR 3.3%
48%
50%
52%
64%
74%
84%
97%
135%
294%
326%
0% 50% 100% 150% 200% 250% 300% 350%
Cameroon
Congo, Rep. of the
Congo, Dem. Rep. of
Zambia
Namibia
Niger
Sierra Leone
Mozambique
Guinea
Liberia
Mining demand as % of total non-mining demand
MINING DEMAND FOR POWER CAN BE OVERWHELMING IN A FEW COUNTRIES
The Power of the Mine
Note: CAGR = Compound annual growth rate

10
Self-supply Self-supply
+ CSR
Self-supply + sell to the
grid
Grid supply + self supply
backup
Mines sell collectively to
grid Mines invest in
grid
Mines serve as anchor demand
for IPP Grid supply
De
scri
pti
on
Mine produces its own power for its own needs
Mine provides power to community through mini-grids or off-grid solutions
Mine produces its own power and sells excess power to the grid
The mine is first connected to the grid and is moving into own-generation when more economical
Coordinated investment by a group of mines, producers, and users in one large power plant off-site connected to the grid
Mine invests with government in new, or in the upgrading of, power assets under different arrangements
Mine buys power from an independent power producer and serves as an anchor customer
Mine does not produce any power, but buys 100% from the grid
Mai
n
Gen
erat
ion
d
rive
rs
Diesel HFO
Diesel HFO
Coal, Gas, Hydro
Diesel HFO
Diesel, HFO, Solar Hydro, Gas Any Any
Pre
sen
ce
Mali and Guinea (hydro) Sierra Leone and Liberia (oil)
Guinea Madagascar
Zimbabwe Mozambique Cameroon
Democratic Republic of Congo Tanzania
Ghana Niger Democratic Republic of Congo
South Africa Mozambique Zambia
Intermediate 1 3
2
THERE ARE SIX DISTINCT INTERMEDIATE POWER SOURCING ARRANGEMENTS
The Power of the Mine 1/24/2014

0
200
400
600
800
1,000
1,200
Grid supply Intermediate Self supply
GW
h
Pre-2000 2001-2012 2020
8 25 62 71 43
87
123 132
76
147
171
189
Pre-2000 2001-2012 2020 (Highprobability)
2020 (High and lowprobability)
Nu
mb
er o
f p
roje
cts
Self supply Intermediate Grid supply
Average annual energy consumption has increased only for Intermediate options
CAGR for the three arrangements (pre-2000 to 2020): Self-supply – 11.4%
Intermediate – 6.04% Grid supply – 5.09%
AVERAGE ENERGY CONSUMPTION IS EXPECTED TO RISE FOR INTERMEDIATE ARRANGEMENTS
The Power of the Mine 11 1/24/2014

0%
20%
40%
60%
80%
100%
0%
50%
100%
Po
wer
arr
ange
men
t (%
)
Hyd
roel
ectr
ic p
ow
er
(%)
% Grid Supply % Intermediate % Self Supply Share of hydro in national power produciton (%)
0%
20%
40%
60%
80%
100%
0
5
10
15
20
25
30
35
Po
wer
arr
ange
men
t (%
)
Nu
mb
er o
f o
uta
ges
% Grid Supply % Intermediate % Self Supply Number of electrical outages in a typical month
12 1/24/2014
0%
50%
100%
0
20
40
60
Po
wer
arr
ange
men
t (%
)
Elec
tric
tar
iff
(cen
ts/k
Wh
)
% Grid Supply % Intermediate % Self Supply Electricity tariff (cents/kWh)
A COMPLEX MIX OF FACTORS - RELIABILITY, FUEL MIX, TARIFFS - DECIDE POWER SOURCING ARRANGEMENT
The Power of the Mine

Mines investment in self –supply power infrastructure
2000-2012: $1.3 billion 2013-2020: $1.4 - $ 3.3 billion
13
Utility
Loss of large customers
Loss of an opportunity to use the mines as anchor customers exhibiting economies of scale
Mines Direct cost of self-supply is generally much higher (offset by continuous supply and consistent product quality)
Country
Weak utility
Loss of exports and tax revenues
Negative impact on GDP, and reduced employment opportunities
SELF-SUPPLY IS A LOSS TO UTILITY, MINES—AND THE COUNTRY
The Power of the Mine 1/24/2014
SCENARIOS OF POWER-MINING INTEGRATION – A WIN-WIN
The Power of the Mine 14 1/24/2014
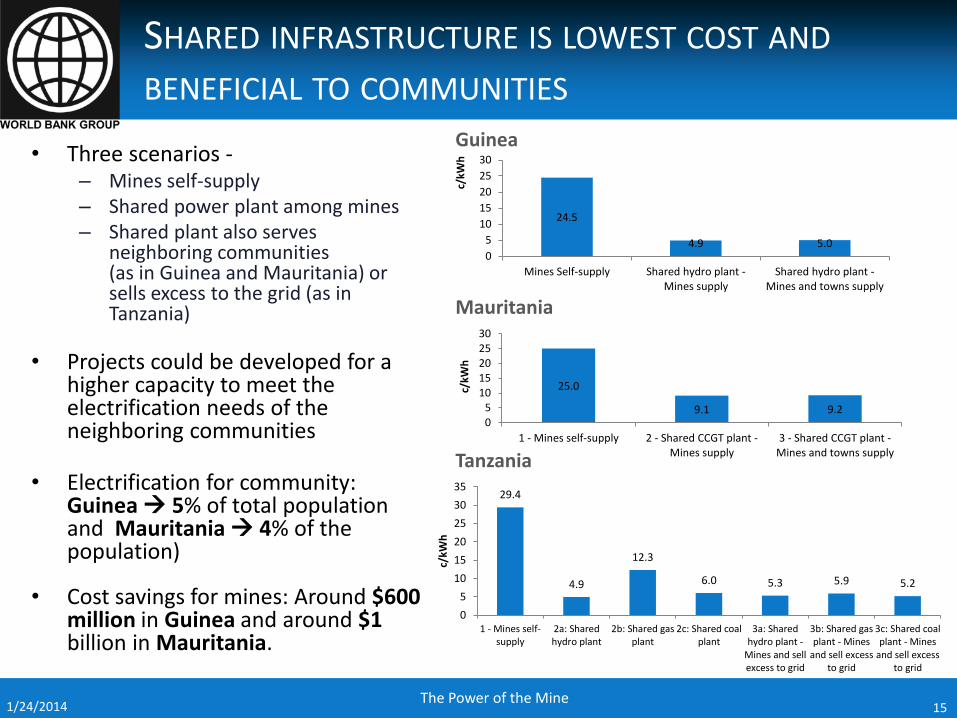
• Three scenarios - – Mines self-supply – Shared power plant among mines – Shared plant also serves
neighboring communities (as in Guinea and Mauritania) or sells excess to the grid (as in Tanzania)
• Projects could be developed for a higher capacity to meet the electrification needs of the neighboring communities
• Electrification for community: Guinea 5% of total population and Mauritania 4% of the population)
• Cost savings for mines: Around $600 million in Guinea and around $1 billion in Mauritania.
24.5
4.9 5.0 0
5
10
15
20
25
30
Mines Self-supply Shared hydro plant -Mines supply
Shared hydro plant -Mines and towns supply
c/kW
h
25.0
9.1 9.2 05
1015202530
1 - Mines self-supply 2 - Shared CCGT plant -Mines supply
3 - Shared CCGT plant -Mines and towns supply
c/kW
h
29.4
4.9
12.3
6.0 5.3 5.9 5.2
0
5
10
15
20
25
30
35
1 - Mines self-supply
2a: Sharedhydro plant
2b: Shared gasplant
2c: Shared coalplant
3a: Sharedhydro plant -
Mines and sellexcess to grid
3b: Shared gasplant - Mines
and sell excessto grid
3c: Shared coalplant - Mines
and sell excessto grid
c/kW
h
Guinea
Mauritania
Tanzania
SHARED INFRASTRUCTURE IS LOWEST COST AND BENEFICIAL TO COMMUNITIES
The Power of the Mine 15 1/24/2014
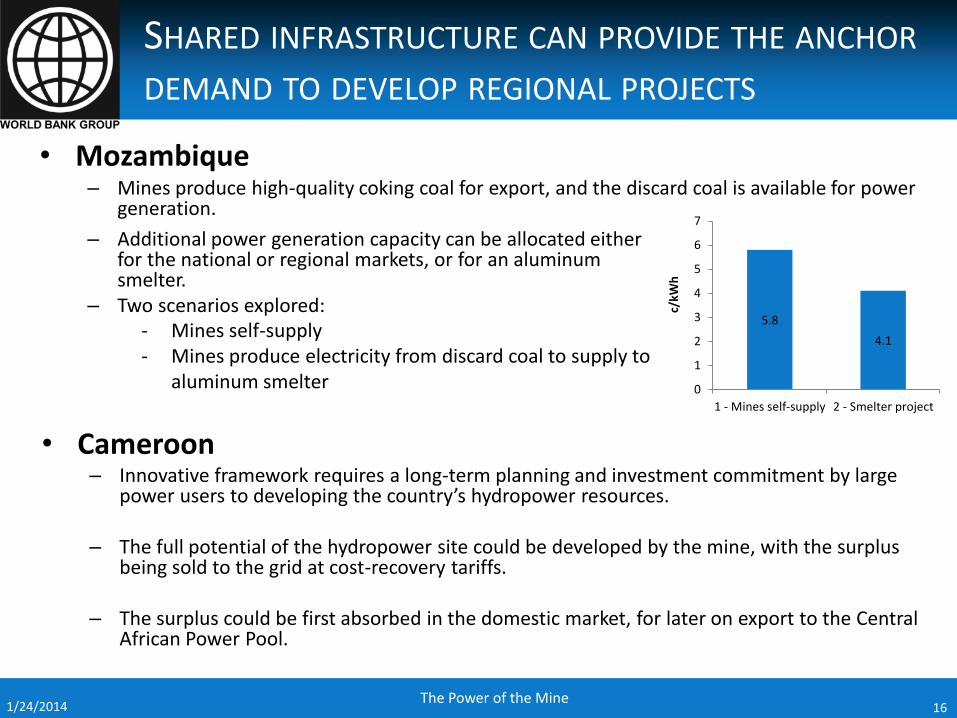
5.8
4.1
0
1
2
3
4
5
6
7
1 - Mines self-supply 2 - Smelter project
c/kW
h
• Mozambique – Mines produce high-quality coking coal for export, and the discard coal is available for power
generation.
SHARED INFRASTRUCTURE CAN PROVIDE THE ANCHOR DEMAND TO DEVELOP REGIONAL PROJECTS
The Power of the Mine 16 1/24/2014
– Additional power generation capacity can be allocated either for the national or regional markets, or for an aluminum smelter.
– Two scenarios explored: - Mines self-supply - Mines produce electricity from discard coal to supply to
aluminum smelter
• Cameroon – Innovative framework requires a long-term planning and investment commitment by large
power users to developing the country’s hydropower resources.
– The full potential of the hydropower site could be developed by the mine, with the surplus being sold to the grid at cost-recovery tariffs.
– The surplus could be first absorbed in the domestic market, for later on export to the Central
African Power Pool.

• At least $6 billion in private– public investment opportunities in Guinea, Mauritania, Tanzania, Mozambique
– Mozambique option – Power plant along with the smelter - $4.5 billion.
– Guinea option - 300 MW hydro plant – $595 million
– Mauritania option – 150 MW combined cycle plant – $142 million
– Tanzania option – 300 MW hydro, coal, gas-fired ~ $400 million
• With a desirable investment climate, potentially viable projects exist for the independent power producers and the governments.
17 1/24/2014
SHARED INFRASTRUCTURE CAN PROVIDE BANKABLE PUBLIC-PRIVATE INVESTMENT OPPORTUNITIES
The Power of the Mine

RISKS IN POWER-MINING INTEGTRATION – OPTIONS FOR POLICYMAKERS
The Power of the Mine 18 1/24/2014
19
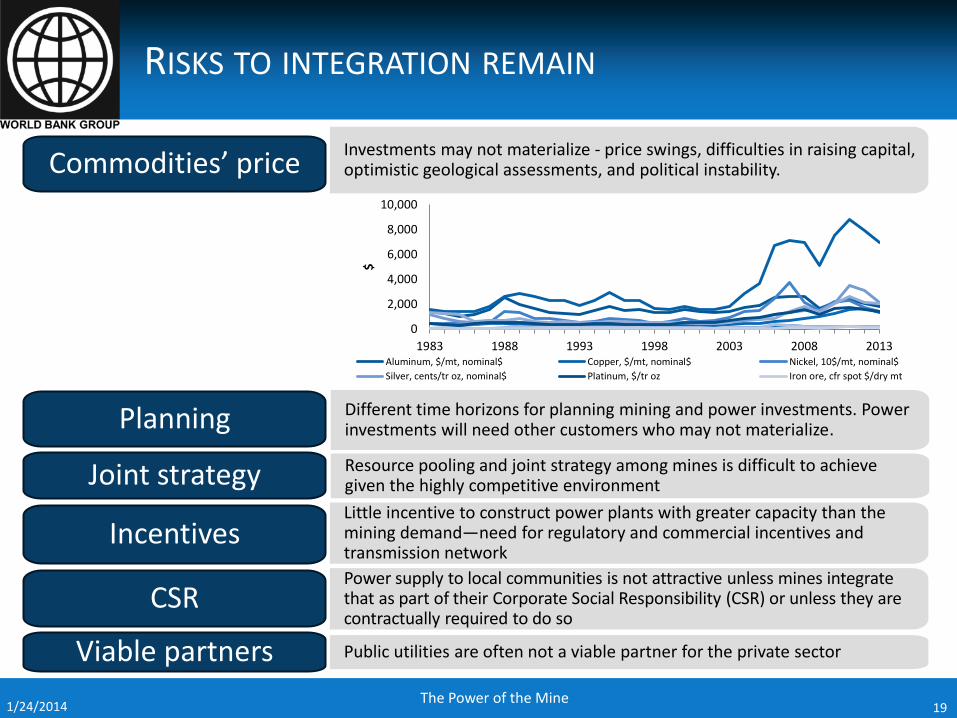
Different time horizons for planning mining and power investments. Power investments will need other customers who may not materialize. Planning
Resource pooling and joint strategy among mines is difficult to achieve given the highly competitive environment Joint strategy Little incentive to construct power plants with greater capacity than the mining demand—need for regulatory and commercial incentives and transmission network
Incentives
Power supply to local communities is not attractive unless mines integrate that as part of their Corporate Social Responsibility (CSR) or unless they are contractually required to do so
CSR
Public utilities are often not a viable partner for the private sector Viable partners
0
2,000
4,000
6,000
8,000
10,000
1983 1988 1993 1998 2003 2008 2013
$
Aluminum, $/mt, nominal$ Copper, $/mt, nominal$ Nickel, 10$/mt, nominal$
Silver, cents/tr oz, nominal$ Platinum, $/tr oz Iron ore, cfr spot $/dry mt
Commodities’ price Investments may not materialize - price swings, difficulties in raising capital, optimistic geological assessments, and political instability.
RISKS TO INTEGRATION REMAIN
The Power of the Mine 1/24/2014
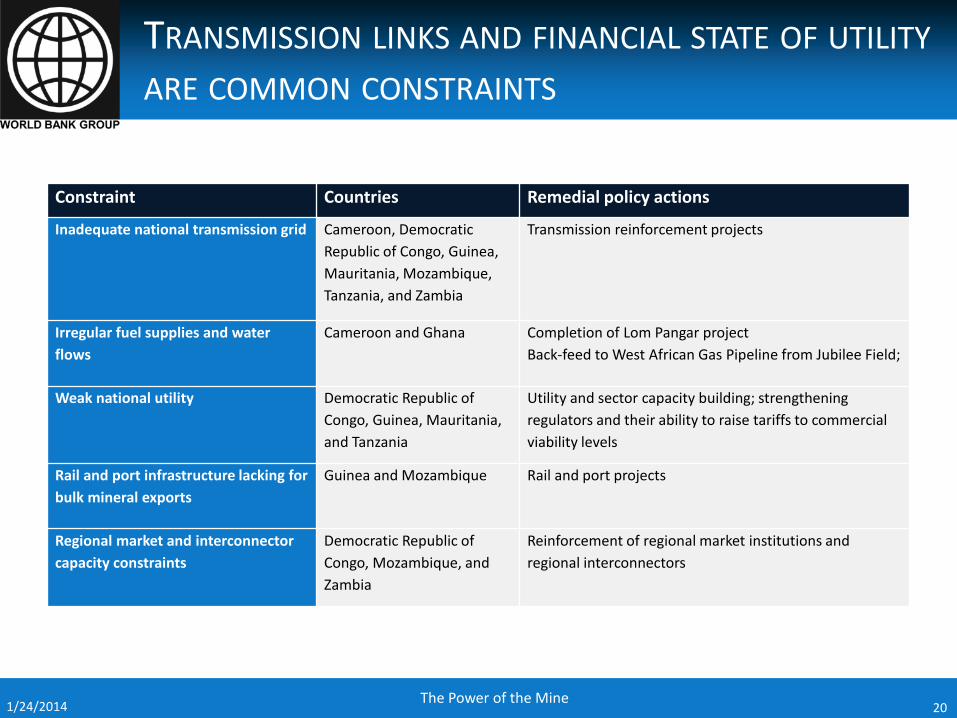
Constraint Countries Remedial policy actions
Inadequate national transmission grid Cameroon, Democratic
Republic of Congo, Guinea,
Mauritania, Mozambique,
Tanzania, and Zambia
Transmission reinforcement projects
Irregular fuel supplies and water
flows
Cameroon and Ghana Completion of Lom Pangar project
Back-feed to West African Gas Pipeline from Jubilee Field;
Weak national utility Democratic Republic of
Congo, Guinea, Mauritania,
and Tanzania
Utility and sector capacity building; strengthening
regulators and their ability to raise tariffs to commercial
viability levels
Rail and port infrastructure lacking for
bulk mineral exports
Guinea and Mozambique Rail and port projects
Regional market and interconnector
capacity constraints
Democratic Republic of
Congo, Mozambique, and
Zambia
Reinforcement of regional market institutions and
regional interconnectors
20 1/24/2014
TRANSMISSION LINKS AND FINANCIAL STATE OF UTILITY ARE COMMON CONSTRAINTS
The Power of the Mine
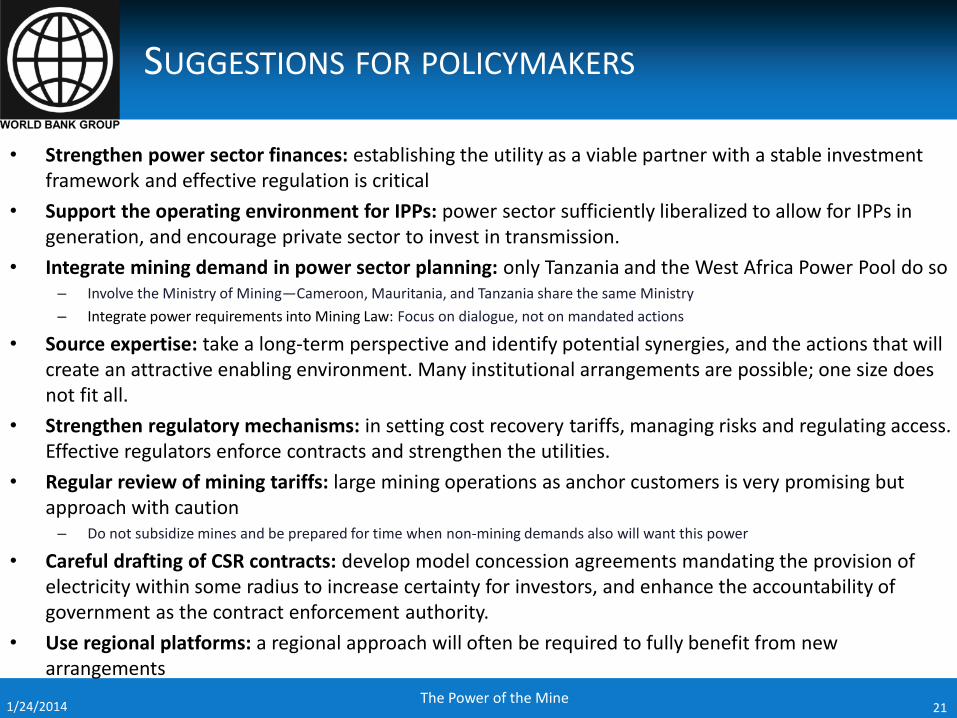
• Strengthen power sector finances: establishing the utility as a viable partner with a stable investment framework and effective regulation is critical
• Support the operating environment for IPPs: power sector sufficiently liberalized to allow for IPPs in generation, and encourage private sector to invest in transmission.
• Integrate mining demand in power sector planning: only Tanzania and the West Africa Power Pool do so – Involve the Ministry of Mining—Cameroon, Mauritania, and Tanzania share the same Ministry
– Integrate power requirements into Mining Law: Focus on dialogue, not on mandated actions
• Source expertise: take a long-term perspective and identify potential synergies, and the actions that will create an attractive enabling environment. Many institutional arrangements are possible; one size does not fit all.
• Strengthen regulatory mechanisms: in setting cost recovery tariffs, managing risks and regulating access. Effective regulators enforce contracts and strengthen the utilities.
• Regular review of mining tariffs: large mining operations as anchor customers is very promising but approach with caution – Do not subsidize mines and be prepared for time when non-mining demands also will want this power
• Careful drafting of CSR contracts: develop model concession agreements mandating the provision of electricity within some radius to increase certainty for investors, and enhance the accountability of government as the contract enforcement authority.
• Use regional platforms: a regional approach will often be required to fully benefit from new arrangements
21 1/24/2014
SUGGESTIONS FOR POLICYMAKERS
The Power of the Mine
THANK YOU! Questions or comments?
22
Gary McMahon Senior Mining Specialist [email protected] http://www.worldbank.org/energy/
The Power of the Mine 1/24/2014

Background Slides
The Power of the Mine 23 1/24/2014
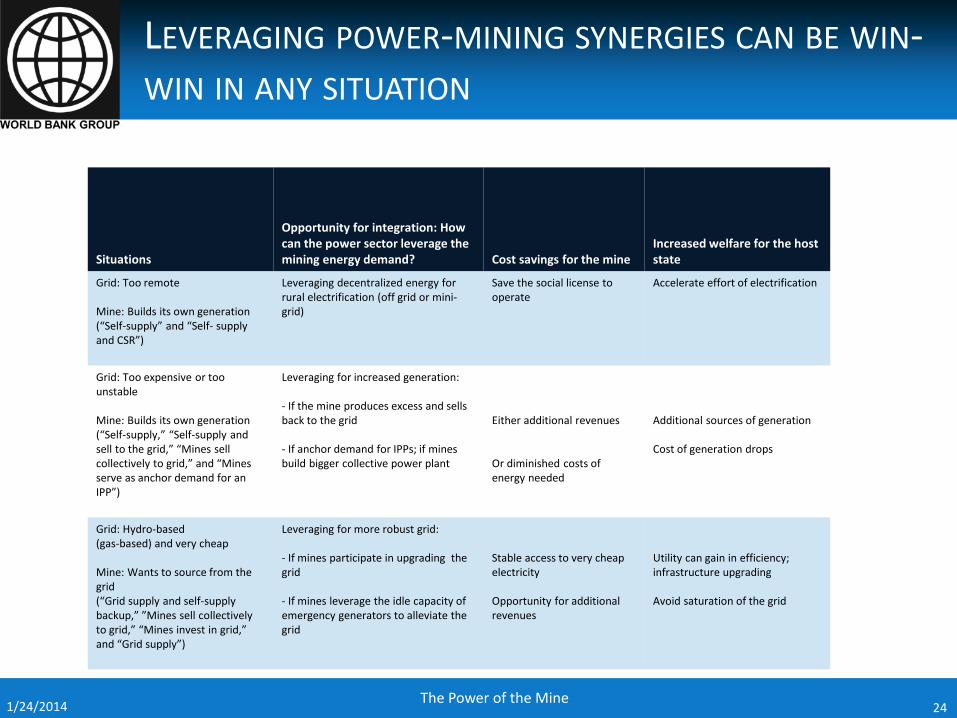
Situations
Opportunity for integration: How can the power sector leverage the mining energy demand? Cost savings for the mine
Increased welfare for the host state
Grid: Too remote Mine: Builds its own generation (“Self-supply” and “Self- supply and CSR”)
Leveraging decentralized energy for rural electrification (off grid or mini-grid)
Save the social license to operate
Accelerate effort of electrification
Grid: Too expensive or too unstable Mine: Builds its own generation (“Self-supply,” “Self-supply and sell to the grid,” “Mines sell collectively to grid,” and “Mines serve as anchor demand for an IPP”)
Leveraging for increased generation: - If the mine produces excess and sells back to the grid
- If anchor demand for IPPs; if mines build bigger collective power plant
Either additional revenues Or diminished costs of energy needed
Additional sources of generation Cost of generation drops
Grid: Hydro-based (gas-based) and very cheap Mine: Wants to source from the grid (“Grid supply and self-supply backup,” ”Mines sell collectively to grid,” “Mines invest in grid,” and “Grid supply”)
Leveraging for more robust grid: - If mines participate in upgrading the grid - If mines leverage the idle capacity of emergency generators to alleviate the grid
Stable access to very cheap electricity Opportunity for additional revenues
Utility can gain in efficiency; infrastructure upgrading Avoid saturation of the grid
24 1/24/2014
LEVERAGING POWER-MINING SYNERGIES CAN BE WIN-WIN IN ANY SITUATION
The Power of the Mine

Power-Mine Synergy Supporting Conditions
Mines supplies power to the communities (rural electrification)
Contractual requirement Coordination between mining companies & donors/govts/NGOs Clear framework allocating responsibilities Each party has sufficient capacity Presence of local govt/utility in rural areas Effective demand/willingness to pay
Mines sells excess power to the grid
Liberalized power market with clear legislative & regulatory framework Excess capacity built in at design phase Commercially viable offtake agreement between company & utility Credible state-owned company (if offtaker) Adequate transmission infrastructure Demand for excess power
Mines as an anchor for IPP Liberalized power market with clear legislative & regulatory framework Sufficient IPP power supply for mining demand and national grid Sufficiently low cost & reliable power supply (relative to self-supply) Power plant and mine on same timetable Investment in transmission infrastructure to supply power to mine Utility is credible partial offtaker of power from IPP
Mines source from grid Sufficient & reliable national power supply Cost of power low enough to act as disincentive to self-supply but high enough to achieve cost recovery Transmission infrastructure in place or manageable investment Management of mines’ power demand so as not to saturate the grid Commercial frameworks provide incentive for mines to participate in infrastructure upgrades & development of power generation capacity
Source: Toledano, Perrine; Sophie Thomashausen; Nicolas Maennling; and Alpa Shah (forthcoming), A Framework to Approach Shared Use of Mining-Related Infrastructure, Vale Columbia Center on Sustainable International Investment, New York, New York.
SUPPORTING CONDITIONS FOR POWER-MINE INTEGRATION
The Power of the Mine 25 1/24/2014