Embed Size (px)
DESCRIPTION
A Topological Framework for Local Structure Analysis in Condensed Matter
Citation preview
A Topological Framework for Local Structure Analysis in Condensed Matter
Emanuel A. Lazar1, Jian Han1, David J. Srolovitz1,21Department of Materials Science and Engineering
2Department of Mechanical Engineering and Applied MechanicsUniversity of Pennsylvania, Philadelphia, Pennsylvania 19104, USA.
(Dated: August 26, 2015)
Physical systems are frequently modeled as sets of points in space, each representing the positionof an atom, molecule, or mesoscale particle. As many properties of such systems depend on theunderlying ordering of their constituent particles, understanding that structure is a primary objectiveof condensed matter research. Although perfect crystals are fully described by a set of translationand basis vectors, real-world materials are never perfect, as thermal vibrations and defects introducesignificant deviation from ideal order. Meanwhile, liquids and glasses present yet more complexity.A complete understanding of structure thus remains a central, open problem. Here we proposea unified mathematical framework, based on the topology of the Voronoi cell of a particle, forclassifying local structure in ordered and disordered systems that is powerful and practical. Weexplain the underlying reason why this topological description of local structure is better suited forstructural analysis than continuous descriptions. We demonstrate the connection of this approachto the behavior of physical systems and explore how crystalline structure is compromised at elevatedtemperatures. We also illustrate potential applications to identifying defects in plastically deformedpolycrystals at high temperatures, automating analysis of complex structures, and characterizinggeneral disordered systems.
Condensed matter systems are often abstracted aslarge sets of points in space, each representing the po-sition of an atom, molecule, or mesoscale particle. Twochallenges frequently encountered when studying systemsat this scale are classifying and identifying local struc-ture. Simulation studies of nucleation, crystallization,and melting, for example, as well as those of defect mi-gration and transformation, require a precise understand-ing of which particles are associated with which phases,and which are associated with defects. As these systemsare abstracted as large point sets, these dual challengesof classifying and identifying structure reduce to ones ofunderstanding arrangements of points in space.
A primary difficulty in classifying structure in spatialpoint sets arises from a tension between a desire for com-pleteness and the necessity for practicality. The localneighborhood of a particle within an ensemble of par-ticles can be completely described by a list of relativepositions of each of its neighbors. However, while sucha list of coordinates is complete in some sense, this rawdata provides little direct insight, leaving us wanting for apractical and more illuminating description. This tensionis often mediated by the choice of an “order parameter”,which distills structural data into a single number or vec-tor, and which is constructed to be both informative andcomputationally tractable [1].
A central limitation of conventional order parametersis exhibited in degeneracies that arise in describing neigh-borhoods that are structurally distinct but which mapto identical order-parameter values. Some order parame-ters classify particles in face-centered cubic (FCC) andbody-centered cubic (BCC) crystals identically, whileothers classify particles in FCC and hexagonal close-packed (HCP) crystals identically [2]. Similarly, parti-cles located near defects in a low-temperature crystal can
have order-parameter values identical to those of parti-cles in a high-temperature defect-free crystal. These de-generacies point to an inherent incompleteness in suchorder-parameter classifications of local structure. Conse-quently, different order parameters are necessary to studydifferent systems [1, 2].
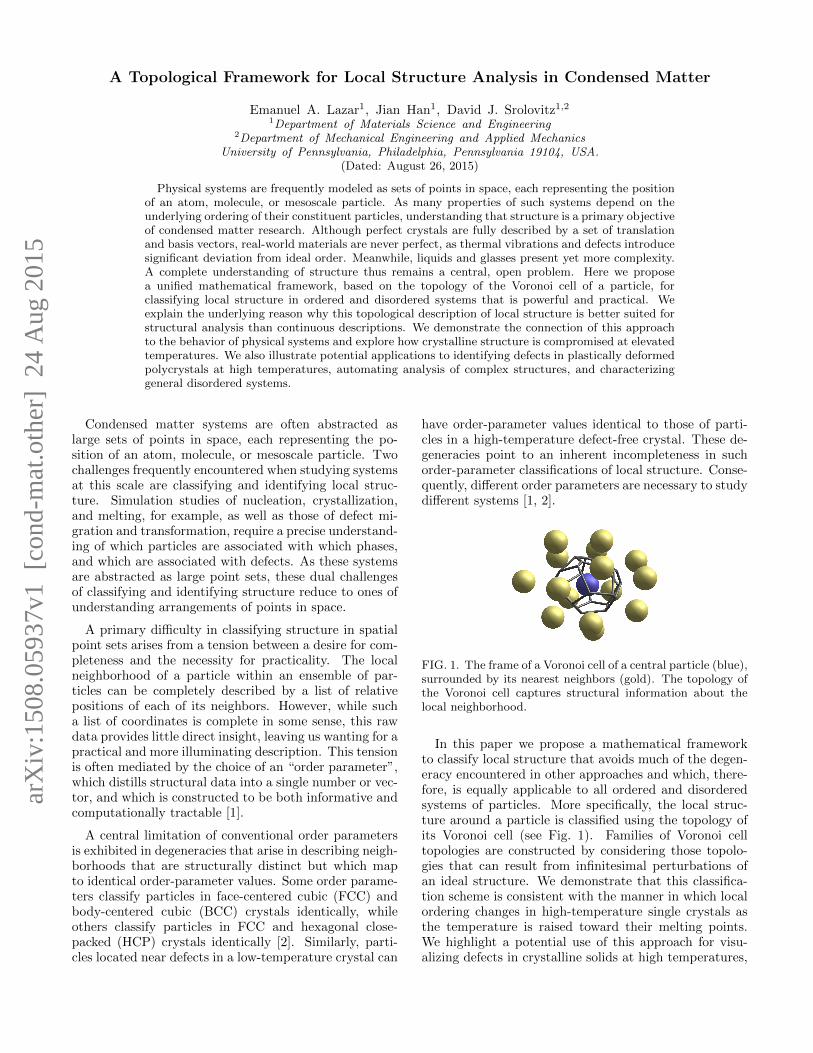
FIG. 1. The frame of a Voronoi cell of a central particle (blue),surrounded by its nearest neighbors (gold). The topology ofthe Voronoi cell captures structural information about thelocal neighborhood.
In this paper we propose a mathematical frameworkto classify local structure that avoids much of the degen-eracy encountered in other approaches and which, there-fore, is equally applicable to all ordered and disorderedsystems of particles. More specifically, the local struc-ture around a particle is classified using the topology ofits Voronoi cell (see Fig. 1). Families of Voronoi celltopologies are constructed by considering those topolo-gies that can result from infinitesimal perturbations ofan ideal structure. We demonstrate that this classifica-tion scheme is consistent with the manner in which localordering changes in high-temperature single crystals asthe temperature is raised toward their melting points.We highlight a potential use of this approach for visu-alizing defects in crystalline solids at high temperatures,
arX
iv:1
508.
0593
7v1
[co
nd-m
at.o
ther
] 2
4 A
ug 2
015
2
and contrast it with previous methods. We then demon-strate an application of this approach to the automatedanalysis of the evolution of complex structures, whereconventional methods are often inadequate. Finally, weshow an application in which this approach is used toprovide robust statistical-structural descriptors for char-acterizing disordered systems.
I. THEORY
A. The Configuration Space of Local Structure
A deeper understanding of local structure can be devel-oped through consideration of all possible arrangementsof neighbors of a central particle. The local neighborhoodof a particle within an ensemble of particles can be com-pletely described by a vector of relative positions of itsn nearest neighbors: x = (r1, r2, ..., rn), where ri is therelative position of the ith neighbor of a central particle.For suitably large n, any question about the local neigh-borhood of a particle can be answered through completeknowledge of x. We use C(n) to denote the configurationspace of all possible arrangements of n nearest neighbors:
C(n) = {(r1, r2, ..., rn) : ri ∈ R3}. (1)
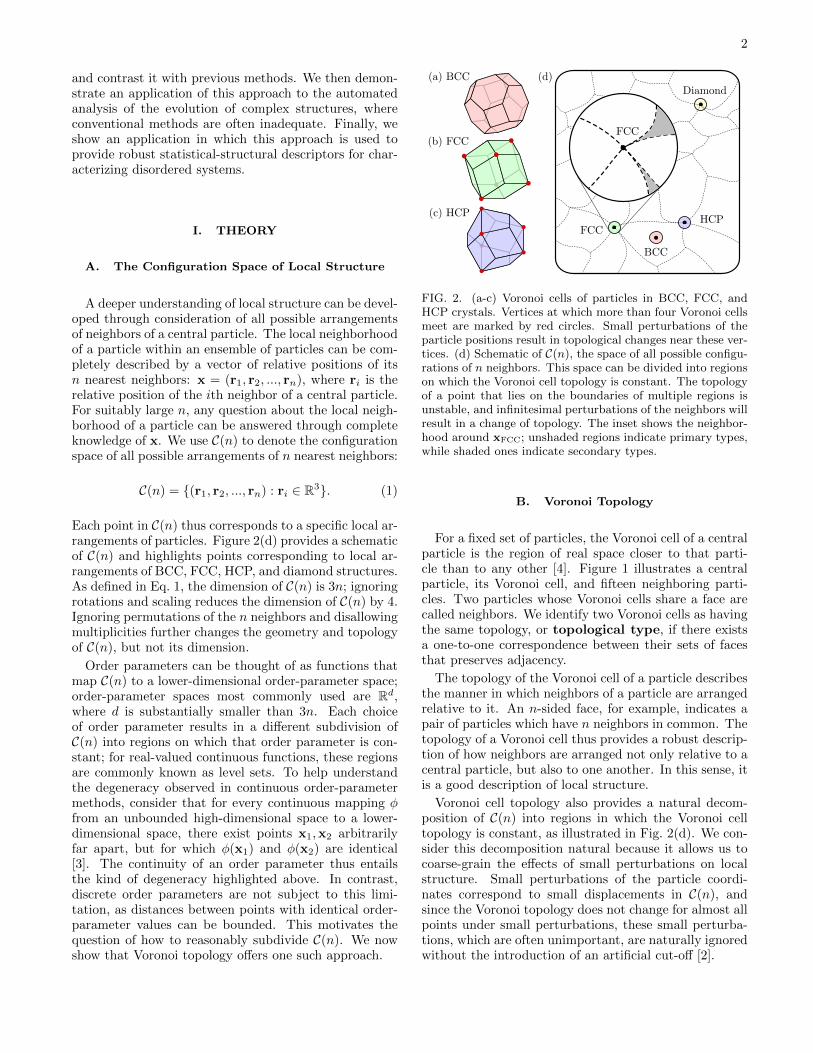
Each point in C(n) thus corresponds to a specific local ar-rangements of particles. Figure 2(d) provides a schematicof C(n) and highlights points corresponding to local ar-rangements of BCC, FCC, HCP, and diamond structures.As defined in Eq. 1, the dimension of C(n) is 3n; ignoringrotations and scaling reduces the dimension of C(n) by 4.Ignoring permutations of the n neighbors and disallowingmultiplicities further changes the geometry and topologyof C(n), but not its dimension.
Order parameters can be thought of as functions thatmap C(n) to a lower-dimensional order-parameter space;order-parameter spaces most commonly used are Rd,where d is substantially smaller than 3n. Each choiceof order parameter results in a different subdivision ofC(n) into regions on which that order parameter is con-stant; for real-valued continuous functions, these regionsare commonly known as level sets. To help understandthe degeneracy observed in continuous order-parametermethods, consider that for every continuous mapping φfrom an unbounded high-dimensional space to a lower-dimensional space, there exist points x1,x2 arbitrarilyfar apart, but for which φ(x1) and φ(x2) are identical[3]. The continuity of an order parameter thus entailsthe kind of degeneracy highlighted above. In contrast,discrete order parameters are not subject to this limi-tation, as distances between points with identical order-parameter values can be bounded. This motivates thequestion of how to reasonably subdivide C(n). We nowshow that Voronoi topology offers one such approach.
FIG. 2. (a-c) Voronoi cells of particles in BCC, FCC, andHCP crystals. Vertices at which more than four Voronoi cellsmeet are marked by red circles. Small perturbations of theparticle positions result in topological changes near these ver-tices. (d) Schematic of C(n), the space of all possible configu-rations of n neighbors. This space can be divided into regionson which the Voronoi cell topology is constant. The topologyof a point that lies on the boundaries of multiple regions isunstable, and infinitesimal perturbations of the neighbors willresult in a change of topology. The inset shows the neighbor-hood around xFCC; unshaded regions indicate primary types,while shaded ones indicate secondary types.
B. Voronoi Topology
For a fixed set of particles, the Voronoi cell of a centralparticle is the region of real space closer to that parti-cle than to any other [4]. Figure 1 illustrates a centralparticle, its Voronoi cell, and fifteen neighboring parti-cles. Two particles whose Voronoi cells share a face arecalled neighbors. We identify two Voronoi cells as havingthe same topology, or topological type, if there existsa one-to-one correspondence between their sets of facesthat preserves adjacency.
The topology of the Voronoi cell of a particle describesthe manner in which neighbors of a particle are arrangedrelative to it. An n-sided face, for example, indicates apair of particles which have n neighbors in common. Thetopology of a Voronoi cell thus provides a robust descrip-tion of how neighbors are arranged not only relative to acentral particle, but also to one another. In this sense, itis a good description of local structure.
Voronoi cell topology also provides a natural decom-position of C(n) into regions in which the Voronoi celltopology is constant, as illustrated in Fig. 2(d). We con-sider this decomposition natural because it allows us tocoarse-grain the effects of small perturbations on localstructure. Small perturbations of the particle coordi-nates correspond to small displacements in C(n), andsince the Voronoi topology does not change for almost allpoints under small perturbations, these small perturba-tions, which are often unimportant, are naturally ignoredwithout the introduction of an artificial cut-off [2].
3
Voronoi cell topology was first introduced by Bernaland others to study the atomic structure of liquids [5–7],and has been subsequently applied to study a wide rangeof condensed matter systems, including random spherepackings [7, 8], finite-temperature crystals [9], and metal-lic glasses [10]. In those studies, however, the topologyof a cell was characterized by counting its types of faces(e.g., triangles and quadrilaterals), though it ignored theway in which those faces are arranged. While this limiteddescription has been used to study some aspects of crys-tallization [11], it cannot distinguish particles whose localenvironments are FCC from those whose local environ-ments are HCP, as both Voronoi cells have twelve four-sided faces. In previous work [12, 13], the authors haveshown how to use a graph-tracing algorithm introducedby Weinberg [14] to efficiently compute strings which en-code a complete description of the Voronoi cell topology;see Methods for further details.
A second limitation arising in traditional Voronoi ap-proaches results from abrupt changes in topology due tosmall geometric perturbations. Consider, for example,that Voronoi cells of particles in FCC and HCP crys-tals are topologically unstable – since some vertices areshared by more than four Voronoi cells (see Fig. 2), in-finitesimal perturbations of the particle positions, suchas those arising from non-hydrostatic strain or thermalvibrations, will change their topology [15]. This prob-lem has been sufficiently challenging to limit the util-ity of conventional Voronoi approaches in studying evenslightly perturbed crystal structures [2]. This problemcan be solved through the classification of topologicaltypes described in the following section.
C. Theory of λ-types
In this section we show how topological types can beclassified using the approach developed in the previoustwo sections. On a basic level, every arrangement ofneighbors relative to a central particle can be describedby its Voronoi cell topology. Families of topological typesassociated with a particular structure can then be definedas sets of types obtained through infinitesimal perturba-tions of that structure. This classification scheme enablesa description of the effects of small strains and thermal vi-brations on local structure, and provides a robust frame-work suitable for theoretical and numerical analysis.
Every local arrangement of neighbors λ is described bya distinct point xλ in C(n), and subsequently correspondsto a unique Voronoi cell topology V [xλ]. For example,if λ = BCC, then xλ = xBCC describes a particle thathas the same local environment as a particle in a perfectBCC crystal; its Voronoi cell topology V [xBCC] is thetruncated octahedron, illustrated in Fig. 2(a).
A suitable distance function on C(n) allows us to de-fine sets of topological types associated with infinitesimalperturbations as follows. We let Bε(x) be a ball of ra-dius ε centered at x. This region of C(n) corresponds to
configurations obtained through small perturbations of aparticle and its neighbors, where ε controls the magni-tude of such a perturbation. The set of topological typesobtained from all possible perturbations of x with mag-nitude smaller than ε is denoted V [Bε(x)]. We define thefamily of topological types associated with infinitesimalperturbations of λ as the limiting set:
Fλ := limε→0
V [Bε(xλ)] . (2)
In more physical terms, Fλ is the set of all topologicaltypes that can be obtained through arbitrarily small per-turbations of a central particle and its neighbors. TheVoronoi cell topology of points in the interior of a re-gion in C(n) remains unchanged by small perturbations.In contrast, points such as xFCC and xHCP are locatedat the boundaries of multiple regions, and small pertur-bations entail a change in Voronoi cell topology. Thus,FFCC and FHCP consist of multiple topological types,whereas FBCC, located in the interior of a region, con-sists of a single type. If a topological type is in Fλ, thenwe say that it is a λ-type. Note that a topological typecan belong to multiple families; this indeterminacy willbe considered below. This classification of λ-types allowsus to account for topological instability without modify-ing the sample data by collapsing edges or faces using adhoc criteria (e.g., cut-offs) [2, 9].
Among λ-types, a further distinction can be drawnbased on the manner in which the Voronoi cell topol-ogy subdivides C(n). Using a suitable volume measureVol, we define the ideal frequency fλ(τ) of a topologicaltype τ relative to xλ as follows:
fλ(τ) := limε→0
Vol(V −1[τ ] ∩Bε(xλ)
)Vol (Bε(xλ))
, (3)
where V −1[τ ] is the set of points in C(n) whose Voronoicell have topology τ . If fλ(τ) > 0, we call τ a primaryλ-type; if fλ(τ) = 0, we call it a secondary λ-type. Theinset in Fig. 2(d) highlights a number of regions incidentwith xFCC. Some of those regions meet xFCC at finitesolid angles; therefore, their fractional volumes withinan ε-ball converge to positive values as ε → 0; these areprimary FCC-types. In contrast, fractional volumes tendto zero as ε → 0 for other regions which meet xFCC atcusps; these are secondary FCC-types.
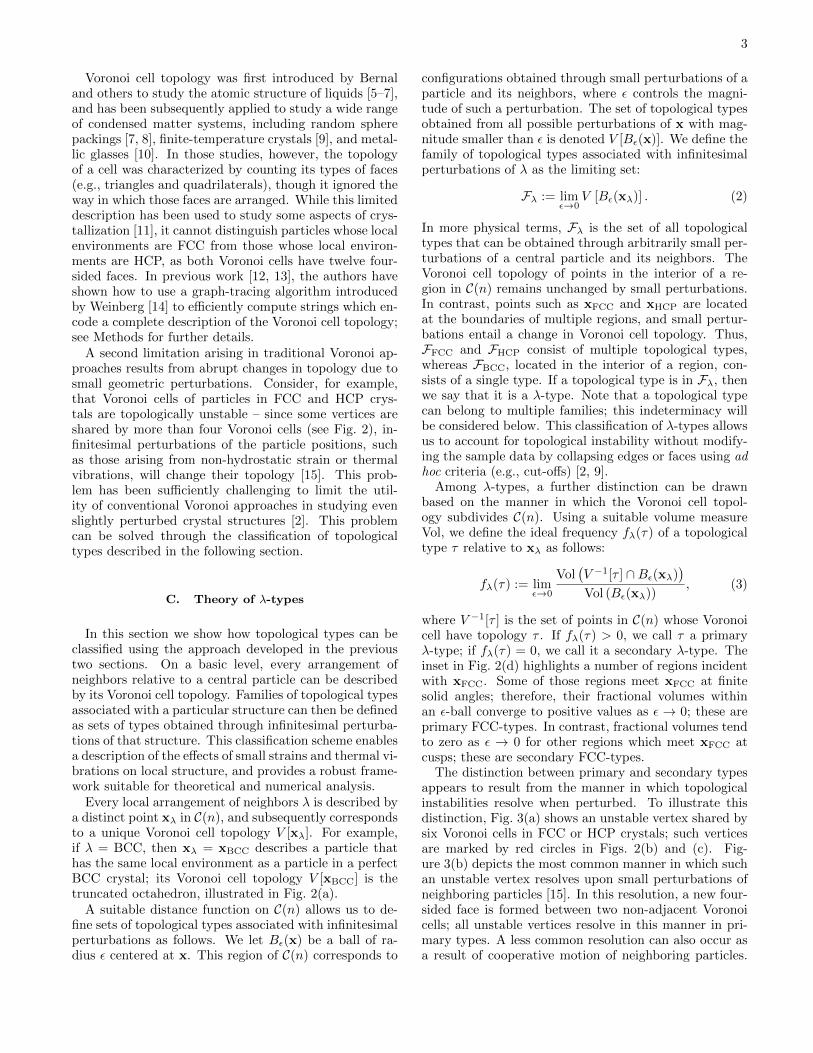
The distinction between primary and secondary typesappears to result from the manner in which topologicalinstabilities resolve when perturbed. To illustrate thisdistinction, Fig. 3(a) shows an unstable vertex shared bysix Voronoi cells in FCC or HCP crystals; such verticesare marked by red circles in Figs. 2(b) and (c). Fig-ure 3(b) depicts the most common manner in which suchan unstable vertex resolves upon small perturbations ofneighboring particles [15]. In this resolution, a new four-sided face is formed between two non-adjacent Voronoicells; all unstable vertices resolve in this manner in pri-mary types. A less common resolution can also occur asa result of cooperative motion of neighboring particles.
4
FIG. 3. (a) An unstable vertex shared by six Voronoi cells inFCC or HCP crystals; such vertices are marked by red circlesin Figs. 2(b) and (c). A small perturbation will cause thevertex to resolve into either (b) a four-sided face, or (c) a pairof adjacent triangular faces; these resolutions are associatedwith primary and secondary types, respectively.
In this resolution, depicted in Fig. 3(c), two triangularfaces are created [11]; secondary types can include suchresolutions.
Determining Fλ is feasible through consideration ofall possible ways in which unstable vertices can resolve.For example, the ideal FCC Voronoi cell, illustrated inFig. 2(b), has six unstable vertices. In primary types,each such vertex resolves in a manner illustrated inFig. 3(b), in one of three directions. More specifically,the unstable vertex can transform in such a way that thecentral cell gains a square face, or else gains an edge inone of two directions. We consider all possible combina-tions of these resolutions over the six unstable vertices,and calculate the topological types of the resulting poly-hedra using the algorithm developed in [13]; a total of44 distinct topological types occur in this manner. Insecondary types, unstable vertices can also resolve in themanner illustrated in Fig. 3(c), or else remain unstable.An additional 6250 topological types can occur in thismanner. A similar approach can be followed to deter-mine Fλ for other structures. Additional details can befound in the supplementary material.
II. FINITE-TEMPERATURE CRYSTALS
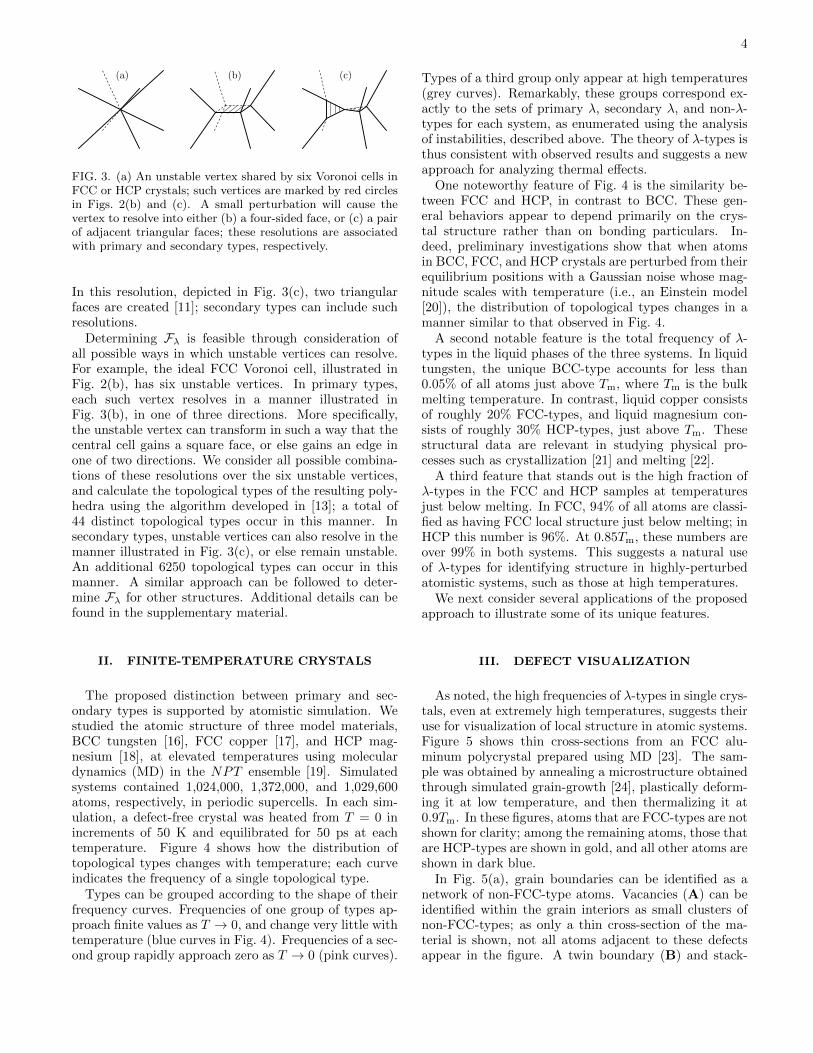
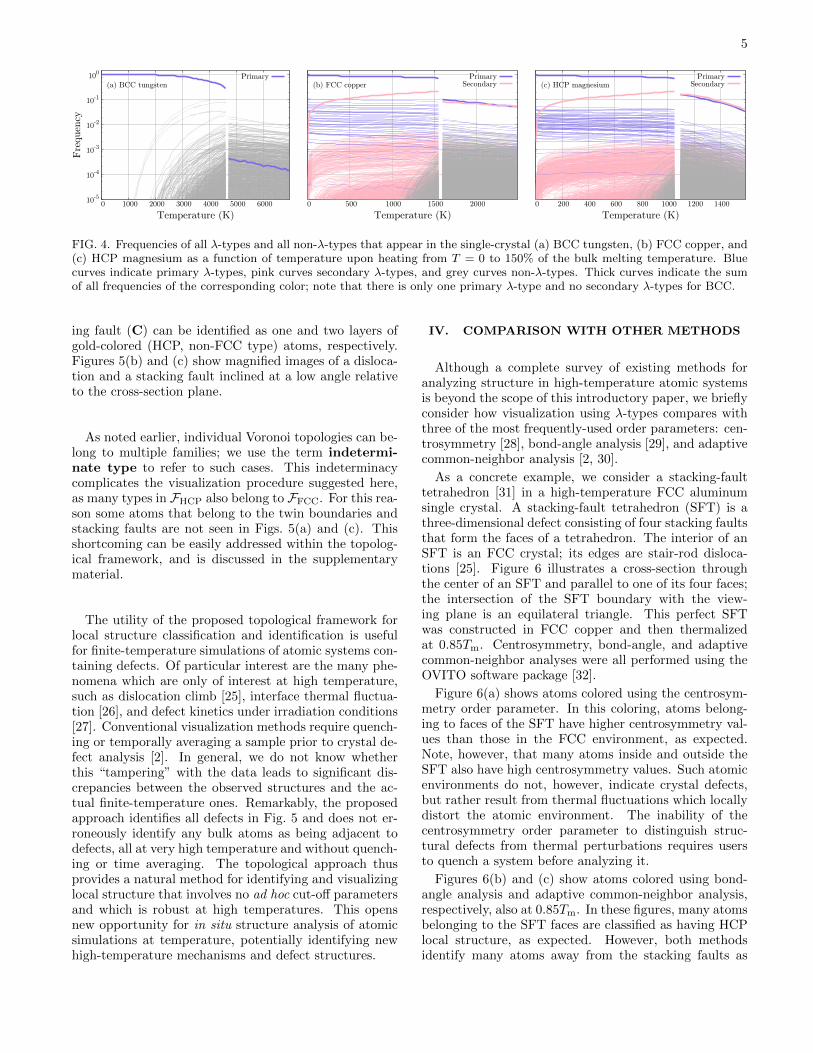
The proposed distinction between primary and sec-ondary types is supported by atomistic simulation. Westudied the atomic structure of three model materials,BCC tungsten [16], FCC copper [17], and HCP mag-nesium [18], at elevated temperatures using moleculardynamics (MD) in the NPT ensemble [19]. Simulatedsystems contained 1,024,000, 1,372,000, and 1,029,600atoms, respectively, in periodic supercells. In each sim-ulation, a defect-free crystal was heated from T = 0 inincrements of 50 K and equilibrated for 50 ps at eachtemperature. Figure 4 shows how the distribution oftopological types changes with temperature; each curveindicates the frequency of a single topological type.
Types can be grouped according to the shape of theirfrequency curves. Frequencies of one group of types ap-proach finite values as T → 0, and change very little withtemperature (blue curves in Fig. 4). Frequencies of a sec-ond group rapidly approach zero as T → 0 (pink curves).
Types of a third group only appear at high temperatures(grey curves). Remarkably, these groups correspond ex-actly to the sets of primary λ, secondary λ, and non-λ-types for each system, as enumerated using the analysisof instabilities, described above. The theory of λ-types isthus consistent with observed results and suggests a newapproach for analyzing thermal effects.
One noteworthy feature of Fig. 4 is the similarity be-tween FCC and HCP, in contrast to BCC. These gen-eral behaviors appear to depend primarily on the crys-tal structure rather than on bonding particulars. In-deed, preliminary investigations show that when atomsin BCC, FCC, and HCP crystals are perturbed from theirequilibrium positions with a Gaussian noise whose mag-nitude scales with temperature (i.e., an Einstein model[20]), the distribution of topological types changes in amanner similar to that observed in Fig. 4.
A second notable feature is the total frequency of λ-types in the liquid phases of the three systems. In liquidtungsten, the unique BCC-type accounts for less than0.05% of all atoms just above Tm, where Tm is the bulkmelting temperature. In contrast, liquid copper consistsof roughly 20% FCC-types, and liquid magnesium con-sists of roughly 30% HCP-types, just above Tm. Thesestructural data are relevant in studying physical pro-cesses such as crystallization [21] and melting [22].
A third feature that stands out is the high fraction ofλ-types in the FCC and HCP samples at temperaturesjust below melting. In FCC, 94% of all atoms are classi-fied as having FCC local structure just below melting; inHCP this number is 96%. At 0.85Tm, these numbers areover 99% in both systems. This suggests a natural useof λ-types for identifying structure in highly-perturbedatomistic systems, such as those at high temperatures.
We next consider several applications of the proposedapproach to illustrate some of its unique features.
III. DEFECT VISUALIZATION
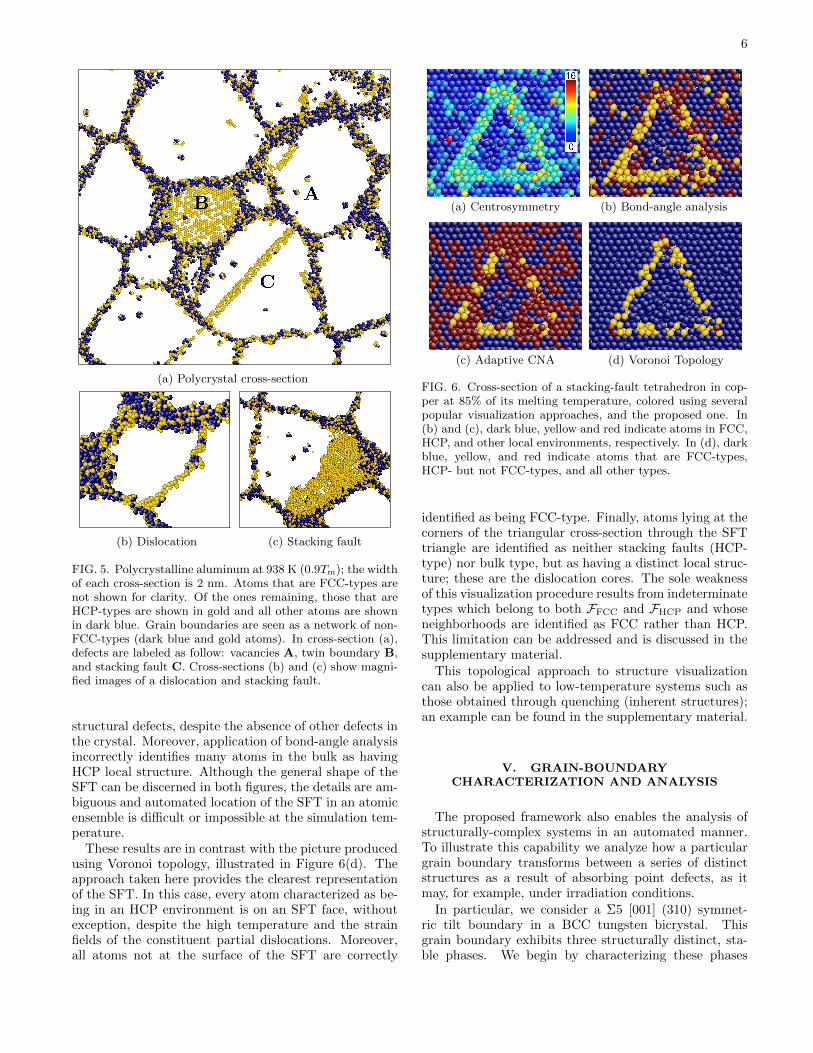
As noted, the high frequencies of λ-types in single crys-tals, even at extremely high temperatures, suggests theiruse for visualization of local structure in atomic systems.Figure 5 shows thin cross-sections from an FCC alu-minum polycrystal prepared using MD [23]. The sam-ple was obtained by annealing a microstructure obtainedthrough simulated grain-growth [24], plastically deform-ing it at low temperature, and then thermalizing it at0.9Tm. In these figures, atoms that are FCC-types are notshown for clarity; among the remaining atoms, those thatare HCP-types are shown in gold, and all other atoms areshown in dark blue.
In Fig. 5(a), grain boundaries can be identified as anetwork of non-FCC-type atoms. Vacancies (A) can beidentified within the grain interiors as small clusters ofnon-FCC-types; as only a thin cross-section of the ma-terial is shown, not all atoms adjacent to these defectsappear in the figure. A twin boundary (B) and stack-
5
10-5
10-4
10-3
10-2
10-1
100
0 1000 2000 3000 4000 5000 6000
Fre
quen
cy
Temperature (K)
(a) BCC tungstenPrimary
0 500 1000 1500 2000Temperature (K)
(b) FCC copperPrimary
Secondary
0 200 400 600 800 1000 1200 1400Temperature (K)
(c) HCP magnesiumPrimary
Secondary
FIG. 4. Frequencies of all λ-types and all non-λ-types that appear in the single-crystal (a) BCC tungsten, (b) FCC copper, and(c) HCP magnesium as a function of temperature upon heating from T = 0 to 150% of the bulk melting temperature. Bluecurves indicate primary λ-types, pink curves secondary λ-types, and grey curves non-λ-types. Thick curves indicate the sumof all frequencies of the corresponding color; note that there is only one primary λ-type and no secondary λ-types for BCC.
ing fault (C) can be identified as one and two layers ofgold-colored (HCP, non-FCC type) atoms, respectively.Figures 5(b) and (c) show magnified images of a disloca-tion and a stacking fault inclined at a low angle relativeto the cross-section plane.
As noted earlier, individual Voronoi topologies can be-long to multiple families; we use the term indetermi-nate type to refer to such cases. This indeterminacycomplicates the visualization procedure suggested here,as many types in FHCP also belong to FFCC. For this rea-son some atoms that belong to the twin boundaries andstacking faults are not seen in Figs. 5(a) and (c). Thisshortcoming can be easily addressed within the topolog-ical framework, and is discussed in the supplementarymaterial.
The utility of the proposed topological framework forlocal structure classification and identification is usefulfor finite-temperature simulations of atomic systems con-taining defects. Of particular interest are the many phe-nomena which are only of interest at high temperature,such as dislocation climb [25], interface thermal fluctua-tion [26], and defect kinetics under irradiation conditions[27]. Conventional visualization methods require quench-ing or temporally averaging a sample prior to crystal de-fect analysis [2]. In general, we do not know whetherthis “tampering” with the data leads to significant dis-crepancies between the observed structures and the ac-tual finite-temperature ones. Remarkably, the proposedapproach identifies all defects in Fig. 5 and does not er-roneously identify any bulk atoms as being adjacent todefects, all at very high temperature and without quench-ing or time averaging. The topological approach thusprovides a natural method for identifying and visualizinglocal structure that involves no ad hoc cut-off parametersand which is robust at high temperatures. This opensnew opportunity for in situ structure analysis of atomicsimulations at temperature, potentially identifying newhigh-temperature mechanisms and defect structures.
IV. COMPARISON WITH OTHER METHODS
Although a complete survey of existing methods foranalyzing structure in high-temperature atomic systemsis beyond the scope of this introductory paper, we brieflyconsider how visualization using λ-types compares withthree of the most frequently-used order parameters: cen-trosymmetry [28], bond-angle analysis [29], and adaptivecommon-neighbor analysis [2, 30].
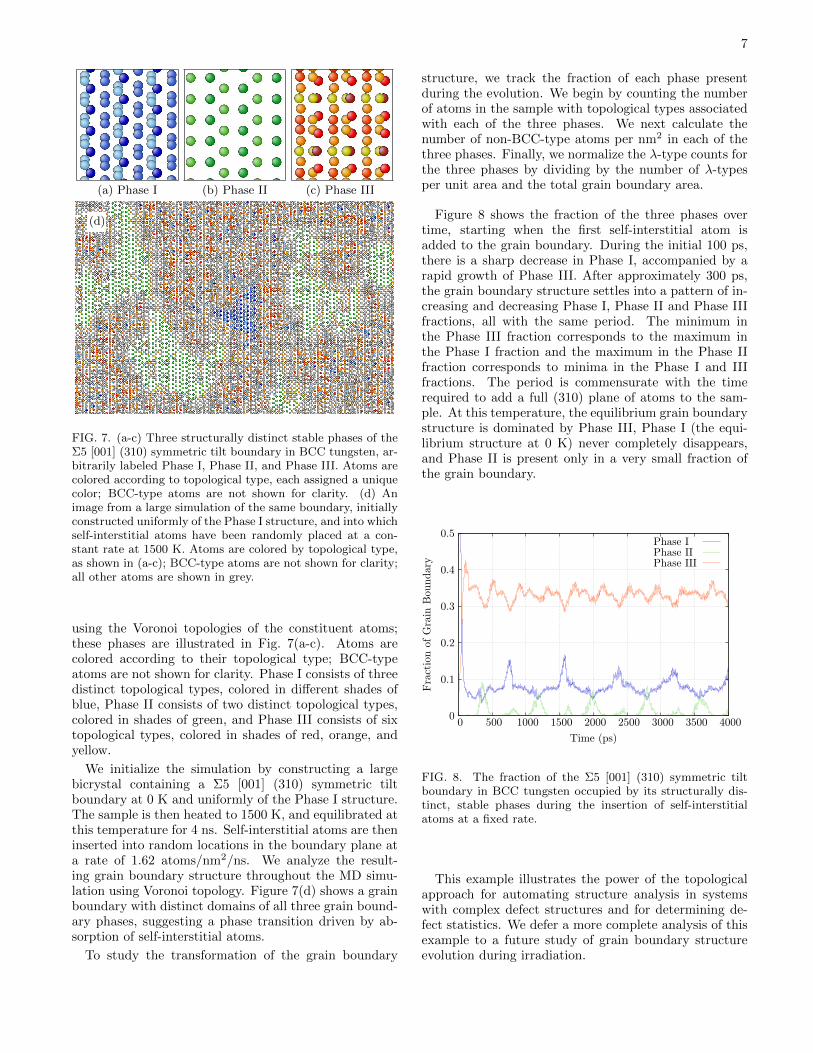
As a concrete example, we consider a stacking-faulttetrahedron [31] in a high-temperature FCC aluminumsingle crystal. A stacking-fault tetrahedron (SFT) is athree-dimensional defect consisting of four stacking faultsthat form the faces of a tetrahedron. The interior of anSFT is an FCC crystal; its edges are stair-rod disloca-tions [25]. Figure 6 illustrates a cross-section throughthe center of an SFT and parallel to one of its four faces;the intersection of the SFT boundary with the view-ing plane is an equilateral triangle. This perfect SFTwas constructed in FCC copper and then thermalizedat 0.85Tm. Centrosymmetry, bond-angle, and adaptivecommon-neighbor analyses were all performed using theOVITO software package [32].
Figure 6(a) shows atoms colored using the centrosym-metry order parameter. In this coloring, atoms belong-ing to faces of the SFT have higher centrosymmetry val-ues than those in the FCC environment, as expected.Note, however, that many atoms inside and outside theSFT also have high centrosymmetry values. Such atomicenvironments do not, however, indicate crystal defects,but rather result from thermal fluctuations which locallydistort the atomic environment. The inability of thecentrosymmetry order parameter to distinguish struc-tural defects from thermal perturbations requires usersto quench a system before analyzing it.
Figures 6(b) and (c) show atoms colored using bond-angle analysis and adaptive common-neighbor analysis,respectively, also at 0.85Tm. In these figures, many atomsbelonging to the SFT faces are classified as having HCPlocal structure, as expected. However, both methodsidentify many atoms away from the stacking faults as
6
(a) Polycrystal cross-section
(b) Dislocation (c) Stacking fault
FIG. 5. Polycrystalline aluminum at 938 K (0.9Tm); the widthof each cross-section is 2 nm. Atoms that are FCC-types arenot shown for clarity. Of the ones remaining, those that areHCP-types are shown in gold and all other atoms are shownin dark blue. Grain boundaries are seen as a network of non-FCC-types (dark blue and gold atoms). In cross-section (a),defects are labeled as follow: vacancies A, twin boundary B,and stacking fault C. Cross-sections (b) and (c) show magni-fied images of a dislocation and stacking fault.
structural defects, despite the absence of other defects inthe crystal. Moreover, application of bond-angle analysisincorrectly identifies many atoms in the bulk as havingHCP local structure. Although the general shape of theSFT can be discerned in both figures, the details are am-biguous and automated location of the SFT in an atomicensemble is difficult or impossible at the simulation tem-perature.
These results are in contrast with the picture producedusing Voronoi topology, illustrated in Figure 6(d). Theapproach taken here provides the clearest representationof the SFT. In this case, every atom characterized as be-ing in an HCP environment is on an SFT face, withoutexception, despite the high temperature and the strainfields of the constituent partial dislocations. Moreover,all atoms not at the surface of the SFT are correctly
(a) Centrosymmetry (b) Bond-angle analysis
(c) Adaptive CNA (d) Voronoi Topology
FIG. 6. Cross-section of a stacking-fault tetrahedron in cop-per at 85% of its melting temperature, colored using severalpopular visualization approaches, and the proposed one. In(b) and (c), dark blue, yellow and red indicate atoms in FCC,HCP, and other local environments, respectively. In (d), darkblue, yellow, and red indicate atoms that are FCC-types,HCP- but not FCC-types, and all other types.
identified as being FCC-type. Finally, atoms lying at thecorners of the triangular cross-section through the SFTtriangle are identified as neither stacking faults (HCP-type) nor bulk type, but as having a distinct local struc-ture; these are the dislocation cores. The sole weaknessof this visualization procedure results from indeterminatetypes which belong to both FFCC and FHCP and whoseneighborhoods are identified as FCC rather than HCP.This limitation can be addressed and is discussed in thesupplementary material.
This topological approach to structure visualizationcan also be applied to low-temperature systems such asthose obtained through quenching (inherent structures);an example can be found in the supplementary material.
V. GRAIN-BOUNDARYCHARACTERIZATION AND ANALYSIS
The proposed framework also enables the analysis ofstructurally-complex systems in an automated manner.To illustrate this capability we analyze how a particulargrain boundary transforms between a series of distinctstructures as a result of absorbing point defects, as itmay, for example, under irradiation conditions.
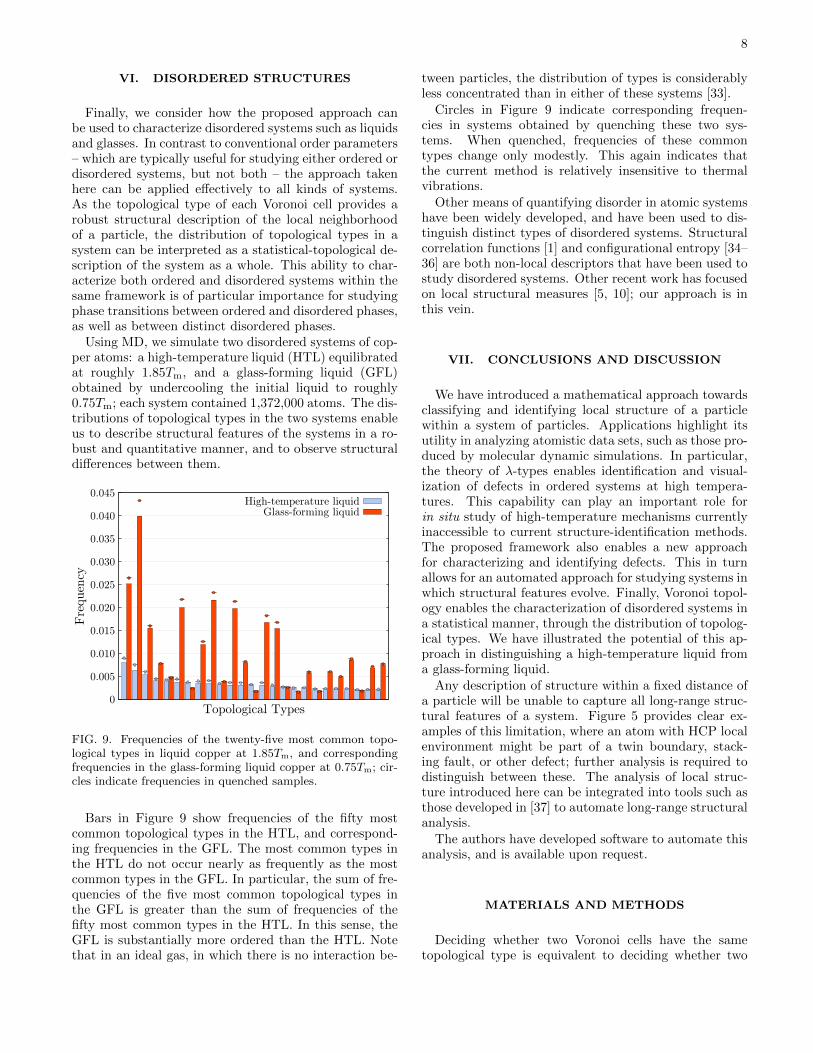
In particular, we consider a Σ5 [001] (310) symmet-ric tilt boundary in a BCC tungsten bicrystal. Thisgrain boundary exhibits three structurally distinct, sta-ble phases. We begin by characterizing these phases
7
(a) Phase I (b) Phase II (c) Phase III
(d)
FIG. 7. (a-c) Three structurally distinct stable phases of theΣ5 [001] (310) symmetric tilt boundary in BCC tungsten, ar-bitrarily labeled Phase I, Phase II, and Phase III. Atoms arecolored according to topological type, each assigned a uniquecolor; BCC-type atoms are not shown for clarity. (d) Animage from a large simulation of the same boundary, initiallyconstructed uniformly of the Phase I structure, and into whichself-interstitial atoms have been randomly placed at a con-stant rate at 1500 K. Atoms are colored by topological type,as shown in (a-c); BCC-type atoms are not shown for clarity;all other atoms are shown in grey.
using the Voronoi topologies of the constituent atoms;these phases are illustrated in Fig. 7(a-c). Atoms arecolored according to their topological type; BCC-typeatoms are not shown for clarity. Phase I consists of threedistinct topological types, colored in different shades ofblue, Phase II consists of two distinct topological types,colored in shades of green, and Phase III consists of sixtopological types, colored in shades of red, orange, andyellow.
We initialize the simulation by constructing a largebicrystal containing a Σ5 [001] (310) symmetric tiltboundary at 0 K and uniformly of the Phase I structure.The sample is then heated to 1500 K, and equilibrated atthis temperature for 4 ns. Self-interstitial atoms are theninserted into random locations in the boundary plane ata rate of 1.62 atoms/nm2/ns. We analyze the result-ing grain boundary structure throughout the MD simu-lation using Voronoi topology. Figure 7(d) shows a grainboundary with distinct domains of all three grain bound-ary phases, suggesting a phase transition driven by ab-sorption of self-interstitial atoms.
To study the transformation of the grain boundary
structure, we track the fraction of each phase presentduring the evolution. We begin by counting the numberof atoms in the sample with topological types associatedwith each of the three phases. We next calculate thenumber of non-BCC-type atoms per nm2 in each of thethree phases. Finally, we normalize the λ-type counts forthe three phases by dividing by the number of λ-typesper unit area and the total grain boundary area.
Figure 8 shows the fraction of the three phases overtime, starting when the first self-interstitial atom isadded to the grain boundary. During the initial 100 ps,there is a sharp decrease in Phase I, accompanied by arapid growth of Phase III. After approximately 300 ps,the grain boundary structure settles into a pattern of in-creasing and decreasing Phase I, Phase II and Phase IIIfractions, all with the same period. The minimum inthe Phase III fraction corresponds to the maximum inthe Phase I fraction and the maximum in the Phase IIfraction corresponds to minima in the Phase I and IIIfractions. The period is commensurate with the timerequired to add a full (310) plane of atoms to the sam-ple. At this temperature, the equilibrium grain boundarystructure is dominated by Phase III, Phase I (the equi-librium structure at 0 K) never completely disappears,and Phase II is present only in a very small fraction ofthe grain boundary.
0
0.1
0.2
0.3
0.4
0.5
0 500 1000 1500 2000 2500 3000 3500 4000
Fra
ctio
n of
Gra
in B
ound
ary
Time (ps)
Phase I Phase II Phase III
FIG. 8. The fraction of the Σ5 [001] (310) symmetric tiltboundary in BCC tungsten occupied by its structurally dis-tinct, stable phases during the insertion of self-interstitialatoms at a fixed rate.
This example illustrates the power of the topologicalapproach for automating structure analysis in systemswith complex defect structures and for determining de-fect statistics. We defer a more complete analysis of thisexample to a future study of grain boundary structureevolution during irradiation.
8
VI. DISORDERED STRUCTURES
Finally, we consider how the proposed approach canbe used to characterize disordered systems such as liquidsand glasses. In contrast to conventional order parameters– which are typically useful for studying either ordered ordisordered systems, but not both – the approach takenhere can be applied effectively to all kinds of systems.As the topological type of each Voronoi cell provides arobust structural description of the local neighborhoodof a particle, the distribution of topological types in asystem can be interpreted as a statistical-topological de-scription of the system as a whole. This ability to char-acterize both ordered and disordered systems within thesame framework is of particular importance for studyingphase transitions between ordered and disordered phases,as well as between distinct disordered phases.
Using MD, we simulate two disordered systems of cop-per atoms: a high-temperature liquid (HTL) equilibratedat roughly 1.85Tm, and a glass-forming liquid (GFL)obtained by undercooling the initial liquid to roughly0.75Tm; each system contained 1,372,000 atoms. The dis-tributions of topological types in the two systems enableus to describe structural features of the systems in a ro-bust and quantitative manner, and to observe structuraldifferences between them.
0
0.005
0.010
0.015
0.020
0.025
0.030
0.035
0.040
0.045
Fre
quen
cy
Topological Types
High-temperature liquidGlass-forming liquid
FIG. 9. Frequencies of the twenty-five most common topo-logical types in liquid copper at 1.85Tm, and correspondingfrequencies in the glass-forming liquid copper at 0.75Tm; cir-cles indicate frequencies in quenched samples.
Bars in Figure 9 show frequencies of the fifty mostcommon topological types in the HTL, and correspond-ing frequencies in the GFL. The most common types inthe HTL do not occur nearly as frequently as the mostcommon types in the GFL. In particular, the sum of fre-quencies of the five most common topological types inthe GFL is greater than the sum of frequencies of thefifty most common types in the HTL. In this sense, theGFL is substantially more ordered than the HTL. Notethat in an ideal gas, in which there is no interaction be-
tween particles, the distribution of types is considerablyless concentrated than in either of these systems [33].
Circles in Figure 9 indicate corresponding frequen-cies in systems obtained by quenching these two sys-tems. When quenched, frequencies of these commontypes change only modestly. This again indicates thatthe current method is relatively insensitive to thermalvibrations.
Other means of quantifying disorder in atomic systemshave been widely developed, and have been used to dis-tinguish distinct types of disordered systems. Structuralcorrelation functions [1] and configurational entropy [34–36] are both non-local descriptors that have been used tostudy disordered systems. Other recent work has focusedon local structural measures [5, 10]; our approach is inthis vein.
VII. CONCLUSIONS AND DISCUSSION
We have introduced a mathematical approach towardsclassifying and identifying local structure of a particlewithin a system of particles. Applications highlight itsutility in analyzing atomistic data sets, such as those pro-duced by molecular dynamic simulations. In particular,the theory of λ-types enables identification and visual-ization of defects in ordered systems at high tempera-tures. This capability can play an important role forin situ study of high-temperature mechanisms currentlyinaccessible to current structure-identification methods.The proposed framework also enables a new approachfor characterizing and identifying defects. This in turnallows for an automated approach for studying systems inwhich structural features evolve. Finally, Voronoi topol-ogy enables the characterization of disordered systems ina statistical manner, through the distribution of topolog-ical types. We have illustrated the potential of this ap-proach in distinguishing a high-temperature liquid froma glass-forming liquid.
Any description of structure within a fixed distance ofa particle will be unable to capture all long-range struc-tural features of a system. Figure 5 provides clear ex-amples of this limitation, where an atom with HCP localenvironment might be part of a twin boundary, stack-ing fault, or other defect; further analysis is required todistinguish between these. The analysis of local struc-ture introduced here can be integrated into tools such asthose developed in [37] to automate long-range structuralanalysis.
The authors have developed software to automate thisanalysis, and is available upon request.
MATERIALS AND METHODS
Deciding whether two Voronoi cells have the sametopological type is equivalent to deciding whether two
9
planar graphs are identical, as the edge-boundary of ev-ery Voronoi cell is a planar graph. For each particle ina system we compute a “code” that records the graphstructure of the edge-boundary network of its Voronoicell. To do this, we first determine the Voronoi cell us-ing the Voro++ software package [38], which computes alist of faces, each represented as an ordered sequence ofvertices. Next, we use a graph-tracing algorithm to com-pute a code for this planar graph. More specifically, thefollowing algorithm of Weinberg [14] is followed: (a) Aninitial vertex is chosen and assigned the label 1. (b) Anedge adjacent to that vertex is chosen and travel beginsalong that edge. (c) If an unlabeled vertex is reached,it is labeled with the next unused integer and we “turnright” and continue. (d) If a labeled vertex is reachedafter traveling along an untraversed edge, we return tothe last vertex along the same edge but in the oppositedirection. (e) If a labeled vertex is reached after travelingalong an edge previously traversed in the opposite direc-tion, we “turn right” and continue; if that right-turn edgehas also been traversed in that direction, we turn alongthe next right-turn edge available; if all outgoing edgeshave been traversed, we stop. At this point, each edge inthe graph has been traversed once in each direction; theordered list of the vertices visited is called a code.
Codes are constructed for each choice of initial ver-
tex and edge, and for each of two spatial orientations;all labels are cleared before producing each code. For aVoronoi cell with e edges, 4e codes are generated, eachan ordered list of 2e integer labels. Each code completelydescribes the Voronoi cell topology, and so it is sufficientto only record one of them. A code for a typical Voronoicell requires less than 100 bytes of storage. Additionaldetails can be found in [12, 14, 39].Run-time. The use of Voronoi topology for structure
identification is computationally efficient. In preliminarytests, the Voronoi topology of one millions atoms couldbe calculated on a desktop computer in less than oneminute. By contrast, conventional approaches used inhigh-temperature structure analysis require that systemsbe quenched before visualization. A complete quenchnecessary to obtain the inherent structure can requireseveral hours of computation for a system of comparablesize.
ACKNOWLEDGMENTS
We gratefully acknowledge discussions with and assis-tance from Chris H. Rycroft and Zhaoxuan Wu. Figures5, 6, and 7 were created with AtomEye [40]. EAL andDJS acknowledge support of the NSF Division of Mate-rials Research through Award 1507013.
[1] Truskett, T. M., Torquato, S. & Debenedetti, P. G.Towards a quantification of disorder in materials: Dis-tinguishing equilibrium and glassy sphere packings.Phys. Rev. E 62, 993 (2000).
[2] Stukowski, A. Structure identification methods foratomistic simulations of crystalline materials. ModellingSimul. Mater. Sci. Eng. 20, 045021 (2012).
[3] Landweber, P. S., Lazar, E. A. & Patel, N. On fiberdiameters of continuous maps. preprint arXiv:1503.07597(2015).
[4] Voronoı, G. Nouvelles applications des parametres con-tinus a la theorie des formes quadratiques. Deuxiemememoire. Recherches sur les parallelloedres primitifs. J.Reine Angew. Math. 134, 198–287 (1908).
[5] Bernal, J. D. A geometrical approach to the structure ofliquids. Nature (1959).
[6] Rahman, A. Liquid structure and self-diffusion. J. Chem.Phys. 45, 2585–2592 (1966).
[7] Finney, J. Random packings and the structure of simpleliquids. Proc. Roy. Soc. Lond. A 319, 479–507 (1970).
[8] Bernal, J. D. & Finney, J. L. Random close-packed hard-sphere model. II. Geometry of random packing of hardspheres. Discuss. Faraday Soc. 43, 62–69 (1967).
[9] Hsu, C. & Rahman, A. Interaction potentials and their ef-fect on crystal nucleation and symmetry. J. Chem. Phys.71, 4974–4986 (1979).
[10] Sheng, H., Luo, W., Alamgir, F., Bai, J. & Ma, E. Atomicpacking and short-to-medium-range order in metallicglasses. Nature 439, 419–425 (2006).
[11] Tanemura, M. et al. Geometrical analysis of crystalliza-
tion of the soft-core model. Prog. Theor. Phys. 58, 1079–1095 (1977).
[12] Lazar, E. A. The Evolution of Cellular Structuresvia Curvature Flow. Ph.D. thesis, Princeton University(2011).
[13] Lazar, E. A., Mason, J. K., MacPherson, R. D.& Srolovitz, D. J. Complete topology of cells,grains, and bubbles in three-dimensional microstruc-tures. Phys. Rev. Lett. 109, 95505 (2012).
[14] Weinberg, L. A simple and efficient algorithm for deter-mining isomorphism of planar triply connected graphs.IEEE Trans. Circuit Theory CT13, 142–148 (1966).
[15] Troadec, J., Gervois, A. & Oger, L. Statistics of voronoicells of slightly perturbed face-centered cubic and hexag-onal close-packed lattices. Europhys. Lett. 42, 167 (1998).
[16] Ackland, G. & Thetford, R. An improved N-body semi-empirical model for body-centred cubic transition metals.Phil. Mag. A 56, 15–30 (1987).
[17] Mishin, Y., Mehl, M., Papaconstantopoulos, D., Voter,A. & Kress, J. Structural stability and lattice defectsin copper: Ab initio, tight-binding, and embedded-atomcalculations. Phys. Rev. B 63, 224106 (2001).
[18] Sun, D. et al. Crystal-melt interfacial free energies in hcpmetals: A molecular dynamics study of Mg. Phys. Rev. B73, 024116 (2006).
[19] Plimpton, S. Fast parallel algorithms for short-rangemolecular dynamics. J. Comput. Phys. 117, 1–19 (1995).
[20] Einstein, A. Planck’s theory of radiation and the theoryof specific heat. Ann. Phys 22, 180–190 (1907).
[21] Kawasaki, T. & Tanaka, H. Formation of a crystal nu-
10
cleus from liquid. Proc. Natl. Acad. Sci. USA 107, 14036–14041 (2010).
[22] Bai, X.-M. & Li, M. Ring-diffusion mediated homoge-neous melting in the superheating regime. Physical Re-view B 77, 134109 (2008).
[23] Mishin, Y., Farkas, D., Mehl, M. & Papaconstantopou-los, D. Interatomic potentials for monoatomic met-als from experimental data and ab initio calculations.Phys. Rev. B 59, 3393 (1999).
[24] Lazar, E. A., Mason, J. K., MacPherson, R. D. &Srolovitz, D. J. A more accurate three-dimensional graingrowth algorithm. Acta Mater. 59, 6837–6847 (2011).
[25] Hirth, J. P. & Lothe, J. Theory of Dislocations (JohnWiley & Sons, 1982).
[26] Foiles, S. M. & Hoyt, J. Computation of grain boundarystiffness and mobility from boundary fluctuations. ActaMater. 54, 3351–3357 (2006).
[27] Fu, C.-C., Dalla Torre, J., Willaime, F., Bocquet, J.-L.& Barbu, A. Multiscale modelling of defect kinetics inirradiated iron. Nature Mater. 4, 68–74 (2004).
[28] Kelchner, C. L., Plimpton, S. & Hamilton, J. Dislocationnucleation and defect structure during surface indenta-tion. Phys. Rev. B 58, 11085 (1998).
[29] Ackland, G. & Jones, A. Applications of local crys-tal structure measures in experiment and simulation.Phys. Rev. B 73, 054104 (2006).
[30] Honeycutt, J. D. & Andersen, H. C. Molecular dynam-ics study of melting and freezing of small Lennard-Jonesclusters. Journal of Physical Chemistry 91, 4950–4963(1987).
[31] Kiritani, M. Story of stacking fault tetrahedra. MaterialsChemistry and Physics 50, 133–138 (1997).
[32] Stukowski, A. Visualization and analysis of atomisticsimulation data with OVITO–the Open VisualizationTool. Modelling Simul. Mater. Sci. Eng. 18, 015012(2010).
[33] Mason, J. K., Lazar, E. A., MacPherson, R. D. &Srolovitz, D. J. Statistical topology of three-dimensionalpoisson-voronoi cells and cell boundary networks. Phys.Rev. E 88, 063309 (2013).
[34] Krekelberg, W. P., Pond, M. J., Goel, G., Shen, V. K.,Errington, J. R. & Truskett, T. M. Generalized Rosen-feld scalings for tracer diffusivities in not-so-simple flu-ids: Mixtures and soft particles. Phys. Rev. E 80, 061205(2009).
[35] Goel, G., Krekelberg, W. P., Errington, J. R. & Truskett,T. M. Tuning density profiles and mobility of inhomoge-neous fluids. Phys. Rev. Lett. 100, 106001 (2008).
[36] Goel, G., Krekelberg, W. P., Pond, M. J., Mittal, J.,Shen, V. K., Errington, J. R. & Truskett, T. M. Availablestates and available space: static properties that predictself-diffusivity of confined fluids. J. of Stat. Mech. Theor.Exp. 04, P04006 (2009).
[37] Stukowski, A., Bulatov, V. V. & Arsenlis, A. Automatedidentification and indexing of dislocations in crystal in-terfaces. Modelling Simul. Mater. Sci. Eng. 20, 085007(2012).
[38] Rycroft, C. Voro++: A three-dimensional Voronoi celllibrary in C++. Chaos 19, 041111 (2009).
[39] Weinberg, L. On the Maximum Order of the Automor-phism Group of a Planar Triply Connected Graph. SIAMJ. on Applied Math. 14, 729–738 (1966).
[40] Li, J. Atomeye: an efficient atomistic configurationviewer. Modelling Simul. Mater. Sci. Eng. 11, 173 (2003).
SUPPLEMENTARY MATERIAL
ENUMERATING PRIMARYAND SECONDARY TYPES
In the paper we considered families of topological typesFλ associated with particular structures. In this sectionwe provide some additional detail regarding the determi-nation of these families, and report the numbers of typesin several of them, as well as in the overlap between mul-tiple families.
The Voronoi cell of BCC is topologically stable in thesense that infinitesimal perturbations of atomic coordi-nates will not change its topology. Therefore, FBCC con-sists of a single primary type and no secondary types.
In contrast, Voronoi cells of FCC and HCP are un-stable, and infinitesimal perturbations of atomic coor-dinates will change their topologies. The instability ofthese Voronoi cells can be detected in vertices that areincident with four edges; there are six such unstable ver-tices in FCC and HCP. As each unstable vertex can eitherremain unstable, resolve in one of 3 primary directions,or resolve in one of 4 secondary directions (see Fig. 3),
we must check 86 = 262,144 configurations that can re-sult from all infinitesimal perturbations. We computethe topology of each configuration using the algorithmdescribed in the Materials and Methods section of thepaper. Multiple configurations can result in the sameVoronoi cell topology due to symmetries of the unper-turbed configuration.
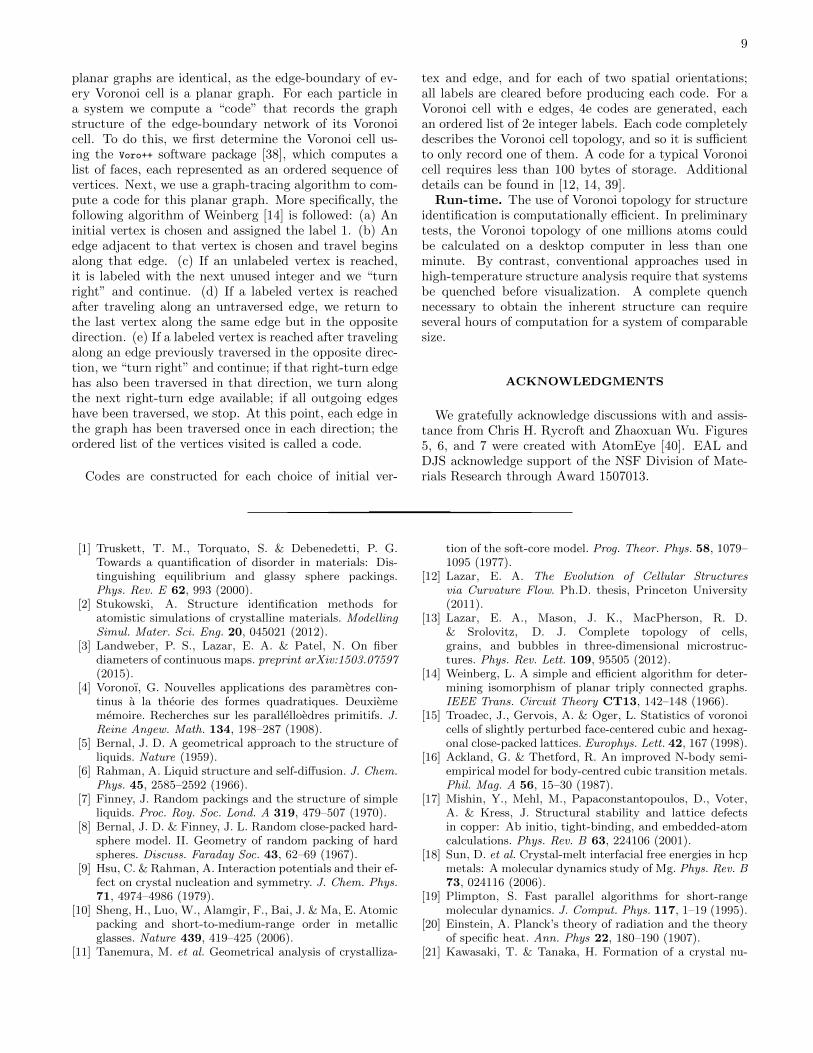
For FCC we find 44 primary types and 6250 secondarytypes; of the secondary types only 2771 have no unstablevertices. Figure S1 illustrates several Voronoi cells ob-served in a finite-temperature FCC crystal; their topolo-gies are given by this enumeration technique. For HCPwe find 66 primary types and 21,545 secondary types; ofthe secondary types only 9490 have no unstable vertices.
While the determination of topological types associ-ated with a particular structure may require substantialcomputation, this needs only be done once per struc-ture. Lookup tables are then created and subsequentlyreferenced when analyzing atomistic data sets. Data forseveral common crystal structures are available from the
11
FIG. S1. Examples of Voronoi cells in a perturbed FCC crys-tal.
authors upon request.In the paper we noted that certain types can belong to
several families (indeterminate types). More specifically,we note that the unique type belonging to FBCC also be-longs to FFCC and FHCP. Furthermore, FFCC and FHCP
share 23 primary types in common and 1352 secondarytypes in common.
RESOLVING INDETERMINATE TYPES
In the paper we noted practical challenges created bythe overlap of multiple families of types. In particular,when attempting to visualize defects in an FCC environ-ment, some atoms were mistakenly identified as belong-ing to the FCC bulk instead of to the HCP-like defect.Although a thorough analysis of this problem is beyondthe scope of this paper, we briefly consider one approachtowards resolving it. We leave a complete discussion ofthis topic for a future paper.
Indeterminate types are Voronoi topologies that canbe obtained through infinitesimal perturbations of mul-tiple distinct structures. Figure 2 in the paper shows anumber of regions in configuration space incident withboth xFCC and xHCP. One way of deciding whether apoint in this region should be classified as FCC or HCPinvolves computing distances in this configuration space:points close to xFCC should be classified as FCC, whilethose close to xHCP should be classified as HCP. Pointscloser to xBCC than to either xFCC or xHCP should beclassified as BCC.
While theoretically appealing, there is no practicalmanner in which to calculate these distances becauseof the complicated topology of this configuration space.More specifically, the standard metric on R3n cannot beused due to the actions of the rotation, renormalization,and permutation groups acting on it.
A more practical approach involves perturbing con-figurations of particles as follows. If the Voronoi typeof a particle is indeterminate, we randomly perturb theparticle and its nearby neighbors; this corresponds toa small perturbation of x in configuration space. TheVoronoi cell of the perturbed configuration is calculated;this procedure is repeated several times. If all pertur-bations result in indeterminate or HCP-types (the latteroccurring at least once), then the particle is classified asbeing HCP-type.
We consider a stacking-fault tetrahedron (SFT) in a
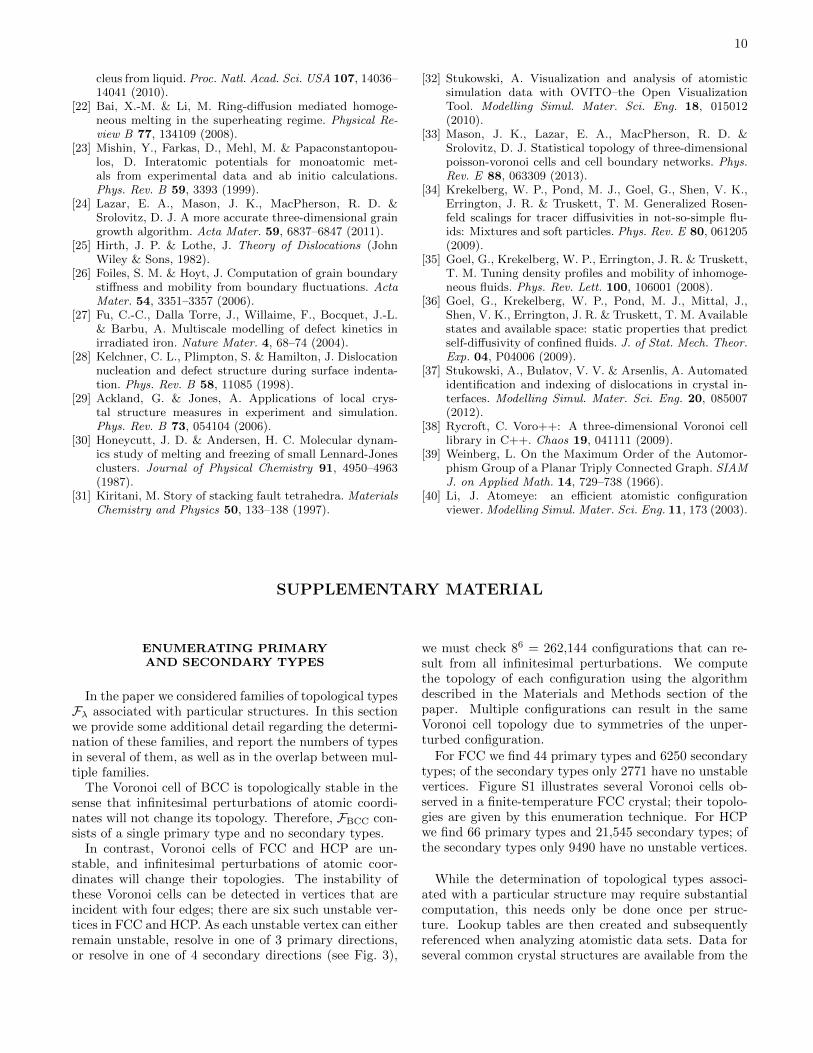
(a) (b)
FIG. S2. A high-temperature single crystal containing anSFT, visualized using (a) the method described in the paperand (b) the modified method proposed here.
single copper crystal that was heated to 85% of its melt-ing temperature; this system was considered in “Compar-ison with Other Methods” section of the paper. FigureS2 shows the SFT colored by the approach considered inthe paper and by the modification considered here. Thismodified approach provides a more robust visualizationof the SFT than the approach suggested in the paper.We defer a complete discussion of indeterminate typesand methods of resolving them to a future paper.
QUANTITATIVE COMPARISONAT HIGH TEMPERATURES
In the paper we have shown that Voronoi topol-ogy enables robust visualization of structure in high-temperature systems that cannot be obtained using con-ventional methods. Here we provide a direct and quan-titative comparison beyond visual inspection. We be-gin with a system containing 1,372,000 copper atomsorganized in a perfect crystal, and heat the system tojust below its melting point as described in the “Finite-Temperature Crystals” section of the paper. For eachorder-parameter considered in the paper, we calculate thefrequency of atoms in this single crystal that are charac-terized as non-FCC-type as a function of temperature.Close inspection of the system shows that there are nodefects.
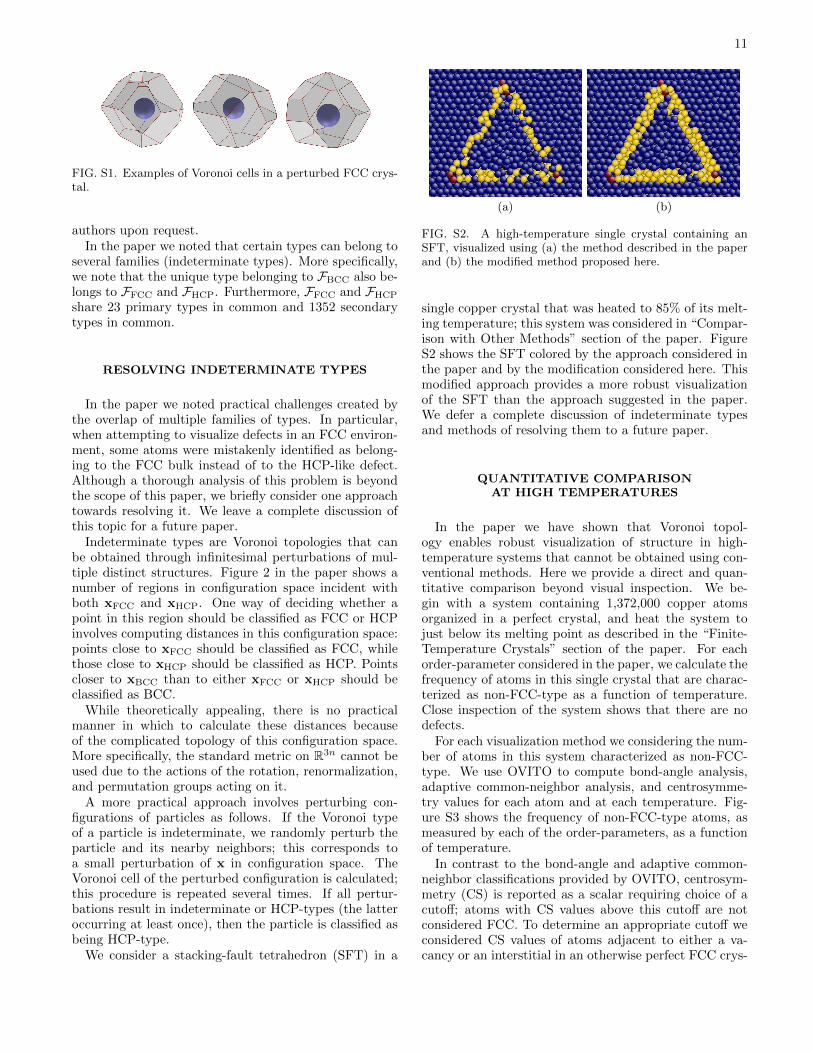
For each visualization method we considering the num-ber of atoms in this system characterized as non-FCC-type. We use OVITO to compute bond-angle analysis,adaptive common-neighbor analysis, and centrosymme-try values for each atom and at each temperature. Fig-ure S3 shows the frequency of non-FCC-type atoms, asmeasured by each of the order-parameters, as a functionof temperature.
In contrast to the bond-angle and adaptive common-neighbor classifications provided by OVITO, centrosym-metry (CS) is reported as a scalar requiring choice of acutoff; atoms with CS values above this cutoff are notconsidered FCC. To determine an appropriate cutoff weconsidered CS values of atoms adjacent to either a va-cancy or an interstitial in an otherwise perfect FCC crys-
12
0
0.2
0.4
0.6
0.8
1
0 200 400 600 800 1000 1200
Fre
quen
cy o
f no
n-FC
C-t
ype
atom
s
Temperature (K)
Adaptive CNA Bond-Angle Analysis Centrosymmetry > 2 Centrosymmetry > 6
Voronoi Topology
FIG. S3. Frequency of atoms characterized as non-FCC-typein a copper crystal.
tal. Atoms adjacent to a vacancy have a CS value of 6.20;interstitial atoms have a CS value of 13.88. In order thatour choice of cutoff allows for the detection of vacancies,we choose a cutoff of 6. We note that cutoff values as lowas 0.5 and 1 can be regularly found in the literature, andso our choice of cutoff is extremely conservative.
At T = 1300 K, bond-angle analysis, adaptivecommon-neighbor analysis, and centrosymmetry incor-rectly identify over 36.9%, 55.7% and 13.5%, respectively,of the atoms as not belonging to the FCC bulk crystal.By contrast, Voronoi topology mistakenly identifies only0.53% as such atoms as not belonging to the FCC bulkcrystal.
QUENCHED SYSTEMS
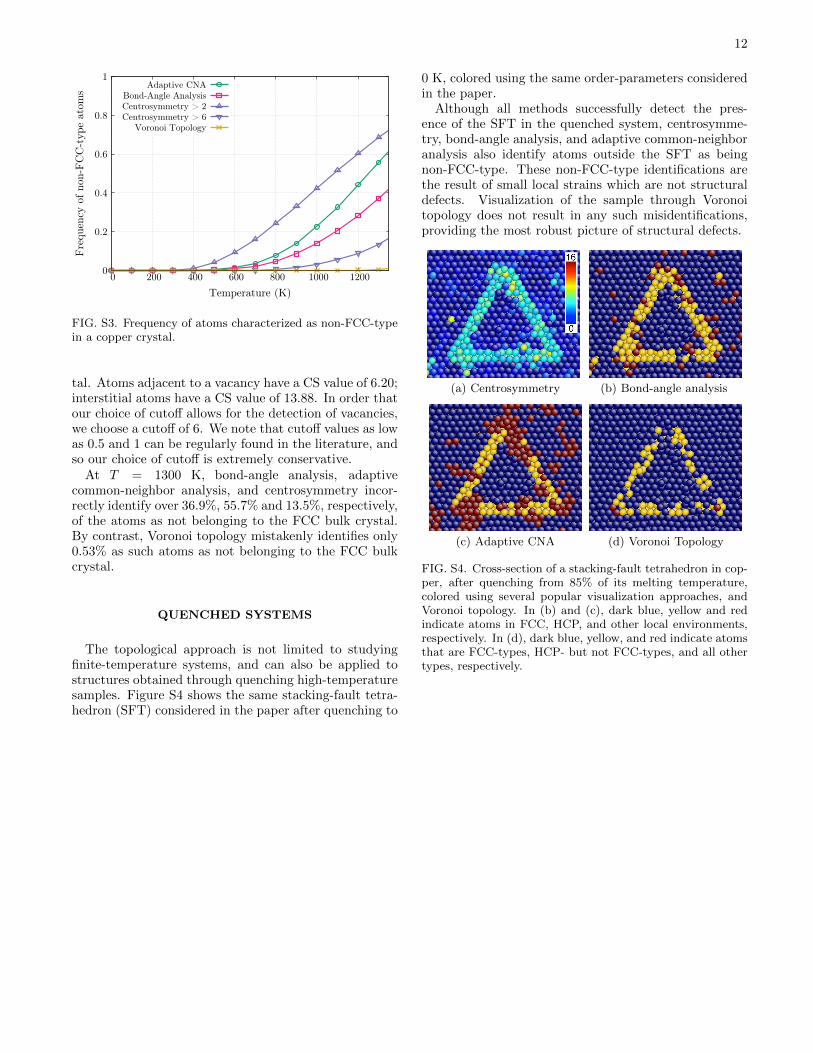
The topological approach is not limited to studyingfinite-temperature systems, and can also be applied tostructures obtained through quenching high-temperaturesamples. Figure S4 shows the same stacking-fault tetra-hedron (SFT) considered in the paper after quenching to
0 K, colored using the same order-parameters consideredin the paper.
Although all methods successfully detect the pres-ence of the SFT in the quenched system, centrosymme-try, bond-angle analysis, and adaptive common-neighboranalysis also identify atoms outside the SFT as beingnon-FCC-type. These non-FCC-type identifications arethe result of small local strains which are not structuraldefects. Visualization of the sample through Voronoitopology does not result in any such misidentifications,providing the most robust picture of structural defects.
(a) Centrosymmetry (b) Bond-angle analysis
(c) Adaptive CNA (d) Voronoi Topology
FIG. S4. Cross-section of a stacking-fault tetrahedron in cop-per, after quenching from 85% of its melting temperature,colored using several popular visualization approaches, andVoronoi topology. In (b) and (c), dark blue, yellow and redindicate atoms in FCC, HCP, and other local environments,respectively. In (d), dark blue, yellow, and red indicate atomsthat are FCC-types, HCP- but not FCC-types, and all othertypes, respectively.


![arXiv:1705.04103v4 [cond-mat.mes-hall] 12 Sep 20171.1 Topology, stability and anyons 3 2 Topological order and anyons in condensed matter systems 6 2.1 Topological states that support](https://img.pdfslide.us/doc/110x75/602530c8c95e0501353964d9/arxiv170504103v4-cond-matmes-hall-12-sep-2017-11-topology-stability-and-anyons.jpg)


![SUPPLEMENTARY INFORMATION I. A BRIEF INTRODUCTION …...exciting developments of topological band theory and the discovery of topological insulators in condensed matter physics [4]](https://img.pdfslide.us/doc/110x75/5f33d84439828c360c6a464a/supplementary-information-i-a-brief-introduction-exciting-developments-of-topological.jpg)