Embed Size (px)
Citation preview

EFFECTS OF LOAD ON LOCOMOTION IN THE BROWN ANOLE, ANOLIS SAGREI
A THESIS SUBMITTED TO THE GRADUATE DIVISION OF THE
UNIVERSITY OF HAWAIʻI AT MĀNOA IN PARTIAL FULFILLMENT
OF THE REQUIREMENTS FOR THE DEGREE OF
MASTER OF SCIENCE
IN
ZOOLOGY
AUGUST 2012
By
Shannon N. Evers
Thesis Committee:
Marguerite Butler, Chairperson
Tim Tricas
Monique Chyba
Keywords: Anolis sagrei, locomotion, loading, kinematics, running, jumping

1
Table of Contents
Abstract……………………………………………………………………………………………………………………….2
Chapter 1: Running under load in the brown anole, Anolis sagrei……………………………….4
Abstract……………………………………………………………………………………………………………4
Introduction………………………………………………………………………………………………………5
Methods……………………………………………………………………………………………………………7
Results……………………………………………………………………………………………………………..12
Discussion………………………………………………………………………………………………………..15
Acknowledgments…………………………………………………………………………………………….21
References……………………………………………………………………………………………………….22
Tables……………………………………………………………………………………………………………….29
Figures………………………………………………………………………………………………………………37
Chapter 2. Effects of increased load on jump performance in the brown anole, Anolis sagrei………………………………………………………………………………………………………….46
Abstract…………………………………………………………………………………………………………….46
Introduction……………………………………………………………………………………………………..47
Methods……………………………………………………………………………………………………………50
Results………………………………………………………………………………………………………………55
Discussion…………………………………………………………………………………………………………58
Acknowledgments…………………………………………………………………………………………….65
References………………………………………………………………………………………………………..66
Tables……………………………………………………………………………………………………………….72
Figures………………………………………………………………………………………………………………78

2
Abstract
Locomotion is a crucial means of predator escape, foraging, and social
interactions in many animals, and the ability of an animal to excel in this performance
will have a direct impact on its overall fitness (Arnold 1983, Wainwright 1994). A factor
that may hinder performance is the addition of a load such as a large meal or clutch of
eggs, which is a challenge many species must face. Locomotor performance may also be
largely dependent on sex, size, or a combination thereof (Losos 1990, Irschick and
Garland 2001). Selective pressures related to those factors often result in adaptations in
morphology or behavior associated with maximal performance capabilities (Cullem
1998, Van Damme et al 2008). Examining locomotor performance and understanding
the associated adaptations can allow us to draw conclusions about fitness (Arnold 1983,
Husak and Fox 2008).
The present study was designed to determine the effects of increased load on
running and jumping performance in the lizard Anolis sagrei. For running, maximum
velocity was examined because of its ecological importance in many lizard species; short
bursts of speed close to maximal capacity are used to evade predation (Van Damme et
al 2008). Gait patterns were also explored, as these have been known to change to
compensate for a locomotor challenge (Irschick et al 2003). Jump distance, take-off
velocity, jump angle, and power output will be examined in jumping, which is another
common form of movement in anoles. It was found that performance in both areas of
locomotion declined under added load, and kinematics such as stride length and take-
3
off velocity were altered as well, but females outperformed males relative to size in
both running and jumping—a rarely reported occurrence.

4
Running under load in the brown anole Anolis sagrei Shannon Evers
Abstract
Locomotor performance has major effects on organismal fitness; therefore a
negative impact on fitness would be expected with burdens on locomotion such as the
carrying of large meals or clutches of eggs. Here the effects of increasing load on run
performance are studied in the brown anole, Anolis sagrei, a semi-arboreal species with
distinct sexual size dimorphism. Maximal running velocity was recorded with high speed
video cameras and compared across four artificial loading treatments: unloaded, 20%,
35%, and 50% body weight. The effect of load, body size, and sex was examined in
relation to maximal velocity, and it was found that both sexes suffered a decline in
maximum velocity with increased load. Gait parameters were examined to see what
changes animals made to compensate for the increased weight. As load increased,
stride lengths decreased, while the step phase remained constant to generate force for
the rest of the stride. Males ran faster than females. There was a positive relationship
between velocity and body mass between the sexes, but this relationship weakened
with added weight, and size-corrections revealed that females were running faster than
males, relative to size. These results suggest that anoles in the field may be unable to
perform to their maximum unloaded capability after a large meal, or while carrying a
clutch of eggs. It is unclear why females should outperform males relative to size, and
5
may indicate some morphological or physiological difference that needs to be further
explored.
Introduction
The ability of an animal to perform at its maximum locomotor capacity can
impact its overall fitness (Arnold 1983, Wainwright 1994), therefore detriments to
performance can have devastating effects. For most animals, running is an especially
important form of locomotion in predator escape, foraging, and social interactions, and
can be influenced by a wide variety of factors, including size or sex (Losos 1990, Irshick
and Garland 2001). Selective pressures related to those factors may result in
adaptations in morphology or behavior associated with maximal performance
capabilities. Furthermore, they may also result in trade-offs, as animals are not
optimally adapted for every situation (Stearns 1989). For example, selection for larger
size may result in greater speed and fighting ability, but less relative power output (Toro
et al 2003). Examining these locomotor differences and exploring the effects of
potential detriments can help us understand the selective pressures that shaped their
musculoskeletal system (Griffin 2006).
The addition of extra weight would be one such detriment to an animal’s
locomotor capability. In natural situations, the increase in load would be in the form of a
large meal or a clutch of eggs (Garland and Arnold 1983, Vitt and Price 1982).
6
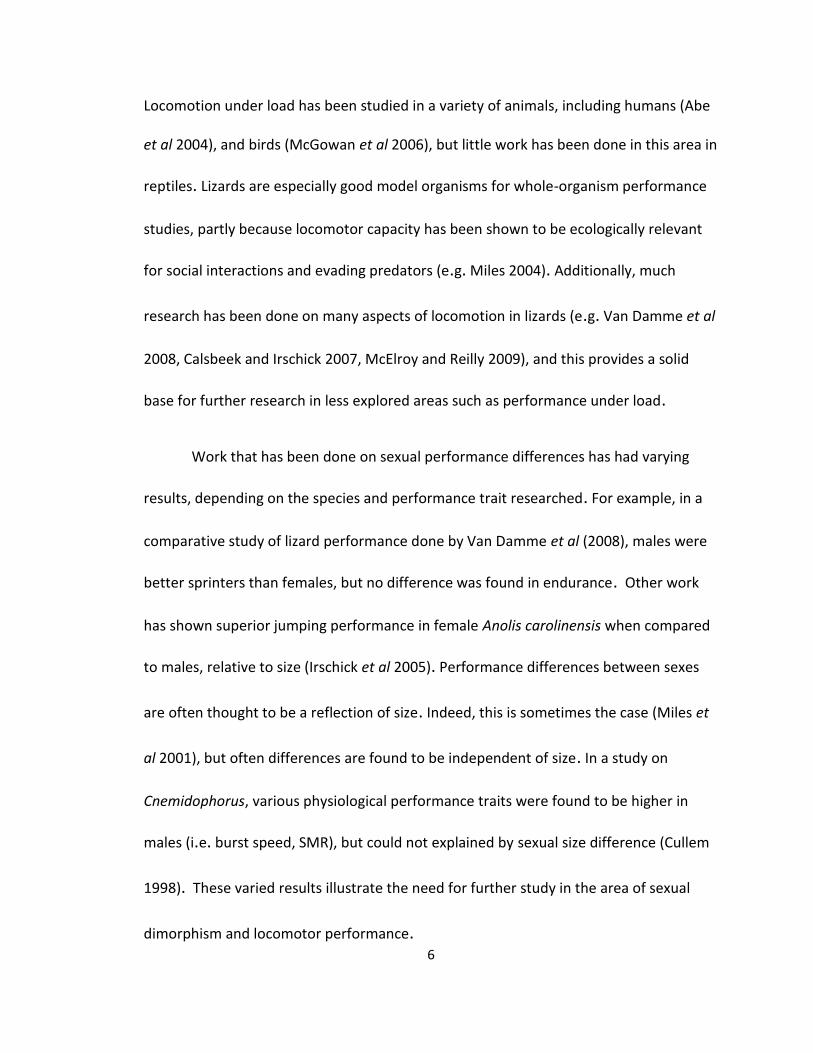
Locomotion under load has been studied in a variety of animals, including humans (Abe
et al 2004), and birds (McGowan et al 2006), but little work has been done in this area in
reptiles. Lizards are especially good model organisms for whole-organism performance
studies, partly because locomotor capacity has been shown to be ecologically relevant
for social interactions and evading predators (e.g. Miles 2004). Additionally, much
research has been done on many aspects of locomotion in lizards (e.g. Van Damme et al
2008, Calsbeek and Irschick 2007, McElroy and Reilly 2009), and this provides a solid
base for further research in less explored areas such as performance under load.
Work that has been done on sexual performance differences has had varying
results, depending on the species and performance trait researched. For example, in a
comparative study of lizard performance done by Van Damme et al (2008), males were
better sprinters than females, but no difference was found in endurance. Other work
has shown superior jumping performance in female Anolis carolinensis when compared
to males, relative to size (Irschick et al 2005). Performance differences between sexes
are often thought to be a reflection of size. Indeed, this is sometimes the case (Miles et
al 2001), but often differences are found to be independent of size. In a study on
Cnemidophorus, various physiological performance traits were found to be higher in
males (i.e. burst speed, SMR), but could not explained by sexual size difference (Cullem
1998). These varied results illustrate the need for further study in the area of sexual
dimorphism and locomotor performance.

7
The present study was designed to determine the effects of increased load on
running performance in an Anolis lizard. Maximum velocity was examined because of its
ecological importance in many lizard species; short bursts of speed close to maximal
capacity are used to evade predation (Van Damme et al 2008). Velocity was examined
in relation to load, and also size and sex in order to see the influence of sexual size
dimorphism. Furthermore, we examined potential changes in gait parameters of the
lizards, as this has been found to vary under load (Irschick et al 2003). It was
hypothesized that males would have higher velocities than females due to their larger
size, but that females would be able to handle the weight more effectively, perhaps as
an adaptation to carrying eggs.
Methods
Study species
The brown anole (Anolis sagrei) is a small Caribbean lizard that has been
introduced in Hawai`i and is common on O`ahu. This species is semi-arboreal and
produces a single-egg clutch as often as every one or two weeks (Andrews and Rand
1974). Anoles breed year-round in Hawaii (Goldberg et al 2002), so females may be
constantly burdened with this reproductive load. Brown anoles are also sexually
dimorphic in size, with males typically being much larger than females (this study: male
average mass: 4.9 g, female average mass: 2.1 g).

8
Sixty A. sagrei (30 males, 30 females) were caught by noose or by hand in Manoa
Valley on O`ahu (August-October 2010). The lizards were maintained in 10-gallon
aquaria. Females were housed in groups of three, while two males shared an aquarium
with an opaque divider to prevent stress and aggressive interactions. They were kept at
ambient temperature (~30° C) and lighting conditions, fed crickets every other day, and
watered daily in accordance with the University of Hawai`i IACUC protocol (no. 10-902-
2).
Experimental setup
A three-meter track was made from a two-by-four plank covered with a
rubberized liner for traction. Originally the track had Plexiglas® walls, but we found that
lizards were distracted by their reflection in the Plexiglas® and ran better with the walls
removed. Because anoles tend to hop on horizontal surfaces, the track was inclined at
20° in order to obtain smooth runs (Calsbeek and Irschick 2007). A small dark box was
placed at the end of the track as a hiding place for the lizards to run toward in order to
facilitate recapture. Two IDTTM N-4 high speed cameras recorded the trials, placed so as
to obtain orthogonal views. Dorsal and lateral views of each run were simultaneously
recorded at 250 Hz using the two high-speed video cameras linked to a computer and
run using IDT Motion Studio software. Kwon CC was used to calibrate the two camera
views using the DLT method, and the video recordings were digitized using Kwon 3D 3.0

9
(Kwon 1994). In order to facilitate digitization of the videos, each lizard had a reflective
marker of negligible mass attached to its hip to track the position of the lizard frame-by-
frame. The marker was made of a 3 mm plastic bead wrapped in retroreflective tape
(3M Scotchlite 8850 Silver Pressure Sensitive Adhesive Film, Motion Lab Systems, Inc.).
Treatments and locomotor trials
The body mass of each lizard was measured to the nearest tenth of a gram, and
snout-vent length (SVL) and hind limb length were measured to the nearest millimeter.
SVL was the length from the tip of the snout to the vent, and the hind limb was
measured from the hip to the tip of the longest toe. Four loading treatments were used
in the experiment: unloaded, 20%, 35%, and 50% of the lizard’s body mass. Weights
were made specifically for each individual and were accurate to a hundredth of a gram.
They were cut from lead fishing sinkers and attached to each lizard’s center of mass
(above the hip) using cyanoacrylate glue. Weights were attached at least twelve hours
before trials began to allow the lizard to become accustomed to the load. After each
treatment weights were simply peeled off, leaving no injury as anoles regularly shed
their skin. Experiments were carried out at ambient temperature (~30° C), which has
been found to be the optimal temperature for performance in anoles (Lailvaux and
Irschick 2007).

10
During experimental trials, anoles were encouraged to run up the track by
tapping the tail. Each lizard carried each of the four treatments in random order, with
two days of rest between treatments. Each lizard was run five times per treatment in an
effort to obtain their maximal velocity (Adolph and Pickering 2008). To assure adequate
rest, at least twenty-four hours of rest was allowed between each running trial. Trials
were held once daily for five consecutive days per treatment, with two days of rest
between treatments.
For each lizard, only “good” runs were considered for analysis, meaning there
were no stops or jumps, and animals appeared to be running with their maximum
effort. From these, only the run with the fastest maximal velocity per treatment was
used for the final analyses. Additionally, anoles needed at least three good treatment
trials in order to be included in the final analyses. Many animals either refused to
perform under large loads, had poor runs with many stops, or appeared to be running at
sub-maximal effort. Therefore only 14 females and 11 males satisfied the criteria to be
included in the final analyses.
Position data from the videos was smoothed using the pspline package (Ramsey
and Ripley 2010) in the R statistical computing language (R Development Core Team,
2010). Smoothing began at least 20 frames before the first frame included in the
analysis and continued until the animal ran out of camera view. The first derivative of

11
the smoothed data was taken to calculate instantaneous velocity, and the maximal
velocity of each run was used for analysis.
We analyzed the kinematics of locomotion near maximum velocity (the three
strides centered around the maximum velocity). Data obtained from the smoothed
videos included: time to maximal velocity from take-off, swing, step, and stride times
and lengths as well. The “swing” phase is the time in a stride the foot was in the air,
while the “stance” phase or “step” is the time the foot was on the ground. A stride is
one complete locomotor cycle, that is, the swing and stance phases combined. The
corresponding lengths are the distance that the body moves during the swing, step, or
stride.
Statistical analysis
All statistical analyses were conducted using the stats package in the R statistical
computing environment (R Development Core Team 2010). To determine the effect of
load on performance, a linear regression was performed of maximum velocity as a
function of added load as a continuous variable, sex, body mass, and the interactions
between them. In all linear models, if interactions were not significant, they were
dropped and the model was run again. An ANOVA was used to examine the effects of
sex and mass in that model.
In an effort to clarify whether differences in velocity between males and females
was due to sex or size, a linear regression was also performed to look at the relationship

12
between body size (using body mass) and maximal velocity. To further explore whether
performance was more strongly affected by sex or size, we calculated velocity on a per-
body-length basis by dividing maximum velocity data by snout-vent length, and
examined the linear regression of relative velocity across load.
Some animals have been shown to alter their gait parameters to compensate for
additional weight (Irshick et al 2003), either by increasing stride length to gain more
distance per step, or by taking smaller, more frequent steps. In the latter scenario, steps
often increase relative to the stride because that is the portion of the stride in which the
animal generates force. To see if either of these alterations occurred in anoles, a linear
regression was run using stride length as a function of load, sex, body mass, and the
interactions between them. Similar regressions were done using stance and swing times
to dissect the stride and determine which aspect of the stride was being altered, if any.
ANOVAs were also used in the linear models of stride, swing, and stance to look for
effects of sex, mass, and hind limb length.
Results
There was a large amount of variation between individuals, and the pattern of
locomotor decline was not always the same across individuals. Some animals, for
example, ran faster carrying 20% of their body weight than when they were unloaded,

13
perhaps spurred on to greater effort by the added stress. However, the overall trend
was that maximum velocity decreased with increased load (linear regression with
maximum velocity as a function of load, mass, and sex, slope of load on velocity= -0.32,
p=0.03, Figure 1). Velocity decreased incrementally with each treatment, and with 50%
of their body weight, males ran 12% slower than while unloaded, while females ran 8%
slower.
Because all males in this study are larger than females, the variables of sex and
mass are confounded. When maximum velocity is modeled as a function of load, mass,
and sex, the effects of mass and sex overlap broadly in explanatory power. If mass is
accounted for first in an ANOVA, it the effect of sex is not significant, whereas if sex is
accounted for before mass, only sex is significant (Table 3). Similarly, if mass is included
in a linear regression, sex is not found to be significant. However, if mass is removed,
sex becomes highly significant (Table 3).
However, several lines of evidence show that the effect of mass is relatively
weak or inconsistent. Within each sex, there is no effect of mass (ANOVA Tables 1 and
2). If sexes are pooled, there is a significant positive relationship between body mass
and maximum velocity when the anoles were unloaded (linear regression, r2=0.36,
p=0.002; fig. 2a). However, this relationship became weaker as load increased, and was
not significant in the 20% and 50% body weight treatments (Figure 2b, d). Size
corrections were used to clarify whether sex or size was influencing velocity. After

14
correcting for SVL, females ran relatively faster than males (ANOVA, Table 4, Figure 3).
Thus, while we cannot rule out some small effect of mass, there is clear evidence for sex
difference in performance. Within the linear regression of relative velocity across load,
there was no significant interaction between sex and load, indicating the amount of
decline with treatment was the same in males and females (ANOVA, sex by load
interaction: F1,80=0.119, p-value=0.731).
Because animals may alter their gait in response to load, the three strides
centered around the maximum velocity were examined. Since the trends were similar
for all three strides, only the results of the first stride are reported here. Stride length
decreased with increased load (linear regression, slope=-0.03, p=0.03, Figure 5, Table 6).
Males shortened their strides by 25% under a 50% BW load compared to unloaded, and
female strides shortened by 15% in the same treatment. Body mass and hind limb
length are also significant factors in regard to stride length (ANOVA, Table 6). However,
stride time was maintained across all four treatments (linear regression, slope=-0.0001,
p=0.24, Figure 4, Table 5), so as load increased, anoles moved a shorter distance in the
same amount of time.
When we break the stride down into its two components, swing and stance, we
see that the swing duration decreases with load at the same rate in both sexes (linear
model, slope of load on swing duration = -0.000215, p=0.022, sex by load interaction:
p=0.09, Figure 6, Table 7). Mass has an effect on swing duration (larger animals have

15
faster swing phases; Table 7), but this effect disappears if we account for sex before
mass (Table 7). On the other hand, sex has a significant effect, regardless of the order it
enters into the model (males have longer swings; Table 7). Animals also shortened
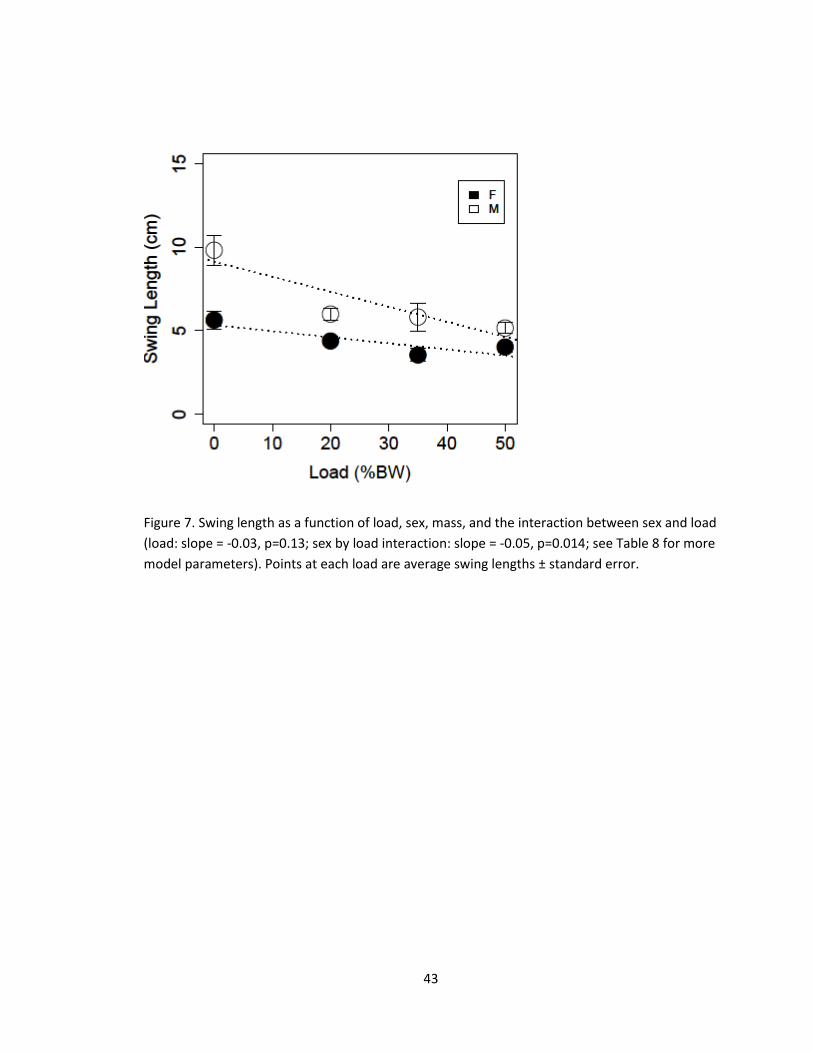
swing length as load increased, that is, the distance moved during the swing phase
(linear model, slope=-0.036±0.01, p=0.013, Figure 7, Table 8), but the decrease was
more substantial in males than in females (linear regression slope of load on swing
length for females: -0.036±0.014 p-value=0.013; for males: -0.09±0.02, p-value=0.014,
Table 8).
The step duration, however, is maintained at a constant value even when loads
are increased within each sex, although males have consistently longer step durations
(Table 9, Figure 8). Despite no changes in step time, step length decreased with added
load in males, but not females (linear model, female slope=-0.003, p=0.78; male slope=-
0.048±0.018, p=0.01, Figure 9, Table 10).
Discussion
Effect of Load on Performance
Maximum running velocity was substantially reduced as added weight increased.
Male velocity decreased 12%, while females ran 8% slower. These findings concur with
previous studies in loaded locomotion. For example, Shine (2003) found that the skink

16
Lampropholis guichenoti ran 15% slower while carrying 20% of its body weight
compared to running unloaded. It is interesting that the decline in performance was less
in the anoles of this study than the skinks, but this could simply be due to the nature of
the added load. Shine created internal loads by injecting the body cavity of the skinks
with saline, while here the anoles ran with external weights. Results similar to this
experiment were seen in a study by Cox and Calsbeek (2010), where they found that
female green anoles (Anolis carolinensis) ran 12% faster after having their oviductal eggs
surgically removed, thus reducing the added weight of the reproductive burden.
Although the percent decrease in performance may not seem large, such a
reduction could still be biologically significant. Male anoles are territorial and therefore
spend time in the open defending an area, where they are exposed to predators. Both
sexes spend time basking in the open as well, and rely on running away to escape
predation, rather than crypsis. A decrement in running capacity due to a large meal or a
clutch of eggs could reduce their ability to flee. Indeed, gravid green anoles have been
shown to have reduced breeding season survival compared to non-gravid females (Cox
and Calsbeek 2010). Additionally, some anoles can consume up to 30% of their body
weight in a single feeding event (Kuo et al 2011), a loading amount that in this study
decreased velocity. These natural loads would likely affect the animal’s maximum
capacity in the field and therefore its ability to flee, which would likely reduce its overall
fitness.
17
Effect of size
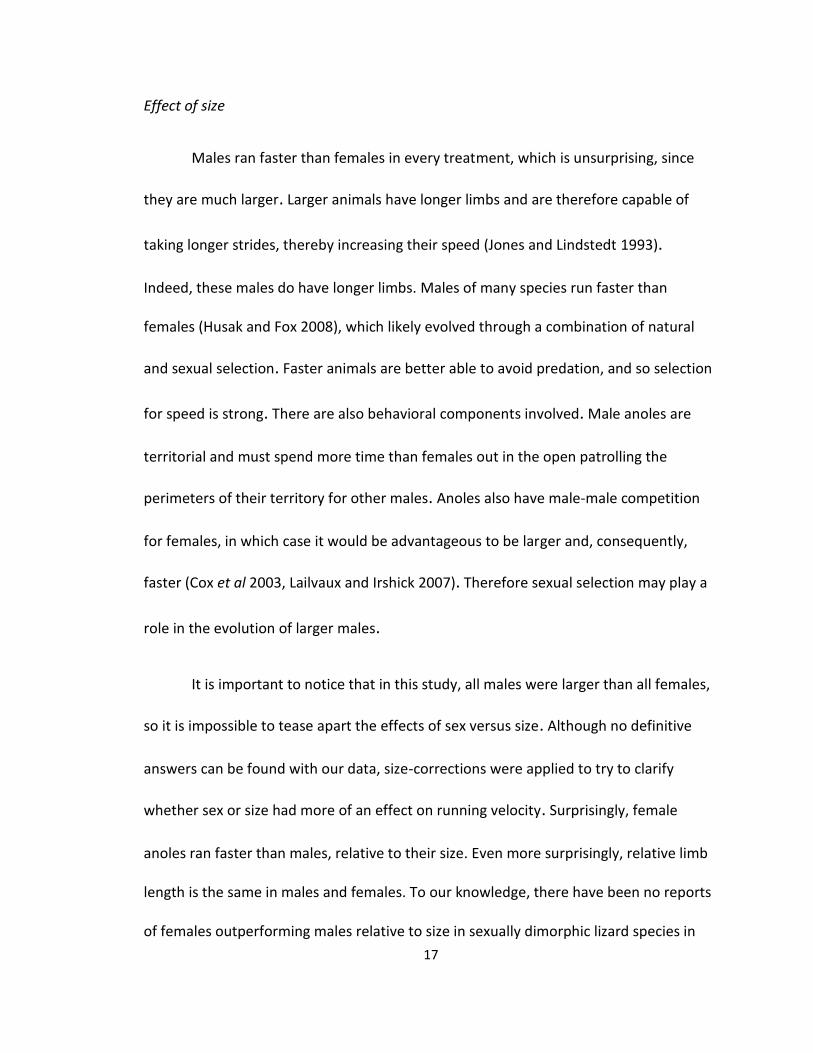
Males ran faster than females in every treatment, which is unsurprising, since
they are much larger. Larger animals have longer limbs and are therefore capable of
taking longer strides, thereby increasing their speed (Jones and Lindstedt 1993).
Indeed, these males do have longer limbs. Males of many species run faster than
females (Husak and Fox 2008), which likely evolved through a combination of natural
and sexual selection. Faster animals are better able to avoid predation, and so selection
for speed is strong. There are also behavioral components involved. Male anoles are
territorial and must spend more time than females out in the open patrolling the
perimeters of their territory for other males. Anoles also have male-male competition
for females, in which case it would be advantageous to be larger and, consequently,
faster (Cox et al 2003, Lailvaux and Irshick 2007). Therefore sexual selection may play a
role in the evolution of larger males.
It is important to notice that in this study, all males were larger than all females,
so it is impossible to tease apart the effects of sex versus size. Although no definitive
answers can be found with our data, size-corrections were applied to try to clarify
whether sex or size had more of an effect on running velocity. Surprisingly, female
anoles ran faster than males, relative to their size. Even more surprisingly, relative limb
length is the same in males and females. To our knowledge, there have been no reports
of females outperforming males relative to size in sexually dimorphic lizard species in

18
which males are larger. Males have always been reported as being faster, both
absolutely and relative to size, although in some cases male and female endurance is
the same (Cullem 1998, Van Damme et al 2008). These findings do support earlier
studies in another form of locomotion, in which females outperformed males in jumping
capability relative to their size (Irschick et al 2005). Why they perform better is still
unclear. Kinetic energy output was not examined in this study, so it is possible that
females are producing more power relative to their size. Alternatively, females may
have some physiological adaptation that allows them to use power more efficiently, for
example, in order to move as well as males. Males and females do face many of the
same selective pressures, such as predators, and so females must be able to
compensate for their size. More research to determine exactly where the difference in
sexes occurs is needed to fully explain this surprising result.
It is interesting to note that while there is a positive relationship between body
mass and velocity when anoles were unloaded, that relationship weakens with added
weight, and is not significant when anoles were carrying 20% and 50% of their body
weight. In some scaling models, an increase in muscle cross-sectional area results in a
larger increase in volume or mass (Hill 1950). So it has been suggested that larger
animals are unable to produce as much power per unit body mass as smaller animals
because of the manner by which muscle cross-sectional area and force scale with size
(Hill 1950, Wilson et al 2000, Toro et al 2003). Perhaps under increased load, larger

19
animals are unable to produce enough power to maintain their speed, while smaller
animals are less constrained.
Gait parameters
Animals have been shown to alter gait parameters to account for challenges to
locomotion, such as steeper inclines or added loads (Hoyt et al 2000, Irshick 2003). In
this case, anoles decreased stride length with added load while stride time was
maintained, which is consistent with their decreased sprint speed. However, both
phases of the stride were not reduced equally. Swing time decreased, while step time
was maintained, in effect fitting in more force-generation phases for the same duration
of travel as load is increased. Since force is generated during the step, this was
presumably an attempt to maintain performance by preserving the step while swinging
the limbs faster. The step is the phase of the stride in which the foot is on the ground,
generating force for the swing. In this case the step phase increased relative to stride
length. The alteration in gait seen here supports some loading studies (e.g. Zani and
Claussen 1995) but conflicts with others (e.g. Hoyt et al 2000). Some discrepancies are
likely due to the wide variety of taxa. Turtles were found to decrease stride length
under load (Zani and Claussen 1995), but some mammals carrying loads displayed no
alterations in stride frequency or length (Taylor et al 1980). However, differences have
also been seen in much more closely related species. In a study of climbing with load
(Irshick et al 2003), one species of gecko (Gekko gecko) takes longer strides to increase

20
speed, while another (Hemidactylus garnoti) takes smaller, more frequent strides. It
would be interesting if further research in Anolis lizards revealed similar differences
between species.

21
Acknowledgments
I would like to thank Marguerite Butler, Tim Tricas and Monique Chyba for their
input in the analysis and interpretation of this study. Thanks also to Jeff Scales, Julio
Rivera, and Justin Walguarnary for their advice, as well as Leigh Ann Boswell for helping
capture anoles and Sammy Collins for her assistance in collecting and digitizing data.
Final thanks go to the University of Hawai`i at Manoa providing laboratory space and
funding for the performance trials.

22
References
Abe, Daijiro, Kazumasa Yanagawa, and Shigemitsu Niihata. 2004. Effects of load
carriage, load position, and walking speed on energy cost of walking. Applied
Ergonomics 35, 329-335.
Adolph, S.C., and T. Pickering. 2008. Estimating maximum performance: effects of
intraindividual variation. Journal of Experimental Biology 211, 1336-1343.
Andrews, R., and A.S. Rand. 1974. Reproductive effort in Anoline lizards. Ecology 55,
1317-1327.
Arnold, Stevan J. 1983. Morphology, Performance and Fitness. American Zoologist 23,
347-361.
Butler, Marguerite A. 2007. Vive le difference! Sexual dimorphism and adaptive
patterns in lizards of the genus Anolis. Integrative and Comparative Biology 47,
272-284.
Calsbeek, Ryan, and Duncan J. Irschick. 2007. The quick and the dead: correlational
selection on morphology, performance, and habitat use in island lizards.
Evolution 61, 2493-2503.

23
Cox, Robert, Stephanie L. Skelly, and Henry B. John-Alder. 2003. A comparative test of
adaptive hypotheses for sexual size dimorphism in lizards. Evolution 57, 1653-
1669.
Cox, Robert, and Ryan Calsbeek. 2010. Severe costs of reproduction persist in Anolis
lizards despite the evolution of a single egg clutch. Evolution 64, 1321-1330.
Cullum, Alistair. 1998. Sexual dimorphism in physiological performance of whiptail
lizards (genus Cnemidophorus). Physiological Zoology 71, 541-552.
Evers, Shannon. 2012. Effects of load on locomotion in the brown anole, Anolis sagrei.
MA thesis. University of Hawai`i at Manoa.
Farley, C.T. 1997. Maximum speed and mechanical power output in lizards. Journal of
Experimental Biology. 200, 2189-2195.
Garland, T. Jr, and S. J. Arnold. 1983. Effects of a full stomach on locomotory
performance of juvenile garter snakes (Thamnophis elegans). Copeia 4, 1092-
1096.
Goldberg, Stephen R., Fred Kraus, and Charles R. Bursey. 2002. Reproduction in an
introduced population of the brown anole, Anolis sagrei, from O`ahu, Hawai`i.
Pacific Science 56, 163-168.

24
Griffin, Timothy M. 2006. Powering locomotion? It’s a loaded question. Journal of
Applied Physiology 101, 1273-1274.
Hill, A. V., 1950. The dimensions of animals and their muscular dynamics. Science
Progress 38, 209-230.
Hoyt, D.F., S. J. Wickler, and E. A. Cogger. 2000. Time of contact and step length: the
effect of limb length on running speed, load carrying and incline. Journal of
Experimental Biology 203, 221-227.
Husak, Jerry F. and Stanley F. Fox. 2008. Sexual selection on locomotor performance.
Evolutionary Ecology Research 10, 213-228.
Irschick, D.J., S. Bocchi, and R.J. Full. 2001. Does power limit climbing performance?
Loading small climbing lizards. American Zoology 41, 1481.
Irschick, D.J., and T. Garland, Jr. 2001. Integrating function and ecology in studies of
adaptation: investigations of locomotor capacity as a model system. Annual
Review of Ecology and Systematics 32, 367-396.
Irschick, Duncan J., Bieke Vanhooydonck, Anthony Herrel, and Anemone Andronescu.
2003. Effects of loading and size on maximum power output and gait
characteristics in geckos. Journal of Experimental Biology 206, 3923-3934

25
Irschick, D.J., B. Vanhooydonck, A. Herrel, and J.J. Meyers. 2005. Intraspecific
correlations among morphology, performance and habitat use within a green
anole lizard (Anolis carolinensis) population. Biological Journal of the Linnean
Society 85, 223-234.
Jones, J. and S. Lindstedt. 1993. Limits to maximal performance. Annual Review of
Physiology 55, 547-569.
Kratochvil, Lukas, and Lukas Kubicka. 2006. Why reduce clutch size to one or two eggs?
Reproductive allometries reveal different evolutionary causes of invariant clutch
size in lizards. Functional Ecology 21, 171-177.
Kuo, Chi-Yun, G.B. Gillis, and D.J. Irschick. 2011. Loading effects on jump performance
in green anole lizards, Anolis carolinensis. Journal of Experimental Biology 214,
2073-2079.
Kwon, Y.-H. (1994). KWON3D Motion Analysis Package 2.1 User's Reference Manual.
Anyang, Korea: V-TEK Corporation.
Lailvaux, Simon P. and Duncan J. Irschick. 2007. The evolution of performance-based
male fighting ability in Caribbean Anolis lizards. The American Naturalist 170,
573-586.

26
Losos, Jonathan B. 1990. The evolution of form and function: morphology and
locomotor performance in West Indian Anolis lizards. Evolution 44, 1189-1203.
McElroy, Eric J. and Stephen M. Reilly. 2009. The relationship between limb
morphology, kinematics, and force during running: the evolution of locomotor
dynamics in lizards. Biological Journal of the Linnean Society 97, 634-651.
McGowan, J.P., H.A. Duarte, J.B. Main, and A. A. Biewener. 2006. Effects of load
carrying on metabolic cost and hindlimb muscle dynamics in guinea fowl
(Numida meleagris). Journal of Applied Physiology 101, 1060-1069.
Miles, D.B., H.L. Snell, and H.M. Snell. 2001. Intrapopulation variation in endurance of
Galapagos lava lizards (Microlophus albemarlensis): evidence for an interaction
between natural and sexual selection. Evolutionary Ecology Research 3, 795-804.
Miles, D.B. 2004. The race goes to the swift: fitness consequences of variation in sprint
performance in juvenile lizards. Evolutionary Ecology Research 6, 63-75.
Ramsey, Jim, and Brian Ripley. 2010. Penalizes Smoothing Splines. R package version
1.0-14. http://CRAN.R-project.org/package=pspline.
R Development Core Team. 2010. R: A language and environment for statistical
computing. R Foundation for Statistical Computing, Vienna, Austria. ISBN 3-
900051-07-0, URL http://www.R-project.org.

27
Scales, Jeffrey, and Marguerite Butler. 2007. Are powerful females powerful enough?
Acceleration in gravid green iguanas (Iguana iguana). Integrative and
Comparative Biology 47, 285-294.
Shine, Richard. 2003. Effects of pregnancy on locomotor performance: an experimental
study on lizards. Oecologia 136, 450-456.
Stearns, S.C., 1989. Trade-offs in life history evolution. Functional Ecology 3, 259-268.
Taylor, C.R., Heglund, N.C., McMahon, T.C., and Looney, T.R. 1980. Energetic cost of
generating muscular force during running: a comparison of large and small
animals. Journal of Experimental Biology 86, 9-18.
Toro, Esteban, Anthony Herrel, Bieke Vanhooydonck, and Duncan J. Irschick. 2003. A
biomechanical analysis of intra- and interspecific scaling of jumping and
morphology in Caribbean Anolis lizards. Journal of Experimental Biology 206,
2641-2652.
Van Damme, R., P. Entin, B. Vanhooydonck, and A. Herrel. 2008. Causes of sexual
dimorphism in performance traits: a comparative approach. Evolutionary
Ecology Research 10, 229-250.
Vitt, L. J., and H. J. Price. 1982. Ecological and evolutionary determinants of relative
clutch mass in lizards. Herpetologica 38, 237-255.

28
Wainwright, Peter C. 1994. Functional morphology as a tool in ecological research. In
Ecological Morphology: ntegrative Organismal Biology (ed. P.C. Wainwright and
M. Reilly), pp. 42-59. Chicago, IL: University of Chicago Press.
Wilson, R.S., Franklin, C.E., and James, R. S. 2000. Allometric scaling relationships of
jumping performance in the striped marsh frog, Limnodynastes peronii. Journal
of Experimental Biology 203, 1937-1946.
Zani, P. A., and D. L. Claussen. 1995. Effects of extrinsic load on locomotion in painted
turtles (Chrysemys picta). Copeia 1995. 735-738.

29
Table 1. ANOVA of male maximum velocity as a function of load and mass.
Velocity ~ load + mass
Df Sum Sq Mean Sq F value Pr(>F)
load 1 2123.9 2123.89 9.3636 0.0043 **
mass 1 79.4 79.42 0.3501 0.5580
Residuals 34 7712.0 226.82
Table 2. ANOVA of female maximum velocity as a function of load and mass.
Velocity ~ load + mass
Df Sum Sq Mean Sq F value Pr(>F)
load 1 1522.8 1522.84 3.5567 0.06577 .
mass 1 1107.7 1107.65 2.5870 0.11474
Residuals 45 19267.1 428.16
Table 3. Velocity ~ load + sex + mass; A) ANOVA of maximum velocity as a function of load, sex,
and mass. ANOVA terms are presented as Type I sums of squares, or sequential improvements
to the model as effects are added. B) ANOVA of maximum velocity as a function of load, mass,
and sex. Because mass and sex are confounding, the order they are entered into the model
determines their significance. C) Summary of linear model of maximum velocity as a function of
load, mass, and sex. P-values for linear regression terms are based on improvements to the
regression model after accounting for all other terms first (analogous to Type III effects). D)
Linear model of maximum velocity as a function of load and sex. Due to mass and sex being
confounding factors, we see that when mass is removed, sex is highly significant.
A Df Sum Sq Mean Sq F value Pr(>F)
load 1 3580.9 3580.9 10.5050 0.0017287 **
sex 1 5312.3 5312.3 15.5843 0.0001673 ***
mass 1 619.5 619.5 1.8173 0.1813949
Residuals 81 27610.6 340.9

30
B Df Sum Sq Mean Sq F value Pr(>F)
load 1 3580.9 3580.9 10.5050 0.001729 **
mass 1 5899.1 5899.1 17.3060 7.869e-05 ***
sex 1 32.6 32.6 0.0956 0.757957
Residuals 81 27610.6 340.9
C Estimate Std. Error t value Pr(>|t|)
(Intercept) 146.6905 8.0050 18.325 < 2e-16 ***
load -0.3524 0.1085 -3.249 0.00169 **
mass 4.5263 3.3576 1.348 0.18139
sexM 3.1826 10.2929 0.309 0.75796
D Estimate Std. Error t value Pr(>|t|)
(Intercept) 156.1331 3.8943 40.093 < 2e-16 ***
load -0.3516 0.1090 -3.226 0.001804 **
sexM 15.9451 4.0592 3.928 0.000178 ***
Table 4. SVL corrected velocity ~ load + sex; A) ANOVA of SVL-corrected maximum velocity as a
function of load and sex. B) Summary of linear model of SVL-corrected maximum velocity as a
function of load, mass, and sex.
A Df Sum Sq Mean Sq F value Pr(>F)
load 1 126.36 126.36 6.0726 0.01582 *
sex 1 402.05 402.05 19.3210 3.285e-05 ***
Residuals 82 1706.33 20.81

31
B Estimate Std. Error t value Pr(>|t|)
(Intercept) 34.69004 0.95743 36.232 < 2e-16 ***
sexM -4.38659 0.99796 -4.396 3.28e-05 ***
load -0.06601 0.02680 -2.463 0.0159 *
Table 5. Summary of linear model of stride time as a function of load, mass, hind limb length,
and sex.
Stride time ~ load + mass + hind limb + sex
Estimate Std. Error t value Pr(>|t|)
(Intercept) 0.0098470 0.0264481 0.372 0.7107
load -0.0001251 0.0001272 -0.984 0.3281
mass -0.0044610 0.0029962 -1.489 0.1405
hindlimb 0.0021296 0.0008320 2.560 0.0124 *
sexM 0.0200333 0.0128950 1.554 0.1243
Table 6. Stride length ~ load + sex + mass; A) Summary of linear model of stride length as a
function of load, sex, and mass. B) ANOVA of stride length as a function of load, mass, hind limb,
and sex.
A Estimate Std. Error t value Pr(>|t|)
(Intercept) 10.17051 0.98316 10.345 < 2e-16 ***
load -0.06918 0.01332 -5.193 1.51e-06 ***
sexM 3.63699 1.26415 2.877 0.00513 **
mass 0.16239 0.41238 0.394 0.69477

32
B Df Sum Sq Mean Sq F value Pr(>F)
load 1 77.703 77.703 20.275 2.255e-05 ***
mass 1 270.914 270.914 70.689 1.282e-12 ***
hindlimb 1 79.101 79.101 20.640 1.938e-05 ***
sex 1 0.299 0.299 0.078 0.7808
Residuals 80 306.600 3.832
Table 7. Swing time ~ load + mass + sex; A) Summary of linear model of swing time as a function
of load, mass, and sex. B) ANOVA of swing time as a function of load, mass, and sex.
A Estimate Std. Error t value Pr(>|t|)
(Intercept) 3.925e-02 5.280e-03 7.433 1.03e-10 ***
load -2.153e-04 9.231e-05 -2.333 0.0222 *
mass -7.950e-04 2.121e-03 -0.375 0.7088
sexM 1.944e-02 7.544e-03 2.577 0.0118 *
B Df Sum Sq Mean Sq F value Pr(>F)
load 1 0.0024375 0.00243752 17.6082 6.836e-05 ***
mass 1 0.0025181 0.00251815 18.1906 5.319e-05 ***
sex 1 0.0007736 0.00077357 5.5881 0.02045 *
Residuals 82 0.0113513 0.00013843

33
Table 8. Swing length ~ load + mass + sex + sex:load; A) Summary of linear model of swing
length as a function of load, mass, sex, and the interaction between sex and load. B) ANOVA of
swing length as a function of load, mass, sex, and the interaction between load and sex.
A Estimate Std. Error t value Pr(>|t|)
(Intercept) 5.18651 0.81967 6.328 1.29e-08 ***
load -0.03646 0.01442 -2.529 0.0134 *
mass 0.06994 0.32838 0.213 0.8319
sexM 3.59443 1.17478 3.060 0.0030 **
load:sexM -0.05345 0.02129 -2.511 0.0140 *
B Df Sum Sq Mean Sq F value Pr(>F)
load 1 106.601 106.601 32.1947 2.093e-07 ***
mass 1 107.288 107.288 32.4021 1.939e-07 ***
sex 1 13.833 13.833 4.1776 0.04421 *
load:sex 1 20.876 20.876 6.3047 0.01403 *
Residuals 81 268.202 3.311
Table 9. Step time ~ load + mass + sex; A) Summary of linear model of step time as a function
of load, mass, and sex. B) ANOVA of step time as a function of load, mass, and sex.
A Estimate Std. Error t value Pr(>|t|)
(Intercept) 3.714e-02 4.152e-03 8.945 9.24e-14 ***
load 8.596e-09 5.552e-05 0.000 0.99988
mass -1.663e-03 1.717e-03 -0.969 0.33560
sexM 1.541e-02 5.233e-03 2.944 0.00421 **

34
B Df Sum Sq Mean Sq F value Pr(>F)
load 1 0.0000014 0.00000144 0.0158 0.90026
mass 1 0.0017489 0.00174891 19.2380 3.402e-05 ***
sex 1 0.0007881 0.00078807 8.6687 0.00421 **
Residuals 82 0.0074545 0.00009091
Table 10. Step length ~ load + mass + sex + sex:load; A) Summary of linear model of step length
as a function of load, mass, sex, and the interaction between sex and load. B) ANOVA of step
length as a function of load, mass, sex, and the interaction between sex and load.
A Estimate Std. Error t value Pr(>|t|)
(Intercept) 4.354773 0.697622 6.242 1.94e-08 ***
load -0.003365 0.012196 -0.276 0.78333
mass 0.041221 0.280246 0.147 0.88343
sexM 3.141643 0.996714 3.152 0.00228 **
load:sexM -0.047703 0.018194 -2.622 0.01046 *
B Df Sum Sq Mean Sq F value Pr(>F)
load 1 17.890 17.890 7.5506 0.007411 **
mass 1 74.877 74.877 31.6017 2.675e-07 ***
sex 1 10.572 10.572 4.4618 0.037781 *
load:sex 1 16.288 16.288 6.8743 0.010465 *
Residuals 80 189.553 2.369

35
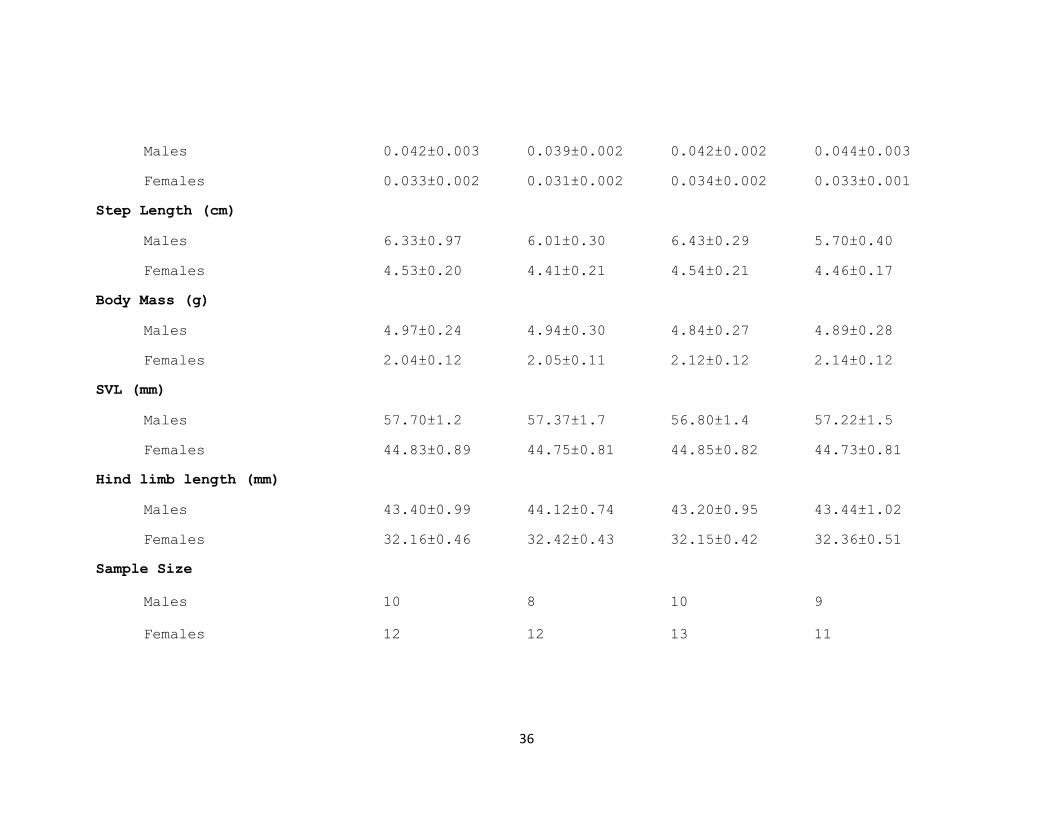
Table 11. Descriptive statistics for variables used in analysis. Means ±standard error given. Columns represent loading treatments which were:
unloaded, loaded with 20% body mass, 35% body mass, and 50% body mass.
Maximum Velocity (cm/s) Unloaded 20% 35% 50%
Males 173.06±4.5 164.33±7.1 162.13±4.1 151.41±4.5
Females 153.56±4.3 153.71±7.6 139.77±6.0 141.13±5.9
Stride Time (s)
Males 0.10±0.009 0.09±0.005 0.08±0.004 0.08±0.005
Females 0.07±0.006 0.06±0.003 0.06±0.003 0.06±0.002
Stride Length (cm)
Males 14.86±1.2 12.97±0.51 12.39±0.82 11.09±0.47
Females 10.12±0.50 9.12±0.43 8.37±0.47 8.54±0.36
Swing Time (s)
Males 0.058±0.006 0.040±0.003 0.037±0.004 0.033±0.003
Females 0.040±0.004 0.031±0.002 0.027±0.002 0.025±0.001
Swing Length (cm)
Males 5.89±0.65 6.98±0.44 5.96±0.70 5.06±0.26
Females 5.59±0.45 4.70±0.28 3.83±0.31 4.19±0.29
Step Time (s)
36
Males 0.042±0.003 0.039±0.002 0.042±0.002 0.044±0.003
Females 0.033±0.002 0.031±0.002 0.034±0.002 0.033±0.001
Step Length (cm)
Males 6.33±0.97 6.01±0.30 6.43±0.29 5.70±0.40
Females 4.53±0.20 4.41±0.21 4.54±0.21 4.46±0.17
Body Mass (g)
Males 4.97±0.24 4.94±0.30 4.84±0.27 4.89±0.28
Females 2.04±0.12 2.05±0.11 2.12±0.12 2.14±0.12
SVL (mm)
Males 57.70±1.2 57.37±1.7 56.80±1.4 57.22±1.5
Females 44.83±0.89 44.75±0.81 44.85±0.82 44.73±0.81
Hind limb length (mm)
Males 43.40±0.99 44.12±0.74 43.20±0.95 43.44±1.02
Females 32.16±0.46 32.42±0.43 32.15±0.42 32.36±0.51
Sample Size
Males 10 8 10 9
Females 12 12 13 11

37
Figure 1. Linear regression of velocity as a function of load (male and female slope= -0.32,
p=0.03; see Table 3 for more model parameters). Points at each load are average velocities ±
standard error.

38
Figure 2. Linear regression of velocity as a function of mass for every treatment. Unloaded:
r2=0.36, p=0.002. 20% BW: r2=0.06, p=0.29. 35% BW: r2=0.32, p=0.004. 50% BW: r2=0.07, p=0.23.
Male points are open circles, females are filled.

39
Figure 3. Linear regression of size-corrected velocity as a function of load (male and female
slope= -0.32, p=0.03; see Table 4 for more model parameters). Points at each load are average
velocities ± standard error.

40
Figure 4. Linear regression of stride time as a function of load (male and female slope=-0.0001,
p=0.24, see Table 5 for more model parameters). Points at each load are average stride lengths
± standard error.

41
Figure 5. Linear regression of stride length as a function of load (male and female slope=-0.03,
p=0.03; see table 6 for more model parameters). Points at each load are average stride lengths ±
standard error.

42
Figure 6. Linear regression of swing time as a function of load, mass, and sex (male and female
slope = -2.15e-04, p=0.022; see Table 7 for more model parameters). Points at each load are
average swing times ± standard error.
43
Figure 7. Swing length as a function of load, sex, mass, and the interaction between sex and load
(load: slope = -0.03, p=0.13; sex by load interaction: slope = -0.05, p=0.014; see Table 8 for more
model parameters). Points at each load are average swing lengths ± standard error.

44
Figure 8. Linear model of step time as a function of load, mass, and sex (male and female slope =
8.5e-09, p=0.99; see Table 9 for more model parameters). Points at each load are average step
times ± standard error.

45
Figure 9. Linear model of step length as a function of load, mass, sex, and the interaction
between sex and load (load: slope =-0.003, p=0.78, load by sex interaction: slope =-0.047,
p=0.01; see Table 10 for more model parameters). Points at each load are average step lengths
± standard error.

46
Effects of increased load on jump performance in the brown anole, Anolis sagrei
Shannon Evers
Abstract
Jumping is an important ecological task for many species that may be influenced
by differences in sex or size. Furthermore, a detriment in performance may affect
overall fitness, such as the addition of an extra load in the form of a large meal or a
clutch of eggs. However, few studies have measured these handicaps or explored the
limits of locomotor capabilities under load. Here the effects of increasing load are
studied in the brown anole, Anolis sagrei, a sexually dimorphic species that is semi-
arboreal and jumps often as part of its natural behavior. Several jump parameters,
including jump distance, take-off velocity, and jump angle were calculated from high
speed video of Anolis jumps and compared across four loading treatments: unloaded,
20%, 35%, and 50% body weight. Power output was examined as a possible limiting
factor to performance. Sex and size were also considered in all analyses. Loading caused
a significant decrease in jump distance and take-off velocity, but jump angle did not
vary. Power output also did not increase with added load, suggesting the ability to
produce power may be a limiting factor in maximum jump performance. The decline in
performance under increasing load was similar in males and females, but females jump
greater distances relative to their size without producing more mass-specific power than
males. These results suggest that anoles in the field may be unable to perform to their
maximum capability after a large meal, or while gravid. Furthermore, the ability of

47
females to jump relatively farther than males indicates some morphological or
physiological difference that needs to be further explored.
Introduction
For many animals, jumping is an integral aspect of predator escape, foraging,
and social interactions, and the ability of an animal to excel in this performance will
have a direct impact on its overall fitness (Arnold 1983, Wainwright 1994). For most
taxa, jumping locomotion may be influenced by a variety of ecological, physiological,
and behavioral factors, such as habitat, optimal temperature, or foraging mode
(Calsbeek and Irshick 2007, Jones and Lindstedt 1993). Even within species, performance
capabilities may be dependent on size or sex (Losos 1990, Van Damme et al 2008,
Irschick and Garland 2001). Selective pressures related to those factors often result in
adaptations in morphology or behavior associated with maximal performance
capabilities, such as active foragers having greater endurance than predators that rely
on crypsis (Huey et al 1984). Examining locomotor performance and understanding the
associated adaptations can allow us to draw conclusions about fitness (Arnold 1983,
Husak and Fox 2008).
One factor that would affect maximal performance is the addition of extra
weight, which in natural situations could be in the form of a large meal or sizeable
offspring. Some venomous snakes may ingest meals exceeding 100% of their body
weight (Garland and Arnold, 1983), and the relative clutch mass of some lizards is over

48
40% of body mass (Vitt and Price, 1982). Feeding and reproduction are crucial tasks that
are repeated throughout an animal’s life, so it is reasonable to assume that adaptations,
whether morphological, physiological, or behavioral, may exist to compensate for the
added load, or the animals will suffer a performance decrease. Understanding how
animals adjust to these burdens and what limits their locomotor abilities can shed light
on the selective pressures that shaped their musculoskeletal system (Griffin 2006,
Irschick et al 2003).
Jump performance has recently been studied in lizards (e.g. Toro et al 2003,
Irschick et al 2005, Kuo et al 2011), but research on the effect of load is less common.
Most research on load-carrying has focused on running performance and has only
examined one natural form of load, that caused by reproduction. Gravidity has been
shown to induce changes in behavior, survival, and locomotor performance (e.g. Cooper
et al 1990, Cox and Calsbeek 2010, Scales and Butler 2007). Results of these studies
have not always been consistent, however. In many cases, gravid females were shown
to run more slowly than non-gravid conspecifics (e.g. Shine 1980, Olsson et al 2000, Cox
and Calsbeek 2010), but in other research, the impairment was not due to an increase in
clutch mass relative to body mass (Brodie 1989, Sinervo et al 1991). Furthermore, it is
difficult to exclude the possibility of hormonal changes affecting locomotion as well as
the load. Therefore, an experimental manipulation such as added mass will produce a
clearer test of the effect of weight alone.
Most of these reproductive studies intuitively focus on females, leaving open
questions about how males handle extra burdens, and whether there is any sex
49
difference. Research comparing load-carrying between the sexes is sparse, which is
surprising since males also carry natural loads such as that of a large meal. Males are
often larger and therefore should be able to perform most physical tasks better than
females due to greater muscle mass (Van Damme et al 2008). However, females may be
adapted to carrying a load and could carry extra weight better. Furthermore, other
factors may affect performance in both sexes, such as power output. How much kinetic
energy an animal can produce may potentially limit performance, and studies in this
area have had conflicting results.
The purpose of this study is to determine how increasing load affects jump
performance in the brown anole, Anolis sagrei. It is hypothesized that performance will
decline with increasing load, but that differences will be seen between the sexes in both
distance and the rate of performance decline. It is expected that males will outperform
females due to larger size, but that females will show less decline in performance with
load due to an adaptation to reproduction. This study will also examine other kinematic
variables included in jumps, such as take-off velocity, angle, and work and power
output. The latter will be analyzed as a possible limitation to performance. Finally, we
will using previous data from an earlier study of running under load (Evers 2012,
Chapter 1) to look for possible trade-offs between running and jumping performance.
Because limb length has been linked to faster runners and longer jump distances (Van
Damme et al 2008, Toro et al 2004), it is hypothesized that good runners will also be
good jumpers, with no trade-offs between the two.
50
Methods
Study species
The brown anole (Anolis sagrei) is a small Caribbean lizard that has been
introduced in Hawai`i and is common on O`ahu. This species is semi-arboreal and
produces a single-egg clutch as often as every one or two weeks (Andrews and Rand
1974). Anoles breed year-round in Hawaii (Goldberg et al 2002), so females may be
constantly burdened with this reproductive load. Brown anoles are also sexually
dimorphic in size, with males typically being much larger than females.
Sixty Anolis sagrei (30 females, 30 males) were caught by noose or by hand in
Manoa Valley on O`ahu (August-October 2010). The lizards were maintained in 10-
gallon aquaria. Females were housed in groups of three, while two males shared an
aquarium with an opaque divider to prevent stress and aggressive interactions. They
were kept at ambient temperature (~30° C) and lighting conditions, fed crickets every
other day, and watered daily in accordance with the University of Hawaii IACUC protocol
(no. 10-902-2). These anoles were also used in running experiments prior to this study
(Evers 2012, Chapter 1), and so were in captivity for several weeks before trials began.
All animals were healthy at the start of this study, and none became acclimated to the
researchers.
Treatments and jump trials
The body mass of each lizard was measured to the nearest tenth of a gram, and
snout-vent length (SVL) and hind limb length were measured to the nearest millimeter.
SVL was the length from the tip of the snout to the vent, and the hind limb was

51
measured with the leg held perpendicularly to the body from the point where the hind
limb inserts into the hip to the tip of the longest toe. Four loading treatments were used
in the experiment: unloaded, 20%, 35%, and 50% of the lizard’s body mass. Weights
were made specifically for each individual and were accurate to a hundredth of a gram.
They were cut from lead fishing sinkers and attached dorsally to each lizard’s hip (the
approximate center of mass) using cyanoacrylate glue. Weights were attached at least
twelve hours before trials began to allow the lizard to become accustomed to the load.
After each treatment weights were simply peeled off, leaving no injury as anoles
regularly shed their skin. Experiments were run at ambient temperature (~30° C), which
has been found to be the optimal temperature for performance in anoles (Lailvaux and
Irschick 2007).
Every anole carried each of the four treatments in random order. Each lizard
performed five trials per treatment in an effort to obtain their maximal effort (Adolph
and Pickering 2008). To minimize stress and assure adequate rest, a trial consisted of
only a single jump, with at least twenty-four hours of rest between each trial. Trials
were held once daily for five consecutive days per treatment, with two days of rest
between treatments.
Experimental setup and data collection
Brown anoles are semi-arboreal lizards, and it is a common behavior for them to
jump down from a low branch to the ground. In an attempt to replicate this natural
behavior, anoles in this study jumped from a platform. The jumping platform was made
from a two-by-four plank covered with a rubberized liner for traction and set 24 cm off

52
the ground. A small, dark box was placed 60 cm away on the ground as a hiding place
for the lizards to run toward after landing to facilitate recapture of the lizards. Two
IDTTM high speed cameras were set up to record the trials. Dorsal and lateral views of
each jump were simultaneously recorded at 250 Hz using the two cameras linked to a
computer and run using IDT Motion Studio software. Kwon CC was used to calibrate the
two camera views using the DLT method, and the video recordings were digitized using
Kwon 3D 3.0 (Kwon 1994). In order to facilitate digitization of the videos, each lizard had
a reflective marker of negligible mass attached to its hip to track the position of the
lizard frame-by-frame. The marker was made of a small (3mm) plastic bead wrapped in
retroreflective tape (3M Scotchlite 8850 Silver Pressure Sensitive Adhesive Film, Motion
Lab Systems, Inc.).
Anoles were encouraged to jump from the platform by tapping the tail or hitting
the platform behind the animal. For each lizard, only “good” jumps were considered for
analysis, meaning that the animal jumped from a starting position of all four feet on top
of the platform (not hanging off the side), jumped in a forward direction, and did not
flail or spin around while in the air. From these, only the jump with the farthest maximal
distance per treatment was used for analysis. Additionally, anoles needed at least three
good treatment trials in order to be included in the final analyses. Many animals either
refused to perform under large loads, had poor jumps, or appeared to be jumping with
sub-optimal effort. Therefore only 12 females and 9 males satisfied the criteria to be
included in the final analyses.

53
Position data of the hip marker in x, y, and z coordinates was smoothed using the
pspline package (Ramsey and Ripley 2010) in the R statistical programming environment
(R Development Core Team 2010). Smoothing began at least 20 frames before the first
frame included in analysis and continued at least 20 frames after the lizard landed. Jump
distance was calculated from the smoothed 3D position data as the distance from the
point where all four feet were off the platform to the point at which all four feet
touched the ground: D = √((x1-x0)2 + (y1-y0)2 + (z1-z0)2), where subscript 1 refers to the
coordinates for the landing position, and 0 refers to the coordinates of the take-off
position. The first derivative of the smoothed data was taken to calculate instantaneous
velocity of the jump. From this data, we obtained the following 3D parameters to be
used for further analysis: take-off velocity, jump distance, jump angle, and push-off
time.
Ballistic Projectile Model
Because the jump is modeled here as a ballistic projectile, jump length is related
to take-off velocity (vt) and take-off angle (θ) in the following manner (Biewener 2003):
L = ( vt2 sin 2θ ) / g
Take-off velocity is the instantaneous velocity at the point where all four feet
have completely left the platform, g is the acceleration due to gravity, and θ is the jump
angle. In order to explain sources of variation in jump distance, we explored whether
take-off velocity, jump angle, or both varied. Jump angle was calculated using the
following equation (Biewener 2003):
54
vv = vtsinθ
where vv is the vertical velocity.
Performance differences will result in differences in work, power or both. Indeed
one explanation for performance decline with added load is that animals are operating
at maximal power output at all loads, thus increasing loads will necessarily result in
performance decline. Work and power for a jump are generated in the push-off phase,
as all force production against the ground ceases once an animal leaves the platform
(Alexander 2003). Work was calculated using the following equation (Alexander 2003):
W = ½ (m vt2)
where, m is the body mass of the lizard plus the experimental load, and vt is take-off
velocity. Power was calculated as:
P = W/tpo
where tpo is the push-off time, which was determined to be the time from the first
movement of the anole’s head (indicating the beginning of a jump) to the point at which
all four feet were completely off the platform.
Statistical analysis
All statistical analyses were conducted using the stats package in the R statistical
computing environment (R Development Core Team 2010). To determine the effect of
load on performance, a linear regression was performed on maximum jump distance as
a function of SVL, added load, sex, and the interaction between load and sex to examine
whether sexes had different responses to load. SVL and load were included as a

55
continuous variables, whereas sex was a factor variable. If the interaction term was not
significant, the interaction term was dropped from the model. ANOVA was used to
examine whether sexes differed.
In order clarify which component of the jump was most affected by load, take-
off velocity and jump angle were each used in linear regressions as functions of load,
SVL, and sex. A final linear regression was done using power as a function of load, sex,
and SVL to see if there was a leveling-off with increased weight, indicating a limiting
factor.
To explore whether performance differed between the sexes after adjusting for
size, we calculated relative jump distance corrected for size by dividing jump distance
data by snout-vent length, and the linear regression of relative jump distance across
load was run again. Similarly, we examined the relationship between mass-specific
power (power divided by body mass) and increasing load.
Finally, to look for potential trade-offs between running and jumping in anoles,
we compared the maximum jump distances from this study to maximum running
velocity in a previous experiment (Evers, 2012, Chapter 1). Again, because a limited
number of animals performed well enough in all treatments to be included, only 9
animals (6 females, 3 males) were used in this analysis.
Results
Increased load had a detrimental effect on maximal jump distance (Linear
regression, slope=-0.15, p<0.001, Figure 1, Table 1). These results support similar

56
findings by Kuo et al (2011) in which jump performance in Anolis carolinensis decreased
with an addition of 30% body weight. There were decreases at every incremental load,
suggesting a continual decline. However, in a study of running under load no decrease
was seen until the added weight reached 20% of the animal’s body weight (Shine 2003),
which was the lowest treatment here. It is possible that there is a certain load at which
performance drops off, but it is not detected by this study. Jump distance decreased
with added load in males and females at the same rate (Linear regression, slope=-0.15,
p<0.001, sex effect: p=0.11, Figure 1, Table 1). When carrying 50% of their body weight,
male jumps shortened by 18% compared to unloaded jumps, while female jumps
shortened 14.5%. Sexes did not significantly differ in the reduction of jump distance, and
there was no relationship between size (SVL) and the amount of jump distance
reduction (ANOVA, sex effect: p=0.18, SVL effect: p=0.28, Table 1).
Because larger animals often outperform smaller conspecifics, and males are
usually larger than females, size and sex are often confounding factors. To attempt to
differentiate between the two, we also examined size-corrected data. After correcting
for SVL, females were shown to jump significantly farther than males (ANOVA, sex
effect: p<0.001, Figure 2, Table 2). At 50% body weight, male jumps were 18% shorter
than females on a per-body length basis. Because females are moving relatively greater
distances under the same loads, it would be expected that they produce more kinetic
energy than males. However, mass-specific power output did not vary between the
sexes (ANOVA, sex effect: p=0.43, Table 3), so, relative to size, females are performing
better than males without producing more power.

57
Jump distance is determined by the parameters in the take-off. When the
ballistic projectile model was broken down to determine which parameter was most
affected, take-off velocity or angle, it was found that take-off velocity decreased with
load in a similar pattern as jump distance (linear regression, slope=-0.61, p<0.001, Table
4, Figure 3), and male take-off velocity was higher than females (ANOVA, sex effect:
p<0.001, Table 4). In contrast, there was no difference in take-off angle between any
loading treatments for males or females (linear regression, slope=0.07, p=0.16, Table 5,
Figure 4). With increasing load, take-off velocity decreased, but no change in jump angle
occurred, resulting in a shorter jump distance. Previous studies on this species reported
similar unloaded jump distances (Irschick et al 2005), after accounting for the height of
the platform, suggesting that animals in this study were exhibiting normal jump
behavior.
When power was examined as a possible limiting factor, it was found that power
output did not increase with load in either males or females, and instead remained level
across the four treatments (linear regression, slope=-0.00004, p=0.76, Figure 5, Table 6).
Males produced more absolute power than females (ANOVA, sex effect: p<0.001, Table
6).
Finally, we compared jump distance to running velocity from a previous study to
look for potential trade-offs in locomotor capacity. Using a linear regression, we found
no relationship between the maximum jump distance recorded in this study and
maximum running velocity from the previous study in any treatment (Figure 6,

58
Unloaded: r2=-0.19, p=0.92; 20% BW: r2=-0.15, p=0.77; 35% BW: r2=-0.14, p=0.92; 50%
BW: r2=-0.21, p=0.75).
Discussion
Anoles in this study displayed a clear decline in jump performance under
increasing load. Jump distance was shortened in both males and females with each
treatment, but females were found to perform better relative to their size. Animals have
been known to produce alterations in kinematics to improve performance (Irshick et al
2003, Kuo et al 2011), but here we see that and important aspect of jump length, jump
angle, did not vary with load. Furthermore, take-off velocity decreased with load, but
power output remained constant with each treatment, suggesting that power is a
limiting factor to performance in this study.
Performance under load
Many animals in the field face natural loads, such as that of a large meal.
Reptiles are especially well known for their ability to consume large proportions of their
body weight, and it has been seen to have little effect on movement in some species of
snakes (Garland and Arnold 1983). While it is unclear how lizards handle such a load, the
decline in performance under load seen in this experiment suggests that jumping in
anoles in the field would suffer after a large meal. A similar species of anole can eat 30%
of its body weight in one meal (Kuo et al 2011), a burden well within the range of
treatments in this experiment. If the anoles cannot move to their maximum capabilities
on a full stomach, they will be more susceptible to predation. There seems to be a

59
trade-off here between obtaining the necessary energy in the form of food and
maintaining the capacity to escape predators—two important aspects of fitness in any
animal. More work needs to be done to examine the issue of feeding, however, as it is
unclear if other factors related to digestion may have an effect, or if a difference exists
in carrying an internal load versus the external loads used in this study.
Since females bear the reproductive burden, they may have some difference in
morphological design to cope with the extra weight. However, the fact that female
decrease in jump distance was no less than the males’ indicates no obvious locomotor
adaptation for carrying a clutch. Female performance would suffer not only after a large
meal, but also while the animal is gravid, making it more susceptible to predation. This
supports previous research that found that gravid anoles had decreased sprint speed
and breeding season survival compared to non-gravid females (Cox and Calsbeek 2010).
Other studies of load have also seen decreases in locomotor performance in females,
both in naturally gravid animals (Scales and Butler 2007) and in cases of artificial
burdens (Shine 1980). However, there have been behavioral differences reported in
females that may help overcome the reported locomotor challenge. For example, gravid
lizards tend to forage less, remain closer to shelter, and flee sooner in the presence of a
predator (Johnson 2010, Cooper et al 1990), thus compensating for their reduced
locomotor abilities and avoiding predation.

60
Effect of size
Larger animals in most taxa are usually better athletes than smaller conspecifics
(Van Damme et al 2008, Cullem 1998). Here we see that male jump distance does not
differ from females in any treatment, even though they are much larger. In the case of
brown anoles, males are territorial and often have three times the mass of females. It
would be advantageous to be larger in territorial species in order to win fights with
conspecific males and quickly escape predators despite more exposure from patrolling
territories (Husak and Fox 2008, Van Damme et al 2008, Peterson and Husak 2006).
Typically, larger animals perform better in many locomotor functions due to larger
muscle mass and the subsequent ability to produce more power (Van Damme 2008).
Indeed, males in this study were producing much more power than females (Table 1),
yet that difference did not translate into longer jumps. This is a curious finding for which
we have no obvious explanation. It is possible that male musculature may be designed
for activities such as male-male combat, and the consequent size has no real locomotor
advantage.
It is interesting to note that females jumped much farther than males relative to
their size. There have been some studies examining sexual differences in athletic
abilities, but in the vast majority of cases males outperform females both absolutely and
relative to their size (Van Damme et al 2008). In cases with sexual size dimorphism, it is
not surprising that a male would outperform a smaller female due to longer limbs, more
muscle mass, and superior power output. Even when correcting for size, males often

61
perform better because they have more muscle mass relative to their size (Van Damme
et al 2008). In this study, however, females jumped relatively farther than males with
each loading treatment, after correcting for snout-vent length. Even while carrying 50%
of their body weight, females jumped 18% farther in body lengths than males with the
same burden.
These findings support an earlier study in which females outperformed both
males and juveniles in jumping capability, relative to their size (Irschick et al 2005), but
why they perform better is still unclear. In this case, females do not produce more mass-
specific power, and they do not have longer hind limbs relative to their body. It is
possible that females have some physiological adaptation that allows them to use
power more efficiently, for example, in order to move as well as males. Males and
females do face many of the same selective pressures, such as predators, and so
females must be able to compensate for their size. More research to determine exactly
where the difference in sexes occurs is needed to fully explain this surprising result.
Limiting factors in performance
Power did not vary between any of the weight treatments in males or females,
suggesting that in this case the lizards are limited by their ability to recruit more power.
Whether or not power limits performance is still an unanswered question in biology. In
a study of lizards running up incrementally steeper slopes, power did not level off but
instead increased across treatments, leading to the conclusion that power was not a
limiting factor in uphill running (Farley 1997). In a study of two species of geckos
62
climbing under load, Irschick (2003) determined that mass-specific power output limited
climbing speed. Similarly, Kuo et al (2011) found that power limited jumping ability in
another species of anole. It could be that Farley simply did not reach the limit of the
lizards’ abilities. Other studies have suggested that animals are capable of producing
much more power than is needed on a regular basis (Askew and Marsh 1997), so
perhaps presenting the lizard with a larger burden such as an even steeper slope or
added weight would have produced different results in Farley’s study. It is also possible
that the differences in these findings could be due to differences in power requirements
in running versus jumping. Jumping is a very power-intensive behavior, with all force
generated during the take-off, which is very short in duration. Therefore, jumping may
be more power-limited than locomotion such as running, where force generation occurs
over a longer period of time and is partially recycled via elastic storage and recovery.
Animals may make other alterations in kinematics to compensate for their
limitations. Anoles running with a load, for example, increase their stride frequency in
an attempt to make up for the weight (Evers 2012, Chapter 2), as do climbing geckos
(Irschick 2003). This study examined take-off velocity and jump angle, the two main
components used to calculate jump distance as a ballistic projectile. Take-off velocity
decreased with load in both sexes, perhaps due to power limitation. Jump angle,
however, did not vary in either sex.
Optimal jump angle for achieving maximum jump length is dependent on hind
limb length and take-off velocity, but is generally around 45° (Biewener 2008). In this

63
study anoles appear to be jumping at sub-optimal angles in every treatment. Previous
work in lizard jump kinematics has found that lower jump angles result in significantly
lessened jump height and duration, but only a small decrement in jump distance (Toro
et al 2004). This is ecologically advantageous when escaping predation. By jumping at a
“sub-optimal” angle, an anole would be able to spend less time in the air where they are
relatively helpless, and instead would reach the ground more quickly to run away.
Another study on jumping in Anolis has suggested that anoles alter their take-off angle
to increase jump distance under load (Kuo et al 2011), but these contradictory findings
present the need for future research in this matter.
Trade-offs in locomotion
Because these anoles were also used in a previous running experiment (Evers
2012, Chapter 1), we had a unique opportunity to look for trade-offs between running
and jumping under load. Trade-offs in athletic performance are common occurrences in
nature; animals are not optimally adapted for every situation. A specialization in
locomotion is often reflected in morphological differences between species as well. For
example, Anolis species with relatively longer limbs move quickly on broad surfaces, but
are more cautious of narrow perches. In contrast, anoles with shorter limbs moved
better on the narrow perches (Losos and Sinervo 1989). However, here we found no
correlation between maximum jump distance and maximum velocity under any weight
treatment. Since no strong positive or negative relationship was found, this suggests no
trade-offs between these forms of locomotion. These findings also do not support the
64
hypothesis that good runners would also be good jumpers. Indeed, some animals were
good jumpers and relatively poor runners, and vice-versa, but most animals had mid-
ranges performances in both experiments. These results could be due to a small sample
size, so more work needs to be done to draw any definitive conclusions.

65
Acknowledgments
I would like to thank Marguerite Butler, Tim Tricas and Monique Chyba for their
input in the analysis and interpretation of this study. Thanks also to Jeff Scales, Julio
Rivera, and Justin Walguarnary for their advice, as well as Leigh Ann Boswell for helping
capture anoles and Sammy Collins for her assistance in collecting and digitizing data.
Final thanks go to the University of Hawai`i at Manoa providing laboratory space and
funding for the performance trials.
66
References
Adolph, S.C., and T. Pickering. 2008. Estimating maximum performance: effects of
intraindividual variation. Journal of Experimental Biology 211, 1336-1343.
Alexander, R.M. 2003. Principles of Animal Locomotion. Princeton, NJ; Princeton
University Press.
Andrews, R., and A.S. Rand. 1974. Reproductive effort in Anoline lizards. Ecology 55,
1317-1327.
Arnold, Stevan J. 1983. Morphology, Performance and Fitness. American Zoologist 23,
347-361.
Askew, G. N., and R. L. Marsh. 1997. The effects of length trajectory on the mechanical
power output of mouse skeletal muscles. Journal of Experimental Biology 200,
3119-3131.
Biewener, Andrew A. 2003. Animal Locomotion. Oxford, New York; Oxford University
Press.
Brodie, E.D. 1989. Behavioral modification as a means of reducing the cost of
reproduction. The American Naturalist 134, 225-238.
Calsbeek, Ryan, and Duncan J. Irschick. 2007. The quick and the dead: correlational
selection on morphology, performance, and habitat use in island lizards.
Evolution 61, 2493-2503.

67
Cooper, William E., L.J. Vitt, R. Hedges, and R.B. Huey. 1990. Locomotor impairment
and defense in gravid lizards (Eumeces laticeps): Behavioral shift in activity may
offset costs of reproduction in an active forager. Behavioral Ecology and
Sociobiology 27, 153-157.
Cox, Robert, and Ryan Calsbeek. 2010. Severe costs of reproduction persist in Anolis
lizards despite the evolution of a single egg clutch. Evolution 64, 1321-1330.
Cullum, Alistair. 1998. Sexual dimorphism in physiological performance of whiptail
lizards (genus Cnemidophorus). Physiological Zoology 71, 541-552.
Evers, Shannon. 2012. Effects of load on locomotion in the brown anole, Anolis sagrei.
MA thesis. University of Hawai`i at Manoa.
Farley, C.T. 1997. Maximum speed and mechanical power output in lizards. Journal of
Experimental Biology. 200, 2189-2195.
Garland, T. Jr, and S. J. Arnold. 1983. Effects of a full stomach on locomotory
performance of juvenile garter snakes (Thamnophis elegans). Copeia 4, 1092-
1096.
Goldberg, Stephen R., Fred Kraus, and Charles R. Bursey. 2002. Reproduction in an
introduced population of the brown anole, Anolis sagrei, from O`ahu, Hawai`i.
Pacific Science 56, 163-168.
Griffin, Timothy M. 2006. Powering locomotion? It’s a loaded question. Journal of
Applied Physiology 101, 1273-1274.

68
Huey, R. 1984. B., A. F. Bennett, H. John-Alder, and K. A. Nagy. Locomotor capacity and
foraging behaviour of Kalahari lacertid lizards. Animal Behavior 32, 41-50.
Husak, Jerry F. and Stanley F. Fox. 2008. Sexual selection on locomotor performance.
Evolutionary Ecology Research 10, 213-228.
Irschick, D.J., and T. Garland, Jr. 2001. Integrating function and ecology in studies of
adaptation: investigations of locomotor capacity as a model system. Annual
Review of Ecology and Systematics 32, 367-396.
Irschick, Duncan J., Bieke Vanhooydonck, Anthony Herrel, and Anemone Andronescu.
2003. Effects of loading and size on maximum power output and gait
characteristics in geckos. Journal of Experimental Biology 206, 3923-3934
Irschick, D.J., B. Vanhooydonck, A. Herrel, and J.J. Meyers. 2005. Intraspecific
correlations among morphology, performance and habitat use within a green
anole lizard (Anolis carolinensis) population. Biological Journal of the Linnean
Society 85, 223-234.
Johnson, Michele A., Jessica L. Caton, Rachel E Cohen, Joseph R. Vandecar, and Juli
Wade. 2010. The burden of motherhood: the effect of reproductive load on
female lizard locomotor, foraging, and social behavior. Ethology 116, 1217-1225.
Jones, J. and S. Lindstedt. 1993. Limits to maximal performance. Annual Review of
Physiology 55, 547-569.
69
Kuo, Chi-Yun, G.B. Gillis, and D.J. Irschick. 2011. Loading effects on jump performance
in green anole lizards, Anolis carolinensis. Journal of Experimental Biology 214,
2073-2079.
Kwon, Y.-H. (1994). KWON3D Motion Analysis Package 2.1 User's Reference Manual.
Anyang, Korea: V-TEK Corporation.
Lailvaux, S. P., and D. J. Irshick. 2007. Effects of temperature and sex on jump
performance and biomechanics in the lizard Anolis carolinensis. Functional
Ecology 21, 534-543.
Losos, Jonathan B., and Barry Sinervo. 1989. The effects of morphology and perch
diameter on sprint performance of Anolis lizards. Journal of Experimental Biology
145, 23-30.
Losos, Jonathan B. 1990. The evolution of form and function: morphology and
locomotor performance in West Indian Anolis lizards. Evolution 44, 1189-1203.
Olsson, M., R. Shine, and E. Bak-Olsson. 2000. Locomotor impairment of gravid lizards:
is the burden physical of physiological? Journal of Evolutionary Biology 13, 263-
268.
Peterson, Charles C., and Jerry F. Husak. 2006. Locomotor performance and sexual
selection: individual variation in sprint speed of collared lizards (Crotaphytus
collaris). Copeia 2, 216-224

70
R Development Core Team. 2010. R: A language and environment for statistical
computing. R Foundation for Statistical Computing, Vienna, Austria. ISBN 3-
900051-07-0, URL http://www.R-project.org.
Ramsey, Jim, and Brian Ripley. 2010. Penalizes Smoothing Splines. R package version
1.0-14. http://CRAN.R-project.org/package=pspline.
Scales, Jeffrey, and Marguerite Butler. 2007. Are powerful females powerful enough?
Acceleration in gravid green iguanas (Iguana iguana). Integrative and
Comparative Biology 47, 285-294.
Shine, Richard. 1980. “Costs” of reproduction in reptiles. Oecologia 46, 92-100.
Shine, Richard. 2003. Effects of pregnancy on locomotor performance: an experimental
study on lizards. Oecologia 136, 450-456.
Sinervo, B., R. Hedges, and S.C. Adolph. 1991. Decreased sprint speed as a cost of
reproduction in the lizard Sceloporus occidentalis: variation among populations.
Journal of Experimental Biology 155, 323-336.
Toro, Esteban, Anthony Herrel, Bieke Vanhooydonck, and Duncan J. Irschick. 2003. A
biomechanical analysis of intra- and interspecific scaling of jumping and
morphology in Caribbean Anolis lizards. Journal of Experimental Biology 206,
2641-2652.

71
Toro, E., Anthony Herrel, and Duncan Irschick. 2004. The evolution of jumping
performance in Caribbean Anolis lizards: solutions to biomechanical trade-offs.
The American Naturalist 163, 844-856.
Van Damme, R., P. Entin, B. Vanhooydonck, and A. Herrel. 2008. Causes of sexual
dimorphism in performance traits: a comparative approach. Evolutionary Ecology
Research 10, 229-250.
Vanhooydonck, B., and R. Van Damme. 2001. Evolutionary trade-offs in locomotor
capacities in lacertid lizards: are splendid sprinters clumsy climbers? Journal of
Evolutionary Biology 14, 46-54.
Vitt, L. J., and H. J. Price. 1982. Ecological and evolutionary determinants of relative
clutch mass in lizards. Herpetologica 38, 237-255.
Wainwright, Peter C. 1994. Functional morphology as a tool in ecological research. In
Ecological Morphology: ntegrative Organismal Biology (ed. P.C. Wainwright and
M. Reilly), pp. 42-59. Chicago, IL: University of Chicago Press.

72
Table 1. Jump distance ~ load + SVL + sex; A) Linear regression of jump distance as a function of
load, SVL, and sex. P-values for linear regression terms are based on improvements to the
regression model after accounting for all other terms first (analogous to Type III effects). B)
ANOVA table of jump distance as a factor of load, SVL, and sex. ANOVA terms are presented as
Type I sums of squares, or sequential improvements to the model as effects are added.
A Estimate Std. Error t value Pr(>|t|)
(Intercept) 57.50562 6.79680 8.461 1.01e-12 ***
load -0.15360 0.02364 -6.496 6.47e-09 ***
SVL -0.16675 0.15473 -1.078 0.284
sexM 2.95081 1.85329 1.592 0.115
B Df Sum Sq Mean Sq F value Pr(>F)
load 1 678.19 678.19 42.2028 6.467e-09 ***
SVL 1 7.32 7.32 0.4553 0.5018
sex 1 40.74 40.74 2.5351 0.1153
Residuals 80 1285.59 16.07
Table 2. SVL-corrected jump distance ~ load + sex; A) Linear regression of size-corrected jump
distance as a function of load and sex. B) ANOVA table of size-corrected jump distance as a
factor of load and sex.
A Estimate Std. Error t value Pr(>|t|)
(Intercept) 11.487221 0.225521 50.936 < 2e-16 ***
load -0.031951 0.006284 -5.084 2.33e-06 ***
sexM -1.856979 0.234902 -7.905 1.15e-11 ***

73
B Df Sum Sq Mean Sq F value Pr(>F)
load 1 29.343 29.343 25.851 2.331e-06 ***
sex 1 70.938 70.938 62.495 1.154e-11 ***
Residuals 81 91.944 1.135
Table 3. Mass-specific power ~ load + sex; A) Linear regression of mass-specific power as a
function of load and sex. B) ANOVA table of mass-specific power output as a factor of load and
sex.
A Estimate Std. Error t value Pr(>|t|)
(Intercept) 27.93079 1.57018 17.788 <2e-16 ***
load -0.01239 0.04375 -0.283 0.778
sexM -1.26484 1.63550 -0.773 0.442
B Df Sum Sq Mean Sq F value Pr(>F)
load 1 4.4 4.415 0.0802 0.7777
sex 1 32.9 32.910 0.5981 0.4416
Residuals 81 4457.1 55.026
Table 4. Take-off velocity ~ load + SVL + sex; A) Linear model of take-off velocity as a function of
load, SVL, and sex. B) ANOVA table of take-off velocity as a factor of load, SVL, and sex.
A Estimate Std. Error t value Pr(>|t|)
(Intercept) 201.20837 21.47865 9.368 1.67e-14 ***
load -0.61446 0.07472 -8.223 2.95e-12 ***
SVL -0.89220 0.48896 -1.825 0.07178 .
sexM 21.21823 5.85660 3.623 0.00051 ***
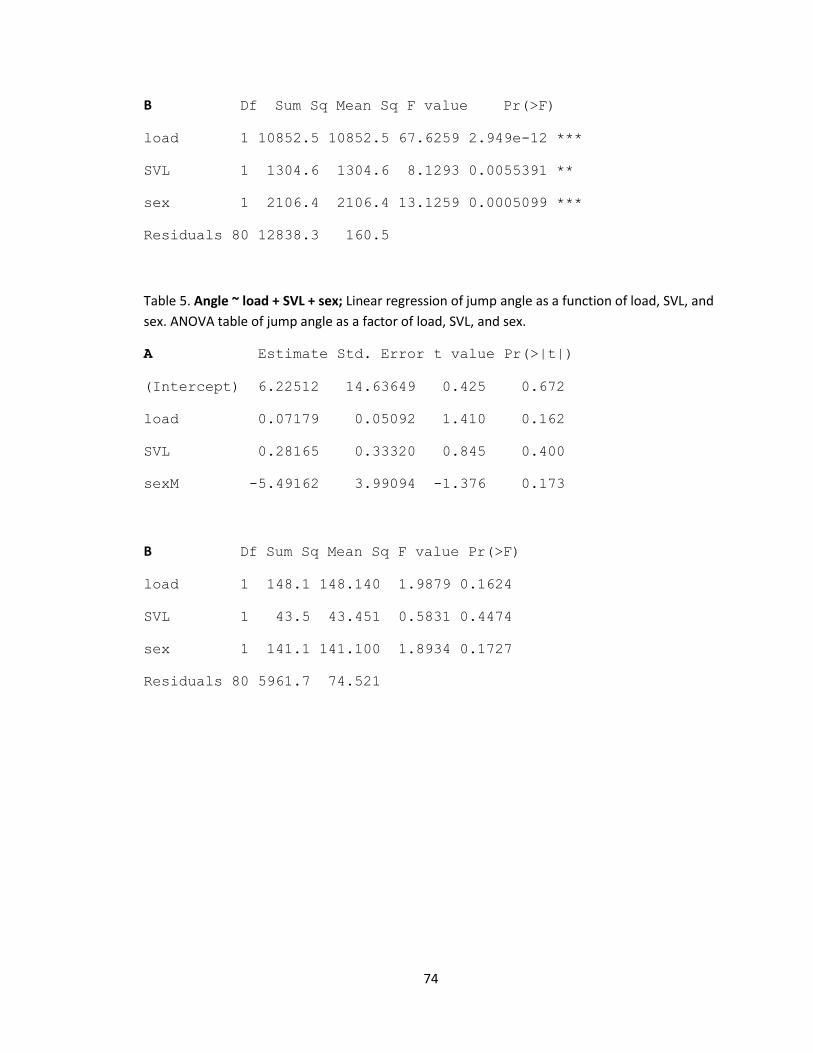
74
B Df Sum Sq Mean Sq F value Pr(>F)
load 1 10852.5 10852.5 67.6259 2.949e-12 ***
SVL 1 1304.6 1304.6 8.1293 0.0055391 **
sex 1 2106.4 2106.4 13.1259 0.0005099 ***
Residuals 80 12838.3 160.5
Table 5. Angle ~ load + SVL + sex; Linear regression of jump angle as a function of load, SVL, and
sex. ANOVA table of jump angle as a factor of load, SVL, and sex.
A Estimate Std. Error t value Pr(>|t|)
(Intercept) 6.22512 14.63649 0.425 0.672
load 0.07179 0.05092 1.410 0.162
SVL 0.28165 0.33320 0.845 0.400
sexM -5.49162 3.99094 -1.376 0.173
B Df Sum Sq Mean Sq F value Pr(>F)
load 1 148.1 148.140 1.9879 0.1624
SVL 1 43.5 43.451 0.5831 0.4474
sex 1 141.1 141.100 1.8934 0.1727
Residuals 80 5961.7 74.521
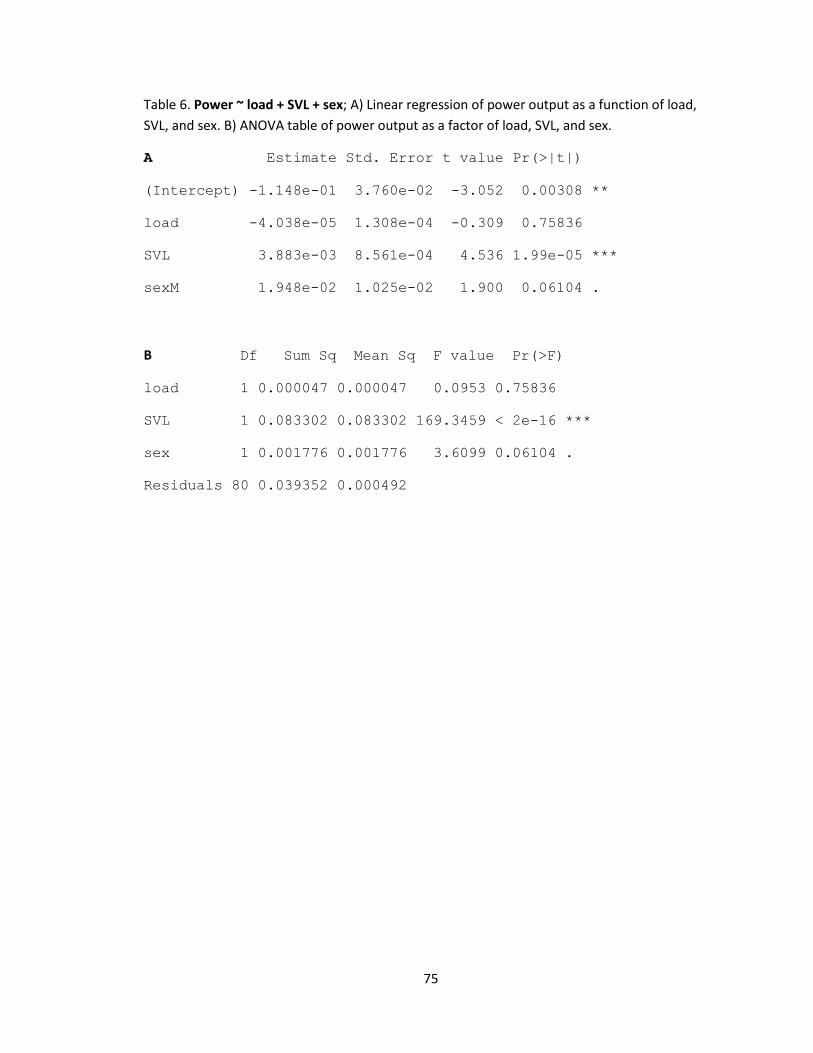
75
Table 6. Power ~ load + SVL + sex; A) Linear regression of power output as a function of load,
SVL, and sex. B) ANOVA table of power output as a factor of load, SVL, and sex.
A Estimate Std. Error t value Pr(>|t|)
(Intercept) -1.148e-01 3.760e-02 -3.052 0.00308 **
load -4.038e-05 1.308e-04 -0.309 0.75836
SVL 3.883e-03 8.561e-04 4.536 1.99e-05 ***
sexM 1.948e-02 1.025e-02 1.900 0.06104 .
B Df Sum Sq Mean Sq F value Pr(>F)
load 1 0.000047 0.000047 0.0953 0.75836
SVL 1 0.083302 0.083302 169.3459 < 2e-16 ***
sex 1 0.001776 0.001776 3.6099 0.06104 .
Residuals 80 0.039352 0.000492

76
Table 7. Descriptive statistics. Means ± standard error for all variables under the four loading treatments, as well as body mass, SVL, and hind limb length. Sample size for all variables was 9 M, 12 F.
Jump Distance (cm/s) Unloaded 20% 35% 50%
Males 52.42±2.4 47.01±1.5 47.10±0.7 43.07±1.3
Females 50.00±0.8 46.63±1.1 45.47±0.7 42.71±0.8
Take-off Velocity (cm/s)
Males 176±4.8 160±3.7 153±2.4 142±4.5
Females 159±3.2 152±4.5 143±2.2 130±5.9
Jump Angle (°)
Males 16±2.8 14±2.7 23±3.5 18±3.8
Females 19±2.3 17±1.9 21±2.2 21±2.3
Power (J/s)
Males 0.11±0.001 0.11±0.001 0.12±0.001 0.10±0.001
Females 0.05±0.005 0.06±0.003 0.06±0.004 0.05±0.004
Mean Body Mass (g)
Males 4.32±0.29
Females 1.97±0.12
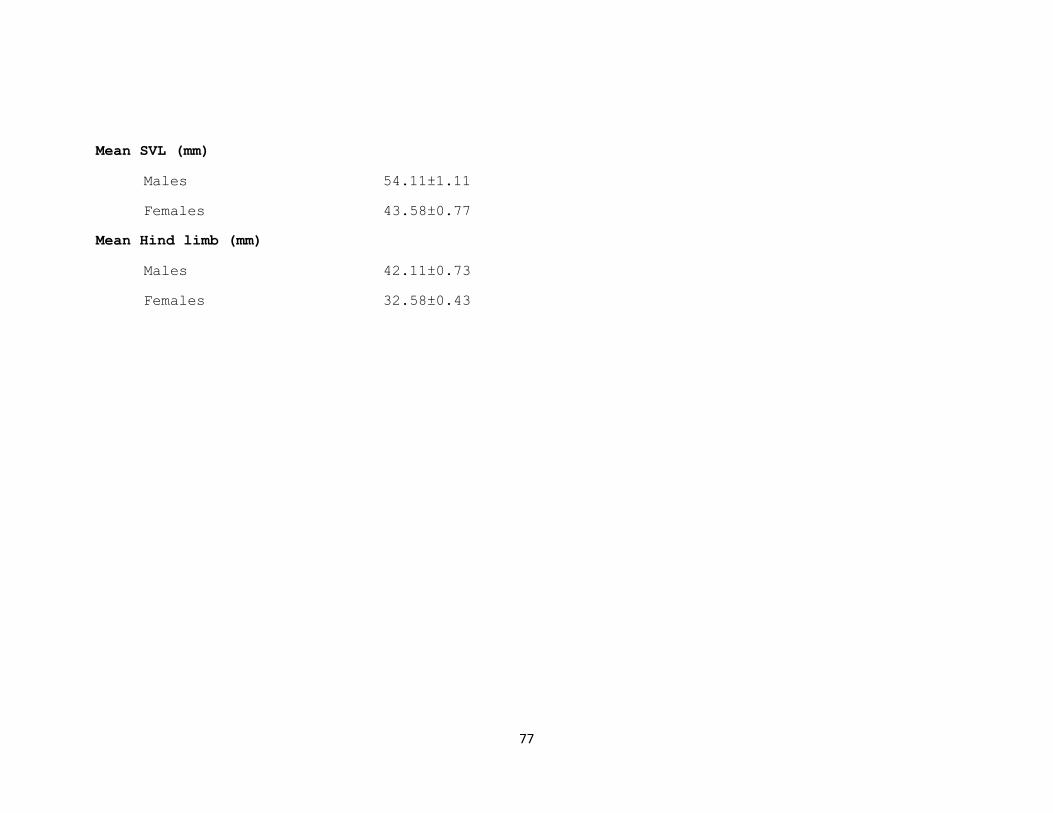
77
Mean SVL (mm)
Males 54.11±1.11
Females 43.58±0.77
Mean Hind limb (mm)
Males 42.11±0.73
Females 32.58±0.43

78
Figure 1. Linear regression of jump distance as a function of load. Both sexes decrease in jump length across treatments (male and female slope=-0.15, r2=0.33, p<0.001), but no significant difference is seen between sexes (ANOVA, sex effect: p=0.18). Points at each load are average jump distances ± standard error. For more model parameters, see Table 1.
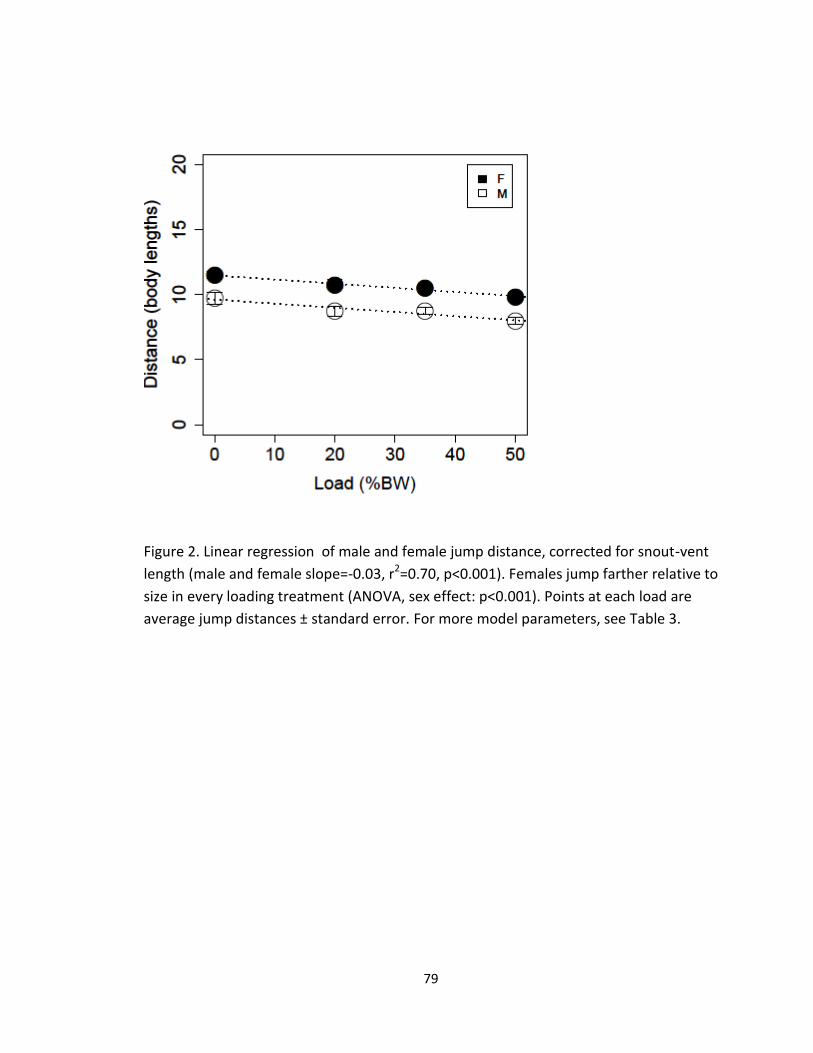
79
Figure 2. Linear regression of male and female jump distance, corrected for snout-vent
length (male and female slope=-0.03, r2=0.70, p<0.001). Females jump farther relative to
size in every loading treatment (ANOVA, sex effect: p<0.001). Points at each load are
average jump distances ± standard error. For more model parameters, see Table 3.

80
Figure 3. Linear regression of male and female take-off velocity (male and female
slope=-0.61, r2=0.51, p<0.001). Males have higher take-off velocity in every treatment
(ANOVA, sex effect: p<0.001). Points at each load are average take-off velocity ±
standard error. For more model parameters, see Table 4.

81
Figure 4. Linear regression of male and female take-off angle (male and female
slope=0.07, r2=0.02, p=0.16). Points at each load are average angles ± standard error.
For more model parameters, see Table 5.
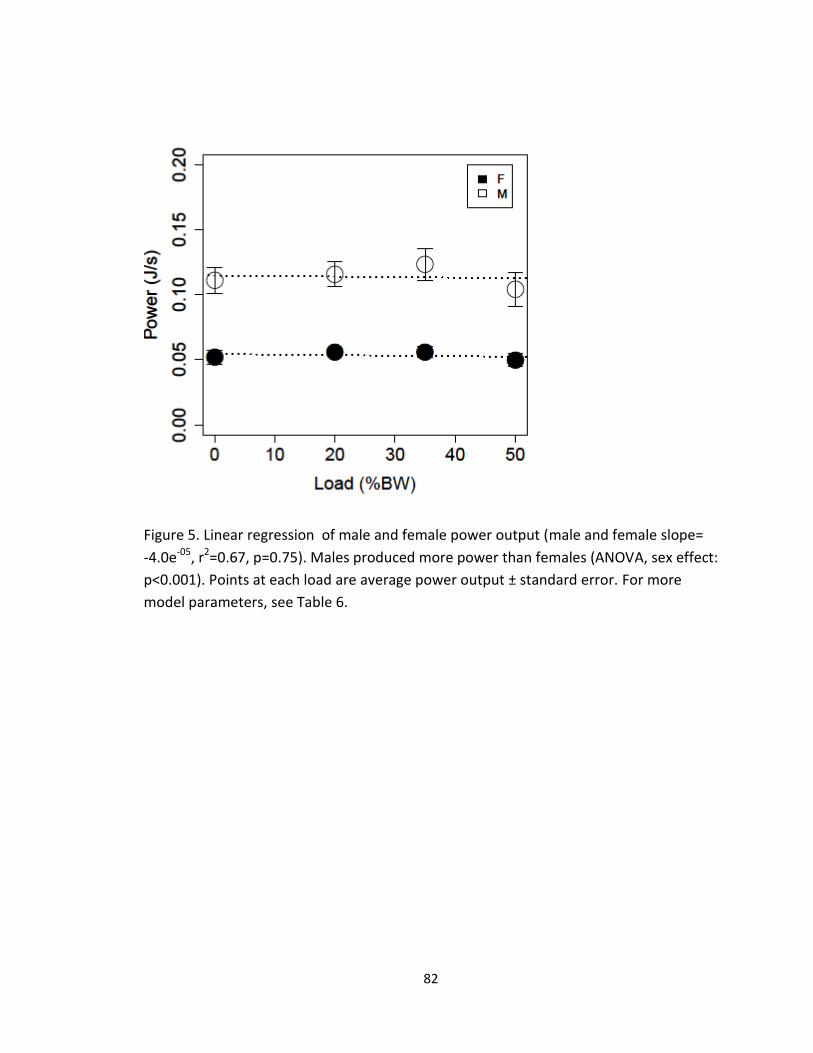
82
Figure 5. Linear regression of male and female power output (male and female slope=
-4.0e-05, r2=0.67, p=0.75). Males produced more power than females (ANOVA, sex effect:
p<0.001). Points at each load are average power output ± standard error. For more
model parameters, see Table 6.

83
Figure 6. Regressions of maximum jump distance as a function of maximum run velocity. Females are represented by the solid circle, males are open circles. There is no significant relationship found in any treatment. Unloaded: r2=-0.19, p=0.92; 20% BW: r2=-0.15, p=0.77; 35% BW: r2=-0.14, p=0.92; 50% BW: r2=-0.21, p=0.75.