Embed Size (px)
Citation preview

NOMINATION CONTESTS AS INDICATORS OF GENERAL ELECTION STRENGTH
A Thesis submitted to the Faculty of the
Graduate School of Arts and Sciences of Georgetown University
in partial fulfillment of the requirements for the degree of
Master of Public Policy
By
Jedediah Daniel Ober, B.A.
Washington, D.C. April 3, 2009

ii
This work would not have been possible without the assistance of
Harold Ickes, Deborah Nolan,
and, of course, David Newman.

iii
NOMINATION CONTESTS AS INDICATORS OF GENERAL ELECTION STRENGTH
Jedediah D. Ober, B.A.
Thesis Advisor: David Newman, S.J. PhD
ABSTRACT
The 2008 Democratic nominating campaign will be remembered as the longest
and closest in the history of the Democratic Party. Throughout the campaign the party’s
nominating rules were debated by the campaigns, members of the media, and over dinner
tables across the country. Never before had the inner workings of an American political
party’s selection process been under such scrutiny for so long. As the nomination
campaign continued unremittingly, the debate began to focus on which candidate would
in fact be more electable in the November general election. While each candidate chose a
different set of metrics to gauge their potential general election strength, both focused on
one widely available source, the results of state Democratic nominating contests. At the
time, many argued there was simply no connection between a candidate’s performance in
a nominating contest and their potential general election strength, and at the time, it was
impossible to measure given the general election had not taken place. Now, a closer
examination is possible. This study employs ordinary least squares multiple regression
analysis to model the relationship between a candidate’s performance in a nominating
contest and their subsequent performance in the general election.
iv
TABLE OF CONTENTS
Introduction..........................................................................................................................1
Literature Review.................................................................................................................3
Conceptual Framework and Hypothesis..............................................................................7
Data....................................................................................................................................10
Analysis Plan.....................................................................................................................12
Descriptive and Bivariate Analysis....................................................................................15
Results of Multivariate Analysis........................................................................................21
Multivariate Analysis Introducing Nominating Mechanisms............................................26
Implications and Recommendations..................................................................................32
References..........................................................................................................................36

1
INTRODUCTION
The Democratic Party’s 2008 presidential nominating process will be
remembered as the longest and closest in the party’s history. From its beginning until its
end, two high profile candidates competed for the party’s nomination.
Throughout the process, the party’s nominating rules were debated by the
campaigns, members of the media, and over dinner tables across the country. Never
before had the inner workings of an American political party’s selection process been
under such scrutiny for so long. As the country tried to decipher the arithmetic underlying
the Democratic Party’s rules, the campaigns of both Barack Obama and Hillary Clinton
spiritedly lobbied the now famous Super Delegates. As neither candidate would reach the
requisite minimum of pledged delegates to secure the nomination, the remarkable
responsibility of choosing the party’s nominee fell to this group of unpledged party
leaders and elected officials. Of course, the Super Delegates eventually chose to confirm
Barack Obama’s narrow margin in the pledged delegate race, thus paving his way to
become the Democratic nominee and ultimately the country’s next president.
As the nomination campaign continued unremittingly, the debate began to focus
on which candidate would in fact be more electable in the November general election.
While each candidate chose a different set of specific metrics to gauge their potential
strength in November, both focused on one widely available source, the results of state
Democratic nominating contests. Secretary Clinton’s campaign claimed her appeal was
stronger in the swing states, such as Nevada, Ohio, Pennsylvania, Michigan and Florida
and that her support amongst critical general election constituencies, such as Hispanics

2
and blue collar workers would propel her to victory in November. The Obama campaign
claimed greater support amongst independents and that their candidate had an ability to
appeal in states which traditionally favored the Republican candidate such as North
Carolina and Virginia. At the time, many argued there was simply no connection between
a candidate’s performance in a nominating contest and their potential general election
strength, and at the time, it was impossible to measure as the general election had not yet
occurred.
With the results of the 2008 general election now known we can use this data to
conduct a more thorough quantitative analysis of the claims made by both campaigns that
primary performance can be used as an indicator of general election strength. This
research seeks to answer the question, what can we infer from a candidate's nomination
campaign performance about their potential strength in the general election? This
analysis could prove useful not only in settling a campaign long dispute but also in efforts
which are currently taking place to rewrite the party’s delegate selection rules. If a
nominating campaign can serve as an indicator of general election strength this would be
valuable information when crafting new delegate allocation methods for the future of the
Democratic nominating process. Using 2008 state level data, this research aims to
uncover any statistical relationships between a candidate’s performance in a party
nominating contest and their subsequent performance in a general election.

3
LITERATURE REVIEW
While previous research has not focused specifically on identifying direct
correlations between primary performance and general election outcomes, many scholars
have explored the relationship. Two specific fields of research are of particular interest to
this study. First, research which investigates the potential for shared characteristics
between primary and general election electorates is valuable. Second, research which
employs general election outcome models provides guidance in terms of model
specification.
PRIMARY ELECTORATES VS. GENERAL ELECTORATES
A long scholarly debate exists as to whether or not primary electorates are
ideologically similar or dissimilar from their general election counterparts. In attempting
to decipher this relationship, Ranney and Epstein (1968) show how the ideologies of
primary electorates do not differ significantly from their general election partisan
counterparts. They reach their conclusion by comparing party specific primary voters to
non-primary voting partisans, assuming these individuals are representative of the greater
party rank and file. Dinitto and Smithers (1972) confirm their finding. Norrander (1998)
makes a critical correction to this analysis when she compares the partisan primary
electorate to the general election partisan electorate which did not participate in the
nominating campaign. She finds a statistically significant similarity between these two
groups.
In applying this research to the 2008 Democratic nominating campaign, we could
confirm that at least within partisan groupings, support amongst primary electorates can
4
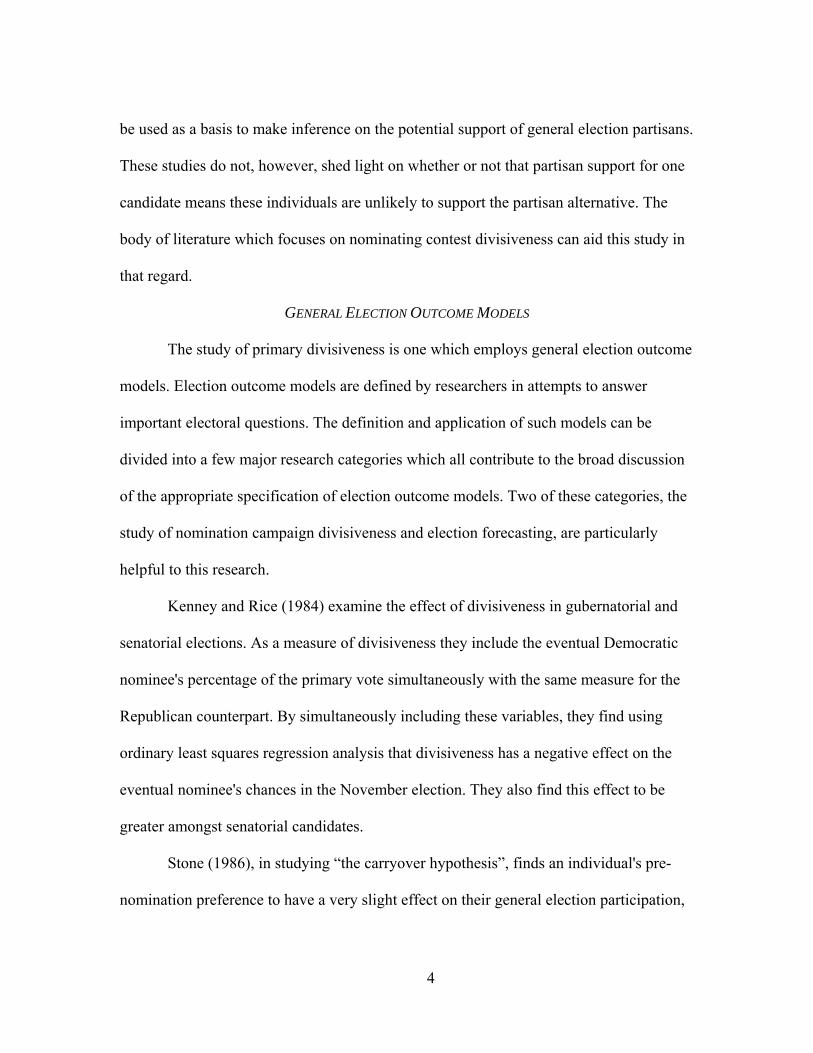
be used as a basis to make inference on the potential support of general election partisans.
These studies do not, however, shed light on whether or not that partisan support for one
candidate means these individuals are unlikely to support the partisan alternative. The
body of literature which focuses on nominating contest divisiveness can aid this study in
that regard.
GENERAL ELECTION OUTCOME MODELS
The study of primary divisiveness is one which employs general election outcome
models. Election outcome models are defined by researchers in attempts to answer
important electoral questions. The definition and application of such models can be
divided into a few major research categories which all contribute to the broad discussion
of the appropriate specification of election outcome models. Two of these categories, the
study of nomination campaign divisiveness and election forecasting, are particularly
helpful to this research.
Kenney and Rice (1984) examine the effect of divisiveness in gubernatorial and
senatorial elections. As a measure of divisiveness they include the eventual Democratic
nominee's percentage of the primary vote simultaneously with the same measure for the
Republican counterpart. By simultaneously including these variables, they find using
ordinary least squares regression analysis that divisiveness has a negative effect on the
eventual nominee's chances in the November election. They also find this effect to be
greater amongst senatorial candidates.
Stone (1986), in studying “the carryover hypothesis”, finds an individual's pre-
nomination preference to have a very slight effect on their general election participation,

5
but finds that for partisan activists a bitter primary campaign may dissuade them from
political activism in the general election. Stone uses a series of dichotomous dependent
variable regression models to gauge both general election participation and activism with
an individual level sample of 1980 Iowa party activists as well as National Election Study
surveys. Stone's study shows how nomination activity can in fact effect general election
activity.
In their 1987 study, Kenney and Rice correct their previous measure of
divisiveness by abandoning their simultaneous measure in favor of a relative measure
calculated as the difference between the Democratic nominee's share of the statewide
vote and that of his Republican counterpart. They employ ordinary least squares
regression with control variables for states’ previous voting patterns, the percentage of
total minor party vote, an incumbency control as well as a variable to account for the
unique politics of the south. Their corrected measure of divisiveness also shows
prenomination preferences significantly affecting general election candidate choice,
particularly when one party holds a divisive primary while the other enjoys a relatively
non-competitive nominating campaign. This aggregate analysis, which has been
confirmed by other scholars (Lengle 1980), builds off of Stone's findings at the individual
level.
Kenney and Rice (1988) use a dynamic simultaneous model of vote choice to
show that prenomination preferences affect general election vote choice. Unlike previous
studies with similar models, they include as an independent variable a prenomination

6
preference. Through path analysis they show the significant effect this prenomination
term has on eventual general election candidate selection.
Atkeson (1998) questions previous general election outcome models on the basis
that they do not control for election year context. Any changes in divisiveness over time,
she explains, should be attributable to the context of an election year. She argues
candidate quality, which had been measured in statewide races (Kenney and Rice 1984),
is critical to the outcome. For this reason, she argues the general election should be
viewed in a national context, and thus changes the unit of analysis to year. This change
allows her model to include controls for presidential approval as well as the change in the
unemployment rate. To gauge divisiveness she subtracts the out party’s nominee
nomination vote share from the incumbent party’s nominee vote share. She also employs
dummy variables to control for election year context. Her ordinary least squares
regression, controlling for candidate quality, finds divisiveness is not significantly
different than zero and that the state of the economy and favorability of the incumbent
party are more important than divisiveness.
GENERAL ELECTION FORECASTING
General election forecasting is generally not relevant to this research as most
forecasts use the results of individual state level polling to hypothesize the outcome,
however, some of these models can provide guidance on particular control variables of
interest to this study. For example, Norpoth (2008) expresses a candidate's primary
support as the percentage of the vote garnered by the eventual nominee relative to his
chief competitor in his ordinary least squares general election outcome model. His

7
rationale for this correction is in its ability to eliminate any effect which a crowded
primary field may have on the nominee's support throughout the nominating campaign.
He also includes a dummy variable which corrects for incumbency. This enables his
model to adapt to situations in which an incumbent faces little to no realistic opposition
in his party's nominating contest. Both of Norpoth's corrections will help guide this study.
While previous studies do not identify specific relationships between a candidate's
performance in a nomination contest and their subsequent performance in the general
election, they provide a useful framework for which such an analysis can be conducted.
As most studies have focused on individual preferences and not candidate performance,
such an analysis could fill a void not only in the contemporary political debate but also
within literature which aims to reveal connections between nominating campaigns and
general election contests.
CONCEPTUAL FRAMEWORK AND HYPOTHESIS
This study seeks to explain the relationship between a candidate's performance
throughout a primary campaign and their subsequent performance in the general election.
Specifically, it aims to show that a strong performance in a state level nominating contest
could serve as an indicator of that candidate's potential in the statewide general election
contest. To conduct such an analysis we must consider a host of factors. These factors
can be divided into traditional general election outcome controls as well as a group of
potential indicators from the nominating campaign. The following equation outlines some
broad potential measures of state level general election support:

8
Democratic Nominee General Support = β0 + β1Strength of Economy + β2State
Level Partisanship + β3Presidential Approval + β4Democratic Primary Support +
β5Republican Primary Support +β6Type of Democratic Nominating Mechanism
+ β7Divisiveness
While one could consider including a direct poll of the potential state electorate, this
study will not employ the use of pre-election polling data as its focus is not to predict the
winner of the election, but to gauge the effect of certain factors on candidate general
election strength.
A nominee's support in a state level general election will depend on a number of
economic and political factors, some of which can potentially be measured by the
candidate's support in a state level party nominating contest. Of primary consequence to a
general election candidate is the strength of the economy and whether or not that
candidate is a member of the incumbent president's party or of the opposition (Fair 1978,
Atkeson 1998, Bartels 1987). In a struggling economy the out-party candidate can expect
a greater level of support than he would otherwise, and likewise, the incumbent party
candidate can expect to be framed as a symbol of current economic hardships.
An important political factor to consider is the current partisan makeup of the
state's electorate. In an electoral system which is dominated by two parties, the partisan
leanings of the state’s electorate could provide a simple but powerful lens to view
potential candidate support. While there are certainly examples of statewide elections
bucking the state’s partisan trend, such as the Republican governor of the staunchly

9
Democratic state of California as well as the former longstanding Republican control of
the Massachusetts governor's office, generally, we can expect a state to follow a partisan
trend over time.
States in which the electorate displays high levels of disdain or approval for the
incumbent president can be expected to display similar preferences for the major party
general election candidates (Finkel 1993). A state which views the president and his
policies favorably, can be expected to support the candidacy of the president's partisan
peer. In contrast, those states which express high levels of disapproval of the president's
agenda may be more likely to support the out party candidate.
The support of a candidate in state level nominating campaigns may provide
indications of how this candidate will fair in the state's general election contest. If a
candidate is able to effectively build a strong coalition of primary voters, this may
forecast their ability to bring critical constituencies into a potential general election
coalition. This study intends to show how a candidate's support in a state level
nominating contest can provide evidence of their potential support in the state level
general election contest, and specifically hypothesizes that variables which gauge a
candidate's support in a nominating campaign will have a positive relationship with that
candidates statewide support in the November election.
This study will also focus on the potential for the Democratic Party's differing
nominating mechanisms to affect this relationship. A particular style of nominating
mechanism may accentuate this relationship or perhaps even negate it. Given this
framework, this research will attempt to draw conclusions on whether certain styles of
10
nominating mechanisms are better suited to act as potential measures of a candidate's
general election strength. Specifically, this study hypothesizes that open primary systems
will most accurately predict a candidate's strength in a general election campaign. Open
primary systems are more inclusive, so have the potential to create a sample via a
nominating contest which is more representative of a potential general election electorate.
This research will provide Democratic Party leaders with important insight into their
nomination process and allow them to consider changes to party rules which will best
equip them to nominate candidates with broad general election appeal.
DATA
This research uses a data set compiled by the author which includes state level
results of the 2008 general election and nomination contests as well as a variety of state
level political and economic factors. It encompasses all fifty states and the District of
Columbia. Its sources are many, and where applicable they are cited.
It is important to re-emphasize that this data set includes only 2008 data and to
explain why the decision to limit this study's scope to the 2008 election season was made.
The 2008 presidential electoral cycle was like no other in that on the Democratic side two
high profile candidates traded wins and losses from the early January contests in Iowa
and New Hampshire, which Barack Obama and Hillary Clinton split, until the final June
contests in Montana and South Dakota, which they also split. Never before had a
nominating contest provided such a full sample of state level data for researchers. Not

11
only was the contest competitive from the beginning until the end, it also shattered
previous voter turnout marks. In light of these facts, the results of the 2008 Democratic
nominating campaign make for a unique and potentially powerful state level analysis.
Data for the results of the general election and nominating contests was collected
from a variety of electronic resources. Vote totals and percentages were collected as
reported by Real Clear Politics and MSNBC and then confirmed on secretary of state
websites where conflicts existed. Democratic nominating contest types were tallied from
The Green Papers, who report the state contest’s voter eligibility interpreted from state
party delegate selection plans. Total state registration with partisan breakdowns was
gathered from voter registration statistics reported by state boards of elections. State level
economic indicators were collected as reported by the Bureau of Labor Statistics.
Partisanship measures were gathered from the National Conference on State Legislatures.
All data is collected at the state level for all fifty states plus the District of Columbia.
While this data set provides an intriguing sample, given the nature of the 2008
Democratic nominating contest, it admittedly suffers from inadequacies. Most critical is
the limited number of observations this cross sectional state level data set provides, which
may detract from the power of this study’s results. Another problem is timing. While we
are trying to conduct an analysis on an event which has recently transpired, some state
level data is unavailable for November of 2008. Certainly any census variables which
may have otherwise been useful will not be available, however, would most likely not
affect the results.

12
ANALYSIS PLAN
This research focuses on how nomination contest performance can provide
indications of a candidate's general election strength. The initial analysis will focus on a
fifty one observation state level sample of election results, political and economic factors.
It will then expand to include controls for Democratic nominating mechanisms.
This research will employ ordinary least squares regression analysis to create a
series of general election outcome models which will examine the aforementioned
relationship. It is expected that this relationship will be linear and positive throughout.
The first two stages of this analysis use a general election outcome model which will
include as the dependent variable the percentage of the vote garnered by the Democratic
nominee in the state general election contest.
The key explanatory variable in this initial model is the percentage of the vote
garnered by the eventual Democratic nominee in the state level nominating contest. This
variable will act as a measure of nominating contest support. This percentage will be
corrected, however, using previous researcher's methods. This study will employ the
same correction method used by Norpoth (2008) and re-calculate the nominee's support
relative to that of his chief competitor. Specifically, the nominee’s support was divided
by the sum of his support and that of his chief competitor. This corrected percentage is
also included for the Republican nominee.
It's important to point out some deficiencies in the available data. First of all, on
the Democratic side, the eventual nominee did not appear on the ballot in the state of

13
Michigan. Instead of accepting this as fact and thus removing this state from the analysis,
this study follows the lead of the Democratic Party's Rules and Bylaws committee in
using as the percentage of the vote for Barack Obama the proportion of votes cast for
“uncommitted”. Also of concern were some anachronistic methods of delegate allocation
on the Republican side. In Wyoming, no vote totals were ever reported as a result of the
Republican closed caucus. In place of Wyoming percentages the study uses percentages
based on the state's final national convention delegate breakdown. The Hawaiian
Republican caucuses presented no clear solutions for inferring statewide nominating
contest support. Hawaiian Republicans do not express presidential preferences at the
county level only support for state level delegates who elect national convention
delegates. No results of any sort were reported besides that the party had allocated all of
its delegates to Senator John McCain. As a result, Hawaii was dropped from the analysis.
As an additional measure of nominating contest support, the model includes a pair
of dummy variables representing whether or not the Democratic nominee, as well as the
Republican nominee, emerged victorious from the state's nominating contest. This
variable provides the ability to gauge a potential carryover effect of simply winning a
state's nomination campaign.
As previous research suggests (Fair 1978, Atkeson 1998), this model also
includes an appropriate measure of state level economic conditions. In order to gauge
economic conditions at the appropriate time, state level unemployment as reported in
October of 2008 by the Bureau of Labor Statistics is included. We can expect increases in
14
statewide unemployment to positively affect our dependent variable, given that, the
Democrat, Barack Obama, was the out-party nominee in 2008.
Also included is a measure of state level partisanship. While an obvious choice to
gauge partisanship would be raw partisan voter registration numbers, this was not
possible for a number of reasons. First, many states don't require partisan voter
registration. Second, when states do require partisan registration some do not publicly
report the partisan breakdown, only the total number of registrants. Lastly, North Dakota
does not require registration at all. Given the small size of this study's sample, it was
decided not to use registration numbers and instead include the most recent partisan
breakdown of the state's legislature. This variable is reported as the Democratic
percentage of the total state legislature including both the state house and state senate or
their state level equivalents. The values reflect the current makeup of state legislatures as
reported by the National Conference on State Legislatures.
Consistent with previous aggregate general election models, this study
incorporates a measure of divisiveness. This measure is calculated as the difference
between the eventual Republican nominee’s percentage of the nominating contest vote
and the eventual Democratic nominee’s percentage in the same state level nominating
contest (Kenney and Rice 1987, Atkeson 1998).
There is theoretical potential for specific styles of nominating mechanisms to
serve more effectively as predictors of a candidate's potential general election strength.
It's conceivable that open mechanisms, which allow for cross party voting, may provide a
more representative sample of the state's November electorate. On the other hand, closed

15
mechanisms, which prohibit the participation of voters registered with another party, may
not accurately represent the November electorate. This study examines the potential for
unique effects of varying styles of nominating contests. To achieve this, a series of
dummy variables were constructed to capture whether a state employs an open primary
system, a closed primary system, an open caucus system, a closed caucus system, or
modified primary or caucus systems. Finally, the nominating mechanism dummy
variables are interacted with the corrected percentage of the Democratic nominee's
nominating contest support (Norpoth 2008). These variables are designed to gauge the
combined effect of the style of nominating contest and the nominee's support in that
contest on the eventual general election performance of the nominee, to assess whether
particular styles of nominating systems have unique abilities to project potential general
election support.
DESCRIPTIVE AND BIVARIATE ANALYSIS
Table 1 presents basic descriptive statistics for our dependent variable as well as
our independent variables of interest. President Barack Obama secured a mean of 51.4
percent in general election contests as opposed to Senator John McCain’s mean of 47.0,
both with a standard deviation of 11 percent. Barack Obama won 29 states in the general
election as opposed to the 22 states which awarded their electoral votes to John McCain.
The highest percentage he received was 92.4 percent, in the heavily Democratic District
of Columbia. John McCain’s maximum was 66.7 percent, in the Republican stronghold
of Oklahoma.

16
TABLE 1: DESCRIPTIVE STATISTICS - DEPENDENT VARIABLE AND CONTINUOUS INDEPENDENT VARIABLES
Obs. Mean Std. Dev. Min. Max.
Democratic Vote in General 51 51.4 11 32.7 92.4
Republican Vote in General 51 47.0 11 6.5 65.6
Democratic Nominee Primary Vote 51 54.9 12.9 27.2 82.2
Republican Nominee Primary Vote 50 56.7 21.1 5.6 88.6
Unemployment 51 5.8 1.4 3.3 9.3
Democratic Percentage of State Legislature
51 55.4 15.9 23.8 90.2
Source: Real Clear Politics, National Conference of State Legislatures, Bureau of Labor Statistics Notes: The term “primary” is used to generalize for all styles of nominating contests. Primary support calculations based on corrected percentages (Norpoth 2008)
In the nominating contests, Barack Obama received mean state level support of
54.9 with a standard deviation of 12.9 percentage points. John McCain received 56.7
percent of the vote with a standard deviation of 21.1. The differences in standard
deviation may be attributable to the competitiveness of the Democratic contest in relation
to the Republican one. It is also noteworthy that John McCain’s minimum level of state
level support was 5.6 percent where Barack Obama’s was 27.2 percent. For McCain this
represents the primary contest in Utah, for Obama, Arkansas. In contrast to his primary

17
performance, John McCain eventually won Utah in the general election. Consistent with
his primary result, Barack Obama lost Arkansas in the general election.
Other variables included in this analysis are state level unemployment as well as
the partisan makeup of the state’s legislature. The mean unemployment rate across states
was 5.8 percent with a standard deviation of 1.4. The lowest unemployment rate was 3.3
percent in both South Dakota and Wyoming. The highest unemployment rate was 9.3
percent in Michigan. These results are consistent with previous research in that the out-
party, the Democrats, won the state which suffered the highest unemployment rate,
Michigan, and the in-party won the states with the lowest (Fair 1978, Bartels 1987,
Atkeson 1998).
The mean percentage of Democratic representation in state legislatures is 55.4
percent with a standard deviation of 15.9 percent. The most Democratic state legislature
is Rhode Island, a state carried by Barack Obama. The least Democratic state legislature
is Idaho, a state carried by John McCain.
Table 2 displays a comparison between the Democratic nominee's performance in
the nominating contests and the general election. In sixteen states, Barack Obama won
the nominating contest and the general election. In fourteen states he won the nominating
contest but lost the general election. The majority of his general election victories came
in states in which he won in the nominating campaign. However, this pattern does not
hold for the states in which he lost the nominating contest. He won thirteen states in the
general election that he lost in the nominating contest, as opposed to eight states in which

18
he lost both contests. A chi square test of significance on this frequency distribution
shows no statistical significance (chi2=.37, p=.54).
TABLE 2: DEMOCRATIC FREQUENCY DISTRIBUTION – PRIMARY VS. GENERAL WINS
Won General Lost General
Won Primary 16 14
Lost Primary 13 8
Source: Real Clear Politics, MSNBC Notes: Chi2=.37, p=.54
Table 3 examines the same relationships for the Republican nominee. Senator
McCain won ten states in the general election which he also won in the nominating
contest as opposed to twenty two states he lost in November which he had won in the
nominating contest. Consistent with these results, were the trends in his losses between
states. He won twelve states in the general election which he had lost in the nominating
campaign and lost seven states in the general which he had also lost in the nominating
campaign. The chi square test of significance on this distribution does however show
statistical significance (chi2=4.94, p=.02).
TABLE 3: REPUBLICAN FREQUENCY DISTRIBUTION – PRIMARY VS. GENERAL WINS
Won General Lost General
Won Primary 10 22
Lost Primary 12 7
Source: Real Clear Politics, MSNBC Notes: Chi2=4.94, p=.02

19
Table 4 examines the relationship between this study’s dependent variable, the
percentage of the Democratic nominee’s vote in the general election, and the independent
variables. The results of this bivariate analysis are inconsistent with the stated hypothesis
that primary performance can indicate potential general election strength. The pairwise
correlation coefficients are insignificant for the percentage of the vote garnered in state
level nominating contests for both the Democratic nominee and the Republican nominee.
This trend holds for whether the Democratic nominee won the primary contest. A
surprising result of this bivariate analysis is the positive coefficient on the dummy
variable measuring whether the Republican nominee won the nominating contest. This
statistically significant positive measure of association is counter intuitive.
As per the results of the pairwise correlation, divisiveness also does not appear to
have a statistically significant effect on the eventual Democratic nominee’s share of the
general election vote. While the negative coefficient is expected, the significance level of
.23 does not support a statistically significant conclusion. The correlation coefficients
which control for economic conditions and statewide partisanship both show the expected
positive relationships. Both of these coefficients are statistically significant at traditional
levels.

20
To examine the effect of particular styles of nominating mechanisms, mechanism
dummy variables were interacted with the Democratic nominee’s vote share in the
nominating contest. Table 5 reports the results of pairwise correlations between these
interaction terms and the Democratic percentage of the vote in the general election
contest. The table also reports the correlations of the Democratic percentage of the vote
in the general election and a dichotomous measure gauging whether the state employed a
caucus system or a primary system. The results of this bivariate analysis show the
majority of these nominating mechanisms to have statistically insignificant effects on
TABLE 4: PAIRWISE CORRELATIONS DEMOCRATIC PERCENTAGE OF GENERAL VOTE VS. INDEPENDENT VARIABLES
Coefficient Significance
Democratic Nominee Primary Vote .11 .41
Republican Nominee Primary Vote .24 .08
Democratic Nominee Won Primary .02 .86
Republican Nominee Won Primary .37* .00
Divisiveness -.17 .237
Unemployment .30* .03
Democratic Percentage of State Legislature .70 .00
Source: Real Clear Politics, National Conference of State Legislatures, Bureau of Labor Statistics Notes: It should be noted that the “Norpoth correction” did improve the level of statistical significance but not to relevant levels.

21
general election performance when interacted with state level primary support. A notable
exception to this is the positive coefficient on the closed primary interaction. The
pairwise correlation in this instance returns a positive and statistically significant result.
While these bivariate results may shed some light on the effect of nominating
mechanisms their effect will be more accurately gauged as part of a multivariate
regression analysis.
TABLE 5: PAIRWISE CORRELATIONS DEMOCRATIC PERCENTAGE OF GENERAL VOTE VS.
NOMINATING MECHANISM INTERACTION
Coefficients Significance Primary 0.22 0.10 Caucus -0.13 0.33 Open Primary -0.08 0.54 Closed Primary 0.29 0.03 Modified Primary 0.04 0.73 Open Caucus -0.15 0.28 Closed Caucus -0.05 0.68 Modified Caucus 0 0.97 Source: Real Clear Politics, National Conference of State Legislatures, Bureau of Labor Statistics
MULTIVARIATE REGRESSION RESULTS
This section reports the results of this study's multivariate ordinary least squares
regression analysis, including the initial model, described in previous sections, as well as
a series of more sophisticated specifications which aim to reveal potential effects of state
level nominating mechanisms on the predictive nature of the state's nominating system.
To review, the initial model is defined as:

22
Democratic Nominee General Support = β0 + β1Democratic Primary Support
+ β2Republican Primary Support + β3Republican Nominee Won Primary +
β4Democratic Nominee Won Primary + β5Divisiveness + β6Unemployment +
β7Percentage of State Legislature Democratic
Table 6 reports the results of this regression analysis. Table 6 does not report a
coefficient for the variable which captures the Republican nominee's performance in the
state's nominating contest. The variable was dropped from the model, due to high
multicollinearity with the model's measure of divisiveness. The alternative to dropping
this variable would have been dropping the measure of divisiveness from the model. For
two reasons, it was decided that omitting the Republican nominee's percentage of the
vote from the model was the appropriate solution. The first reason stems from the depth
of research focused on the effect of divisiveness on general election outcomes. With so
much prior focus on the potential for divisive nominating contests affecting general
election outcomes, it seemed inappropriate to drop this measure from this analysis. The
second reason is due to the nature of this study. The focus of this study is the potential
predictive nature of Democratic nominating contests. Considering this study focuses on
potential Democratic general election performance, dropping the Republican nominee's
primary vote share does not seem detrimental to the theoretical foundations of the model.

23
TABLE 6: MULTIVARIATE RESULTS DEMOCRATIC PERCENTAGE OF GENERAL VOTE
β
Democratic Nominee's Primary Vote 0.46* (.15)
Democratic Nominee Won Primary -7.21* (3.6)
Republican Nominee Won Primary 9.12* (2.9)
Divisiveness 0.07 (.06)
Unemployment 0.33 (.71)
Percentage of Legislature Democratic 0.52* (.07)
R-squared .67
Joint Significance 0.00
Notes: Percentage of Republican nominee's primary vote dropped due to high multicollinearity with divisiveness. Standard Errors in parentheses. * indicates significance at 95% level or better.
The results reported in Table 6 reveal a few surprises. The model's measures of
divisiveness and unemployment are not statistically significant at the traditional level. For
divisiveness, this is not entirely inconsistent with previous scholars' findings (Atkeson
1998). The results do not provide a means to support a claim that the divisiveness of the
2008 nominating contest had adverse effects on President Obama's performance in the
November election. The fact that the model's economic measure, the state level October
unemployment rate, does not have a statistically significant effect on the Democratic

24
nominee's performance in November is surprising and contrary to previous research (Fair
1978). The overwhelming evidence supporting the argument that economic factors affect
the results of presidential elections warrants potential changes to the model which may
better capture economic realities at the state level. To account for this reality the measure
of unemployment was altered to reflect the over-the year change in state level
unemployment from 2007 to 2008 as reported by the Bureau of Labor Statistics. This is
calculated by subtracting the final measure of unemployment in 2008 from the final
measure of unemployment in 2007. The multivariate regression did not, however, return a
statistically significant coefficient for this measure.
Whether each party's nominee emerged victorious in their state level nominating
contest significantly affects the Democratic nominee's performance in November. The
direction of this effect, however, may be a bit of a quandary. If the Republican nominee
won his party's state nominating contest, the Democratic nominee can expect this to have
a positive effect on his performance in the state's November election. If the Democratic
nominee won his party's state nominating contest, he can expect this to have a negative
effect on his performance in November.
It’s critical to understand that these dummy variables have one time intercept
effects. The magnitude of the win or loss is not accounted for in these variables. While
the result may seem counter intuitive, if we consider the circumstances of our limited
2008 sample, the logic may be apparent. Throughout the 2008 Democratic nominating
campaign, President Obama fared well in states which would traditionally cast their votes
for the Republican candidate in November, such as Idaho, Kansas and Georgia. Secretary

25
Clinton competed well in more traditionally Democratic states, such as California,
Massachusetts and New York. As a result, many states which President Obama won in the
nominating contest were inevitably won by Senator McCain in November and many
states which he lost in the nominating contest he inevitably won in the general. In fact, as
Table 2 illustrates, in twenty-seven states, President Obama's results were not consistent
from the primary to the general election. On the Republican side, this effect may be
attributable to Senator McCain's relatively early emergence as his party's nominee. As
Table 3 illustrates, Senator McCain's results were consistent across the primary and
general elections in only seventeen states. So while the results may initially seem counter
intuitive, a deeper analysis of the 2008 case sheds light on the directions of these
coefficients.
State level partisanship also has a statistically significant effect on the Democratic
nominee's performance in the general election. For each percentage point of Democratic
representation in a state's legislature, the Democratic nominee can expect an additional
.52 percentage points in that state's November election. This result is far from surprising.
The more Democratic a state legislature, the more likely the Democratic nominee is to
fare well in the state's general election. These results are consistent with the model's
theoretical foundations.
The independent variable of interest, the Democratic nominee's percentage of vote
in the state's nominating contest displays a statistically significant effect on the nominee's
percentage of the vote in the state's November election. For every percentage point of
support garnered by the Democratic nominee in the state's nominating contest, the

26
nominee can expect .46 percentage points of support in the state's general election. This
finding supports those who argue that nominating contests can serve as potential
indicators of general election strength.
MULTIVARIATE REGRESSION RESULTS: INTRODUCING NOMINATING MECHANISMS
In order to capture the effects of varying styles of nominating mechanisms, a
series of OLS regressions were conducted which use as a foundation the model discussed
in the previous section. Table 7 and Table 8 report the results of these models.
Table 7 reports the results of two expansions to the initial OLS model. Model A
introduces a control variables to gauge the effect of primary style nominating
mechanisms as opposed to caucus systems. The model includes both a dummy variable
which gauges whether the state employs a primary system or not, as well as a variable
which interacts this dichotomous measure with our original independent variable of
interest, the Norpoth corrected Democratic nominee’s share of the nominating contest
vote. The results display a potential for inconsistency. Our dichotomous primary system
measure displays a statistically significant negative correlation with the nominee’s share
of the general election vote. The interaction term between this dichotomous measure and
the Democratic nominee’s percentage of the nominating contest vote also reports a
statistically significant result. The direction of the effect, however, is inconsistent with the
simple dummy variable. The results of this model indicate the potential for primary
mechanisms to have a negative intercept effect on a candidate’s general election strength,
but subsequently have a positive slope effect. The standardized intercept effect of -1.55 is

27
TABLE 7: DEMOCRATIC PERCENTAGE OF GENERAL VOTE MODEL A: PRIMARIES VS. CAUCUSES
MODEL B: OPEN VS. CLOSED
A B
Democratic Nominee's Primary Vote .06 (.22)
.57* (.17)
Democratic Nominee Won Primary -.44* (3.5)
-.33 (3.8)
Republican Nominee Won Primary .33* (2.9)
.41* (3.1)
Divisiveness .10 (.06)
.17 (.07)
Unemployment .02 (.68)
.04 (.75)
Percentage of Legislature Democratic .69* (.06)
.73* (.07)
Primary Mechanism -1.55* (15.2)
---
Primary Interaction 1.45* (.23)
---
Open System --- .14 (9.9)
Open Interaction --- -.16 (.17)
R-Squared .72 .67
Notes: Standardized coefficients presented. * indicates 95% significance.
countered by a 1.45 percentage point increase in a candidate’s general election share for
every positive standard deviation change.
Model B tests the potential effect of open systems, which allow for inter-party
voting, on the Democrat's relative vote share in the November election. Model B also
includes a simple dummy variable measuring whether the state employs an open
nominating system as well as an interaction term incorporating the open system dummy

28
variable and the corrected percentage of the Democratic nominee's vote in the nominating
contest. Unlike the independent effect of the primary mechanism tested in Model A, open
systems do not relate to the Democratic nominee's performance in the November contest
in any statistically significant fashion. The coefficients on the simple dummy variable
and interaction term are statistically insignificant.
Model C in Table 8 segments the state level nominating mechanisms further, by
dividing the states into six categories, one for each specific style of nominating
mechanism. These different systems are controlled for by including a system of dummy
variables . The system of dummy variables allows the model to capture any intercept
effect a particular mechanism may have on the Democratic nominee's performance in the
state's November election. Model C also includes a system of mechanism interactions
which attempt to capture the potential unique predictive ability of each nominating
mechanism. This system of interactions results from multiplying the Democratic
nominee's vote share in the state's nominating contest by the series of dummy variables
previously mentioned. The open primary system is used as the baseline for both the
system of basic dummy variables as well as the dummy interactions. As a result, the
interaction terms have the potential to measure any significant differences between the
predictive nature of a specific nominating mechanism as compared to the open primary
system. This specification follows those outlined by others who've employed similar
systems of dummy variable interactions (Aiken).

29
TABLE 8: DEMOCRATIC PERCENTAGE OF GENERAL VOTE MODEL C: VARYING MECHANISMS
MODEL D: CLOSED CAUCUSES C D
Democratic Nominee's Primary Vote .61* (.22)
.62* (.14)
Democratic Nominee Won Primary -.42* (3.9)
-.36* (3.5)
Republican Nominee Won Primary .39* (3.6)
.42* (2.9)
Divisiveness .16 (.08)
.20 (.06)
Unemployment .05 (.76)
.04 (.69)
Percentage of Legislature Democratic .69* (.09)
.72* (.06)
Open Caucus .71 (36.3)
---
Closed Caucus 1.15* (19.1)
1.2* (17.3)
Modified Caucus 6.1 (923)
---
Closed Primary -.40 (13.3)
---
Modified Primary -.49 (16.8)
---
Open Caucus Interaction -.73 (.52)
---
Closed Caucus Interaction -1.1* (.31)
-1.2* (.27)
Modified Caucus Interaction -6.2 (13.5)
---
Closed Primary Interaction .49 (.24)
---
Modified Primary Interaction .45 (.33)
---
R-Squared .75 .70 Notes: Standardized coefficients presented. * indicates significance at a 95% level.

30
The OLS regression run with this specification produces results which are
consistent with the original specification. For most nominating mechanisms, the model
does not reveal statistically significant effects. The one mechanism which does display
statistical significance, as Table 7 shows, is the closed caucus system. A joint test of
significance between the dummy interactions also reveals statistical significance
(F=2.64(.04)). The model returns statistically significant standardized coefficients on
both the simple closed caucus dummy variable as well as its respective interaction. In
order to interpret these results, we must consider the effects of the closed caucus system
against those of the open primary system, the model's baseline nominating mechanism.
The standardized coefficient on the simple dummy variable posits that if a state
employs a closed caucus system, the Democratic nominee can expect a 1.2 percentage
point increase in their November vote share compared to the yield he would expect if the
state employed an open primary system. As only the closed caucus system reports a
statistically significant coefficient, the final model reported in Table 7, Model D, removes
all nominating mechanisms except for the closed caucus. The results remain consistent.
The model displays differences in the directions between the coefficients of the
simple dummy variable and the interaction term. The same logic may help to understand
this phenomenon, however, as was previously advanced to explain what at first glance
looked to be counter intuitive directional results with the dummy variables which
controlled for whether the Democratic and Republican nominees were victorious in state
level nominating contests. It's very likely that the resulting intercept effect is a
phenomenon unique to the 2008 Democratic nominating campaign. Throughout the

31
contest, President Obama fared better in states which employed caucus systems than he
did in states which employed primary systems. Logic would stand that given this reality,
if a state were to employ a closed caucus system, this could have a positive level effect on
President Obama's chances in the November election. There exist at least two possible
explanations for the negative coefficient on the closed caucus interaction. First, this could
be indicative of President Obama's strong performance in closed caucus states whose
electoral votes were unlikely to go to a Democratic candidate in November. A second,
more general explanation of this coefficient, however, is that a closed caucus system
excludes participation at such an extreme that the mechanism serves as a poor indicator
of the potential general election electorate and thus provides a poor basis for predicting a
candidate’s performance in November. An examination of the particular states this study
defines as employing closed caucus mechanisms may help to further explain these
counter directional effects.
This study defines eight states as closed caucus states: Alaska, Colorado, Hawaii,
Iowa, Kansas, Maine, Nevada and Wyoming. As previously noted, Hawaii is not included
in any of this study's models, due to an anachronistic nominating system on the
Republican side. This leaves us with seven cases to examine. While this is admittedly a
very small sample to be considering, conducting the analysis is still beneficial. Table 9
shows President Obama's relative vote share in the state nominating contests as compared
with his relative vote share in the general election. In all but one of these states, President
Obama performed better in the nominating contest than he did in the general election. In
some cases the margin was quite large, which would seem to lend credence to the first
32
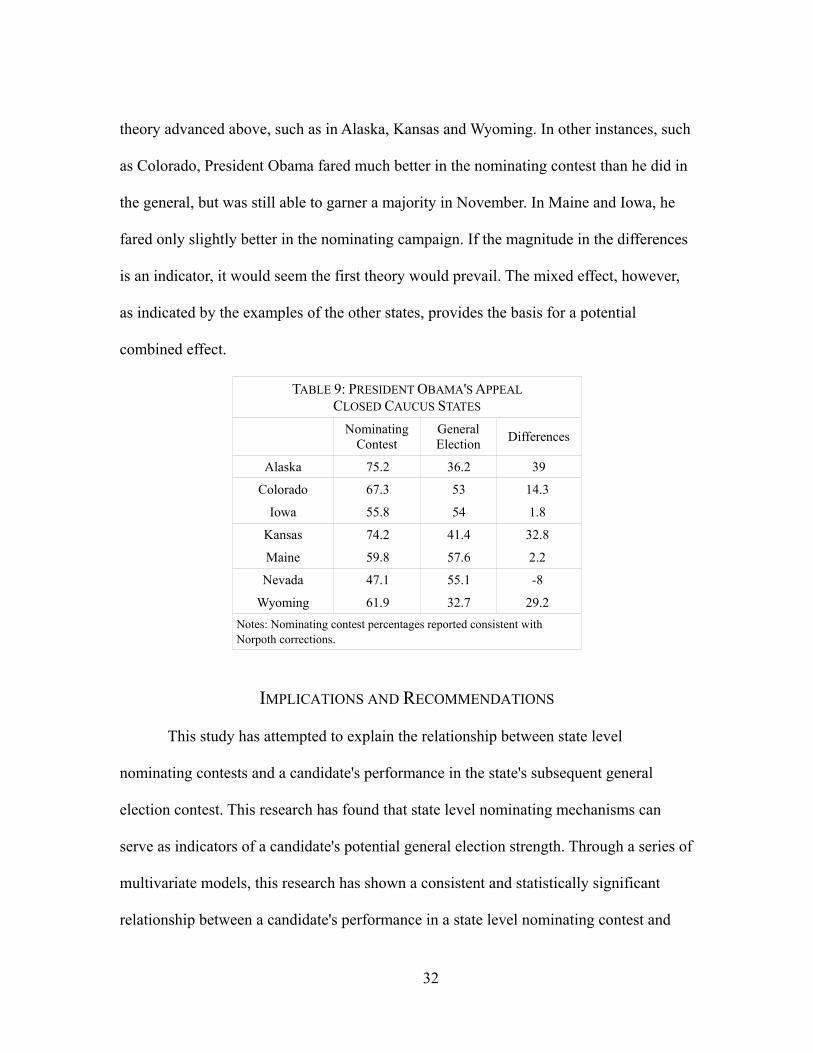
theory advanced above, such as in Alaska, Kansas and Wyoming. In other instances, such
as Colorado, President Obama fared much better in the nominating contest than he did in
the general, but was still able to garner a majority in November. In Maine and Iowa, he
fared only slightly better in the nominating campaign. If the magnitude in the differences
is an indicator, it would seem the first theory would prevail. The mixed effect, however,
as indicated by the examples of the other states, provides the basis for a potential
combined effect.
TABLE 9: PRESIDENT OBAMA'S APPEAL CLOSED CAUCUS STATES
Nominating Contest
General Election Differences
Alaska 75.2 36.2 39
Colorado 67.3 53 14.3
Iowa 55.8 54 1.8
Kansas 74.2 41.4 32.8
Maine 59.8 57.6 2.2
Nevada 47.1 55.1 -8
Wyoming 61.9 32.7 29.2 Notes: Nominating contest percentages reported consistent with Norpoth corrections.
IMPLICATIONS AND RECOMMENDATIONS
This study has attempted to explain the relationship between state level
nominating contests and a candidate's performance in the state's subsequent general
election contest. This research has found that state level nominating mechanisms can
serve as indicators of a candidate's potential general election strength. Through a series of
multivariate models, this research has shown a consistent and statistically significant
relationship between a candidate's performance in a state level nominating contest and

33
their subsequent performance in the state's general election contest. Throughout the 2008
Democratic nominating campaign many argued there was no connection between a
candidate's performance in a nominating contest and their viability in the November
election. This study refutes that view.
Some may argue that the results of this model are only useful in drawing
conclusions on the 2008 presidential campaign. Given the sample this study covers, their
arguments are not without merit. However, given that the 2008 campaign provided the
most complete nationwide sample of the Democratic nominating rules as they stand now,
the results should not be ignored by those who look to propose changes to such rules. If
we are to draw conclusions from this initial model's results, one could argue that a long
and contested primary campaign is not detrimental to the party's electoral prospects in
November. In fact, one could argue quite the opposite: that a long primary campaign,
with two high caliber candidates, can provide a much more complete view into the
potential nominee's prospects in the November election. With a fifty state sample, the
eventual Democratic nominee's relative vote share in a state's nominating contest displays
a statistically significant ability to predict the nominee's relative vote share in the state's
general election. Given this reality, an examination of the effects of specific nominating
mechanisms on general election performance, may prove fruitful to Democratic rules
makers. This study provides such an analysis.
This study has shown that primary systems are generally more predictive than
caucus systems. This research has also revealed the inadequacy of the closed caucus
system in gauging a candidate’s general election strength. Some will say this study’s

34
findings on closed caucuses are solely a result of President Obama's relatively high
nominating contest success rate in closed caucus states and not the mechanism's ability to
create an unrepresentative sample of November voters. As previously discussed, the
intercept effect is most likely attributed to specific 2008 conditions, while the slope effect
may provide for more insight into general effects of the mechanism. While it may not be
possible to ascertain specific percentage levels associated with these effects, it's entirely
impossible to rule out the possibility of a combined effect, given the significance of the
returned results. Given these concerns, the mechanism seems ill suited for gauging a
candidate's November potential, in comparison to other options.
If we believe closed caucus systems poorly gauge a candidate's general election
strength, the implications are serious for those considering changes to party nominating
rules. By inviting states to employ closed caucus systems, the party may be allowing
candidates to compete and emerge from such systems whose performance is by no means
consistent with their potential general election appeal. In fact, if we consider a set of rules
which required closed caucus systems across the board, the results would be extremely
detrimental to the party's primary objective of winning presidential elections.
These findings have serious implications for Democratic rule makers. In crafting
new delegate selection rules, the party's rule and bylaws committee should be aware of
the statistical relationship between nominating and general election contests. An
understanding of this relationship may prove useful in deciding upon the calendar of the
nominating contest as well as pledged delegate allocation per state. This study's findings
should not be overlooked when crafting the rules by which states establish their delegate

35
selection processes and the particular mechanisms available to state parties. This study
has shown closed caucus contests to have a statistically significant negative relationship
with general election contests. By excluding voters who pledge allegiance to other parties
from participating in Democratic nominating contests, closed caucuses become
unrepresentative of the November electorate.
By recognizing the relationship between state level nominating systems and
general election contests, party rule makers could build a delegate selection system which
provides for a strategic advantage over an anachronistic Republican system. By steering
states away from closed caucus systems, particularly in crucial November election states,
the party would be committing itself to vetting candidates with nominating contest
electorates much more representative of the November electorate. Another potential
application of this study's findings would be to incorporate a measure of a state's
November election competitiveness in nominating contest delegate allocation and timing.
By adjusting the delegate allocation factor to reward states which have the potential to be
closest in the November election, the party would be creating an environment in which
the fiercest competition would take place in states critical in the November election.
Employing these combined recommendations could result in candidates competing
vigorously in states most critical to the November election via nominating mechanisms
which have the ability to significantly gauge their general election viability.

36
REFERENCES
Aiken, Leona S. and Stephen G. West. Multiple Regression: Testing and Interpreting Interactions. London: Sage Publications ltd., 1991. Atkeson, LR. 1998. “Divisive Primaries and General Election Outcomes: Another Look at Presidential Campaigns” American Journal of Political Science 42 (1): 256-271. Bartels, Larry. 1987. “Candidate Choice and the Dynamics of the Presidential Nominating Process”. American Journal of Political Science 31: 1-30. Bureau of Labor Statistics. “Overview of BLS Statistics on Unemployment”. http://www.bls.gov/bls/unemployment.htm. Dinitto, Andrew J. and William Smithers. 1972. “The Representatives of the Direct Primary: A Further Test of V.O Key’s Thesis.” Polity 5 (2): 209-224. Fair, RC. 1978. “The effect of economic events on votes for president”. Review of Economics and Statistics 60 (2): 159-173. Finkel, Steve E. 1993. “Reexamining the “Minimal Effects” Model in Recent Presidential Campaigns.” The Journal of Politics 55 (1): 1-21. Green Papers, The. “Primary, Caucus, and Convention Phase”. http://www.thegreenpapers.com/P08/. Kenney, Patrick J., and Tom W. Rice. 1984. “The Effect of Primary Divisiveness in Gubernatorial and Senatorial Elections.” Journal of Politics 46: 904-15. Kenney, Patrick J., and Tom W. Rice. 1987. “The Relationship Between Divisive Primaries and General Election Outcomes.” American Journal of Political Science 31 (1): 3-27. Kenney, Patrick J., and Tom W. Rice. 1988. " Presidential Prenomination Preferences and Candidate Evaluations." American Political Science Review 82 (4): 1309-1319. Lengle, James. 1980. “Divisive Presidential Primaries and Party Electoral Prospects, 1932-1976.” American Politics Research 8 (3): 261-277. MSNBC Political News & Updates. “Politics Dashboard”. http://www.msnbc.msn.com/id/27105655#scroll_map. Norpoth, Helmut. 2004. “From Primary to General Election: Forecast of the Primary Model.” Political Science & Politics 37: 737-740.

37
Norpoth, Helmut. 2008. “On the Razor’s Edge: The Forecast of the Primary Model.” Political Science and Politics October: 683-686. Norrander, Barbara . "Nomination Choices: Caucus and Primary Outcomes, 1976-1988." American Journal of Political Science 37: 343-364. Ranney, Austin. 1968. “Representativenes of Primary Electorates.” Midwest Journal of Political Science 12 (2): 224-38. Ranney, Austin and Leon D. Epstein. 1966. “The Two Electorates: Voters and Non-Voters in a Wisconsin Primary.” The Journal of Politics 28 (3): 598-616. RealClearPolitics. “Election 2008”. http://www.realclearpolitics.com/epolls/2008/latestpolls/index.html. Stone, Walter J. 1986. “The Carryover Effect in Presidential Elections.” American Political Science Review 80 (1): 271-80.