Embed Size (px)
Citation preview
MULTIMEDIA FATE MODELLING AND IMPACT OF PHARMACEUTICAL
COMPOUNDS ON FRESHWATER ECOSYSTEMS
By
Sérgio Alberto Morais
A thesis submitted in the fulfilment of the requirements for the PhD degree in Environmental Sciences and Technology
September 2013

II
III
The present thesis entitled Multimedia Fate Modelling and Impact of Pharmaceutical Compounds on Freshwater Ecosystems by Sérgio Alberto Morais has been carried out at the Institute of Environmental Science and Technology (ICTA) at Universitat Autònoma de Barcelona (UAB) Sérgio Alberto Morais
under the supervision of Dr. Xavier Gabarrell, from the ICTA and the Department of Chemical Engineering at the UAB, and Dr. Cristina Delerue-‐Matos, from REQUIMTE and Instituto Superior de Engenharia do Porto
Xavier Gabarrell Cristina Delerue-‐Matos
Bellaterra (Cerdanyola del Vallès), September 2013

IV
Table of Contents
V
Table of Contents Acknowlegdements ........................................................................................................ IX
Abstract ........................................................................................................................... XI
Resumen ....................................................................................................................... XIII
Sumário ....................................................................................................................... XVII
1. Introduction ............................................................................................................. 21
1.1 Context ............................................................................................................. 21
1.2 Problem setting ................................................................................................ 22
1.3 Objectives and structure of the thesis .............................................................. 24
2. Multimedia Fate Modelling and Comparative Impact on Freshwater Ecosystems of
Pharmaceuticals from Biosolids-Amended Soils ........................................................... 27
2.1 Abstract ............................................................................................................ 27
2.2 Introduction ...................................................................................................... 28
2.3 Methodology .................................................................................................... 29
2.3.1 Intermedia transport and loss processes ................................................... 32
2.3.2 Freshwater ecosystem impacts ................................................................. 36
2.3.3 Monte Carlo Analysis ............................................................................... 37
2.4 Results and discussion ..................................................................................... 38
2.4.1 Transport to freshwater compartment ....................................................... 38
2.4.2 Probabilistic comparative impact results .................................................. 40
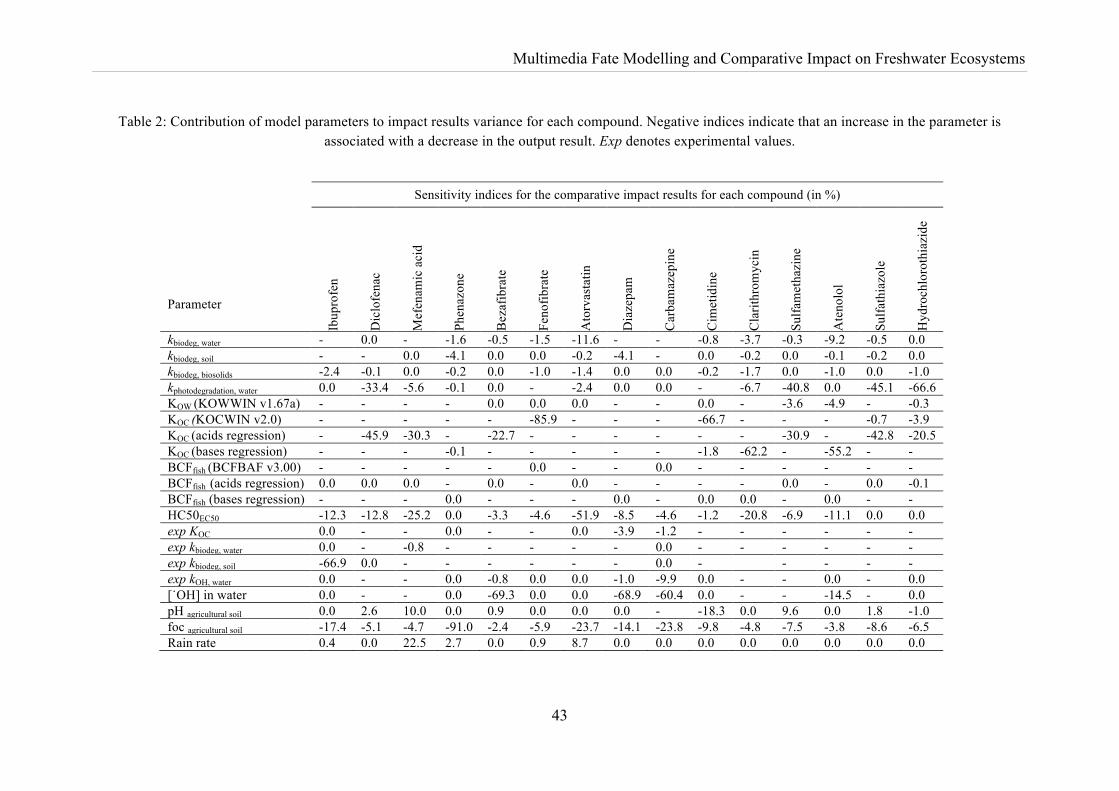
2.4.3 Contribution to variance of impact results ............................................... 42
2.5 Conclusions ...................................................................................................... 44
2.6 Acknowledgements .......................................................................................... 45
3. Accounting for the dissociating properties of organic chemicals in LCIA: an
uncertainty analysis applied to micropollutants in the assessment of freshwater
ecotoxicity ...................................................................................................................... 47
3.1 Abstract ............................................................................................................ 47
Table of Contents
VI
3.2 Introduction ...................................................................................................... 48
3.3 Methodology .................................................................................................... 49
3.3.1 Partition coefficients ................................................................................. 51
3.3.2 Bioconcentration factor in fish ................................................................. 52
3.3.3 Degradation .............................................................................................. 53
3.3.4 Monte Carlo Analysis ............................................................................... 54
3.4 Results and Discussion .................................................................................... 57
3.5 Conclusions ...................................................................................................... 62
3.6 Acknowledgements .......................................................................................... 63
4. An Uncertainty Analysis Applied to the Prioritisation of Pharmaceuticals as
Surface Water Contaminants from Wastewater Treatment Plant Direct Emissions ...... 65
4.1 Abstract ............................................................................................................ 65
1.1 Introduction ...................................................................................................... 66
1.2 Methodology .................................................................................................... 67
1.2.1 The ecotoxicity effect factor ..................................................................... 69
1.2.2 Uncertainty analysis ................................................................................. 71
1.3 Results and discussion ..................................................................................... 72
1.3.1 Antineoplastics ......................................................................................... 72
1.3.2 Analgesics/anti-inflammatories ................................................................ 73
1.3.3 β-blockers ................................................................................................. 75
1.3.4 Psychiatric drugs ....................................................................................... 77
1.3.5 Other therapeutical classes ....................................................................... 78
1.3.6 Additional considerations ......................................................................... 80
1.3.7 Model limitations ...................................................................................... 82
1.4 Conclusions ...................................................................................................... 83
1.5 Acknowledgments ............................................................................................ 84
Table of Contents
VII
5. An Uncertainty Analysis Applied to the Prioritisation of Pharmaceuticals as
Surface Water Contaminants from Wastewater Treatment Plants: the Case of Indirect
Emissions from Amendment of Soils with Biosolids and Irrigation with Reclaimed
Water .............................................................................................................................. 85
5.1 Abstract ............................................................................................................ 85
5.2 Introduction ...................................................................................................... 86
5.3 Methodology .................................................................................................... 87
5.3.1 Emission data ............................................................................................ 87
5.3.2 Fate and effect .......................................................................................... 88
5.3.3 Uncertainty analysis ................................................................................. 90
5.4 Results and discussion ..................................................................................... 91
5.4.1 The pathway of irrigation with reclaimed water ...................................... 91
5.4.2 The biosolids-amended soils pathway ...................................................... 98
5.4.3 Additional considerations ....................................................................... 102
5.5 Conclusions .................................................................................................... 106
5.6 Acknowledgments .......................................................................................... 107
6. General conclusions .............................................................................................. 109
Appendix A ................................................................................................................... 115
A1: Bulk transport rate coefficients and fate matrices .............................................. 115
A2: Intermedia partition coefficients ........................................................................ 117
Solids-water partitioning ....................................................................................... 118
Gas-aerosol partitioning ........................................................................................ 119
Air-water partitioning ............................................................................................ 120
A3: Plant uptake ........................................................................................................ 120
A4: Experimental parameters ................................................................................... 122
A5: Ecotoxicity factor in water ................................................................................. 123
A6: Parameter uncertainty and variability included in the Monte Carlo analysis .... 127
Appendix B ................................................................................................................... 128

Table of Contents
VIII
Appendix C ................................................................................................................... 133
C5: Further discussion of results ............................................................................... 152
Bibliography ................................................................................................................. 155
List of figures ................................................................................................................ 173
List of tables ................................................................................................................. 175

Acknowledgdements
IX
Acknowlegdements I want to thank to Xavier Gabarrell for his fruitful supervision. Thank you very much
for all the support, confidence, and great collaboration. I really appreciated the balance
between personal freedom and the necessary guidance towards the goal of completing
this work.
I also owe many thanks to Cristina Delerue-Matos for co-supervising this thesis, also
for proposing me to pursue this PhD work plan in the first place, and for the following
constant care and support.
Many thanks to all my colleagues in the ICTA office for being so available to help, for
the fruitful discussions, and great moments of friendship.
Thanks a lot to those in GRAQ/REQUIMTE for the help always provided since many
years.
I should also be thankful to my family and friends for their care, unconditional support, and incitement.

Acknowledgdements
X
Abstract
XI
Abstract The overall objective of this dissertation is to contribute to the development of best
available practices in environmental multimedia fate and effect modelling for ecosystem
impacts assessment of pharmaceutical compounds. The distribution of pharmaceuticals
through several environmental media poses a potential toxic hazard to freshwater
ecosystems, among other endpoints. The ionising properties of pharmaceuticals
represent additional challenges when modelling the multimedia fate, exposure, and
effect of this class of chemicals. Large uncertainties are expected when modelling the
mobility, as well as the bioavailability for uptake by exposed biota and degradation, of
ionising organic chemicals using conventional models. The development and evaluation
of alternative approaches that include these issues are essential for the improvement of
micropollutants environmental behaviour simulation. Model comparison and quantification of uncertainties of model results are vital for their correct interpretation. Furthermore, the quantification of uncertainties of model results is detrimental to establish priorities for further monitoring, as well as research, the wide number of
pharmaceutical active compounds currently in use considering the most important
pathways of environmental contamination.
In order to achieve that, the following specific objectives are addressed:
1. Develop a consistent matrix algebra framework for multimedia fate,
multipathway exposure and toxicity effects models adapted for pharmaceutical
compounds and consistent with life cycle impact assessment models.
2. Develop an approach to quantify the uncertainty of model results, accounting
for regression model uncertainty, and identifying the main contributing
parameters to overall uncertainty.
3. Compare and quantify the uncertainty of alternative model approaches on the
level of characterisation factors as well as of final impact results, contributing to the identification of the best available practices on multimedia fate, exposure and effect modelling of PCs based on current scientific knowledge.
4. Prioritise pharmaceutical compounds on their probabilistic impact on freshwater
ecosystems from both WWTP direct emissions and indirect emissions for
further monitoring and research.
Chapter 1 puts this dissertation into its context and defines its objectives.
Abstract
XII
Chapter 2 presents a multimedia fate, exposure, and effect model based on matrix
algebra adapted for pharmaceutical compounds and consistent with the UNEP/SETAC
consensus model USEtox. An approach to quantify the uncertainty of model results
using Monte Carlo analysis is presented. The approach accounts for the uncertainty of
regression models and toxicity effects, as well as the variability of environmental
parameters and experimental parameter values. The framework is applied to
pharmaceuticals detected in biosolids following application on agricultural soils. The
most influential parameters of the probabilistic comparative impact assessment were
identified, as well as topics for further research for the compounds of most concern.
Chapter 3 is a detailed comparison of the USEtox model with the alternative framework
adapted for pharmaceutical compounds. The alternative framework includes regressions
to estimate fate parameters that account for the ionized fraction of a molecule. The
comparison has been performed at the level of characterisation factors as well as of final
impact results for 3 emissions scenarios into different environmental media. The most
sensitive model parameters in the estimation of ecotoxicological characterization factors
of micropollutants were evaluated by Monte Carlo analysis in both the default USEtox
model and in the alternative approach.
Chapter 4 and 5 present a prioritisation of PCs detected in European wastewater
treatment plants for further monitoring and research. Chapter 4 presents the pathway of
direct discharge of WWTPs emissions to surface waters. In Chapter 5 the indirect
emissions pathways to the freshwater compartment are addressed. The indirect emission
pathways include the application of biosolids from WWTPs and of effluents as
reclaimed water for irrigation, both on agricultural areas and landscapes. Research
topics were defined by indentifying important gaps of knowledge as well as by
computing the contribution of estimated model parameters’ uncertainty to the impact
variance.
Chapter 6 presents general conclusions on the research outlined and will provide
recommendations for future research.
Keywords: Multimedia fate model, Uncertainty analysis, Pharmaceuticals,
Micropollutants, Dissociating organics, Freshwater ecotoxicity, Wastewater treatment
plants, Biosolids, Land application, Reclaimed water, Probabilistic comparative impact,
Risk Assessment, LCA, USEtox.
Resumen
XIII
Resumen Esta tesis tiene como objetivo principal contribuir para el desarrollo de las mejores
prácticas disponibles en la modelación del destino multimedia y de los efectos de
compuestos farmacéuticos para evaluar su impacto en los ecosistemas. La distribución
de fármacos a través de los distintos compartimentos ambientales representa un riesgo
potencial de toxicidad para los ecosistemas acuáticos, entre otros. La capacidad de
ionización de muchos de estos compuestos en el medio ambiente es un reto para la
modelación de su destino multimedia, de su exposición y efectos. El uso de modelos
convencionales no polares representa un elevado nivel de incertidumbre en la
modelación de la movilidad de compuestos orgánicos ionizables, y en la modelación de
su biodisponibilidad para la exposición a organismos y para la degradación en el medio
ambiente. El desarrollo y la evaluación de modelos alternativos que incluyan estos
puntos son esenciales para mejorar la simulación del comportamiento ambiental de
microcontaminantes. La comparación de modelos y la cuantificación de la
incertidumbre de sus resultados son fundamentales para su correcta interpretación.
Además, la cuantificación de estas incertidumbres es necesaria para establecer
prioridades de monitoreo y de investigación adicional entre el gran número de fármacos
activos en uso actual teniendo en cuenta las diferentes vías de contaminación ambiental.
En este contexto, se consideraron los siguientes objetivos específicos:
1. Desarrollo de un modelo de destino multimedia, exposición y toxicidad con
base en álgebra matricial y adaptado a compuestos farmacéuticos, consistente
con modelos de evaluación del impacto de ciclo de vida.
2. Desarrollo de un método para la cuantificación de la incertidumbre del
modelo, incluyendo la incertidumbre de los modelos de regresión aplicados, y la
identificación de los parámetros más pertinentes a la incertidumbre total.
3. Comparar y cuantificar las incertidumbres de los modelos alternativos en
términos de los factores de caracterización y de los resultados finales de
impacto, contribuyendo a la identificación de las mejores prácticas de
modelación del destino multimedia, exposición y efectos de fármacos con base
en los conocimientos científicos actuales.
4 Priorización de compuestos farmacéuticos en términos de su impacto
probabilístico en los ecosistemas de agua dulce, considerando las emisiones
Resumen
XIV
directas y indirectas de plantas de tratamiento de aguas, para posterior
monitorización e investigación adicional.
Capítulo 1 establece el contexto de la tesis y sus objetivos.
Capítulo 2 presenta un modelo de destino multimedia, exposición y efectos con base en
álgebra matricial, adaptado a fármacos y consistente con el modelo consensual de la
UNEP/SETAC, el modelo USEtox. Se presenta un enfoque para cuantificar la
incertidumbre de los resultados del modelo usando el análisis de Monte Carlo. El
enfoque incluye la incertidumbre asociada a los modelos de regresión utilizados y a los
efectos tóxicos, y la variabilidad asociada a los parámetros ambientales y
experimentales. El modelo se aplicó a fármacos detectados en lodos de depuradora,
posteriormente aplicados a suelos agrícolas. En relación a los compuestos de mayor
relevancia, los parámetros más influyentes en la evaluación probabilística de impacto
fueron identificados tal como temas para investigación futura.
El capítulo 3 presenta una comparación detallada entre el modelo USEtox y el modelo
alternativo adaptado a compuestos farmacéuticos. Este modelo alternativo incluye
modelos de regresión para estimar parámetros teniendo en cuenta la fracción iónica de
una molécula. La comparación se hizo al nivel de los factores de caracterización y al
nivel de los resultados finales del impacto teniendo en cuenta tres escenarios de
emisiones en distintos compartimientos ambientales. Los parámetros más sensibles de
los modelos fueron identificados por análisis de Monte Carlo.
Los capítulos 4 y 5 presentan una priorización de los fármacos detectados en plantas de
tratamiento de aguas residuales europeas al nivel de su monitorización ambiental y de
temas para investigación futura. En el Capítulo 4 las emisiones directas de efluentes al
compartimiento de agua dulce son estudiadas. En el capítulo 5 se consideran las
emisiones indirectas: la aplicación de lodos de depuración y de efluentes en suelos
agrícolas como fertilizante y como agua de irrigación, respectivamente. Los temas de
investigación futura se definieran tanto por la identificación de lagunas en el
conocimiento acerca del comportamiento ambiental de los fármacos, como por la
contribución de la incertidumbre de los parámetros estimados del modelo a la varianza
de los impactos calculados.
En el capítulo 6 se presentan las conclusiones generales y recomendaciones para trabajo
futuro.
Resumen
XV
Palabras clave: Modelo de destino multimedia, Análisis de incertidumbre, fármacos,
microcontaminantes, compuestos orgánicos ionizables, ecotoxicidad en agua dulce,
plantas de tratamiento de aguas residuales, lodos de depuración, agua regenerada,
Evaluación de riego, Impacto comparativo probabilístico, Análisis de ciclo de vida,
USEtox .

Resumen
XVI
Sumário
XVII
Sumário Esta tese tem como objectivo principal contribuir para o desenvolvimento de melhores
práticas disponíveis em modelação do destino multi-compartimental e dos efeitos de
compostos farmacêuticos para a avaliação dos seus impactos em ecossistemas. A
distribuição de fármacos através dos vários compartimentos ambientais representa um
risco tóxico potencial para os ecossistemas aquáticos, entre outros. A capacidade de
muitos fármacos em se ionizarem no meio ambiente representa um desafio para a
modelação do comportamento ambiental destes compostos. Elevadas incertezas são
expectáveis ao modelar a mobilidade de compostos orgânicos ionizáveis utilizando
modelos convencionais não-polares, tal como ao modelar a sua biodisponibilidade para
se degradarem nos meios ambientais e para serem tomados por organismos expostos. O
desenvolvimento e avaliação de modelos alternativos que incluam estes pontos são
essenciais para a melhoria da simulação do comportamento ambiental de
micropoluentes. A comparação de modelos e a quantificação das incertezas dos seus
resultados é vital para a sua correcta interpretação. Adicionalmente, a quantificação
destas incertezas é necessária para estabelecer prioridades de monitorização e de
investigação adicional entre vasto número de fármacos activos em uso corrente
considerando as diferentes vias de contaminação ambiental.
Neste âmbito, os seguintes objectivos específicos foram considerados:
1. Desenvolvimento de um modelo de destino multi-compartimental, exposição e
efeitos tóxicos baseado em matrizes algébricas, adaptado a compostos
farmacêuticos e consistente com modelos de avaliação de impacto de ciclo de
vida.
2. Desenvolvimento de uma abordagem para a quantificação das incertezas do
modelo, incluindo a incertezas dos modelos de regressão aplicados, e
identificando os parâmetros de maior relevância para a incerteza total.
3. Comparar e quantificar as incertezas de modelos alternativos ao nível dos
factores de caracterização e dos resultados finais de impacto, contribuindo para
a identificação das melhores práticas disponíveis em modelação do destino
multi-compartimental, exposição e efeitos de fármacos baseadas no
conhecimento científico actual.
Sumário
XVIII
4. Priorização de compostos farmacêuticos ao nível do seu impacto probabilístico
em ecossistemas de água doce, tanto de emissões directas de estações de
tratamento de água como de emissões indirectas, para posterior monitorização e
investigação adicional.
O capítulo 1 contextualiza a dissertação e define os seus objectivos.
O capítulo 2 apresenta um modelo de destino multi-compartimental, exposição e efeitos
baseado em matrizes algébricas, adaptado a compostos farmacêuticos e consistente com
o modelo consensual da UNEP/SETAC, o modelo USEtox. Uma abordagem utilizando
a análise de Monte Carlo para a quantificação das incertezas dos resultados do modelo é
apresentada. A abordagem inclui a incerteza associada aos modelos de regressão
utilizados e aos efeitos tóxicos e a variabilidade associada aos parâmetros ambientais e
experimentais. O modelo foi aplicado a fármacos detectados em lamas de depuração e
posteriormente aplicadas em solos agrícolas. Os parâmetros mais influentes da
avaliação probabilística de impacto foram identificados, tal como tópicos para
investigação futura relativamente aos compostos de maior relevância.
No capítulo 3 é apresentada uma comparação detalhada entre o modelo USEtox e o
modelo alternativo adaptado a compostos farmacêuticos. Este modelo alternativo inclui
regressões para estimar parâmetros considerando a fracção iónica de uma molécula. A
comparação foi realizada ao nível dos factores de caracterização e ao nível dos
resultados finais de impacto, considerando 3 cenários de emissão em diferentes meios
ambientais. Os parâmetros mais sensíveis dos modelos foram identificados através de
análise de Monte Carlo.
Os capítulos 4 e 5 apresentam uma priorização de fármacos detectados em estações de
tratamento de água europeias para posterior monitorização e investigação. No capítulo 4
são estudadas as emissões directas de efluentes para o compartimento de água doce. No
capítulo 5 são consideradas as emissões indirectas: aplicação de lamas de depuração e
de efluentes de estações de tratamento de água em solos, como fertilizante e como água
de rega, respectivamente. Tópicos para investigação futura foram definidos, tanto pela
identificação de lacunas de conhecimento, como pela contribuição da incerteza dos
parâmetros estimados para a variância do impacto.
O capítulo 6 apresenta conclusões generais e recomendações para trabalho futuro.
Sumário
XIX
Palavras-chave: Modelo de destino multi-compartimental, Análise de incerteza,
Fármacos, Micropoluentes, Compostos orgânicos ionizáveis, Ecotoxicidade em água
doce, Estações de tratamento de água, Lamas de depuração, Água reciclada. Impacto
comparativo probabilístico, Avaliação de Risco, Avaliação de ciclo de vida, USEtox.

Sumário
XX
Introduction
21
1. Introduction
1.1 Context
The release of chemicals into the environment takes place as part of either natural or human activity. These chemicals, depending on several factors, can pose a risk to both humans and ecosystems and the knowledge and the quantification of such risks are pivotal for preventive action. The measurement of environmental concentrations is a very important step to identify potentially hazardous concentrations of chemicals in environmental media, such as air, water, soil, or sediment. However, only when there are evidence of contamination and availability of resources these measurements are practical. Methods that can simulate the fate of a chemical, i.e., the distribution of a chemical after its release into the environment, as well as to predict the exposure level of the target under protection (e.g. human population, or ecosystems) and which effects the chemical will cause, are therefore necessary. Such methods are referred to as environmental multimedia fate, multipathway exposure and effect models. The application of these models is a necessary solution when measurements of environmental concentrations are not practicable; for example, when large areas are under toxic stress or a predictive estimation of the potential hazard of an emission, e.g. of a new chemical design, is necessary in for a decision-making process. In the last decades there has been an increasing interest in life cycle and comparative risk approaches, focusing on the prevention of emissions in opposition to end-of-pipe solutions, in order to design environmentally friendlier products or services (Rosenbaum, 2006). These environmental management approaches need methods that link the product development chains to the corresponding emissions and eventually impacts on human health and ecosystems. Such approaches can provide informed decisions whenever choices affecting a product, service, or activity and its impact in the environment have to be made.
In recent years, the focus of environmental pollution by organic chemicals is being enlarged to include organic micropollutants, i.e. organic chemicals which are detected in environmental media at trace amounts, belonging to diverse classes of chemicals such
as pesticides, pharmaceuticals and personal care products (PPCPs). For example, in
Europe, approximately 4000 different pharmaceutical active compounds can reach
every environmental compartment (Mompelat et al., 2009). Whenever choices affecting
products, services, or activities involving these ubiquitous pollutants, life cycle and
comparative risk assessments are needed to support decisions regarding, for example,
Introduction
22
the definition of environmental contamination monitoring programmes, the comparison
of agricultural practices, emission reduction technologies and scenarios, or new
chemical designs to be introduced in the market.
1.2 Problem setting
Pharmaceutical compounds (PCs) are one of the chemical classes of micropollutants
whose detection in environmental media has raised concern in recent years. The most
common environmental contamination pathways are the emission of pharmaceutical
compounds (PCs) from wastewater treatment plants (WWTPs) after urinal and faecal
excretion and the application of livestock manure as a top soil dressing containing
veterinary pharmaceuticals. The pathways of contamination after excretion and passage
through municipal sewage systems include 1) the infiltration of sewage from leakages
in drains, 2) the application of biosolids from WWTPs on agricultural areas and
landscapes, and, due to incomplete removal, 3) the disposal of WWTP effluents and raw
sewage into surface waters and 4) as reclaimed water into agricultural fields and
landscapes by irrigation. The distribution of PCs through several environmental media
poses a potential toxic hazard to terrestrial organisms, humans, and freshwater
ecosystems; however, the scope of the present thesis is restricted to the ecotoxicity
impact of PCs on freshwater ecosystems.
Ecotoxicity refers to the potential for biological, chemical, or physical stressors to affect
ecosystems (Van Zelm, 2010a). The term was first outlined by Truhaut (1977), who
defined it as “the branch of toxicology concerned with the study of toxic effects, caused
by natural or synthetic pollutants, to ecosystems, animals (including human beings),
plants, and microbial communities”. Ecotoxicology research is being used to set
environmental regulations, given that legal environmental criteria are derived from
ecological and human risk assessments, which establishes generic risk limits for toxic
compounds for different environmental media.
Methods addressing ecotoxicity to be applied either in life cycle or comparative risk
assessments need to be improved regarding the chemical coverage and environmental
relevance (Larsen and Hauschild, 2007a). In the case of PCs, large uncertainties may be
attached to the ecotoxicity modelling as estimated data must used at a great extent,
given that reliable fate, exposure, and effect data are not always available. Furthermore,
compared to most bulk chemicals, pharmaceuticals are often large and chemically
Introduction
23
complex molecules with basic and acidic functionalities. Under environmental
conditions, PCs can be neutral, cationic, anionic, or zwitterionic. In conventional
multimedia fate and exposure models, the sorption of the ionic fraction of ionised
organic chemicals is not adequately modelled because conventional non-polar
partitioning models to estimate partitioning coefficients are applied. Therefore, large
uncertainties are expected when modelling the mobility, as well as the bioavailability
for uptake by exposed biota and degradation, of dissociating organic chemicals using
the conventional models.
The quantification and communication of uncertainties related to model results is vital for their correct interpretation and use (Steen, 1997). Such analysis is often hindered by the difficulty to assign uncertainty distributions to the usually numerous parameters of a model as required by most methods of uncertainty assessment. Frequently, this leads to complete omission of this important and integral aspect of any model result, while potentially it might influence or even change the main result of such a comparative study (Rosenbaum, 2006). This problem is even more apparent when modelling large sets of chemicals as usually done in comparative risk or life cycle assessment. In this context, potential important sources of uncertainty in a model result, such as regression models used for parameter estimation and toxicity effects, are usually neglected in comparative risk or life cycle assessments. The identification of important contributors of uncertainty in a model results applied to micropollutants is needed in order to develop alternative, simpler approaches of uncertainty estimation, given that conventional uncertainty analysis are rather resource intensive, especially when modelling large sets of chemicals. Moreover, the quantification of uncertainty related to different model approaches covering the full source-to-impact chain is necessary in order to identify the best available practices on multimedia fate, exposure and effect modelling based on current scientific knowledge.
Conventional multimedia fate, exposure and effect models have been applied on the
topic of emissions of PCs from WWTPs in order to prioritise compounds for further
monitoring or additional research. In this context, quite a large body of work has been
conducted, however studies have generally been limited to single WWTPs (Verlicchi et
al., 2012) and rarely account for the quantification of the uncertainty of model results.
Moreover, these studies are either limited to a few therapeutic classes, or do not account
for spatial variations of the environmental landscape, nor do most of them account for
the dissociating properties of PCs (e.g., Sandersonn et al., 2004; Besse and Garric,
2008; Christen et al., 2010). Most of those studies, therefore, lack spatial differentiation

Introduction
24
given that the spatial resolution is neglected. This limitation can be overcome by the use
of regional grids within a model’s geographic scale, which is rather resource intensive,
or by including spatial variations of landscape characteristics in the model using
uncertainty analysis. Furthermore, as stated above, because many PCs contain ionising
functional groups, their charge changes with environmental pH, which displays great
variability with a given geographic scale, and thus, their transport behaviour and
bioavailability may be affected. In addition, the indirect emission pathways to the
freshwater compartment from WWTPs, such as the application of biosolids from
WWTPs and of effluents as reclaimed water for irrigation on agricultural areas and
landscapes, are neglected when examining the prioritisation of PCs for further
monitoring or additional research.
1.3 Objectives and structure of the thesis
The overall objective of this thesis is to contribute to the development of best available
practice in environmental multimedia and multipathway modelling for ecosystem
impacts of pharmaceutical compounds, addressing several important aspects. In order to
achieve that, the following specific objectives are addressed:
1. Develop a consistent matrix algebra framework for multimedia fate,
multipathway exposure and toxicity effect models adapted for pharmaceutical
compounds and consistent with life cycle impact assessment models.
2. Develop an approach to quantify the uncertainty of model results, accounting
for regression model uncertainty, and identifying the main contributing
parameters to overall uncertainty.
3. Compare and quantify the uncertainty of alternative model approaches on the
level of characterisation factors as well as of final impact results, contributing to the identification of the best available practices on multimedia fate, exposure and effect modelling of PCs based on current scientific knowledge.
4. Prioritise pharmaceutical compounds on their probabilistic impact on freshwater
ecosystems from both WWTP direct emissions and indirect emissions for
further monitoring and research. Research topics will be defined by indentifying
important gaps of knowledge as well as by computing the contribution of
estimated model parameters’ uncertainty and variability to the impact variance.
Introduction
25
The chapters in this thesis are all written as journal articles. The literature review is thus
performed at the beginning of each chapter. In each introduction, specific objectives
related to the overall thesis topic are expanded. Since journal articles must be self-
contained there is some degree of repetition in this thesis.
Chapter 2 presents a multimedia fate, exposure, and effect model based on matrix
algebra adapted for pharmaceutical compounds and consistent with the UNEP/SETAC
consensus model USEtox. An approach to quantify the uncertainty of model results
using Monte Carlo analysis is presented. The approach accounts for the uncertainty of
regression models and toxicity effects, as well as the variability of environmental
parameters and experimental parameter values. The framework is applied to
pharmaceuticals detected in biosolids following application on agricultural soils.
Emphasis is laid upon interpretation of the physical meaning of different elements
within the fate matrix, such as the transfer fractions of PCs from biosolids to the
freshwater compartment and their residence time on the freshwater compartment. The
most influential parameters of the probabilistic comparative impact assessment were
identified, as well as topics for further research for the compounds of most concern.
Chapter 3 is a detailed comparison of the USEtox model with the alternative framework
adapted for pharmaceutical compounds. The alternative framework includes regressions
to estimate fate parameters that account for the ionised fraction of a molecule. The
comparison has been performed at the level of characterisation factors as well as of final
impact results for 3 emissions scenarios into different environmental media. The most
sensitive model parameters in the estimation of ecotoxicological characterization factors
of micropollutants were evaluated by Monte Carlo analysis in both the default USEtox
model and in the alternative approach.
Chapter 4 and 5 present a prioritisation of PCs detected in European wastewater
treatment plants for further monitoring and research. Chapter 4 presents the pathway of
direct discharge of WWTPs emissions to surface waters. In Chapter 5 the indirect
emissions pathways to the freshwater compartment are assessed. The indirect emission
pathways include the application of biosolids from WWTPs and of effluents as
reclaimed water for irrigation, both on agricultural areas and landscapes. The analysis
includes the occurrence of 85 PCs detected in influents and effluents of 179 WWTPs.
Research topics were defined by indentifying important gaps of knowledge as well as
Introduction
26
by computing the contribution of estimated model parameters’ uncertainty to the impact
variance.
Finally, Chapter 6 presents general conclusions on the research outlined and will
provide recommendations for future research.
Multimedia Fate Modelling and Comparative Impact on Freshwater Ecosystems
27
2. Multimedia Fate Modelling and Comparative Impact on Freshwater Ecosystems of
Pharmaceuticals from Biosolids-Amended Soils This paper was published in Chemosphere, issue 93, volume 2, pages 252-262, under
the same title.
Additional authors are Cristina Delerue-Matosa, Xavier Gabarrellb,c, and Paqui
Blánquezc. aREQUIMTE/Instituto Superior de Engenharia do Porto (ISEP), Rua Dr. António
Bernardino de Almeida, 431 4200-072, Porto, Portugal. bSosteniPrA (UAB-IRTA-Inèdit), Institut de Ciència i Tecnologia Ambientals (ICTA),
Universitat Autònoma de Barcelona (UAB), 08193 Bellaterra, Barcelona, Spain. cDepartament d’Enginyeria Química, Escola d’Enginyeria, Universitat Autònoma de
Barcelona (UAB), 08193 Bellaterra, Barcelona, Spain.
2.1 Abstract
This study modelled the impact on freshwater ecosystems of pharmaceuticals detected
in biosolids following application on agricultural soils. The detected sulfonamides and
hydrochlorothiazide displayed comparatively moderate retention in solid matrices and,
therefore, higher transfer fractions from biosolids to the freshwater compartment.
However, the residence times of these pharmaceuticals in freshwater were estimated to
be short due to abiotic degradation processes. The non-steroidal anti-inflammatory
mefenamic acid had the highest environmental impact on aquatic ecosystems and
warrants further investigation. The estimation of the solid-water partitioning coefficient
was generally the most influential parameter of the probabilistic comparative impact
assessment. These results and the modelling approach used in this study serve to
prioritize pharmaceuticals in the research effort to assess the risks and the
environmental impacts on aquatic biota of these emerging pollutants.
Keywords: Biosolids, Freshwater ecotoxicity, Land application, Multimedia fate
modelling, Pharmaceuticals, Probabilistic comparative impact.
Multimedia Fate Modelling and Comparative Impact on Freshwater Ecosystems
28
2.2 Introduction
The application of municipal biosolids to agricultural soils as a source of crop nutrients
and organic matter is a common farming practice. Seven EU member states spread
>50% of their biosolids on agricultural soils (Müller, 2007). Persistent pharmaceuticals
that partition into organic matter during the sewage treatment process are present in
sludge and ultimately in biosolids (Edwards et al., 2009; Sabourin et al., 2009; Wu et
al., 2010). These emerging pollutants have been detected in biosolids-amended soils
(Furczak and Joniec, 2007; Kinney et al., 2008). Recent research has shown the
potential of several pharmaceuticals to migrate offsite in runoff water following land
application of biosolids (Lapen et al., 2008; Topp et al., 2008; Wu et al., 2010).
However, few studies have experimentally characterized the fate and transport of these
pharmaceuticals and the risks of contaminating adjacent surface waters (Barron et al.,
2010). Furthermore, in Europe, approximately 4000 different pharmaceutical active
compounds (PhACs) can reach every environmental compartment (Mompelat et al.,
2009). The wide range of properties of pharmaceuticals and the lengthy analytical
processes required for field-scale experiments make chemical fate modelling a valuable
tool for screening and prioritizing pharmaceuticals in research efforts to understand
their environmental behaviour.
The aims of this study were 1) to model the environmental fate of pharmaceuticals
detected in dewatered municipal biosolids (DMB) applied to agricultural soils,
accounting for their dissociating properties, 2) to estimate their comparative impact on
freshwater ecosystems, and 3) to identify and prioritize those compounds that warrant
further investigation as well as the most sensitive fate processes, i.e., those that
contribute to variance of impact results to a higher extent. For other endpoints, such as
terrestrial ecosystems and humans, other modelling challenges need to be investigated
and are currently out of the scope of this research. Almost no experimental data on
terrestrial ecotoxicity effects are available, as well as, in human exposure routes,
quantitative structure activity relationship (QSAR) models to estimate biotransfer
factors for milk and meat and bioaccumulation in roots and leaves of dissociating
compounds or degradation data in the vegetation compartment are also not available.
Multimedia Fate Modelling and Comparative Impact on Freshwater Ecosystems
29
2.3 Methodology
In a previous study, 43 pharmaceuticals were targeted in DMB samples, and 28 were
either absent or present in concentrations below the method detection limit (Rodríguez-
Rodríguez et al., 2011). The wastewater treatment plant (WWTP) in this study is
located in El Prat de Llobregat, near Barcelona, Spain, and it has a treatment capacity of
two million equivalent habitants. Table 1 show the concentrations of detected
pharmaceuticals in the DMB analysis, which did not account for human or veterinary
metabolites of parent compounds.
The concentration of pharmaceuticals is higher immediately following sludge
application at the beginning of the growing season and lower at the end of the year due
to removal processes. However, for screening purposes, steady-state conditions and
first-order kinetics for the degradation processes are assumed.
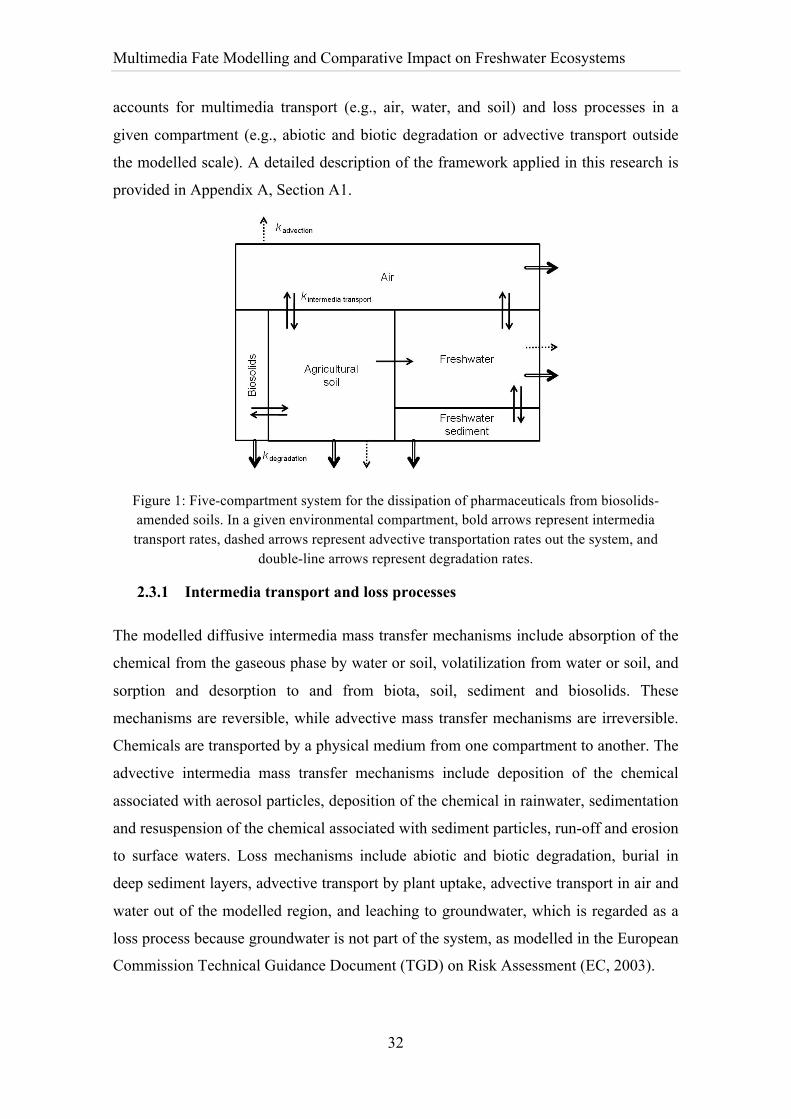
The modelled system consists of five compartments: biosolids, agricultural soil, air,
freshwater, and freshwater sediment (Figure 1). The landscape and environmental
parameters of the regional scale European Union System for the Evaluation of
Substances model (EUSES v2.1.1) (EC, 2004) were chosen to mimic a typical densely
populated region in the EU with an area of 40 400 km2 and applied in this assessment.
After biosolids have been applied to a soil, pharmaceuticals can desorb and thereby
become bioavailable in the agricultural soil matrix. They can then undergo leaching and
runoff in surface water. Conversely, they can remain highly bound and unavailable. To
account for differences in the sorption, desorption, and degradation of compounds
between the biosolid and soil matrices, the biosolids-amended soil compartment was
modelled as a biosolids compartment nested in the agricultural soil compartment. The
volume of the biosolids compartment was calculated for an application rate of 5000 kg
dry weight per hectare per year, assumed to be typical for EU regional agricultural
practices (EC, 2004), and 1.5 kg.L-1 density of dry biosolids (EC, 2004).
In the model, the environmental compartments are assumed to be homogeneous and
well mixed. Once emitted, chemicals are assumed to be instantaneously dispersed
throughout the entire compartment. Therefore, spatial variations in properties of the
medium and spatial differences in concentrations are disregarded. The mass distribution
estimation in the five-compartment model requires a mass balance solution with five
simultaneous differential equations.
Multimedia Fate Modelling and Comparative Impact on Freshwater Ecosystems
30
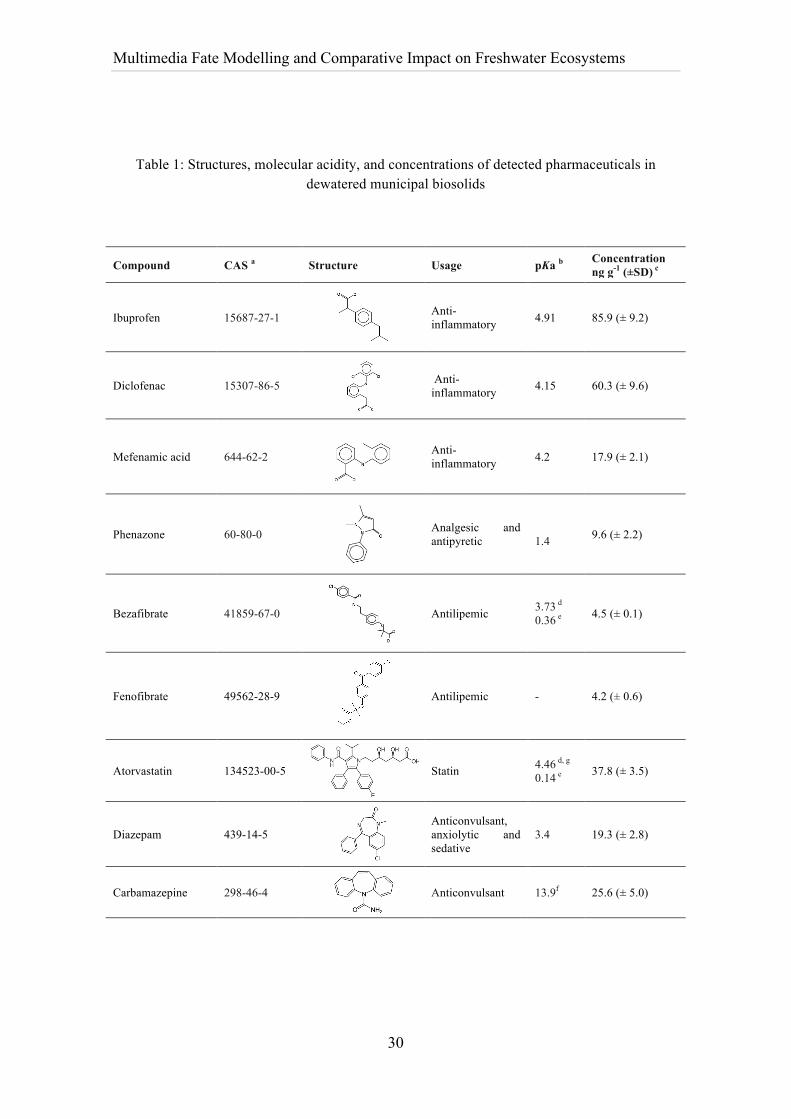
Table 1: Structures, molecular acidity, and concentrations of detected pharmaceuticals in dewatered municipal biosolids
Compound CAS a Structure Usage pKa b Concentration ng g-1 (±SD) c
Ibuprofen 15687-27-1
Anti-inflammatory 4.91 85.9 (± 9.2)
Diclofenac 15307-86-5
Anti-inflammatory 4.15 60.3 (± 9.6)
Mefenamic acid 644-62-2
Anti-inflammatory 4.2 17.9 (± 2.1)
Phenazone 60-80-0
Analgesic and antipyretic
1.4 9.6 (± 2.2)
Bezafibrate 41859-67-0
Antilipemic 3.73 d 0.36 e 4.5 (± 0.1)
Fenofibrate 49562-28-9
Antilipemic - 4.2 (± 0.6)
Atorvastatin 134523-00-5
Statin 4.46 d, g 0.14 e 37.8 (± 3.5)
Diazepam 439-14-5
Anticonvulsant, anxiolytic and sedative
3.4 19.3 (± 2.8)
Carbamazepine 298-46-4
Anticonvulsant 13.9f 25.6 (± 5.0)
Multimedia Fate Modelling and Comparative Impact on Freshwater Ecosystems
31
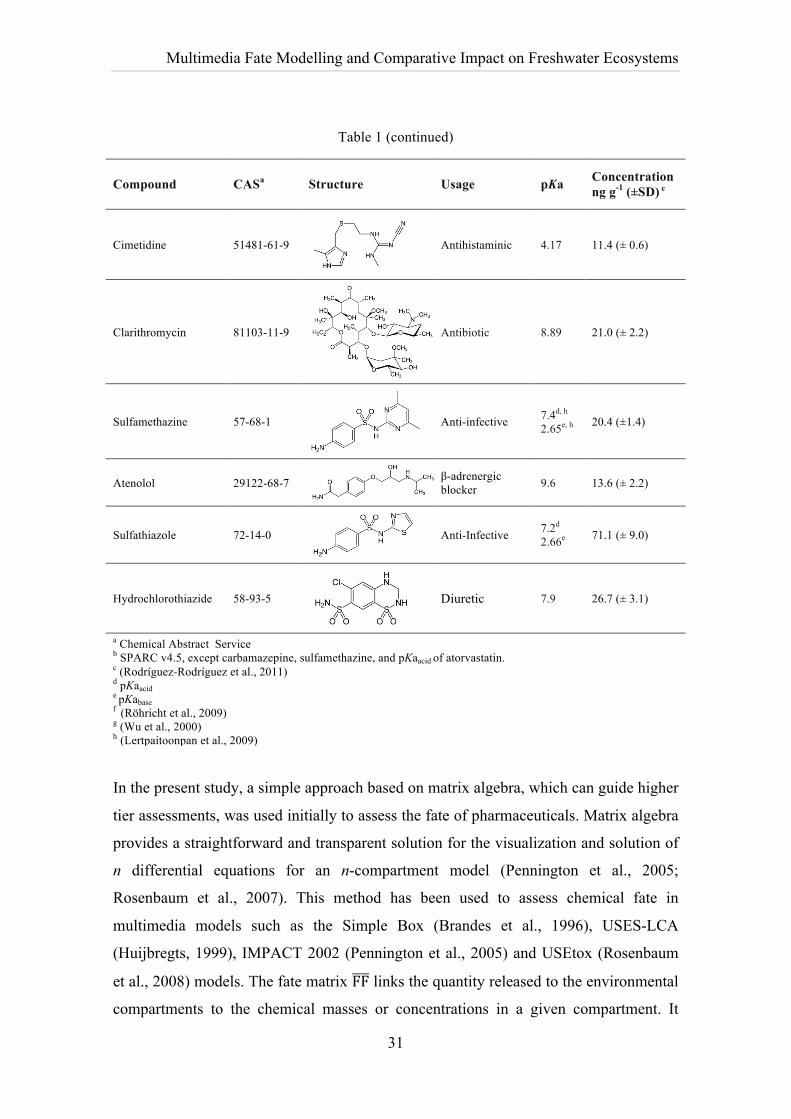
Table 1 (continued)
Compound CASa Structure Usage pKa Concentration ng g-1 (±SD) c
Cimetidine 51481-61-9
Antihistaminic 4.17 11.4 (± 0.6)
Clarithromycin 81103-11-9
Antibiotic 8.89 21.0 (± 2.2)
Sulfamethazine 57-68-1
Anti-infective 7.4d, h
2.65e, h 20.4 (±1.4)
Atenolol 29122-68-7
β-adrenergic blocker 9.6 13.6 (± 2.2)
Sulfathiazole 72-14-0
Anti-Infective 7.2d
2.66e 71.1 (± 9.0)
Hydrochlorothiazide 58-93-5
Diuretic 7.9 26.7 (± 3.1)
a Chemical Abstract Service b SPARC v4.5, except carbamazepine, sulfamethazine, and pKaacid of atorvastatin. c (Rodríguez-Rodríguez et al., 2011) d pKaacid e pKabase f (Röhricht et al., 2009) g (Wu et al., 2000) h (Lertpaitoonpan et al., 2009)
In the present study, a simple approach based on matrix algebra, which can guide higher
tier assessments, was used initially to assess the fate of pharmaceuticals. Matrix algebra
provides a straightforward and transparent solution for the visualization and solution of
n differential equations for an n-compartment model (Pennington et al., 2005;
Rosenbaum et al., 2007). This method has been used to assess chemical fate in
multimedia models such as the Simple Box (Brandes et al., 1996), USES-LCA
(Huijbregts, 1999), IMPACT 2002 (Pennington et al., 2005) and USEtox (Rosenbaum
et al., 2008) models. The fate matrix FF links the quantity released to the environmental
compartments to the chemical masses or concentrations in a given compartment. It
Multimedia Fate Modelling and Comparative Impact on Freshwater Ecosystems
32
accounts for multimedia transport (e.g., air, water, and soil) and loss processes in a
given compartment (e.g., abiotic and biotic degradation or advective transport outside
the modelled scale). A detailed description of the framework applied in this research is
provided in Appendix A, Section A1.
Figure 1: Five-compartment system for the dissipation of pharmaceuticals from biosolids-amended soils. In a given environmental compartment, bold arrows represent intermedia transport rates, dashed arrows represent advective transportation rates out the system, and
double-line arrows represent degradation rates.
2.3.1 Intermedia transport and loss processes
The modelled diffusive intermedia mass transfer mechanisms include absorption of the
chemical from the gaseous phase by water or soil, volatilization from water or soil, and
sorption and desorption to and from biota, soil, sediment and biosolids. These
mechanisms are reversible, while advective mass transfer mechanisms are irreversible.
Chemicals are transported by a physical medium from one compartment to another. The
advective intermedia mass transfer mechanisms include deposition of the chemical
associated with aerosol particles, deposition of the chemical in rainwater, sedimentation
and resuspension of the chemical associated with sediment particles, run-off and erosion
to surface waters. Loss mechanisms include abiotic and biotic degradation, burial in
deep sediment layers, advective transport by plant uptake, advective transport in air and
water out of the modelled region, and leaching to groundwater, which is regarded as a
loss process because groundwater is not part of the system, as modelled in the European
Commission Technical Guidance Document (TGD) on Risk Assessment (EC, 2003).
Multimedia Fate Modelling and Comparative Impact on Freshwater Ecosystems
33
To determine the intermedia transport, leaching, burial, and advective transport rates to
outside the regional scale, equations from the USEtox model were applied (Rosenbaum
et al., 2008). These equations use mass-transfer coefficients, partition coefficients and
environment characteristics as inputs. Mass-transfer coefficients and the environment
characteristics were set according to the EUSES 2.1.1 European regional model (EC,
2004). Experimental data of physic-chemical properties to obtain partition coefficients
of compounds are preferred in present model, except in the cases described in Appendix
A, Section A2. If experimental data was not available, the partition coefficients were
estimated according to the routines described in the same section. For a given
environmental compartment pH, a different degree of anion, cation, and neutral
molecule sorption can be expected; therefore, the applied regressions to estimate solid-
water partition coefficients account for the dissociating properties of pharmaceuticals.
Such approach has been shown to outperform the application of conventional non-polar
partitioning regressions, reducing substantially the uncertainty of ecotoxicity impact
results of indirect emissions to the freshwater compartment (Morais et al., 2013). In the
USEtox model, plant uptake is modelled as a human exposure pathway for non-
dissociating compounds; therefore, it was not applicable in this study. The modelling
description of plant uptake is provided in Appendix A, Section A3.
For degradation in the environment, substance-specific degradation rates are preferred
in the model calculations (Appendix A, Section A4). However, degradation data are
usually lacking for one or more compartments. Therefore, several models and
assumptions were applied in this study. In any environmental compartment, the overall
degradation rate constant is given by the sum of degradation rate constants for the various
transformation processes.
Degradation in air
The most effective elimination process in the troposphere for most substances is
reaction with photochemically generated OH-radicals, although for some substances,
reaction with ozone and nitrate radicals may be also important (EC, 2004).
Volatilization from water and soil surfaces is not expected to be an important fate
process based on estimated Henry's Law constants; therefore, degradation by reaction
with ozone and nitrate radicals and direct photolysis were disregarded. The specific
pseudo-first-order degradation rate constant of a substance with ˙OH radicals (kdeg, air in
Multimedia Fate Modelling and Comparative Impact on Freshwater Ecosystems
34
s-1) was determined by multiplying the compound-specific hydroxyl radical rate
constant (kOH in cm3.molec-1.s-1) to the OH-radical concentration in the atmosphere,
according to EUSES2.0 (EC 2004). The kOH values were estimated using the software
program AOPWIN v1.92a (USEPA 2008). The default [•OH] was 2.0×10⁶ molecules
(radicals)/cm3 for 12 hours of daylight (Atkinson and Arey, 2003).
Degradation in water
The ultimate aerobic biodegradation probabilities in freshwater were estimated using the
Biowin3 model in the software program Biowin v4.10™ (USEPA, 2009). Biowin has
been shown to outperform other models in the predictive screening of a variety of
chemicals (Raymond, Rogers et al. 2001). Biodegradation probabilities were converted
to biodegradation rates (kbiodeg,water in s-1) according to Aronson et al. (Aronson et al.,
2006). For compounds reported as recalcitrant in the literature, half-lives of 180 days
were assigned (Aronson et al., 2006).
Photodegradation rates for pharmaceuticals depend on the intensity of solar irradiation,
eutrophic conditions, water depth, organic matter composition, latitude and season
(Boreen et al., 2003; Vione et al., 2009). Experimental photolysis half-lives based on
the literature may not reflect consistently a regional model due to differences in
experimental conditions, thus introducing uncertainty. Therefore, in the present study,
average full day direct photolysis rates for winter and summer seasons were calculated
by GCSOLAR (USEPA, 1999) for a well-mixed water layer of 50cm thickness (Tixier
et al., 2002), after providing experimental molar absorption coefficients in function of
the UV/VIS wavelength range (ελ, in L.mol-1.cm-1) (Ulvi, 1998; Doll and Frimmel,
2003; Boreen et al., 2004; Werner et al. 2005; Liu and Williams, 2006; Vione et al.,
2009; Yuan et al., 2009; Baeza and Knappe, 2011; Calisto et al., 2011; Razavi et al.,
2011) and quantum yields of pharmaceuticals (Appendix A, Section A4). Absorption
attenuation coefficients of pure water in function of wavelength were assumed for the
water body, as well as a depth of 3 m (EC, 2003), the latitude range of 40°-60°, and
assuming a perfectly clear sky. Ozone layer thickness values were obtained from
satellite data (NASA, 2011).
Indirect photolysis reactions proceed due to the presence of chemical transients such as
hydroxyl, alkyl peroxy, and carbonate radicals, single oxygen, aqueous electrons, and
coloured dissolved organic matter (cDOM) in its excited triplet state, which are
Multimedia Fate Modelling and Comparative Impact on Freshwater Ecosystems
35
generated by natural water constituents and can react with organic compounds. The
hydroxyl radical, ˙OH, is the most reactive of the aforementioned intermediates due to
its non-selective and highly electrophilic nature (Lam and Mabury, 2005) and the only
transient considered in this study, although for some pharmaceuticals other transients
may have a large impact on the rate of degradation (Lam et al., 2003). Bimolecular rate
constants (kOH, in M-1s-1) for the reaction between pharmaceuticals and ˙OH (Appendix
B, Section A4) were converted to pseudo-first order rate constants by multiplication by
the hydroxyl radical concentration (in M). The concentration of ˙OH is reported to be
present at 10-14–10-17 M in surface waters (Lam et al., 2003).
The importance of hydrolysis degradation rates is normally limited for pharmaceuticals
(Khan and Ongerth, 2002). For pharmaceuticals that reach the freshwater compartment,
there is a lack of hydrolysable functional groups, or these compounds are generally
resistant to hydrolysis, or other mechanisms of degradation are the limiting ones
(Lyman et al., 1990; West, 2007; Liu et al., 2009).
Degradation in soil and sediment
The main route for the degradation of pharmaceuticals in soils is aerobic soil
biodegradation (Kümmerer et al., 2005). Division factors of 1:2:9 were used to
extrapolate biodegradation rates from fresh water to the soil and sediment compartments
(kbiodeg, soil and kbiodeg, sed in s-1), respectively, as suggested in the EPI Suite™ and applied
in the USEtox model (Huijbregts et al., 2010). Photodegradation is likely to occur only
in the top layer of the soil surface; hence, the formation and persistence of
photodegradable substances is dependent on farming practices such as the timing and
depth of ploughing (Boxall, 2008), which are virtually impossible to determine. This
degradation route was therefore neglected for the screening purposes of this study.
Degradation in biosolids
Biodegradation is also the primary degradation route for most pharmaceuticals in
biosolids (Wu et al., 2009). Minor impacts from sunlight irradiation on degradation
were reported for 8 pharmaceuticals, including carbamazepine and clarithromycin (Wu
et al., 2008). Presently, the understanding of the effects of the biosolid matrix on the
persistence of compounds in agricultural soils is limited (Monteiro and Boxall, 2009).
Amendment with biosolids increases organic matter and phosphorous content, which
Multimedia Fate Modelling and Comparative Impact on Freshwater Ecosystems
36
have been reported to increase microbial activity (Furczak and Joniec, 2007).
Conversely, studies have shown that high soil organic matter (SOM) content may
inhibit the degradation of organic compounds due to increased adsorption of chemicals
and reduced bioavailabity (Xu et al., 2009a). In addition, SOM may serve as an
alternative nutrition source for microorganisms involved in the degradation (Alvey and
Crowley, 1995). The type of digestion may also influence biodegradation in biosolids
matrices in opposing ways. Monteiro and Boxall (2009) suggested that aerobically
digested biosolids may hasten degradation rates, whereas anaerobically digested
biosolids show opposite effects, possibly as a result of differences in microbial
communities and properties. Moreover, interactions between pharmaceuticals and other
contaminants can affect the fate of pharmaceuticals in biosolids. For example, the
presence of antibacterial compounds, such as sulfamethazine, is likely to reduce
bacterial populations (Thiele-Bruhn and Beck, 2005) and, therefore, influence microbial
degradation. We pragmatically estimated biodegradation rates in biosolids amended to
soils by extrapolation from biodegradation rates in soils and by assessing the influence
of different extrapolation factors on the comparative impact results by Monte Carlo
analysis (Appendix A, Section A6).
2.3.2 Freshwater ecosystem impacts
The impact of a chemical on freshwater ecosystems due to an emission flow from
biosolids-amended soils, EIaqu,b in PAF·m3.d, is given by
EI aqu,b = M b · FF b,fw · FR fw,fw · EF aqua,fw (2.1)
where Mb is the mass emitted from biosolids amended to soils, in kg per kg of dry
weight biosolids, and FFb,fw is the fate factor that represents the mass increase in
freshwater due to an emission flow from biosolids and is estimated by means of the fate
matrix (Appendix A, Section A1). It is equivalent to the fraction transferred from
biosolids to freshwater (fb,fw = FFb,fw/FFfw,fw), multiplied by the residence time in
freshwater (FFfw,fw). FRfw,fw is the environmental exposure factor for freshwater,
equivalent to the fraction of chemical dissolved in freshwater (Appendix A, Section
A5). EFaqua,fw is the ecotoxicity factor in water, which expresses the change in the
Potentially Affected Fraction (PAF) species that experiences an increase in stress for a
change in contaminant concentration, in PAF·m3·kg-1. EFaqua,fw is calculated according
to the AMI method (Jolliet et al. 2003; Payet 2004), which is based on the Hazardous
Multimedia Fate Modelling and Comparative Impact on Freshwater Ecosystems
37
Concentration (HC) of a chemical affecting 50% of a tested species over their chronic
Effect Concentration affecting 50% of tested individuals (EC50), also called HC50EC50.
A detailed description of the procedure used to calculate effect factors is provided in
Appendix A, Section A5. The AMI method may be limited in comparative risk
assessments for pharmaceuticals. This approach and all risk assessments are based on
the effects of single compounds. However, pharmaceutical mixtures have been shown to
exhibit effects different from those of single compounds (Backhaus et al., 2008; Quinn
et al., 2009). Moreover, the ecological relevance of sub-lethal responses is unknown for
some compounds. Particularly, the relevance of non-standard endpoints, which may
introduce bias in the comparative results, is unknown. Furthermore, acute-chronic ratios
are based on industrial chemicals, and although the acute-chronic ratios of
pharmaceuticals for crustacean and algae do not differ from those reported elsewhere
for industrial chemicals, differences of several orders of magnitude were observed
between acute and chronic data in fish for endocrinologically active compounds (Webb,
2004, Han et al., 2010) .
2.3.3 Monte Carlo Analysis
To characterize the comparative impact of pharmaceuticals on freshwater ecosystems,
Monte Carlo analysis was conducted on the impact estimates. The analysis includes 1)
the experimental parameter values (partition coefficients, biodegradation half lives in
water and soil, and bimolecular hydroxyl radical rate constants); the geometric mean
and the geometric standard deviation of experimental values were set as uncertainty
parameters assuming a lognormal distribution; 2) the extrapolation of parameter values
from one compartment to another (biodegradation rates in biosolids); 3) the
uncertainties associated with the regression equations adopted in the model; 4) the
uncertainty of ecotoxicological impact characterization, and 5) the variability of
environmental parameters (pH and fOC of agricultural soil, concentration of hydroxyl
radical in freshwater, and rain rate) and direct photolysis rates. The parameters included
in the Monte Carlo analysis are described in Appendix A, Section A6.
The training and validation sets used to derive the regressions adopted in the model
(estimation of partition coefficients, bioconcentration factors, and biodegradation rates)
were used to derive residual estimation errors between estimated and experimental data.
The mean error and their probability distribution were fit into the regressions as
Multimedia Fate Modelling and Comparative Impact on Freshwater Ecosystems
38
uncertainty parameters. Uncertainty distributions of HC50EC50 values were estimated
according to Payet parametric method (Payet 2004), which is based on the Student
distribution for calculating the confidence interval on the mean. For each
pharmaceutical, the maximum and minimum of the uniformly distributed
photodegradation rate parameter were obtained considering the GCSOLAR results for
the winter and summer seasons, the latitudes of 40 and 60°, and the maximum and
minimum experimental quantum yields.
2.4 Results and discussion
2.4.1 Transport to freshwater compartment
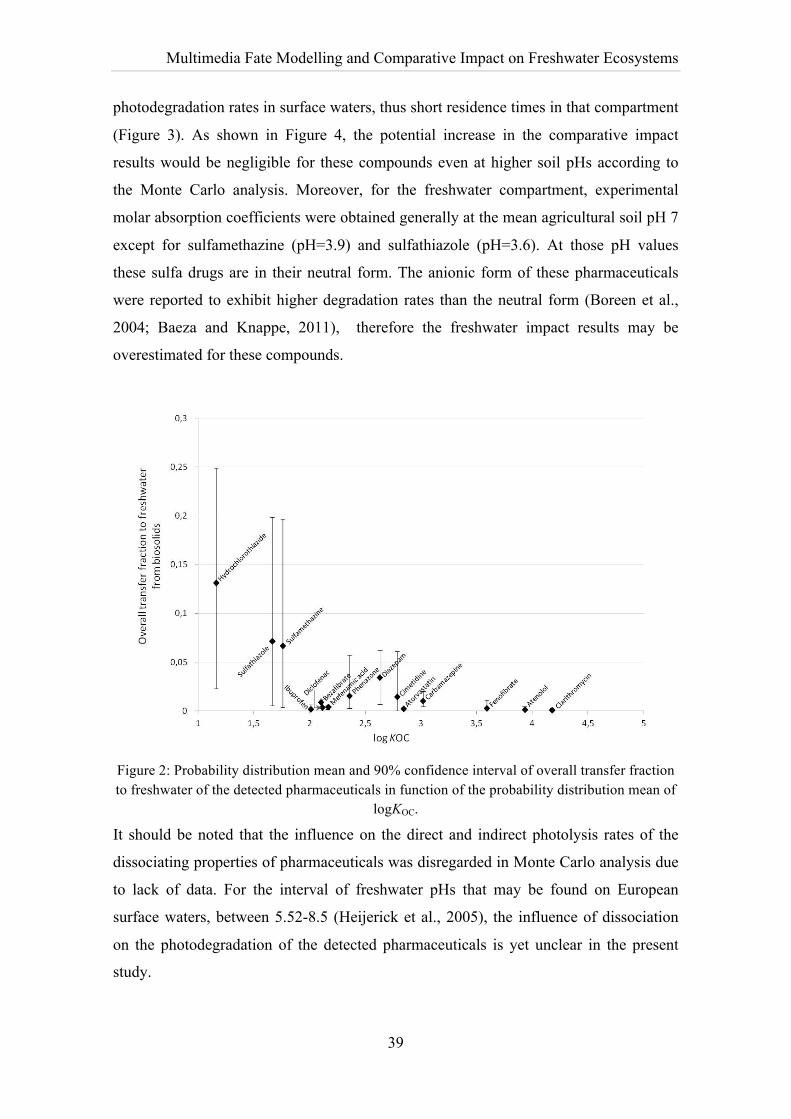
Figure 2 shows the overall transfer fraction of pharmaceuticals to freshwater from
biosolids-amended soils in function of the overall soil-water partitioning coefficient
normalized by the organic carbon content, KOC. Pharmaceuticals with large log KOC
values are strongly sorbed to solid matrices and are less likely to leach and runoff due to
their low availability for transport in the solution phase. Generally, the studied
compounds can be considered to have low mobility in solid matrices. However,
hydrochlorothiazide and the sulfonamides sulfathiazole and sulfamethazine display
moderate retention comparatively to the other compounds. For the mean agricultural
soil pH 7, approximately 11% of hydrochlorothiazide appears in the anionic form,
which displays reduced sorption capacity due to the negatively charged surface of
organic colloids at relevant environmental pH values. Moreover, the neutral form of
hydrochlorothiazide is highly hydrophilic (log KOW = -0.07). The same reasoning is
applied to sulfathiozole, 39% of which appears in the anionic form, and its neutral form
also displays high hydrophilicity (log KOW = 0.72), and to sulfamethazine, 18% in the
anionic form and high hydrophilicity of its neutral form (log KOW = 0.76). A
zwitterionic form of sulfathiozole exists along with the anionic and neutral forms at
agricultural soil pHs (for example, ≈20% at pH 7). The sorption behaviour of this form
could not be estimated by the procedure adopted for the estimation of partition
coefficients.
The mobility of the sulfonamides and of hydrochlorothiazide increase for higher soil
pHs because the fraction of their anionic forms increases accordingly; further, the
electronegativity of colloid surfaces due to ionization of hydroxides and phenolic
groups also increases. However, these compounds display comparatively high
Multimedia Fate Modelling and Comparative Impact on Freshwater Ecosystems
39
photodegradation rates in surface waters, thus short residence times in that compartment
(Figure 3). As shown in Figure 4, the potential increase in the comparative impact
results would be negligible for these compounds even at higher soil pHs according to
the Monte Carlo analysis. Moreover, for the freshwater compartment, experimental
molar absorption coefficients were obtained generally at the mean agricultural soil pH 7
except for sulfamethazine (pH=3.9) and sulfathiazole (pH=3.6). At those pH values
these sulfa drugs are in their neutral form. The anionic form of these pharmaceuticals
were reported to exhibit higher degradation rates than the neutral form (Boreen et al.,
2004; Baeza and Knappe, 2011), therefore the freshwater impact results may be
overestimated for these compounds.
Figure 2: Probability distribution mean and 90% confidence interval of overall transfer fraction to freshwater of the detected pharmaceuticals in function of the probability distribution mean of
logKOC.
It should be noted that the influence on the direct and indirect photolysis rates of the
dissociating properties of pharmaceuticals was disregarded in Monte Carlo analysis due
to lack of data. For the interval of freshwater pHs that may be found on European
surface waters, between 5.52-8.5 (Heijerick et al., 2005), the influence of dissociation
on the photodegradation of the detected pharmaceuticals is yet unclear in the present
study.
Multimedia Fate Modelling and Comparative Impact on Freshwater Ecosystems
40
2.4.2 Probabilistic comparative impact results
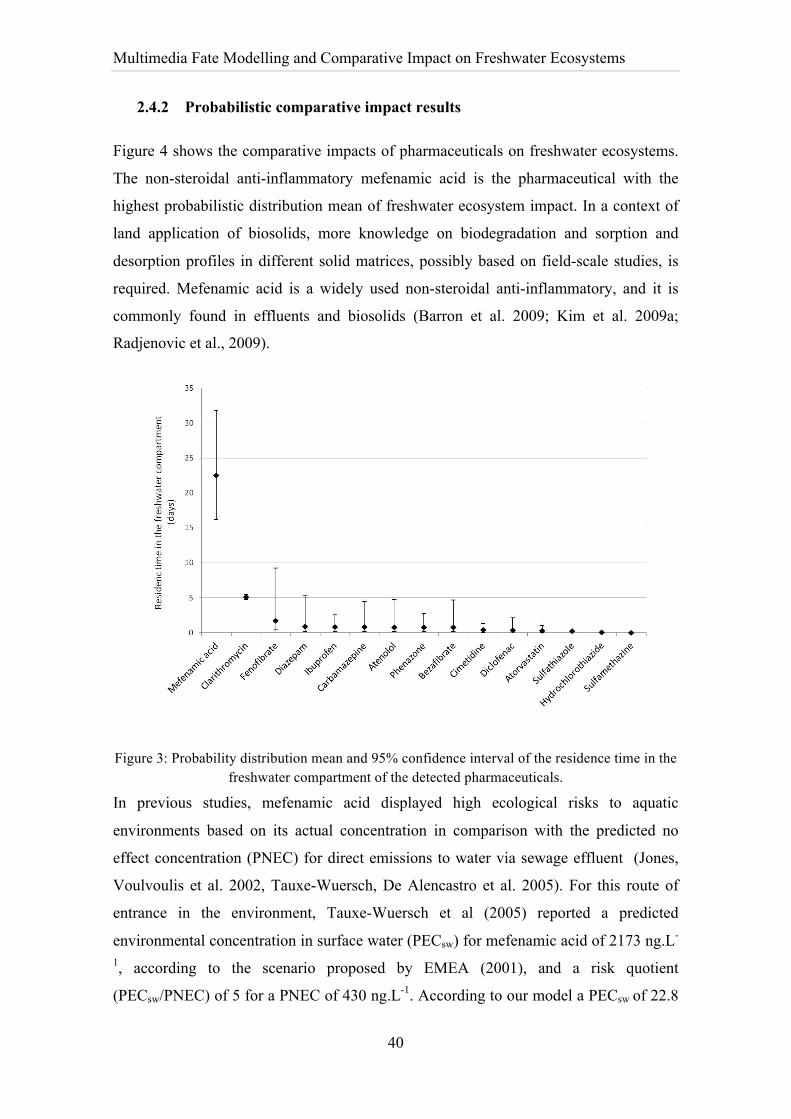
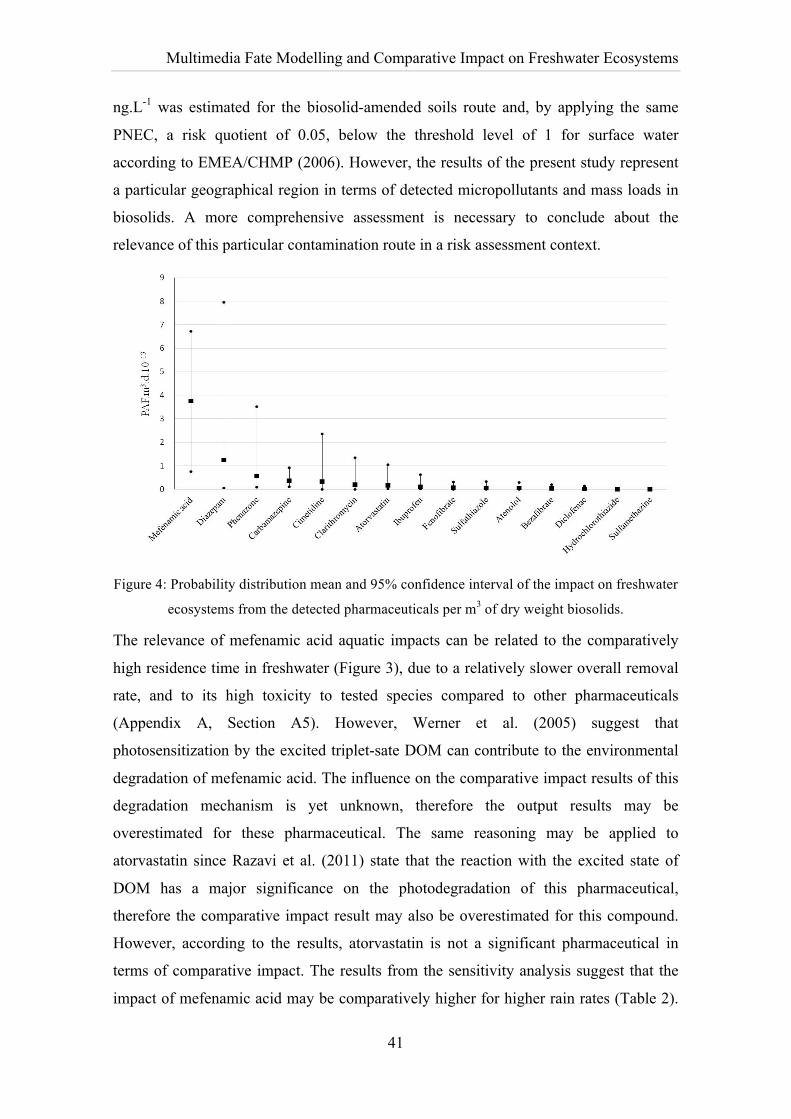
Figure 4 shows the comparative impacts of pharmaceuticals on freshwater ecosystems.
The non-steroidal anti-inflammatory mefenamic acid is the pharmaceutical with the
highest probabilistic distribution mean of freshwater ecosystem impact. In a context of
land application of biosolids, more knowledge on biodegradation and sorption and
desorption profiles in different solid matrices, possibly based on field-scale studies, is
required. Mefenamic acid is a widely used non-steroidal anti-inflammatory, and it is
commonly found in effluents and biosolids (Barron et al. 2009; Kim et al. 2009a;
Radjenovic et al., 2009).
Figure 3: Probability distribution mean and 95% confidence interval of the residence time in the
freshwater compartment of the detected pharmaceuticals.
In previous studies, mefenamic acid displayed high ecological risks to aquatic
environments based on its actual concentration in comparison with the predicted no
effect concentration (PNEC) for direct emissions to water via sewage effluent (Jones,
Voulvoulis et al. 2002, Tauxe-Wuersch, De Alencastro et al. 2005). For this route of
entrance in the environment, Tauxe-Wuersch et al (2005) reported a predicted
environmental concentration in surface water (PECsw) for mefenamic acid of 2173 ng.L-
1, according to the scenario proposed by EMEA (2001), and a risk quotient
(PECsw/PNEC) of 5 for a PNEC of 430 ng.L-1. According to our model a PECsw of 22.8
Multimedia Fate Modelling and Comparative Impact on Freshwater Ecosystems
41
ng.L-1 was estimated for the biosolid-amended soils route and, by applying the same
PNEC, a risk quotient of 0.05, below the threshold level of 1 for surface water
according to EMEA/CHMP (2006). However, the results of the present study represent
a particular geographical region in terms of detected micropollutants and mass loads in
biosolids. A more comprehensive assessment is necessary to conclude about the
relevance of this particular contamination route in a risk assessment context.
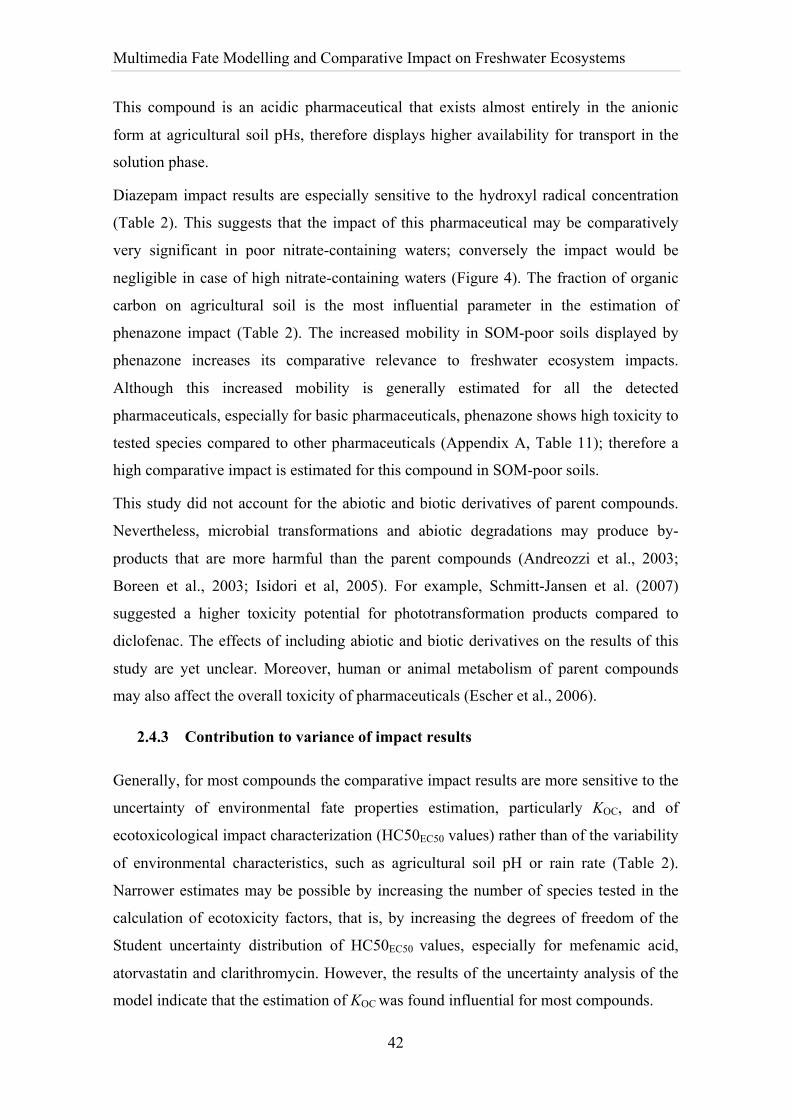
Figure 4: Probability distribution mean and 95% confidence interval of the impact on freshwater
ecosystems from the detected pharmaceuticals per m3 of dry weight biosolids.
The relevance of mefenamic acid aquatic impacts can be related to the comparatively
high residence time in freshwater (Figure 3), due to a relatively slower overall removal
rate, and to its high toxicity to tested species compared to other pharmaceuticals
(Appendix A, Section A5). However, Werner et al. (2005) suggest that
photosensitization by the excited triplet-sate DOM can contribute to the environmental
degradation of mefenamic acid. The influence on the comparative impact results of this
degradation mechanism is yet unknown, therefore the output results may be
overestimated for these pharmaceutical. The same reasoning may be applied to
atorvastatin since Razavi et al. (2011) state that the reaction with the excited state of
DOM has a major significance on the photodegradation of this pharmaceutical,
therefore the comparative impact result may also be overestimated for this compound.
However, according to the results, atorvastatin is not a significant pharmaceutical in
terms of comparative impact. The results from the sensitivity analysis suggest that the
impact of mefenamic acid may be comparatively higher for higher rain rates (Table 2).
Multimedia Fate Modelling and Comparative Impact on Freshwater Ecosystems
42
This compound is an acidic pharmaceutical that exists almost entirely in the anionic
form at agricultural soil pHs, therefore displays higher availability for transport in the
solution phase.
Diazepam impact results are especially sensitive to the hydroxyl radical concentration
(Table 2). This suggests that the impact of this pharmaceutical may be comparatively
very significant in poor nitrate-containing waters; conversely the impact would be
negligible in case of high nitrate-containing waters (Figure 4). The fraction of organic
carbon on agricultural soil is the most influential parameter in the estimation of
phenazone impact (Table 2). The increased mobility in SOM-poor soils displayed by
phenazone increases its comparative relevance to freshwater ecosystem impacts.
Although this increased mobility is generally estimated for all the detected
pharmaceuticals, especially for basic pharmaceuticals, phenazone shows high toxicity to
tested species compared to other pharmaceuticals (Appendix A, Table 11); therefore a
high comparative impact is estimated for this compound in SOM-poor soils.
This study did not account for the abiotic and biotic derivatives of parent compounds.
Nevertheless, microbial transformations and abiotic degradations may produce by-
products that are more harmful than the parent compounds (Andreozzi et al., 2003;
Boreen et al., 2003; Isidori et al, 2005). For example, Schmitt-Jansen et al. (2007)
suggested a higher toxicity potential for phototransformation products compared to
diclofenac. The effects of including abiotic and biotic derivatives on the results of this
study are yet unclear. Moreover, human or animal metabolism of parent compounds
may also affect the overall toxicity of pharmaceuticals (Escher et al., 2006).
2.4.3 Contribution to variance of impact results
Generally, for most compounds the comparative impact results are more sensitive to the
uncertainty of environmental fate properties estimation, particularly KOC, and of
ecotoxicological impact characterization (HC50EC50 values) rather than of the variability
of environmental characteristics, such as agricultural soil pH or rain rate (Table 2).
Narrower estimates may be possible by increasing the number of species tested in the
calculation of ecotoxicity factors, that is, by increasing the degrees of freedom of the
Student uncertainty distribution of HC50EC50 values, especially for mefenamic acid,
atorvastatin and clarithromycin. However, the results of the uncertainty analysis of the
model indicate that the estimation of KOC was found influential for most compounds.
Multimedia Fate Modelling and Comparative Impact on Freshwater Ecosystems
43
Table 2: Contribution of model parameters to impact results variance for each compound. Negative indices indicate that an increase in the parameter is associated with a decrease in the output result. Exp denotes experimental values.
Sensitivity indices for the comparative impact results for each compound (in %)
Ibup
rofe
n
Dic
lofe
nac
Mef
enam
ic a
cid
Phen
azon
e
Bez
afib
rate
Feno
fibra
te
Ato
rvas
tatin
Dia
zepa
m
Car
bam
azep
ine
Cim
etid
ine
Cla
rithr
omyc
in
Sulfa
met
hazi
ne
Ate
nolo
l
Sulfa
thia
zole
Hyd
roch
loro
thia
zide
Parameter
kbiodeg, water - 0.0 - -1.6 -0.5 -1.5 -11.6 - - -0.8 -3.7 -0.3 -9.2 -0.5 0.0 kbiodeg, soil - - 0.0 -4.1 0.0 0.0 -0.2 -4.1 - 0.0 -0.2 0.0 -0.1 -0.2 0.0 kbiodeg, biosolids -2.4 -0.1 0.0 -0.2 0.0 -1.0 -1.4 0.0 0.0 -0.2 -1.7 0.0 -1.0 0.0 -1.0 kphotodegradation, water 0.0 -33.4 -5.6 -0.1 0.0 - -2.4 0.0 0.0 - -6.7 -40.8 0.0 -45.1 -66.6 KOW (KOWWIN v1.67a) - - - - 0.0 0.0 0.0 - - 0.0 - -3.6 -4.9 - -0.3 KOC (KOCWIN v2.0) - - - - - -85.9 - - - -66.7 - - - -0.7 -3.9 KOC (acids regression) - -45.9 -30.3 - -22.7 - - - - - - -30.9 - -42.8 -20.5 KOC (bases regression) - - - -0.1 - - - - - -1.8 -62.2 - -55.2 - - BCFfish (BCFBAF v3.00) - - - - - 0.0 - - 0.0 - - - - - - BCFfish (acids regression) 0.0 0.0 0.0 - 0.0 - 0.0 - - - - 0.0 - 0.0 -0.1 BCFfish (bases regression) - - - 0.0 - - - 0.0 - 0.0 0.0 - 0.0 - - HC50EC50 -12.3 -12.8 -25.2 0.0 -3.3 -4.6 -51.9 -8.5 -4.6 -1.2 -20.8 -6.9 -11.1 0.0 0.0 exp KOC 0.0 - - 0.0 - - 0.0 -3.9 -1.2 - - - - - - exp kbiodeg, water 0.0 - -0.8 - - - - - 0.0 - - - - - - exp kbiodeg, soil -66.9 0.0 - - - - - - 0.0 - - - - - exp kOH, water 0.0 - - 0.0 -0.8 0.0 0.0 -1.0 -9.9 0.0 - - 0.0 - 0.0 [˙OH] in water 0.0 - - 0.0 -69.3 0.0 0.0 -68.9 -60.4 0.0 - - -14.5 - 0.0 pH agricultural soil 0.0 2.6 10.0 0.0 0.9 0.0 0.0 0.0 - -18.3 0.0 9.6 0.0 1.8 -1.0 foc agricultural soil -17.4 -5.1 -4.7 -91.0 -2.4 -5.9 -23.7 -14.1 -23.8 -9.8 -4.8 -7.5 -3.8 -8.6 -6.5 Rain rate 0.4 0.0 22.5 2.7 0.0 0.9 8.7 0.0 0.0 0.0 0.0 0.0 0.0 0.0 0.0
Multimedia Fate Modelling and Comparative Impact on Freshwater Ecosystems
44
This suggests the limited predictive power of the regressions used to describe the pH
dependence of the KOC of dissociating compounds, at least in the particular context of
this study, particularly in case of basic pharmaceuticals with like clarithromycin and
atenolol. The driving force behind the strong sorption of cations may be electrical
attraction since, at the same lipophilicity, the sorption of cations is stronger than of
neutral bases, making it unlikely that the process behind is lipophilic sorption (Franco
and Trapp, 2008). These regressions are not sufficiently accurate to predict pH-
dependent sorption of organic bases because they suffer from the following limitations:
1) they do not consider unusual ratios of organic carbon to clay or other adsorbent
materials because the method assumes correlated amounts of clay and organic carbon;
2) they do not address the effects of complexation, i.e. the binding of organic ions to
ligands of opposite charge, and 3) they consider the impact of pH on the speciation of
the molecule (sorbate), but they do not consider the impact on the soil surface chemistry
(sorbent), where the surface of organic colloids is negatively charged because of
ionization of hydroxides and phenolic groups. The more complex behaviour of bases and the difficulty of improving model predictions have already been observed (Kah and Brown, 2007; Franco et al., 2009). It should be noted that others sources of uncertainty
not included in the analysis may be important. Issues such as the influence on the direct
and indirect photolysis rates of the dissociating properties of pharmaceuticals, already
referred in Section 2.4.1, the acute-to-chronic data extrapolation, and the application of
a linear dose-response curve for aquatic ecotoxicity effect factors calculation are yet
unclear in the present study regarding their uncertainty. Moreover, the assumption of
homogenous compartments for such complex media as soil or water represents a further
uncertainty, as a chemical entering these compartments is assumed to immediately
dilute perfectly within the volume.
2.5 Conclusions
Treatment lines in conventional WWTPs do not adequately remove PhACs. These
microcontaminants are found not only in the aqueous phase but also in the solid phase.
The application of biosolids to land represents another input to the environment. This
study modelled the environmental fate and ranked the potential impact on aquatic
ecosystems of pharmaceuticals, accounting for their dissociating properties, detected
and quantified in biosolids which are used as soil amendments on agricultural fields.

Multimedia Fate Modelling and Comparative Impact on Freshwater Ecosystems
45
Generally, the pharmaceuticals were considered to have low mobility in the regional EU
model. The detected sulfonamides and hydrochlorothiazide displayed comparative
moderate retention in solid matrices and, therefore, higher transfer fractions from
biosolids to the freshwater compartment. However, the residence times of these
pharmaceuticals in freshwater were estimated to be short due to abiotic degradation
processes. The non-steroidal anti-inflammatory mefenamic acid had the highest
probabilistic distribution mean of freshwater ecosystem impact and warrants further
investigation.
The estimation of the solid-water partitioning coefficient was generally the most
influential parameter of the probabilistic comparative impact assessment. Nevertheless
the addition of estimated uncertainties, pharmaceuticals of greater potential of concern
may be identified, depending on the geographical conditions of pollutant mass loads in
biosolids, as well as the most sensitive fate processes.
This approach, starting from the most complex route in terms of fate modelling,
pretends to be straightforward and transparent solution that can be applied to all routes
of entrance in the environment of micropollutants, probably more relevant in terms of
ecological risk. In this trend, it should be noted that freshwater ecosystem impacts of
micropollutants in case of using reclaimed effluent water in agricultural soils can be
assessed with Equation 1 by applying the fate factor to freshwater from an emission to
agricultural soil, FFag,fw, calculated by means of the fate matrix in Appendix A, Section
A1. Likewise, freshwater ecosystem impacts of pharmaceuticals in wastewater
treatment effluents can be assessed by applying FFfw,fw. Moreover, the overall
procedure is consistent with life cycle impact assessment methods (LCIA), such as
USEtox, and can be adapted for life cycle assessment purposes. Advanced effluent
treatments and alternative biosolids applications can also be compared by means of
LCA, as well as the entire life cycle of a pharmaceutical can be compared with that of
new chemical designs.
2.6 Acknowledgements
Sérgio Alberto Morais is grateful to FCT-Fundação para a Ciência e a Tecnologia for a
Ph.D. grant (SFRH/BD/64599/2009). This work was supported by the Spanish Ministry
of Science and Innovation (project CTQ2010-21776-C02-01) and by Portuguese FCT-
Fundação para a Ciência e Tecnologia, through project PTDC/ECM/103141/2008. The
Multimedia Fate Modelling and Comparative Impact on Freshwater Ecosystems
46
Department of Chemical Engineering of the Universitat Autònoma de Barcelona is the
Unit of Biochemical Engineering of the Centre de Referència en Biotecnologia de la
Generalitat de Catalunya. Xavier Gabarrell and Paqui Blánquez are members of the
Consolidated Research Group of Catalonia (2009-SGR-1505 and 2009-SGR-656
respectively).
Uncertainty Analysis Prioritisation Direct Emissions
47
3. Accounting for the dissociating properties of organic chemicals in LCIA: an uncertainty analysis applied to micropollutants in the
assessment of freshwater ecotoxicity This paper was published in Journal of Hazardous Materials, volumes 248-249, pages
461-468, under the same title.
Additional authors are Cristina Delerue-Matosa and Xavier Gabarrellb,c. aREQUIMTE/Instituto Superior de Engenharia do Porto (ISEP), Rua Dr. António
Bernardino de Almeida, 431 4200-072, Porto, Portugal. bSosteniPrA (UAB-IRTA-Inèdit), Institut de Ciència i Tecnologia Ambientals (ICTA),
Universitat Autònoma de Barcelona (UAB), 08193 Bellaterra, Barcelona, Spain. cDepartament d’Enginyeria Química, Escola d’Enginyeria, Universitat Autònoma de
Barcelona (UAB), 08193 Bellaterra, Barcelona, Spain.
3.1 Abstract
In Life Cycle Impact Assessment (LCIA) models, the sorption of the ionic fraction of
dissociating organic chemicals is not adequately modelled because conventional non-
polar partitioning models are applied. Therefore, high uncertainties are expected when
modelling the mobility, as well as the bioavailability for uptake by exposed biota and
degradation, of dissociating organic chemicals. Alternative regressions that account for
the ionized fraction of a molecule to estimate fate parameters were applied to the
USEtox model. The most sensitive model parameters in the estimation of
ecotoxicological Characterization Factors (CFs) of micropollutants were evaluated by
Monte Carlo analysis in both the default USEtox model and the alternative approach.
Negligible differences of CFs values and 95% confidence limits between the two
approaches were estimated for direct emissions to the freshwater compartment; however
the default USEtox model overestimates CFs and the 95% confidence limits of basic
compounds up to three orders and four orders of magnitude, respectively, relatively to
the alternative approach for emissions to the agricultural soil compartment. For three
emission scenarios, LCIA results show that the default USEtox model overestimates
freshwater ecotoxicity impacts for the emission scenarios to agricultural soil by one
Accounting for the dissociating properties of organic chemicals in LCIA
48
order of magnitude, and larger confidence limits were estimated, relatively to the
alternative approach.
Keywords: USEtox, LCA, Freshwater ecotoxicity, Micropollutants; Dissociating
organics, Risk Assessment
3.2 Introduction
Sorption of chemicals released to the environment to solid surfaces is a dominating
process driving their distribution in soil, surface waters and sediments. Therefore, the
solid-water partitioning coefficient, Kd, is a key parameter to model the mobility and
fate of chemicals in the environment. Many transport processes in environmental
systems, as well as bioavailability for uptake by exposed biota and degradation, are
directly related to Kd. Experimental Kd values are often not available in the literature.
For example, in the USEtox LCIA model eighty-three percent of the chemicals present
in the organic chemicals database have estimated Kd values. The estimation of this
parameter in LCIA models, such as IMPACT2002+, USES-LCA, EDIP 2003 or
USEtox, is based on conventional non-polar partitioning models correlated only to the
octanol–water partition coefficient, KOW, that do not adequately model the mechanism
of sorption of dissociating organic chemicals to organic colloids in soil, which consists
of organic matter and inorganic clay minerals. These correlations are particularly true
for lipophilic compounds, however, the driving force behind the sorption of cations may
be electrical attraction to the negatively charged sorption sites in soil since, at the same
lipophilicity, the sorption of cations is stronger than of neutral bases, making it unlikely
that the process behind is lipophilic sorption (Franco and Trapp, 2008). Recently, Droge
and Gross (2012) cited an ample number of recent studies that have shown that the
dominant sorption process for organic cations is cation-exchange at negatively charged
sorption sites in natural organic matter and whole soils/sediments. The sorption of
anions generally is moderate but not negligible, even for very hydrophilic anions
(Franco et al., 2009). Therefore, a different degree of anion, cation, and neutral
molecule sorption can be expected, with cations showing the highest potential for
sorption. Moreover, other fate parameters depend upon the dissociation of the molecule,
such as the Bioconcentration Factors (BFs) or the partitioning coefficient between
dissolved organic carbon and water, KDOC.
Uncertainty Analysis Prioritisation Direct Emissions
49
In the USEtox model (Rosenbaum et al., 2008), an ecotoxicological Characterization
Factor (CF) of a chemical in freshwater is the product between a fate factor, that
represents the persistence in the environment described by processes such as
degradation and inter-compartment transfer, an exposure factor, that represents the
bioavalability (i.e, the fraction of chemical dissolved in the freshwater compartment),
and an effect factor. Twenty-one percent of chemicals in the USEtox organics database
are fifty percent or more in ionic phase at physiological pH (i.e., acids pKa < 7.4, bases
pKa > 7.4). Therefore, CFs of these chemicals are labelled in the model as interim
whereas relatively high uncertainty is expected. Moreover, forty-five percent of
chemicals, at least those for which pKa values are available, suffer any degree of
dissociation at the environmental pH interval of the model’s continental scale (3.2-8.5
(Reuter et al., 2008)).
The aims of this study were 1) to apply to the USEtox model alternative regressions that
account for the ionized fraction of a molecule to estimate fate parameters 2) to identify
the most sensitive model parameters in the estimation of CFs by Monte Carlo analysis
in both the default USEtox model and the alternative approach, and 3) to propagate
uncertainties and compare both approaches in the impact assessment of different
emissions scenarios to different environmental compartments.
3.3 Methodology
Three emission scenarios to freshwater were considered in the this study: a) direct
emission to the freshwater compartment of a Wastewater treatment plant (WWTP)
effluent, b) direct emission to agricultural soil by using WWTP effluent as reclaimed
water, and c) emission to agricultural soil by using WWTP biosolids as soil amendment.
The inventory data were gathered from a Neptune FP6 Project report [(Larsen et al.
2010a) (Appendix B, Table 13). It contains twenty micropollutants, thirteen of which
are acidic compounds, six basic compounds and one neutral compound
(carbamazepine). For the biosolids-amended soil scenario, in order to account for
differences in the sorption, desorption, and degradation of compounds between the
biosolid and soil matrices, the biosolids-amended soil compartment was modelled as a
biosolids compartment nested in the agricultural soil compartment (Figure 1).
The multimedia model USEtox was chosen in the present study because it results from a
consensus building effort, under the auspices of UNEP and SETAC, amongst modellers
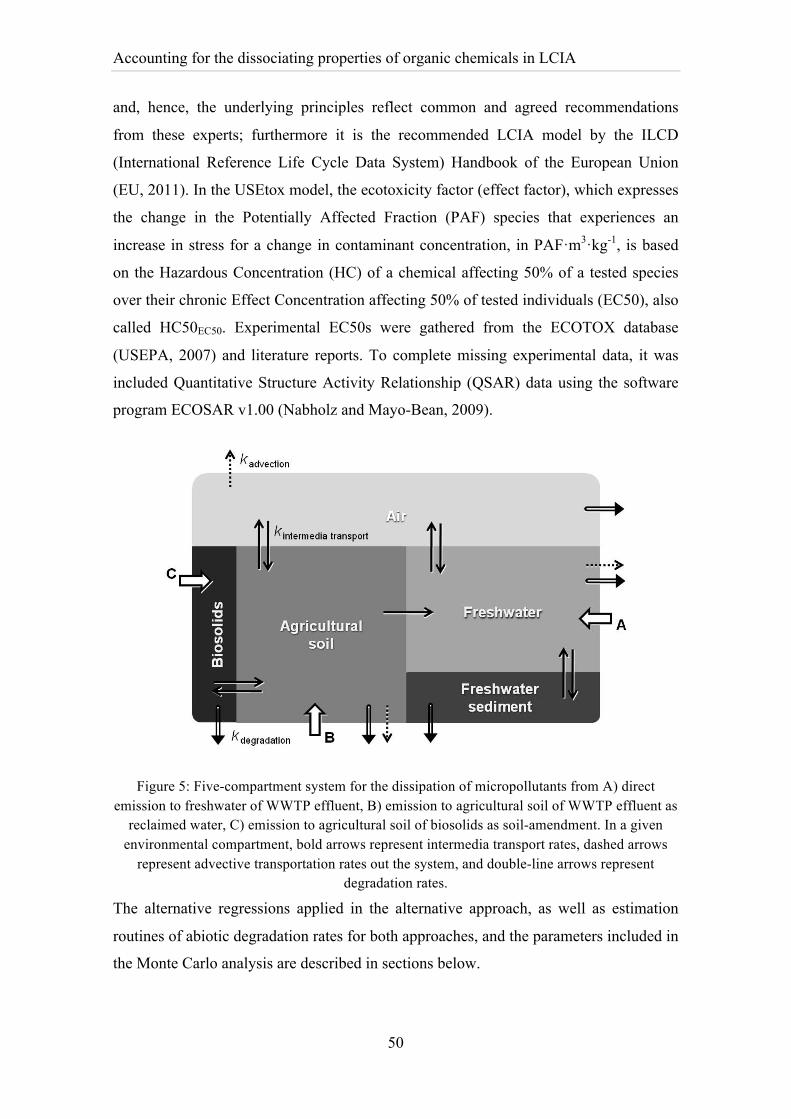
Accounting for the dissociating properties of organic chemicals in LCIA
50
and, hence, the underlying principles reflect common and agreed recommendations
from these experts; furthermore it is the recommended LCIA model by the ILCD
(International Reference Life Cycle Data System) Handbook of the European Union
(EU, 2011). In the USEtox model, the ecotoxicity factor (effect factor), which expresses
the change in the Potentially Affected Fraction (PAF) species that experiences an
increase in stress for a change in contaminant concentration, in PAF·m3·kg-1, is based
on the Hazardous Concentration (HC) of a chemical affecting 50% of a tested species
over their chronic Effect Concentration affecting 50% of tested individuals (EC50), also
called HC50EC50. Experimental EC50s were gathered from the ECOTOX database
(USEPA, 2007) and literature reports. To complete missing experimental data, it was
included Quantitative Structure Activity Relationship (QSAR) data using the software
program ECOSAR v1.00 (Nabholz and Mayo-Bean, 2009).
Figure 5: Five-compartment system for the dissipation of micropollutants from A) direct emission to freshwater of WWTP effluent, B) emission to agricultural soil of WWTP effluent as
reclaimed water, C) emission to agricultural soil of biosolids as soil-amendment. In a given environmental compartment, bold arrows represent intermedia transport rates, dashed arrows
represent advective transportation rates out the system, and double-line arrows represent degradation rates.
The alternative regressions applied in the alternative approach, as well as estimation
routines of abiotic degradation rates for both approaches, and the parameters included in
the Monte Carlo analysis are described in sections below.
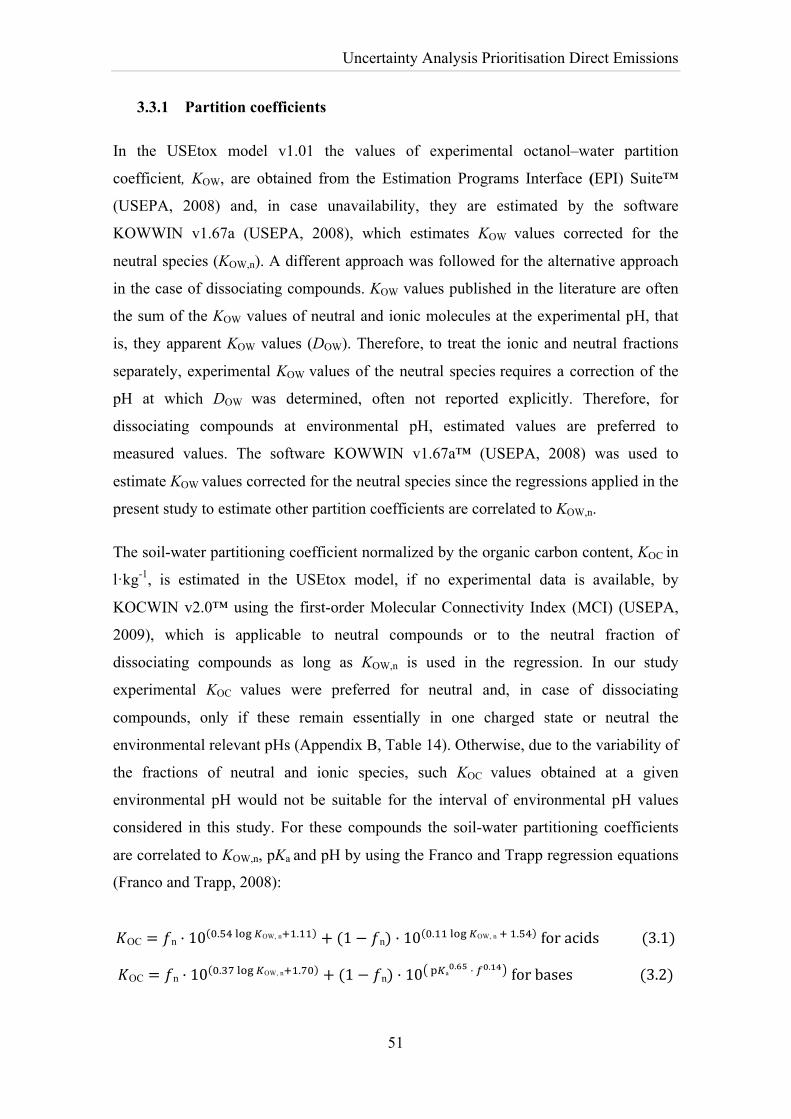
Uncertainty Analysis Prioritisation Direct Emissions
51
3.3.1 Partition coefficients
In the USEtox model v1.01 the values of experimental octanol–water partition
coefficient, KOW, are obtained from the Estimation Programs Interface (EPI) Suite™
(USEPA, 2008) and, in case unavailability, they are estimated by the software
KOWWIN v1.67a (USEPA, 2008), which estimates KOW values corrected for the
neutral species (KOW,n). A different approach was followed for the alternative approach
in the case of dissociating compounds. KOW values published in the literature are often
the sum of the KOW values of neutral and ionic molecules at the experimental pH, that
is, they apparent KOW values (DOW). Therefore, to treat the ionic and neutral fractions
separately, experimental KOW values of the neutral species requires a correction of the
pH at which DOW was determined, often not reported explicitly. Therefore, for
dissociating compounds at environmental pH, estimated values are preferred to
measured values. The software KOWWIN v1.67a™ (USEPA, 2008) was used to
estimate KOW values corrected for the neutral species since the regressions applied in the
present study to estimate other partition coefficients are correlated to KOW,n.
The soil-water partitioning coefficient normalized by the organic carbon content, KOC in
l·kg-1, is estimated in the USEtox model, if no experimental data is available, by
KOCWIN v2.0™ using the first-order Molecular Connectivity Index (MCI) (USEPA,
2009), which is applicable to neutral compounds or to the neutral fraction of
dissociating compounds as long as KOW,n is used in the regression. In our study
experimental KOC values were preferred for neutral and, in case of dissociating
compounds, only if these remain essentially in one charged state or neutral the
environmental relevant pHs (Appendix B, Table 14). Otherwise, due to the variability of
the fractions of neutral and ionic species, such KOC values obtained at a given
environmental pH would not be suitable for the interval of environmental pH values
considered in this study. For these compounds the soil-water partitioning coefficients
are correlated to KOW,n, pKa and pH by using the Franco and Trapp regression equations
(Franco and Trapp, 2008):
𝐾OC = 𝑓n · 10 !.!" !"# !OW, n!!.!! + (1− 𝑓n) · 10 !.!! !"# !OW, n ! !.!" for acids (3.1)
𝐾OC = 𝑓n · 10 !.!" !"# !OW, n!!.!" + (1− 𝑓n) · 10 !!a!.!" · !!.!" for bases (3.2)
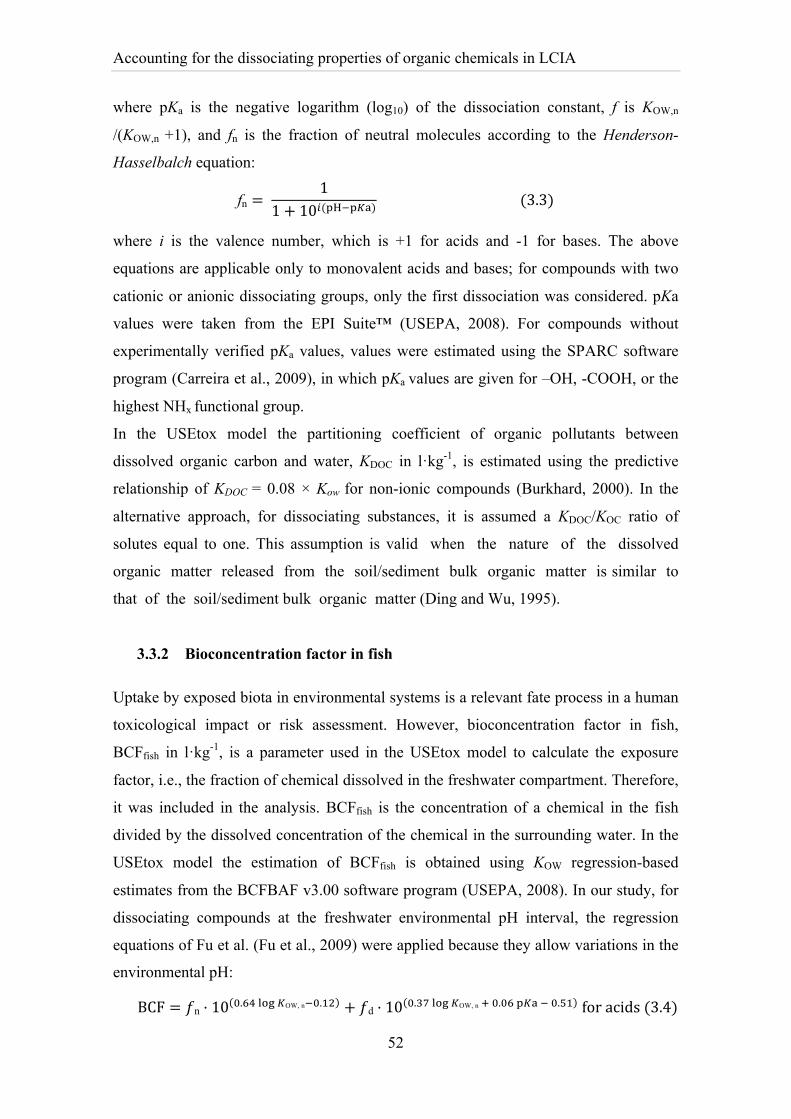
Accounting for the dissociating properties of organic chemicals in LCIA
52
where pKa is the negative logarithm (log10) of the dissociation constant, f is KOW,n
/(KOW,n +1), and fn is the fraction of neutral molecules according to the Henderson-
Hasselbalch equation:
fn = 1
1+ 10!(!"!!!!) (3.3)
where i is the valence number, which is +1 for acids and -1 for bases. The above
equations are applicable only to monovalent acids and bases; for compounds with two
cationic or anionic dissociating groups, only the first dissociation was considered. pKa
values were taken from the EPI Suite™ (USEPA, 2008). For compounds without
experimentally verified pKa values, values were estimated using the SPARC software
program (Carreira et al., 2009), in which pKa values are given for –OH, -COOH, or the
highest NHx functional group.
In the USEtox model the partitioning coefficient of organic pollutants between
dissolved organic carbon and water, KDOC in l·kg-1, is estimated using the predictive
relationship of KDOC = 0.08 × Kow for non-ionic compounds (Burkhard, 2000). In the
alternative approach, for dissociating substances, it is assumed a KDOC/KOC ratio of
solutes equal to one. This assumption is valid when the nature of the dissolved
organic matter released from the soil/sediment bulk organic matter is similar to
that of the soil/sediment bulk organic matter (Ding and Wu, 1995).
3.3.2 Bioconcentration factor in fish
Uptake by exposed biota in environmental systems is a relevant fate process in a human
toxicological impact or risk assessment. However, bioconcentration factor in fish,
BCFfish in l·kg-1, is a parameter used in the USEtox model to calculate the exposure
factor, i.e., the fraction of chemical dissolved in the freshwater compartment. Therefore,
it was included in the analysis. BCFfish is the concentration of a chemical in the fish
divided by the dissolved concentration of the chemical in the surrounding water. In the
USEtox model the estimation of BCFfish is obtained using KOW regression-based
estimates from the BCFBAF v3.00 software program (USEPA, 2008). In our study, for
dissociating compounds at the freshwater environmental pH interval, the regression
equations of Fu et al. (Fu et al., 2009) were applied because they allow variations in the
environmental pH:
BCF = 𝑓n · 10 !.!" !"# !OW, n!!.!" + 𝑓d · 10 !.!" !"# !OW, n ! !.!" !!! ! !.!" for acids (3.4)
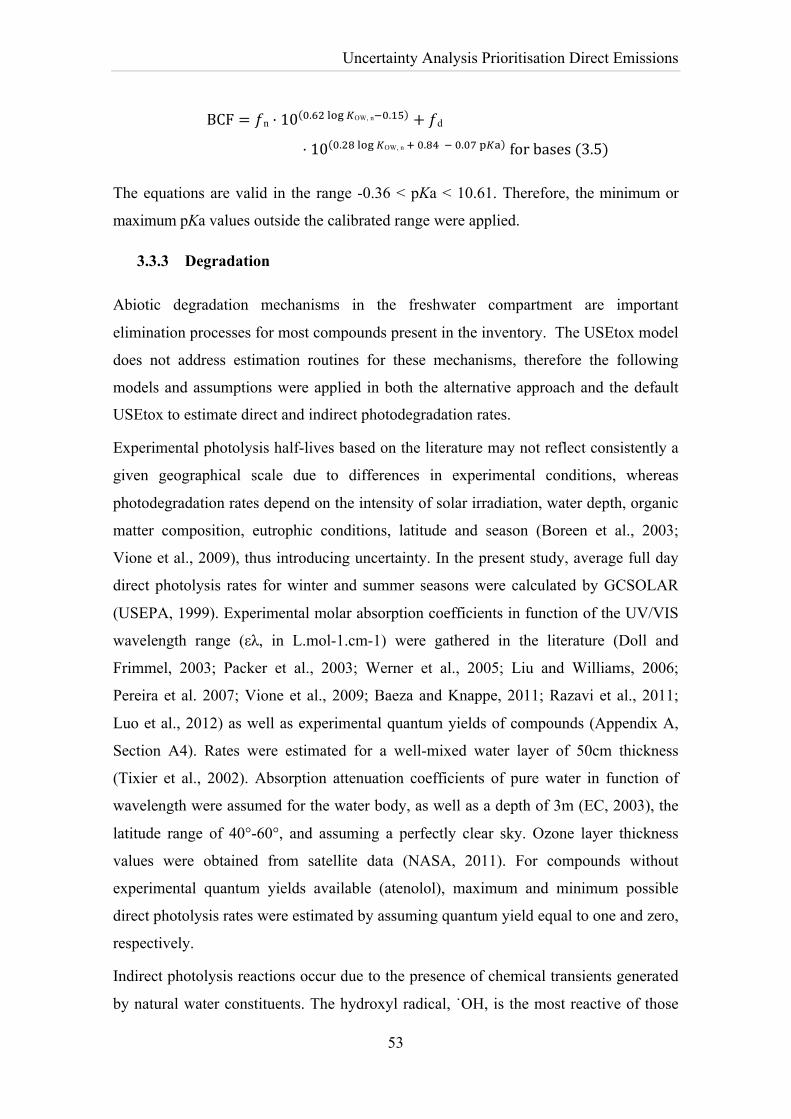
Uncertainty Analysis Prioritisation Direct Emissions
53
BCF = 𝑓n · 10 !.!" !"# !OW, n!!.!" + 𝑓d
· 10 !.!" !"# !OW, n ! !.!" ! !.!" !!! for bases (3.5)
The equations are valid in the range -0.36 < pKa < 10.61. Therefore, the minimum or
maximum pKa values outside the calibrated range were applied.
3.3.3 Degradation
Abiotic degradation mechanisms in the freshwater compartment are important
elimination processes for most compounds present in the inventory. The USEtox model
does not address estimation routines for these mechanisms, therefore the following
models and assumptions were applied in both the alternative approach and the default
USEtox to estimate direct and indirect photodegradation rates.
Experimental photolysis half-lives based on the literature may not reflect consistently a
given geographical scale due to differences in experimental conditions, whereas
photodegradation rates depend on the intensity of solar irradiation, water depth, organic
matter composition, eutrophic conditions, latitude and season (Boreen et al., 2003;
Vione et al., 2009), thus introducing uncertainty. In the present study, average full day
direct photolysis rates for winter and summer seasons were calculated by GCSOLAR
(USEPA, 1999). Experimental molar absorption coefficients in function of the UV/VIS
wavelength range (ελ, in L.mol-1.cm-1) were gathered in the literature (Doll and
Frimmel, 2003; Packer et al., 2003; Werner et al., 2005; Liu and Williams, 2006;
Pereira et al. 2007; Vione et al., 2009; Baeza and Knappe, 2011; Razavi et al., 2011;
Luo et al., 2012) as well as experimental quantum yields of compounds (Appendix A,
Section A4). Rates were estimated for a well-mixed water layer of 50cm thickness
(Tixier et al., 2002). Absorption attenuation coefficients of pure water in function of
wavelength were assumed for the water body, as well as a depth of 3m (EC, 2003), the
latitude range of 40°-60°, and assuming a perfectly clear sky. Ozone layer thickness
values were obtained from satellite data (NASA, 2011). For compounds without
experimental quantum yields available (atenolol), maximum and minimum possible
direct photolysis rates were estimated by assuming quantum yield equal to one and zero,
respectively.
Indirect photolysis reactions occur due to the presence of chemical transients generated
by natural water constituents. The hydroxyl radical, ˙OH, is the most reactive of those
Accounting for the dissociating properties of organic chemicals in LCIA
54
intermediates due to its non-selective and highly electrophilic nature (Lam and Mabury,
2005) and the only transient considered in this study. Pseudo-first order rates were
calculated by multiplying bimolecular rate constants (kOH, in M-1s-1) for the reaction
with ˙OH (Appendix B, Table 14) by the hydroxyl radical concentration, reported to be
present at 10-14–10-17 M in surface waters (Lam et al., 2003).
Currently, the understanding of the effects of the biosolid matrix on the persistence of
compounds in agricultural soils is limited (Monteiro and Boxall, 2009), therefore, for
the scenario of emission to agricultural soil from biosolids application as soil
amendment, biodegradation rates in biosolids were estimated by extrapolation from
biodegradation rates in soils. The calculation of the probabilistic characterization factors
includes an interval of extrapolation factors (Table 3).
3.3.4 Monte Carlo Analysis
Monte Carlo analysis was conducted on the estimation of characterization factors in
both approaches. The parameters included in the Monte Carlo analysis are described in
Table 3. The analysis includes:
1) the variability of environmental parameters (fraction of organic carbon, fOC, in
agricultural soil, pH of freshwater and agricultural soil, concentration of
hydroxyl radical in freshwater, and rain rate) and of direct photolysis rates in the
USEtox continental scale.
2) the uncertainty of ecotoxicological impact characterization. Uncertainty
distributions of HC50EC50 values were estimated according to Payet parametric
method (Payet 2004) which is based on the Student distribution for calculating
the confidence interval on the mean.
3) the uncertainties associated with the regression equations adopted in the model
to estimate partition coefficients, BCFs and biodegradation rates.
4) the extrapolation of parameter values from one compartment to another
(biodegradation rates in biosolids) and from other parameter values (KDOC from
KOC).
5) The experimental parameter values (partition coefficients, biodegradation half
lives in water and soil, and bimolecular hydroxyl radical rate constants). The
geometric mean and the geometric standard deviation of experimental values
were set as uncertainty parameters assuming a lognormal distribution.
Uncertainty Analysis Prioritisation Direct Emissions
55
The training and validation sets used to derive the regressions adopted in the model
were used to derive residual estimation errors between estimated and experimental data
(Franco and Trapp, 2008; USEPA, 2008; Fu et al., 2009; USEPA, 2009). The training
and validation sets of Franco and Trapp (Franco and Trapp, 2008) used to derive
regression to predict KOC of acids and bases were used to generate residual estimation
errors of the KOCWIN software applied to dissociating substances in the default
USEtox model (parameters a6 and a7 in Table 3). Likewise, the training and validation
sets of Fu et al. (Fu et al., 2009) used to derive regression to predict BCFfish of acids and
bases were used to generate residual estimation errors of the BCFBAF software applied
to dissociating substances in the default USEtox model (parameters a11 and a12 in
Table 3). The mean error and their probability distribution were fit into the regressions
as uncertainty parameters (parameters a3 to a15 in Table 3). It should be noted that
experimental KOC values on the Franco and Trapp training and validation sets were
obtained at the pH 4.5 for bases and 5.8 for acids. Nevertheless, it is assumed constant
uncertainty parameters for the environmental pH interval. Experimental biodegradation
rates gathered in the literature of micropollutants were used to derive residual estimation
errors of the procedure adopted in USEtox to estimate biodegradation rates.
In the USEtox model, uncertainty parameters on the estimation of the partitioning
coefficient between dissolved organic carbon and neutral organic pollutants in water,
KDOC in l·kg-1, are provided by Burkhard (Burkhard, 2000). For dissociating substances,
it is assumed a KDOC/KOC ratio of solutes equal to one. However, if the dissolved
organic matter is more hydrophilic than the soil/sediment bulk organic matter,
they tend to escape from soil/sediment particles to the aqueous phase, and the
ratios of KDOC/KOC of these solutes will be less than one (Ding and Wu, 1995). In
addition, when the sources and nature of the dissolved organic matter and
soil/sediment organic matter are different, the ratios of KDOC/KOC of solutes will
have a broad range. The broader range of KDOC/KOC ratios estimated by Ding and Wu
(1995) is assumed in the Monte Carlo analysis (parameter a16). The environmental
variability of suspended matter and dissolved organic carbon concentration in
freshwater was found to be negligible in terms of sensitivity to CFs values.
In ecotoxicological impact characterization, the inherent uncertainty of QSAR data from
the software program ECOSAR was not included on the overall uncertainty of
ecotoxicological impact characterization.
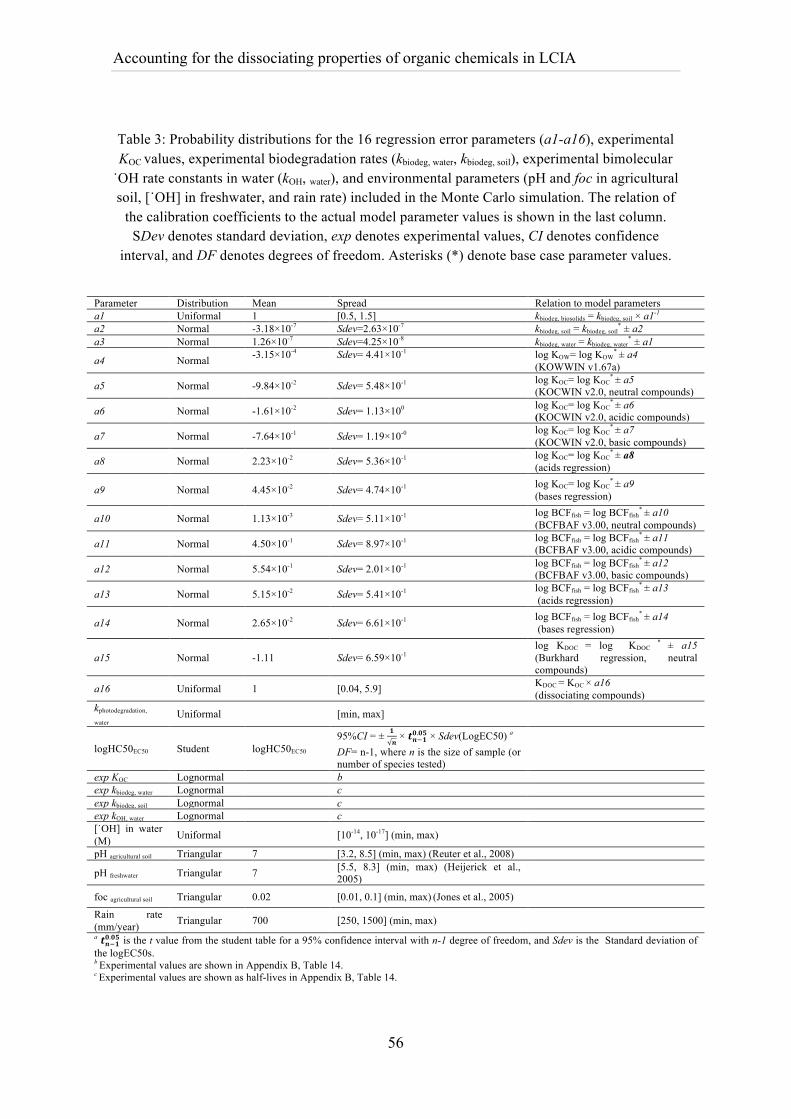
Accounting for the dissociating properties of organic chemicals in LCIA
56
Table 3: Probability distributions for the 16 regression error parameters (a1-a16), experimental KOC values, experimental biodegradation rates (kbiodeg, water, kbiodeg, soil), experimental bimolecular
˙OH rate constants in water (kOH, water), and environmental parameters (pH and foc in agricultural soil, [˙OH] in freshwater, and rain rate) included in the Monte Carlo simulation. The relation of
the calibration coefficients to the actual model parameter values is shown in the last column. SDev denotes standard deviation, exp denotes experimental values, CI denotes confidence
interval, and DF denotes degrees of freedom. Asterisks (*) denote base case parameter values.
Parameter Distribution Mean Spread Relation to model parameters a1 Uniformal 1 [0.5, 1.5] kbiodeg, biosolids = kbiodeg, soil × a1-1 a2 Normal -3.18×10⁻⁷ Sdev=2.63×10⁻⁷ kbiodeg, soil = kbiodeg, soil
* ± a2 a3 Normal 1.26×10⁻⁷ Sdev=4.25×10⁻⁸ kbiodeg, water = kbiodeg, water
* ± a1
a4 Normal -3.15×10⁻⁴
Sdev= 4.41×10⁻¹
log KOW= log KOW*
± a4 (KOWWIN v1.67a)
a5 Normal -9.84×10⁻² Sdev= 5.48×10⁻¹ log KOC= log KOC*
± a5 (KOCWIN v2.0, neutral compounds)
a6 Normal -1.61×10⁻² Sdev= 1.13×100 log KOC= log KOC*
± a6 (KOCWIN v2.0, acidic compounds)
a7 Normal -7.64×10⁻¹ Sdev= 1.19×10-0 log KOC= log KOC*
± a7 (KOCWIN v2.0, basic compounds)
a8 Normal 2.23×10⁻² Sdev= 5.36×10⁻¹ log KOC= log KOC*
± a8 (acids regression)
a9 Normal 4.45×10⁻² Sdev= 4.74×10⁻¹ log KOC= log KOC*
± a9 (bases regression)
a10 Normal 1.13×10⁻³ Sdev= 5.11×10⁻¹ log BCFfish = log BCFfish*
± a10 (BCFBAF v3.00, neutral compounds)
a11 Normal 4.50×10⁻¹ Sdev= 8.97×10⁻¹ log BCFfish = log BCFfish*
± a11 (BCFBAF v3.00, acidic compounds)
a12 Normal 5.54×10⁻¹ Sdev= 2.01×10⁻¹ log BCFfish = log BCFfish*
± a12 (BCFBAF v3.00, basic compounds)
a13 Normal 5.15×10⁻² Sdev= 5.41×10⁻¹ log BCFfish = log BCFfish*
± a13 (acids regression)
a14 Normal 2.65×10⁻² Sdev= 6.61×10⁻¹ log BCFfish = log BCFfish*
± a14 (bases regression)
a15 Normal -1.11 Sdev= 6.59×10⁻¹ log KDOC = log KDOC
* ± a15
(Burkhard regression, neutral compounds)
a16 Uniformal 1 [0.04, 5.9] KDOC = KOC × a16
(dissociating compounds) kphotodegradation,
water Uniformal [min, max]
logHC50EC50 Student logHC50EC50 95%CI = ± 𝟏
𝒏 × 𝒕𝒏!𝟏𝟎.𝟎𝟓 × Sdev(LogEC50) a
DF= n-1, where n is the size of sample (or number of species tested)
exp KOC Lognormal b exp kbiodeg, water Lognormal c exp kbiodeg, soil Lognormal c exp kOH, water Lognormal c [˙OH] in water (M) Uniformal [10-14, 10-17] (min, max)
pH agricultural soil Triangular 7 [3.2, 8.5] (min, max) (Reuter et al., 2008)
pH freshwater Triangular 7 [5.5, 8.3] (min, max) (Heijerick et al., 2005)
foc agricultural soil Triangular 0.02 [0.01, 0.1] (min, max) (Jones et al., 2005)
Rain rate (mm/year) Triangular 700 [250, 1500] (min, max) a 𝒕𝒏!𝟏𝟎.𝟎𝟓 is the t value from the student table for a 95% confidence interval with n-1 degree of freedom, and Sdev is the Standard deviation of the logEC50s. b Experimental values are shown in Appendix B, Table 14. c Experimental values are shown as half-lives in Appendix B, Table 14.
Uncertainty Analysis Prioritisation Direct Emissions
57
The uncertainties of GCSOLAR model estimates were not treated in the study but rather
the variability of direct photodegradation rates considering the geographical scale.
Therefore, the maximum and minimum of the uniformly distributed photodegradation
rate parameter was obtained considering the GCSOLAR results for the winter and
summer seasons, the latitudes of 40° and 60°, and the maximum and minimum
experimental quantum yields.
3.4 Results and Discussion
Table 4 shows the CFs results and the 95% confidence interval for the three emission
scenarios and for both approaches. Minor differences of CFs values and of 95%
confidence limits between the two approaches are estimated for direct emissions to the
freshwater compartment. However, the default USEtox model overestimates CFs of
basic compounds relatively to the alternative approach for emissions to the agricultural
soil compartment. The differences are as large as 3 orders of magnitude for metropopol
and propanolol and 2 orders of magnitude for atenolol and clarithromycin. Larger 95%
confidence limits are estimated for basic compounds in the default USEtox model. In
the upper endpoint, an increase of 4 orders of magnitude is estimated for propanolol, 3
orders of magnitude for metropropol and 2 orders of magnitude for atenolol,
clarithromyin and clindamycin. In the lower endpoint, a decrease of 3 orders of
magnitude is estimated for clarithromyin, metropropol and for the acidic pharmaceutical
naproxen.
Freshwater ecotoxicity probabilistic CF values of direct emissions to freshwater are
mainly sensitive to the variability of abiotic degradation rates and to the uncertainty of
ecotoxicological impact characterization (HC50EC50 values) (Appendix C, Table 15).
The uncertainty of sorption partitioning coefficients and BCFs estimation is negligible
and explains the minor differences of CFs values and 95% confidence limits between
the two approaches for direct emissions. However, for indirect emissions, CF results are
more sensitive to the uncertainty of environmental fate properties estimation,
particularly KOC, and of HC50EC50 values rather to the variability of experimental fate
properties or environmental characteristics (Appendix C, Table 16, sensitivity indices
are not shown for emission scenario from biosolids because they do not differ
significantly). The results of the Monte Carlo analysis of both approaches indicate that
the estimation of KOC was found influential for most compounds, particularly in the case
Accounting for the dissociating properties of organic chemicals in LCIA
58
of the default USEtox model. This suggests the limited predictive power of regressions
that do not account for the sorption of the cationic fraction of organic bases, particularly
in case of basic compounds with pKa>4 (bases for which the cation dominates the
sorption). The underestimation of sorption to solid matrices in case of indirect emissions
to freshwater, which overestimates the availability for transport in the solution phase,
largely overestimates CFs of basic compounds relatively to the alternative approach and
results in larger confidence limits.
Figure 6 shows the freshwater ecotoxicity impacts for the three emission scenarios and
for both approaches. For a direct emission to freshwater, as expected from estimated CF
values, negligible differences between approaches are estimated. Nevertheless, the
USEtox model overestimates approximately by one order of magnitude the impacts of
indirect emissions relatively to the alternative approach. Moreover, confidence limits
are substantially reduced in the alternative approach (Table 5). In the case of emission
to agricultural soil of WWTP effluent as reclaimed water, USEtox impact results are
mainly sensitive to the propagation of the uncertainty and variability of the basic
compounds clarithromycin and propanolol CFs (sensitivity indices of 43.9% and 24.6%,
respectively). On the other hand, by estimating the electrical adsorption of the cationic
species in the fate and transport modelling of these compounds, which are almost
completely dissociated at environmental relevant pH’s, the total impact results of the
alternative approach are one order of magnitude lower and the confidence limits are
mainly sensitive to the propagation of the uncertainty and variability of the acidic
compounds sulfamethazole and primidone CFs (sensitivity indices of 53.7% and 24.5%,
respectively). Moreover, in the alternative approach, ecotoxicity impacts are entirely
dominated by the anionic compounds and by the neutral carbamazepine. Therefore, in
freshwater ecotoxicity assessment, it may be more realistic to neglect indirect emissions
of basic compounds with pKa>4, which is the case for the bases present in the inventory
data, when using LCIA models that do not account for the dissociating properties of
compounds.
The overestimation of impacts and the larger 95% confidence limits associated with the
default USEtox model might or might not result in large uncertainties in outputs from
LCA applications employing this model or others that do not account for the
dissociating properties of compounds.
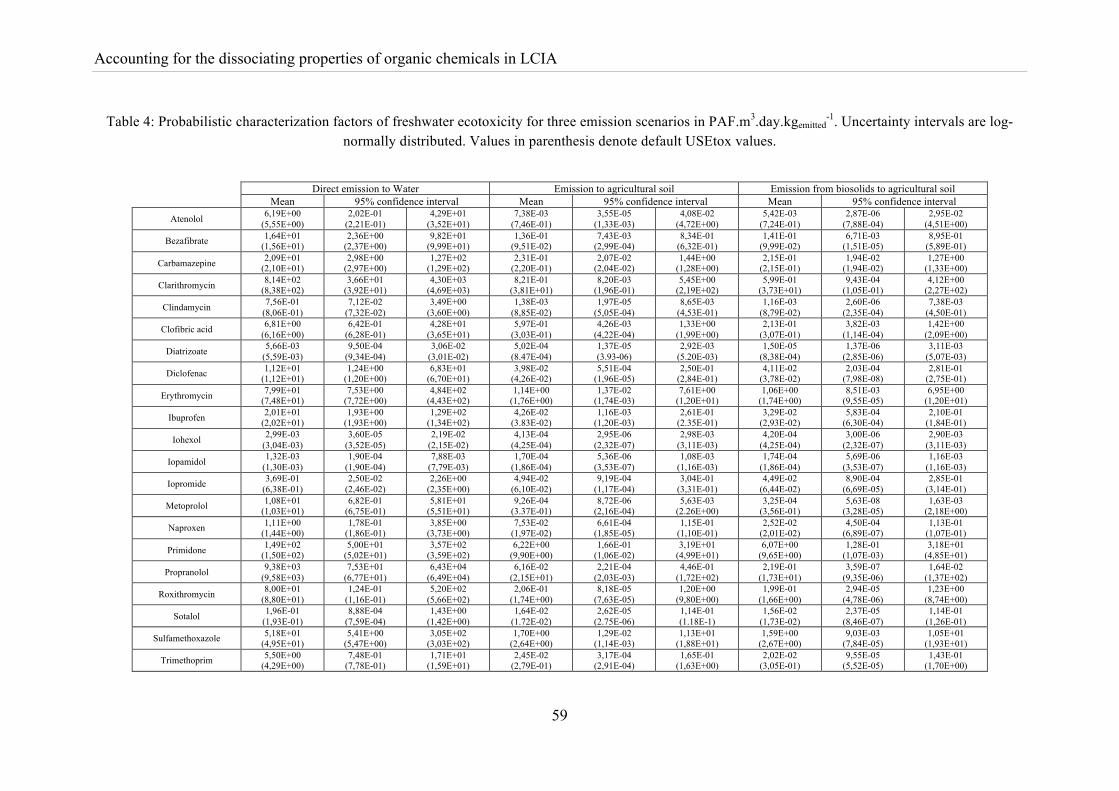
Accounting for the dissociating properties of organic chemicals in LCIA
59
Table 4: Probabilistic characterization factors of freshwater ecotoxicity for three emission scenarios in PAF.m3.day.kgemitted-1. Uncertainty intervals are log-
normally distributed. Values in parenthesis denote default USEtox values.
Direct emission to Water Emission to agricultural soil Emission from biosolids to agricultural soil Mean 95% confidence interval Mean 95% confidence interval Mean 95% confidence interval
Atenolol 6,19E+00 (5,55E+00)
2,02E-01 (2,21E-01)
4,29E+01 (3,52E+01)
7,38E-03 (7,46E-01)
3,55E-05 (1,33E-03)
4,08E-02 (4,72E+00)
5,42E-03 (7,24E-01)
2,87E-06 (7,88E-04)
2,95E-02 (4,51E+00)
Bezafibrate 1,64E+01 (1,56E+01)
2,36E+00 (2,37E+00)
9,82E+01 (9,99E+01)
1,36E-01 (9,51E-02)
7,43E-03 (2,99E-04)
8,34E-01 (6,32E-01)
1,41E-01 (9,99E-02)
6,71E-03 (1,51E-05)
8,95E-01 (5,89E-01)
Carbamazepine 2,09E+01 (2,10E+01)
2,98E+00 (2,97E+00)
1,27E+02 (1,29E+02)
2,31E-01 (2,20E-01)
2,07E-02 (2,04E-02)
1,44E+00 (1,28E+00)
2,15E-01 (2,15E-01)
1,94E-02 (1,94E-02)
1,27E+00 (1,33E+00)
Clarithromycin 8,14E+02 (8,38E+02)
3,66E+01 (3,92E+01)
4,30E+03 (4,69E+03)
8,21E-01 (3,81E+01)
8,20E-03 (1,96E-01)
5,45E+00 (2,19E+02)
5,99E-01 (3,73E+01)
9,43E-04 (1,05E-01)
4,12E+00 (2,27E+02)
Clindamycin 7,56E-01 (8,06E-01)
7,12E-02 (7,32E-02)
3,49E+00 (3,60E+00)
1,38E-03 (8,85E-02)
1,97E-05 (5,05E-04)
8,65E-03 (4,53E-01)
1,16E-03 (8,79E-02)
2,60E-06 (2,35E-04)
7,38E-03 (4,50E-01)
Clofibric acid 6,81E+00 (6,16E+00)
6,42E-01 (6,28E-01)
4,28E+01 (3,65E+01)
5,97E-01 (3,03E-01)
4,26E-03 (4,22E-04)
1,33E+00 (1,99E+00)
2,13E-01 (3,07E-01)
3,82E-03 (1,14E-04)
1,42E+00 (2,09E+00)
Diatrizoate 5,66E-03 (5,59E-03)
9,50E-04 (9,34E-04)
3,06E-02 (3,01E-02)
5,02E-04 (8.47E-04)
1,37E-05 (3.93-06)
2,92E-03 (5.20E-03)
1,50E-05 (8,38E-04)
1,37E-06 (2,85E-06)
3,11E-03 (5,07E-03)
Diclofenac 1,12E+01 (1,12E+01)
1,24E+00 (1,20E+00)
6,83E+01 (6,70E+01)
3,98E-02 (4,26E-02)
5,51E-04 (1,96E-05)
2,50E-01 (2,84E-01)
4,11E-02 (3,78E-02)
2,03E-04 (7,98E-08)
2,81E-01 (2,75E-01)
Erythromycin 7,99E+01 (7,48E+01)
7,53E+00 (7,72E+00)
4,84E+02 (4,43E+02)
1,14E+00 (1,76E+00)
1,37E-02 (1,74E-03)
7,61E+00 (1,20E+01)
1,06E+00 (1,74E+00)
8,51E-03 (9,55E-05)
6,95E+00 (1,20E+01)
Ibuprofen 2,01E+01 (2,02E+01)
1,93E+00 (1,93E+00)
1,29E+02 (1,34E+02)
4,26E-02 (3.83E-02)
1,16E-03 (1,20E-03)
2,61E-01 (2.35E-01)
3,29E-02 (2,93E-02)
5,83E-04 (6,30E-04)
2,10E-01 (1,84E-01)
Iohexol 2,99E-03 (3,04E-03)
3,60E-05 (3,52E-05)
2,19E-02 (2,15E-02)
4,13E-04 (4,25E-04)
2,95E-06 (2,32E-07)
2,98E-03 (3,11E-03)
4,20E-04 (4,25E-04)
3,00E-06 (2,32E-07)
2,90E-03 (3,11E-03)
Iopamidol 1,32E-03 (1,30E-03)
1,90E-04 (1,90E-04)
7,88E-03 (7,79E-03)
1,70E-04 (1,86E-04)
5,36E-06 (3,53E-07)
1,08E-03 (1,16E-03)
1,74E-04 (1,86E-04)
5,69E-06 (3,53E-07)
1,16E-03 (1,16E-03)
Iopromide 3,69E-01 (6,38E-01)
2,50E-02 (2,46E-02)
2,26E+00 (2,35E+00)
4,94E-02 (6,10E-02)
9,19E-04 (1,17E-04)
3,04E-01 (3,31E-01)
4,49E-02 (6,44E-02)
8,90E-04 (6,69E-05)
2,85E-01 (3,14E-01)
Metoprolol 1,08E+01 (1,03E+01)
6,82E-01 (6,75E-01)
5,81E+01 (5,51E+01)
9,26E-04 (3.37E-01)
8,72E-06 (2,16E-04)
5,63E-03 (2.26E+00)
3,25E-04 (3,56E-01)
5,63E-08 (3,28E-05)
1,63E-03 (2,18E+00)
Naproxen 1,11E+00 (1,44E+00)
1,78E-01 (1,86E-01)
3,85E+00 (3,73E+00)
7,53E-02 (1,97E-02)
6,61E-04 (1,85E-05)
1,15E-01 (1,10E-01)
2,52E-02 (2,01E-02)
4,50E-04 (6,89E-07)
1,13E-01 (1,07E-01)
Primidone 1,49E+02 (1,50E+02)
5,00E+01 (5,02E+01)
3,57E+02 (3,59E+02)
6,22E+00 (9,90E+00)
1,66E-01 (1,06E-02)
3,19E+01 (4,99E+01)
6,07E+00 (9,65E+00)
1,28E-01 (1,07E-03)
3,18E+01 (4,85E+01)
Propranolol 9,38E+03 (9,58E+03)
7,53E+01 (6,77E+01)
6,43E+04 (6,49E+04)
6,16E-02 (2,15E+01)
2,21E-04 (2,03E-03)
4,46E-01 (1,72E+02)
2,19E-01 (1,73E+01)
3,59E-07 (9,35E-06)
1,64E-02 (1,37E+02)
Roxithromycin 8,00E+01 (8,80E+01)
1,24E-01 (1,16E-01)
5,20E+02 (5,66E+02)
2,06E-01 (1,74E+00)
8,18E-05 (7,63E-05)
1,20E+00 (9,80E+00)
1,99E-01 (1,66E+00)
2,94E-05 (4,78E-06)
1,23E+00 (8,74E+00)
Sotalol 1,96E-01 (1,93E-01)
8,88E-04 (7,59E-04)
1,43E+00 (1,42E+00)
1,64E-02 (1.72E-02)
2,62E-05 (2.75E-06)
1,14E-01 (1.18E-1)
1,56E-02 (1,73E-02)
2,37E-05 (8,46E-07)
1,14E-01 (1,26E-01)
Sulfamethoxazole 5,18E+01 (4,95E+01)
5,41E+00 (5,47E+00)
3,05E+02 (3,03E+02)
1,70E+00 (2,64E+00)
1,29E-02 (1,14E-03)
1,13E+01 (1,88E+01)
1,59E+00 (2,67E+00)
9,03E-03 (7,84E-05)
1,05E+01 (1,93E+01)
Trimethoprim 5,50E+00 (4,29E+00)
7,48E-01 (7,78E-01)
1,71E+01 (1,59E+01)
2,45E-02 (2,79E-01)
3,17E-04 (2,91E-04)
1,65E-01 (1,63E+00)
2,02E-02 (3,05E-01)
9,55E-05 (5,52E-05)
1,43E-01 (1,70E+00)
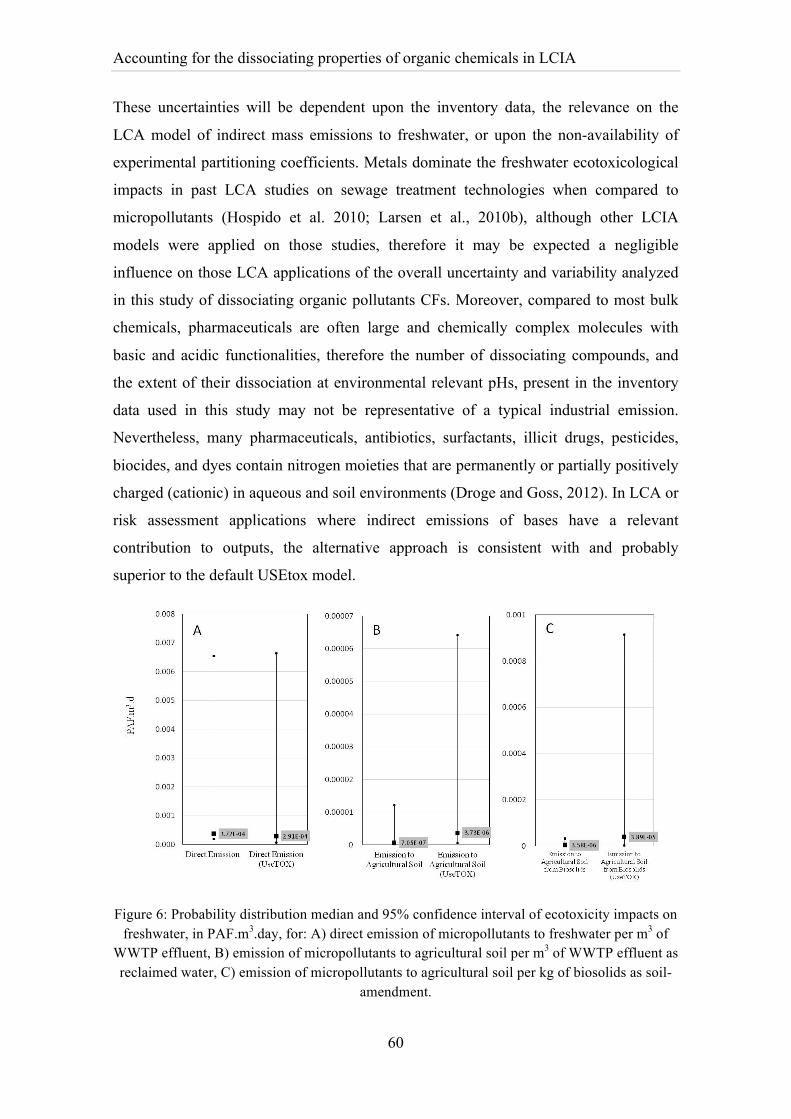
Accounting for the dissociating properties of organic chemicals in LCIA
60
These uncertainties will be dependent upon the inventory data, the relevance on the
LCA model of indirect mass emissions to freshwater, or upon the non-availability of
experimental partitioning coefficients. Metals dominate the freshwater ecotoxicological
impacts in past LCA studies on sewage treatment technologies when compared to
micropollutants (Hospido et al. 2010; Larsen et al., 2010b), although other LCIA
models were applied on those studies, therefore it may be expected a negligible
influence on those LCA applications of the overall uncertainty and variability analyzed
in this study of dissociating organic pollutants CFs. Moreover, compared to most bulk
chemicals, pharmaceuticals are often large and chemically complex molecules with
basic and acidic functionalities, therefore the number of dissociating compounds, and
the extent of their dissociation at environmental relevant pHs, present in the inventory
data used in this study may not be representative of a typical industrial emission.
Nevertheless, many pharmaceuticals, antibiotics, surfactants, illicit drugs, pesticides,
biocides, and dyes contain nitrogen moieties that are permanently or partially positively
charged (cationic) in aqueous and soil environments (Droge and Goss, 2012). In LCA or
risk assessment applications where indirect emissions of bases have a relevant
contribution to outputs, the alternative approach is consistent with and probably
superior to the default USEtox model.
Figure 6: Probability distribution median and 95% confidence interval of ecotoxicity impacts on freshwater, in PAF.m3.day, for: A) direct emission of micropollutants to freshwater per m3 of
WWTP effluent, B) emission of micropollutants to agricultural soil per m3 of WWTP effluent as reclaimed water, C) emission of micropollutants to agricultural soil per kg of biosolids as soil-
amendment.
Accounting for the dissociating properties of organic chemicals in LCIA
61
The uncertainty and variability analysis performed in the present study does not account
for other factors that may influence its outcome. In the case of regressions for
dissociating compounds applied in the alternative approach, it is assumed constant
uncertainty parameters for the environmental pH interval. That is, although the
regressions consider the impact of pH on the speciation of the molecule, the impact of
pH on the regressions uncertainty parameters is disregarded. Focusing in the case of the
KOC regression for bases (the most influential parameter on the estimated differences
between approaches) and due to the more complex behaviour of bases and difficulty of
improving model predictions (Kah and Brown, 2007; Franco et al., 2009), one can
assume that the overall uncertainty is mainly due to the cationic species sorption,
therefore, considering that the regression for bases was obtained at pH 4.5 and the base
case environmental pH is 7, for higher pH values the fraction of cations decreases and
so should the regression confidence limits. However, pH influences the speciation of the
molecule (sorbate) as well as the soil surface chemistry (sorbent). For bases, the impact of pH on speciation and on the sorbent surface chemistry has contrasting effects on the total sorption (Franco et al., 2009). The surface of organic colloids in soil (organic matter and clay) is negatively charged because of ionization of hydroxides and phenolic groups. Cations are electrically attracted by the negative surface of natural colloids in soil. At higher pH, the fraction of cations decreases, but the deprotonation of hydroxides and phenolic groups at the sorbing surface increases the potential for cation exchange. Therefore, the uncertainty parameters of the KOC regression for bases may be both over-
and underestimated for other pH values in environmental pH interval. The same
reasoning is applied for default USEtox model in terms of uncertainty parameters, but
since the regressions do not consider the impact of pH on the speciation of the
molecule, the Monte Carlo analysis does not account for the variability of pH on the
estimation of KOC, therefore confidence limits of the USEtox results may be
underestimated.
It should be noted that the influence on the direct and indirect photolysis rates of the
dissociating properties of compounds was disregarded in Monte Carlo analysis due to
lack of data. The anionic form of some micropollutants were reported to exhibit higher
degradation rates than the neutral form (Boreen et al. 2004; Baeza and Knappe, 2011).
The influence of freshwater pH on the photodegradation of compounds, and by
extension on the ecotoxicological impacts, is unclear in the present study.
Accounting for the dissociating properties of organic chemicals in LCIA
62
Table 5: Summary of differences of USEtox results relatively to the alternative approach.
Median 95% Confidence Interval CFs direct emission Negligible differences Negligible differences
CFs indirect emission Overestimation of up to 3 orders of magnitude for basic compounds
• Overestimation of up to 4 orders of magnitude for basic compounds in the upper endpoint
• Overestimation of up to 3 orders of magnitude for basic compounds in the lower endpoint
Impact direct emission Negligible differences Negligible differences
Impact indirect emission Overestimation of 1 order of magnitude
• Overestimation of up to a factor of 30 in the upper endpoint
• Overestimation of up to a factor of 3 in the lower endpoint
3.5 Conclusions
The influence on the freshwater ecotoxicity impact results of using pH dependent-
regressions to estimate fate properties of dissociating compounds was analyzed, as well
as the sensitivity of model parameters on the outcome of the impact assessment, and
compared to the default USEtox model for three different emissions scenarios of
micropollutants to two environmental compartments. Negligible differences of CFs
values and 95% confidence limits between the two approaches were estimated for direct
emissions to the freshwater compartment; however the default USEtox model
overestimates CFs of basic compounds up to three orders of magnitude relatively to the
alternative approach for emissions to the agricultural soil compartment. For CFs of
those indirect emissions, the results of uncertainty and variability analysis of both
approaches indicate that the estimation of KOC was found influential for most
compounds, particularly in the case of the default USEtox model. The underestimation
of sorption of cations to solid matrices in the USEtox model overestimates freshwater
ecotoxicity impacts for the emission scenarios to agricultural soil by one order of
magnitude and larger confidence limits were estimated relatively to the alternative
approach. Depending upon the inventory data, the relevance of indirect mass emissions
to freshwater on an LCA model and upon the non-availability of experimental
partitioning coefficients, there might be considerable uncertainties on outputs from a
given LCA study.
Accounting for the dissociating properties of organic chemicals in LCIA
63
3.6 Acknowledgements
Sérgio Alberto Morais is grateful to FCT-Fundação para a Ciência e a Tecnologia for a
Ph.D. grant (SFRH/BD/64599/2009). This work was supported by the Foundation of
Science and Technology (FCT) of the Portuguese Ministry of Science, Technology and
Higher Education (MCTES), through project PTDC/ECM/103141/2008.
Accounting for the dissociating properties of organic chemicals in LCIA
64
Uncertainty Analysis Prioritisation Direct Emissions
65
4. An Uncertainty Analysis Applied to the Prioritisation of Pharmaceuticals as Surface
Water Contaminants from Wastewater Treatment Plant Direct Emissions
This paper was submitted to Water Research, under the same title.
Additional authors are Cristina Delerue-Matosa and Xavier Gabarrellb,c. aREQUIMTE/Instituto Superior de Engenharia do Porto (ISEP), Rua Dr. António
Bernardino de Almeida, 431 4200-072, Porto, Portugal. bSosteniPrA (UAB-IRTA-Inèdit), Institut de Ciència i Tecnologia Ambientals (ICTA),
Universitat Autònoma de Barcelona (UAB), 08193 Bellaterra, Barcelona, Spain. cDepartament d’Enginyeria Química, Escola d’Enginyeria, Universitat Autònoma de
Barcelona (UAB), 08193 Bellaterra, Barcelona, Spain.
4.1 Abstract
In this study, the concentration probability distributions of 82 pharmaceutical
compounds detected in the effluents of 179 European wastewater treatment plants were
computed and inserted into a multimedia fate model. The comparative impact of the
direct emission of these compounds from wastewater treatment plants on freshwater
ecosystems was assessed to rank compounds based on priority. As many
pharmaceuticals are acids or bases, the multimedia fate model accounts for regressions
to estimate pH-dependent fate parameters. An uncertainty analysis was performed by
means of Monte Carlo analysis, which included the uncertainty of fate and ecotoxicity
model parameters, as well as the spatial variability of landscape characteristics on the
European continental scale.
Several pharmaceutical compounds were identified as being of greatest concern,
including 7 analgesics/anti-inflammatories, 3 β-blockers, 3 psychiatric drugs, and 1 each
of 6 other therapeutic classes. Most of these compounds have little or no experimental
fate or ecotoxicity data available, as well as a limited reported occurrence in effluents.
The contribution of estimated model parameters to the variance of output results, as
well as the lack of experimental abiotic degradation data for most compounds, helped to
establish priorities for further testing. Generally, the effluent concentration and the
Uncertainty Analysis Prioritisation Direct Emissions
66
ecotoxicity effect factor were the model parameters with the most significant effect on
the uncertainty of output results.
Keywords: Pharmaceuticals, Multimedia fate model, Freshwater ecotoxicity,
Dissociating organics, Uncertainty analysis, Wastewater treatment plants
1.1 Introduction
The presence of medicinal residues in the environment and their potential to induce
adverse biological effects have been known for many years (Tabak and Bunch, 1970;
Aherne and Briggs, 1989). The most common environmental contamination pathways
are the emission of pharmaceutical compounds (PCs) from wastewater treatment plants
(WWTPs) after urinal and faecal excretion and the application of livestock manure as a
top soil dressing (without previous wastewater treatment) containing veterinary drugs
that are likely to contaminate the soil and groundwater, which, after rainfall incidents,
can reach surface waters from contaminated soil by run-off. Other less important
sources of contamination include industrial wastewater and drugs disposed of with
domestic waste in landfill sites, which could lead to groundwater contamination by
leaching (Ternes, 1998). The pathways of contamination after excretion and passage
through municipal sewage systems include the infiltration of sewage from leakages in
drains, the application of biosolids from WWTPs on agricultural areas and landscapes,
and, due to incomplete removal, the disposal of WWTP effluents and raw sewage into
surface waters and as reclaimed water into agricultural fields and landscapes by
irrigation. Regarding the emission pathways from WWTPs, we distinguish between
direct and indirect emissions to the freshwater compartment; the application of biosolids
and effluents into agricultural soils and landscapes can also lead to the migration of
contaminants to surface waters via run-off (Sabourin et al., 2009; Borgman and Chefetz,
2013).
Although much research has been conducted on the topic of direct emissions of PCs
from WWTPs, studies have generally been limited to single WWTPs (Verlicchi et al.,
2012). Moreover, past studies examining the prioritisation of pharmaceuticals (e.g.,
(Sanderson et al., 2004; Besse and Garric, 2008; Christen et al., 2010) do not account
for spatial variations of the environmental landscape, nor do most of them account for
the dissociating properties of PCs or include a comprehensive uncertainty analysis of
the results.
Uncertainty Analysis Prioritisation Direct Emissions
67
To provide a holistic view of the PCs of greatest concern, we collected data concerning
PC occurrence in 179 WWTPs in Europe. A multimedia model was applied to prioritise
PCs according to their probabilistic impact on freshwater ecosystems from WWTP
direct emissions. Generally, experimental fate parameters, such as partitioning
coefficients or degradation rates, and ecotoxicity data are scarce for most PCs;
therefore, estimation methods must be applied in their assessment. Research topics were
prioritised for the compounds of most concern by indentifying important gaps of
knowledge, as well as by computing the contribution of estimated model parameters’
uncertainty and variability to the impact variance. Currently, a similar assessment is
being performed concerning indirect emissions to the freshwater compartment.
1.2 Methodology
A survey of the occurrence of PCs in the effluents of European WWTPs was performed
to compute concentration probability distributions. The survey is based on a recent
review conducted by Verlicchi et al. (2012) on the global occurrence of PCs in urban
wastewater. For this Europe-focused study, 54 peer-reviewed publications were
collected from the cited review covering 179 WWTPs located in Austria, Denmark,
Finland, France, Germany, Greece, Italy, Spain, Sweden, Switzerland, and the UK, with
capacities ranging from 6 000 to 2 500 000 population equivalents. Effluent
concentration data included 82 drugs pertaining to 15 different classes: 19
analgesics/anti-inflammatories (including 1 metabolite), 15 antibiotics, 12 β-blockers, 7
psychiatric drugs, 7 lipid regulators (including 2 metabolites), 4 hormones, 4 β-agonists,
3 receptor antagonists, 3 antineoplastics, 2 antihypertensives, 2 diuretics, 1 proton-pump
inhibitor, 1 antiseptic, 1 contrast agent, and 1 antifungal (Appendix C, Table 17). The
quality of effluent concentration data reported in the literature has been confirmed
according to the EC Technical Guidance Document (TGD) on Risk Assessment (EC,
2003). Therefore, the references included in the survey feature a description of the
analytical methodology and the quality assurance programme used for sampling,
analysis and elaboration. The geometric mean and the geometric standard deviation of
the effluent concentration of each compound, assuming a lognormal distribution and
weighted by the population served in each WWTP, were computed and inserted into a
multimedia fate and transport model, assuming steady-state concentrations, to assess the
comparative impact to freshwater ecosystems.
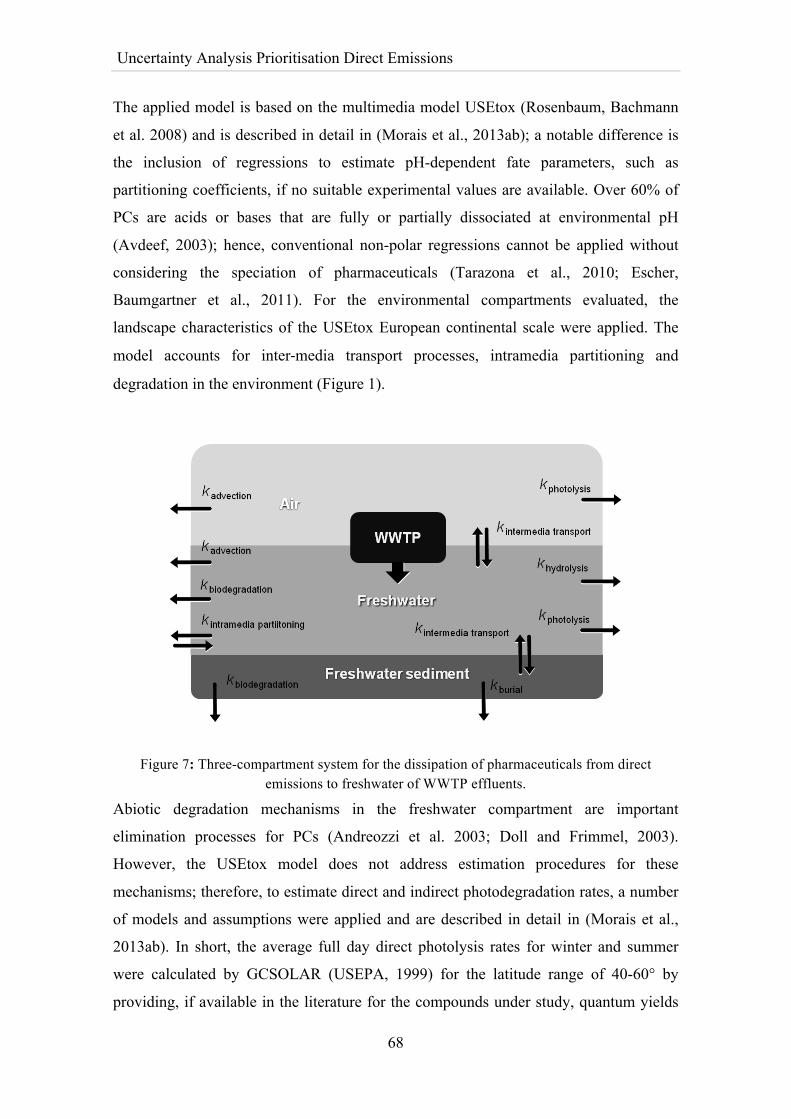
Uncertainty Analysis Prioritisation Direct Emissions
68
The applied model is based on the multimedia model USEtox (Rosenbaum, Bachmann
et al. 2008) and is described in detail in (Morais et al., 2013ab); a notable difference is
the inclusion of regressions to estimate pH-dependent fate parameters, such as
partitioning coefficients, if no suitable experimental values are available. Over 60% of
PCs are acids or bases that are fully or partially dissociated at environmental pH
(Avdeef, 2003); hence, conventional non-polar regressions cannot be applied without
considering the speciation of pharmaceuticals (Tarazona et al., 2010; Escher,
Baumgartner et al., 2011). For the environmental compartments evaluated, the
landscape characteristics of the USEtox European continental scale were applied. The
model accounts for inter-‐media transport processes, intramedia partitioning and
degradation in the environment (Figure 1).
Figure 7: Three-compartment system for the dissipation of pharmaceuticals from direct emissions to freshwater of WWTP effluents.
Abiotic degradation mechanisms in the freshwater compartment are important
elimination processes for PCs (Andreozzi et al. 2003; Doll and Frimmel, 2003).
However, the USEtox model does not address estimation procedures for these
mechanisms; therefore, to estimate direct and indirect photodegradation rates, a number
of models and assumptions were applied and are described in detail in (Morais et al.,
2013ab). In short, the average full day direct photolysis rates for winter and summer
were calculated by GCSOLAR (USEPA, 1999) for the latitude range of 40-60° by
providing, if available in the literature for the compounds under study, quantum yields
Uncertainty Analysis Prioritisation Direct Emissions
69
and molar absorption coefficients as a function of the UV/VIS wavelength range
(Appendix C, Table 18). For indirect photolysis, bimolecular rate constants (kOH, in M-
1s-1) for the reaction between a substance and ˙OH (Appendix C, Table 18), the most
reactive chemical transient, were converted to pseudo-first order rate constants by
multiplication by the hydroxyl radical concentration in surface waters (in M).
1.2.1 The ecotoxicity effect factor
In comparative impact assessment methodologies, the conversion of emissions to
ecotoxicological impacts comprises a fate and an effect analysis step (van Zelm et al.,
2007). The fate factor describes the marginal increase in environmental concentration
per unit of emission. The ecotoxicity effect factor (EEF) addresses the marginal increase
in effect (toxic pressure on ecosystems) per unit of chemical concentration. An
assessment factor (AF) based on the predicted no effect concentration (PNEC) approach
is recommended in generic risk assessment according to the TGD (EC, 2003); however,
a potentially affected fraction (PAF) of species approach based on the average toxicity
was considered in the present study as a basis for the EEF calculation, as adopted in the
USEtox model. Both approaches have advantages and drawbacks (Larsen and
Hauschild, 2007ab); however, a PAF-based approach has two main advantages that
better serve the purposes of this study: 1) a PNEC approach targets the protection of the
most sensitive species; therefore, the risk of bias is high when scarce ecotoxicity data
are available, which is the case for PCs; and 2) the assessment of the mean impact
(AMI) on ecosystems method, a PAF-based approach, allows the quantification of
uncertainty, giving an indication of the reliability of the results. The AMI method is
based on the hazardous concentration (HC) at which the effect concentration (with an
endpoint of, for example, mortality) affecting 50% of tested individuals (EC50) is
exceeded for 50% of the included species; this is also called HC50EC50 (Payet, 2004;
Payet, 2005; Payet and Jolliet, 2005). Two statistical estimators can be used to estimate
the toxicity of a substance to biological species and the associated confidence interval: a
non-parametric estimator using the median as the HC50EC50 combined with bootstrap
statistics to estimate its uncertainty (Payet and Jolliet, 2005) or a parametric estimator
based on the assumption of a lognormal distribution of data using the geometric mean
as HC50EC50 and Student’s t-statistics for its confidence interval (Payet, 2004; Payet,
2005).
Uncertainty Analysis Prioritisation Direct Emissions
70
The EEF indicator, i.e., 0.5/HC50EC50, focuses on the trophic structure by including the
EC50 values of at least 3 trophic levels: primary producers (algae), primary consumers
(crustaceans), and secondary consumers (fish) (Appendix C, Table 19). The low
environmental concentrations but constant introduction to the environment indicate that
PCs are more likely to have chronic rather than acute toxic effects on aquatic biota
(Carlsson et al., 2006; Fent et al., 2006; Quinn et al., 2008); hence, chronic EC50 values
are preferred as well as, due to the comparative context of the assessment, standard
tests/test conditions and standard test organisms. However, the ecotoxicological data on
PCs remain scarce, and there are not enough chronic experimental ecotoxicity data
available to perform an assessment (Escher et al., 2011). An acute-chronic ratio of 2
was applied to extrapolate chronic HC50EC50 values from acute HC50EC50 values, as
recommended by (Larsen and Hauschild, 2007b), and was applied in the USEtox model
(Huijbregts et al., 2010). However, best estimate AFs for this extrapolation have not yet
been developed, and research is needed in this area (Larsen and Hauschild, 2007b),
particularly in the context of micropollutants. Even acute ecotoxicity data are only
available for a very limited set of pharmaceuticals (Escher et al., 2011); therefore, EC50
values are completed by extrapolation from the lowest observed effect concentration
(LOEC) or no observed effect concentration (NOEC) values, according to the best-
estimate AFs from (Payet 2004). To determine missing experimental data, quantitative-
structure activity relationship (QSAR) data were included using the software program
ECOSAR v1.00 (Nabholz and Mayo-Bean, 2009). For estimated data, a conservative
approach was followed by considering the chemical class with the highest potency (i.e.,
the lowest concentration predicted to cause the toxic effect), except in the case of the
neutral organics class if a compound is completely dissociated at environmentally
relevant pH values.
The baseline toxicity, or narcosis, is the addressed toxic mode of action (TMoA) in
most generic risk assessment or impact assessment methodologies. Previous studies
have shown that most PCs produce their environmental adverse effect via narcosis
(Sanderson and Thomsen, 2007). However, some pharmaceuticals, which are designed
to be bioactive (with the exception of contrast agents), also exhibit a therapeutic effect
in non-target aquatic life, such as the estrogenic effects caused by hormones in fish
(Santos et al., 2010), or they act via a specific TMoA, such as the inhibition of
photosynthesis caused by β-blockers in algae (Escher et al., 2006). As a change in sex
ratio apparently relates directly to the reproduction of a fish population, this endpoint is
Uncertainty Analysis Prioritisation Direct Emissions
71
considered more relevant than vitellogenin in an impact assessment context (Larsen et
al., 2010b). Hence, the endpoints used for the average toxicity calculation include the
inhibition of growth and photosynthesis for algae, mortality or immobility (Daphnia)
for invertebrates, and mortality or change in sex ratio for fish.
1.2.2 Uncertainty analysis
The propagation of the uncertainty and variability of model parameters in the output
results was quantified by Monte Carlo analysis. The parameters included in the analysis
are described in the Appendix C, Table 20. The analysis includes the following factors:
(1) The variability of effluent concentrations, direct photolysis rates and
continental-scale environmental parameters (freshwater pH, rainfall, freshwater
concentration of suspended matter, dissolved organic carbon, and ˙OH).
(2) The uncertainty of the EEF. Uncertainty distributions of HC50EC50 values
were estimated according to the parametric estimator, as recommended by
(Payet 2004). Moreover, the parametric estimator is based on the geometric
mean, which is the most robust average estimator for HC50EC50 (Larsen and
Hauschild, 2007b). However, the uncertainty of extrapolating average chronic
toxicity, i.e., chronic HC50EC50, from average acute toxicity was not addressed in
the present study, nor was the uncertainty of extrapolating and estimating
individual endpoints.
(3) The uncertainties associated with the regression equations adopted in the
model to estimate partition coefficients, bioconcentration factors and
biodegradation rates. The procedure to compute the uncertainty parameters of
estimated fate parameters is described in detail in Morais et al. (2013ab). In
short, the training and validation sets used to derive the regression methods
applied in the present study (Franco and Trapp, 2008; USEPA, 2008; Fu et al.,
2009; USEPA, 2009) were used to derive mean residual errors and their
probability distributions and were fit into the regressions.
(4) The experimental parameter values (partition coefficients, biodegradation
half-lives, and kOH). The geometric mean and the geometric standard deviation
of experimental values were set as uncertainty parameters, assuming a lognormal
distribution.
Uncertainty Analysis Prioritisation Direct Emissions
72
1.3 Results and discussion Figure 8 shows the comparative ecotoxicological impact of PCs emitted directly from
WWTP effluents to the freshwater compartment. A general condition for impact
assessment methodologies is that the impact indicator be additive (Hauschild 2007).
Hence, the contribution of each PC’s uncertainty to the variance of the total ecotoxicity
can be computed; these results are shown in Figure 9. The total ecotoxicity impact is
6.51×10⁻² PAF·m3·d per m3 of effluent (95% confidence interval = 2.84×10⁻²–6.61×10-
1), and to rank PCs for further discussion, it is assumed that the PCs of most concern are
those totalling a 90% contribution to the total impact variance. For the PCs of most
concern, the contribution of model parameters to the variance of the results of Figure 8
is shown in Figure 10. The contribution to the variance provides an approximation of
the percentage of the variance or uncertainty of an output result caused by the variability
or uncertainty of a given model parameter. The contribution is calculated by squaring
the correlation coefficients between model parameters and impact results, for a given
number of trials, and normalising them to 100%. Generally, for the substances of most
concern, the HC50 parameter is the most relevant one for the statistical spread of impact
results shown in Figure 2. For most substances, the parametric quantification of HC50
uncertainty is based on only 3 data values, which typically produces wide confidence
limits (Larsen and Hauschild, 2007a), making the statistical differentiation between
substances ambiguous.
1.3.1 Antineoplastics
The antineoplastic tamoxifen displays the highest median ecotoxicity impact (Figure 8).
The uncertainty of the HC50 parameter contributes 93.8% of the variance of the
tamoxifen impact results (Figure 4). Only 2 experimental acute EC50 values, covering 1
trophic level, were obtained in the present study (Appendix C, Table 19). The
ecotoxicological datum on algae was estimated by ECOSAR. The quantification of this
QSAR method’s uncertainty is not considered in the present study, as stated above;
therefore, its influence on impact results is unclear. In addition, the EC50 value for
crustaceans was extrapolated from the NOEC. The inherent uncertainty of extrapolating
ecotoxicological endpoints is also not considered in the present study. Overall, a more
comprehensive ecotoxicological study is needed. Moreover, the calculated impact of
tamoxifen is based on very limited data on measurements in WWTP effluents. Roberts
Uncertainty Analysis Prioritisation Direct Emissions
73
and Thomas (2006) reported concentrations ranging from 0.146 to 0.369 µg/l in a
WWTP in the UK, and Coetsier et al. (2009) reported detected concentrations ranging
from 0.053 to 0.102 µg/l in a WWTP in France. According to the outcome of the
present study, tamoxifen should be subject to monitoring in WWTP effluents for more
conclusive results. The neutral form of tamoxifen, with an estimated log KOW of 6.30
(USEPA, 2008), is highly hydrophobic. Moreover, tamoxifen is predominantly found in
the basic form at pH 7 (pKa = 8.52); therefore, electrostatic interactions may play a
significant role in its partitioning into negatively charged sorption sites of particles and,
consequently, in its removal from WWTPs. The environmental occurrence of tamoxifen
is, however, relatively common. It was detected in all samples from the Ebro River in
Spain and from its tributaries at mean concentrations of 18.9 and 22.7 ng/l, respectively
(López-Serna et al., 2012). In the River Tyne, UK tamoxifen concentrations ranged
from 27 to 212 ng/l, with a median concentration of 53 ng/l (Roberts and Thomas,
2006). Thomas and Hilton (2004) reported similar values in 5 UK estuaries. Another
issue of concern, and a subject for further study, is the depletion of tamoxifen, which
may be underestimated in the aquatic environment because no data on indirect
photolysis are available in the literature. Nevertheless, this compound, which has double
bonds and aromatic rings, may react with chemical transients generated by natural water
constituents under sunlight, especially with the extremely reactive hydroxyl radical that
can abstract hydrogen from saturated organics, add to double bonds or add to aromatic
rings. In contrast, the chronic ecotoxicity of tamoxifen derivatives produced by direct
photolysis revealed no significant differences in comparison to the parental compound
(DellaGreca et al., 2007); therefore, the overall impact of tamoxifen may be
underestimated, given that photoproducts were not included in the present study.
1.3.2 Analgesics/anti-inflammatories
Mefenamic acid is a widely used non-steroidal anti-inflammatory compound and is
commonly found in effluents (e.g., Tauxe-Wuersch et al., 2005; Barron et al., 2009;
Kim et al., 2009a; Radjenovic et al., 2009; Rosal et al., 2010a). Literature data on
mefenamic acid concentrations in WWTP effluents vary by 3 orders of magnitude, from
0.005 (Kasprzyk-Hordern et al., 2009) to 3.0 µg/l (Tauxe-Wuersch et al., 2005). The
variability of the effluent concentration contributes 97.7% of the variance of the impact
of mefenamic acid. However, the calculated effect of this anti-inflammatory may be
Uncertainty Analysis Prioritisation Direct Emissions
74
overestimated, given that Werner et al. (2005) suggested that photosensitisation by
excited triplet-state DOM may contribute to the environmental degradation of
mefenamic acid. The influence of this degradation mechanism on the calculated effect
remains unknown in the present study. Concerning environmental occurrence,
mefenamic acid was not detected in samples from the Ebro River, Spain, or its
tributaries (López-Serna et al. (2012). In contrast, it was detected in 2 rivers in South
Wales, UK at a maximum concentration of 33 ng/l (Kasprzyk-Hordern et al., 2009).
The calculated impact of aminopyrine is based on estimated ecotoxicological data. Even
excluding the uncertainty of ecotoxicity data estimation, the HC50 parameter has a
contribution of 97.4% to the variance of the impact of aminopyrine. Moreover, this
compound is not commonly detected in WWTP effluents. Ternes (1998) reported the
detection of aminopyrine at a maximum concentration of 1.0 µg/l in 3 WWTP effluents
during monitoring of 16 WWTPs in Germany. Andreozzi et al. (2003) reported
detection in a WWTP in France at a concentration of 0.43 µg/l; however, the same
authors reported no detection in another WWTP effluent in France, 3 WWTPs in Italy,
1 WWTP in Sweden and another WWTP in Greece. Poor sorption to particles in
WWTPs may be expected, given that the predominant neutral form of this basic
compound at pH 7 (pKa = 5.0) has an estimated log KOW of 0.6 (USEPA, 2008).
Therefore, depending on the role of its biodegradation in WWTPs, a very low influent
concentration or non-existent discharge may have been observed in the studied WWTPs
in which aminopyrine was not detected in the effluents; however, no data on influent
concentrations were reported in the referred studies. In fact, the human clinical use of
aminopyrine is widely banned due to the risk of agranulocytosis and due to its potential
to produce carcinogenic nitrosamines (U.N., 2003); hence, its presence in WWTP
discharges may be caused by low levels of application in veterinary medicine or by
industrial release (Ternes, 1998). No abiotic degradation data are available; however,
aminopyrine is expected to be susceptible to indirect photolysis. In addition, it contains
chromophores that absorb at wavelengths >290 nm and may therefore also be
susceptible to direct photolysis; hence, the residence time of aminopyrine in the aquatic
environment may be overestimated. Concerning its occurrence in the environment,
aminopyrine was not detected in 20 rivers in Germany (Ternes, 1998).
The concentration reported in the literature on the occurrence of the opiate codeine in
WWTP effluents varies by 3 orders of magnitude (Gómez et al. 2007; Wick et al.,
2009), from 0.022 to 15.59 µg/l. This variability of the effluent concentration
Uncertainty Analysis Prioritisation Direct Emissions
75
contributes 66.6% of the variance of impact results. The HC50 parameter contributes
32.8%; furthermore, estimated data were applied. Codeine is expected to be susceptible
to indirect photolysis and contains chromophores that absorb at wavelengths >290 nm;
therefore, it may also be susceptible to direct photolysis.
The concentration of tramadol in WWTP effluents reported in the literature varies by 3
orders of magnitude, from 0.02 to 97.62 µg/l (Kasprzyk-Hordern et al., 2009, Wick et
al., 2009). The effluent concentration of tramadol contributes 75.3% to the impact
variance. The HC50 parameter represents 24.1% of the tramadol impact result variance;
furthermore, for experimental EC50 values of 2 trophic levels, crustaceans and fish, the
species were not specified in the literature. In terms of environmental occurrence,
tramadol was detected in 2 rivers in South Wales, UK at a maximum concentration of
5970 ng/l (Kasprzyk-Hordern et al., 2009).
1.3.3 β-blockers
The HC50 parameter contributes between 70-86% to the impact results for variance of
the β-blockers betaxolol, oxprenolol, and propanolol. Moreover, oxprenolol ecotoxicity
data have been estimated for all trophic levels, and in the case of betaxolol, only 1 acute
EC50 value is experimental. Propanolol is commonly measured in WWTP effluents
(e.g., Maurer et al., 2007; Wick et al., 2009; Alder et al., 2010); however, limited data
are available on the occurrence of oxprenolol and betaxolol in WWTP effluents. The
former was detected in a range of 0.01 to 0.05 µg/l in 2 WWTPs in Italy, 2 WWTPs in
France and 1 WWTP in Greece (Andreozzi et al., 2003). The same authors reported no
detection in the effluent of a Swedish WWTP. Among 29 WWTPs that were studied in
Germany, betaxolol was detected in 50% of the WWTPs at a maximum concentration
of 0.19 µg/l and a median concentration of 0.057 µg/l (Ternes, 1998). In contrast, it was
not detected in 3 WWTPs in Italy, 2 WWTPs in France, 1 WWTP in Sweden, 1 WWTP
in Greece (Andreozzi et al., 2003) or 1 WWTP in Germany (Wick et al., 2009). In terms
of environmental occurrence, no literature data on oxprenolol were found; however,
betaxolol was not detected in 29 rivers in Germany, even when it was present in WWTP
effluents (Ternes, 1998), nor was it detected in the Ebro River in Spain (López-Serna et
al., 2012). According to the molecular structures of β-blockers, indirect photolysis may
play a role in their persistence in the aquatic environment; however, except for
propanolol, no experimental data on photosensitisation were found in the literature.
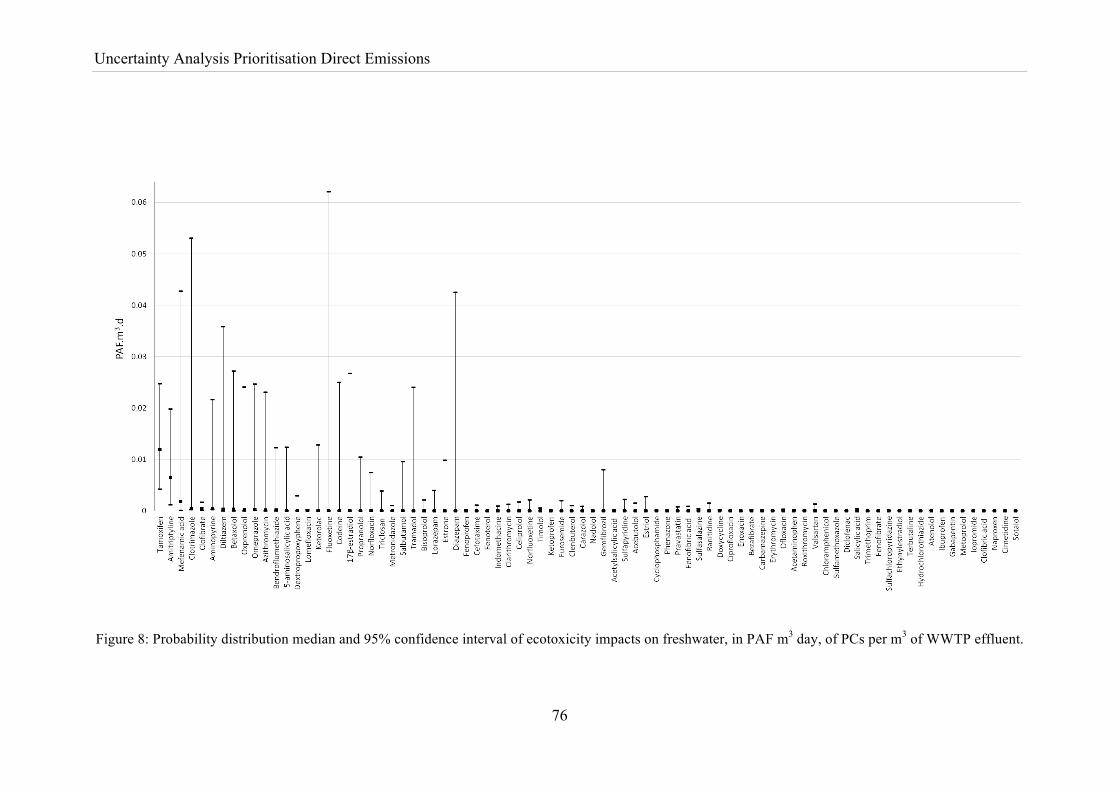
Uncertainty Analysis Prioritisation Direct Emissions
76
Figure 8: Probability distribution median and 95% confidence interval of ecotoxicity impacts on freshwater, in PAF m3 day, of PCs per m3 of WWTP effluent.
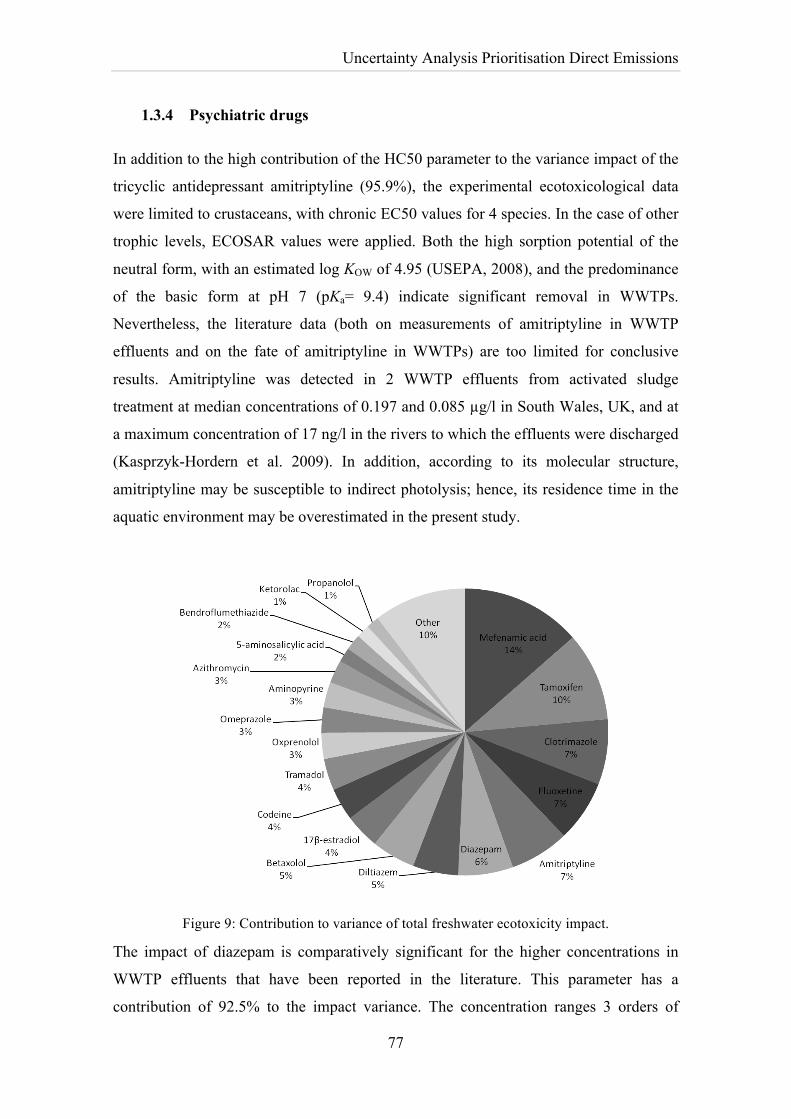
Uncertainty Analysis Prioritisation Direct Emissions
77
1.3.4 Psychiatric drugs
In addition to the high contribution of the HC50 parameter to the variance impact of the
tricyclic antidepressant amitriptyline (95.9%), the experimental ecotoxicological data
were limited to crustaceans, with chronic EC50 values for 4 species. In the case of other
trophic levels, ECOSAR values were applied. Both the high sorption potential of the
neutral form, with an estimated log KOW of 4.95 (USEPA, 2008), and the predominance
of the basic form at pH 7 (pKa= 9.4) indicate significant removal in WWTPs.
Nevertheless, the literature data (both on measurements of amitriptyline in WWTP
effluents and on the fate of amitriptyline in WWTPs) are too limited for conclusive
results. Amitriptyline was detected in 2 WWTP effluents from activated sludge
treatment at median concentrations of 0.197 and 0.085 µg/l in South Wales, UK, and at
a maximum concentration of 17 ng/l in the rivers to which the effluents were discharged
(Kasprzyk-Hordern et al. 2009). In addition, according to its molecular structure,
amitriptyline may be susceptible to indirect photolysis; hence, its residence time in the
aquatic environment may be overestimated in the present study.
Figure 9: Contribution to variance of total freshwater ecotoxicity impact.
The impact of diazepam is comparatively significant for the higher concentrations in
WWTP effluents that have been reported in the literature. This parameter has a
contribution of 92.5% to the impact variance. The concentration ranges 3 orders of
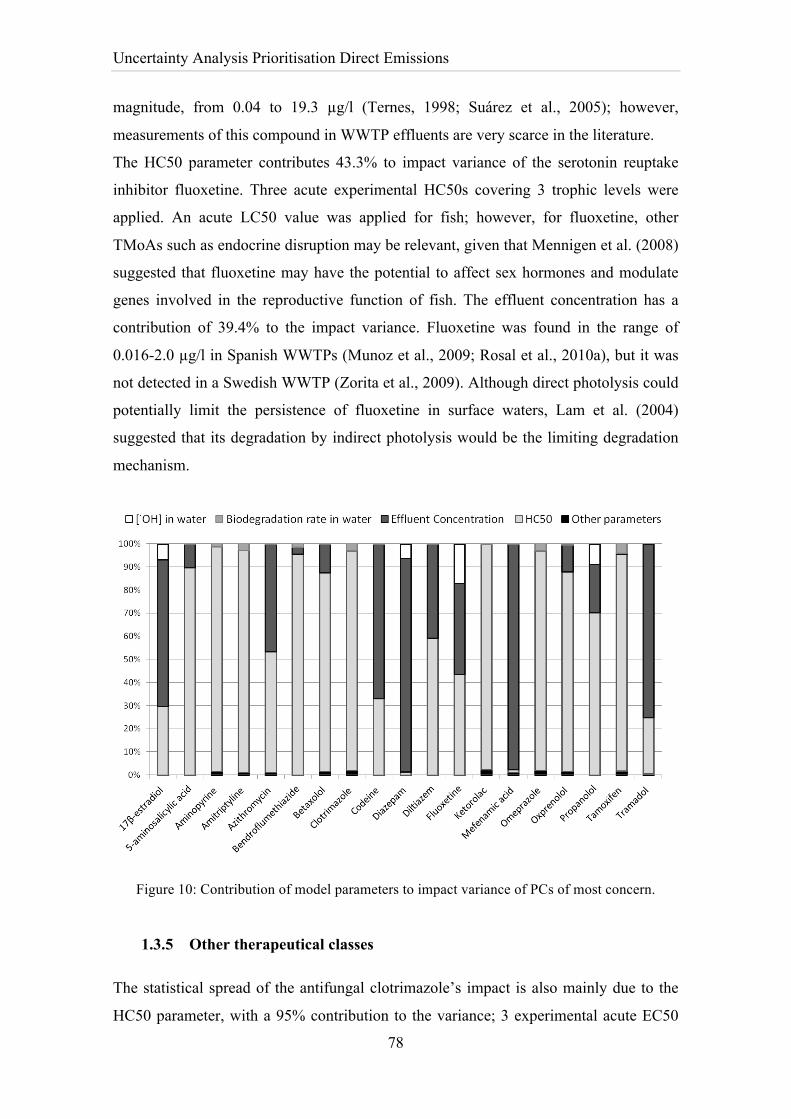
Uncertainty Analysis Prioritisation Direct Emissions
78
magnitude, from 0.04 to 19.3 µg/l (Ternes, 1998; Suárez et al., 2005); however,
measurements of this compound in WWTP effluents are very scarce in the literature.
The HC50 parameter contributes 43.3% to impact variance of the serotonin reuptake
inhibitor fluoxetine. Three acute experimental HC50s covering 3 trophic levels were
applied. An acute LC50 value was applied for fish; however, for fluoxetine, other
TMoAs such as endocrine disruption may be relevant, given that Mennigen et al. (2008)
suggested that fluoxetine may have the potential to affect sex hormones and modulate
genes involved in the reproductive function of fish. The effluent concentration has a
contribution of 39.4% to the impact variance. Fluoxetine was found in the range of
0.016-2.0 µg/l in Spanish WWTPs (Munoz et al., 2009; Rosal et al., 2010a), but it was
not detected in a Swedish WWTP (Zorita et al., 2009). Although direct photolysis could
potentially limit the persistence of fluoxetine in surface waters, Lam et al. (2004)
suggested that its degradation by indirect photolysis would be the limiting degradation
mechanism.
Figure 10: Contribution of model parameters to impact variance of PCs of most concern.
1.3.5 Other therapeutical classes
The statistical spread of the antifungal clotrimazole’s impact is also mainly due to the
HC50 parameter, with a 95% contribution to the variance; 3 experimental acute EC50
Uncertainty Analysis Prioritisation Direct Emissions
79
values covering 3 trophic levels were applied. According to its molecular structure,
clotrimazole is expected to be susceptible to indirect photolysis; therefore, its residence
time in the aquatic environment may be overestimated. The neutral form of
clotrimazole, which predominates at pH 7 (pKa= 5.22), is highly hydrophobic, with an
estimated log KOW of 6.26 (USEPA, 2008); therefore, significant partitioning to
particles in WWTPs may be observed. There are limited data on the occurrence of this
topical product in WWTP effluents at detectable concentrations; however, clotrimazole
is a widely used over-the-counter antifungal agent. Clotrimazole was not detected in the
WWTP effluent of a former production plant, even when clotrimazole was found in the
WWTP influent (OSPAR, 2005). Conversely, Roberts and Thomas (2006) reported
concentrations ranging from 0.014 to 0.027 µg/l in a WWTP in the UK, and Kahle et al.
(2008) reported concentrations ranging between 0.005 and 0.006 µg/l in the effluents of
2 Swiss WWTPs. In terms of environmental occurrence, clotrimazole was not detected
in the Elbe and Saale Rivers in Germany at any of the measured points (OSPAR, 2005).
However, it was detected in concentrations ranging from 6 to 34 ng/l, with a median of
21 ng/l, in the River Tyne, UK (Roberts and Thomas, 2006) and was the most
frequently detected of 14 pharmaceuticals analysed in UK estuaries, with a maximum
concentration of 22 ng/l and a median concentration of 7 ng/l (Hilton and Thomas,
2003).
The HC50 parameter contributes 59% to the impact variance of the antihypertensive
receptor diltiazem. This parameter is of even greater concern, given that only 1
experimental EC50 value was found in the literature. Diltiazem was found at
concentrations ranging between 0.095 and 1.156 µg/l in 2 WWTP effluents in the UK
and at concentrations ranging between 2 and 40 ng/l in the rivers to which those
effluents are discharged (Kasprzyk-Hordern et al., 2009). No abiotic degradation data
are available. However, diltiazem is expected to be susceptible to indirect photolysis,
and because it has chromophores that absorb at wavelengths >290 nm, it has the
potential to be degraded by direct photolysis; therefore, the depletion of diltiazem in the
aquatic environment may be underestimated.
The HC50 parameter contributes 95% to the impact variance of the proton-pump
inhibitor omeprazole. Moreover, only 1 experimental EC50 value was found in the
literature. Very limited data on measurements of omeprazole in WWTP effluents are
available in the literature; nevertheless, it is one of the most widely prescribed
pharmaceuticals. It was detected at a maximum concentration of 0.922 µg/l and an
Uncertainty Analysis Prioritisation Direct Emissions
80
average concentration of 0.322 µg/l in a WWTP effluent in Spain (Rosal et al., 2010a).
Omeprazole is expected to undergo hydrolysis in the environment due to the presence of
functional groups that hydrolyse under environmental conditions, and it may also be
susceptible to direct and indirect photolysis.
In addition to the high contribution of HC50 to the variance of the macrolide antibiotic
azithromycin’s impact result (52.2%), EC50 values were estimated. The effluent
concentration contributes 46.7% to the impact variance. Azithromycin was detected in a
range between 0.040 and 0.400 µg/l in a WWTP in Switzerland (Göbel et al., 2005) and
in a range between 0.035 and 0.160 µg/l in a WWTP in Spain (Prieto-Rodríguez et al.,
2013). Literature reports of its environmental occurrence are scarce. It was detected in
the Ebro River in Spain at a median concentration of 4.57 ng/l (López-Serna et al.,
2012). The photodegradation of azithromycin was shown to be enhanced in the presence
of nitrates and humic acids (Tong et al., 2011), which indicates the role of indirect
photolysis in the persistence of this compound in the environment. However, indirect
photodegradation was not included in the present study for this compound; therefore,
the impact of azithromycin is most likely overestimated.
Concentrations of the hormone 17β-estradiol in WWTP effluents reported in the
literature vary by 2 orders of magnitude (Baronti et al. 2000; Clara et al., 2004), from
0.0007 to 0.0180 µg/l. The variability of effluent concentration represents 63.6% of the
impact variance. The HC50 parameter contributes 29.2% to the variance. Experimental
acute EC50 values for 6 species were applied; however, the EC50 value for algae was
estimated. 17β-estradiol was detected in rivers at levels ranging from 0.002 to 0.006
ng/l (Laganà et al., 2004; Zuehlke et al., 2005).
The diuretic bendroflumethiazide, the anti-inflammatories 5-aminosalicylic acid and
ketorolac, and the lipid regulator clofibrate are discussed in the Appendix C (Section 4).
1.3.6 Additional considerations
Table 6 summarises future research topics for the PCs of greatest concern. These topics
can be related to 3 issues: a) the fate of PCs in WWTPs, b) substance-specific modelling
parameters, and c) lack of spatial and time resolution models. The first topic includes
compounds with very limited data on measurements or detection in WWTP effluents,
such as tamoxifen or amitriptyline. These substances should be subject to further
monitoring in WWTPs, depending on geographical usage patterns, for more conclusive
Uncertainty Analysis Prioritisation Direct Emissions
81
results. This category should also include compounds whose impact result would be
most sensitive to variations of the emission concentration. Ideally, a comparatively well
characterised drug from an impact perspective would account for low variance of output
results due to environmental fate and transport modelling parameters, either estimated
or experimental, and due to EEF characterisation. The uncertainty of its impact result,
from a modelling perspective, would be related mainly to the variability of the
concentration in WWTP effluents, depending on geographical and seasonal usage
patterns, treatment technologies, and operation conditions. The focus of research for
these compounds should be detailed ecological risk assessments possibly leading to
research and development on the operation and design of WWTPs to improve the
reduction of the compounds’ effluent concentrations. However, the compounds most
sensitive to the emission concentration, such as diazepam or mefenamic acid, have other
research priorities either because of limited data on their occurrence or incomplete
modelling parameters.
The second issue includes drugs whose impact results are mostly sensitive to the
uncertainty of substance-specific environmental fate and transport modelling
parameters, such as degradation rates or partitioning coefficients, or to EEF
characterisation, as well as drugs whose impact result may be affected by modelling
incompleteness, either from the lack of abiotic degradation data (such as for omeprazole
or azithromycin) or from the exclusion of degradation products (such as for tamoxifen).
These compounds should be subjected to further experimental research according to the
most sensitive parameters because of a lack of precise knowledge regarding those
parameters. The third issue, the lack of spatial and time resolution models, addresses the
variability of landscape parameters, such as freshwater pH or [˙OH], and the seasonal
variation of direct photolysis rates. However, for the compounds of greatest concern,
only the spatial variability is somewhat significant, and only in the case of [˙OH]. The
large scale applied in the present study displays a great variety of landscape
characteristics; nevertheless, the uncertainty regarding the HC50 parameter and the
variability of the effluent concentration predominate in terms of the contribution of
variance to the output results.
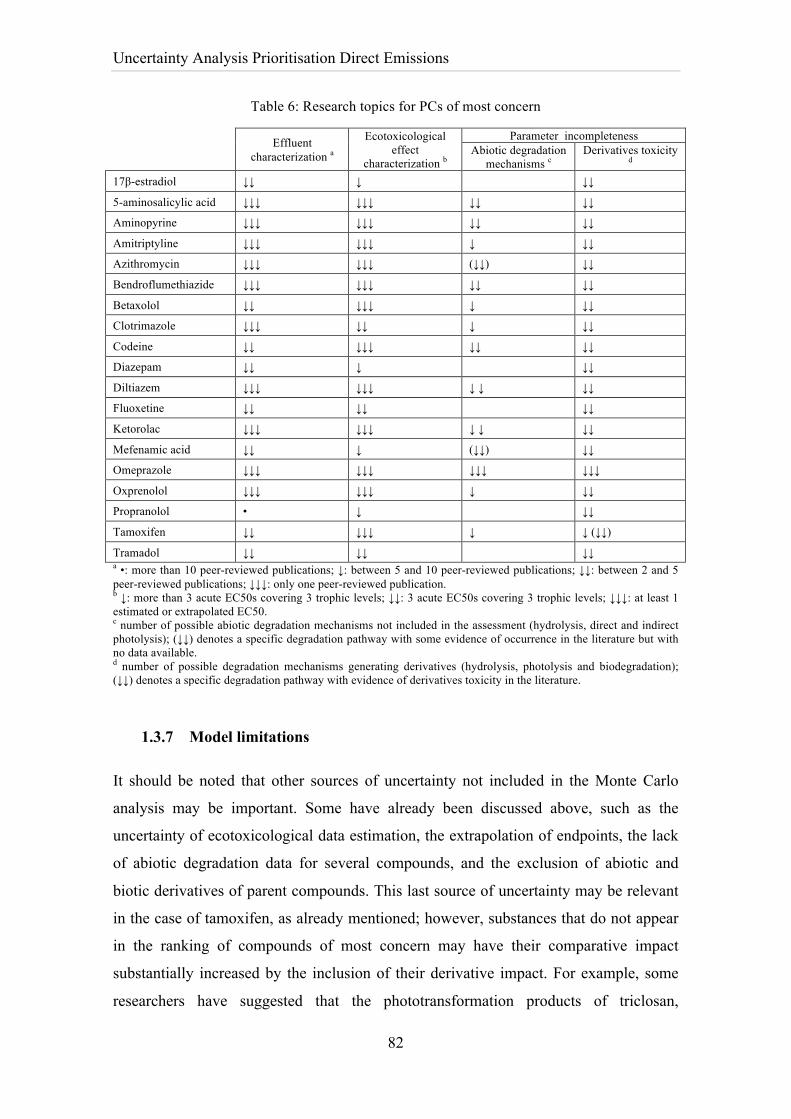
Uncertainty Analysis Prioritisation Direct Emissions
82
Table 6: Research topics for PCs of most concern
Effluent characterization a
Ecotoxicological effect
characterization b
Parameter incompleteness Abiotic degradation
mechanisms c Derivatives toxicity
d 17β-estradiol ↓↓ ↓ ↓↓
5-aminosalicylic acid ↓↓↓ ↓↓↓ ↓↓ ↓↓
Aminopyrine ↓↓↓ ↓↓↓ ↓↓ ↓↓
Amitriptyline ↓↓↓ ↓↓↓ ↓ ↓↓
Azithromycin ↓↓↓ ↓↓↓ (↓↓) ↓↓
Bendroflumethiazide ↓↓↓ ↓↓↓ ↓↓ ↓↓
Betaxolol ↓↓ ↓↓↓ ↓ ↓↓
Clotrimazole ↓↓↓ ↓↓ ↓ ↓↓
Codeine ↓↓ ↓↓↓ ↓↓ ↓↓
Diazepam ↓↓ ↓ ↓↓
Diltiazem ↓↓↓ ↓↓↓ ↓ ↓ ↓↓
Fluoxetine ↓↓ ↓↓ ↓↓
Ketorolac ↓↓↓ ↓↓↓ ↓ ↓ ↓↓
Mefenamic acid ↓↓ ↓ (↓↓) ↓↓
Omeprazole ↓↓↓ ↓↓↓ ↓↓↓ ↓↓↓
Oxprenolol ↓↓↓ ↓↓↓ ↓ ↓↓
Propranolol • ↓ ↓↓
Tamoxifen ↓↓ ↓↓↓ ↓ ↓ (↓↓)
Tramadol ↓↓ ↓↓ ↓↓ a •: more than 10 peer-reviewed publications; ↓: between 5 and 10 peer-reviewed publications; ↓↓: between 2 and 5 peer-reviewed publications; ↓↓↓: only one peer-reviewed publication. b ↓: more than 3 acute EC50s covering 3 trophic levels; ↓↓: 3 acute EC50s covering 3 trophic levels; ↓↓↓: at least 1 estimated or extrapolated EC50. c number of possible abiotic degradation mechanisms not included in the assessment (hydrolysis, direct and indirect photolysis); (↓↓) denotes a specific degradation pathway with some evidence of occurrence in the literature but with no data available. d number of possible degradation mechanisms generating derivatives (hydrolysis, photolysis and biodegradation); (↓↓) denotes a specific degradation pathway with evidence of derivatives toxicity in the literature.
1.3.7 Model limitations
It should be noted that other sources of uncertainty not included in the Monte Carlo
analysis may be important. Some have already been discussed above, such as the
uncertainty of ecotoxicological data estimation, the extrapolation of endpoints, the lack
of abiotic degradation data for several compounds, and the exclusion of abiotic and
biotic derivatives of parent compounds. This last source of uncertainty may be relevant
in the case of tamoxifen, as already mentioned; however, substances that do not appear
in the ranking of compounds of most concern may have their comparative impact
substantially increased by the inclusion of their derivative impact. For example, some
researchers have suggested that the phototransformation products of triclosan,
Uncertainty Analysis Prioritisation Direct Emissions
83
diclofenac or hydrochlorothiazide have a higher toxicity potential than their parent
compounds (Han et al., 2000; Schmitt-Jansen et al., 2007). Nevertheless, the inclusion
of phototransformation products impact is possible, if the chemical structures are
identified, by applying the method proposed by (van Zelm et al., 2010b).
In addition, the uncertainty of the influence of pH on direct and indirect photolysis
rates, the uncertainty of the application of a linear dose-response curve for the
calculation of EEFs, and the lack of spatial variation of background impacts in the AMI
method remain unclear. For example, for uncertainty of the influence of pH on the
abiotic degradation, the literature data on the direct phototransformation of triclosan
(pKa =8.1) applied in the present study are based on its anionic form (Tixier et al.,
2002), which is the dominant photochemical degradation pathway. Therefore, by
disregarding the influence of pH on the direct photolysis rate, the residence time of
triclosan in the freshwater environment may be underestimated for lower pH values.
1.4 Conclusions
Despite the high uncertainties of the PC impact results, which range up to 12 orders of
magnitude, and the model’s limitations and incompleteness, the outcome of the present
study allows priorities to be set for further experimental testing. Notably, some PCs of
greatest concern, such as tamoxifen, clotrimazole and oxprenolol, have rarely been
investigated previously with regard to their ecotoxicity, their occurrence in WWTPs, or
their degradation in the environment. Theoretically, the relevant PCs may be susceptible
to abiotic degradation. However, in general, no experimental data are available; hence,
the persistence of these PCs in the freshwater compartment is comparatively higher than
that of well-researched PCs that were not included on the ranking of priority drugs, such
as triclosan, diclofenac or ibuprofen. Ecotoxicity data remain to be the most critical
issue affecting impact or risk assessments of PCs. The present assessment is based on
only 3 data values for most of priority PCs (only approximately 4% of these compounds
have more than 3 EC50 values) that produced wide confidence limits. Moreover,
approximately 63% of the PCs of priority have at least 1 estimated or extrapolated
EC50. In short, several PCs were identified both for further WWTP monitoring and for
testing their ecotoxicity and their persistence in the environment.
Uncertainty Analysis Prioritisation Direct Emissions
84
1.5 Acknowledgments
Sérgio Alberto Morais is grateful to FCT-Fundação para a Ciência e a Tecnologia for a
Ph.D. grant (SFRH/BD/64599/2009). This work was supported by the Foundation of
Science and Technology (FCT) of the Portuguese Ministry of Science, Technology and
Higher Education (MCTES), through project PTDC/AAG-TEC/2692/2012, as well as
by the Ecotech Sudoe project (SOE2/P1/E377) “LCA and Ecodesign International
network for environmental innovation”.
Uncertainty Analysis Prioritisation Indirect Emissions
85
5. An Uncertainty Analysis Applied to the Prioritisation of Pharmaceuticals as Surface
Water Contaminants from Wastewater Treatment Plants: the Case of Indirect Emissions from
Amendment of Soils with Biosolids and Irrigation with Reclaimed Water
This paper was submitted to Water Research, under the same title.
Additional authors are Cristina Delerue-Matosa and Xavier Gabarrellb,c. aREQUIMTE/Instituto Superior de Engenharia do Porto (ISEP), Rua Dr. António
Bernardino de Almeida, 431 4200-072, Porto, Portugal. bSosteniPrA (UAB-IRTA-Inèdit), Institut de Ciència i Tecnologia Ambientals (ICTA),
Universitat Autònoma de Barcelona (UAB), 08193 Bellaterra, Barcelona, Spain. cDepartament d’Enginyeria Química, Escola d’Enginyeria, Universitat Autònoma de
Barcelona (UAB), 08193 Bellaterra, Barcelona, Spain.
5.1 Abstract
The comparative impact on freshwater ecosystems of pharmaceutical compounds from
indirect emission pathways from wastewater treatment plants was assessed to rank
compounds based on priority. The concentration probability distributions of 85
pharmaceutical compounds detected in the effluents of 179 European wastewater
treatment plants were computed, their concentrations in biosolids were estimated, and
their fates were calculated for the reuse of effluents as irrigation water and for the
application of biosolids as a soil amendment, both in agricultural soils. Because many
pharmaceutical compounds contain dissociating functional groups, their charges change
with solution pH, and thus, their transport behaviour may be affected; therefore, the
multimedia fate model uses regressions to estimate pH-dependent fate parameters. An
uncertainty analysis was performed using Monte Carlo analysis, which included the
uncertainty of the fate and ecotoxicity model parameters and the spatial variability of
landscape and meteorological characteristics at the European continental scale.
Several pharmaceutical compounds were identified as being of greatest concern,
including 4 analgesics/anti-inflammatories, 3 antibiotics, 2 diuretics, and 1 each of 4
other therapeutic classes. For most of these compounds, few or no experimental fate or
Uncertainty Analysis Prioritisation Direct Emissions
86
ecotoxicity data are available, and there have been limited reported occurrences in
effluents. The contribution of the estimated model parameters to the variance in the
output results and the lack of experimental abiotic degradation data for most of the
compounds helped to establish priorities for further additional research. The emissions
concentration, the ecotoxicity effect factor, and the solid-water partitioning coefficient
were the model parameters with the most significant effects on the uncertainty of the
output results. The spatial and temporal variation in the environmental characteristics
was found to be of minor significance to the output results.
Keywords: Pharmaceuticals, Reclaimed water, Biosolids, Freshwater ecotoxicity,
Dissociating organics, Wastewater treatment plants
5.2 Introduction
The presence of pharmaceutical compounds (PCs) in the environment with the potential
to induce adverse biological effects has been recognised as a concern for many years
(Tabak and Bunch, 1970; Richardson and Bowron, 1985). Some PCs are not fully
metabolised in the body, or their metabolites are reconverted into parent compounds;
some PCs may be disposed of in sewage systems via flushing and, thereafter, not
completely eliminated in conventional wastewater treatment plants (WWTPs). Body
metabolisation and excretion followed by wastewater treatment is considered to be the
primary pathway by which biologically active PCs enter the environment (Jelic, Gros et
al. 2011). WWTP effluents are discharged to surface waters or reused for irrigation, and
the biosolids produced are applied to agriculture soil or landscapes as soil amendment
or disposed of in landfills. The benefits of effluent reuse and biosolids application in
agricultural soils are obvious. The use of WWTP effluents as reclaimed water can
increase the water supply in areas in which the water demand by the urbanised
population has exceeded the available natural water sources, becoming a limiting factor
for agricultural and industrial requirements (Ternes et al., 2007). In addition, the
application of biosolids to land, the option favoured internationally for sludge
management, contributes positively to recycling nutrients, soil properties, and fertility
(Clarke and Smith, 2011). However, several studies have investigated the occurrence
and fate of pharmaceuticals in irrigated soils with reclaimed water (e.g., Kinney et al.,
2006; Ternes et al., 2007; Borgman and Chefetz, 2013) and in biosolids-amended soils
(e.g., Lapen et al., 2008; Wu et al., 2010). In recent years, concern has arisen regarding
Uncertainty Analysis Prioritisation Indirect Emissions
87
the presence of WWTP-derived PCs in runoff and drainage water from cultivated fields,
either due to irrigation with reclaimed water and/or biosolids application, and the ability
of these PCs to reach the freshwater compartment (Topp et al. 2008; Yang et al., 2012).
Many studies regarding the direct emissions of PCs from WWTP effluents to surface
waters have been conducted; however, the indirect emission pathways are generally
neglected when examining the prioritisation of PCs for further monitoring or additional
research, especially in the case of the reclaimed water pathway. Moreover, past studies
examining the prioritisation of PCs from biosolids-amended soils do not account for the
dissociating properties of PCs (e.g., Eriksen, Amundsen et al., 2009) or are limited to a
few therapeutic classes (e.g., Oldenkamp et al., 2013).
In this study, we collected data from literature concerning PC occurrences in 179
WWTPs in Europe to provide a holistic view of the PCs of most concern in the indirect
emission pathways to the freshwater compartment. This study focuses on freshwater
ecosystems; terrestrial ecosystems and the risk of human exposure are out of the scope
of this research. A multimedia model was applied to prioritise PCs according to their
probabilistic impact on freshwater ecosystems from indirect emissions from WWTPs.
Research topics were prioritised for the compounds of most concern by identifying
important gaps in knowledge and by computing the contribution to the impact variance
of the uncertainty of the model parameters and the variability. Previously, a similar
assessment was performed concerning direct emissions to the freshwater compartment
(Morais et al., 2013a).
5.3 Methodology
5.3.1 Emission data
A survey of the occurrence of PCs in European WWTPs was performed to compute the
concentration probability distributions in either influents or effluents. This survey was
based on a recent review conducted by Verlicchi et al. (2012) on the global occurrence
of PCs in urban wastewater. For this Europe-focused study, 54 peer-reviewed
publications were collected from the cited review, covering 179 WWTPs located in
Austria, Denmark, Finland, France, Germany, Greece, Italy, Spain, Sweden,
Switzerland, and the UK, with capacities ranging from 6 000 to 2 500 000 population
equivalents. The concentration data included 85 drugs in 15 different classes: 20
analgesics/anti-inflammatories (including 1 metabolite), 15 antibiotics, 12 β-blockers, 8
Uncertainty Analysis Prioritisation Direct Emissions
88
psychiatric drugs, 7 lipid regulators (including 2 metabolites), 4 hormones, 4 β-agonists,
4 receptor antagonists, 3 antineoplastics, 2 antihypertensives, 2 diuretics, 1 proton-pump
inhibitor, 1 antiseptic, 1 contrast agent, and 1 antifungal (Appendix C, Table 17). The
quality of the effluent concentration data reported in the literature has been confirmed
according to the EC Technical Guidance Document (TGD) on Risk Assessment (EC,
2003). The geometric mean and the geometric standard deviation of the influent and
effluent concentrations of each compound were computed, assuming a lognormal
distribution and weighted by the population served in each WWTP. The WWTP
parameters of the Sewage Treatment Plant (STP) model of the EPI Suite™ (USEPA,
2008) and the biodegradation rates in WWTPs that were estimated by the same model
were applied in a mass balance to estimate PC concentrations in biosolids and their
confidence intervals, assuming steady-state concentrations (Appendix C, Table 17).
However, the estimated concentrations concern the raw sludge, and the potential effects
of sludge digestion on the removal of PCs were disregarded in the present study.
5.3.2 Fate and effect
A fate factor describes the marginal increase in the environmental concentration per unit
of emission. The fate calculations were performed using the multimedia model USEtox
(Rosenbaum et al., 2008) adapted for dissociating compounds (Morais et al., 2013ab).
Because many PCs contain dissociating functional groups, their charge changes with
solution pH, and thus, their transport behaviour may be affected. The adaptation of the
model includes regressions to estimate the pH-dependent fate parameters of the
dissociating compounds, such as partitioning coefficients and bioconcentration factors
(Franco and Trapp, 2008; Fu et al., 2009), if no suitable experimental values are
available in the literature. Moreover, in the biosolids-amended soil pathway, the
biosolids-amended soil compartment was modelled as a biosolids compartment nested
in the agricultural soil compartment to account for differences in the sorption,
desorption, and degradation of the compounds between the biosolids and soil matrices
(Morais, Delerue-Matos et al.). The model accounts for inter-‐media transport processes,
intra-media partitioning and degradation in the 5-compartment system (Figure 11), for
which the landscape characteristics of the USEtox European continental scale were
applied. To estimate direct and indirect photodegradation rates, a number of models and
assumptions were applied and are described in detail in Morais et al. (2013ab). Briefly,
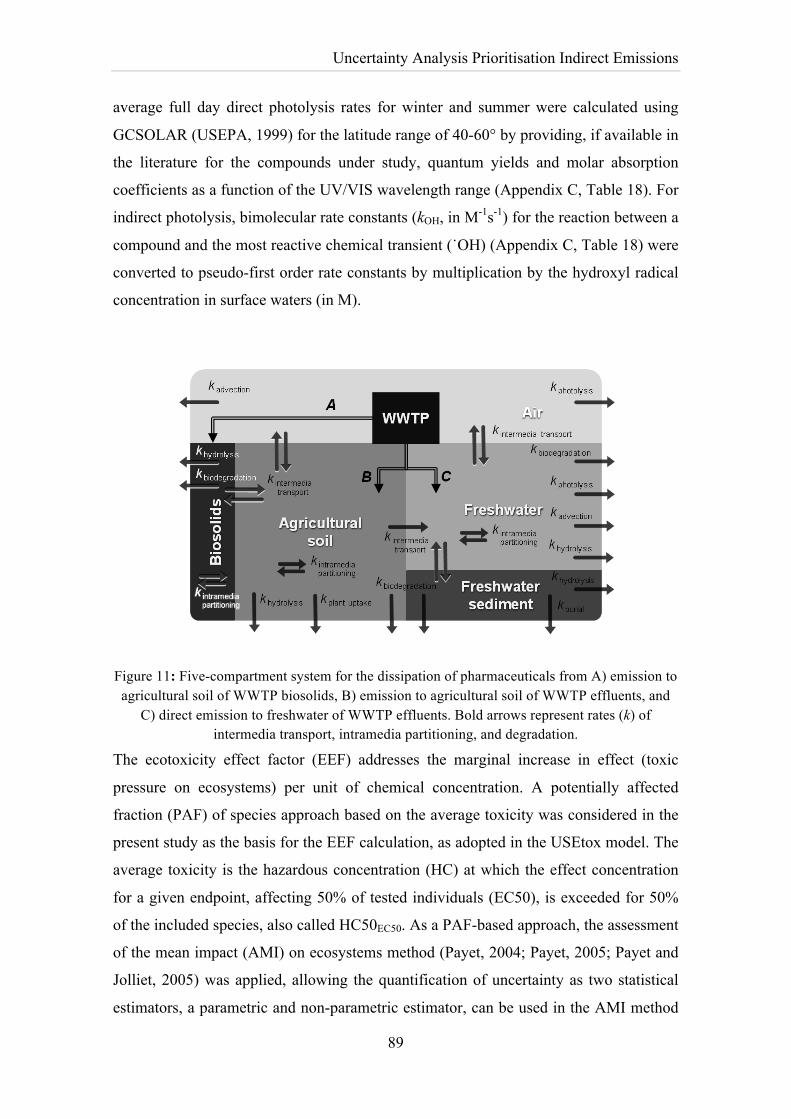
Uncertainty Analysis Prioritisation Indirect Emissions
89
average full day direct photolysis rates for winter and summer were calculated using
GCSOLAR (USEPA, 1999) for the latitude range of 40-60° by providing, if available in
the literature for the compounds under study, quantum yields and molar absorption
coefficients as a function of the UV/VIS wavelength range (Appendix C, Table 18). For
indirect photolysis, bimolecular rate constants (kOH, in M-1s-1) for the reaction between a
compound and the most reactive chemical transient (˙OH) (Appendix C, Table 18) were
converted to pseudo-first order rate constants by multiplication by the hydroxyl radical
concentration in surface waters (in M).
Figure 11: Five-compartment system for the dissipation of pharmaceuticals from A) emission to agricultural soil of WWTP biosolids, B) emission to agricultural soil of WWTP effluents, and
C) direct emission to freshwater of WWTP effluents. Bold arrows represent rates (k) of intermedia transport, intramedia partitioning, and degradation.
The ecotoxicity effect factor (EEF) addresses the marginal increase in effect (toxic
pressure on ecosystems) per unit of chemical concentration. A potentially affected
fraction (PAF) of species approach based on the average toxicity was considered in the
present study as the basis for the EEF calculation, as adopted in the USEtox model. The
average toxicity is the hazardous concentration (HC) at which the effect concentration
for a given endpoint, affecting 50% of tested individuals (EC50), is exceeded for 50%
of the included species, also called HC50EC50. As a PAF-based approach, the assessment
of the mean impact (AMI) on ecosystems method (Payet, 2004; Payet, 2005; Payet and
Jolliet, 2005) was applied, allowing the quantification of uncertainty as two statistical
estimators, a parametric and non-parametric estimator, can be used in the AMI method
Uncertainty Analysis Prioritisation Direct Emissions
90
to estimate the toxicity of a substance to biological species and the associated
confidence interval. The average toxicity focuses on the trophic structure by including
the EC50 values of at least 3 trophic levels: primary producers (algae), primary
consumers (crustaceans), and secondary consumers (fish) (Appendix C, Table 19).
Chronic EC50 values were preferred because of the low environmental concentrations
and the constant introduction of PCs, indicating that these compounds are more likely to
have chronic rather than acute toxic effects on aquatic biota (Carlsson et al., 2006; Fent
et al., 2006; Quinn et al., 2008). However, as chronic ecotoxicological data on PCs
remain rare, the best estimate assessment factor (AF) to extrapolate the chronic HC50
from the acute HC50, recommended by Larsen and Hauschild (2007b) and adopted in
the USEtox model (Huijbregts et al., 2010), was applied in the present study.
Furthermore, when acute EC50 values were not available, the best estimates from Payet
(2004) for extrapolation from other endpoints were also applied. When no experimental
data were available, ECOSAR v1.00 (Nabholz and Mayo-Bean, 2009) was used to
predict EC50s for algae, daphnia, and fish. The endpoints used for the average toxicity
calculation include the inhibition of growth and photosynthesis for algae, mortality or
immobility (Daphnia) for invertebrates, and mortality or, for the endocrine disruption
toxic mode of action, change in sex ratio for fish.
5.3.3 Uncertainty analysis
The propagation of the uncertainty and variability of the model parameters in the output
results was quantified using Monte Carlo analysis (Appendix C, Table 20). The analysis
includes the following factors:
1) the variability of the continental-scale environmental and meteorological
parameters (agricultural soil and freshwater pH, fraction of organic carbon in
soil (fOC), rainfall, freshwater concentration of suspended matter, dissolved
organic carbon, and ˙OH);
2) the variability of the direct photolysis rates;
3) the variability of the concentrations of PCs in the effluents in the reclaimed
water pathway;
4) the uncertainty of the concentrations if PCs in the biosolids in the biosolids-
amended soils pathway;
Uncertainty Analysis Prioritisation Indirect Emissions
91
5) the variability of the experimental parameter values (partition coefficients,
biodegradation half-lives, and kOH); the geometric mean and the geometric
standard deviation of experimental values were set as uncertainty parameters,
assuming a lognormal distribution;
6) the extrapolation of parameter values from one compartment to another
(biodegradation rates in biosolids) and from other parameter values (KDOC from
KOC);
7) the uncertainties associated with the regression equations adopted in the model
to estimate the partition coefficients, bioconcentration factors and
biodegradation rates; the training and validation sets used to derive the
regression methods applied in the present study (Franco and Trapp, 2008;
USEPA, 2008; Fu et al., 2009; USEPA, 2009) were used to derive the mean
residual errors and their probability distributions and were fit into the
regressions, as described in (Morais et al. 2013ab);
8) the uncertainty distributions of the HC50EC50 values, according to the parametric
estimator as recommended by (Payet, 2004), based on the assumption of a
lognormal distribution of data using the geometric mean as HC50EC50 and
Student’s t-statistics for the confidence interval (Payet, 2004; Payet, 2005); the
uncertainty of extrapolating chronic HC50EC50 from acute chronic HC50EC50 was
not addressed in the present study, nor was the uncertainty of extrapolating and
estimating individual endpoints.
5.4 Results and discussion
5.4.1 The pathway of irrigation with reclaimed water
Figure 12 shows the comparative ecotoxicological impact of PCs on the freshwater
compartment for the reclaimed water pathway. The contribution of each PC to the
variance of the total ecotoxicity impact is shown in Figure 13. The PCs of greatest
concern are those with a 90% contribution to the total impact variance, and these are
discussed further. The contribution of the model parameters to the variance of the
impact results of these PCs is shown in Figure 14.
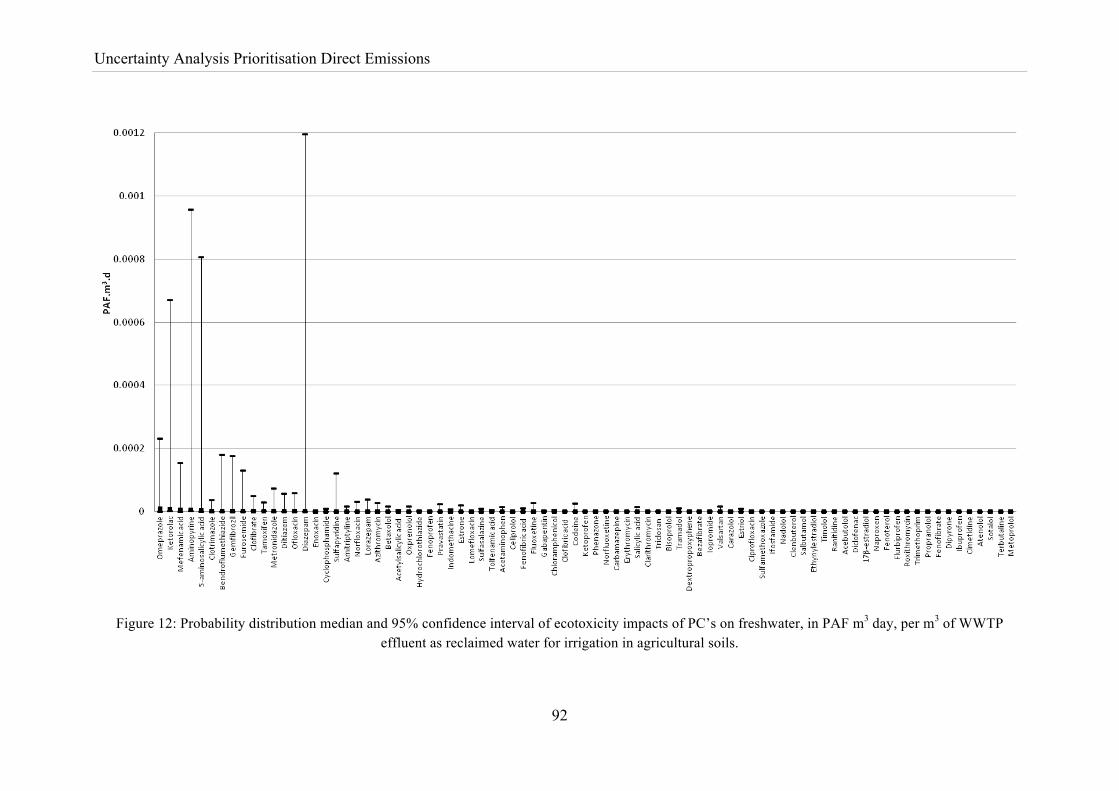
Uncertainty Analysis Prioritisation Direct Emissions
92
Figure 12: Probability distribution median and 95% confidence interval of ecotoxicity impacts of PC’s on freshwater, in PAF m3 day, per m3 of WWTP effluent as reclaimed water for irrigation in agricultural soils.
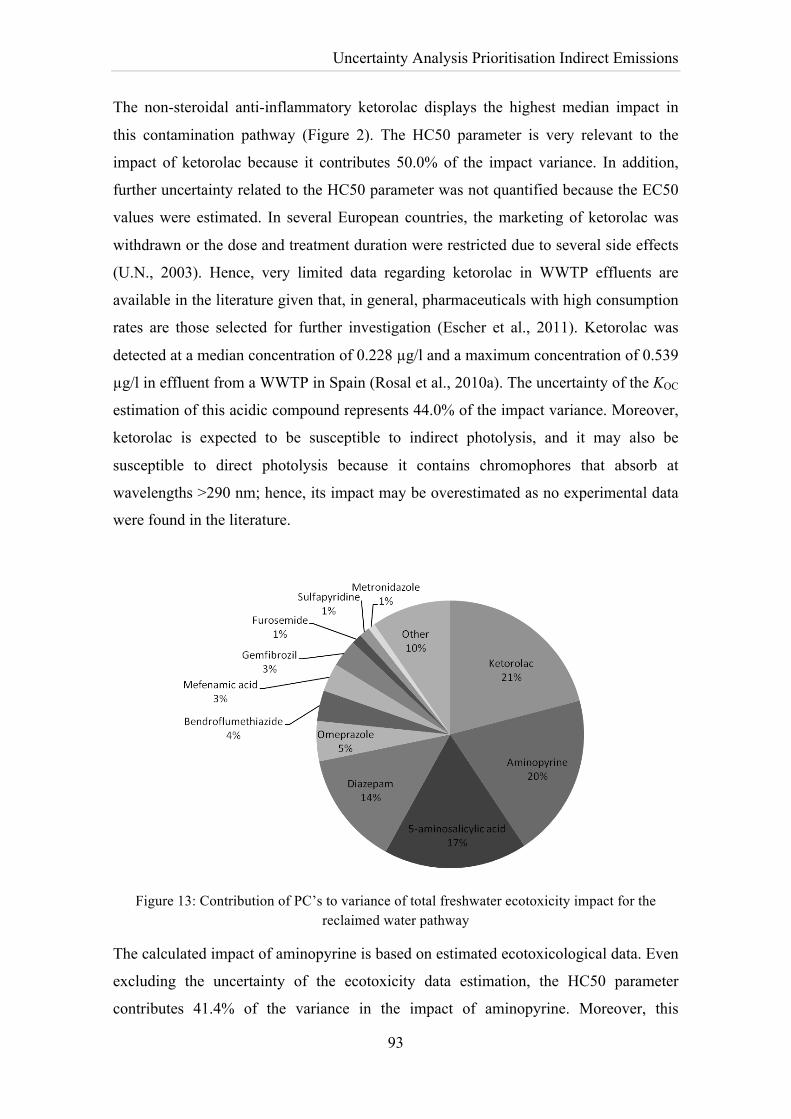
Uncertainty Analysis Prioritisation Indirect Emissions
93
The non-steroidal anti-inflammatory ketorolac displays the highest median impact in
this contamination pathway (Figure 2). The HC50 parameter is very relevant to the
impact of ketorolac because it contributes 50.0% of the impact variance. In addition,
further uncertainty related to the HC50 parameter was not quantified because the EC50
values were estimated. In several European countries, the marketing of ketorolac was
withdrawn or the dose and treatment duration were restricted due to several side effects
(U.N., 2003). Hence, very limited data regarding ketorolac in WWTP effluents are
available in the literature given that, in general, pharmaceuticals with high consumption
rates are those selected for further investigation (Escher et al., 2011). Ketorolac was
detected at a median concentration of 0.228 µg/l and a maximum concentration of 0.539
µg/l in effluent from a WWTP in Spain (Rosal et al., 2010a). The uncertainty of the KOC
estimation of this acidic compound represents 44.0% of the impact variance. Moreover,
ketorolac is expected to be susceptible to indirect photolysis, and it may also be
susceptible to direct photolysis because it contains chromophores that absorb at
wavelengths >290 nm; hence, its impact may be overestimated as no experimental data
were found in the literature.
Figure 13: Contribution of PC’s to variance of total freshwater ecotoxicity impact for the reclaimed water pathway
The calculated impact of aminopyrine is based on estimated ecotoxicological data. Even
excluding the uncertainty of the ecotoxicity data estimation, the HC50 parameter
contributes 41.4% of the variance in the impact of aminopyrine. Moreover, this
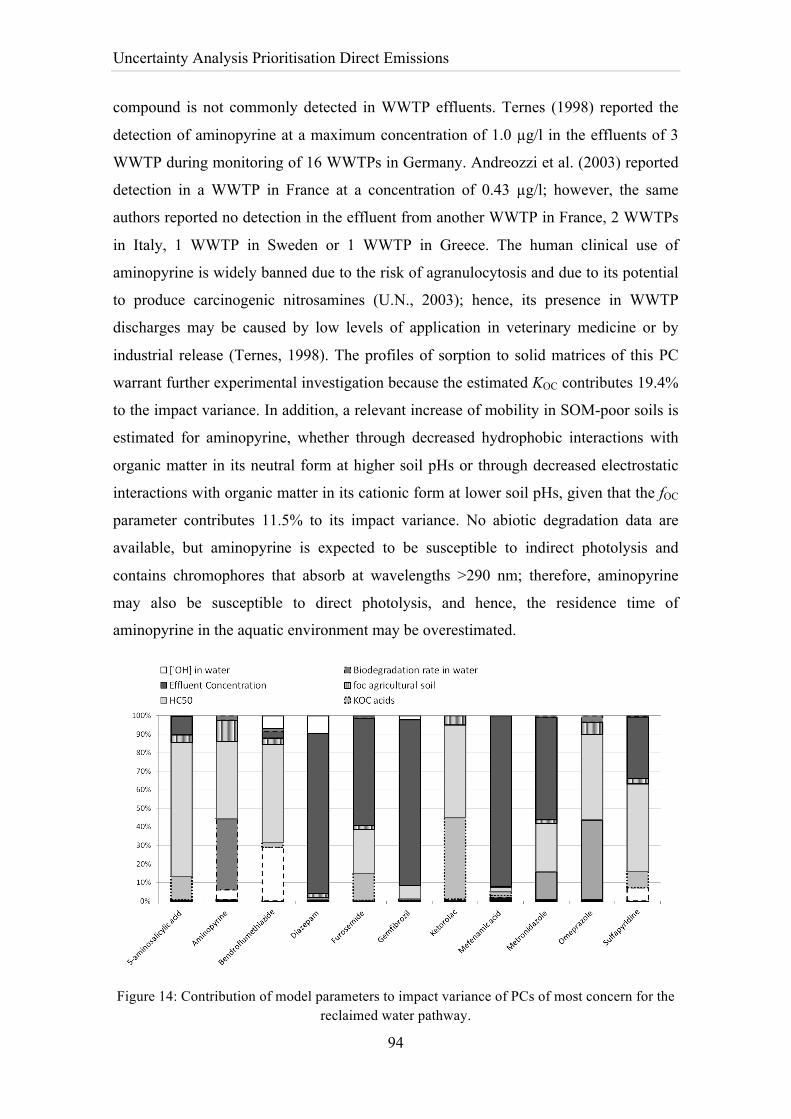
Uncertainty Analysis Prioritisation Direct Emissions
94
compound is not commonly detected in WWTP effluents. Ternes (1998) reported the
detection of aminopyrine at a maximum concentration of 1.0 µg/l in the effluents of 3
WWTP during monitoring of 16 WWTPs in Germany. Andreozzi et al. (2003) reported
detection in a WWTP in France at a concentration of 0.43 µg/l; however, the same
authors reported no detection in the effluent from another WWTP in France, 2 WWTPs
in Italy, 1 WWTP in Sweden or 1 WWTP in Greece. The human clinical use of
aminopyrine is widely banned due to the risk of agranulocytosis and due to its potential
to produce carcinogenic nitrosamines (U.N., 2003); hence, its presence in WWTP
discharges may be caused by low levels of application in veterinary medicine or by
industrial release (Ternes, 1998). The profiles of sorption to solid matrices of this PC
warrant further experimental investigation because the estimated KOC contributes 19.4%
to the impact variance. In addition, a relevant increase of mobility in SOM-poor soils is
estimated for aminopyrine, whether through decreased hydrophobic interactions with
organic matter in its neutral form at higher soil pHs or through decreased electrostatic
interactions with organic matter in its cationic form at lower soil pHs, given that the fOC
parameter contributes 11.5% to its impact variance. No abiotic degradation data are
available, but aminopyrine is expected to be susceptible to indirect photolysis and
contains chromophores that absorb at wavelengths >290 nm; therefore, aminopyrine
may also be susceptible to direct photolysis, and hence, the residence time of
aminopyrine in the aquatic environment may be overestimated.
Figure 14: Contribution of model parameters to impact variance of PCs of most concern for the
reclaimed water pathway.
Uncertainty Analysis Prioritisation Indirect Emissions
95
The impact results for the anti-inflammatory 5-aminosalicylic acid are primarily
sensitive to the HC50 parameter, which contributes 72.4% to the variance of the output
results. Moreover, only EC50 values for fish species are available in the literature, and
EC50s were estimated for the other trophic levels. Very limited data regarding 5-
aminosalicylic in WWTP effluents are available in the literature. It was detected at
median concentrations of 0.63 and 21.1 µg/l in the effluents of 2 WWTP that were used
in activated sludge treatments in South Wales, UK (Kasprzyk-Hordern et al., 2009). In
addition, 5-aminosalicylic contains chromophores that absorb at wavelengths >290 nm
and, therefore, may be susceptible to direct photolysis by sunlight and to
photosensitisation.
The range of diazepam effluent concentrations reported in the literature varies by 3
orders of magnitude, from 0.04 to 19.3 µg/l (Ternes, 1998; Suárez et al., 2005);
however, the occurrence of this compound in WWTP effluents is very rare in the
literature. The impact results of diazepam are especially sensitive to the variability of
effluent concentration, which contributes 86.4% of the impact variance. Because
diazepam displays the highest upper limit of the impact result confidence intervals, the
monitoring of this antihypertensive in WWTP effluents is necessary. Its 9.5%
contribution to the variance of the concentration of ˙OH radicals in freshwater suggests
an increased residence time of diazepam in poor quality, nitrate-containing waters.
Reactions mediated by ˙OH radicals tend to predominate in waters with high nitrate
concentrations (Lam et al., 2003), which generate ˙OH radicals. However, in low nitrate
waters, the contributions of other reactive intermediates to the degradation of diazepam,
which are unclear in the present study, may become more apparent.
The HC50 parameter contributes 46.0% to the impact variance of the proton-pump
inhibitor omeprazole. Moreover, only 1 experimental EC50 value was found in the
literature. Very limited data regarding concentrations of omeprazole in WWTP effluents
are available in the literature; nevertheless, it is one of the most widely prescribed
pharmaceuticals. Omeprazole was detected at a maximum concentration of 0.922 µg/l
and an average concentration of 0.322 µg/l in the effluent from a WWTP in Spain
(Rosal et al., 2010a). In addition, the uncertainty of KOC estimation represents 42.8% of
the variance. Moreover, omeprazole is expected to undergo hydrolysis in the
environment due to the presence of functional groups that hydrolyse under
environmental conditions, and it may also be susceptible to direct and indirect
Uncertainty Analysis Prioritisation Direct Emissions
96
photolysis; hence, the residence time in the freshwater compartment is most likely
overestimated.
Measurements of the thiazide diuretic bendroflumethiazide in WWTP effluents and in
the environment are rare. Kasprzyk-Hordern et al. (2009) reported detection at a median
concentration of 0.011 µg/l and a maximum concentration of 0.058 µg/l in the effluent
from a WWTP in Wales, UK; conversely, no detection was reported at any other
WWTP plant (limit if detection = 0.8 ng/l). In addition, it was not detected in the river
into which the former WWTP effluent was discharged (limit of detection = 0.5 ng/l).
Bendroflumethiazide is primarily sensitive to the HC50 parameter estimation, with a
52.9% contribution to its impact variance. In addition, ecotoxicological data were
estimated for all trophic levels. The agricultural soil pH has a contribution of 28.8%,
given that the anionic form of bendroflumethiazide occurs at higher soil pHs (pKa =
8.50), thus displaying reduced sorption capacity into the solid matrix. No abiotic
degradation data are available; however, bendroflumethiazide may be susceptible to
indirect and direct photolysis because it contains chromophores that absorb at
wavelengths >290 nm.
The non-steroidal anti-inflammatory mefenamic acid is widely used and commonly
found in effluents and biosolids (e.g., Tauxe-Wuersch et al. 2005; Barron et al., 2009;
Kim et al., 2009a; Radjenovic et al., 2009; Rosal et al., 2010a). Mefenamic acid is
essentially in its anionic form at pH 7 (pKa = 4.20), and thus, poor sorption to particles
may be expected in WWTPs; therefore, depending on consumption patterns, mefenamic
acid may be present at significant concentrations in WWTP effluents. Concentrations of
mefenamic acid in WWTP effluents in the literature vary by 3 orders of magnitude,
from 0.005 (Kasprzyk-Hordern et al., 2009) to 3.0 µg/l (Tauxe-Wuersch et al., 2005).
At the higher concentrations in the reported range, a significant impact is estimated
because the effluent concentration parameter represents 92.0% of the impact variance.
However, the comparative impact results of this anti-inflammatory may be
overestimated as Werner et al. (2005) suggested that photosensitisation by excited
triplet-state DOM may contribute to the environmental degradation of mefenamic acid.
The influence of this degradation mechanism on the comparative impact results is yet
unknown in the present study.
The lipid regulator gemfibrozil is essentially in its anionic form at environmentally
relevant pHs (pKa = 4.48), thus displaying comparatively higher availability for
Uncertainty Analysis Prioritisation Indirect Emissions
97
transport to the freshwater compartment. This pharmaceutical is commonly found in
WWTP effluents (e.g., Ternes, 1998; Andreozzi et al, 2003; Munoz et al., 2009) and is
especially sensitive to the effluent concentration parameter, representing 89.4% of its
impact variance. The concentrations of gemfibrozil in WWTP effluents reported in the
literature range 3 orders of magnitude, from 0.003 (Rosal et al., 2010a) to 5.2 µg/l
(Munoz et al., 2009). Indirect photolysis possibly plays a role in the persistence of this
compound in the aquatic environment, but no data were available in the literature;
therefore, its impact may be overestimated.
The impact results of furosemide are primarily sensitive to the effluent concentration
and HC50 parameters, which contribute 57.8 and 23.8% to the variance, respectively.
The concentrations of furosemide in WWTP effluents reported in the literature vary by
2 orders of magnitude (Kasprzyk-Hordern et al., 2009), from 0.043 to 1.823 µg/l.
Furosemide is not expected to directly photolyse due to the lack of absorption in the
environmental UV spectrum (>290 nm), but it is expected to be susceptible to indirect
photolysis; therefore, the depletion of furosemide may be underestimated in the aquatic
environment.
For sulfapyridine, the HC50 parameter is of relevant concern because it contributes
47.3.1% to the impact variance. Moreover, the ecotoxicological data were estimated for
all trophic levels. The concentration of sulfapyridine in effluents contributes 33.0% to
its impact variance. Sulfapyridine concentrations in WWTP effluents in the literature
vary by 2 orders of magnitude, from 0.040 to 1.112 µg/l (Göbel et al. 2005; Kasprzyk-
Hordern et al. 2009). In addition, sulfapyridine contains chromophores that absorb at
wavelengths >290 nm, and therefore, it may also be susceptible to direct and indirect
photolysis; however, no experimental data were found in the literature.
The antibiotic metronidazole is primarily sensitive to the effluent concentration
parameter, which contributes 55.1% to the impact variance. The reported concentrations
in WWTP effluents vary from 0.05 µg/l (Rosal et al., 2010a) to 0.56 µg/l (Kasprzyk-
Hordern et al., 2009). However, there are very limited concentration data from WWTP
effluents. The HC50 parameter contributes 25.8% to the impact, and 3 trophic levels are
represented by experimental EC50s of 5 species. In addition, metronidazole may be
susceptible to indirect photolysis; however, no experimental data are available.
Uncertainty Analysis Prioritisation Direct Emissions
98
5.4.2 The biosolids-amended soils pathway
The anti-inflammatory 5-aminosalicylic acid displays the highest median impact result
in this contamination pathway (Figure 15). The contribution of each PC to the variance
of the total ecotoxicity impact is shown in Figure 16. The contribution of the modelling
parameters to the variance of the impact results for the pharmaceuticals of most concern
(90% of total ecotoxicity impact) is shown in Figure 17. The anti-inflammatory 5-
aminosalicylic acid is essentially in its anionic form at environmentally relevant pHs
(pKa = 5.87); therefore, it displays high availability for transport to the freshwater
compartment from the agricultural soil compartment. The most sensitive modelling
parameters, HC50 and concentration, contribute 46.8 and 41.2% to the variance,
respectively, and the lack of abiotic depletion data were already discussed in the
previous section. The anti-inflammatory 5-aminosalicylic acid may be a hydrophilic
compound, having an estimated log KOW of 0.98. In addition, its acidity constant is
sufficiently low that the molecule is predominantly anionic at pH 7. Both
physicochemical properties indicate that poor sorption onto the sewage sludge would be
expected because of electrostatic repulsion with the negatively charged groups of the
activated sludge. Nevertheless, adsorption of pharmaceuticals onto the sludge can be
influenced by intermolecular forces, such as Van der Waals forces. These hydrophobic
interactions with the sludge matrix can occur despite the presence of ionic charges
and/or the low log KOW of pharmaceuticals (Kulshrestha et al., 2004). However, the
biodegradation rate in the WWTP was estimated. Furthermore, the uncertainty inherent
in the estimation of this parameter was not included in the Monte Carlo analysis. In
summary, in addition to the shortcomings discussed in the previous section, this
pharmaceutical warrants further attention regarding its fate in WWTPs.
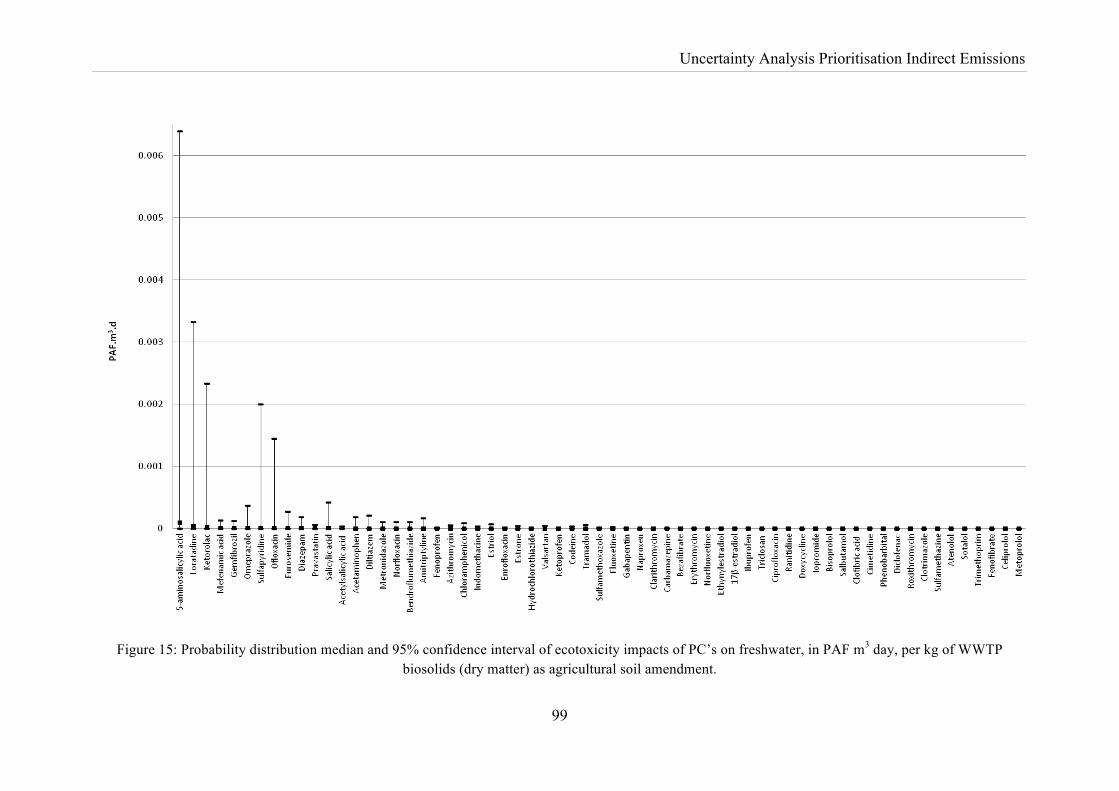
Uncertainty Analysis Prioritisation Indirect Emissions
99
Figure 15: Probability distribution median and 95% confidence interval of ecotoxicity impacts of PC’s on freshwater, in PAF m3 day, per kg of WWTP biosolids (dry matter) as agricultural soil amendment.
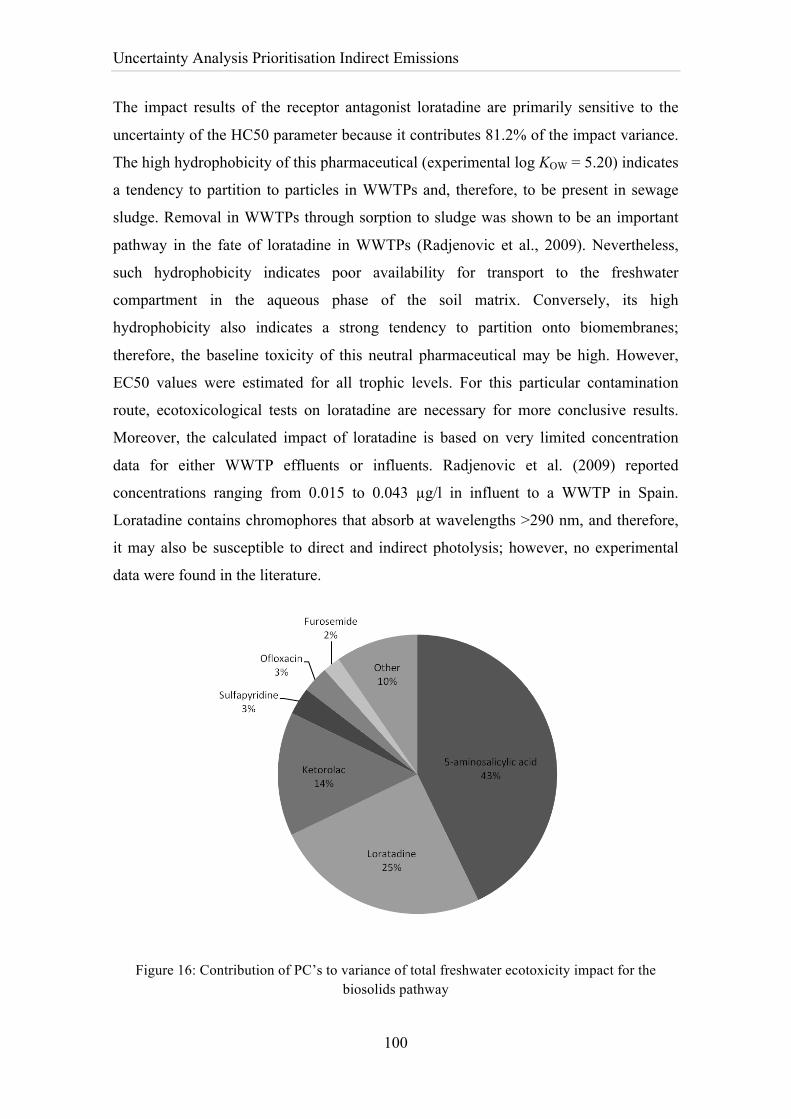
Uncertainty Analysis Prioritisation Indirect Emissions
100
The impact results of the receptor antagonist loratadine are primarily sensitive to the
uncertainty of the HC50 parameter because it contributes 81.2% of the impact variance.
The high hydrophobicity of this pharmaceutical (experimental log KOW = 5.20) indicates
a tendency to partition to particles in WWTPs and, therefore, to be present in sewage
sludge. Removal in WWTPs through sorption to sludge was shown to be an important
pathway in the fate of loratadine in WWTPs (Radjenovic et al., 2009). Nevertheless,
such hydrophobicity indicates poor availability for transport to the freshwater
compartment in the aqueous phase of the soil matrix. Conversely, its high
hydrophobicity also indicates a strong tendency to partition onto biomembranes;
therefore, the baseline toxicity of this neutral pharmaceutical may be high. However,
EC50 values were estimated for all trophic levels. For this particular contamination
route, ecotoxicological tests on loratadine are necessary for more conclusive results.
Moreover, the calculated impact of loratadine is based on very limited concentration
data for either WWTP effluents or influents. Radjenovic et al. (2009) reported
concentrations ranging from 0.015 to 0.043 µg/l in influent to a WWTP in Spain.
Loratadine contains chromophores that absorb at wavelengths >290 nm, and therefore,
it may also be susceptible to direct and indirect photolysis; however, no experimental
data were found in the literature.
Figure 16: Contribution of PC’s to variance of total freshwater ecotoxicity impact for the biosolids pathway
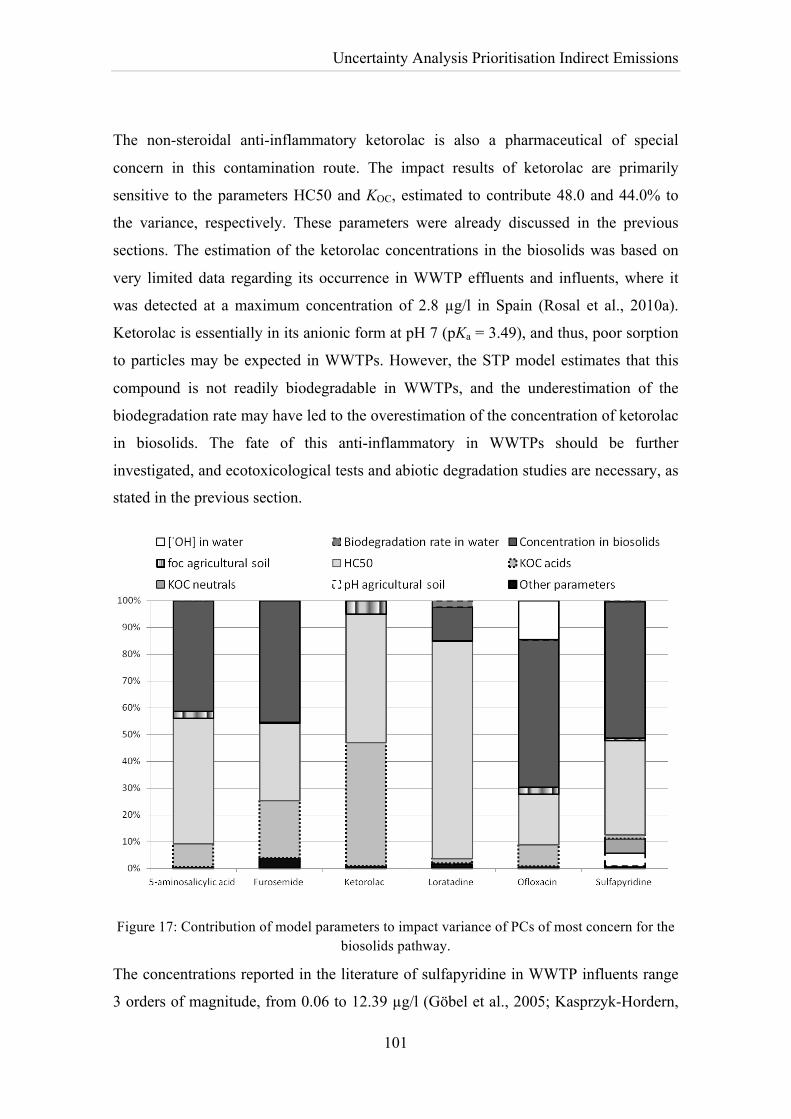
Uncertainty Analysis Prioritisation Indirect Emissions
101
The non-steroidal anti-inflammatory ketorolac is also a pharmaceutical of special
concern in this contamination route. The impact results of ketorolac are primarily
sensitive to the parameters HC50 and KOC, estimated to contribute 48.0 and 44.0% to
the variance, respectively. These parameters were already discussed in the previous
sections. The estimation of the ketorolac concentrations in the biosolids was based on
very limited data regarding its occurrence in WWTP effluents and influents, where it
was detected at a maximum concentration of 2.8 µg/l in Spain (Rosal et al., 2010a).
Ketorolac is essentially in its anionic form at pH 7 (pKa = 3.49), and thus, poor sorption
to particles may be expected in WWTPs. However, the STP model estimates that this
compound is not readily biodegradable in WWTPs, and the underestimation of the
biodegradation rate may have led to the overestimation of the concentration of ketorolac
in biosolids. The fate of this anti-inflammatory in WWTPs should be further
investigated, and ecotoxicological tests and abiotic degradation studies are necessary, as
stated in the previous section.
Figure 17: Contribution of model parameters to impact variance of PCs of most concern for the biosolids pathway.
The concentrations reported in the literature of sulfapyridine in WWTP influents range
3 orders of magnitude, from 0.06 to 12.39 µg/l (Göbel et al., 2005; Kasprzyk-Hordern,
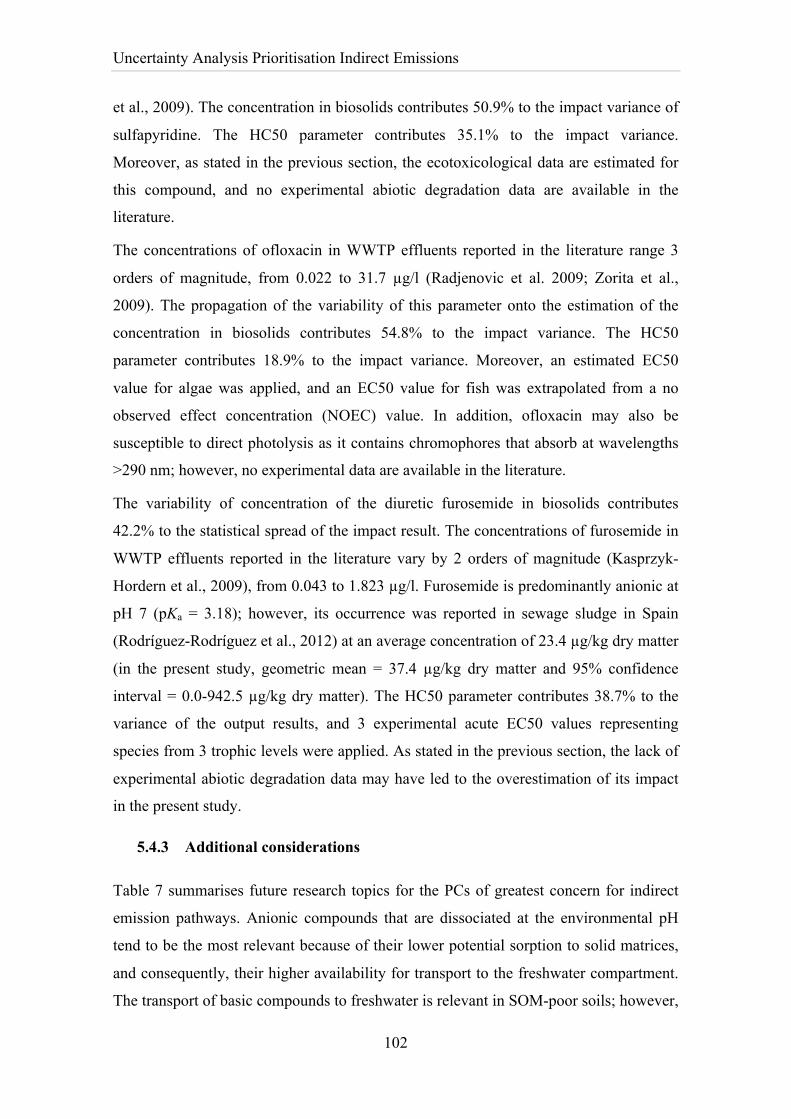
Uncertainty Analysis Prioritisation Indirect Emissions
102
et al., 2009). The concentration in biosolids contributes 50.9% to the impact variance of
sulfapyridine. The HC50 parameter contributes 35.1% to the impact variance.
Moreover, as stated in the previous section, the ecotoxicological data are estimated for
this compound, and no experimental abiotic degradation data are available in the
literature.
The concentrations of ofloxacin in WWTP effluents reported in the literature range 3
orders of magnitude, from 0.022 to 31.7 µg/l (Radjenovic et al. 2009; Zorita et al.,
2009). The propagation of the variability of this parameter onto the estimation of the
concentration in biosolids contributes 54.8% to the impact variance. The HC50
parameter contributes 18.9% to the impact variance. Moreover, an estimated EC50
value for algae was applied, and an EC50 value for fish was extrapolated from a no
observed effect concentration (NOEC) value. In addition, ofloxacin may also be
susceptible to direct photolysis as it contains chromophores that absorb at wavelengths
>290 nm; however, no experimental data are available in the literature.
The variability of concentration of the diuretic furosemide in biosolids contributes
42.2% to the statistical spread of the impact result. The concentrations of furosemide in
WWTP effluents reported in the literature vary by 2 orders of magnitude (Kasprzyk-
Hordern et al., 2009), from 0.043 to 1.823 µg/l. Furosemide is predominantly anionic at
pH 7 (pKa = 3.18); however, its occurrence was reported in sewage sludge in Spain
(Rodríguez-Rodríguez et al., 2012) at an average concentration of 23.4 µg/kg dry matter
(in the present study, geometric mean = 37.4 µg/kg dry matter and 95% confidence
interval = 0.0-942.5 µg/kg dry matter). The HC50 parameter contributes 38.7% to the
variance of the output results, and 3 experimental acute EC50 values representing
species from 3 trophic levels were applied. As stated in the previous section, the lack of
experimental abiotic degradation data may have led to the overestimation of its impact
in the present study.
5.4.3 Additional considerations
Table 7 summarises future research topics for the PCs of greatest concern for indirect
emission pathways. Anionic compounds that are dissociated at the environmental pH
tend to be the most relevant because of their lower potential sorption to solid matrices,
and consequently, their higher availability for transport to the freshwater compartment.
The transport of basic compounds to freshwater is relevant in SOM-poor soils; however,
Uncertainty Analysis Prioritisation Indirect Emissions
103
among the compounds of most concern, only aminopyrine in the reclaimed water use
pathway is of concern. These future research topics can be related to 3 issues: a) the fate
of PCs in WWTPs, b) substance-specific modelling parameters, and c) the lack of
spatial and time resolution within the model.
The first issue includes compounds with very limited concentration or detection data
from the reclaimed water pathway of WWTP effluents, such as ketorolac or 5-
aminosalicylic acid, and those of greatest concern for the biosolids pathway because
their concentrations of PCs in biosolids were estimated. For more conclusive results,
these substances should be the focus of further monitoring in WWTPs, depending on
the geographical usage patterns. This category should also include compounds whose
impact result would be most sensitive to variations in the emission concentrations. A
comparatively well-characterised pharmaceutical from an impact perspective would,
ideally, account for the low variance of the output results due to the environmental fate,
transport, and impact modelling parameters. The uncertainty of its impact result, from a
modelling perspective, would be primarily related to the variability of the
concentrations in WWTP effluents, depending on the geographical and seasonal usage
patterns, treatment technologies, and operation conditions. For example, variations in
the consumption and discharge to effluents of macrolide antibiotics are twice as high in
winter because these pharmaceuticals are primarily used to cure infections of the
respiratory tract (Alder et al., 2004); membrane bioreactors generally feature higher
removal rates than conventional activated sludge systems (Verlicchi et al. 2012), and in
terms of operation conditions, several researchers have noted improved removal from
WWTPs with increased solid retention time, especially in the case of EDCs (e.g., Göbel
et al., 2007; Suarez et al., 2010). These compounds should be subjected to detailed
ecological risk assessments, possibly leading to research and development on the
operation and design of WWTPs to improve the reduction of effluent concentrations of
the compounds. However, the compounds that are most sensitive to the variability in the
concentrations in the WWTP emissions, such as diazepam or gemfibrozil, have other
research priorities because of either limited occurrence data on their occurrence or
incomplete modelling parameters.
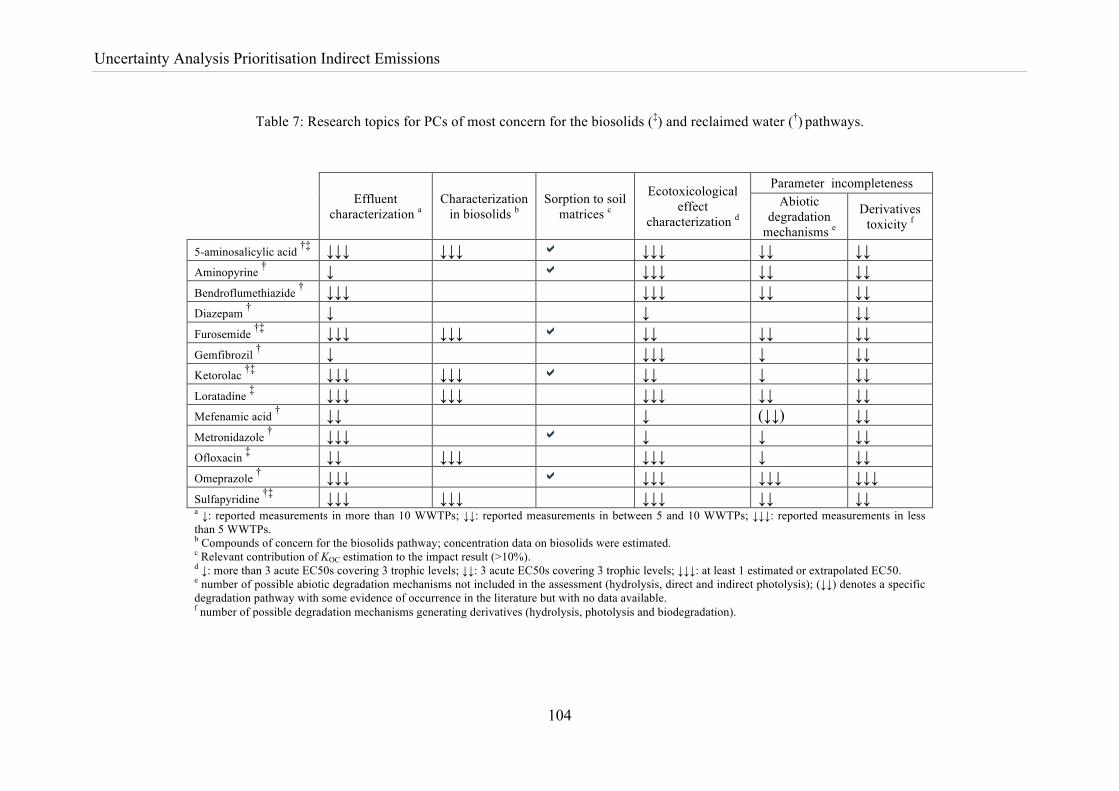
Uncertainty Analysis Prioritisation Indirect Emissions
104
Table 7: Research topics for PCs of most concern for the biosolids (‡) and reclaimed water (†) pathways.
Effluent
characterization a Characterization
in biosolids b Sorption to soil
matrices c
Ecotoxicological effect
characterization d
Parameter incompleteness Abiotic
degradation mechanisms e
Derivatives toxicity f
5-aminosalicylic acid †‡ ↓↓↓ ↓↓↓ ! ↓↓↓ ↓↓ ↓↓ Aminopyrine † ↓ ! ↓↓↓ ↓↓ ↓↓ Bendroflumethiazide † ↓↓↓ ↓↓↓ ↓↓ ↓↓ Diazepam † ↓ ↓ ↓↓ Furosemide †‡ ↓↓↓ ↓↓↓ ! ↓↓ ↓↓ ↓↓ Gemfibrozil † ↓ ↓↓↓ ↓ ↓↓ Ketorolac †‡ ↓↓↓ ↓↓↓ ! ↓↓ ↓ ↓↓ Loratadine ‡ ↓↓↓ ↓↓↓ ↓↓↓ ↓↓ ↓↓ Mefenamic acid † ↓↓ ↓ (↓↓) ↓↓ Metronidazole † ↓↓↓ ! ↓ ↓ ↓↓ Ofloxacin ‡ ↓↓ ↓↓↓ ↓↓↓ ↓ ↓↓ Omeprazole † ↓↓↓ ! ↓↓↓ ↓↓↓ ↓↓↓ Sulfapyridine †‡ ↓↓↓ ↓↓↓ ↓↓↓ ↓↓ ↓↓ a ↓: reported measurements in more than 10 WWTPs; ↓↓: reported measurements in between 5 and 10 WWTPs; ↓↓↓: reported measurements in less than 5 WWTPs. b Compounds of concern for the biosolids pathway; concentration data on biosolids were estimated. c Relevant contribution of KOC estimation to the impact result (>10%). d ↓: more than 3 acute EC50s covering 3 trophic levels; ↓↓: 3 acute EC50s covering 3 trophic levels; ↓↓↓: at least 1 estimated or extrapolated EC50. e number of possible abiotic degradation mechanisms not included in the assessment (hydrolysis, direct and indirect photolysis); (↓↓) denotes a specific degradation pathway with some evidence of occurrence in the literature but with no data available. f number of possible degradation mechanisms generating derivatives (hydrolysis, photolysis and biodegradation).
Uncertainty Analysis Prioritisation Indirect Emissions
105
The second issue, the substance-specific fate and transport modelling parameters and
the ecotoxicological effect factor characterisation, includes compounds, such as
ketorolac or omeprazole, whose impact results are most sensitive to the uncertainty of
substance-specific modelling parameters, such as HC50 and KOC, or whose impact
results may be affected by parameter incompleteness, either by the lack of abiotic
degradation data or by the lack of inclusion of degradation products. The HC50
parameter is relevant for compounds such as bendroflumethiazide and loratadine. The
parametric quantification of HC50 uncertainty is generally based on only 3 data values,
which typically would cause wide confidence limits (Larsen and Hauschild, 2007b).
These compounds should be subjected to further ecotoxicological tests for more
conclusive results. The estimation of the pH-dependent sorption of organic acids is also
influential for compounds such as furosemide or ketorolac. The effects of complexation
are not addressed in the regressions to estimate the KOC value of dissociating compounds
(Franco and Trapp, 2008), which may be especially relevant to the uncertainty of the
organic acids regression. The formation of a neutral complex due to the binding of
organic anions to metals or other ligands of opposite charge may alter the speciation and
sorption equilibria, consequently increasing the lipophilicity of the complexes formed.
For these compounds, research should focus on the measurement of an experimental
range of Kd values for several soil samples, attending to the variation in the solid matrix
characteristics in terms of particle size, pH and organic and clay content, which may be
used as inputs into fate and transport models for more conclusive results.
The third issue addresses the variability in the landscape parameters, such as agriculture
soil and freshwater pH, and the seasonal variation of the direct photolysis rates.
Although the present model does not include the spatial and temporal resolution of the
landscape parameters, their variability in the Monte Carlo analysis allows the
determination of the sensitivity of PCs to those parameters. However, although the large
scale applied in the present study displays a great variety of landscape characteristics,
such parameters are generally of minor significance to the impact variance.
Nevertheless, the impact of bendroflumethiazide in the reclaimed water use pathway is
comparatively relevant for higher soil pH values, and the impact of aminopyrine may be
comparatively relevant in SOM-poor soils; in addition, the impact of ofloxacin is
estimated to be comparatively relevant in poor quality, nitrate-containing surface waters
Uncertainty Analysis Prioritisation Indirect Emissions
106
because the variability of ˙OH concentration is somewhat significant for the impact of
this compound via the biosolids pathway.
However, other sources of uncertainty not included in the Monte Carlo analysis may be
important. The uncertainty of ecotoxicological data estimation, the extrapolation of
endpoints, the lack of abiotic degradation data for several compounds, and the
uncertainty of estimating biodegradation rates in WWTPs were already discussed
above. In addition, the effects of the uncertainty of the influence of pH on direct and
indirect photolysis rates, the uncertainty of the application of a linear dose-response
curve for the calculation of EEFs, and the lack of spatial variation in the background
impacts in the AMI method remain unclear, as does the effect of the exclusion of abiotic
and biotic derivatives of parent compounds. For example, some researchers have
suggested that the photo-transformation products of triclosan, diclofenac and/or
hydrochlorothiazide have a higher toxicity potential than that of their parent compounds
(Han et al. 2000; Schmitt-Jansen et al., 2007). Of special concern are the
photodegradation products of triclosan, which include 2,8-dichlorodibenzo-p-dioxin
(2,8-DCDD) and halogenated phenol compounds (Sanchez-Prado et al., 2006).
Polychlorinated dibenzo-p-dioxins (PCDDs) containing 4, 5, or 6 chlorine atoms, which
originate from the photodegradation of chlorinated triclosan derivatives and form during
disinfection with chlorine in WWTPs, are highly toxic, particularly to the early stages of
fish, with reported effect concentrations in the ng/l range, and are readily
bioaccumulated (Grimwood and Dobbs, 1995). Moreover, the assumption of
homogenous compartments for such complex media as soil or water represents a further
uncertainty as a chemical entering these compartments is assumed to be immediately
and perfectly diluted within the volume.
5.5 Conclusions
Notwithstanding the high uncertainties of the impact results, which range up to 13
orders of magnitude, and the limitations and incompleteness of the model, the outcome
of the present study provides guidance towards either further monitoring of PCs or
additional research. Thirteen compounds were identified as being of the most concern
for the indirect emission pathways to surface waters, 4 of which were for both pathways
(5-aminosalicylic acid, ketorolac, furosemide, and sulfapyridine).
Uncertainty Analysis Prioritisation Indirect Emissions
107
The HC50 parameter, the variability of the emissions concentrations, and the KOC
estimation of organic acids are generally the model parameters that are most relevant to
the uncertainty of the impact results. According to our results, the spatial and temporal
variation of the environmental characteristics was found to be of minor significance to
the output results.
Most of the identified PCs have rarely been investigated with regard to ecotoxicity,
including 5-aminosalicylic acid, ketorolac, aminopyrine, omeprazole,
bendroflumethiazide, sulfapyridine, loratadine, and ofloxacin. Moreover, most of these
have rarely been investigated with regard to their occurrence in WWTPs, given that PCs
such as 5-aminosalicylic acid, ketorolac, omeprazole, bendroflumethiazide, furosemide,
and loratadine were only occasionally monitored in WWTPs. In addition, the gaps in
knowledge regarding the abiotic degradation of most compounds may have led to the
overestimation of their residence times in the freshwater compartment, and
consequently to the overestimation of the impact comparatively to well-studied
compounds in terms of fate parameters, such as diclofenac or triclosan, that were not
identified as of most concern.
5.6 Acknowledgments
Sérgio Alberto Morais is grateful to FCT-Fundação para a Ciência e a Tecnologia for a
Ph.D. grant (SFRH/BD/64599/2009). This work was supported by the Foundation of
Science and Technology (FCT) of the Portuguese Ministry of Science, Technology and
Higher Education (MCTES), through project PTDC/AAG-TEC/2692/2012.

Uncertainty Analysis Prioritisation Indirect Emissions
108
General Conclusions
109
6. General conclusions In this PhD thesis a new and updated method for comparative risk and life cycle impact
assessments adapted for the freshwater ecotoxicity impacts of ionizing organic
compounds was outlined and the parameter uncertainty in characterisation factors (CFs)
and impact results was addressed. In direct emission scenarios to the freshwater
compartment of pharmaceutical compounds negligible differences were estimated
between the new method and the conventional USEtox model, in which the former is
based. However, in indirect emission scenarios, when the chemical is first emitted to
soil compartments, the characterization factors of basic pharmaceutical compounds are
overestimated up to 3 orders of magnitude in the conventional model and the 95%
confidence intervals are overestimated up to 4 orders and 3 orders of magnitude in the
upper and lower endpoint, respectively. In the case of indirect emissions, the
underestimation of sorption to solid matrices, when using non-polar conventional
regression methods, overestimates the availability for transport in the solution phase
and, thus, largely overestimates CFs of basic compounds relatively to the alternative
approach. The electrical attraction of basic organic compounds to the negatively
charged sorption sites of organic colloids in soil is, therefore, a relevant fate modelling
issue when addressing the impacts of indirect emissions of micropollutants to the
freshwater compartment.
Considering the freshwater impact assessment regarding the inventory data of
pharmaceuticals of a wastewater treatment plant (WWTP) emissions, the conventional
model overestimates the impact result by 1 order of magnitude for the contamination
pathways of application of biosolids in agricultural soils as soil-amendment and of
irrigation of agriculture soils using WWTP effluents, and the 95% confidence interval is
overestimated up to a factor of 30 in the upper endpoint and of 3 in the lower endpoint.
Nevertheless, LCA applications dealing with the indirect emission of micropollutants to
the freshwater compartment are needed in order to conclude about the influence of these
uncertainties on the general output of an LCA study.
The new and updated approach represents an improvement towards the modelling of the
multimedia fate, exposure, and effects of ionising organic compounds. However, the
updated regressions applied in the new approach still have limitations in predicting
sorption to solid matrices and need improvement, given that the contribution of the
regression uncertainty to the impact variance of compounds with relevant transfer
General Conclusions
110
fractions to the freshwater compartment from the soil compartment, usually anionic
organic compounds, are as high as 44%. The regressions to estimate solid-water
partition coefficients of organic acids need to be further developed to include the
underlying mechanism of complexion, which may alter the speciation and sorption
equilibria of these compounds.
The uncertainty of toxic effects is generally of highest significance, given that the
contribution of this model parameter to compounds impact variance is as high as 97%
for the direct emission and 81% for the indirect emissions scenarios. Moreover, the
uncertainty of estimating and extrapolating endpoints was not included in the
uncertainty analysis; nevertheless approximately 65% of all compounds addressed in
this thesis have at least 1 estimated or extrapolated endpoint in the ecotoxicological
effect characterization. The conduction of more experimental tests regarding
ecotoxicological effects of pharmaceuticals, and considering specific toxic modes of
action, is detrimental for the improvement of multimedia fate, exposure, and effect
model results of pharmaceuticals, reducing the typical large statistical spread of impact
results when using few ecotoxicity data points.
Noteworthy, the spatial variability of environmental characteristics within the European
geographical scale (such as soil pH, rain rate, or the fraction of organic matter in soil) is
of secondary relevance regarding its contribution to the impact variance of this class of
chemicals. In terms of parameter uncertainty, the toxicity effects and the sorption to
solid matrices are the issues of priority in order to improve the model’s predictive
power, rather than the spatial differentiation, or resolution, within the model.
The model predictions in terms of impact results applied to 85 pharmaceuticals
compounds detected in European WWTPs and pertaining to 15 different therapeutic
classes, as well as the contribution of parameter uncertainty to impact variance and the
incompleteness of model parameters, helped to establish priorities for further research
and monitoring in regard to these compounds, for both direct and indirect pathways of
contamination.
For the direct emission pathway from WWTPs, 19 compounds of concern were
identified. The monitoring in WWTPs is necessary for more conclusive results, whereas
53% of compounds of most concern were reported only in one peer-reviewed
publication to have been measured in WWTPs effluents, for example, in such cases as
clotrimazole, ketorolac, omeprazole, or aminopyrine. For this pathway of
General Conclusions
111
contamination, the uncertainty of toxicity effects contributes between 24-97% to the
impact variance of compounds of most concern. This parameter is in general the most
significant one, as stated above, regarding the large statistical spread of impact results,
which range up to 12 orders of magnitude. Moreover, 63% of these compounds have at
least one estimated or extrapolated endpoint. In addition, the toxicity effect factor
calculation of 32% of these compounds relies entirely on estimated data. In terms of
gaps of knowledge leading to the incompleteness of model parameters, the lack of
experimental abiotic degradation data for several compounds may have a relevant
influence on the output results and needs further research. Theoretically, 74% of
compounds of most concern may be subject to at least one abiotic degradation
mechanism for which no experimental data were available, which is the case of, for
example, codeine, omeprazole, or 5-aminosalicylic acid. Usually, pharmaceuticals with
high consumption rates are those selected for further investigation (Escher et al., 2011).
This may explain the fact that most compounds defined as of priority in the present
thesis are poorly monitored in WWTPs or in the environment. The residence times in
the freshwater compartment of these compounds may be overestimated due to lack of
experimental abiotic degradation data in comparison to well studied compounds, such
as diclofenac or ibuprofen. The conduction of experiments on direct and indirect
photolysis for compounds theoretically subject to these degradation mechanisms is,
therefore, a necessary topic for further research.
Thirteen compounds of concern were identified for the indirect emission pathways. In
the scenario of using WWTP effluents as reclaimed water in agricultural soils, the
monitoring in WWTPs is also necessary for more conclusive results, given that 61% of
compounds of most concern were measured in less than 5 WWTPs, for example, in the
cases of metronidazole, sulfapyridine, or furosemide. In the application of biosolids as
soil-amendment scenario, the monitoring of compounds of concern in this
contamination pathway, such as 5-aminosalicylic acid, oflaxacin, or sulfapyridine, is
also necessary given that the concentration of pharmaceutical compounds was
estimated. The uncertainty of toxicity effects is also relevant for these contamination
pathways, contributing between 8-81% to the impact variance of compounds of most
concern and requiring further ecotoxicity tests for compounds such as gemfibrozil,
ofloxacin, or bendroflumethiazide. Also, the lack of experimental abiotic degradation
data for several compounds may have a relevant influence on the output results and
General Conclusions
112
needs further research, given that, theoretically, 92% of compounds of most concern
may be subject to at least one abiotic degradation mechanism for which no experimental
data were available, which is the case, for example, of omeprazole, ofloxacin, or
loratadine. Moreover, the estimation of the pH-dependent sorption of organic acids is
also influential for compounds such as furosemide or ketorolac. For these compounds,
further research is needed regarding the measurement of an experimental range of Kd
values for several soil samples, attending to the variation in the solid matrix
characteristics in terms of particle size, pH and organic and clay content, which may be
used as inputs into fate and transport models for more conclusive results.
To establish future research based on the impact results of PCs measured in European
WWTPs, as well on parameter uncertainty and incompleteness, was one the objectives
of this thesis. However, the model uncertainty not addressed in the present thesis should
also serve as recommendations for future work to improve the model’s predictive
power. Model uncertainty includes all model choices and assumptions, which can be
difficult to quantify in comparison to parameter uncertainty. To overcome model
uncertainty, information is needed on the most appropriate description of reality and
application of the most relevant model (Van Zelm, 2010). The increase of complexity of
a multimedia fate, exposure, and effect model, that better simulate reality, leads in
general to larger parameter uncertainty; nevertheless it reduces the model uncertainty.
The uncertainty of the following model choices and assumptions was not address in the
present thesis:
1. exclusion of abiotic and biotic derivatives of parent compounds,
2. exclusion of the influence of freshwater pH on direct and indirect photolysis
rates,
3. application of a linear dose-response curve for the calculation of ecotoxicity
effect factors,
4. assessment factor (AF) of 2 to extrapolate average chronic toxicity from acute
chronic toxicity.
The influence of degradation derivates on the total compound impact is unclear in the
present thesis. Nevertheless, the inclusion of phototransformation products impact is
possible by applying the method proposed by van Zelm et al. (2010b). The method
calculates the total characterization factor by summing the characterization factors of
the parent compounds and its derivates, treating the uncertainties in fractions of
General Conclusions
113
formation as triangular distributions with 0 as minimum and 1 as maximum. The
chemical structures of derivates must be identified in order to estimate the necessary
fate and effect parameters; however presently these chemical structures are not usually
available in the literature for pharmaceuticals compounds. However, for compounds
with such data available, the influence of the inclusion of derivates on the total impact
should be further addressed.
The speciation of organic compounds affects their photodegradation rates (Boreen et al.,
2004; Baeza and Knappe, 2011). A first screening approach to deal with the uncertainty
of speciation of an organic compound could be based on a uniformal distribution using
the lowest and highest degradation rates among all the species involved in the speciation
as the minimum and maximum. Therefore, quantum yields and experimental molar
absorption coefficients in function of the UV/VIS wavelength range of all the species
involved must be experimentally obtained and applied to models that compute direct
photolysis rates and half-lives of pollutants in the aquatic environment. A similar
approach can be applied for indirect photolysis by obtaining experimental rate constants
between chemical transients and all the chemical species involved in the speciation.
The “average potential affected fraction (PAF) increase” approach based on the
HC50EC50 applied in the present thesis (consistently with the USEtox model) for
calculation of the ecotoxicity effect factors assumes a linear dose-response PAF curve
with a slope of 0.5. However, pharmaceuticals-specific PAF curves should computed in
order to verify the linearity assumption for this class of compounds, which requires
ecotoxicological data for a large number of species, usually not available for
pharmaceutical compounds.
An acute-chronic ratio of 2 was applied to extrapolate chronic HC50EC50 values from
acute HC50EC50 values, as applied in the USEtox model. However, best estimate AFs
for this extrapolation have not yet been developed and further research is needed in this
area, particularly in the context of pharmaceuticals.

General Conclusions
114
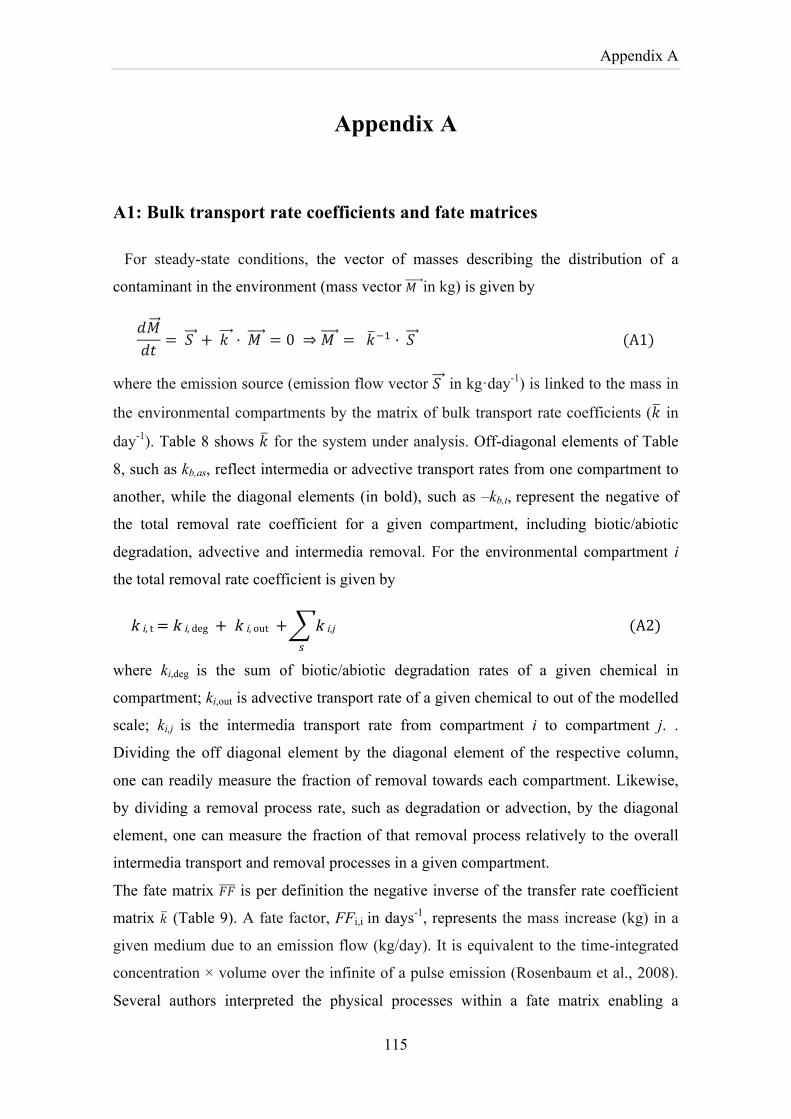
Appendix A
115
Appendix A
A1: Bulk transport rate coefficients and fate matrices
For steady-state conditions, the vector of masses describing the distribution of a
contaminant in the environment (mass vector 𝑀 in kg) is given by
𝑑𝑀𝑑𝑡 = 𝑆 + 𝑘 · 𝑀 = 0 ⇒ 𝑀 = 𝑘!! · 𝑆 (A1)
where the emission source (emission flow vector 𝑆 in kg·day-1) is linked to the mass in
the environmental compartments by the matrix of bulk transport rate coefficients (𝑘 in
day-1). Table 8 shows 𝑘 for the system under analysis. Off-diagonal elements of Table
8, such as kb,as, reflect intermedia or advective transport rates from one compartment to
another, while the diagonal elements (in bold), such as –kb,t, represent the negative of
the total removal rate coefficient for a given compartment, including biotic/abiotic
degradation, advective and intermedia removal. For the environmental compartment i
the total removal rate coefficient is given by
k i, t = k i, deg + k i, out + k i,j!
(A2)
where ki,deg is the sum of biotic/abiotic degradation rates of a given chemical in
compartment; ki,out is advective transport rate of a given chemical to out of the modelled
scale; ki,j is the intermedia transport rate from compartment i to compartment j. .
Dividing the off diagonal element by the diagonal element of the respective column,
one can readily measure the fraction of removal towards each compartment. Likewise,
by dividing a removal process rate, such as degradation or advection, by the diagonal
element, one can measure the fraction of that removal process relatively to the overall
intermedia transport and removal processes in a given compartment.
The fate matrix 𝐹𝐹 is per definition the negative inverse of the transfer rate coefficient
matrix 𝑘 (Table 9). A fate factor, FFi,i in days-1, represents the mass increase (kg) in a
given medium due to an emission flow (kg/day). It is equivalent to the time-integrated
concentration × volume over the infinite of a pulse emission (Rosenbaum et al., 2008).
Several authors interpreted the physical processes within a fate matrix enabling a
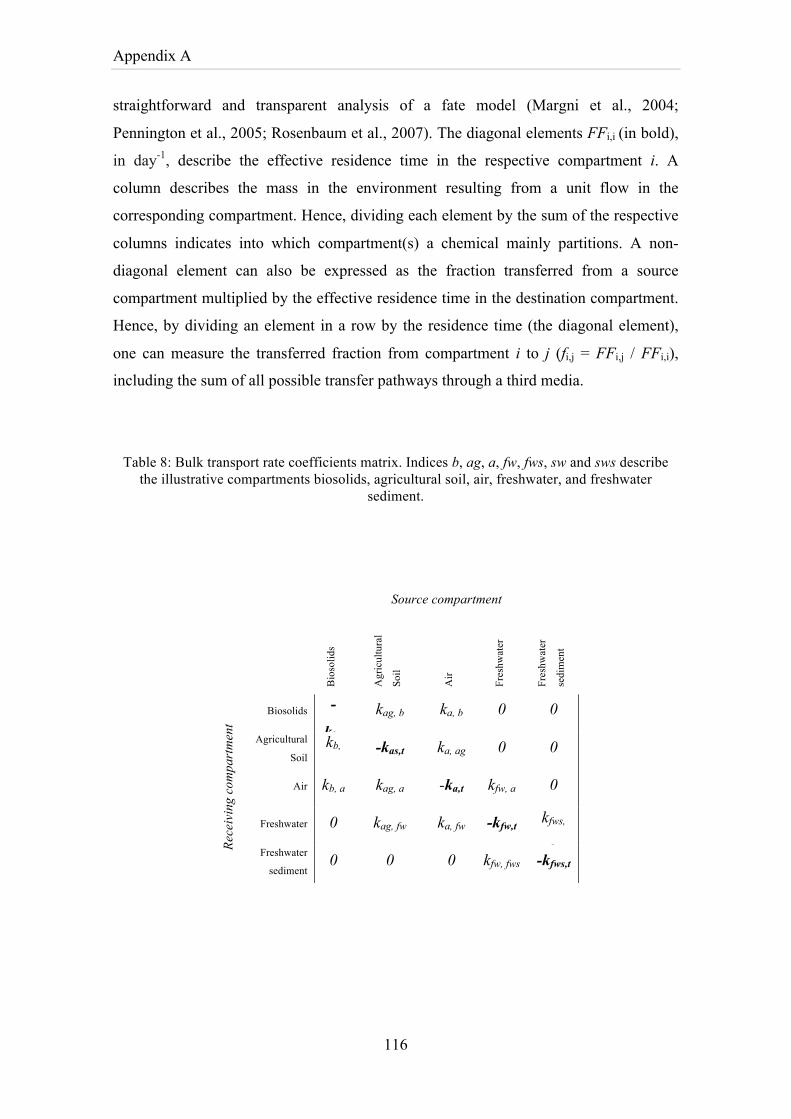
Appendix A
116
straightforward and transparent analysis of a fate model (Margni et al., 2004;
Pennington et al., 2005; Rosenbaum et al., 2007). The diagonal elements FFi,i (in bold),
in day-1, describe the effective residence time in the respective compartment i. A
column describes the mass in the environment resulting from a unit flow in the
corresponding compartment. Hence, dividing each element by the sum of the respective
columns indicates into which compartment(s) a chemical mainly partitions. A non-
diagonal element can also be expressed as the fraction transferred from a source
compartment multiplied by the effective residence time in the destination compartment.
Hence, by dividing an element in a row by the residence time (the diagonal element),
one can measure the transferred fraction from compartment i to j (fi,j = FFi,j / FFi,i),
including the sum of all possible transfer pathways through a third media.
Table 8: Bulk transport rate coefficients matrix. Indices b, ag, a, fw, fws, sw and sws describe the illustrative compartments biosolids, agricultural soil, air, freshwater, and freshwater
sediment.
Source compartment
Bio
solid
s
Agr
icul
tura
l
Soil
Air
Fres
hwat
er
Fres
hwat
er
sedi
men
t
Rec
eivi
ng c
ompa
rtm
ent
Biosolids -
kb,t kag, b ka, b 0 0
Agricultural
Soil kb,
as -kas,t ka, ag 0 0
Air kb, a kag, a -ka,t kfw, a 0
Freshwater 0 kag, fw ka, fw -kfw,t kfws,
fw Freshwater
sediment 0 0 0 kfw, fws -kfws,t
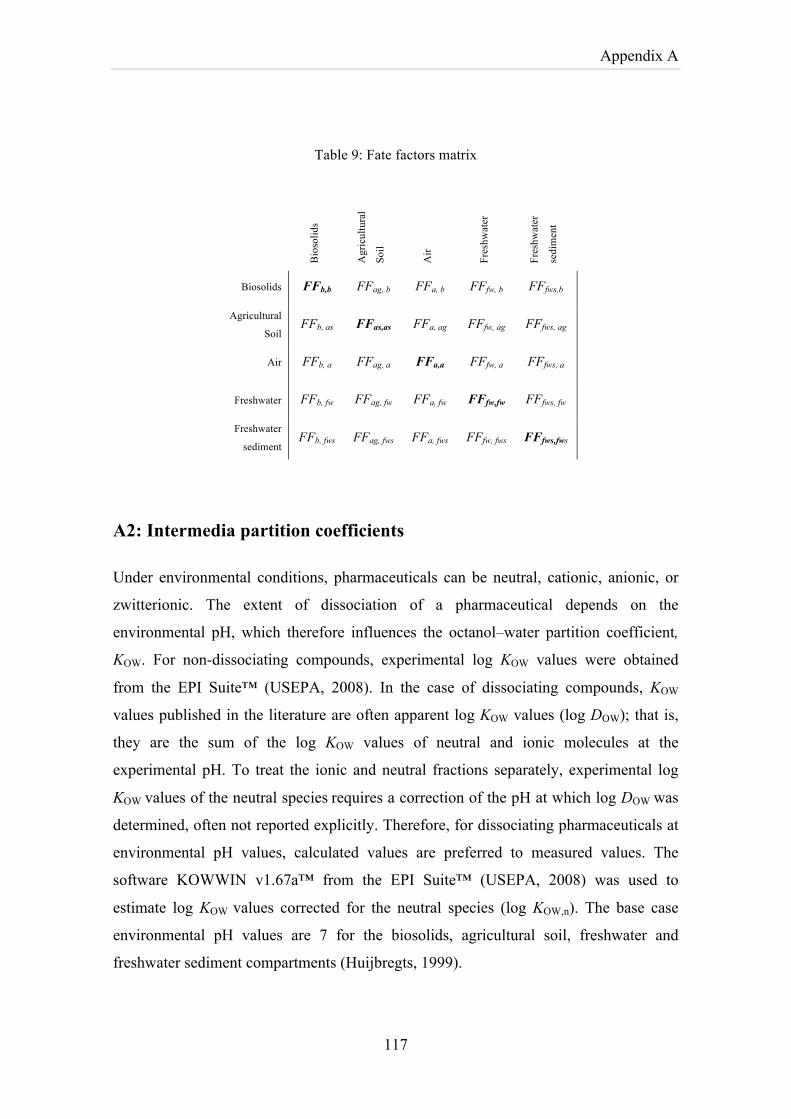
Appendix A
117
Table 9: Fate factors matrix
Bio
solid
s
Agr
icul
tura
l
Soil
Air
Fres
hwat
er
Fres
hwat
er
sedi
men
t
Biosolids FFb,b FFag, b FFa, b FFfw, b FFfws,b
Agricultural
Soil FFb, as FFas,as FFa, ag FFfw, ag FFfws, ag
Air FFb, a FFag, a FFa,a FFfw, a FFfws, a
Freshwater FFb, fw FFag, fw FFa, fw FFfw,fw FFfws, fw
Freshwater
sediment FFb, fws FFag, fws FFa, fws FFfw, fws FFfws,fws
A2: Intermedia partition coefficients
Under environmental conditions, pharmaceuticals can be neutral, cationic, anionic, or
zwitterionic. The extent of dissociation of a pharmaceutical depends on the
environmental pH, which therefore influences the octanol–water partition coefficient,
KOW. For non-dissociating compounds, experimental log KOW values were obtained
from the EPI Suite™ (USEPA, 2008). In the case of dissociating compounds, KOW
values published in the literature are often apparent log KOW values (log DOW); that is,
they are the sum of the log KOW values of neutral and ionic molecules at the
experimental pH. To treat the ionic and neutral fractions separately, experimental log
KOW values of the neutral species requires a correction of the pH at which log DOW was
determined, often not reported explicitly. Therefore, for dissociating pharmaceuticals at
environmental pH values, calculated values are preferred to measured values. The
software KOWWIN v1.67a™ from the EPI Suite™ (USEPA, 2008) was used to
estimate log KOW values corrected for the neutral species (log KOW,n). The base case
environmental pH values are 7 for the biosolids, agricultural soil, freshwater and
freshwater sediment compartments (Huijbregts, 1999).
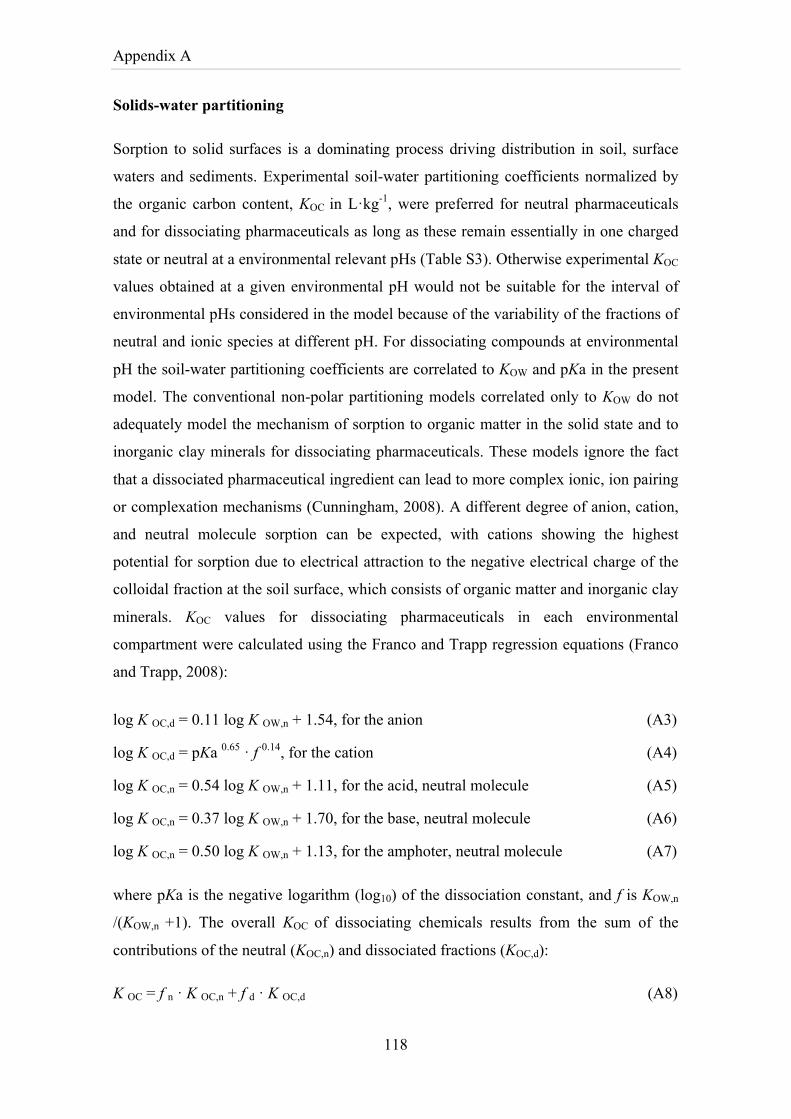
Appendix A
118
Solids-water partitioning
Sorption to solid surfaces is a dominating process driving distribution in soil, surface
waters and sediments. Experimental soil-water partitioning coefficients normalized by
the organic carbon content, KOC in L·kg-1, were preferred for neutral pharmaceuticals
and for dissociating pharmaceuticals as long as these remain essentially in one charged
state or neutral at a environmental relevant pHs (Table S3). Otherwise experimental KOC
values obtained at a given environmental pH would not be suitable for the interval of
environmental pHs considered in the model because of the variability of the fractions of
neutral and ionic species at different pH. For dissociating compounds at environmental
pH the soil-water partitioning coefficients are correlated to KOW and pKa in the present
model. The conventional non-polar partitioning models correlated only to KOW do not
adequately model the mechanism of sorption to organic matter in the solid state and to
inorganic clay minerals for dissociating pharmaceuticals. These models ignore the fact
that a dissociated pharmaceutical ingredient can lead to more complex ionic, ion pairing
or complexation mechanisms (Cunningham, 2008). A different degree of anion, cation,
and neutral molecule sorption can be expected, with cations showing the highest
potential for sorption due to electrical attraction to the negative electrical charge of the
colloidal fraction at the soil surface, which consists of organic matter and inorganic clay
minerals. KOC values for dissociating pharmaceuticals in each environmental
compartment were calculated using the Franco and Trapp regression equations (Franco
and Trapp, 2008):
log K OC,d = 0.11 log K OW,n + 1.54, for the anion (A3)
log K OC,d = pKa 0.65 · f 0.14, for the cation (A4)
log K OC,n = 0.54 log K OW,n + 1.11, for the acid, neutral molecule (A5)
log K OC,n = 0.37 log K OW,n + 1.70, for the base, neutral molecule (A6)
log K OC,n = 0.50 log K OW,n + 1.13, for the amphoter, neutral molecule (A7)
where pKa is the negative logarithm (log10) of the dissociation constant, and f is KOW,n
/(KOW,n +1). The overall KOC of dissociating chemicals results from the sum of the
contributions of the neutral (KOC,n) and dissociated fractions (KOC,d):
K OC = f n · K OC,n + f d · K OC,d (A8)
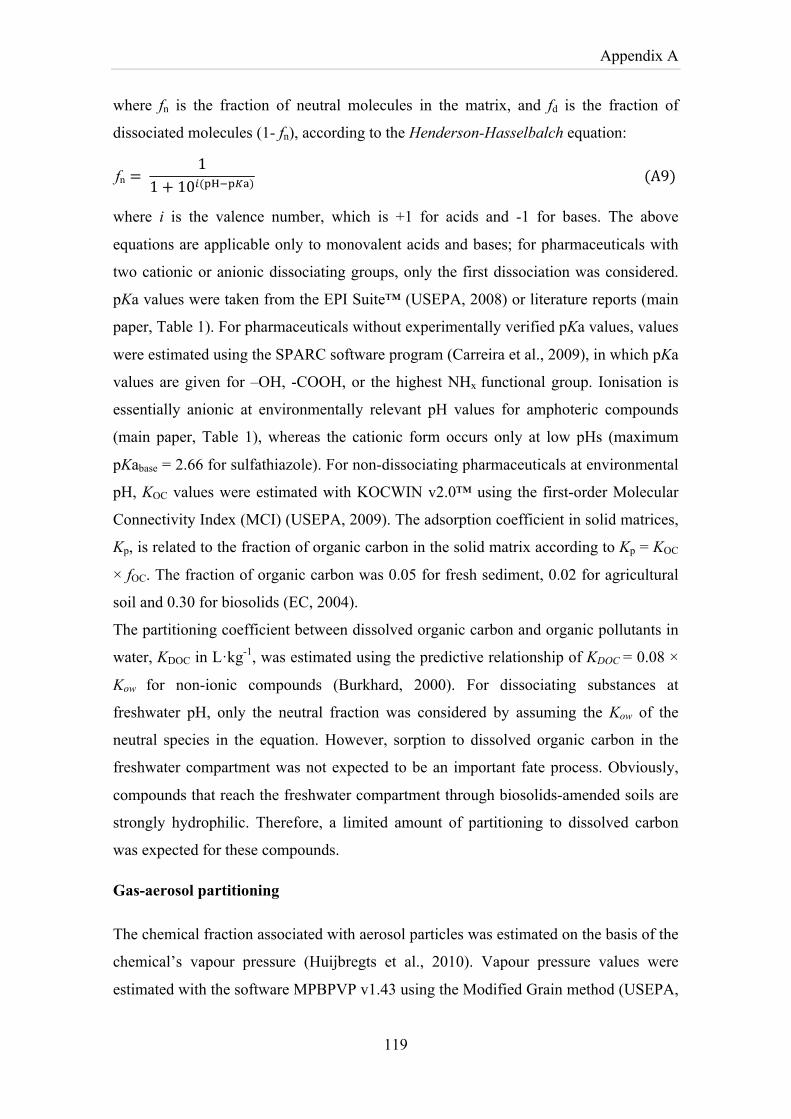
Appendix A
119
where fn is the fraction of neutral molecules in the matrix, and fd is the fraction of
dissociated molecules (1- fn), according to the Henderson-Hasselbalch equation:
fn = 1
1+ 10!(!"!!!!) (A9)
where i is the valence number, which is +1 for acids and -1 for bases. The above
equations are applicable only to monovalent acids and bases; for pharmaceuticals with
two cationic or anionic dissociating groups, only the first dissociation was considered.
pKa values were taken from the EPI Suite™ (USEPA, 2008) or literature reports (main
paper, Table 1). For pharmaceuticals without experimentally verified pKa values, values
were estimated using the SPARC software program (Carreira et al., 2009), in which pKa
values are given for –OH, -COOH, or the highest NHx functional group. Ionisation is
essentially anionic at environmentally relevant pH values for amphoteric compounds
(main paper, Table 1), whereas the cationic form occurs only at low pHs (maximum
pKabase = 2.66 for sulfathiazole). For non-dissociating pharmaceuticals at environmental
pH, KOC values were estimated with KOCWIN v2.0™ using the first-order Molecular
Connectivity Index (MCI) (USEPA, 2009). The adsorption coefficient in solid matrices,
Kp, is related to the fraction of organic carbon in the solid matrix according to Kp = KOC
× fOC. The fraction of organic carbon was 0.05 for fresh sediment, 0.02 for agricultural
soil and 0.30 for biosolids (EC, 2004).
The partitioning coefficient between dissolved organic carbon and organic pollutants in
water, KDOC in L·kg-1, was estimated using the predictive relationship of KDOC = 0.08 ×
Kow for non-ionic compounds (Burkhard, 2000). For dissociating substances at
freshwater pH, only the neutral fraction was considered by assuming the Kow of the
neutral species in the equation. However, sorption to dissolved organic carbon in the
freshwater compartment was not expected to be an important fate process. Obviously,
compounds that reach the freshwater compartment through biosolids-amended soils are
strongly hydrophilic. Therefore, a limited amount of partitioning to dissolved carbon
was expected for these compounds.
Gas-aerosol partitioning
The chemical fraction associated with aerosol particles was estimated on the basis of the
chemical’s vapour pressure (Huijbregts et al., 2010). Vapour pressure values were
estimated with the software MPBPVP v1.43 using the Modified Grain method (USEPA,
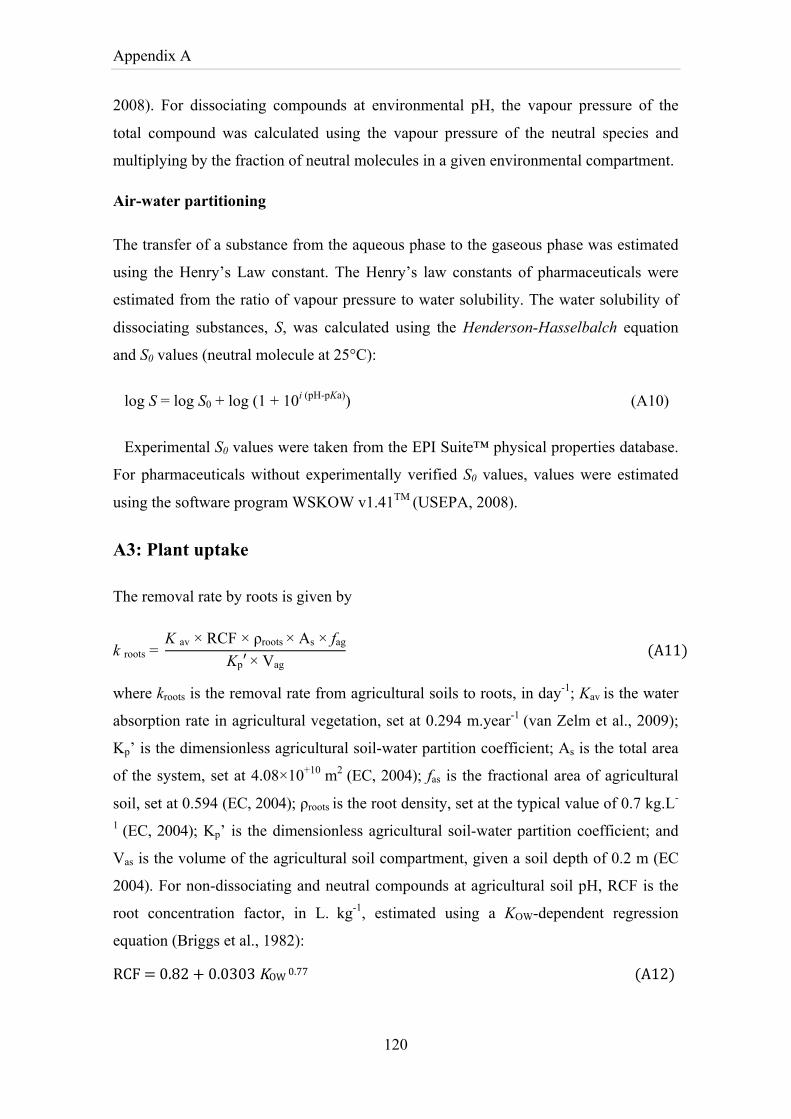
Appendix A
120
2008). For dissociating compounds at environmental pH, the vapour pressure of the
total compound was calculated using the vapour pressure of the neutral species and
multiplying by the fraction of neutral molecules in a given environmental compartment.
Air-water partitioning
The transfer of a substance from the aqueous phase to the gaseous phase was estimated
using the Henry’s Law constant. The Henry’s law constants of pharmaceuticals were
estimated from the ratio of vapour pressure to water solubility. The water solubility of
dissociating substances, S, was calculated using the Henderson-Hasselbalch equation
and S0 values (neutral molecule at 25°C):
log S = log S0 + log (1 + 10i (pH-pKa)) (A10)
Experimental S0 values were taken from the EPI Suite™ physical properties database.
For pharmaceuticals without experimentally verified S0 values, values were estimated
using the software program WSKOW v1.41TM (USEPA, 2008).
A3: Plant uptake
The removal rate by roots is given by
k roots = K av × RCF × ρroots × As × fag
Kp′ × Vag (A11)
where kroots is the removal rate from agricultural soils to roots, in day-1; Kav is the water
absorption rate in agricultural vegetation, set at 0.294 m.year-1 (van Zelm et al., 2009);
Kp’ is the dimensionless agricultural soil-water partition coefficient; As is the total area
of the system, set at 4.08×10+10 m2 (EC, 2004); fas is the fractional area of agricultural
soil, set at 0.594 (EC, 2004); ρroots is the root density, set at the typical value of 0.7 kg.L-
1 (EC, 2004); Kp’ is the dimensionless agricultural soil-water partition coefficient; and
Vas is the volume of the agricultural soil compartment, given a soil depth of 0.2 m (EC
2004). For non-dissociating and neutral compounds at agricultural soil pH, RCF is the
root concentration factor, in L. kg-1, estimated using a KOW-dependent regression
equation (Briggs et al., 1982):
RCF = 0.82 + 0.0303 KOW 0.77 (A12)
Appendix A
121
For ionisable compounds at agricultural soil pH, the suggestion of the TGD (EC, 2003)
for correcting chemical properties by the neutral fraction of the compound, in this case
fn × KOW (KOW,n), was followed. For the particular case of root uptake, such a procedure
seems to be reasonable at a screening level because fewer anions than neutral molecules
are generally taken up as a result of electric repulsion, which slows transfer across
membranes (Trapp, 2009). Moreover, although cations are attracted by the electrical
potential of living cells, they have the highest potential of sorption to soil, which
reduces their bioavailability and uptake. Plant uptake may be underestimated because
the ionic fraction is disregarded. However, the application of Equation A12 to
dissociating compounds using the uncorrected KOW overestimates sorption possibly to a
greater extent. Nevertheless, as observed by Trapp (2009), the reliability of this
procedure for ionisable compounds has never been critically evaluated.
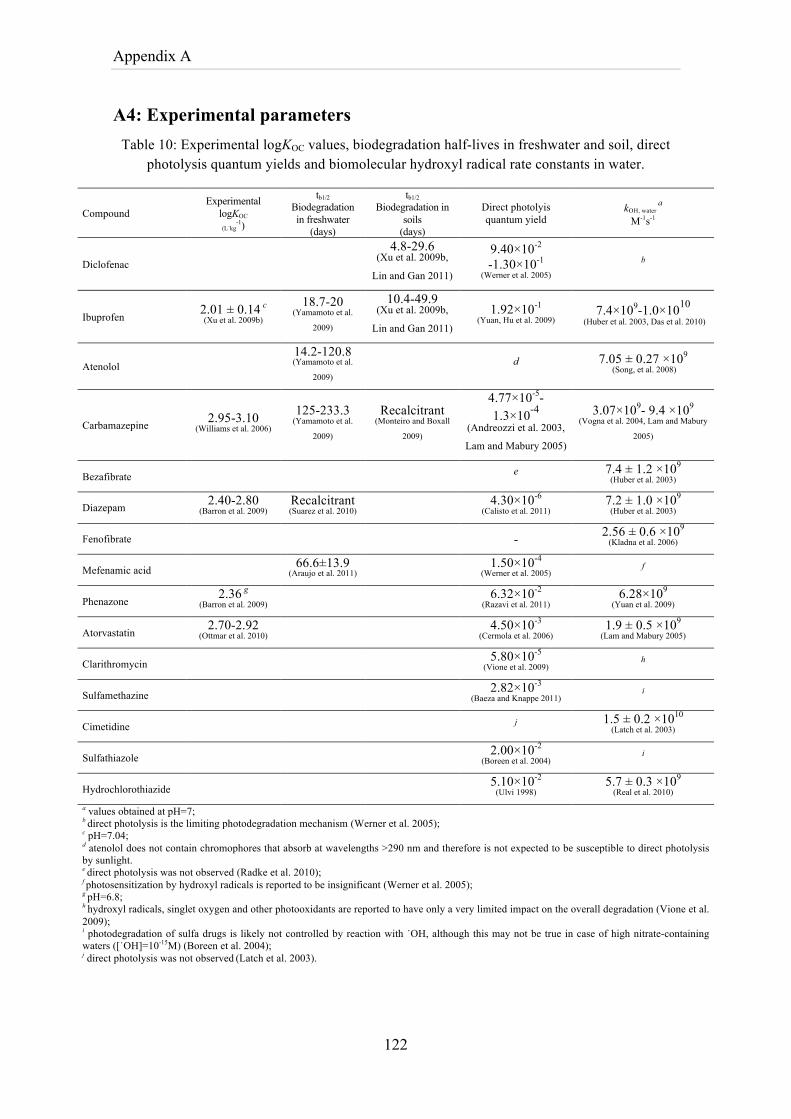
Appendix A
122
A4: Experimental parameters Table 10: Experimental logKOC values, biodegradation half-lives in freshwater and soil, direct
photolysis quantum yields and biomolecular hydroxyl radical rate constants in water.
Compound Experimental
logKOC
(L˙kg-1)
tb1/2
Biodegradation in freshwater
(days)
tb1/2
Biodegradation in soils
(days)
Direct photolyis quantum yield
kOH, water a
M-1s-1
Diclofenac 4.8-29.6
(Xu et al. 2009b,
Lin and Gan 2011)
9.40×10⁻²
-1.30×10⁻¹
(Werner et al. 2005)
b
Ibuprofen 2.01 ± 0.14 c (Xu et al. 2009b)
18.7-20 (Yamamoto et al.
2009)
10.4-49.9 (Xu et al. 2009b,
Lin and Gan 2011)
1.92×10⁻¹
(Yuan, Hu et al. 2009) 7.4×10⁹-1.0×10¹⁰
(Huber et al. 2003, Das et al. 2010)
Atenolol 14.2-120.8 (Yamamoto et al.
2009) d
7.05 ± 0.27 ×10⁹
(Song, et al. 2008)
Carbamazepine 2.95-3.10 (Williams et al. 2006)
125-233.3 (Yamamoto et al.
2009)
Recalcitrant (Monteiro and Boxall
2009)
4.77×10⁻⁵- 1.3×10⁻⁴
(Andreozzi et al. 2003,
Lam and Mabury 2005)
3.07×10⁹- 9.4 ×10⁹
(Vogna et al. 2004, Lam and Mabury
2005)
Bezafibrate e 7.4 ± 1.2 ×10⁹
(Huber et al. 2003)
Diazepam 2.40-2.80 (Barron et al. 2009)
Recalcitrant (Suarez et al. 2010) 4.30×10⁻⁶
(Calisto et al. 2011) 7.2 ± 1.0 ×10⁹
(Huber et al. 2003)
Fenofibrate - 2.56 ± 0.6 ×10⁹
(Kladna et al. 2006)
Mefenamic acid 66.6±13.9 (Araujo et al. 2011) 1.50×10⁻⁴
(Werner et al. 2005) f
Phenazone 2.36 g
(Barron et al. 2009) 6.32×10⁻²
(Razavi et al. 2011) 6.28×10⁹
(Yuan et al. 2009)
Atorvastatin 2.70-2.92
(Ottmar et al. 2010) 4.50×10⁻³
(Cermola et al. 2006) 1.9 ± 0.5 ×10⁹
(Lam and Mabury 2005)
Clarithromycin 5.80×10⁻⁵
(Vione et al. 2009) h
Sulfamethazine 2.82×10⁻³
(Baeza and Knappe 2011) i
Cimetidine j 1.5 ± 0.2 ×10¹⁰
(Latch et al. 2003)
Sulfathiazole 2.00×10⁻²
(Boreen et al. 2004) i
Hydrochlorothiazide 5.10×10⁻²
(Ulvi 1998) 5.7 ± 0.3 ×10⁹
(Real et al. 2010) a values obtained at pH=7; b direct photolysis is the limiting photodegradation mechanism (Werner et al. 2005); c pH=7.04; d atenolol does not contain chromophores that absorb at wavelengths >290 nm and therefore is not expected to be susceptible to direct photolysis by sunlight. e direct photolysis was not observed (Radke et al. 2010); f photosensitization by hydroxyl radicals is reported to be insignificant (Werner et al. 2005); g pH=6.8; h hydroxyl radicals, singlet oxygen and other photooxidants are reported to have only a very limited impact on the overall degradation (Vione et al. 2009); i photodegradation of sulfa drugs is likely not controlled by reaction with ˙OH, although this may not be true in case of high nitrate-containing waters ([˙OH]=10-15M) (Boreen et al. 2004); j direct photolysis was not observed (Latch et al. 2003).
Appendix A
123
A5: Ecotoxicity factor in water
The ecotoxicty factor in water, EFaqua,fw, is calculated according to the AMI method
(Payet 2004), which is based on the Hazardous Concentration (HC) of a chemical
affecting 50% of the species tested over their chronic EC50 (Effect Concentration
affecting 50% of tested individuals), also called HC50EC50, according to:
𝐸𝐹 = ΔPAFΔC =
0.5HC50 (A13)
where C is the exposure concentration, in kg·m-3, and PAF is the potentially affected
fraction of species due to exposure to the chemical. HC50EC50 is given by
log HC50 = 1ns · logEC50
!
(A14)
where n is the number of species (or trophic levels) for which EC50 values are
available. Figure S1 shows the procedure of calculation of the effect factors. The EC50
values must cover at least three different trophic levels (algae, crustacean, and fish) for
standard endpoints with standard organisms. For a given chemical, if several EC50
values are available for the same species, the geometric mean of the EC50 is calculated
to represent this species. The ability of pharmaceuticals to bioconcentrate and their low
concentration but constant introduction and relative persistence in the environment
indicate that these compounds are more likely to have chronic rather than acute toxic
effects on aquatic biota (Fent et al., 2006; Quinn et al., 2008). Chronic EC50 values are
seldom reported in the literature, therefore, according to the AMI method, when chronic
data do not cover three different taxa, calculation of chronic HC50EC50s must be based
on acute data. An acute-to-chronic ratio of 1.9 was applied to extrapolate chronic
HC50EC50s from acute HC50EC50s (Payet, 2004). Experimental acute EC50s were
gathered from the ECOTOX database (USEPA, 2007) and literature reports (Table 11).
In Equation A15, FRfw,fw is the environmental exposure factor for freshwater,
equivalent to the fraction of chemical dissolved in freshwater (Huijbregts et al., 2010):
FR fw, fw = 1
1+ 𝐾p · [SUSP]fw + 𝐾DOC · [SUSP]fw + BCFfish · [SUSP]fw (𝐴15)
Appendix A
124
where Kp is the partition coefficient between water and suspended matter; the fraction of
organic carbon in suspended matter, fOC, necessary to derive Kp from KOC, the partition
coefficient normalized by the organic carbon content, is assumed to be 0.10 (EC, 2004);
Kdoc is the partition coefficient between dissolved organic carbon and water; [SUSP]fw,
[DOC]fw, and [BIOTA]fw are the concentrations of suspended matter, dissolved organic
carbon and biota in freshwater, set at 15×10-6 kg·L-1, 5×10⁻⁶ kg·L-1, and 1×10⁻⁶ kg·L-1,
respectively, for typical European conditions (Huijbregts et al., 2010); the
bioconcentration factor in fish, BCFfish in L·kg-1, is the concentration of a chemical in
the fish divided by the dissolved concentration of the chemical in the surrounding water.
BCFs in fish for non-dissociating compounds were obtained using KOW regression-
based estimates from the BCFBAF v3.00 software program (USEPA, 2008). For
dissociating compounds at environmental pH, the regression equations of Fu et al.
(2009) were applied:
BCF = 𝑓n · 10 !.!" !"# !OW, n!!.!" + 𝑓d
· 10 !.!" !"# !OW, n ! !.!" !!! ! !.!" for acids (A16)
BCF = 𝑓n · 10 !.!" !"# !OW, n!!.!" + 𝑓d
· 10 !.!" !"# !OW, n ! !.!" ! !.!" !!! for bases (A17)
Fu et al. (2009) showed that these regression equations outperform conventional non-
polar regressions using the KOW corrected by the neutral fraction. The equations are
valid in the range -0.36 < pKa < 10.61. Therefore, the minimum or maximum pKa values
outside the calibrated range were applied.
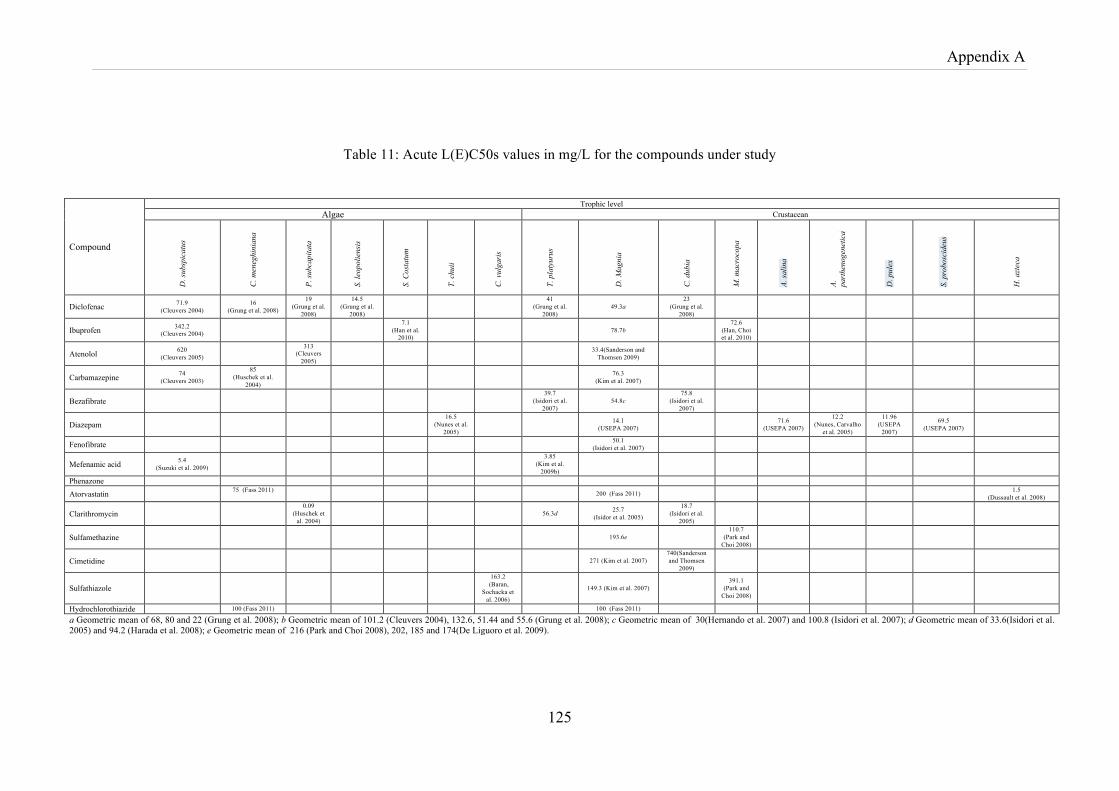
Appendix A
125
Table 11: Acute L(E)C50s values in mg/L for the compounds under study
Compound
Trophic level
Algae Crustacean
D. s
ubsp
icat
us
C. m
eneg
hini
ana
P. su
bcap
itata
S. le
opol
iens
is
S. C
osta
tum
T. c
huii
C. v
ulga
ris
T. p
laty
urus
D. M
agni
a
C. d
ubia
M. m
acro
copa
A. sa
lina
A.
part
heno
gene
tica
D. p
ulex
S. p
robo
scid
eus
H. a
ztec
a
Diclofenac 71.9 (Cleuvers 2004)
16 (Grung et al. 2008)
19 (Grung et al.
2008)
14.5 (Grung et al.
2008)
41 (Grung et al.
2008) 49.3a
23 (Grung et al.
2008)
Ibuprofen 342.2 (Cleuvers 2004)
7.1 (Han et al.
2010) 78.7b
72.6 (Han, Choi et al. 2010)
Atenolol 620 (Cleuvers 2005)
313 (Cleuvers
2005) 33.4(Sanderson and
Thomsen 2009)
Carbamazepine 74 (Cleuvers 2003)
85 (Huschek et al.
2004) 76.3
(Kim et al. 2007)
Bezafibrate 39.7
(Isidori et al. 2007)
54.8c 75.8
(Isidori et al. 2007)
Diazepam 16.5
(Nunes et al. 2005)
14.1 (USEPA 2007) 71.6
(USEPA 2007)
12.2 (Nunes, Carvalho
et al. 2005)
11.96 (USEPA
2007)
69.5 (USEPA 2007)
Fenofibrate 50.1 (Isidori et al. 2007)
Mefenamic acid 5.4 (Suzuki et al. 2009)
3.85 (Kim et al.
2009b)
Phenazone
Atorvastatin 75 (Fass 2011) 200 (Fass 2011) 1.5
(Dussault et al. 2008)
Clarithromycin 0.09
(Huschek et al. 2004)
56.3d 25.7 (Isidor et al. 2005)
18.7 (Isidori et al.
2005)
Sulfamethazine 193.6e 110.7
(Park and Choi 2008)
Cimetidine 271 (Kim et al. 2007) 740(Sanderson and Thomsen
2009)
Sulfathiazole
163.2 (Baran,
Sochacka et al. 2006)
149.3 (Kim et al. 2007) 391.1
(Park and Choi 2008)
Hydrochlorothiazide 100 (Fass 2011) 100 (Fass 2011)
a Geometric mean of 68, 80 and 22 (Grung et al. 2008); b Geometric mean of 101.2 (Cleuvers 2004), 132.6, 51.44 and 55.6 (Grung et al. 2008); c Geometric mean of 30(Hernando et al. 2007) and 100.8 (Isidori et al. 2007); d Geometric mean of 33.6(Isidori et al. 2005) and 94.2 (Harada et al. 2008); e Geometric mean of 216 (Park and Choi 2008), 202, 185 and 174(De Liguoro et al. 2009).
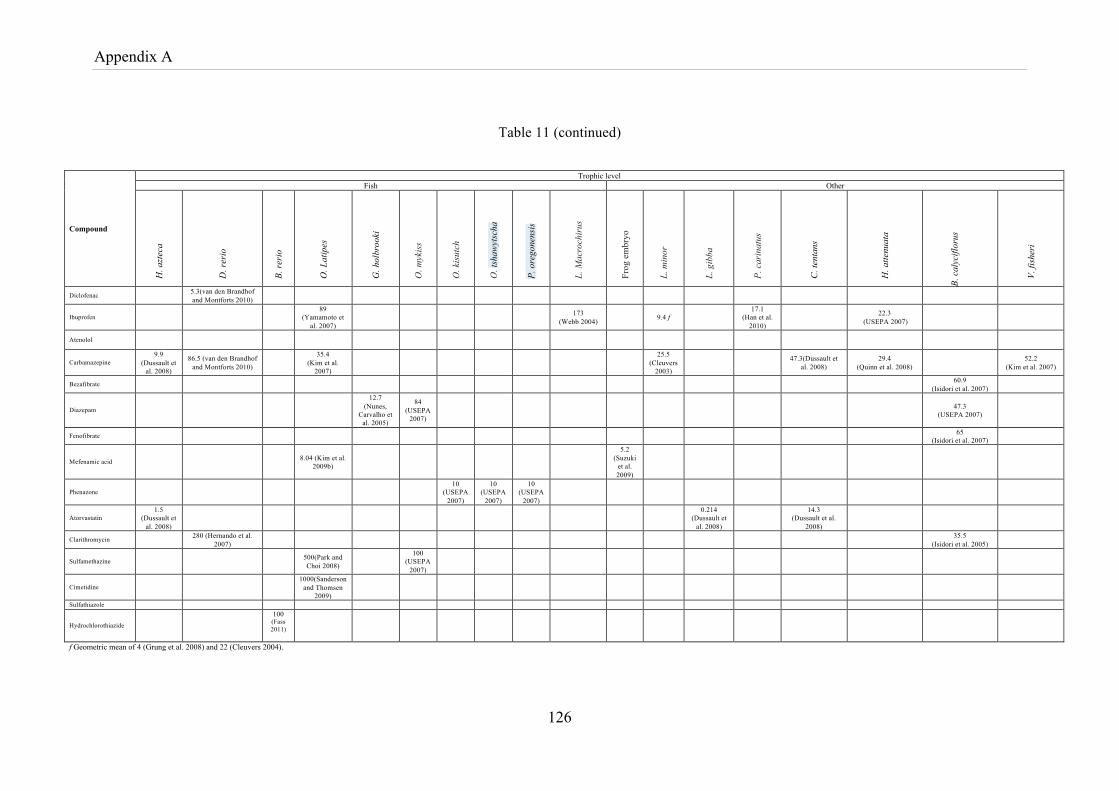
Appendix A
126
Table 11 (continued)
Compound
Trophic level Fish Other
H. a
ztec
a
D. r
erio
B. re
rio
O. L
atip
es
G. h
olbr
ooki
O. m
ykis
s
O. k
isut
ch
O. t
shaw
ytsc
ha
P. o
rego
nens
is
L. M
acro
chir
us
Frog
em
bryo
L. m
inor
L. g
ibba
P. c
arin
atus
C. t
enta
ns
H. a
ttenu
ata
B. c
alyc
iflor
us
V. fi
sher
i
Diclofenac 5.3(van den Brandhof and Montforts 2010)
Ibuprofen 89
(Yamamoto et al. 2007)
173 (Webb 2004) 9.4 f
17.1 (Han et al.
2010) 22.3
(USEPA 2007)
Atenolol
Carbamazepine 9.9
(Dussault et al. 2008)
86.5 (van den Brandhof and Montforts 2010)
35.4 (Kim et al.
2007)
25.5 (Cleuvers
2003) 47.3(Dussault et
al. 2008) 29.4
(Quinn et al. 2008) 52.2 (Kim et al. 2007)
Bezafibrate 60.9 (Isidori et al. 2007)
Diazepam
12.7 (Nunes,
Carvalho et al. 2005)
84 (USEPA
2007) 47.3
(USEPA 2007)
Fenofibrate 65 (Isidori et al. 2007)
Mefenamic acid 8.04 (Kim et al. 2009b)
5.2 (Suzuki
et al. 2009)
Phenazone 10
(USEPA 2007)
10 (USEPA
2007)
10 (USEPA
2007)
Atorvastatin 1.5
(Dussault et al. 2008)
0.214
(Dussault et al. 2008)
14.3
(Dussault et al. 2008)
Clarithromycin 280 (Hernando et al. 2007) 35.5
(Isidori et al. 2005)
Sulfamethazine 500(Park and Choi 2008)
100 (USEPA
2007)
Cimetidine 1000(Sanderson
and Thomsen 2009)
Sulfathiazole
Hydrochlorothiazide
100 (Fass 2011)
f Geometric mean of 4 (Grung et al. 2008) and 22 (Cleuvers 2004).
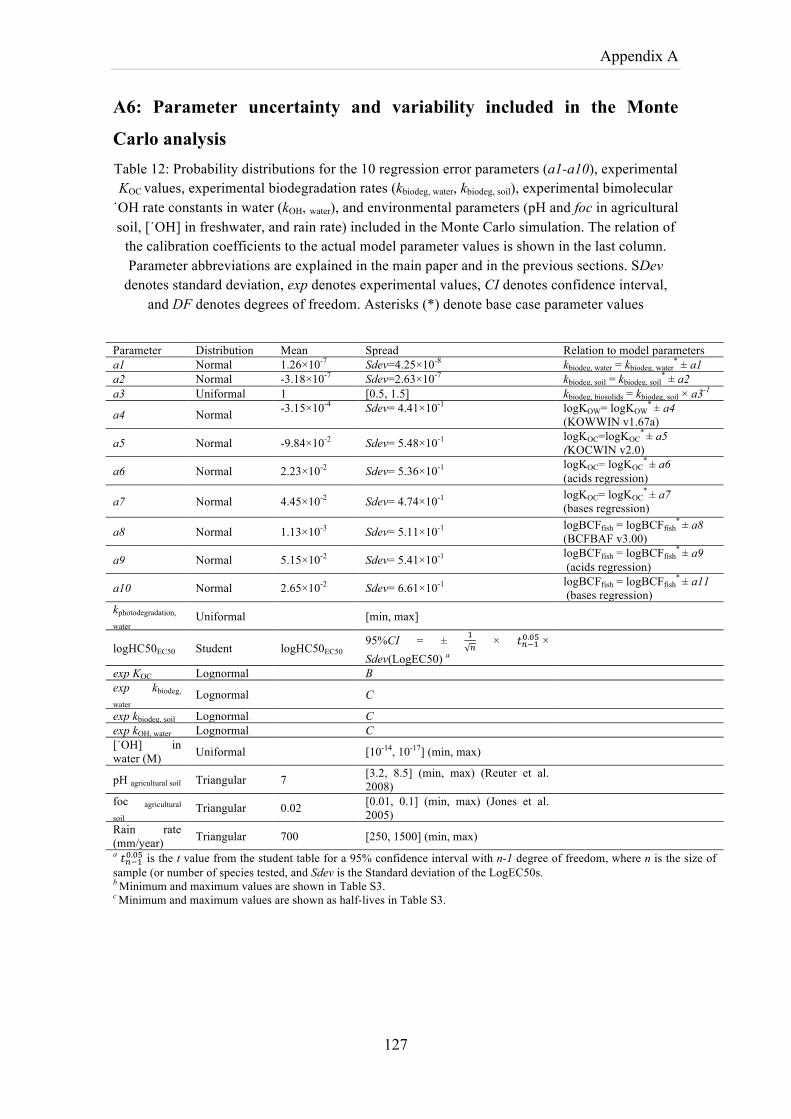
Appendix A
127
A6: Parameter uncertainty and variability included in the Monte
Carlo analysis Table 12: Probability distributions for the 10 regression error parameters (a1-a10), experimental KOC values, experimental biodegradation rates (kbiodeg, water, kbiodeg, soil), experimental bimolecular
˙OH rate constants in water (kOH, water), and environmental parameters (pH and foc in agricultural soil, [˙OH] in freshwater, and rain rate) included in the Monte Carlo simulation. The relation of
the calibration coefficients to the actual model parameter values is shown in the last column. Parameter abbreviations are explained in the main paper and in the previous sections. SDev
denotes standard deviation, exp denotes experimental values, CI denotes confidence interval, and DF denotes degrees of freedom. Asterisks (*) denote base case parameter values
Parameter Distribution Mean Spread Relation to model parameters a1 Normal 1.26×10⁻⁷ Sdev=4.25×10⁻⁸ kbiodeg, water = kbiodeg, water
* ± a1 a2 Normal -3.18×10⁻⁷ Sdev=2.63×10⁻⁷ kbiodeg, soil = kbiodeg, soil
* ± a2 a3 Uniformal 1 [0.5, 1.5] kbiodeg, biosolids = kbiodeg, soil × a3-1
a4 Normal -3.15×10⁻⁴
Sdev= 4.41×10⁻¹
logKOW= logKOW* ± a4
(KOWWIN v1.67a)
a5 Normal -9.84×10⁻² Sdev= 5.48×10⁻¹ logKOC=logKOC* ± a5
(KOCWIN v2.0)
a6 Normal 2.23×10⁻² Sdev= 5.36×10⁻¹ logKOC= logKOC* ± a6
(acids regression)
a7 Normal 4.45×10⁻² Sdev= 4.74×10⁻¹ logKOC= logKOC* ± a7
(bases regression)
a8 Normal 1.13×10⁻³ Sdev= 5.11×10⁻¹ logBCFfish = logBCFfish*
± a8 (BCFBAF v3.00)
a9 Normal 5.15×10⁻² Sdev= 5.41×10⁻¹ logBCFfish = logBCFfish*
± a9 (acids regression)
a10 Normal 2.65×10⁻² Sdev= 6.61×10⁻¹ logBCFfish = logBCFfish*
± a11 (bases regression)
kphotodegradation,
water Uniformal [min, max]
logHC50EC50 Student logHC50EC50 95%CI = ± !
! × 𝑡!!!!.!" ×
Sdev(LogEC50) a
exp KOC Lognormal B exp kbiodeg,
water Lognormal C
exp kbiodeg, soil Lognormal C exp kOH, water Lognormal C [˙OH] in water (M) Uniformal [10-14, 10-17] (min, max)
pH agricultural soil Triangular 7 [3.2, 8.5] (min, max) (Reuter et al. 2008)
foc agricultural
soil Triangular 0.02 [0.01, 0.1] (min, max) (Jones et al.
2005)
Rain rate (mm/year) Triangular 700 [250, 1500] (min, max) a 𝑡!!!!.!" is the t value from the student table for a 95% confidence interval with n-1 degree of freedom, where n is the size of sample (or number of species tested, and Sdev is the Standard deviation of the LogEC50s. b Minimum and maximum values are shown in Table S3. c Minimum and maximum values are shown as half-lives in Table S3.
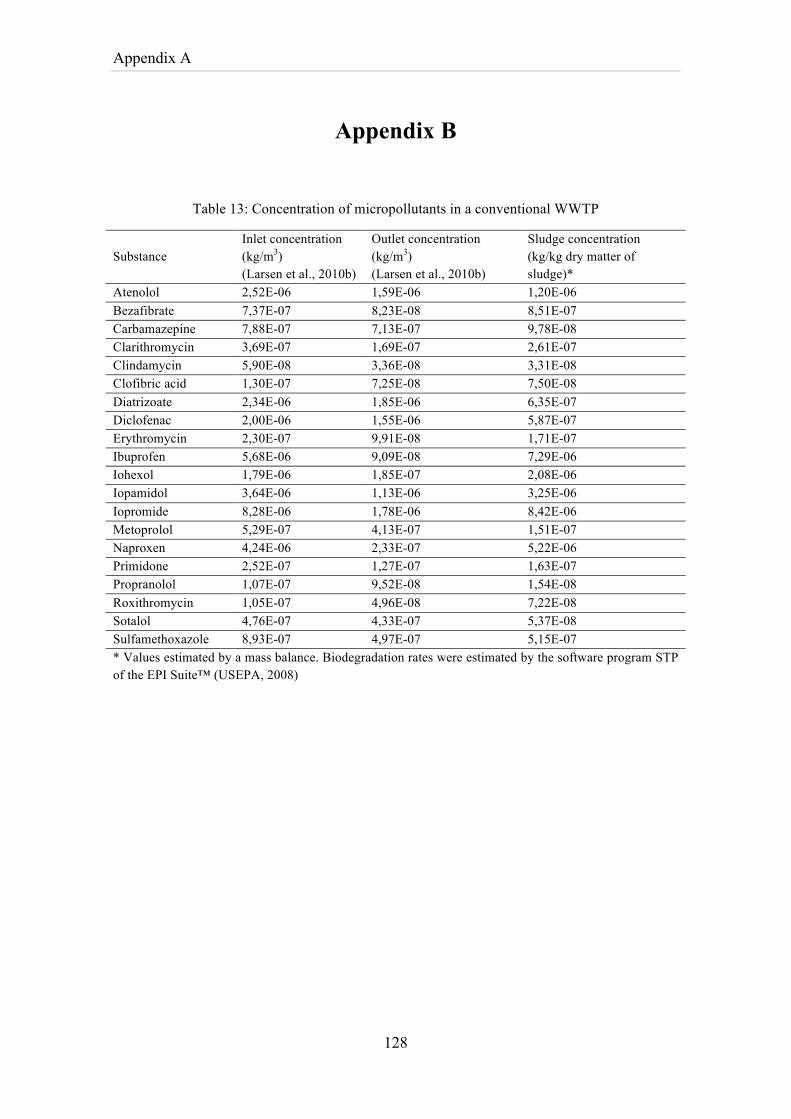
Appendix A
128
Appendix B
Table 13: Concentration of micropollutants in a conventional WWTP
Substance Inlet concentration (kg/m3) (Larsen et al., 2010b)
Outlet concentration (kg/m3) (Larsen et al., 2010b)
Sludge concentration (kg/kg dry matter of sludge)*
Atenolol 2,52E-06 1,59E-06 1,20E-06 Bezafibrate 7,37E-07 8,23E-08 8,51E-07 Carbamazepine 7,88E-07 7,13E-07 9,78E-08 Clarithromycin 3,69E-07 1,69E-07 2,61E-07 Clindamycin 5,90E-08 3,36E-08 3,31E-08 Clofibric acid 1,30E-07 7,25E-08 7,50E-08 Diatrizoate 2,34E-06 1,85E-06 6,35E-07 Diclofenac 2,00E-06 1,55E-06 5,87E-07 Erythromycin 2,30E-07 9,91E-08 1,71E-07 Ibuprofen 5,68E-06 9,09E-08 7,29E-06 Iohexol 1,79E-06 1,85E-07 2,08E-06 Iopamidol 3,64E-06 1,13E-06 3,25E-06 Iopromide 8,28E-06 1,78E-06 8,42E-06 Metoprolol 5,29E-07 4,13E-07 1,51E-07 Naproxen 4,24E-06 2,33E-07 5,22E-06 Primidone 2,52E-07 1,27E-07 1,63E-07 Propranolol 1,07E-07 9,52E-08 1,54E-08 Roxithromycin 1,05E-07 4,96E-08 7,22E-08 Sotalol 4,76E-07 4,33E-07 5,37E-08 Sulfamethoxazole 8,93E-07 4,97E-07 5,15E-07 * Values estimated by a mass balance. Biodegradation rates were estimated by the software program STP of the EPI Suite™ (USEPA, 2008)
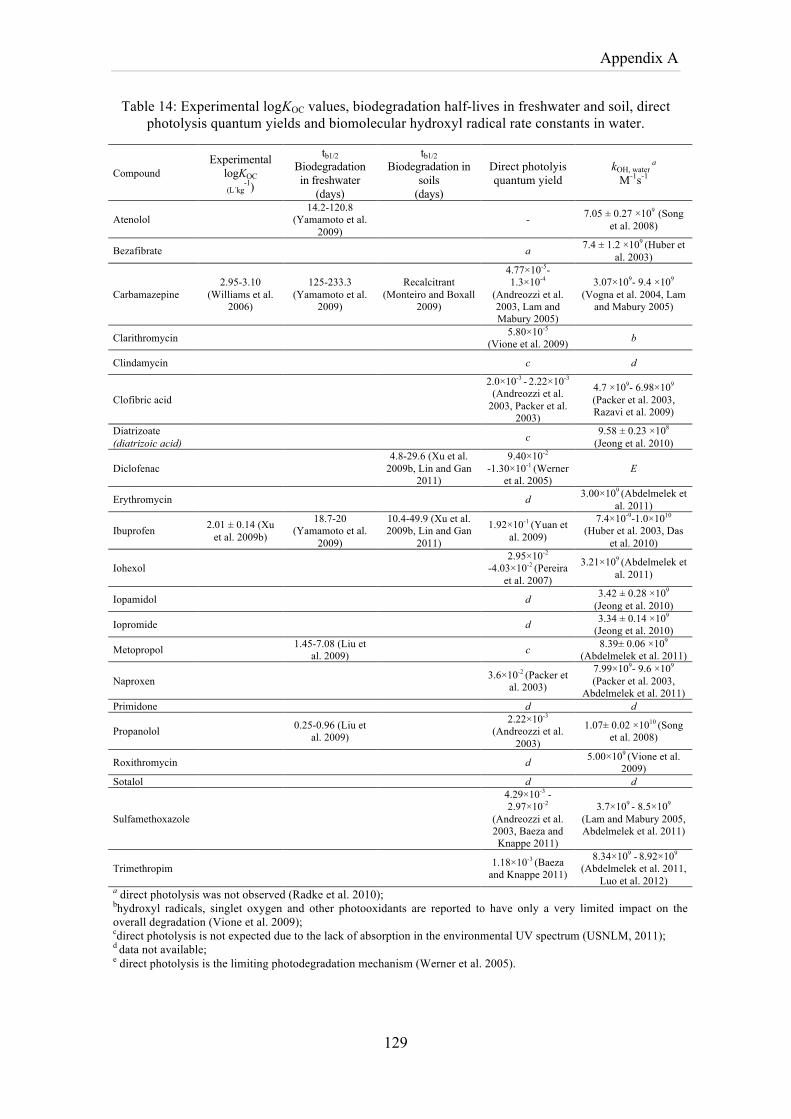
Appendix A
129
Table 14: Experimental logKOC values, biodegradation half-lives in freshwater and soil, direct photolysis quantum yields and biomolecular hydroxyl radical rate constants in water.
Compound Experimental
logKOC
(L˙kg-1)
tb1/2 Biodegradation in freshwater
(days)
tb1/2 Biodegradation in
soils (days)
Direct photolyis quantum yield
kOH, water a
M-1s-1
Atenolol 14.2-120.8
(Yamamoto et al. 2009)
- 7.05 ± 0.27 ×10⁹ (Song et al. 2008)
Bezafibrate a 7.4 ± 1.2 ×10⁹ (Huber et al. 2003)
Carbamazepine 2.95-3.10
(Williams et al. 2006)
125-233.3 (Yamamoto et al.
2009)
Recalcitrant (Monteiro and Boxall
2009)
4.77×10⁻⁵- 1.3×10⁻⁴
(Andreozzi et al. 2003, Lam and Mabury 2005)
3.07×10⁹- 9.4 ×10⁹
(Vogna et al. 2004, Lam and Mabury 2005)
Clarithromycin 5.80×10⁻⁵
(Vione et al. 2009) b
Clindamycin c d
Clofibric acid
2.0×10⁻³ - 2.22×10⁻³
(Andreozzi et al. 2003, Packer et al.
2003)
4.7 ×10⁹- 6.98×10⁹
(Packer et al. 2003, Razavi et al. 2009)
Diatrizoate (diatrizoic acid) c 9.58 ± 0.23 ×10⁸
(Jeong et al. 2010)
Diclofenac 4.8-29.6 (Xu et al.
2009b, Lin and Gan 2011)
9.40×10⁻²
-1.30×10⁻¹ (Werner et al. 2005)
E
Erythromycin d 3.00×10⁹ (Abdelmelek et al. 2011)
Ibuprofen 2.01 ± 0.14 (Xu et al. 2009b)
18.7-20 (Yamamoto et al.
2009)
10.4-49.9 (Xu et al. 2009b, Lin and Gan
2011)
1.92×10⁻¹ (Yuan et al. 2009)
7.4×10⁻⁹-1.0×10¹⁰
(Huber et al. 2003, Das et al. 2010)
Iohexol 2.95×10⁻²
-4.03×10⁻² (Pereira et al. 2007)
3.21×10⁹ (Abdelmelek et al. 2011)
Iopamidol d 3.42 ± 0.28 ×10⁹
(Jeong et al. 2010)
Iopromide d 3.34 ± 0.14 ×10⁹
(Jeong et al. 2010)
Metopropol 1.45-7.08 (Liu et al. 2009) c 8.39± 0.06 ×10⁹
(Abdelmelek et al. 2011)
Naproxen 3.6×10⁻² (Packer et al. 2003)
7.99×10⁹- 9.6 ×10⁹
(Packer et al. 2003, Abdelmelek et al. 2011)
Primidone d d
Propanolol 0.25-0.96 (Liu et al. 2009)
2.22×10⁻³ (Andreozzi et al.
2003)
1.07± 0.02 ×10¹⁰ (Song et al. 2008)
Roxithromycin d 5.00×10⁹ (Vione et al. 2009)
Sotalol d d
Sulfamethoxazole
4.29×10⁻³ - 2.97×10⁻²
(Andreozzi et al. 2003, Baeza and Knappe 2011)
3.7×10⁹ - 8.5×10⁹
(Lam and Mabury 2005, Abdelmelek et al. 2011)
Trimethropim 1.18×10⁻³ (Baeza and Knappe 2011)
8.34×10⁹ - 8.92×10⁹
(Abdelmelek et al. 2011, Luo et al. 2012)
a direct photolysis was not observed (Radke et al. 2010); bhydroxyl radicals, singlet oxygen and other photooxidants are reported to have only a very limited impact on the overall degradation (Vione et al. 2009); cdirect photolysis is not expected due to the lack of absorption in the environmental UV spectrum (USNLM, 2011); d data not available; e direct photolysis is the limiting photodegradation mechanism (Werner et al. 2005).
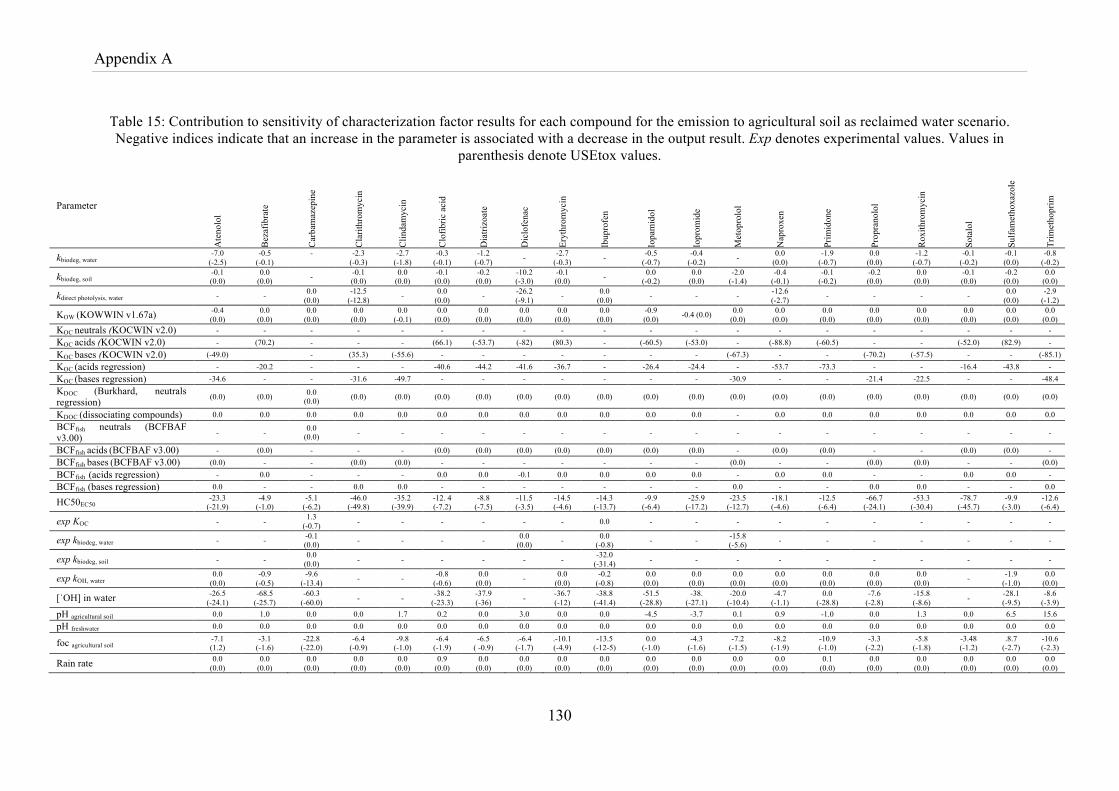
Appendix A
130
Table 15: Contribution to sensitivity of characterization factor results for each compound for the emission to agricultural soil as reclaimed water scenario. Negative indices indicate that an increase in the parameter is associated with a decrease in the output result. Exp denotes experimental values. Values in
parenthesis denote USEtox values.
Parameter A
teno
lol
Bez
afib
rate
Car
bam
azep
ine
Cla
rithr
omyc
in
Clin
dam
ycin
Clo
fibric
aci
d
Dia
trizo
ate
Dic
lofe
nac
Eryt
hrom
ycin
Ibup
rofe
n
Iopa
mid
ol
Iopr
omid
e
Met
opro
lol
Nap
roxe
n
Prim
idon
e
Prop
rano
lol
Rox
ithro
myc
in
Sota
lol
Sulfa
met
hoxa
zole
Trim
etho
prim
kbiodeg, water -7.0 (-2.5)
-0.5 (-0.1)
-
-2.3 (-0.3)
-2.7 (-1.8)
-0.3 (-0.1)
-1.2 (-0.7) - -2.7
(-0.3) - -0.5 (-0.7)
-0.4 (-0.2) - 0.0
(0.0) -1.9
(-0.7) 0.0
(0.0) -1.2
(-0.7) -0.1
(-0.2) -0.1 (0.0)
-0.8 (-0.2)
kbiodeg, soil -0.1 (0.0)
0.0 (0.0) - -0.1
(0.0) 0.0
(0.0) -0.1 (0.0)
-0.2 (0.0)
-10.2 (-3.0)
-0.1 (0.0) - 0.0
(-0.2) 0.0
(0.0) -2.0
(-1.4) -0.4
(-0.1) -0.1
(-0.2) -0.2 (0.0)
0.0 (0.0)
-0.1 (0.0)
-0.2 (0.0)
0.0 (0.0)
kdirect photolysis, water - - 0.0 (0.0)
-12.5 (-12.8) - 0.0
(0.0) - -26.2 (-9.1) - 0.0
(0.0) - - - -12.6 (-2.7) - - - - 0.0
(0.0) -2.9
(-1.2)
KOW (KOWWIN v1.67a) -0.4 (0.0)
0.0 (0.0)
0.0 (0.0)
0.0 (0.0)
0.0 (-0.1)
0.0 (0.0)
0.0 (0.0)
0.0 (0.0)
0.0 (0.0)
0.0 (0.0)
-0.9 (0.0) -0.4 (0.0) 0.0
(0.0) 0.0
(0.0) 0.0
(0.0) 0.0
(0.0) 0.0
(0.0) 0.0
(0.0) 0.0
(0.0) 0.0
(0.0) KOC neutrals (KOCWIN v2.0) - - - - - - - - - - - - - - - - - - - - KOC acids (KOCWIN v2.0) - (70.2) - - - (66.1) (-53.7) (-82) (80.3) - (-60.5) (-53.0) - (-88.8) (-60.5) - - (-52.0) (82.9) - KOC bases (KOCWIN v2.0) (-49.0) - (35.3) (-55.6) - - - - - - - (-67.3) - - (-70.2) (-57.5) - - (-85.1) KOC (acids regression) - -20.2 - - - -40.6 -44.2 -41.6 -36.7 - -26.4 -24.4 - -53.7 -73.3 - - -16.4 -43.8 - KOC (bases regression) -34.6 - - -31.6 -49.7 - - - - - - - -30.9 - - -21.4 -22.5 - - -48.4 KDOC (Burkhard, neutrals regression) (0.0) (0.0) 0.0
(0.0) (0.0) (0.0) (0.0) (0.0) (0.0) (0.0) (0.0) (0.0) (0.0) (0.0) (0.0) (0.0) (0.0) (0.0) (0.0) (0.0) (0.0)
KDOC (dissociating compounds) 0.0 0.0 0.0 0.0 0.0 0.0 0.0 0.0 0.0 0.0 0.0 0.0 - 0.0 0.0 0.0 0.0 0.0 0.0 0.0 BCFfish neutrals (BCFBAF v3.00) - - 0.0
(0.0) - - - - - - - - - - - - - - - - -
BCFfish acids (BCFBAF v3.00) - (0.0) - - - (0.0) (0.0) (0.0) (0.0) (0.0) (0.0) (0.0) - (0.0) (0.0) - - (0.0) (0.0) - BCFfish bases (BCFBAF v3.00) (0.0) - - (0.0) (0.0) - - - - - - - (0.0) - - (0.0) (0.0) - - (0.0) BCFfish (acids regression) - 0.0 - - - 0.0 0.0 -0.1 0.0 0.0 0.0 0.0 - 0.0 0.0 - - 0.0 0.0 - BCFfish (bases regression) 0.0 - - 0.0 0.0 - - - - - - - 0.0 - - 0.0 0.0 - - 0.0
HC50EC50 -23.3
(-21.9) -4.9
(-1.0) -5.1
(-6.2) -46.0
(-49.8) -35.2
(-39.9) -12. 4 (-7.2)
-8.8 (-7.5)
-11.5 (-3.5)
-14.5 (-4.6)
-14.3 (-13.7)
-9.9 (-6.4)
-25.9 (-17.2)
-23.5 (-12.7)
-18.1 (-4.6)
-12.5 (-6.4)
-66.7 (-24.1)
-53.3 (-30.4)
-78.7 (-45.7)
-9.9 (-3.0)
-12.6 (-6.4)
exp KOC - - 1.3 (-0.7) - - - - - - 0.0 - - - - - - - - - -
exp kbiodeg, water - - -0.1 (0.0) - - - - 0.0
(0.0) - 0.0 (-0.8) - - -15.8
(-5.6) - - - - - - -
exp kbiodeg, soil - - 0.0 (0.0) - - - - - - -32.0
(-31.4) - - - - - - - - - -
exp kOH, water 0.0 (0.0)
-0.9 (-0.5)
-9.6 (-13.4) - - -0.8
(-0.6) 0.0
(0.0) - 0.0 (0.0)
-0.2 (-0.8)
0.0 (0.0)
0.0 (0.0)
0.0 (0.0)
0.0 (0.0)
0.0 (0.0)
0.0 (0.0)
0.0 (0.0) - -1.9
(-1.0) 0.0
(0.0)
[˙OH] in water -26.5 (-24.1)
-68.5 (-25.7)
-60.3 (-60.0) - - -38.2
(-23.3) -37.9 (-36) - -36.7
(-12) -38.8
(-41.4) -51.5
(-28.8) -38.
(-27.1) -20.0
(-10.4) -4.7
(-1.1) 0.0
(-28.8) -7.6
(-2.8) -15.8 (-8.6) - -28.1
(-9.5) -8.6
(-3.9) pH agricultural soil 0.0 1.0 0.0 0.0 1.7 0.2 0.0 3.0 0.0 0.0 -4.5 -3.7 0.1 0.9 -1.0 0.0 1.3 0.0 6.5 15.6 pH freshwater 0.0 0.0 0.0 0.0 0.0 0.0 0.0 0.0 0.0 0.0 0.0 0.0 0.0 0.0 0.0 0.0 0.0 0.0 0.0 0.0
foc agricultural soil -7.1 (1.2)
-3.1 (-1.6)
-22.8 (-22.0)
-6.4 (-0.9)
-9.8 (-1.0)
-6.4 (-1.9)
-6.5 ( -0.9)
.-6.4 (-1.7)
.-10.1 (-4.9)
-13.5 (-12-5)
0.0 (-1.0)
-4.3 (-1.6)
-7.2 (-1.5)
-8.2 (-1.9)
-10.9 (-1.0)
-3.3 (-2.2)
-5.8 (-1.8)
-3.48 (-1.2)
.8.7 (-2.7)
-10.6 (-2.3)
Rain rate 0.0 (0.0)
0.0 (0.0)
0.0 (0.0)
0.0 (0.0)
0.0 (0.0)
0.9 (0.0)
0.0 (0.0)
0.0 (0.0)
0.0 (0.0)
0.0 (0.0)
0.0 (0.0)
0.0 (0.0)
0.0 (0.0)
0.0 (0.0)
0.1 (0.0)
0.0 (0.0)
0.0 (0.0)
0.0 (0.0)
0.0 (0.0)
0.0 (0.0)
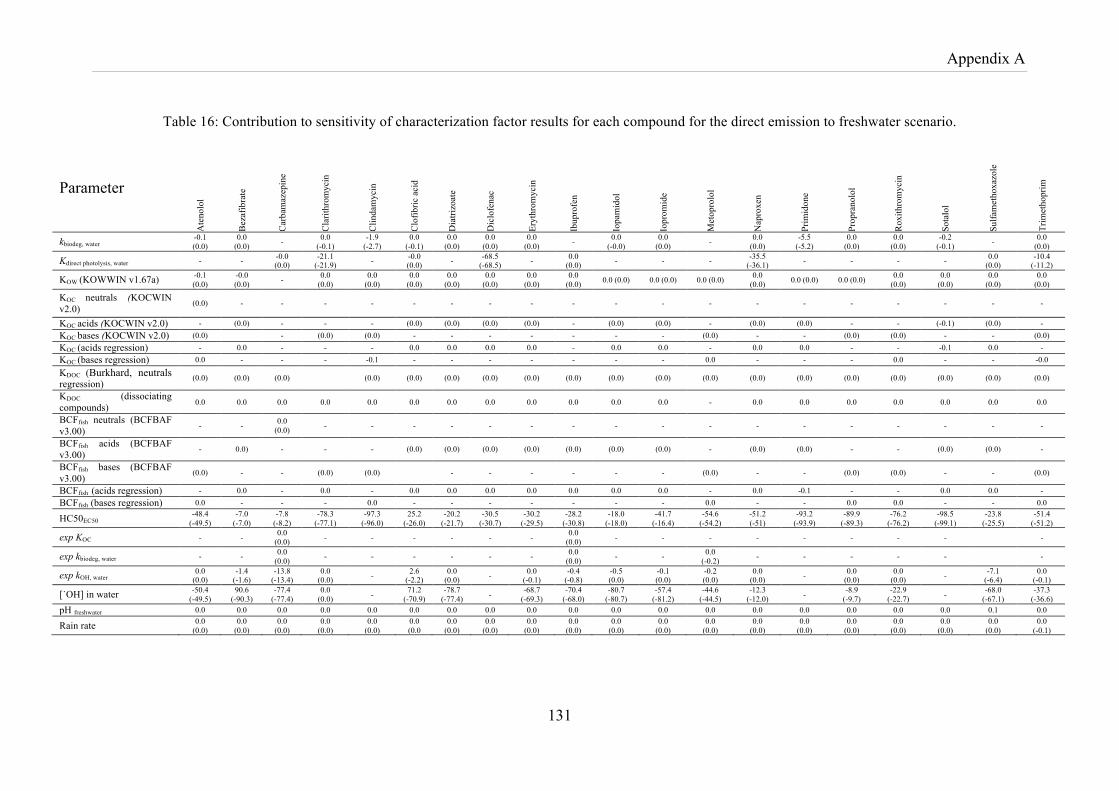
Appendix A
131
Table 16: Contribution to sensitivity of characterization factor results for each compound for the direct emission to freshwater scenario.
Parameter A
teno
lol
Bez
afib
rate
Car
bam
azep
ine
Cla
rithr
omyc
in
Clin
dam
ycin
Clo
fibric
aci
d
Dia
trizo
ate
Dic
lofe
nac
Eryt
hrom
ycin
Ibup
rofe
n
Iopa
mid
ol
Iopr
omid
e
Met
opro
lol
Nap
roxe
n
Prim
idon
e
Prop
rano
lol
Rox
ithro
myc
in
Sota
lol
Sulfa
met
hoxa
zole
Trim
etho
prim
kbiodeg, water -0.1 (0.0)
0.0 (0.0) - 0.0
(-0.1) -1.9
(-2.7) 0.0
(-0.1) 0.0
(0.0) 0.0
(0.0) 0.0
(0.0) - 0.0 (-0.0)
0.0 (0.0) - 0.0
(0.0) -5.5
(-5.2) 0.0
(0.0) 0.0
(0.0) -0.2
(-0.1) - 0.0 (0.0)
Kdirect photolysis, water - - -0.0 (0.0)
-21.1 (-21.9) - -0.0
(0.0) - -68.5 (-68.5) - 0.0
(0.0) - - - -35.5 (-36.1) - - - - 0.0
(0.0) -10.4
(-11.2)
KOW (KOWWIN v1.67a) -0.1 (0.0)
-0.0 (0.0) - 0.0
(0.0) 0.0
(0.0) 0.0
(0.0) 0.0
(0.0) 0.0
(0.0) 0.0
(0.0) 0.0
(0.0) 0.0 (0.0) 0.0 (0.0) 0.0 (0.0) 0.0 (0.0) 0.0 (0.0) 0.0 (0.0) 0.0
(0.0) 0.0
(0.0) 0.0
(0.0) 0.0
(0.0)
KOC neutrals (KOCWIN v2.0) (0.0) - - - - - - - - - - - - - - - - - - -
KOC acids (KOCWIN v2.0) - (0.0) - - - (0.0) (0.0) (0.0) (0.0) - (0.0) (0.0) - (0.0) (0.0) - - (-0.1) (0.0) - KOC bases (KOCWIN v2.0) (0.0) - (0.0) (0.0) - - - - - - - (0.0) - - (0.0) (0.0) - - (0.0) KOC (acids regression) - 0.0 - - - 0.0 0.0 0.0 0.0 - 0.0 0.0 - 0.0 0.0 - - -0.1 0.0 - KOC (bases regression) 0.0 - - - -0.1 - - - - - - - 0.0 - - - 0.0 - - -0.0
KDOC (Burkhard, neutrals regression)
(0.0) (0.0) (0.0) (0.0) (0.0) (0.0) (0.0) (0.0) (0.0) (0.0) (0.0) (0.0) (0.0) (0.0) (0.0) (0.0) (0.0) (0.0) (0.0)
KDOC (dissociating compounds) 0.0 0.0 0.0 0.0 0.0 0.0 0.0 0.0 0.0 0.0 0.0 0.0 - 0.0 0.0 0.0 0.0 0.0 0.0 0.0
BCFfish neutrals (BCFBAF v3.00) - - 0.0
(0.0) - - - - - - - - - - - - - - - - -
BCFfish acids (BCFBAF v3.00) - 0.0) - - - (0.0) (0.0) (0.0) (0.0) (0.0) (0.0) (0.0) - (0.0) (0.0) - - (0.0) (0.0) -
BCFfish bases (BCFBAF v3.00) (0.0) - - (0.0) (0.0) - - - - - - (0.0) - - (0.0) (0.0) - - (0.0)
BCFfish (acids regression) - 0.0 - 0.0 - 0.0 0.0 0.0 0.0 0.0 0.0 0.0 - 0.0 -0.1 - - 0.0 0.0 - BCFfish (bases regression) 0.0 - - - 0.0 - - - - - - - 0.0 - - 0.0 0.0 - - 0.0
HC50EC50 -48.4
(-49.5) -7.0
(-7.0) -7.8
(-8.2) -78.3
(-77.1) -97.3
(-96.0) 25.2
(-26.0) -20.2
(-21.7) -30.5
(-30.7) -30.2
(-29.5) -28.2
(-30.8) -18.0
(-18.0) -41.7
(-16.4) -54.6
(-54.2) -51.2 (-51)
-93.2 (-93.9)
-89.9 (-89.3)
-76.2 (-76.2)
-98.5 (-99.1)
-23.8 (-25.5)
-51.4 (-51.2)
exp KOC - - 0.0 (0.0) - - - - - - 0.0
(0.0) - - - - - - - - -
exp kbiodeg, water - - 0.0 (0.0) - - - - - - 0.0
(0.0) - - 0.0 (-0.2) - - - - - -
exp kOH, water 0.0 (0.0)
-1.4 (-1.6)
-13.8 (-13.4)
0.0 (0.0) - 2.6
(-2.2) 0.0
(0.0) - 0.0 (-0.1)
-0.4 (-0.8)
-0.5 (0.0)
-0.1 (0.0)
-0.2 (0.0)
0.0 (0.0) - 0.0
(0.0) 0.0
(0.0) - -7.1 (-6.4)
0.0 (-0.1)
[˙OH] in water -50.4 (-49.5)
90.6 (-90.3)
-77.4 (-77.4)
0.0 (0.0) - 71.2
(-70.9) -78.7
(-77.4) - -68.7 (-69.3)
-70.4 (-68.0)
-80.7 (-80.7)
-57.4 (-81.2)
-44.6 (-44.5)
-12.3 (-12.0) - -8.9
(-9.7) -22.9
(-22.7) - -68.0 (-67.1)
-37.3 (-36.6)
pH freshwater 0.0 0.0 0.0 0.0 0.0 0.0 0.0 0.0 0.0 0.0 0.0 0.0 0.0 0.0 0.0 0.0 0.0 0.0 0.1 0.0
Rain rate 0.0 (0.0)
0.0 (0.0)
0.0 (0.0)
0.0 (0.0)
0.0 (0.0)
0.0 (0.0
0.0 (0.0)
0.0 (0.0)
0.0 (0.0)
0.0 (0.0)
0.0 (0.0)
0.0 (0.0)
0.0 (0.0)
0.0 (0.0)
0.0 (0.0)
0.0 (0.0)
0.0 (0.0)
0.0 (0.0)
0.0 (0.0)
0.0 (-0.1)

Appendix A
132
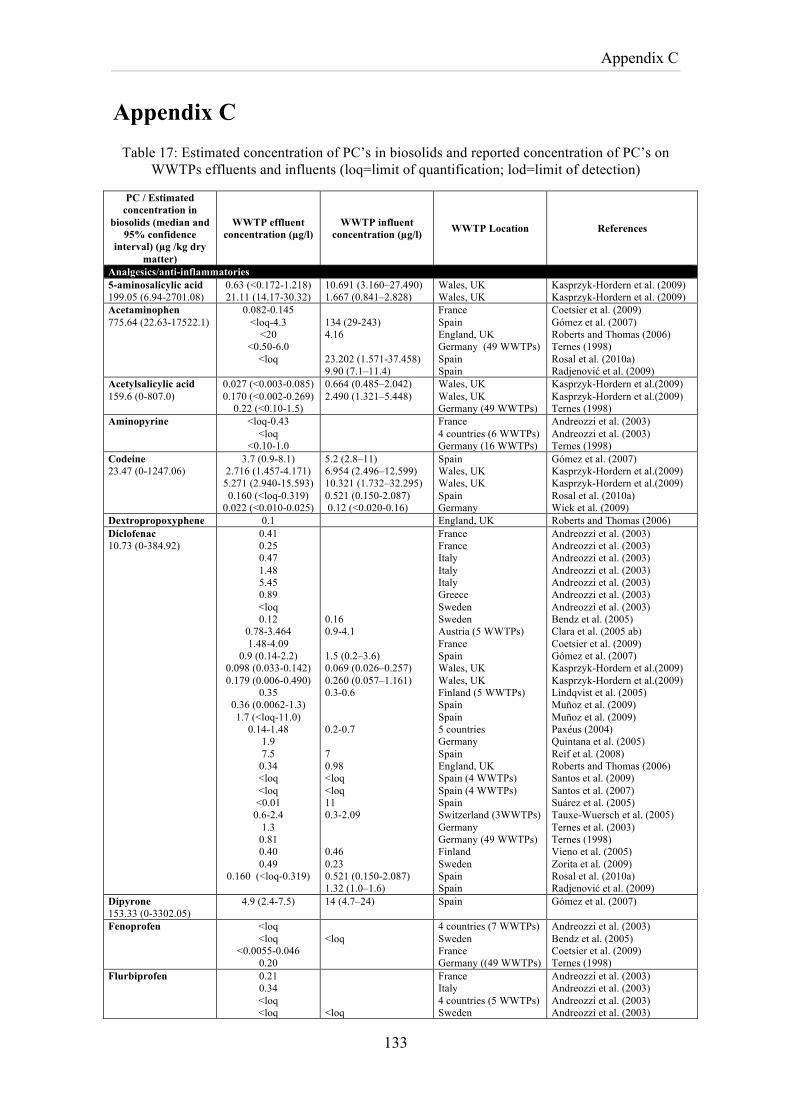
Appendix C
133
Appendix C Table 17: Estimated concentration of PC’s in biosolids and reported concentration of PC’s on
WWTPs effluents and influents (loq=limit of quantification; lod=limit of detection)
PC / Estimated concentration in
biosolids (median and 95% confidence
interval) (µg /kg dry matter)
WWTP effluent concentration (µg/l)
WWTP influent concentration (µg/l) WWTP Location References
Analgesics/anti-inflammatories 5-aminosalicylic acid 199.05 (6.94-2701.08)
0.63 (<0.172-1.218) 21.11 (14.17-30.32)
10.691 (3.160–27.490) 1.667 (0.841–2.828)
Wales, UK Wales, UK
Kasprzyk-Hordern et al. (2009) Kasprzyk-Hordern et al. (2009)
Acetaminophen 775.64 (22.63-17522.1)
0.082-0.145 <loq-4.3
<20 <0.50-6.0
<loq
134 (29-243) 4.16 23.202 (1.571-37.458) 9.90 (7.1–11.4)
France Spain England, UK Germany (49 WWTPs) Spain Spain
Coetsier et al. (2009) Gómez et al. (2007) Roberts and Thomas (2006) Ternes (1998) Rosal et al. (2010a) Radjenović et al. (2009)
Acetylsalicylic acid 159.6 (0-807.0)
0.027 (<0.003-0.085) 0.170 (<0.002-0.269)
0.22 (<0.10-1.5)
0.664 (0.485–2.042) 2.490 (1.321–5.448)
Wales, UK Wales, UK Germany (49 WWTPs)
Kasprzyk-Hordern et al.(2009) Kasprzyk-Hordern et al.(2009) Ternes (1998)
Aminopyrine
<loq-0.43 <loq
<0.10-1.0
France 4 countries (6 WWTPs) Germany (16 WWTPs)
Andreozzi et al. (2003) Andreozzi et al. (2003) Ternes (1998)
Codeine 23.47 (0-1247.06)
3.7 (0.9-8.1) 2.716 (1.457-4.171)
5.271 (2.940-15.593) 0.160 (<loq-0.319)
0.022 (<0.010-0.025)
5.2 (2.8–11) 6.954 (2.496–12.599) 10.321 (1.732–32.295) 0.521 (0.150-2.087) 0.12 (<0.020-0.16)
Spain Wales, UK Wales, UK Spain Germany
Gómez et al. (2007) Kasprzyk-Hordern et al.(2009) Kasprzyk-Hordern et al.(2009) Rosal et al. (2010a) Wick et al. (2009)
Dextropropoxyphene 0.1 England, UK Roberts and Thomas (2006) Diclofenac 10.73 (0-384.92)
0.41 0.25 0.47 1.48 5.45 0.89 <loq 0.12
0.78-3.464 1.48-4.09
0.9 (0.14-2.2) 0.098 (0.033-0.142) 0.179 (0.006-0.490)
0.35 0.36 (0.0062-1.3) 1.7 (<loq-11.0)
0.14-1.48 1.9 7.5
0.34 <loq <loq <0.01
0.6-2.4 1.3
0.81 0.40 0.49
0.160 (<loq-0.319)
0.16 0.9-4.1 1.5 (0.2–3.6) 0.069 (0.026–0.257) 0.260 (0.057–1.161) 0.3-0.6 0.2-0.7 7 0.98 <loq <loq 11 0.3-2.09 0.46 0.23 0.521 (0.150-2.087) 1.32 (1.0–1.6)
France France Italy Italy Italy Greece Sweden Sweden Austria (5 WWTPs) France Spain Wales, UK Wales, UK Finland (5 WWTPs) Spain Spain 5 countries Germany Spain England, UK Spain (4 WWTPs) Spain (4 WWTPs) Spain Switzerland (3WWTPs) Germany Germany (49 WWTPs) Finland Sweden Spain Spain
Andreozzi et al. (2003) Andreozzi et al. (2003) Andreozzi et al. (2003) Andreozzi et al. (2003) Andreozzi et al. (2003) Andreozzi et al. (2003) Andreozzi et al. (2003) Bendz et al. (2005) Clara et al. (2005 ab) (C) Coetsier et al. (2009) Gómez et al. (2007) Kasprzyk-Hordern et al.(2009) Kasprzyk-Hordern et al.(2009) Lindqvist et al. (2005) Muñoz et al. (2009) Muñoz et al. (2009) Paxéus (2004) Quintana et al. (2005) Reif et al. (2008) Roberts and Thomas (2006) Santos et al. (2009) Santos et al. (2007) Suárez et al. (2005) Tauxe-Wuersch et al. (2005) Ternes et al. (2003) Ternes (1998) Vieno et al. (2005) Zorita et al. (2009) Rosal et al. (2010a) Radjenović et al. (2009)
Dipyrone 153.33 (0-3302.05)
4.9 (2.4-7.5) 14 (4.7–24) Spain Gómez et al. (2007)
Fenoprofen
<loq <loq
<0.0055-0.046 0.20
<loq
4 countries (7 WWTPs) Sweden France Germany ((49 WWTPs)
Andreozzi et al. (2003) Bendz et al. (2005) Coetsier et al. (2009) Ternes (1998)
Flurbiprofen 0.21 0.34 <loq <loq
<loq
France Italy 4 countries (5 WWTPs) Sweden
Andreozzi et al. (2003) Andreozzi et al. (2003) Andreozzi et al. (2003) Andreozzi et al. (2003)
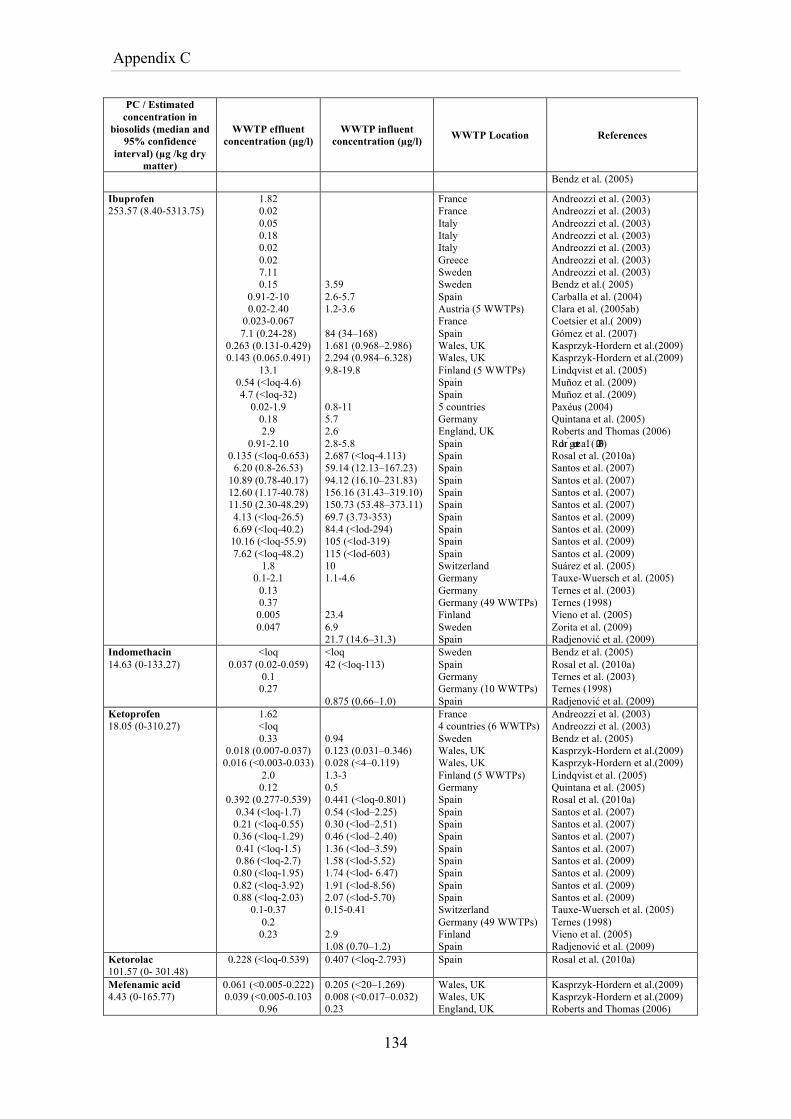
Appendix C
134
PC / Estimated concentration in
biosolids (median and 95% confidence
interval) (µg /kg dry matter)
WWTP effluent concentration (µg/l)
WWTP influent concentration (µg/l) WWTP Location References
Bendz et al. (2005)
Ibuprofen 253.57 (8.40-5313.75)
1.82 0.02 0.05 0.18 0.02 0.02 7.11 0.15
0.91-2-10 0.02-2.40
0.023-0.067 7.1 (0.24-28)
0.263 (0.131-0.429) 0.143 (0.065.0.491)
13.1 0.54 (<loq-4.6) 4.7 (<loq-32)
0.02-1.9 0.18 2.9
0.91-2.10 0.135 (<loq-0.653)
6.20 (0.8-26.53) 10.89 (0.78-40.17) 12.60 (1.17-40.78) 11.50 (2.30-48.29) 4.13 (<loq-26.5) 6.69 (<loq-40.2)
10.16 (<loq-55.9) 7.62 (<loq-48.2)
1.8 0.1-2.1
0.13 0.37
0.005 0.047
3.59 2.6-5.7 1.2-3.6 84 (34–168) 1.681 (0.968–2.986) 2.294 (0.984–6.328) 9.8-19.8 0.8-11 5.7 2.6 2.8-5.8 2.687 (<loq-4.113) 59.14 (12.13–167.23) 94.12 (16.10–231.83) 156.16 (31.43–319.10) 150.73 (53.48–373.11) 69.7 (3.73-353) 84.4 (<lod-294) 105 (<lod-319) 115 (<lod-603) 10 1.1-4.6 23.4 6.9 21.7 (14.6–31.3)
France France Italy Italy Italy Greece Sweden Sweden Spain Austria (5 WWTPs) France Spain Wales, UK Wales, UK Finland (5 WWTPs) Spain Spain 5 countries Germany England, UK Spain Spain Spain Spain Spain Spain Spain Spain Spain Spain Switzerland Germany Germany Germany (49 WWTPs) Finland Sweden Spain
Andreozzi et al. (2003) Andreozzi et al. (2003) Andreozzi et al. (2003) Andreozzi et al. (2003) Andreozzi et al. (2003) Andreozzi et al. (2003) Andreozzi et al. (2003) Bendz et al.( 2005) Carballa et al. (2004) Clara et al. (2005ab) Coetsier et al.( 2009) Gómez et al. (2007) Kasprzyk-Hordern et al.(2009) Kasprzyk-Hordern et al.(2009) Lindqvist et al. (2005) Muñoz et al. (2009) Muñoz et al. (2009) Paxéus (2004) Quintana et al. (2005) Roberts and Thomas (2006) Rodrı ́guez et al. (2003) Rosal et al. (2010a) Santos et al. (2007) Santos et al. (2007) Santos et al. (2007) Santos et al. (2007) Santos et al. (2009) Santos et al. (2009) Santos et al. (2009) Santos et al. (2009) Suárez et al. (2005) Tauxe-Wuersch et al. (2005) Ternes et al. (2003) Ternes (1998) Vieno et al. (2005) Zorita et al. (2009) Radjenović et al. (2009)
Indomethacin 14.63 (0-133.27)
<loq 0.037 (0.02-0.059)
0.1 0.27
<loq 42 (<loq-113) 0.875 (0.66–1.0)
Sweden Spain Germany Germany (10 WWTPs) Spain
Bendz et al. (2005) Rosal et al. (2010a) Ternes et al. (2003) Ternes (1998) Radjenović et al. (2009)
Ketoprofen 18.05 (0-310.27)
1.62 <loq 0.33
0.018 (0.007-0.037) 0.016 (<0.003-0.033)
2.0 0.12
0.392 (0.277-0.539) 0.34 (<loq-1.7)
0.21 (<loq-0.55) 0.36 (<loq-1.29) 0.41 (<loq-1.5) 0.86 (<loq-2.7)
0.80 (<loq-1.95) 0.82 (<loq-3.92) 0.88 (<loq-2.03)
0.1-0.37 0.2
0.23
0.94 0.123 (0.031–0.346) 0.028 (<4–0.119) 1.3-3 0.5 0.441 (<loq-0.801) 0.54 (<lod–2.25) 0.30 (<lod–2.51) 0.46 (<lod–2.40) 1.36 (<lod–3.59) 1.58 (<lod-5.52) 1.74 (<lod- 6.47) 1.91 (<lod-8.56) 2.07 (<lod-5.70) 0.15-0.41 2.9 1.08 (0.70–1.2)
France 4 countries (6 WWTPs) Sweden Wales, UK Wales, UK Finland (5 WWTPs) Germany Spain Spain Spain Spain Spain Spain Spain Spain Spain Switzerland Germany (49 WWTPs) Finland Spain
Andreozzi et al. (2003) Andreozzi et al. (2003) Bendz et al. (2005) Kasprzyk-Hordern et al.(2009) Kasprzyk-Hordern et al.(2009) Lindqvist et al. (2005) Quintana et al. (2005) Rosal et al. (2010a) Santos et al. (2007) Santos et al. (2007) Santos et al. (2007) Santos et al. (2007) Santos et al. (2009) Santos et al. (2009) Santos et al. (2009) Santos et al. (2009) Tauxe-Wuersch et al. (2005) Ternes (1998) Vieno et al. (2005) Radjenović et al. (2009)
Ketorolac 101.57 (0- 301.48)
0.228 (<loq-0.539) 0.407 (<loq-2.793) Spain Rosal et al. (2010a)
Mefenamic acid 4.43 (0-165.77)
0.061 (<0.005-0.222) 0.039 (<0.005-0.103
0.96
0.205 (<20–1.269) 0.008 (<0.017–0.032) 0.23
Wales, UK Wales, UK England, UK
Kasprzyk-Hordern et al.(2009) Kasprzyk-Hordern et al.(2009) Roberts and Thomas (2006)
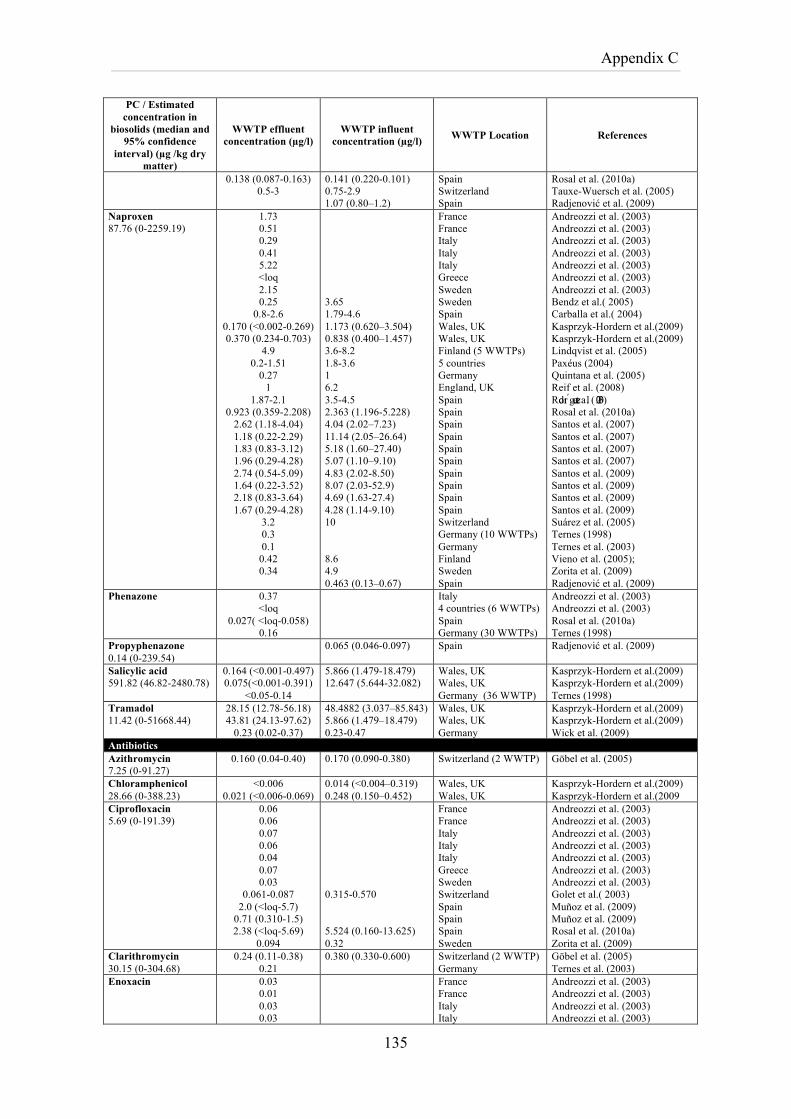
Appendix C
135
PC / Estimated concentration in
biosolids (median and 95% confidence
interval) (µg /kg dry matter)
WWTP effluent concentration (µg/l)
WWTP influent concentration (µg/l) WWTP Location References
0.138 (0.087-0.163) 0.5-3
0.141 (0.220-0.101) 0.75-2.9 1.07 (0.80–1.2)
Spain Switzerland Spain
Rosal et al. (2010a) Tauxe-Wuersch et al. (2005) Radjenović et al. (2009)
Naproxen 87.76 (0-2259.19)
1.73 0.51 0.29 0.41 5.22 <loq 2.15 0.25
0.8-2.6 0.170 (<0.002-0.269) 0.370 (0.234-0.703)
4.9 0.2-1.51
0.27 1
1.87-2.1 0.923 (0.359-2.208)
2.62 (1.18-4.04) 1.18 (0.22-2.29) 1.83 (0.83-3.12) 1.96 (0.29-4.28) 2.74 (0.54-5.09) 1.64 (0.22-3.52) 2.18 (0.83-3.64) 1.67 (0.29-4.28)
3.2 0.3 0.1
0.42 0.34
3.65 1.79-4.6 1.173 (0.620–3.504) 0.838 (0.400–1.457) 3.6-8.2 1.8-3.6 1 6.2 3.5-4.5 2.363 (1.196-5.228) 4.04 (2.02–7.23) 11.14 (2.05–26.64) 5.18 (1.60–27.40) 5.07 (1.10–9.10) 4.83 (2.02-8.50) 8.07 (2.03-52.9) 4.69 (1.63-27.4) 4.28 (1.14-9.10) 10 8.6 4.9 0.463 (0.13–0.67)
France France Italy Italy Italy Greece Sweden Sweden Spain Wales, UK Wales, UK Finland (5 WWTPs) 5 countries Germany England, UK Spain Spain Spain Spain Spain Spain Spain Spain Spain Spain Switzerland Germany (10 WWTPs) Germany Finland Sweden Spain
Andreozzi et al. (2003) Andreozzi et al. (2003) Andreozzi et al. (2003) Andreozzi et al. (2003) Andreozzi et al. (2003) Andreozzi et al. (2003) Andreozzi et al. (2003) Bendz et al.( 2005) Carballa et al.( 2004) Kasprzyk-Hordern et al.(2009) Kasprzyk-Hordern et al.(2009) Lindqvist et al. (2005) Paxéus (2004) Quintana et al. (2005) Reif et al. (2008) Rodrı ́guez et al. (2003) Rosal et al. (2010a) Santos et al. (2007) Santos et al. (2007) Santos et al. (2007) Santos et al. (2007) Santos et al. (2009) Santos et al. (2009) Santos et al. (2009) Santos et al. (2009) Suárez et al. (2005) Ternes (1998) Ternes et al. (2003) Vieno et al. (2005); Zorita et al. (2009) Radjenović et al. (2009)
Phenazone 0.37 <loq
0.027( <loq-0.058) 0.16
Italy 4 countries (6 WWTPs) Spain Germany (30 WWTPs)
Andreozzi et al. (2003) Andreozzi et al. (2003) Rosal et al. (2010a) Ternes (1998)
Propyphenazone 0.14 (0-239.54)
0.065 (0.046-0.097) Spain Radjenović et al. (2009)
Salicylic acid 591.82 (46.82-2480.78)
0.164 (<0.001-0.497) 0.075(<0.001-0.391)
<0.05-0.14
5.866 (1.479-18.479) 12.647 (5.644-32.082)
Wales, UK Wales, UK Germany (36 WWTP)
Kasprzyk-Hordern et al.(2009) Kasprzyk-Hordern et al.(2009) Ternes (1998)
Tramadol 11.42 (0-51668.44)
28.15 (12.78-56.18) 43.81 (24.13-97.62)
0.23 (0.02-0.37)
48.4882 (3.037–85.843) 5.866 (1.479–18.479) 0.23-0.47
Wales, UK Wales, UK Germany
Kasprzyk-Hordern et al.(2009) Kasprzyk-Hordern et al.(2009) Wick et al. (2009)
Antibiotics Azithromycin 7.25 (0-91.27)
0.160 (0.04-0.40) 0.170 (0.090-0.380) Switzerland (2 WWTP) Göbel et al. (2005)
Chloramphenicol 28.66 (0-388.23)
<0.006 0.021 (<0.006-0.069)
0.014 (<0.004–0.319) 0.248 (0.150–0.452)
Wales, UK Wales, UK
Kasprzyk-Hordern et al.(2009) Kasprzyk-Hordern et al.(2009
Ciprofloxacin 5.69 (0-191.39)
0.06 0.06 0.07 0.06 0.04 0.07 0.03
0.061-0.087 2.0 (<loq-5.7)
0.71 (0.310-1.5) 2.38 (<loq-5.69)
0.094
0.315-0.570 5.524 (0.160-13.625) 0.32
France France Italy Italy Italy Greece Sweden Switzerland Spain Spain Spain Sweden
Andreozzi et al. (2003) Andreozzi et al. (2003) Andreozzi et al. (2003) Andreozzi et al. (2003) Andreozzi et al. (2003) Andreozzi et al. (2003) Andreozzi et al. (2003) Golet et al.( 2003) Muñoz et al. (2009) Muñoz et al. (2009) Rosal et al. (2010a) Zorita et al. (2009)
Clarithromycin 30.15 (0-304.68)
0.24 (0.11-0.38) 0.21
0.380 (0.330-0.600) Switzerland (2 WWTP) Germany
Göbel et al. (2005) Ternes et al. (2003)
Enoxacin
0.03 0.01 0.03 0.03
France France Italy Italy
Andreozzi et al. (2003) Andreozzi et al. (2003) Andreozzi et al. (2003) Andreozzi et al. (2003)
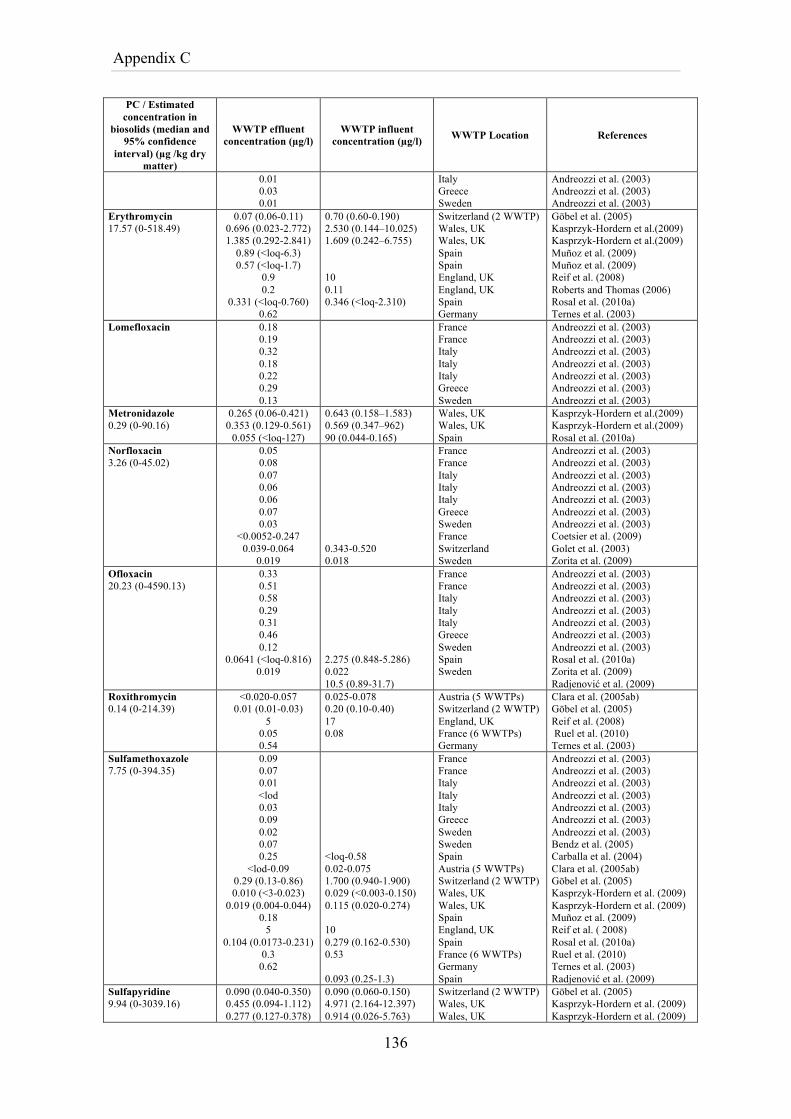
Appendix C
136
PC / Estimated concentration in
biosolids (median and 95% confidence
interval) (µg /kg dry matter)
WWTP effluent concentration (µg/l)
WWTP influent concentration (µg/l) WWTP Location References
0.01 0.03 0.01
Italy Greece Sweden
Andreozzi et al. (2003) Andreozzi et al. (2003) Andreozzi et al. (2003)
Erythromycin 17.57 (0-518.49)
0.07 (0.06-0.11) 0.696 (0.023-2.772) 1.385 (0.292-2.841)
0.89 (<loq-6.3) 0.57 (<loq-1.7)
0.9 0.2
0.331 (<loq-0.760) 0.62
0.70 (0.60-0.190) 2.530 (0.144–10.025) 1.609 (0.242–6.755) 10 0.11 0.346 (<loq-2.310)
Switzerland (2 WWTP) Wales, UK Wales, UK Spain Spain England, UK England, UK Spain Germany
Göbel et al. (2005) Kasprzyk-Hordern et al.(2009) Kasprzyk-Hordern et al.(2009) Muñoz et al. (2009) Muñoz et al. (2009) Reif et al. (2008) Roberts and Thomas (2006) Rosal et al. (2010a) Ternes et al. (2003)
Lomefloxacin 0.18 0.19 0.32 0.18 0.22 0.29 0.13
France France Italy Italy Italy Greece Sweden
Andreozzi et al. (2003) Andreozzi et al. (2003) Andreozzi et al. (2003) Andreozzi et al. (2003) Andreozzi et al. (2003) Andreozzi et al. (2003) Andreozzi et al. (2003)
Metronidazole 0.29 (0-90.16)
0.265 (0.06-0.421) 0.353 (0.129-0.561)
0.055 (<loq-127)
0.643 (0.158–1.583) 0.569 (0.347–962) 90 (0.044-0.165)
Wales, UK Wales, UK Spain
Kasprzyk-Hordern et al.(2009) Kasprzyk-Hordern et al.(2009) Rosal et al. (2010a)
Norfloxacin 3.26 (0-45.02)
0.05 0.08 0.07 0.06 0.06 0.07 0.03
<0.0052-0.247 0.039-0.064
0.019
0.343-0.520 0.018
France France Italy Italy Italy Greece Sweden France Switzerland Sweden
Andreozzi et al. (2003) Andreozzi et al. (2003) Andreozzi et al. (2003) Andreozzi et al. (2003) Andreozzi et al. (2003) Andreozzi et al. (2003) Andreozzi et al. (2003) Coetsier et al. (2009) Golet et al. (2003) Zorita et al. (2009)
Ofloxacin 20.23 (0-4590.13)
0.33 0.51 0.58 0.29 0.31 0.46 0.12
0.0641 (<loq-0.816) 0.019
2.275 (0.848-5.286) 0.022 10.5 (0.89-31.7)
France France Italy Italy Italy Greece Sweden Spain Sweden
Andreozzi et al. (2003) Andreozzi et al. (2003) Andreozzi et al. (2003) Andreozzi et al. (2003) Andreozzi et al. (2003) Andreozzi et al. (2003) Andreozzi et al. (2003) Rosal et al. (2010a) Zorita et al. (2009) Radjenović et al. (2009)
Roxithromycin 0.14 (0-214.39)
<0.020-0.057 0.01 (0.01-0.03)
5 0.05 0.54
0.025-0.078 0.20 (0.10-0.40) 17 0.08
Austria (5 WWTPs) Switzerland (2 WWTP) England, UK France (6 WWTPs) Germany
Clara et al. (2005ab) Göbel et al. (2005) Reif et al. (2008) Ruel et al. (2010) Ternes et al. (2003)
Sulfamethoxazole 7.75 (0-394.35)
0.09 0.07 0.01 <lod 0.03 0.09 0.02 0.07 0.25
<lod-0.09 0.29 (0.13-0.86) 0.010 (<3-0.023)
0.019 (0.004-0.044) 0.18
5 0.104 (0.0173-0.231)
0.3 0.62
<loq-0.58 0.02-0.075 1.700 (0.940-1.900) 0.029 (<0.003-0.150) 0.115 (0.020-0.274) 10 0.279 (0.162-0.530) 0.53 0.093 (0.25-1.3)
France France Italy Italy Italy Greece Sweden Sweden Spain Austria (5 WWTPs) Switzerland (2 WWTP) Wales, UK Wales, UK Spain England, UK Spain France (6 WWTPs) Germany Spain
Andreozzi et al. (2003) Andreozzi et al. (2003) Andreozzi et al. (2003) Andreozzi et al. (2003) Andreozzi et al. (2003) Andreozzi et al. (2003) Andreozzi et al. (2003) Bendz et al. (2005) Carballa et al. (2004) Clara et al. (2005ab) Göbel et al. (2005) Kasprzyk-Hordern et al. (2009) Kasprzyk-Hordern et al. (2009) Muñoz et al. (2009) Reif et al. ( 2008) Rosal et al. (2010a) Ruel et al. (2010) Ternes et al. (2003) Radjenović et al. (2009)
Sulfapyridine 9.94 (0-3039.16)
0.090 (0.040-0.350) 0.455 (0.094-1.112) 0.277 (0.127-0.378)
0.090 (0.060-0.150) 4.971 (2.164-12.397) 0.914 (0.026-5.763)
Switzerland (2 WWTP) Wales, UK Wales, UK
Göbel et al. (2005) Kasprzyk-Hordern et al. (2009) Kasprzyk-Hordern et al. (2009)
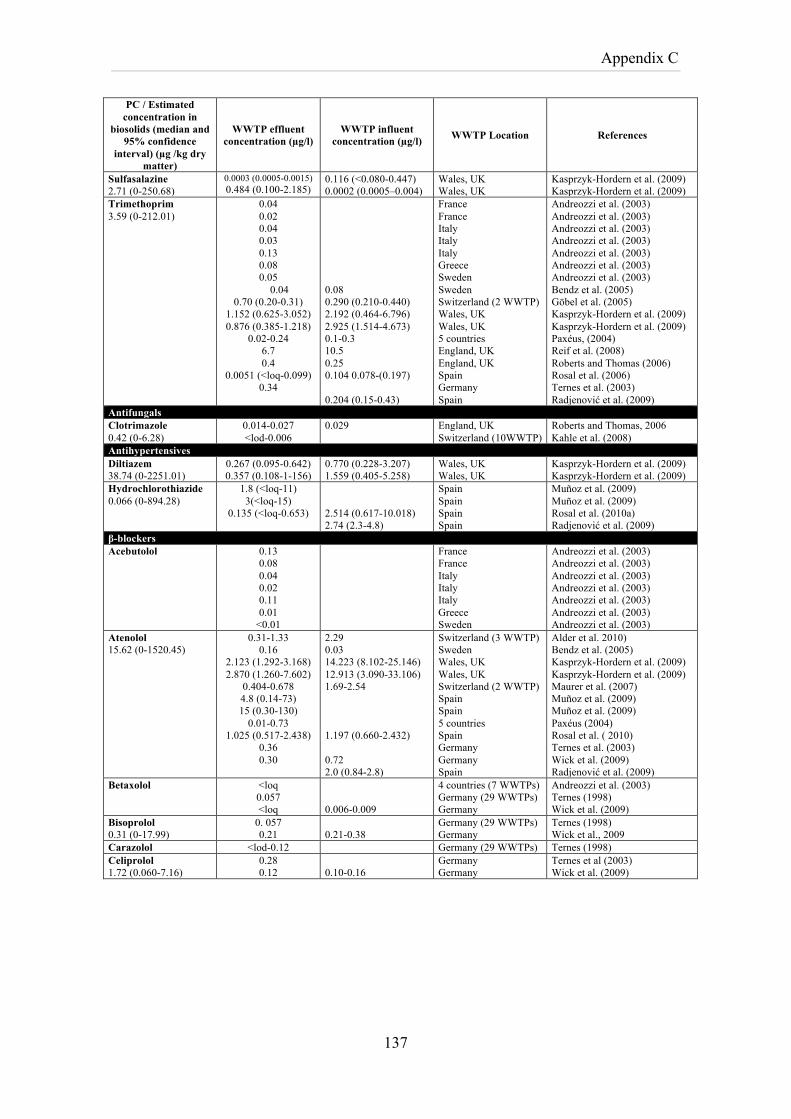
Appendix C
137
PC / Estimated concentration in
biosolids (median and 95% confidence
interval) (µg /kg dry matter)
WWTP effluent concentration (µg/l)
WWTP influent concentration (µg/l) WWTP Location References
Sulfasalazine 2.71 (0-250.68)
0.0003 (0.0005-0.0015) 0.484 (0.100-2.185)
0.116 (<0.080-0.447) 0.0002 (0.0005–0.004)
Wales, UK Wales, UK
Kasprzyk-Hordern et al. (2009) Kasprzyk-Hordern et al. (2009)
Trimethoprim 3.59 (0-212.01)
0.04 0.02 0.04 0.03 0.13 0.08 0.05
0.04 0.70 (0.20-0.31)
1.152 (0.625-3.052) 0.876 (0.385-1.218)
0.02-0.24 6.7 0.4
0.0051 (<loq-0.099) 0.34
0.08 0.290 (0.210-0.440) 2.192 (0.464-6.796) 2.925 (1.514-4.673) 0.1-0.3 10.5 0.25 0.104 0.078-(0.197) 0.204 (0.15-0.43)
France France Italy Italy Italy Greece Sweden Sweden Switzerland (2 WWTP) Wales, UK Wales, UK 5 countries England, UK England, UK Spain Germany Spain
Andreozzi et al. (2003) Andreozzi et al. (2003) Andreozzi et al. (2003) Andreozzi et al. (2003) Andreozzi et al. (2003) Andreozzi et al. (2003) Andreozzi et al. (2003) Bendz et al. (2005) Göbel et al. (2005) Kasprzyk-Hordern et al. (2009) Kasprzyk-Hordern et al. (2009) Paxéus, (2004) Reif et al. (2008) Roberts and Thomas (2006) Rosal et al. (2006) Ternes et al. (2003) Radjenović et al. (2009)
Antifungals Clotrimazole 0.42 (0-6.28)
0.014-0.027 <lod-0.006
0.029 England, UK Switzerland (10WWTP)
Roberts and Thomas, 2006 Kahle et al. (2008)
Antihypertensives Diltiazem 38.74 (0-2251.01)
0.267 (0.095-0.642) 0.357 (0.108-1-156)
0.770 (0.228-3.207) 1.559 (0.405-5.258)
Wales, UK Wales, UK
Kasprzyk-Hordern et al. (2009) Kasprzyk-Hordern et al. (2009)
Hydrochlorothiazide 0.066 (0-894.28)
1.8 (<loq-11) 3(<loq-15)
0.135 (<loq-0.653)
2.514 (0.617-10.018) 2.74 (2.3-4.8)
Spain Spain Spain Spain
Muñoz et al. (2009) Muñoz et al. (2009) Rosal et al. (2010a) Radjenović et al. (2009)
β-blockers Acebutolol 0.13
0.08 0.04 0.02 0.11 0.01
<0.01
France France Italy Italy Italy Greece Sweden
Andreozzi et al. (2003) Andreozzi et al. (2003) Andreozzi et al. (2003) Andreozzi et al. (2003) Andreozzi et al. (2003) Andreozzi et al. (2003) Andreozzi et al. (2003)
Atenolol 15.62 (0-1520.45)
0.31-1.33 0.16
2.123 (1.292-3.168) 2.870 (1.260-7.602)
0.404-0.678 4.8 (0.14-73) 15 (0.30-130)
0.01-0.73 1.025 (0.517-2.438)
0.36 0.30
2.29 0.03 14.223 (8.102-25.146) 12.913 (3.090-33.106) 1.69-2.54 1.197 (0.660-2.432) 0.72 2.0 (0.84-2.8)
Switzerland (3 WWTP) Sweden Wales, UK Wales, UK Switzerland (2 WWTP) Spain Spain 5 countries Spain Germany Germany Spain
Alder et al. 2010) Bendz et al. (2005) Kasprzyk-Hordern et al. (2009) Kasprzyk-Hordern et al. (2009) Maurer et al. (2007) Muñoz et al. (2009) Muñoz et al. (2009) Paxéus (2004) Rosal et al. ( 2010) Ternes et al. (2003) Wick et al. (2009) Radjenović et al. (2009)
Betaxolol
<loq 0.057 <loq
0.006-0.009
4 countries (7 WWTPs) Germany (29 WWTPs) Germany
Andreozzi et al. (2003) Ternes (1998) Wick et al. (2009)
Bisoprolol 0.31 (0-17.99)
0. 057 0.21
0.21-0.38
Germany (29 WWTPs) Germany
Ternes (1998) Wick et al., 2009
Carazolol <lod-0.12 Germany (29 WWTPs) Ternes (1998) Celiprolol 1.72 (0.060-7.16)
0.28 0.12
0.10-0.16
Germany Germany
Ternes et al (2003) Wick et al. (2009)
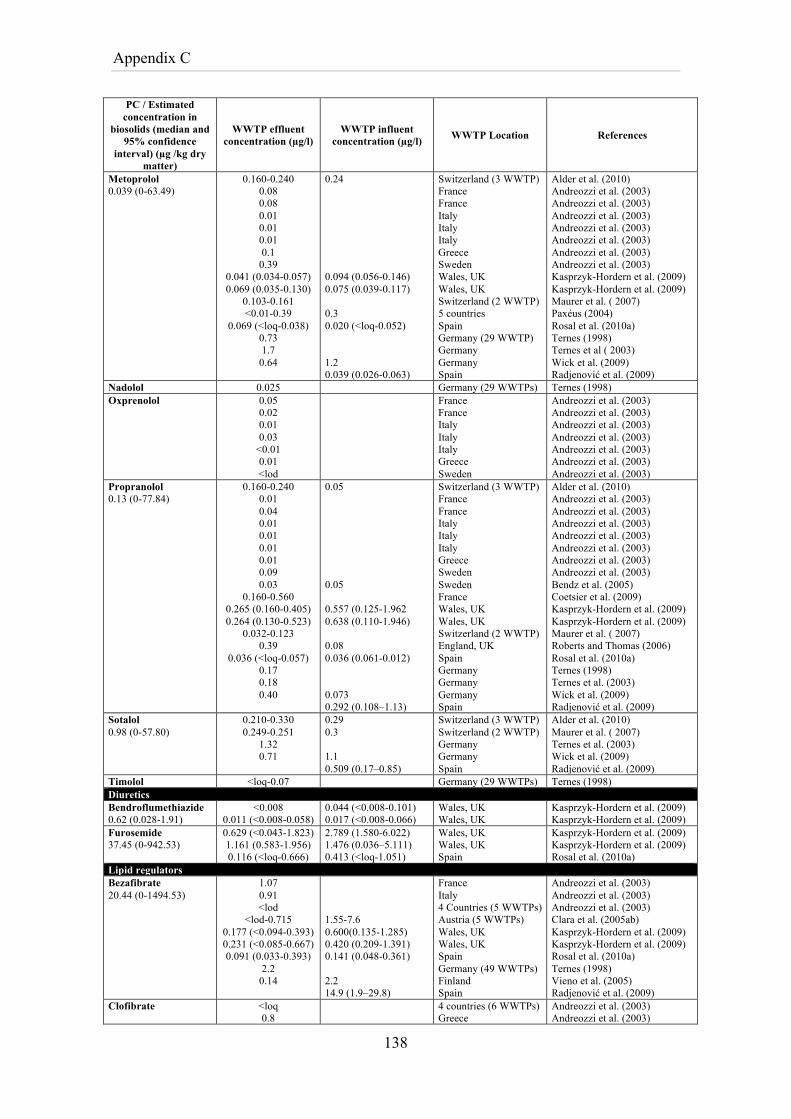
Appendix C
138
PC / Estimated concentration in
biosolids (median and 95% confidence
interval) (µg /kg dry matter)
WWTP effluent concentration (µg/l)
WWTP influent concentration (µg/l) WWTP Location References
Metoprolol 0.039 (0-63.49)
0.160-0.240 0.08 0.08 0.01 0.01 0.01 0.1
0.39 0.041 (0.034-0.057) 0.069 (0.035-0.130)
0.103-0.161 <0.01-0.39
0.069 (<loq-0.038) 0.73 1.7
0.64
0.24 0.094 (0.056-0.146) 0.075 (0.039-0.117) 0.3 0.020 (<loq-0.052) 1.2 0.039 (0.026-0.063)
Switzerland (3 WWTP) France France Italy Italy Italy Greece Sweden Wales, UK Wales, UK Switzerland (2 WWTP) 5 countries Spain Germany (29 WWTP) Germany Germany Spain
Alder et al. (2010) Andreozzi et al. (2003) Andreozzi et al. (2003) Andreozzi et al. (2003) Andreozzi et al. (2003) Andreozzi et al. (2003) Andreozzi et al. (2003) Andreozzi et al. (2003) Kasprzyk-Hordern et al. (2009) Kasprzyk-Hordern et al. (2009) Maurer et al. ( 2007) Paxéus (2004) Rosal et al. (2010a) Ternes (1998) Ternes et al ( 2003) Wick et al. (2009) Radjenović et al. (2009)
Nadolol 0.025 Germany (29 WWTPs) Ternes (1998) Oxprenolol 0.05
0.02 0.01 0.03
<0.01 0.01 <lod
France France Italy Italy Italy Greece Sweden
Andreozzi et al. (2003) Andreozzi et al. (2003) Andreozzi et al. (2003) Andreozzi et al. (2003) Andreozzi et al. (2003) Andreozzi et al. (2003) Andreozzi et al. (2003)
Propranolol 0.13 (0-77.84)
0.160-0.240 0.01 0.04 0.01 0.01 0.01 0.01 0.09 0.03
0.160-0.560 0.265 (0.160-0.405) 0.264 (0.130-0.523)
0.032-0.123 0.39
0.036 (<loq-0.057) 0.17 0.18 0.40
0.05 0.05 0.557 (0.125-1.962 0.638 (0.110-1.946) 0.08 0.036 (0.061-0.012) 0.073 0.292 (0.108–1.13)
Switzerland (3 WWTP) France France Italy Italy Italy Greece Sweden Sweden France Wales, UK Wales, UK Switzerland (2 WWTP) England, UK Spain Germany Germany Germany Spain
Alder et al. (2010) Andreozzi et al. (2003) Andreozzi et al. (2003) Andreozzi et al. (2003) Andreozzi et al. (2003) Andreozzi et al. (2003) Andreozzi et al. (2003) Andreozzi et al. (2003) Bendz et al. (2005) Coetsier et al. (2009) Kasprzyk-Hordern et al. (2009) Kasprzyk-Hordern et al. (2009) Maurer et al. ( 2007) Roberts and Thomas (2006) Rosal et al. (2010a) Ternes (1998) Ternes et al. (2003) Wick et al. (2009) Radjenović et al. (2009)
Sotalol 0.98 (0-57.80)
0.210-0.330 0.249-0.251
1.32 0.71
0.29 0.3 1.1 0.509 (0.17–0.85)
Switzerland (3 WWTP) Switzerland (2 WWTP) Germany Germany Spain
Alder et al. (2010) Maurer et al. ( 2007) Ternes et al. (2003) Wick et al. (2009) Radjenović et al. (2009)
Timolol <loq-0.07 Germany (29 WWTPs) Ternes (1998) Diuretics Bendroflumethiazide 0.62 (0.028-1.91)
<0.008 0.011 (<0.008-0.058)
0.044 (<0.008-0.101) 0.017 (<0.008-0.066)
Wales, UK Wales, UK
Kasprzyk-Hordern et al. (2009) Kasprzyk-Hordern et al. (2009)
Furosemide 37.45 (0-942.53)
0.629 (<0.043-1.823) 1.161 (0.583-1.956) 0.116 (<loq-0.666)
2.789 (1.580-6.022) 1.476 (0.036–5.111) 0.413 (<loq-1.051)
Wales, UK Wales, UK Spain
Kasprzyk-Hordern et al. (2009) Kasprzyk-Hordern et al. (2009) Rosal et al. (2010a)
Lipid regulators Bezafibrate 20.44 (0-1494.53)
1.07 0.91 <lod
<lod-0.715 0.177 (<0.094-0.393) 0.231 (<0.085-0.667) 0.091 (0.033-0.393)
2.2 0.14
1.55-7.6 0.600(0.135-1.285) 0.420 (0.209-1.391) 0.141 (0.048-0.361) 2.2 14.9 (1.9–29.8)
France Italy 4 Countries (5 WWTPs) Austria (5 WWTPs) Wales, UK Wales, UK Spain Germany (49 WWTPs) Finland Spain
Andreozzi et al. (2003) Andreozzi et al. (2003) Andreozzi et al. (2003) Clara et al. (2005ab) Kasprzyk-Hordern et al. (2009) Kasprzyk-Hordern et al. (2009) Rosal et al. (2010a) Ternes (1998) Vieno et al. (2005) Radjenović et al. (2009)
Clofibrate
<loq 0.8
4 countries (6 WWTPs) Greece
Andreozzi et al. (2003) Andreozzi et al. (2003)
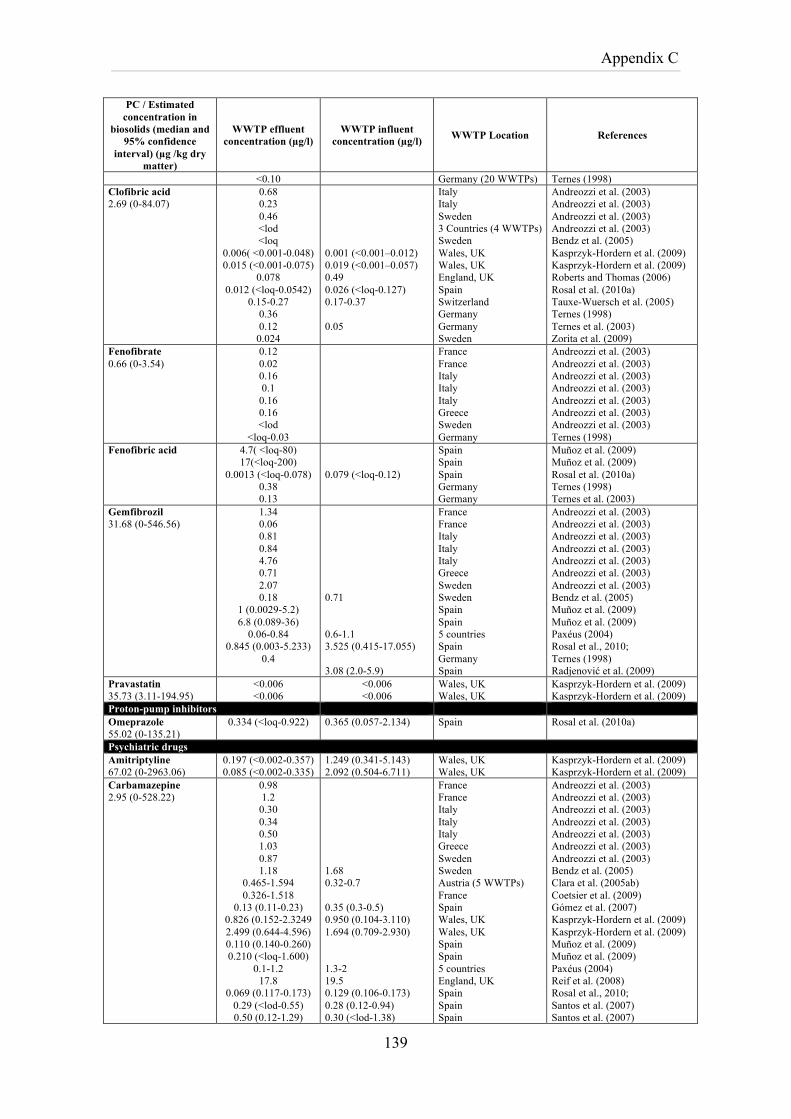
Appendix C
139
PC / Estimated concentration in
biosolids (median and 95% confidence
interval) (µg /kg dry matter)
WWTP effluent concentration (µg/l)
WWTP influent concentration (µg/l) WWTP Location References
<0.10 Germany (20 WWTPs) Ternes (1998) Clofibric acid 2.69 (0-84.07)
0.68 0.23 0.46 <lod <loq
0.006( <0.001-0.048) 0.015 (<0.001-0.075)
0.078 0.012 (<loq-0.0542)
0.15-0.27 0.36 0.12
0.024
0.001 (<0.001–0.012) 0.019 (<0.001–0.057) 0.49 0.026 (<loq-0.127) 0.17-0.37 0.05
Italy Italy Sweden 3 Countries (4 WWTPs) Sweden Wales, UK Wales, UK England, UK Spain Switzerland Germany Germany Sweden
Andreozzi et al. (2003) Andreozzi et al. (2003) Andreozzi et al. (2003) Andreozzi et al. (2003) Bendz et al. (2005) Kasprzyk-Hordern et al. (2009) Kasprzyk-Hordern et al. (2009) Roberts and Thomas (2006) Rosal et al. (2010a) Tauxe-Wuersch et al. (2005) Ternes (1998) Ternes et al. (2003) Zorita et al. (2009)
Fenofibrate 0.66 (0-3.54)
0.12 0.02 0.16 0.1
0.16 0.16 <lod
<loq-0.03
France France Italy Italy Italy Greece Sweden Germany
Andreozzi et al. (2003) Andreozzi et al. (2003) Andreozzi et al. (2003) Andreozzi et al. (2003) Andreozzi et al. (2003) Andreozzi et al. (2003) Andreozzi et al. (2003) Ternes (1998)
Fenofibric acid 4.7( <loq-80) 17(<loq-200)
0.0013 (<loq-0.078) 0.38 0.13
0.079 (<loq-0.12)
Spain Spain Spain Germany Germany
Muñoz et al. (2009) Muñoz et al. (2009) Rosal et al. (2010a) Ternes (1998) Ternes et al. (2003)
Gemfibrozil 31.68 (0-546.56)
1.34 0.06 0.81 0.84 4.76 0.71 2.07 0.18
1 (0.0029-5.2) 6.8 (0.089-36)
0.06-0.84 0.845 (0.003-5.233)
0.4
0.71 0.6-1.1 3.525 (0.415-17.055) 3.08 (2.0-5.9)
France France Italy Italy Italy Greece Sweden Sweden Spain Spain 5 countries Spain Germany Spain
Andreozzi et al. (2003) Andreozzi et al. (2003) Andreozzi et al. (2003) Andreozzi et al. (2003) Andreozzi et al. (2003) Andreozzi et al. (2003) Andreozzi et al. (2003) Bendz et al. (2005) Muñoz et al. (2009) Muñoz et al. (2009) Paxéus (2004) Rosal et al., 2010; Ternes (1998) Radjenović et al. (2009)
Pravastatin 35.73 (3.11-194.95)
<0.006 <0.006
<0.006 <0.006
Wales, UK Wales, UK
Kasprzyk-Hordern et al. (2009) Kasprzyk-Hordern et al. (2009)
Proton-pump inhibitors Omeprazole 55.02 (0-135.21)
0.334 (<loq-0.922) 0.365 (0.057-2.134) Spain Rosal et al. (2010a)
Psychiatric drugs Amitriptyline 67.02 (0-2963.06)
0.197 (<0.002-0.357) 0.085 (<0.002-0.335)
1.249 (0.341-5.143) 2.092 (0.504-6.711)
Wales, UK Wales, UK
Kasprzyk-Hordern et al. (2009) Kasprzyk-Hordern et al. (2009)
Carbamazepine 2.95 (0-528.22)
0.98 1.2
0.30 0.34 0.50 1.03 0.87 1.18
0.465-1.594 0.326-1.518
0.13 (0.11-0.23) 0.826 (0.152-2.3249 2.499 (0.644-4.596) 0.110 (0.140-0.260) 0.210 (<loq-1.600)
0.1-1.2 17.8
0.069 (0.117-0.173) 0.29 (<lod-0.55) 0.50 (0.12-1.29)
1.68 0.32-0.7 0.35 (0.3-0.5) 0.950 (0.104-3.110) 1.694 (0.709-2.930) 1.3-2 19.5 0.129 (0.106-0.173) 0.28 (0.12-0.94) 0.30 (<lod-1.38)
France France Italy Italy Italy Greece Sweden Sweden Austria (5 WWTPs) France Spain Wales, UK Wales, UK Spain Spain 5 countries England, UK Spain Spain Spain
Andreozzi et al. (2003) Andreozzi et al. (2003) Andreozzi et al. (2003) Andreozzi et al. (2003) Andreozzi et al. (2003) Andreozzi et al. (2003) Andreozzi et al. (2003) Bendz et al. (2005) Clara et al. (2005ab) Coetsier et al. (2009) Gómez et al. (2007) Kasprzyk-Hordern et al. (2009) Kasprzyk-Hordern et al. (2009) Muñoz et al. (2009) Muñoz et al. (2009) Paxéus (2004) Reif et al. (2008) Rosal et al., 2010; Santos et al. (2007) Santos et al. (2007)
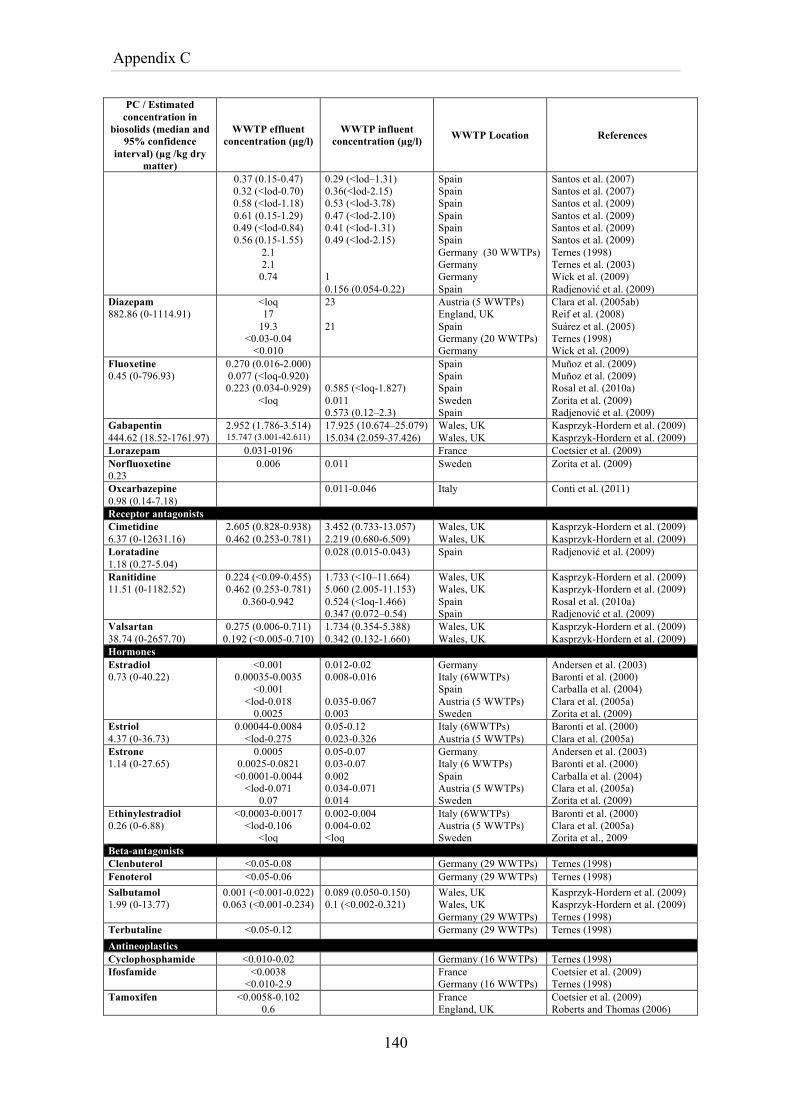
Appendix C
140
PC / Estimated concentration in
biosolids (median and 95% confidence
interval) (µg /kg dry matter)
WWTP effluent concentration (µg/l)
WWTP influent concentration (µg/l) WWTP Location References
0.37 (0.15-0.47) 0.32 (<lod-0.70) 0.58 (<lod-1.18) 0.61 (0.15-1.29) 0.49 (<lod-0.84) 0.56 (0.15-1.55)
2.1 2.1
0.74
0.29 (<lod–1.31) 0.36(<lod-2.15) 0.53 (<lod-3.78) 0.47 (<lod-2.10) 0.41 (<lod-1.31) 0.49 (<lod-2.15) 1 0.156 (0.054-0.22)
Spain Spain Spain Spain Spain Spain Germany (30 WWTPs) Germany Germany Spain
Santos et al. (2007) Santos et al. (2007) Santos et al. (2009) Santos et al. (2009) Santos et al. (2009) Santos et al. (2009) Ternes (1998) Ternes et al. (2003) Wick et al. (2009) Radjenović et al. (2009)
Diazepam 882.86 (0-1114.91)
<loq 17
19.3 <0.03-0.04
<0.010
23 21
Austria (5 WWTPs) England, UK Spain Germany (20 WWTPs) Germany
Clara et al. (2005ab) Reif et al. (2008) Suárez et al. (2005) Ternes (1998) Wick et al. (2009)
Fluoxetine 0.45 (0-796.93)
0.270 (0.016-2.000) 0.077 (<loq-0.920) 0.223 (0.034-0.929)
<loq
0.585 (<loq-1.827) 0.011 0.573 (0.12–2.3)
Spain Spain Spain Sweden Spain
Muñoz et al. (2009) Muñoz et al. (2009) Rosal et al. (2010a) Zorita et al. (2009) Radjenović et al. (2009)
Gabapentin 444.62 (18.52-1761.97)
2.952 (1.786-3.514) 15.747 (3.001-42.611)
17.925 (10.674–25.079) 15.034 (2.059-37.426)
Wales, UK Wales, UK
Kasprzyk-Hordern et al. (2009) Kasprzyk-Hordern et al. (2009)
Lorazepam 0.031-0196 France Coetsier et al. (2009) Norfluoxetine 0.23
0.006 0.011 Sweden Zorita et al. (2009)
Oxcarbazepine 0.98 (0.14-7.18)
0.011-0.046 Italy Conti et al. (2011)
Receptor antagonists Cimetidine 6.37 (0-12631.16)
2.605 (0.828-0.938) 0.462 (0.253-0.781)
3.452 (0.733-13.057) 2.219 (0.680-6.509)
Wales, UK Wales, UK
Kasprzyk-Hordern et al. (2009) Kasprzyk-Hordern et al. (2009)
Loratadine 1.18 (0.27- 5.04)
0.028 (0.015-0.043) Spain Radjenović et al. (2009)
Ranitidine 11.51 (0-1182.52)
0.224 (<0.09-0.455) 0.462 (0.253-0.781)
0.360-0.942
1.733 (<10–11.664) 5.060 (2.005-11.153) 0.524 (<loq-1.466) 0.347 (0.072–0.54)
Wales, UK Wales, UK Spain Spain
Kasprzyk-Hordern et al. (2009) Kasprzyk-Hordern et al. (2009) Rosal et al. (2010a) Radjenović et al. (2009)
Valsartan 38.74 (0-2657.70)
0.275 (0.006-0.711) 0.192 (<0.005-0.710)
1.734 (0.354-5.388) 0.342 (0.132-1.660)
Wales, UK Wales, UK
Kasprzyk-Hordern et al. (2009) Kasprzyk-Hordern et al. (2009)
Hormones Estradiol 0.73 (0-40.22)
<0.001 0.00035-0.0035
<0.001 <lod-0.018
0.0025
0.012-0.02 0.008-0.016 0.035-0.067 0.003
Germany Italy (6WWTPs) Spain Austria (5 WWTPs) Sweden
Andersen et al. (2003) Baronti et al. (2000) Carballa et al. (2004) Clara et al. (2005a) Zorita et al. (2009)
Estriol 4.37 (0-36.73)
0.00044-0.0084 <lod-0.275
0.05-0.12 0.023-0.326
Italy (6WWTPs) Austria (5 WWTPs)
Baronti et al. (2000) Clara et al. (2005a)
Estrone 1.14 (0-27.65)
0.0005 0.0025-0.0821
<0.0001-0.0044 <lod-0.071
0.07
0.05-0.07 0.03-0.07 0.002 0.034-0.071 0.014
Germany Italy (6 WWTPs) Spain Austria (5 WWTPs) Sweden
Andersen et al. (2003) Baronti et al. (2000) Carballa et al. (2004) Clara et al. (2005a) Zorita et al. (2009)
Ethinylestradiol 0.26 (0-6.88)
<0.0003-0.0017 <lod-0.106
<loq
0.002-0.004 0.004-0.02 <loq
Italy (6WWTPs) Austria (5 WWTPs) Sweden
Baronti et al. (2000) Clara et al. (2005a) Zorita et al., 2009
Beta-antagonists Clenbuterol <0.05-0.08 Germany (29 WWTPs) Ternes (1998) Fenoterol <0.05-0.06 Germany (29 WWTPs) Ternes (1998) Salbutamol 1.99 (0-13.77)
0.001 (<0.001-0.022) 0.063 (<0.001-0.234)
0.089 (0.050-0.150) 0.1 (<0.002-0.321)
Wales, UK Wales, UK Germany (29 WWTPs)
Kasprzyk-Hordern et al. (2009) Kasprzyk-Hordern et al. (2009) Ternes (1998)
Terbutaline <0.05-0.12 Germany (29 WWTPs) Ternes (1998) Antineoplastics Cyclophosphamide <0.010-0.02 Germany (16 WWTPs) Ternes (1998) Ifosfamide <0.0038
<0.010-2.9 France
Germany (16 WWTPs) Coetsier et al. (2009) Ternes (1998)
Tamoxifen <0.0058-0.102 0.6
France England, UK
Coetsier et al. (2009) Roberts and Thomas (2006)
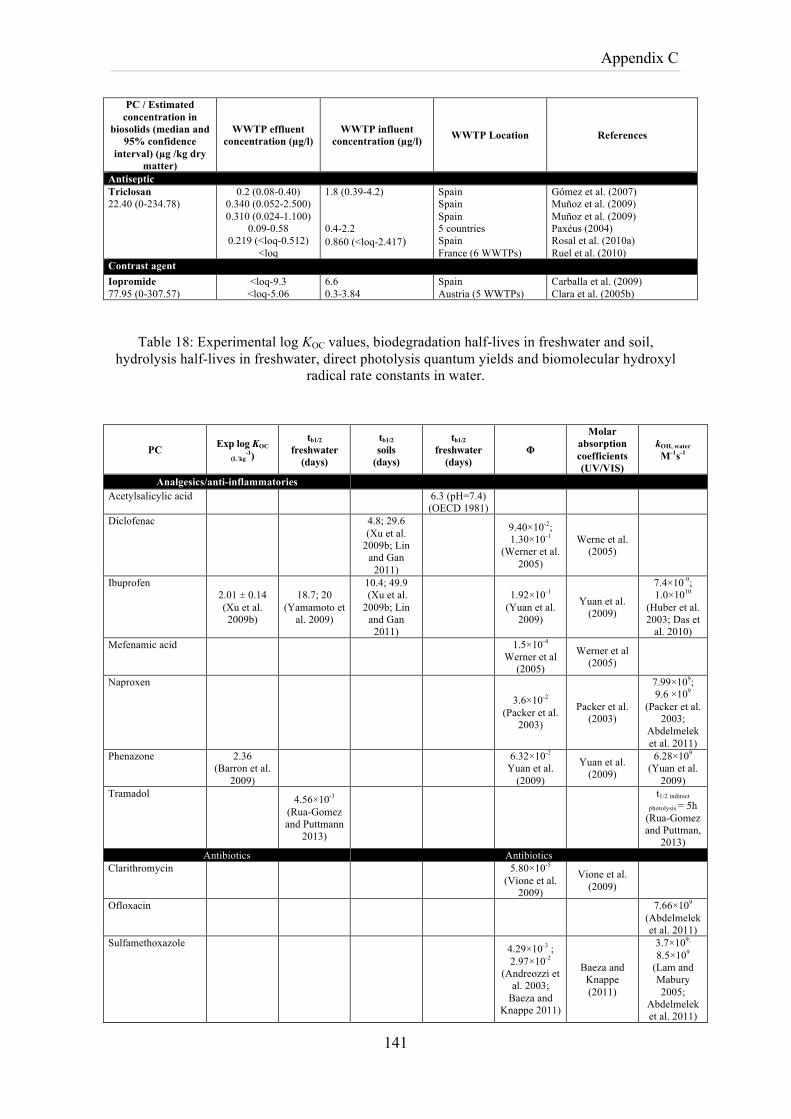
Appendix C
141
PC / Estimated concentration in
biosolids (median and 95% confidence
interval) (µg /kg dry matter)
WWTP effluent concentration (µg/l)
WWTP influent concentration (µg/l) WWTP Location References
Antiseptic Triclosan 22.40 (0-234.78)
0.2 (0.08-0.40) 0.340 (0.052-2.500) 0.310 (0.024-1.100)
0.09-0.58 0.219 (<loq-0.512)
<loq
1.8 (0.39-4.2) 0.4-2.2 0.860 (<loq-2.417)
Spain Spain Spain 5 countries Spain France (6 WWTPs)
Gómez et al. (2007) Muñoz et al. (2009) Muñoz et al. (2009) Paxéus (2004) Rosal et al. (2010a) Ruel et al. (2010)
Contrast agent Iopromide 77.95 (0-307.57)
<loq-9.3 <loq-5.06
6.6 0.3-3.84
Spain Austria (5 WWTPs)
Carballa et al. (2009) Clara et al. (2005b)
Table 18: Experimental log KOC values, biodegradation half-lives in freshwater and soil, hydrolysis half-lives in freshwater, direct photolysis quantum yields and biomolecular hydroxyl
radical rate constants in water.
PC Exp log KOC
(L˙kg-1)
tb1/2
freshwater (days)
tb1/2
soils (days)
th1/2
freshwater (days)
Φ
Molar absorption coefficients (UV/VIS)
kOH, water M-1s-1
Analgesics/anti-inflammatories Acetylsalicylic acid 6.3 (pH=7.4)
(OECD 1981)
Diclofenac
4.8; 29.6 (Xu et al.
2009b; Lin and Gan
2011)
9.40×10⁻²;
1.30×10⁻¹
(Werner et al. 2005)
Werne et al. (2005)
Ibuprofen 2.01 ± 0.14 (Xu et al. 2009b)
18.7; 20 (Yamamoto et
al. 2009)
10.4; 49.9 (Xu et al. 2009b; Lin
and Gan 2011)
1.92×10⁻¹
(Yuan et al. 2009)
Yuan et al. (2009)
7.4×10⁻⁹; 1.0×10¹⁰
(Huber et al. 2003; Das et
al. 2010) Mefenamic acid
1.5×10⁻⁴
Werner et al (2005)
Werner et al (2005)
Naproxen
3.6×10⁻²
(Packer et al. 2003)
Packer et al. (2003)
7.99×10⁹; 9.6 ×10⁹
(Packer et al. 2003;
Abdelmelek et al. 2011)
Phenazone 2.36 (Barron et al.
2009)
6.32×10⁻²
Yuan et al. (2009)
Yuan et al. (2009)
6.28×10⁹
(Yuan et al. 2009)
Tramadol
4.56×10⁻³
(Rua-Gomez and Puttmann
2013)
t1/2 indirect
photolysis = 5h (Rua-Gomez and Puttman,
2013) Antibiotics Antibiotics
Clarithromycin
5.80×10⁻⁵
(Vione et al. 2009)
Vione et al. (2009)
Ofloxacin
7.66×10⁹ (Abdelmelek et al. 2011)
Sulfamethoxazole
4.29×10⁻³ ; 2.97×10⁻²
(Andreozzi et al. 2003;
Baeza and Knappe 2011)
Baeza and Knappe (2011)
3.7×10⁹;
8.5×10⁹
(Lam and Mabury 2005;
Abdelmelek et al. 2011)
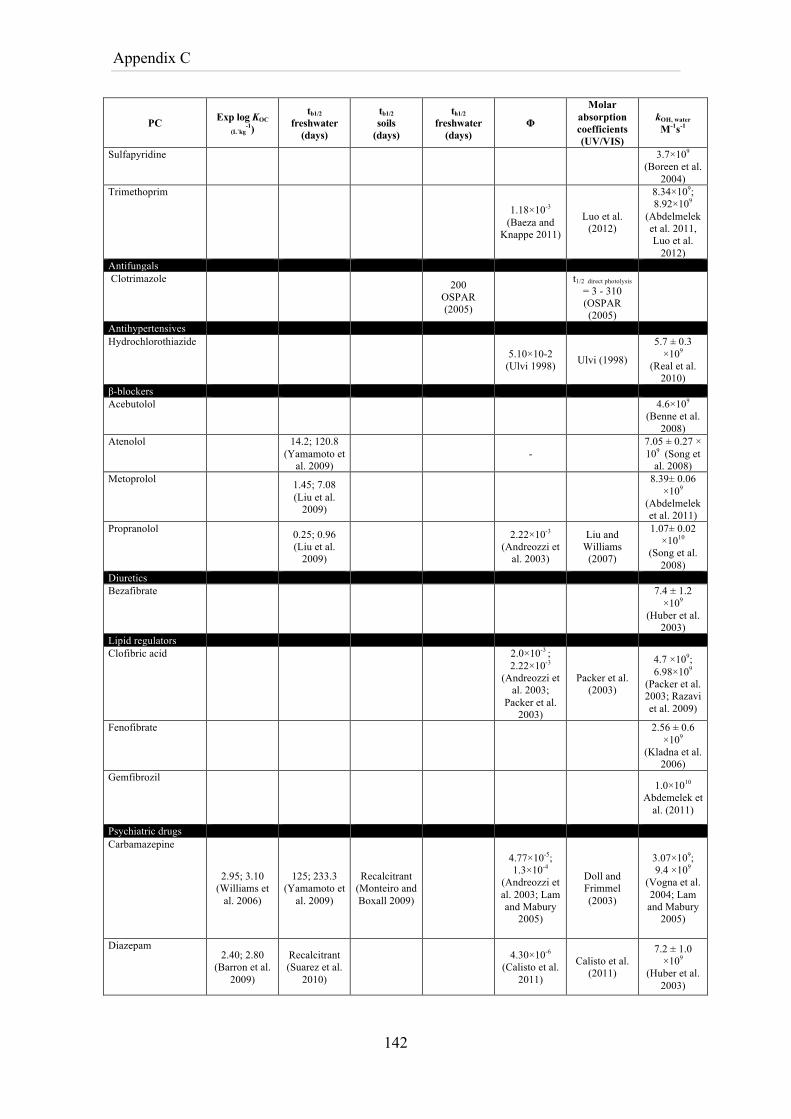
Appendix C
142
PC Exp log KOC
(L˙kg-1)
tb1/2
freshwater (days)
tb1/2
soils (days)
th1/2
freshwater (days)
Φ
Molar absorption coefficients (UV/VIS)
kOH, water M-1s-1
Sulfapyridine
3.7×10⁹
(Boreen et al. 2004)
Trimethoprim
1.18×10⁻³
(Baeza and Knappe 2011)
Luo et al. (2012)
8.34×10⁹;
8.92×10⁹
(Abdelmelek et al. 2011, Luo et al.
2012) Antifungals Clotrimazole
200
OSPAR (2005)
t1/2 direct photolysis
= 3 - 310 (OSPAR (2005)
Antihypertensives Hydrochlorothiazide
5.10×10⁻² (Ulvi 1998) Ulvi (1998)
5.7 ± 0.3 ×10⁹
(Real et al. 2010)
β-blockers Acebutolol
4.6×10⁹
(Benne et al. 2008)
Atenolol
14.2; 120.8 (Yamamoto et
al. 2009) -
7.05 ± 0.27 × 10⁹ (Song et
al. 2008) Metoprolol
1.45; 7.08 (Liu et al.
2009)
8.39± 0.06 ×10⁹
(Abdelmelek et al. 2011)
Propranolol
0.25; 0.96 (Liu et al.
2009)
2.22×10⁻³ (Andreozzi et
al. 2003)
Liu and Williams
(2007)
1.07± 0.02 ×10¹⁰
(Song et al. 2008)
Diuretics Bezafibrate
7.4 ± 1.2 ×10⁹
(Huber et al. 2003)
Lipid regulators Clofibric acid
2.0×10⁻³ ; 2.22×10⁻³
(Andreozzi et al. 2003;
Packer et al. 2003)
Packer et al. (2003)
4.7 ×10⁹; 6.98×10⁹
(Packer et al. 2003; Razavi et al. 2009)
Fenofibrate
2.56 ± 0.6 ×10⁹
(Kladna et al. 2006)
Gemfibrozil
1.0×10¹⁰
Abdemelek et al. (2011)
Psychiatric drugs Carbamazepine
2.95; 3.10 (Williams et
al. 2006)
125; 233.3 (Yamamoto et
al. 2009)
Recalcitrant (Monteiro and Boxall 2009)
4.77×10⁻⁵; 1.3×10⁻⁴
(Andreozzi et al. 2003; Lam and Mabury
2005)
Doll and Frimmel (2003)
3.07×10⁹; 9.4 ×10⁹
(Vogna et al. 2004; Lam
and Mabury 2005)
Diazepam 2.40; 2.80
(Barron et al. 2009)
Recalcitrant (Suarez et al.
2010)
4.30×10⁻⁶
(Calisto et al. 2011)
Calisto et al. (2011)
7.2 ± 1.0 ×10⁹
(Huber et al. 2003)
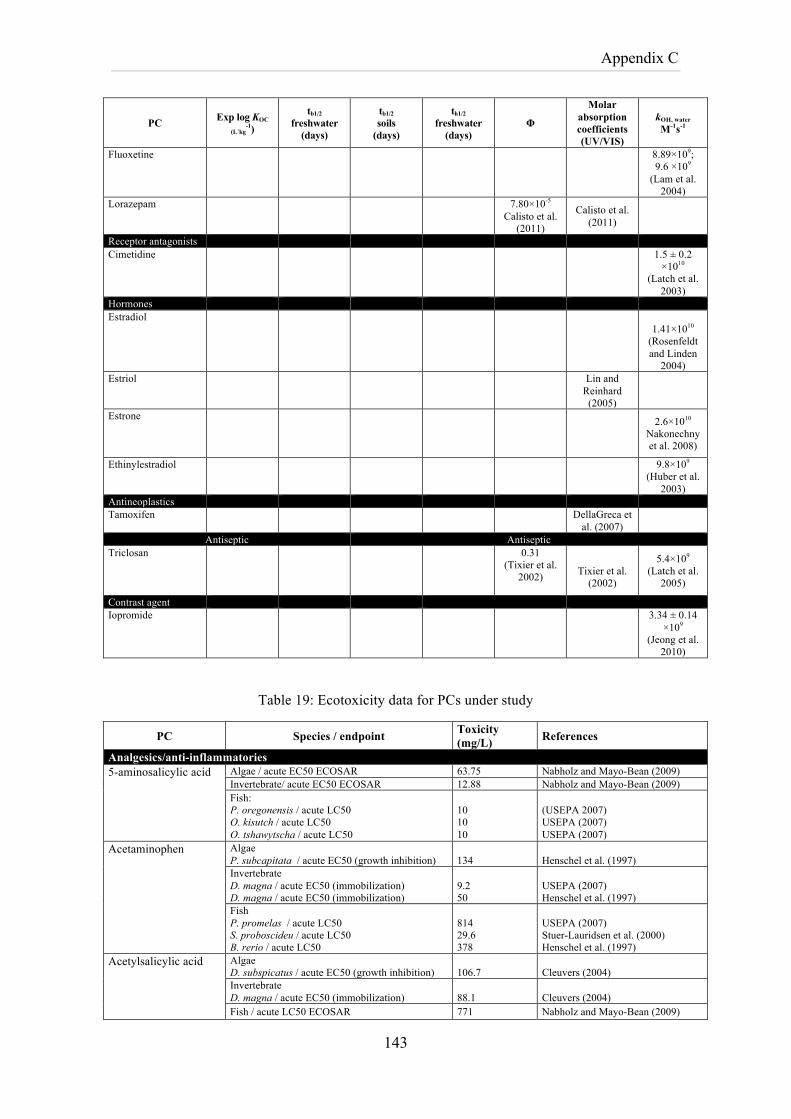
Appendix C
143
PC Exp log KOC
(L˙kg-1)
tb1/2
freshwater (days)
tb1/2
soils (days)
th1/2
freshwater (days)
Φ
Molar absorption coefficients (UV/VIS)
kOH, water M-1s-1
Fluoxetine
8.89×10⁹; 9.6 ×10⁹
(Lam et al. 2004)
Lorazepam
7.80×10⁻⁵
Calisto et al. (2011)
Calisto et al. (2011)
Receptor antagonists Cimetidine
1.5 ± 0.2 ×10¹⁰
(Latch et al. 2003)
Hormones Estradiol
1.41×10¹⁰
(Rosenfeldt and Linden
2004) Estriol
Lin and
Reinhard (2005)
Estrone
2.6×10¹⁰
Nakonechny et al. 2008)
Ethinylestradiol
9.8×10⁹ (Huber et al.
2003) Antineoplastics Tamoxifen DellaGreca et
al. (2007)
Antiseptic Antiseptic Triclosan
0.31 (Tixier et al.
2002)
Tixier et al.
(2002)
5.4×10⁹ (Latch et al.
2005)
Contrast agent Iopromide
3.34 ± 0.14 ×10⁹
(Jeong et al. 2010)
Table 19: Ecotoxicity data for PCs under study
PC Species / endpoint Toxicity (mg/L) References
Analgesics/anti-inflammatories 5-aminosalicylic acid Algae / acute EC50 ECOSAR 63.75 Nabholz and Mayo-Bean (2009)
Invertebrate/ acute EC50 ECOSAR 12.88 Nabholz and Mayo-Bean (2009) Fish: P. oregonensis / acute LC50 O. kisutch / acute LC50 O. tshawytscha / acute LC50
10 10 10
(USEPA 2007) USEPA (2007) USEPA (2007)
Acetaminophen Algae P. subcapitata / acute EC50 (growth inhibition)
134
Henschel et al. (1997)
Invertebrate D. magna / acute EC50 (immobilization) D. magna / acute EC50 (immobilization)
9.2 50
USEPA (2007) Henschel et al. (1997)
Fish P. promelas / acute LC50 S. proboscideu / acute LC50 B. rerio / acute LC50
814 29.6 378
USEPA (2007) Stuer-Lauridsen et al. (2000) Henschel et al. (1997)
Acetylsalicylic acid Algae D. subspicatus / acute EC50 (growth inhibition)
106.7
Cleuvers (2004)
Invertebrate D. magna / acute EC50 (immobilization)
88.1
Cleuvers (2004)
Fish / acute LC50 ECOSAR 771 Nabholz and Mayo-Bean (2009)
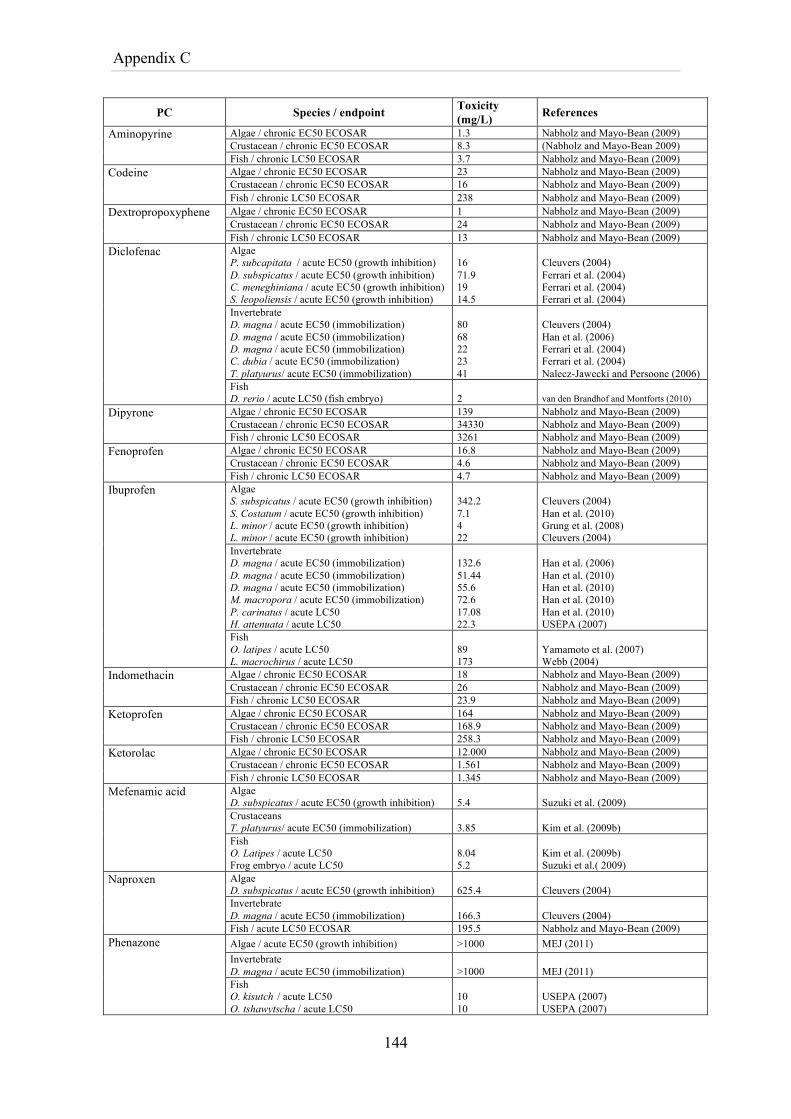
Appendix C
144
PC Species / endpoint Toxicity (mg/L) References
Aminopyrine Algae / chronic EC50 ECOSAR 1.3 Nabholz and Mayo-Bean (2009) Crustacean / chronic EC50 ECOSAR 8.3 (Nabholz and Mayo-Bean 2009) Fish / chronic LC50 ECOSAR 3.7 Nabholz and Mayo-Bean (2009)
Codeine Algae / chronic EC50 ECOSAR 23 Nabholz and Mayo-Bean (2009) Crustacean / chronic EC50 ECOSAR 16 Nabholz and Mayo-Bean (2009) Fish / chronic LC50 ECOSAR 238 Nabholz and Mayo-Bean (2009)
Dextropropoxyphene Algae / chronic EC50 ECOSAR 1 Nabholz and Mayo-Bean (2009) Crustacean / chronic EC50 ECOSAR 24 Nabholz and Mayo-Bean (2009) Fish / chronic LC50 ECOSAR 13 Nabholz and Mayo-Bean (2009)
Diclofenac Algae P. subcapitata / acute EC50 (growth inhibition) D. subspicatus / acute EC50 (growth inhibition) C. meneghiniana / acute EC50 (growth inhibition) S. leopoliensis / acute EC50 (growth inhibition)
16 71.9 19 14.5
Cleuvers (2004) Ferrari et al. (2004) Ferrari et al. (2004) Ferrari et al. (2004)
Invertebrate D. magna / acute EC50 (immobilization) D. magna / acute EC50 (immobilization) D. magna / acute EC50 (immobilization) C. dubia / acute EC50 (immobilization) T. platyurus/ acute EC50 (immobilization)
80 68 22 23 41
Cleuvers (2004) Han et al. (2006) Ferrari et al. (2004) Ferrari et al. (2004) Nalecz-Jawecki and Persoone (2006)
Fish D. rerio / acute LC50 (fish embryo)
2
van den Brandhof and Montforts (2010)
Dipyrone Algae / chronic EC50 ECOSAR 139 Nabholz and Mayo-Bean (2009) Crustacean / chronic EC50 ECOSAR 34330 Nabholz and Mayo-Bean (2009) Fish / chronic LC50 ECOSAR 3261 Nabholz and Mayo-Bean (2009)
Fenoprofen Algae / chronic EC50 ECOSAR 16.8 Nabholz and Mayo-Bean (2009) Crustacean / chronic EC50 ECOSAR 4.6 Nabholz and Mayo-Bean (2009) Fish / chronic LC50 ECOSAR 4.7 Nabholz and Mayo-Bean (2009)
Ibuprofen Algae S. subspicatus / acute EC50 (growth inhibition) S. Costatum / acute EC50 (growth inhibition) L. minor / acute EC50 (growth inhibition) L. minor / acute EC50 (growth inhibition)
342.2 7.1 4 22
Cleuvers (2004) Han et al. (2010) Grung et al. (2008) Cleuvers (2004)
Invertebrate D. magna / acute EC50 (immobilization) D. magna / acute EC50 (immobilization) D. magna / acute EC50 (immobilization) M. macropora / acute EC50 (immobilization) P. carinatus / acute LC50 H. attenuata / acute LC50
132.6 51.44 55.6 72.6 17.08 22.3
Han et al. (2006) Han et al. (2010) Han et al. (2010) Han et al. (2010) Han et al. (2010) USEPA (2007)
Fish O. latipes / acute LC50 L. macrochirus / acute LC50
89 173
Yamamoto et al. (2007) Webb (2004)
Indomethacin Algae / chronic EC50 ECOSAR 18 Nabholz and Mayo-Bean (2009) Crustacean / chronic EC50 ECOSAR 26 Nabholz and Mayo-Bean (2009) Fish / chronic LC50 ECOSAR 23.9 Nabholz and Mayo-Bean (2009)
Ketoprofen Algae / chronic EC50 ECOSAR 164 Nabholz and Mayo-Bean (2009) Crustacean / chronic EC50 ECOSAR 168.9 Nabholz and Mayo-Bean (2009) Fish / chronic LC50 ECOSAR 258.3 Nabholz and Mayo-Bean (2009)
Ketorolac Algae / chronic EC50 ECOSAR 12.000 Nabholz and Mayo-Bean (2009) Crustacean / chronic EC50 ECOSAR 1.561 Nabholz and Mayo-Bean (2009) Fish / chronic LC50 ECOSAR 1.345 Nabholz and Mayo-Bean (2009)
Mefenamic acid Algae D. subspicatus / acute EC50 (growth inhibition)
5.4
Suzuki et al. (2009)
Crustaceans T. platyurus/ acute EC50 (immobilization)
3.85
Kim et al. (2009b)
Fish O. Latipes / acute LC50 Frog embryo / acute LC50
8.04 5.2
Kim et al. (2009b) Suzuki et al.( 2009)
Naproxen Algae D. subspicatus / acute EC50 (growth inhibition)
625.4
Cleuvers (2004)
Invertebrate D. magna / acute EC50 (immobilization)
166.3
Cleuvers (2004)
Fish / acute LC50 ECOSAR 195.5 Nabholz and Mayo-Bean (2009) Phenazone Algae / acute EC50 (growth inhibition) >1000 MEJ (2011)
Invertebrate D. magna / acute EC50 (immobilization)
>1000
MEJ (2011)
Fish O. kisutch / acute LC50 O. tshawytscha / acute LC50
10 10
USEPA (2007) USEPA (2007)
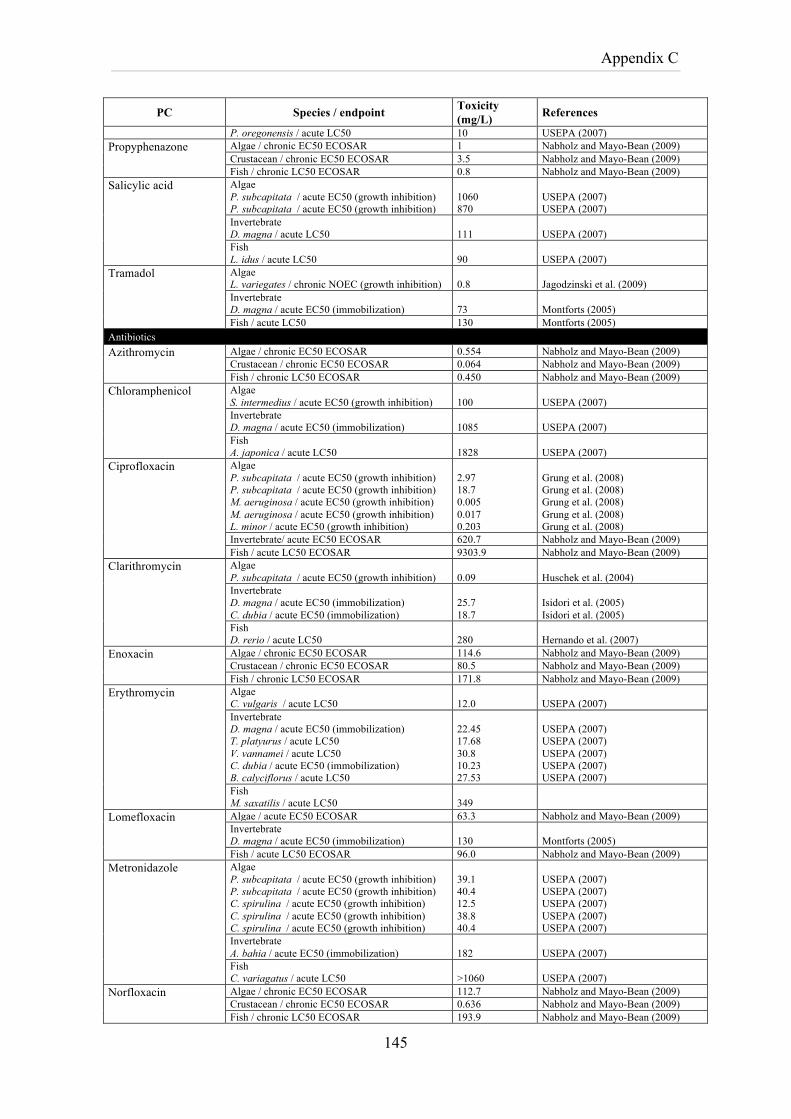
Appendix C
145
PC Species / endpoint Toxicity (mg/L) References
P. oregonensis / acute LC50 10 USEPA (2007) Propyphenazone Algae / chronic EC50 ECOSAR 1 Nabholz and Mayo-Bean (2009)
Crustacean / chronic EC50 ECOSAR 3.5 Nabholz and Mayo-Bean (2009) Fish / chronic LC50 ECOSAR 0.8 Nabholz and Mayo-Bean (2009)
Salicylic acid Algae P. subcapitata / acute EC50 (growth inhibition) P. subcapitata / acute EC50 (growth inhibition)
1060 870
USEPA (2007) USEPA (2007)
Invertebrate D. magna / acute LC50
111
USEPA (2007)
Fish L. idus / acute LC50
90
USEPA (2007)
Tramadol Algae L. variegates / chronic NOEC (growth inhibition)
0.8
Jagodzinski et al. (2009)
Invertebrate D. magna / acute EC50 (immobilization)
73
Montforts (2005)
Fish / acute LC50 130 Montforts (2005) Antibiotics Azithromycin Algae / chronic EC50 ECOSAR 0.554 Nabholz and Mayo-Bean (2009)
Crustacean / chronic EC50 ECOSAR 0.064 Nabholz and Mayo-Bean (2009) Fish / chronic LC50 ECOSAR 0.450 Nabholz and Mayo-Bean (2009)
Chloramphenicol Algae S. intermedius / acute EC50 (growth inhibition)
100
USEPA (2007)
Invertebrate D. magna / acute EC50 (immobilization)
1085
USEPA (2007)
Fish A. japonica / acute LC50
1828
USEPA (2007)
Ciprofloxacin Algae P. subcapitata / acute EC50 (growth inhibition) P. subcapitata / acute EC50 (growth inhibition) M. aeruginosa / acute EC50 (growth inhibition) M. aeruginosa / acute EC50 (growth inhibition) L. minor / acute EC50 (growth inhibition)
2.97 18.7 0.005 0.017 0.203
Grung et al. (2008) Grung et al. (2008) Grung et al. (2008) Grung et al. (2008) Grung et al. (2008)
Invertebrate/ acute EC50 ECOSAR 620.7 Nabholz and Mayo-Bean (2009) Fish / acute LC50 ECOSAR 9303.9 Nabholz and Mayo-Bean (2009)
Clarithromycin Algae P. subcapitata / acute EC50 (growth inhibition)
0.09
Huschek et al. (2004)
Invertebrate D. magna / acute EC50 (immobilization) C. dubia / acute EC50 (immobilization)
25.7 18.7
Isidori et al. (2005) Isidori et al. (2005)
Fish D. rerio / acute LC50
280
Hernando et al. (2007)
Enoxacin Algae / chronic EC50 ECOSAR 114.6 Nabholz and Mayo-Bean (2009) Crustacean / chronic EC50 ECOSAR 80.5 Nabholz and Mayo-Bean (2009) Fish / chronic LC50 ECOSAR 171.8 Nabholz and Mayo-Bean (2009)
Erythromycin Algae C. vulgaris / acute LC50
12.0
USEPA (2007)
Invertebrate D. magna / acute EC50 (immobilization) T. platyurus / acute LC50 V. vannamei / acute LC50 C. dubia / acute EC50 (immobilization) B. calyciflorus / acute LC50
22.45 17.68 30.8 10.23 27.53
USEPA (2007) USEPA (2007) USEPA (2007) USEPA (2007) USEPA (2007)
Fish M. saxatilis / acute LC50
349
Lomefloxacin Algae / acute EC50 ECOSAR 63.3 Nabholz and Mayo-Bean (2009) Invertebrate D. magna / acute EC50 (immobilization)
130
Montforts (2005)
Fish / acute LC50 ECOSAR 96.0 Nabholz and Mayo-Bean (2009) Metronidazole Algae
P. subcapitata / acute EC50 (growth inhibition) P. subcapitata / acute EC50 (growth inhibition) C. spirulina / acute EC50 (growth inhibition) C. spirulina / acute EC50 (growth inhibition) C. spirulina / acute EC50 (growth inhibition)
39.1 40.4 12.5 38.8 40.4
USEPA (2007) USEPA (2007) USEPA (2007) USEPA (2007) USEPA (2007)
Invertebrate A. bahia / acute EC50 (immobilization)
182
USEPA (2007)
Fish C. variagatus / acute LC50
>1060
USEPA (2007)
Norfloxacin Algae / chronic EC50 ECOSAR 112.7 Nabholz and Mayo-Bean (2009) Crustacean / chronic EC50 ECOSAR 0.636 Nabholz and Mayo-Bean (2009) Fish / chronic LC50 ECOSAR 193.9 Nabholz and Mayo-Bean (2009)
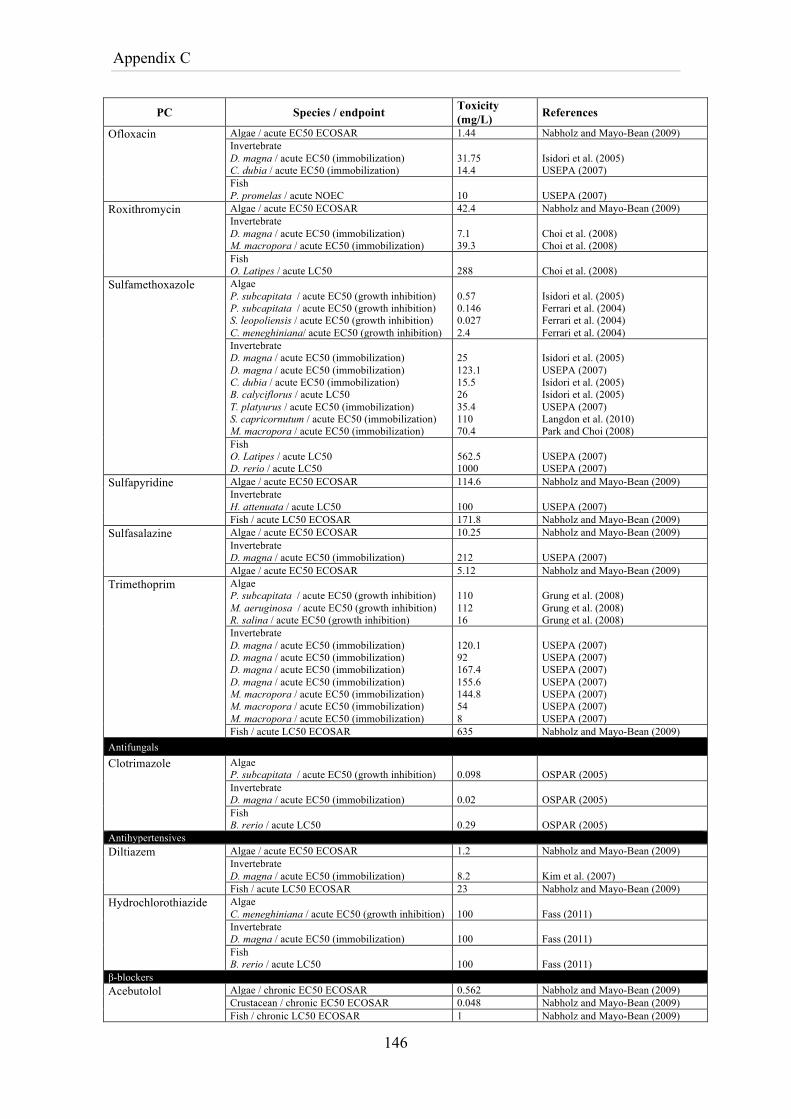
Appendix C
146
PC Species / endpoint Toxicity (mg/L) References
Ofloxacin Algae / acute EC50 ECOSAR 1.44 Nabholz and Mayo-Bean (2009) Invertebrate D. magna / acute EC50 (immobilization) C. dubia / acute EC50 (immobilization)
31.75 14.4
Isidori et al. (2005) USEPA (2007)
Fish P. promelas / acute NOEC
10
USEPA (2007)
Roxithromycin Algae / acute EC50 ECOSAR 42.4 Nabholz and Mayo-Bean (2009) Invertebrate D. magna / acute EC50 (immobilization) M. macropora / acute EC50 (immobilization)
7.1 39.3
Choi et al. (2008) Choi et al. (2008)
Fish O. Latipes / acute LC50
288
Choi et al. (2008)
Sulfamethoxazole Algae P. subcapitata / acute EC50 (growth inhibition) P. subcapitata / acute EC50 (growth inhibition) S. leopoliensis / acute EC50 (growth inhibition) C. meneghiniana/ acute EC50 (growth inhibition)
0.57 0.146 0.027 2.4
Isidori et al. (2005) Ferrari et al. (2004) Ferrari et al. (2004) Ferrari et al. (2004)
Invertebrate D. magna / acute EC50 (immobilization) D. magna / acute EC50 (immobilization) C. dubia / acute EC50 (immobilization) B. calyciflorus / acute LC50 T. platyurus / acute EC50 (immobilization) S. capricornutum / acute EC50 (immobilization) M. macropora / acute EC50 (immobilization)
25 123.1 15.5 26 35.4 110 70.4
Isidori et al. (2005) USEPA (2007) Isidori et al. (2005) Isidori et al. (2005) USEPA (2007) Langdon et al. (2010) Park and Choi (2008)
Fish O. Latipes / acute LC50 D. rerio / acute LC50
562.5 1000
USEPA (2007) USEPA (2007)
Sulfapyridine Algae / acute EC50 ECOSAR 114.6 Nabholz and Mayo-Bean (2009) Invertebrate H. attenuata / acute LC50
100
USEPA (2007)
Fish / acute LC50 ECOSAR 171.8 Nabholz and Mayo-Bean (2009) Sulfasalazine Algae / acute EC50 ECOSAR 10.25 Nabholz and Mayo-Bean (2009)
Invertebrate D. magna / acute EC50 (immobilization)
212
USEPA (2007)
Algae / acute EC50 ECOSAR 5.12 Nabholz and Mayo-Bean (2009) Trimethoprim Algae
P. subcapitata / acute EC50 (growth inhibition) M. aeruginosa / acute EC50 (growth inhibition) R. salina / acute EC50 (growth inhibition)
110 112 16
Grung et al. (2008) Grung et al. (2008) Grung et al. (2008)
Invertebrate D. magna / acute EC50 (immobilization) D. magna / acute EC50 (immobilization) D. magna / acute EC50 (immobilization) D. magna / acute EC50 (immobilization) M. macropora / acute EC50 (immobilization) M. macropora / acute EC50 (immobilization) M. macropora / acute EC50 (immobilization)
120.1 92 167.4 155.6 144.8 54 8
USEPA (2007) USEPA (2007) USEPA (2007) USEPA (2007) USEPA (2007) USEPA (2007) USEPA (2007)
Fish / acute LC50 ECOSAR 635 Nabholz and Mayo-Bean (2009) Antifungals Clotrimazole Algae
P. subcapitata / acute EC50 (growth inhibition) 0.098
OSPAR (2005)
Invertebrate D. magna / acute EC50 (immobilization)
0.02
OSPAR (2005)
Fish B. rerio / acute LC50
0.29
OSPAR (2005)
Antihypertensives Diltiazem Algae / acute EC50 ECOSAR 1.2 Nabholz and Mayo-Bean (2009)
Invertebrate D. magna / acute EC50 (immobilization)
8.2
Kim et al. (2007)
Fish / acute LC50 ECOSAR 23 Nabholz and Mayo-Bean (2009) Hydrochlorothiazide Algae
C. meneghiniana / acute EC50 (growth inhibition) 100
Fass (2011)
Invertebrate D. magna / acute EC50 (immobilization)
100
Fass (2011)
Fish B. rerio / acute LC50
100
Fass (2011)
β-blockers Acebutolol Algae / chronic EC50 ECOSAR 0.562 Nabholz and Mayo-Bean (2009)
Crustacean / chronic EC50 ECOSAR 0.048 Nabholz and Mayo-Bean (2009) Fish / chronic LC50 ECOSAR 1 Nabholz and Mayo-Bean (2009)
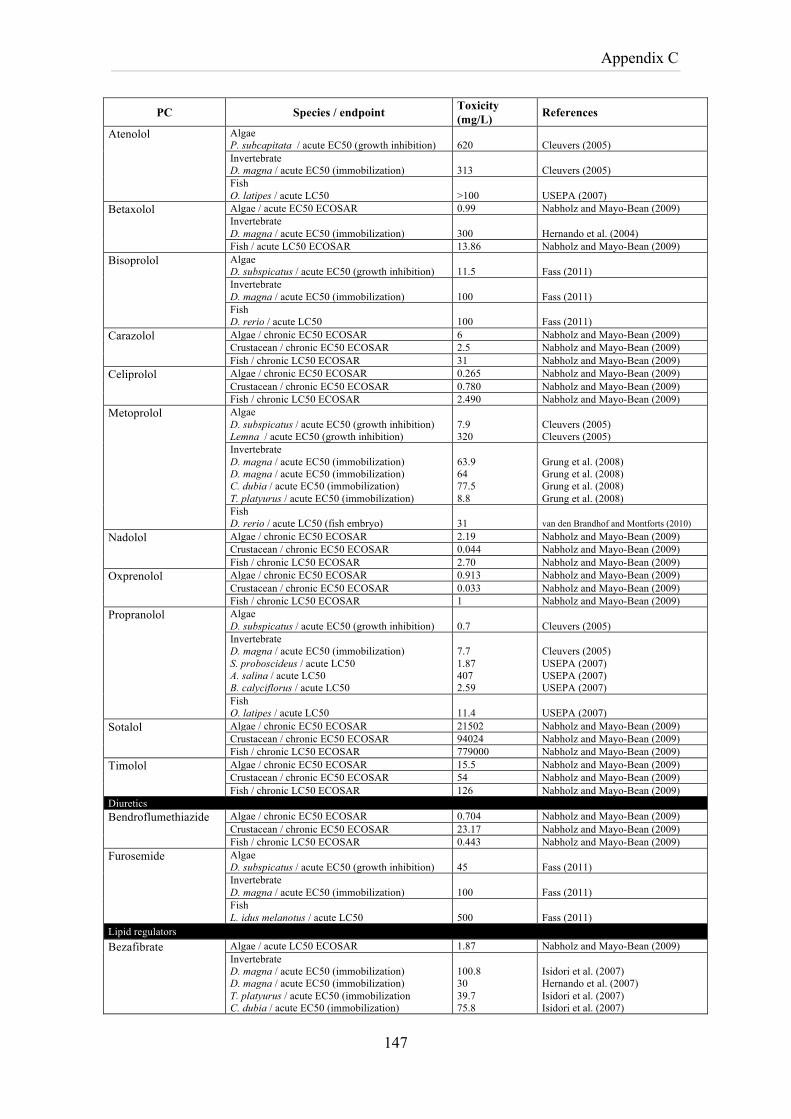
Appendix C
147
PC Species / endpoint Toxicity (mg/L) References
Atenolol Algae P. subcapitata / acute EC50 (growth inhibition)
620
Cleuvers (2005)
Invertebrate D. magna / acute EC50 (immobilization)
313
Cleuvers (2005)
Fish O. latipes / acute LC50
>100
USEPA (2007)
Betaxolol Algae / acute EC50 ECOSAR 0.99 Nabholz and Mayo-Bean (2009) Invertebrate D. magna / acute EC50 (immobilization)
300
Hernando et al. (2004)
Fish / acute LC50 ECOSAR 13.86 Nabholz and Mayo-Bean (2009) Bisoprolol Algae
D. subspicatus / acute EC50 (growth inhibition) 11.5
Fass (2011)
Invertebrate D. magna / acute EC50 (immobilization)
100
Fass (2011)
Fish D. rerio / acute LC50
100
Fass (2011)
Carazolol Algae / chronic EC50 ECOSAR 6 Nabholz and Mayo-Bean (2009) Crustacean / chronic EC50 ECOSAR 2.5 Nabholz and Mayo-Bean (2009) Fish / chronic LC50 ECOSAR 31 Nabholz and Mayo-Bean (2009)
Celiprolol Algae / chronic EC50 ECOSAR 0.265 Nabholz and Mayo-Bean (2009) Crustacean / chronic EC50 ECOSAR 0.780 Nabholz and Mayo-Bean (2009) Fish / chronic LC50 ECOSAR 2.490 Nabholz and Mayo-Bean (2009)
Metoprolol Algae D. subspicatus / acute EC50 (growth inhibition) Lemna / acute EC50 (growth inhibition)
7.9 320
Cleuvers (2005) Cleuvers (2005)
Invertebrate D. magna / acute EC50 (immobilization) D. magna / acute EC50 (immobilization) C. dubia / acute EC50 (immobilization) T. platyurus / acute EC50 (immobilization)
63.9 64 77.5 8.8
Grung et al. (2008) Grung et al. (2008) Grung et al. (2008) Grung et al. (2008)
Fish D. rerio / acute LC50 (fish embryo)
31
van den Brandhof and Montforts (2010)
Nadolol Algae / chronic EC50 ECOSAR 2.19 Nabholz and Mayo-Bean (2009) Crustacean / chronic EC50 ECOSAR 0.044 Nabholz and Mayo-Bean (2009) Fish / chronic LC50 ECOSAR 2.70 Nabholz and Mayo-Bean (2009)
Oxprenolol Algae / chronic EC50 ECOSAR 0.913 Nabholz and Mayo-Bean (2009) Crustacean / chronic EC50 ECOSAR 0.033 Nabholz and Mayo-Bean (2009) Fish / chronic LC50 ECOSAR 1 Nabholz and Mayo-Bean (2009)
Propranolol Algae D. subspicatus / acute EC50 (growth inhibition)
0.7
Cleuvers (2005)
Invertebrate D. magna / acute EC50 (immobilization) S. proboscideus / acute LC50 A. salina / acute LC50 B. calyciflorus / acute LC50
7.7 1.87 407 2.59
Cleuvers (2005) USEPA (2007) USEPA (2007) USEPA (2007)
Fish O. latipes / acute LC50
11.4
USEPA (2007)
Sotalol Algae / chronic EC50 ECOSAR 21502 Nabholz and Mayo-Bean (2009) Crustacean / chronic EC50 ECOSAR 94024 Nabholz and Mayo-Bean (2009) Fish / chronic LC50 ECOSAR 779000 Nabholz and Mayo-Bean (2009)
Timolol Algae / chronic EC50 ECOSAR 15.5 Nabholz and Mayo-Bean (2009) Crustacean / chronic EC50 ECOSAR 54 Nabholz and Mayo-Bean (2009) Fish / chronic LC50 ECOSAR 126 Nabholz and Mayo-Bean (2009)
Diuretics Bendroflumethiazide Algae / chronic EC50 ECOSAR 0.704 Nabholz and Mayo-Bean (2009)
Crustacean / chronic EC50 ECOSAR 23.17 Nabholz and Mayo-Bean (2009) Fish / chronic LC50 ECOSAR 0.443 Nabholz and Mayo-Bean (2009)
Furosemide Algae D. subspicatus / acute EC50 (growth inhibition)
45
Fass (2011)
Invertebrate D. magna / acute EC50 (immobilization)
100
Fass (2011)
Fish L. idus melanotus / acute LC50
500
Fass (2011)
Lipid regulators Bezafibrate Algae / acute LC50 ECOSAR 1.87 Nabholz and Mayo-Bean (2009)
Invertebrate D. magna / acute EC50 (immobilization) D. magna / acute EC50 (immobilization) T. platyurus / acute EC50 (immobilization C. dubia / acute EC50 (immobilization)
100.8 30 39.7 75.8
Isidori et al. (2007) Hernando et al. (2007) Isidori et al. (2007) Isidori et al. (2007)
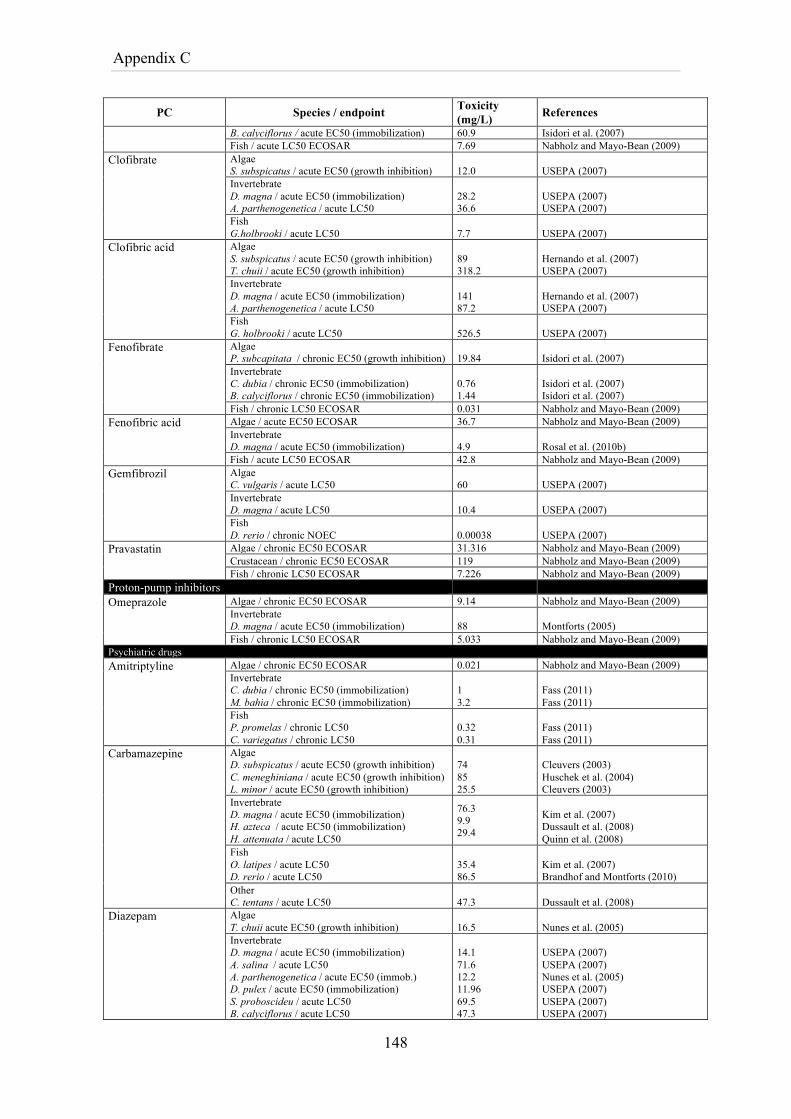
Appendix C
148
PC Species / endpoint Toxicity (mg/L) References
B. calyciflorus / acute EC50 (immobilization) 60.9 Isidori et al. (2007) Fish / acute LC50 ECOSAR 7.69 Nabholz and Mayo-Bean (2009)
Clofibrate Algae S. subspicatus / acute EC50 (growth inhibition)
12.0
USEPA (2007)
Invertebrate D. magna / acute EC50 (immobilization) A. parthenogenetica / acute LC50
28.2 36.6
USEPA (2007) USEPA (2007)
Fish G.holbrooki / acute LC50
7.7
USEPA (2007)
Clofibric acid Algae S. subspicatus / acute EC50 (growth inhibition) T. chuii / acute EC50 (growth inhibition)
89 318.2
Hernando et al. (2007) USEPA (2007)
Invertebrate D. magna / acute EC50 (immobilization) A. parthenogenetica / acute LC50
141 87.2
Hernando et al. (2007) USEPA (2007)
Fish G. holbrooki / acute LC50
526.5
USEPA (2007)
Fenofibrate Algae P. subcapitata / chronic EC50 (growth inhibition)
19.84
Isidori et al. (2007)
Invertebrate C. dubia / chronic EC50 (immobilization) B. calyciflorus / chronic EC50 (immobilization)
0.76 1.44
Isidori et al. (2007) Isidori et al. (2007)
Fish / chronic LC50 ECOSAR 0.031 Nabholz and Mayo-Bean (2009) Fenofibric acid Algae / acute EC50 ECOSAR 36.7 Nabholz and Mayo-Bean (2009)
Invertebrate D. magna / acute EC50 (immobilization)
4.9
Rosal et al. (2010b)
Fish / acute LC50 ECOSAR 42.8 Nabholz and Mayo-Bean (2009) Gemfibrozil Algae
C. vulgaris / acute LC50 60
USEPA (2007)
Invertebrate D. magna / acute LC50
10.4
USEPA (2007)
Fish D. rerio / chronic NOEC
0.00038
USEPA (2007)
Pravastatin Algae / chronic EC50 ECOSAR 31.316 Nabholz and Mayo-Bean (2009) Crustacean / chronic EC50 ECOSAR 119 Nabholz and Mayo-Bean (2009) Fish / chronic LC50 ECOSAR 7.226 Nabholz and Mayo-Bean (2009)
Proton-pump inhibitors Omeprazole Algae / chronic EC50 ECOSAR 9.14 Nabholz and Mayo-Bean (2009)
Invertebrate D. magna / acute EC50 (immobilization)
88
Montforts (2005)
Fish / chronic LC50 ECOSAR 5.033 Nabholz and Mayo-Bean (2009) Psychiatric drugs Amitriptyline Algae / chronic EC50 ECOSAR 0.021 Nabholz and Mayo-Bean (2009)
Invertebrate C. dubia / chronic EC50 (immobilization) M. bahia / chronic EC50 (immobilization)
1 3.2
Fass (2011) Fass (2011)
Fish P. promelas / chronic LC50 C. variegatus / chronic LC50
0.32 0.31
Fass (2011) Fass (2011)
Carbamazepine Algae D. subspicatus / acute EC50 (growth inhibition) C. meneghiniana / acute EC50 (growth inhibition) L. minor / acute EC50 (growth inhibition)
74 85 25.5
Cleuvers (2003) Huschek et al. (2004) Cleuvers (2003)
Invertebrate D. magna / acute EC50 (immobilization) H. azteca / acute EC50 (immobilization) H. attenuata / acute LC50
76.3 9.9 29.4
Kim et al. (2007) Dussault et al. (2008) Quinn et al. (2008)
Fish O. latipes / acute LC50 D. rerio / acute LC50
35.4 86.5
Kim et al. (2007) Brandhof and Montforts (2010)
Other C. tentans / acute LC50
47.3
Dussault et al. (2008)
Diazepam Algae T. chuii acute EC50 (growth inhibition)
16.5
Nunes et al. (2005)
Invertebrate D. magna / acute EC50 (immobilization) A. salina / acute LC50 A. parthenogenetica / acute EC50 (immob.) D. pulex / acute EC50 (immobilization) S. proboscideu / acute LC50 B. calyciflorus / acute LC50
14.1 71.6 12.2 11.96 69.5 47.3
USEPA (2007) USEPA (2007) Nunes et al. (2005) USEPA (2007) USEPA (2007) USEPA (2007)
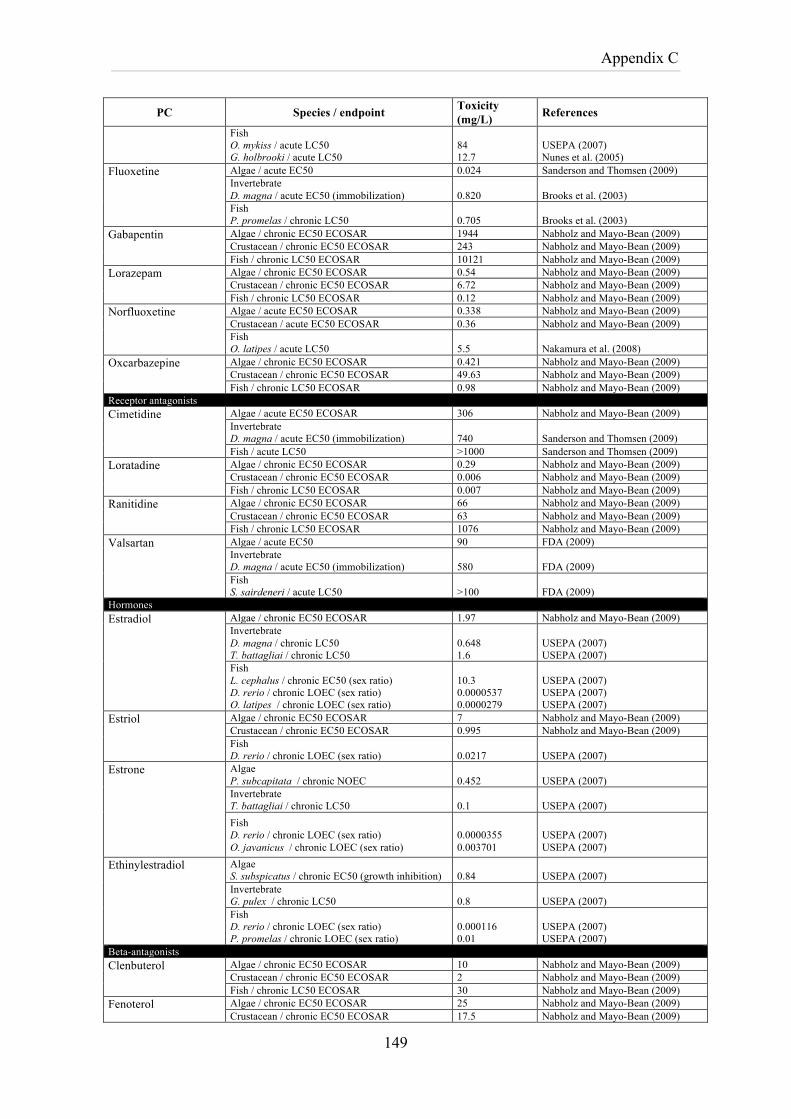
Appendix C
149
PC Species / endpoint Toxicity (mg/L) References
Fish O. mykiss / acute LC50 G. holbrooki / acute LC50
84 12.7
USEPA (2007) Nunes et al. (2005)
Fluoxetine Algae / acute EC50 0.024 Sanderson and Thomsen (2009) Invertebrate D. magna / acute EC50 (immobilization)
0.820
Brooks et al. (2003)
Fish P. promelas / chronic LC50
0.705
Brooks et al. (2003)
Gabapentin Algae / chronic EC50 ECOSAR 1944 Nabholz and Mayo-Bean (2009) Crustacean / chronic EC50 ECOSAR 243 Nabholz and Mayo-Bean (2009) Fish / chronic LC50 ECOSAR 10121 Nabholz and Mayo-Bean (2009)
Lorazepam Algae / chronic EC50 ECOSAR 0.54 Nabholz and Mayo-Bean (2009) Crustacean / chronic EC50 ECOSAR 6.72 Nabholz and Mayo-Bean (2009) Fish / chronic LC50 ECOSAR 0.12 Nabholz and Mayo-Bean (2009)
Norfluoxetine Algae / acute EC50 ECOSAR 0.338 Nabholz and Mayo-Bean (2009) Crustacean / acute EC50 ECOSAR 0.36 Nabholz and Mayo-Bean (2009) Fish O. latipes / acute LC50
5.5
Nakamura et al. (2008)
Oxcarbazepine Algae / chronic EC50 ECOSAR 0.421 Nabholz and Mayo-Bean (2009) Crustacean / chronic EC50 ECOSAR 49.63 Nabholz and Mayo-Bean (2009) Fish / chronic LC50 ECOSAR 0.98 Nabholz and Mayo-Bean (2009)
Receptor antagonists Cimetidine Algae / acute EC50 ECOSAR 306 Nabholz and Mayo-Bean (2009)
Invertebrate D. magna / acute EC50 (immobilization)
740
Sanderson and Thomsen (2009)
Fish / acute LC50 >1000 Sanderson and Thomsen (2009) Loratadine Algae / chronic EC50 ECOSAR 0.29 Nabholz and Mayo-Bean (2009)
Crustacean / chronic EC50 ECOSAR 0.006 Nabholz and Mayo-Bean (2009) Fish / chronic LC50 ECOSAR 0.007 Nabholz and Mayo-Bean (2009)
Ranitidine Algae / chronic EC50 ECOSAR 66 Nabholz and Mayo-Bean (2009) Crustacean / chronic EC50 ECOSAR 63 Nabholz and Mayo-Bean (2009) Fish / chronic LC50 ECOSAR 1076 Nabholz and Mayo-Bean (2009)
Valsartan Algae / acute EC50 90 FDA (2009) Invertebrate D. magna / acute EC50 (immobilization)
580
FDA (2009)
Fish S. sairdeneri / acute LC50
>100
FDA (2009)
Hormones Estradiol Algae / chronic EC50 ECOSAR 1.97 Nabholz and Mayo-Bean (2009)
Invertebrate D. magna / chronic LC50 T. battagliai / chronic LC50
0.648 1.6
USEPA (2007) USEPA (2007)
Fish L. cephalus / chronic EC50 (sex ratio) D. rerio / chronic LOEC (sex ratio) O. latipes / chronic LOEC (sex ratio)
10.3 0.0000537 0.0000279
USEPA (2007) USEPA (2007) USEPA (2007)
Estriol Algae / chronic EC50 ECOSAR 7 Nabholz and Mayo-Bean (2009) Crustacean / chronic EC50 ECOSAR 0.995 Nabholz and Mayo-Bean (2009) Fish D. rerio / chronic LOEC (sex ratio)
0.0217
USEPA (2007)
Estrone Algae P. subcapitata / chronic NOEC
0.452
USEPA (2007)
Invertebrate T. battagliai / chronic LC50
0.1
USEPA (2007)
Fish D. rerio / chronic LOEC (sex ratio) O. javanicus / chronic LOEC (sex ratio)
0.0000355 0.003701
USEPA (2007) USEPA (2007)
Ethinylestradiol Algae S. subspicatus / chronic EC50 (growth inhibition)
0.84
USEPA (2007)
Invertebrate G. pulex / chronic LC50
0.8
USEPA (2007)
Fish D. rerio / chronic LOEC (sex ratio) P. promelas / chronic LOEC (sex ratio)
0.000116 0.01
USEPA (2007) USEPA (2007)
Beta-antagonists Clenbuterol Algae / chronic EC50 ECOSAR 10 Nabholz and Mayo-Bean (2009)
Crustacean / chronic EC50 ECOSAR 2 Nabholz and Mayo-Bean (2009) Fish / chronic LC50 ECOSAR 30 Nabholz and Mayo-Bean (2009)
Fenoterol Algae / chronic EC50 ECOSAR 25 Nabholz and Mayo-Bean (2009) Crustacean / chronic EC50 ECOSAR 17.5 Nabholz and Mayo-Bean (2009)
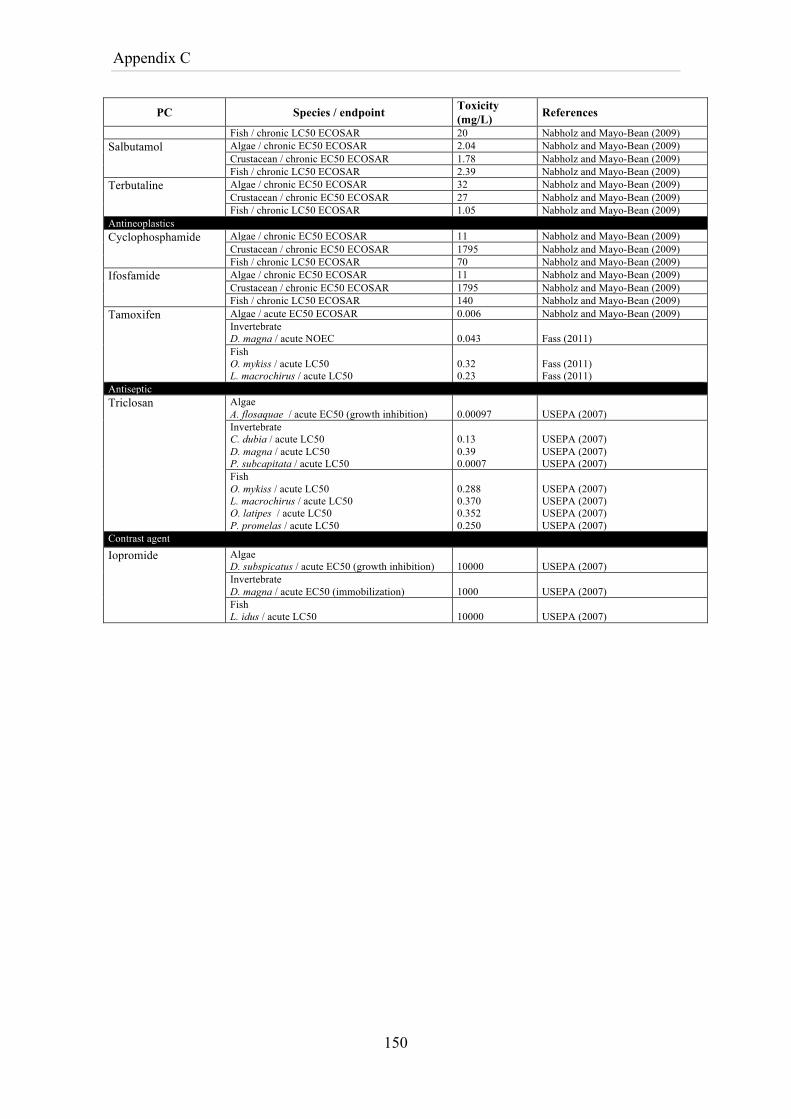
Appendix C
150
PC Species / endpoint Toxicity (mg/L) References
Fish / chronic LC50 ECOSAR 20 Nabholz and Mayo-Bean (2009) Salbutamol Algae / chronic EC50 ECOSAR 2.04 Nabholz and Mayo-Bean (2009)
Crustacean / chronic EC50 ECOSAR 1.78 Nabholz and Mayo-Bean (2009) Fish / chronic LC50 ECOSAR 2.39 Nabholz and Mayo-Bean (2009)
Terbutaline Algae / chronic EC50 ECOSAR 32 Nabholz and Mayo-Bean (2009) Crustacean / chronic EC50 ECOSAR 27 Nabholz and Mayo-Bean (2009) Fish / chronic LC50 ECOSAR 1.05 Nabholz and Mayo-Bean (2009)
Antineoplastics Cyclophosphamide Algae / chronic EC50 ECOSAR 11 Nabholz and Mayo-Bean (2009)
Crustacean / chronic EC50 ECOSAR 1795 Nabholz and Mayo-Bean (2009) Fish / chronic LC50 ECOSAR 70 Nabholz and Mayo-Bean (2009)
Ifosfamide Algae / chronic EC50 ECOSAR 11 Nabholz and Mayo-Bean (2009) Crustacean / chronic EC50 ECOSAR 1795 Nabholz and Mayo-Bean (2009) Fish / chronic LC50 ECOSAR 140 Nabholz and Mayo-Bean (2009)
Tamoxifen Algae / acute EC50 ECOSAR 0.006 Nabholz and Mayo-Bean (2009) Invertebrate D. magna / acute NOEC
0.043
Fass (2011)
Fish O. mykiss / acute LC50 L. macrochirus / acute LC50
0.32 0.23
Fass (2011) Fass (2011)
Antiseptic Triclosan Algae
A. flosaquae / acute EC50 (growth inhibition) 0.00097
USEPA (2007)
Invertebrate C. dubia / acute LC50 D. magna / acute LC50 P. subcapitata / acute LC50
0.13 0.39 0.0007
USEPA (2007) USEPA (2007) USEPA (2007)
Fish O. mykiss / acute LC50 L. macrochirus / acute LC50 O. latipes / acute LC50 P. promelas / acute LC50
0.288 0.370 0.352 0.250
USEPA (2007) USEPA (2007) USEPA (2007) USEPA (2007)
Contrast agent Iopromide Algae
D. subspicatus / acute EC50 (growth inhibition) 10000
USEPA (2007)
Invertebrate D. magna / acute EC50 (immobilization)
1000
USEPA (2007)
Fish L. idus / acute LC50
10000
USEPA (2007)
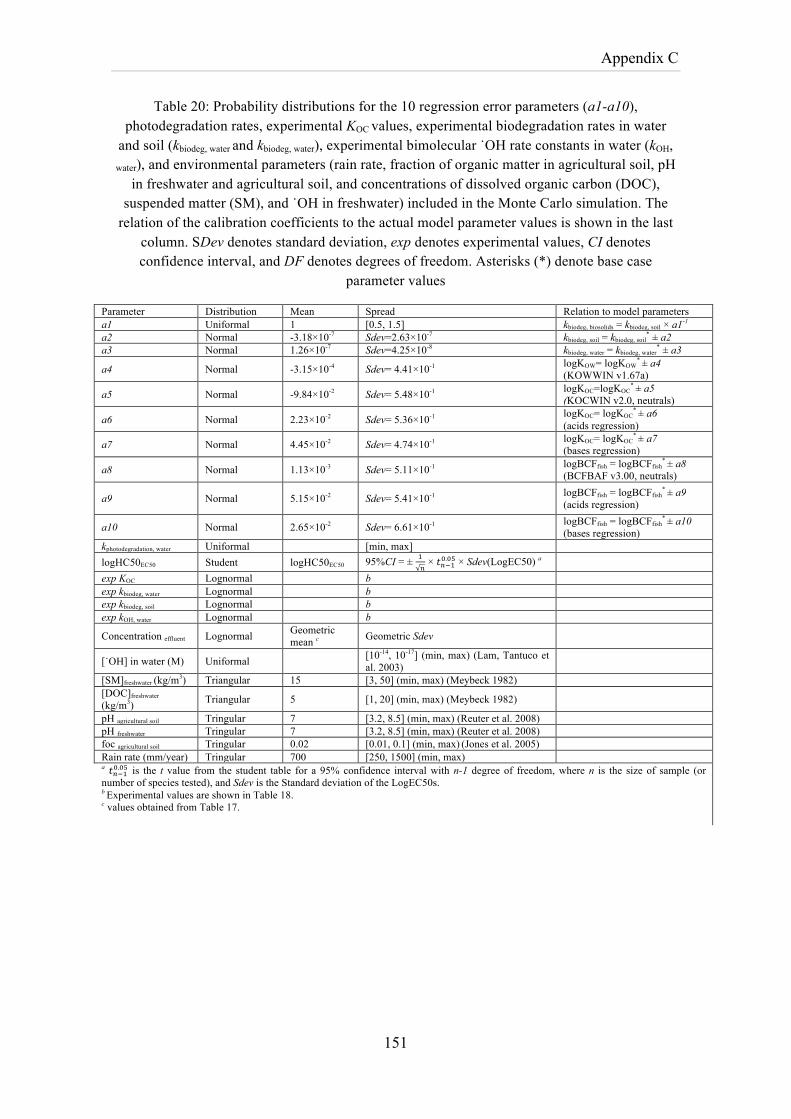
Appendix C
151
Table 20: Probability distributions for the 10 regression error parameters (a1-a10), photodegradation rates, experimental KOC values, experimental biodegradation rates in water
and soil (kbiodeg, water and kbiodeg, water), experimental bimolecular ˙OH rate constants in water (kOH, water), and environmental parameters (rain rate, fraction of organic matter in agricultural soil, pH
in freshwater and agricultural soil, and concentrations of dissolved organic carbon (DOC), suspended matter (SM), and ˙OH in freshwater) included in the Monte Carlo simulation. The
relation of the calibration coefficients to the actual model parameter values is shown in the last column. SDev denotes standard deviation, exp denotes experimental values, CI denotes confidence interval, and DF denotes degrees of freedom. Asterisks (*) denote base case
parameter values
Parameter Distribution Mean Spread Relation to model parameters a1 Uniformal 1 [0.5, 1.5] kbiodeg, biosolids = kbiodeg, soil × a1-1 a2 Normal -3.18×10⁻⁷ Sdev=2.63×10⁻⁷ kbiodeg, soil = kbiodeg, soil
* ± a2 a3 Normal 1.26×10⁻⁷ Sdev=4.25×10⁻⁸ kbiodeg, water = kbiodeg, water
* ± a3
a4 Normal -3.15×10⁻⁴ Sdev= 4.41×10⁻¹ logKOW= logKOW*
± a4 (KOWWIN v1.67a)
a5 Normal -9.84×10⁻² Sdev= 5.48×10⁻¹ logKOC=logKOC*
± a5 (KOCWIN v2.0, neutrals)
a6 Normal 2.23×10⁻² Sdev= 5.36×10⁻¹ logKOC= logKOC*
± a6 (acids regression)
a7 Normal 4.45×10⁻² Sdev= 4.74×10⁻¹ logKOC= logKOC*
± a7 (bases regression)
a8 Normal 1.13×10⁻³ Sdev= 5.11×10⁻¹ logBCFfish = logBCFfish*
± a8 (BCFBAF v3.00, neutrals)
a9 Normal 5.15×10⁻² Sdev= 5.41×10⁻¹ logBCFfish = logBCFfish*
± a9 (acids regression)
a10 Normal 2.65×10⁻² Sdev= 6.61×10⁻¹ logBCFfish = logBCFfish*
± a10 (bases regression)
kphotodegradation, water Uniformal [min, max] logHC50EC50 Student logHC50EC50 95%CI = ± !
! × 𝑡!!!!.!" × Sdev(LogEC50) a
exp KOC Lognormal b exp kbiodeg, water Lognormal b exp kbiodeg, soil Lognormal b exp kOH, water Lognormal b
Concentration effluent Lognormal Geometric mean c Geometric Sdev
[˙OH] in water (M) Uniformal [10-14, 10-17] (min, max) (Lam, Tantuco et al. 2003)
[SM]freshwater (kg/m3) Triangular 15 [3, 50] (min, max) (Meybeck 1982) [DOC]freshwater
(kg/m3) Triangular 5 [1, 20] (min, max) (Meybeck 1982)
pH agricultural soil Tringular 7 [3.2, 8.5] (min, max) (Reuter et al. 2008) pH freshwater Tringular 7 [3.2, 8.5] (min, max) (Reuter et al. 2008) foc agricultural soil Tringular 0.02 [0.01, 0.1] (min, max) (Jones et al. 2005) Rain rate (mm/year) Tringular 700 [250, 1500] (min, max) a 𝑡!!!!.!" is the t value from the student table for a 95% confidence interval with n-1 degree of freedom, where n is the size of sample (or number of species tested), and Sdev is the Standard deviation of the LogEC50s. b Experimental values are shown in Table 18. c values obtained from Table 17.
Appendix C
152
C5: Further discussion of results Measurements of the thiazide diuretic bendroflumethiazide in WWTP effluents and in
the environment are scarce. Kasprzyk-Hordern et al. (2009) reported detection at a
median concentration of 0.011 µg/l and a maximum concentration of 0.058 µg/l in a
WWTP effluent in Wales, UK; conversely, no detection was reported in other WWTP
plant (limit if detection = 0.8 ng/l). In addition, it was not detected in the river to which
the former WWTP effluent was discharged (limit of detection = 0.5 ng/l). The HC50
parameter contributes 95.2% to the impact result variance. Moreover, ecotoxicological
data were estimated for all trophic levels. No abiotic degradation data is available
however bendroflumethiazide may be susceptible to indirect photolysis, as well as,
containing chromophores that absorb at wavelengths >290 nm, it may also be
susceptible to direct photolysis.
The anti-inflammatory 5-aminosalicylic acid, or mesalazine, impact result is mainly
sensitive the HC50 parameter, which contributes 85.5% to the variance of output
results. Moreover, this parameter warrants further investigation given that only 1
experimental EC50 value was available in the literature; for other trophic levels EC50s
were estimated. Very limited data on measurements of 5-aminosalicylic in WWTP
effluents are also available in the literature. It was detected in 2 WWTP effluents from
activated sludge treatments at median concentrations of 0.63 and 30.32 µg/l in South
Wales, UK (Kasprzyk-Hordern et al., 2009). In addition, 5-aminosalicylic does contains
chromophores that absorb at wavelengths >290 nm and therefore may be susceptible to
direct photolysis by sunlight, as well as it may be susceptible to photosensitization.
The HC50 parameter contributes 97.7% to the impact result variance of the non-
steroidal anti-inflammatory ketorolac impact result. In addition, further uncertainty
related to HC50 parameter was not quantified given that EC50 values were estimated.
In several European countries ketorolac marketing was withdraw or the dose and
treatment duration were restricted due to several side effects (U.N., 2003). Generally,
pharmaceuticals with high consumption are those selected for further investigation
(Escher et al. 2011); hence very limited data on measurements of ketorolac in WWTP
effluents are available in the literature. It was detected at a maximum concentration of
0.539 µg/l in a WWTP effluent in Spain (Rosal et al., 2010). Ketorolac is expected to be
susceptible to indirect photolysis and it does contains chromophores that absorb at
wavelengths >290 nm; hence it may be also susceptible to direct photolysis.
Appendix C
153
The confidence limits of the unpolar lipid regulator clofibrate impact result are
comparatively narrow, having an insignificant contribution to total impact variance
(<0.05%). Therefore, clofibrate does not figure among compounds of greatest concern
(Figure 2); however, the median impact result is comparatively high. In general
clofibrate is not detectable in WWTP effluents, as well as fenofibrate and etofibrate.
The complete hydrolysis of these drugs to fenofibric acid and clofibric acid occurs in
the human body immediately after intake; therefore, the occurrence of these metabolites
are quite common in WWTP effluents (Ternes, 1998). Moreover, this neutral lipid
regulator has an estimated log KOW of 3.62 (USEPA, 2008), hence significant removal
in WWTPs may be expected due to partitioning to particles, given that, for hydrophobic
interactions, compounds exhibiting log KOW values greater than 3 would undergo
significant removal (i.e., >50% associated with particles in equilibrium) (Sedlak, 2000).
In fact, the parent compound clofibrate was not detected in 20 WWTP and in 20 rivers
in Germany (Ternes, 1998), and in 5 WWTPs in Italy, France and Sweden (Andreozzi
et al., 2003). However, its detection in 1 WWTP effluent in Greece (Andreozzi et al.,
2003), but not clofibric acid, is rather unusual and the authors do not have any
explanation. The impact result of clofibrate is based on the reported concentration of 0.8
µg/l in the Greek WWTP. Nevertheless, considering the discussion above, this compoud
may be comparatively of minor significance. Moreover, no data on indirect photolysis
was found in the literature therefore the residence time of clofibrate on the aquatic
environment may be overestimated in the present study.

Appendix C
154
Bibliography
155
Bibliography Abdelmelek, S. B., J. Greaves, K. P. Ishida, W. J. Cooper and W. Song (2011). "Removal of Pharmaceutical and Personal Care Products from Reverse Osmosis Retentate Using Advanced Oxidation Processes." Environmental Science & Technology 45(8): 3665-3671.
Aherne, G. W. and R. Briggs (1989). "The relevance of the presence of certain synthetic steroids in the aquatic environment." J Pharm Pharmacol 41(10): 735-736.
Alder, A. C., C. S. McArdell, E. M. Golet, H.-P. E. Kohler, E. Molnar, N. S. Nipales and W. Giger (2004). Environmental Exposure of Antibiotics in Wasterwaters, Sewage Sludges and Surface Waters in Switzerland. Pharmaceuticals in the Environment. Sources, Fate, Effects and Risks. K. Kümmerer. Berlin, Springer: 55-65.
Alder, A. C., C. Schaffner, M. Majewsky, J. Klasmeier and K. Fenner (2010). "Fate of beta-blocker human pharmaceuticals in surface water: Comparison of measured and simulated concentrations in the Glatt Valley Watershed, Switzerland." Water Research 44(3): 936-948.
Alvey, S. and D. E. Crowley (1995). "Influence of organic amendments on biodegradation of atrazine as a nitrogen source." Journal of environmental quality 24(6): 1156-1162.
Andersen, H., H. Siegrist, B. Halling-Sørensen and T. A. Ternes (2003). "Fate of Estrogens in a Municipal Sewage Treatment Plant." Environmental Science & Technology 37(18): 4021-4026.
Andreozzi, R., M. Raffaele and P. Nicklas (2003). "Pharmaceuticals in STP effluents and their solar photodegradation in aquatic environment." Chemosphere 50(10): 1319-1330.
Araujo, L., N. Villa, N. Camargo, M. Bustos, T. García and A. d. J. Prieto (2011). "Persistence of gemfibrozil, naproxen and mefenamic acid in natural waters." Environmental Chemistry Letters 9(1): 13-18.
Aronson, D., R. Boethling, P. Howard and W. Stiteler (2006). "Estimating biodegradation half-lives for use in chemical screening." Chemosphere 63(11): 1953-1960.
Atkinson, R. and J. Arey (2003). "Atmospheric degradation of volatile organic compounds." Chemical Reviews 108: 4605-4638
Avdeef, A. (2003). Absorption and drug development: solubility, permeability, and charged state. Hoboken, N.J., USA, Wiley.
Backhaus, T., J. Sumpter and H. Blanck (2008). On the Ecotoxicology of Pharmaceutical Mixtures. Pharmaceuticals in the Environment: Sources, Fate, Effects and Risks. K. Kümmerer. Berlin Heidelberg, Springer-Verlag: 258-276.
Baeza, C. and D. R. U. Knappe (2011). "Transformation Kinetics of Biochemically Active Compounds in Low-Pressure UV Photolysis and UV/H2O2 Advanced Oxidation Processes." Water Research 45: 4531-4543.
Baran, W., J. Sochacka and W. Wardas (2006). "Toxicity and biodegradability of sulfonamides and products of their photocatalytic degradation in aqueous solutions." Chemosphere 65(8): 1295-1299.
Baronti, C., R. Curini, G. D'Ascenzo, A. Di Corcia, A. Gentili and R. Samperi (2000). "Monitoring Natural and Synthetic Estrogens at Activated Sludge Sewage Treatment Plants and in a Receiving River Water." Environmental Science & Technology 34(24): 5059-5066.
Bibiography
Barron, L., J. Havel, M. Purcell, M. Szpak, B. Kelleher and B. Paull (2009). "Predicting sorption of pharmaceuticals and personal care products onto soil and digested sludge using artificial neural networks." Analyst 134(4): 663-670.
Barron, L., E. Nesterenko, K. Hart, E. Power, B. Quinn, B. Kelleher and B. Paull (2010). "Holistic visualisation of the multimodal transport and fate of twelve pharmaceuticals in biosolid enriched topsoils." Analytical and Bioanalytical Chemistry 397(1): 287-296.
Bendz, D., N. A. Paxéus, T. R. Ginn and F. J. Loge (2005). "Occurrence and fate of pharmaceutically active compounds in the environment, a case study: Höje River in Sweden." Journal of Hazardous Materials 122(3): 195-204.
Benner, J., E. Salhi, T. Ternes and U. von Gunten (2008). "Ozonation of reverse osmosis concentrate: Kinetics and efficiency of beta blocker oxidation." Water Research 42(12): 3003-3012.
Besse, J.-P. and J. Garric (2008). "Human pharmaceuticals in surface waters: Implementation of a prioritization methodology and application to the French situation." Toxicology Letters 176(2): 104-123.
Boreen, A. L., W. A. Arnold and K. McNeill (2003). "Photodegradation of pharmaceuticals in the aquatic environment: A review." Aquatic Sciences 65(4): 320-341.
Boreen, A. L., W. A. Arnold and K. McNeill (2004). "Photochemical Fate of Sulfa Drugs in the Aquatic Environment: Sulfa Drugs Containing Five-Membered Heterocyclic Groups." Environmental Science & Technology 38(14): 3933-3940.
Borgman, O. and B. Chefetz (2013). "Combined effects of biosolids application and irrigation with reclaimed wastewater on transport of pharmaceutical compounds in arable soils." Water Research 47(10): 3431-3443.
Boxall, A. B. A. (2008). Fate of Veterinary Medicines Applied to Soils. Pharmaceuticals in the Environment. Sources, Fate, Effects and Risks. K. Kümmerer. Berlin Heidelberg, Springer-Verlag: 103-119.
Brandes, L. J., H. den Hollander and D. van de Meent (1996). SimpleBox 2.0: A Nested Multimedia Fate Model for Evaluating the Environmental Fate of Chemicals. Bilthoven, the Netherlands, National Institute of Public Health and the Environment (RIVM).
Briggs, G. G., R. H. Bromilow and A. A. Evans (1982). "Relationships between lipophilicity and root uptake and translocation of non-ionised chemicals by barley." Pesticide Science 13(5): 495-504.
Brooks, B. W., P. K. Turner, J. K. Stanley, J. J. Weston, E. A. Glidewell, C. M. Foran, M. Slattery, T. W. La Point and D. B. Huggett (2003). "Waterborne and sediment toxicity of fluoxetine to select organisms." Chemosphere 52(1): 135-142.
Burkhard, L. P. (2000). "Estimating dissolved organic carbon partition coefficients for nonionic organic chemicals." Environmental Science & Technology 34(22): 4663-4668.
Calisto, V., M. R. M. Domingues and V. I. Esteves (2011). "Photodegradation of psychiatric pharmaceuticals in aquatic environments – Kinetics and photodegradation products." Water Research 45(18): 6097-6106.
Bibliography
157
Carball a, M., F. Omil , J. M. Lema, M. a. Llompart, C. Garcı ́a -Jares, I. Rodrı ́guez, M. Gómez and T. Ternes (2004). "Behavior of pharmaceuticals, cosmetics and hormones in a sewage treatment plant." Water Research 38(12): 2918-2926.
Carlsson, C., A.-K. Johansson, G. Alvan, K. Bergman and T. Kühler (2006). "Are pharmaceuticals potent environmental pollutants?: Part I: Environmental risk assessments of selected active pharmaceutical ingredients." Science of The Total Environment 364(1–3): 67-87.
Carreira, L. A., S. Ayyampalayam and J. Carreira (2009). SPARC On-Line Calculator, ARCHem, LP.
Cermola, F., M. DellaGreca, M. R. Iesce, S. Montanaro, L. Previtera and F. Temussi (2006). "Photochemical behavior of the drug atorvastatin in water." Tetrahedron 62(31): 7390-7395.
Choi, K., Y. Kim, J. Jung, M.-H. Kim, C.-S. Kim, N.-H. Kim and J. Park (2008). "Occurrences and ecological risks of roxithromycin, trimethoprim, and chloramphenicol in the Han River, Korea." Environmental Toxicology and Chemistry 27(3): 711-719.
Christen, V., S. Hickmann, B. Rechenberg and K. Fent (2010). "Highly active human pharmaceuticals in aquatic systems: A concept for their identification based on their mode of action." Aquatic Toxicology 96(3): 167-181.
Clara, M., N. Kreuzinger, B. Strenn, O. Gans and H. Kroiss (2005). "The solids retention time—a suitable design parameter to evaluate the capacity of wastewater treatment plants to remove micropollutants." Water Research 39(1): 97-106.
Clara, M., B. Strenn, M. Ausserleitner and N. Kreuzinger (2004). "Comparison of the behaviour of selected micropollutants in a membrane bioreactor and a conventional wastewater treatment plant." Water Science & Technology 50(5): 29-36.
Clara, M., B. Strenn, O. Gans, E. Martinez, N. Kreuzinger and H. Kroiss (2005). "Removal of selected pharmaceuticals, fragrances and endocrine disrupting compounds in a membrane bioreactor and conventional wastewater treatment plants." Water Research 39(19): 4797-4807.
Clarke, B. O. and S. R. Smith (2011). "Review of ‘emerging’ organic contaminants in biosolids and assessment of international research priorities for the agricultural use of biosolids." Environment International 37(1): 226-247.
Cleuvers, M.. (2003). "Aquatic ecotoxicity of pharmaceuticals including the assessment of combination effects." Toxicology Letters 142(3): 185-194.
Cleuvers, M. (2004). "Mixture toxicity of the anti-inflammatory drugs diclofenac, ibuprofen, naproxen, and acetylsalicylic acid." Ecotoxicology and Environmental Safety 59(3): 309-315.
Cleuvers, M. (2005). "Initial risk assessment for three beta-blockers found in the aquatic environment." Chemosphere 59(2): 199-205.
Coetsier, C. M., S. Spinelli, L. Lin, B. Roig and E. Touraud (2009). "Discharge of pharmaceutical products (PPs) through a conventional biological sewage treatment plant: MECs vs PECs?" Environment International 35(5): 787-792.
Conti, F., D. Cottica, S. Negri, A. Perissi and S. Stella (2011). Pharmaceuticals removal from urban wastewater by means of biological and physical–chemical treatments in full scale plants.
Bibiography
VI EWRA International Symposium, Water engineering and management in a changing environment, Catania.
Cunningham, V. L. (2008). Special Characteristics of Pharmaceuticals Related to Environmental Fate. Fate of Veterinary Medicines Applied to Soils. K. Kümmerer. Berlin Heidelberg, Springer-Verlag: 23-34.
Das, R., D. Vione, F. Rubertelli, V. Maurino, C. Minero, S. Barbati and S. Chiron (2010). "Modelling On Photogeneration Of Hydroxyl Radical In Surface Waters And Its Reactivity Towards Pharmaceutical Wastes." AIP Conference Proceedings 1298(1): 178-185.
De Liguoro, M., B. Fioretto, C. Poltronieri and G. Gallina (2009). "The toxicity of sulfamethazine to Daphnia magna and its additivity to other veterinary sulfonamides and trimethoprim." Chemosphere 75(11): 1519-1524.
DellaGreca, M., M. R. Iesce, M. Isidori, A. Nardelli, L. Previtera and M. Rubino (2007). "Phototransformation products of tamoxifen by sunlight in water. Toxicity of the drug and its derivatives on aquatic organisms." Chemosphere 67(10): 1933-1939.
Ding, J. Y. and S. C. Wu (1995). "Partition coefficients of organochlorine pesticides on soil and on the dissolved organic matter in water." Chemosphere 30(12): 2259-2266.
Doll, T. E. and F. H. Frimmel (2003). "Fate of pharmaceuticals--photodegradation by simulated solar UV-light." Chemosphere 52(10): 1757-1769.
Droge, S. and K.-U. Goss (2012). "Effect of Sodium and Calcium Cations on the Ion-Exchange Affinity of Organic Cations for Soil Organic Matter." Environmental Science & Technology.
Dussault, È. B., V. K. Balakrishnan, E. Sverko, K. R. Solomon and P. K. Sibley (2008). "Toxicity of human pharmaceuticals and personal care products to benthic invertebrates." Environmental Toxicology and Chemistry 27(2): 425-432.
EC (2003). Technical Guidance Document on Risk Assessment in support of Commission Directive 93/67/EEC on Risk Assessment for new notified substances, Commission Regulation (EC) No 1488/94 on Risk Assessment for existing substances and Directive 98/8/EC of the European Parliament and the Council concerning the placing of biocidal products on the market. E. Comission, European Chemicals Bureau.
EC (2004). European Union System for the Evaluation of Substances 2.0 (EUSES 2.0). Prepared for the European Chemicals Bureau by the National Institute of Public Health and the Environment (RIVM). Bilthoven, The Netherlands, European Commission.
EC (2011). European Commission, Joint Research Centre, Institute for Environment and Sustainability: International Reference Life Cycle Data System (ILCD) Handbook – Recommendations for Life Cycle Impact Assessment in the European context, 1st ed., Publications Office of the European Union, Luxemburg, 2011 (EUR 24571EN)
Bibliography
159
Edwards, M., E. Topp, C. D. Metcalfe, H. Li, N. Gottschall, P. Bolton, W. Curnoe, M. Payne, A. Beck, S. Kleywegt and D. R. Lapen (2009). "Pharmaceutical and personal care products in tile drainage following surface spreading and injection of dewatered municipal biosolids to an agricultural field." Science of the Total Environment 407(14): 4220-4230.
Eriksen, G., C. Amundsen, A. Bernhoft, T. Eggen, K. Grave, B. Halling-Sørensen, T. Källvist, T. Sogn and L. Sverdrup (2009). Risk assessment of contaminants in sewage sludge applied on Norwegian soils - Opinion from the Panel on Contaminants in the Norwegian Scientific Committee for Food Safety, Norwegian Scientific Committee for Food Safety (VKM).
Escher, B. I., R. Baumgartner, M. Koller, K. Treyer, J. Lienert and C. S. McArdell (2011). "Environmental toxicology and risk assessment of pharmaceuticals from hospital wastewater." Water Research 45(1): 75-92.
Escher, B. I., N. Bramaz, M. Richter and J. Lienert (2006). "Comparative ecotoxicological hazard assessment of beta-blockers and their human metabolites using a mode-of-action-based test battery and a QSAR approach." Environmental Science & Technology 40(23): 7402-7408.
Fass (2011). The Swedish Medicines Information Engine (www.fass.se), The Swedish Association of the Pharmaceutical Industry AB (LIF)
FDA (2009). Aliskiren/Valsartan Film-Coated Tablets, Food and Drug Administration Center for Drug Evaluation and Research
Fent, K., A. A. Weston and D. Caminada (2006). "Ecotoxicology of human pharmaceuticals." Aquatic Toxicology 76(2): 122-159.
Ferrari, B., R. Mons, B. Vollat, B. Fraysse, N. Paxeus, R. Lo Giudice, A. Pollio and J. Garric (2004). "Environmental risk assessment of six human pharmaceuticals: are the current environmental risk assessment procedures sufficient for the protection of the aquatic environment?" Environ Toxicol Chem 23(5): 1344-1354.
Franco, A., W. Fu and S. Trapp (2009). "Influence of soil pH on the sorption of ionizable chemicals: Modeling advances." Environmental Toxicology and Chemistry 28(3): 458-464.
Franco, A. and S. Trapp (2008). "Estimation of the soil-water partition coefficient normalized to organic carbon for ionizable organic chemicals." Environmental Toxicology and Chemistry 27(10): 1995-2004.
Fu, W., A. Franco and S. Trapp (2009). "Methods for estimating the bioconcentration factor of ionizable organic chemicals." Environmental Toxicology and Chemistry 28(7): 1372-1379.
Furczak, J. and J. Joniec (2007). "Preliminary study of sludge effect on soil microbial activity of a podzolic soil under willow culture." International Agrophysics 21(1): 39-48.
Golet, E. M., I. Xifra, H. Siegrist, A. C. Alder and W. Giger (2003). "Environmental Exposure Assessment of Fluoroquinolone Antibacterial Agents from Sewage to Soil." Environmental Science & Technology 37(15): 3243-3249.
Grimwood, M. J. and T. J. Dobbs (1995). "A review of the aquatic ecotoxicology of polychlorinated dibenzo-p-dioxins and dibenzofurans." Environmental Toxicology and Water Quality 10(1): 57-75.
Bibiography
Grung, M., T. Kallqvist, S. Sakshaug, S. Skurtveit and K. V. Thomas (2008). "Environmental assessment of Norwegian priority pharmaceuticals based on the EMEA guideline." Ecotoxicology and Environmental Safety 71(2): 328-340.
Gómez, M. J., M. J. Martínez Bueno, S. Lacorte, A. R. Fernández-Alba and A. Agüera (2007). "Pilot survey monitoring pharmaceuticals and related compounds in a sewage treatment plant located on the Mediterranean coast." Chemosphere 66(6): 993-1002.
Göbel, A., C. S. McArdell, A. Joss, H. Siegrist and W. Giger (2007). "Fate of sulfonamides, macrolides, and trimethoprim in different wastewater treatment technologies." Science of The Total Environment 372(2–3): 361-371.
Göbel, A., A. Thomsen, C. S. McArdell, A. Joss and W. Giger (2005). "Occurrence and Sorption Behavior of Sulfonamides, Macrolides, and Trimethoprim in Activated Sludge Treatment." Environmental Science & Technology 39(11): 3981-3989.
Han, G. H., H. G. Hur and S. D. Kim (2006). "Ecotoxicological risk of pharmaceuticals from wastewater treatment plants in Korea: occurrence and toxicity to Daphnia magna." Environ Toxicol Chem 25(1): 265-271.
Han, K. D., K. M. Bark, E. P. Heo, J. K. Lee, J. S. Kang and T. H. Kim (2000). "Increased phototoxicity of hydrochlorothiazide by photodegradation." Photodermatology, Photoimmunology & Photomedicine 16(3): 121-124.
Han, S., K. Choi, J. Kim, K. Ji, S. Kim, B. Ahn, J. Yun, K. Choi, J. S. Khim, X. Zhang and J. P. Giesy (2010). "Endocrine disruption and consequences of chronic exposure to ibuprofen in Japanese medaka (Oryzias latipes) and freshwater cladocerans Daphnia magna and Moina macrocopa." Aquatic Toxicology 98(3): 256-264.
Harada, A., K. Komori, N. Nakada, K. Kitamura and Y. Suzuki (2008). "Biological effects of PPCPs on aquatic lives and evaluation of river waters affected by different wastewater treatment levels." Water Science and Technology 58(8): 1541-1546.
Hauschild, M. (2007). "GM-troph: A Low Data Demand Ecotoxicity Effect Indicator for Use in LCIA (13+3 pp)." The International Journal of Life Cycle Assessment 12(2): 79-91.
Heijerick, D. G., B. B.T.A., K. A. C. De Schamphelaere, M. Indeherberg, M. Mingazzini and C. R. Janssen (2005). "Effect of Varying Physicochemistry of European Surface Waters on the Copper Toxicity to the Green Alga Pseudokirchneriella subcapitata." Ecotoxicology 14(6): 661-670.
Henschel, K. P., A. Wenzel, M. Diedrich and A. Fliedner (1997). "Environmental hazard assessment of pharmaceuticals." Regul Toxicol Pharmacol 25(3): 220-225.
Hernando, M., A. Agüera and A. Fernández-Alba (2007). "LC-MS analysis and environmental risk of lipid regulators." Analytical and Bioanalytical Chemistry 387(4): 1269-1285.
Hernando, M. D., M. Petrovic, A. R. Fernandez-Alba and D. Barcelo (2004). "Analysis by liquid chromatography-electrospray ionization tandem mass spectrometry and acute toxicity evaluation for beta-blockers and lipid-regulating agents in wastewater samples." J Chromatogr A 1046(1-2): 133-140.
Hilton, M. J. and K. V. Thomas (2003). "Determination of selected human pharmaceutical compounds in effluent and surface water samples by high-performance liquid chromatography–electrospray tandem mass spectrometry." Journal of Chromatography A 1015(1–2): 129-141.
Bibliography
161
Hospido, A., M. Carballa, M. Moreira, F. Omil, J. M. Lema and G. Feijoo (2010). "Environmental assessment of anaerobically digested sludge reuse in agriculture: Potential impacts of emerging micropollutants." Water Research 44(10): 3225-3233.
Huber, M. M., S. Canonica, G.-Y. Park and U. von Gunten (2003). "Oxidation of Pharmaceuticals during Ozonation and Advanced Oxidation Processes." Environmental Science & Technology 37(5): 1016-1024.
Huijbregts, M., M. Hauschild, O. Jolliet, M. Margni, T. McKone, R. K. Rosenbaum and D. van de Meent (2010). USEtox User Manual version 1.01, USEtox Team.
Huijbregts, M., M. M. Margni, D. van de Meent, O. J. Jolliet, R. K. Rosenbaum, T. M. McKone and M. Hauschild (2010) "USEtox Chemical-specific database: organics."
Huijbregts, M. A. J. (1999). Priority assessment of toxic substances - development and application of the multi-media fate, exposure and effect model USES-LCA, Universiteit van Amsterdam.
Huschek, G., P. D. Hansen, H. H. Maurer, D. Krengel and A. Kayser (2004). "Environmental risk assessment of medicinal products for human use according to European Commission recommendations." Environmental Toxicology 19(3): 226-240.
Isidori, M., M. Lavorgna, A. Nardelli, L. Pascarella and A. Parrella (2005). "Toxic and genotoxic evaluation of six antibiotics on non-target organisms." Science of The Total Environment 346(1-3): 87-98.
Isidori, M., A. Nardelli, L. Pascarella, M. Rubino and A. Parrella (2007). "Toxic and genotoxic impact of fibrates and their photoproducts on non-target organisms." Environment International 33(5): 635-641.
Jagodzinski, L., A. Magdeburg, J. Oehlmann and D. Stalter (2009). Neptune. New sustainable concepts and processes for optimization and upgrading municipal wastewater and sludge treatment. Work Package 4 - Assessment of environmental sustainability and best practice. Deliverable 3.2 · Data set of ecotoxicity testing in relevant treatment processes and additionally of two emerging contaminants. http://www.eu-neptune.org/Publications%20and%20Presentations/NEPTUNE_Deliverable_3_2_final_2_for_public.pdf.
Jelic, A., M. Gros, A. Ginebreda, R. Cespedes-Sánchez, F. Ventura, M. Petrovic and D. Barcelo (2011). "Occurrence, partition and removal of pharmaceuticals in sewage water and sludge during wastewater treatment." Water Research 45(3): 1165-1176.
Jeong, J., J. Jung, W. J. Cooper and W. Song (2010). "Degradation mechanisms and kinetic studies for the treatment of X-ray contrast media compounds by advanced oxidation/reduction processes." Water Research 44(15): 4391-4398.
Jolliet, O., M. Margni, R. Charles, S. Humbert, J. Payet, G. Rebitzer and R. Rosenbaum (2003). "IMPACT 2002+: A new life cycle impact assessment methodology." International Journal of Life Cycle Assessment 8(6): 324-330.
Jones, O. A. H., N. Voulvoulis and J. N. Lester (2002). "Aquatic environmental assessment of the top 25 English prescription pharmaceuticals." Water Research 36(20): 5013-5022.
Jones, R. J. A., R. Hiederer, E. Rusco and L. Montanarella (2005). "Estimating organic carbon in the soils of Europe for policy support." European Journal of Soil Science 56(5): 655-671.
Bibiography
Kah, M. and C. D. Brown (2007). "Prediction of the Adsorption of Ionizable Pesticides in Soils." Journal of Agricultural and Food Chemistry 55(6): 2312-2322.
Kahle, M., I. J. Buerge, A. Hauser, M. D. Müller and T. Poiger (2008). "Azole Fungicides: Occurrence and Fate in Wastewater and Surface Waters." Environmental Science & Technology 42(19): 7193-7200.
Kasprzyk-Hordern, B., R. M. Dinsdale and A. J. Guwy (2009). "The removal of pharmaceuticals, personal care products, endocrine disruptors and illicit drugs during wastewater treatment and its impact on the quality of receiving waters." Water Research 43(2): 363-380.
Khan, S. J. and J. E. Ongerth (2002). "Estimation of pharmaceutical residues in primary and secondary sewage sludge based on quantities of use and fugacity modelling." Water Science and Technology 46(3): 105–113.
Kim, J.-W., H.-S. Jang, J.-G. Kim, H. Ishibashi, M. Hirano, K. Nasu, N. Ichikawa, Y. Takao, R. Shinohara and K. Arizono (2009a). "Occurrence of Pharmaceutical and Personal Care Products (PPCPs) in Surface Water from Mankyung River, South Korea." Journal of Health Science 55(2): 249-258.
Kim, J.-W., H. Ishibashi, R. Yamauchi, N. Ichikawa, Y. Takao, M. Hirano, M. Koga and K. Arizono (2009b). "Acute toxicity of pharmaceutical and personal care products on freshwater crustacean (Thamnocephalus platyurus) and fish (Oryzias latipes)." The Journal of Toxicological Sciences 34(2): 227-232.
Kim, Y., K. Choi, J. Jung, S. Park, P.-G. Kim and J. Park (2007). "Aquatic toxicity of acetaminophen, carbamazepine, cimetidine, diltiazem and six major sulfonamides, and their potential ecological risks in Korea." Environment International 33(3): 370-375.
Kinney, C. A., E. T. Furlong, D. W. Kolpin, M. R. Burkhardt, S. D. Zaugg, S. L. Werner, J. P. Bossio and M. J. Benotti (2008). "Bioaccumulation of pharmaceuticals and other anthropogenic waste indicators in earthworms from agricultural soil amended with biosolid or swine manure." Environmental Science & Technology 42(6): 1863-1870.
Kinney, C. A., E. T. Furlong, S. L. Werner and J. D. Cahill (2006). "Presence and distribution of wastewater-derived pharmaceuticals in soil irrigated with reclaimed water." Environ Toxicol Chem 25(2): 317-326.
Kladna, A., H. Y. Aboul-Enein, I. Kruk, K. Lichszteld and T. Michalska (2006). "Scavenging of reactive oxygen species by some nonsteroidal anti-inflammatory drugs and fenofibrate." Biopolymers 82(2): 99-105.
Kulshrestha, P., R. F. Giese and D. S. Aga (2004). "Investigating the Molecular Interactions of Oxytetracycline in Clay and Organic Matter: Insights on Factors Affecting Its Mobility in Soil." Environmental Science & Technology 38(15): 4097-4105.
Kümmerer, K., J. F. Ericson, R. Hannah, A. Johnson, D. L. Sedlak and J. J. Weston (2005). Environmental Fate and Transport of Human Pharmaceuticals. Human Pharmaceuticals. Assessing the Impacts on Aquatic Ecosystems. R. T. Williams. Pensacola (FL), USA, Society of Environmental Toxicology and Chemistry (SETAC): 400.
Laganà, A., A. Bacaloni, I. De Leva, A. Faberi, G. Fago and A. Marino (2004). "Analytical methodologies for determining the occurrence of endocrine disrupting chemicals in sewage treatment plants and natural waters." Analytica Chimica Acta 501(1): 79-88.
Bibliography
163
Lam, M. W. and S. A. Mabury (2005). "Photodegradation of the pharmaceuticals atorvastatin, carbamazepine, levofloxacin, and sulfamethoxazole in natural waters." Aquatic Sciences - Research Across Boundaries 67(2): 177-188.
Lam, M. W., K. Tantuco and S. A. Mabury (2003). "PhotoFate: A new approach in accounting for the contribution of indirect photolysis of pesticides and pharmaceuticals in surface waters." Environmental Science & Technology 37(5): 899-907.
Lam, M. W., C. J. Young and S. A. Mabury (2004). "Aqueous Photochemical Reaction Kinetics and Transformations of Fluoxetine." Environmental Science & Technology 39(2): 513-522.
Langdon, K. A., M. S. U. Warne and R. S. Kookana (2010). "Aquatic Hazard Assessment for Pharmaceuticals, Personal Care Products, and Endocrine-Disrupting Compounds From Biosolids-Amended Land." Integrated Environmental Assessment and Management 6(4): 663-676.
Lapen, D. R., E. Topp, C. D. Metcalfe, H. Li, M. Edwards, N. Gottschall, P. Bolton, W. Curnoe, M. Payne and A. Beck (2008). "Pharmaceutical and personal care products in tile drainage following land application of municipal biosolids." Science of the Total Environment 399(1-3): 50-65.
Larsen, H. F. and M. Hauschild (2007a). "Evaluation of ecotoxicity effect indicators for use in LCIA." International Journal of Life Cycle Assessment 12(1): 24-33.
Larsen, H. F. and M. Hauschild (2007b). "GM-troph: A Low Data Demand Ecotoxicity Effect Indicator for Use in LCIA." The International Journal of Life Cycle Assessment 12(2): 79-91.
Larsen, H. F., S. I. Olsen, M. Hauschild and A. Laurent (2010a). Neptune. New sustainable concepts and processes for optimization and upgrading municipal wastewater and sludge treatment. Work Package 4 - Assessment of environmental sustainability and best practice. Deliverable 4.2 - Methodology for including specific biological effects and pathogen aspects into LCA. http://www.eu-neptune.org/Publications%20and%20Presentations/D4-2__NEPTUNE_Version_1-0.pdf.
Larsen, H. F., P. A. Hansen and F. Boyer-Souchet (2010b). Neptune. New sustainable concepts and processes for optimization and upgrading municipal wastewater and sludge treatment. Deliverable 4.3 - Decision support guideline based on LCA and cost/efficiency assessment. http://www.eu-neptune.org/Publications%20and%20Presentations/D4-3__NEPTUNE.pdf.
Latch, D. E., J. L. Packer, B. L. Stender, J. VanOverbeke, W. A. Arnold and K. McNeill (2005). "Aqueous photochemistry of triclosan: formation of 2,4-dichlorophenol, 2,8-dichlorodibenzo-p-dioxin, and oligomerization products." Environ Toxicol Chem 24(3): 517-525.
Latch, D. E., B. L. Stender, J. L. Packer, W. A. Arnold and K. McNeill (2003). "Photochemical Fate of Pharmaceuticals in the Environment: Cimetidine and Ranitidine." Environmental Science & Technology 37(15): 3342-3350.
Lertpaitoonpan, W., S. K. Ong and T. B. Moorman (2009). "Effect of organic carbon and pH on soil sorption of sulfamethazine." Chemosphere 76(4): 558-564.
Lin, A. Y. and M. Reinhard (2005). "Photodegradation of common environmental pharmaceuticals and estrogens in river water." Environ Toxicol Chem 24(6): 1303-1309.
Lin, K. and J. Gan (2011). "Sorption and degradation of wastewater-associated non-steroidal anti-inflammatory drugs and antibiotics in soils." Chemosphere 83(3): 240-246.
Bibiography
Lindqvist, N., T. Tuhkanen and L. Kronberg (2005). "Occurrence of acidic pharmaceuticals in raw and treated sewages and in receiving waters." Water Research 39(11): 2219-2228.
Liu, Q.-T., R. I. Cumming and A. D. Sharpe (2009). "Photo-induced environmental depletion processes of [small beta]-blockers in river waters." Photochemical & Photobiological Sciences 8(6): 768-777.
Liu, Q.-T. and H. E. Williams (2006). "Kinetics and Degradation Products for Direct Photolysis of β-Blockers in Water." Environmental Science & Technology 41(3): 803-810.
Liu, Q. T. and H. E. Williams (2007). "Kinetics and degradation products for direct photolysis of beta-blockers in water." Environ Sci Technol 41(3): 803-810.
Luo, X., Z. Zheng, J. Greaves, W. J. Cooper and W. Song (2012). "Trimethoprim: Kinetic and mechanistic considerations in photochemical environmental fate and AOP treatment." Water Research 46(4): 1327-1336.
Lyman, W. J., W. F. Reehl and D. H. Rosenblatt (1990). Handbook of Chemical Property Estimation Methods. Washington DC, American Chemical Society.
López-Serna, R., M. Petrović and D. Barceló (2012). "Occurrence and distribution of multi-class pharmaceuticals and their active metabolites and transformation products in the Ebro River basin (NE Spain)." Science of The Total Environment 440(0): 280-289.
Margni, M., D. W. Pennington, D. H. Bennett and O. Jolliet (2004). "Cyclic Exchanges and Level of Coupling between Environmental Media: Intermedia Feedback in Multimedia Fate Models." Environmental Science & Technology 38(20): 5450-5457.
Martin Ruel, S., M. Esperanza, J. M. Choubert, I. Valor, H. Budzinski and M. Coquery (2010). "On-site evaluation of the efficiency of conventional and advanced secondary processes for the removal of 60 organic micropollutants." Water Sci Technol 62(12): 2970-2978.
Maurer, M., B. I. Escher, P. Richle, C. Schaffner and A. C. Alder (2007). "Elimination of β-blockers in sewage treatment plants." Water Research 41(7): 1614-1622.
MEJ (2011). Results of Eco-toxicity tests of chemicals conducted by Ministry of the Environment in Japan, www.env.go.jp/chemi/sesaku/02e.pdf.
Mennigen, J. A., C. J. Martyniuk, K. Crump, H. Xiong, E. Zhao, J. Popesku, H. Anisman, A. R. Cossins, X. Xia and V. L. Trudeau (2008). "Effects of fluoxetine on the reproductive axis of female goldfish (Carassius auratus)." Physiological Genomics 35(3): 273-282.
Meybeck, M. (1982). "Carbon, nitrogen, and phosphorous transport by world rivers." American Journal of Science 282: 401-450.
Mompelat, S., B. Le Bot and O. Thomas (2009). "Occurrence and fate of pharmaceutical products and by-products, from resource to drinking water." Environment International 35(5): 803-814.
Monteiro, S. C. and A. B. A. Boxall (2009). "Factors Affecting the Degradation of Pharmaceuticals In Agricultural Soils." Environmental Toxicology and Chemistry 28(12): 2546-2554.
Bibliography
165
Montforts, M. H. M. M. (2005). The trigger values in the environmental risk assessment for (veterinary) medicines in the European Union: a critical appraisal Bilthoven, The Netherlands, Expert Centre for Substances of the RIVM.
Morais, S. A., C. Delerue-Matos and X. Gabarrell (2013a). "Accounting for the dissociating properties of organic chemicals in LCIA: An uncertainty analysis applied to micropollutants in the assessment of freshwater ecotoxicity." Journal of Hazardous Materials 248–249(0): 461-468.
Morais, S. A., C. Delerue-Matos, X. Gabarrell and P. Blánquez (2013b) "Multimedia fate modeling and comparative impact on freshwater ecosystems of pharmaceuticals from biosolids-amended soils." Chemosphere (93):252-262.
Müller, J.A., (2007). In: Spinosa, L., (Ed.), Wastewater sludge: a global overview of the current status and future prospects. IWA Publishing.
Munoz, I., M. J. Gomez-Ramos, A. Aguera, J. F. Garcia-Reyes, A. Molina-Diaz and A. R. Fernandez-Alba (2009). "Chemical evaluation of contaminants in wastewater effluents and the environmental risk of reusing effluents in agriculture." Trac-Trends in Analytical Chemistry 28(6): 676-694.
Nabholz, V. and K. Mayo-Bean (2009). ECOSAR, U.S. Environmental Protection Agency.
Nakamura, Y., H. Yamamoto, J. Sekizawa, T. Kondo, N. Hirai and N. Tatarazako (2008). "The effects of pH on fluoxetine in Japanese medaka (Oryzias latipes): acute toxicity in fish larvae and bioaccumulation in juvenile fish." Chemosphere 70(5): 865-873.
Nakonechny, M., K. Ikehata and M. Gamal El-Din (2008). "Kinetics of Estrone Ozone/Hydrogen Peroxide Advanced Oxidation Treatment." Ozone: Science & Engineering 30(4): 249-255.
Nalecz-Jawecki, G. and G. Persoone (2006). "Toxicity of selected pharmaceuticals to the anostracan crustacean Thamnocephalus platyurus: comparison of sublethal and lethal effect levels with the 1h Rapidtoxkit and the 24h Thamnotoxkit microbiotests." Environ Sci Pollut Res Int 13(1): 22-27.
NASA. (2011). "Space-based measurements of ozone and air quality in the ultraviolet and visible (http://ozoneaq.gsfc.nasa.gov/). National Aeronautics and Space Administration."
Nunes, B., F. Carvalho and L. Guilhermino (2005). "Acute toxicity of widely used pharmaceuticals in aquatic species: Gambusia holbrooki, Artemia parthenogenetica and Tetraselmis chuii." Ecotoxicology and Environmental Safety 61(3): 413-419.
OECD (1981). OECD Guidelines for Testing of Chemicals. OECD. Berlin: Umweltbundesant pp. 842.
Oldenkamp, R., M. A. J. Huijbregts, A. Hollander, A. Versporten, H. Goossens and A. M. J. Ragas (2013). "Spatially explicit prioritization of human antibiotics and antineoplastics in Europe." Environment International 51(0): 13-26.
OSPAR (2005). OSPAR Commission: Hazardous Substances Series: OSPAR background document on clotrimazole. OSPAR Publication 2005/199, 2005, ISBN 1-904426-38-7.
Bibiography
Ottmar, K. J., L. M. Colosi and J. A. Smith (2010). "Sorption of statin pharmaceuticals to wastewater-treatment biosolids, terrestrial soils, and freshwater sediment." Journal of Environmental Engineering 136(3): 256-264.
Packer, J. L., J. J. Werner, D. E. Latch, K. McNeill and W. A. Arnold (2003). "Photochemical fate of pharmaceuticals in the environment: Naproxen, diclofenac, clofibric acid, and ibuprofen." Aquatic Sciences 65(4): 342-351.
Park, S. and K. Choi (2008). "Hazard assessment of commonly used agricultural antibiotics on aquatic ecosystems." Ecotoxicology 17(6): 526-538.
Paxéus, N. (2004). "Removal of selected non-steroidal anti-inflammatory drugs (NSAIDs), gemfibrozil, carbamazepine, B-blockers, trimethoprim and triclosan in coventional wastewater treatment plants in five EU countries and their discharge to the aquatic environment." Water Science & Technology 50((5)): 253-260.
Payet, J. (2004). Assessing Toxic Impacts On Aquatic Ecossystems In Life Cycle Assessment (LCA). PhD, École Polytechnique Fédérale de Lausanne.
Payet, J. (2005). "Assessing Toxic Impacts on Aquatic Ecosystems in LCA." The International Journal of Life Cycle Assessment 10(5): 373-373.
Payet, J. and O. Jolliet (2005). Comparative assessment of the toxic impact of metals on aquatic ecosystems: the AMI Method. Life-cycle assessment of metals: issues and research directions. (Proceedings of the International Workshop on Life-Cycle Assessment and Metals. Montreal, Canada. 15-17 April 2002). A. Dubreuil. Pensacola, FL, USA, SETAC.
Pennington, D. W., M. Margni, C. Ammann and O. Jolliet (2005). "Multimedia fate and human intake modeling: Spatial versus nonspatial insights for chemical emissions in Western Europe." Environmental Science & Technology 39(4): 1119-1128.
Pereira, V. J., K. G. Linden and H. S. Weinberg (2007). "Evaluation of UV irradiation for photolytic and oxidative degradation of pharmaceutical compounds in water." Water Research 41(19): 4413-4423.
Prieto-Rodríguez, L., I. Oller, N. Klamerth, A. Agüera, E. M. Rodríguez and S. Malato (2013). "Application of solar AOPs and ozonation for elimination of micropollutants in municipal wastewater treatment plant effluents." Water Research 47(4): 1521-1528.
Quinn, B., F. Gagné and C. Blaise (2008). "The effects of pharmaceuticals on the regeneration of the cnidarian, Hydra attenuata." Science of The Total Environment 402(1): 62-69.
Quinn, B., F. Gagné and C. Blaise (2009). "Evaluation of the acute, chronic and teratogenic effects of a mixture of eleven pharmaceuticals on the cnidarian, Hydra attenuata." Science of The Total Environment 407(3): 1072-1079.
Quintana, J. B., S. Weiss and T. Reemtsma (2005). "Pathways and metabolites of microbial degradation of selected acidic pharmaceutical and their occurrence in municipal wastewater treated by a membrane bioreactor." Water Research 39(12): 2654-2664.
Radjenovic, J., M. Petrovic and D. Barcelo (2009). "Fate and distribution of pharmaceuticals in wastewater and sewage sludge of the conventional activated sludge (CAS) and advanced membrane bioreactor (MBR) treatment." Water Research 43(3): 831-841.
Bibliography
167
Radke, M., H. Ulrich, C. Wurm and U. Kunkel (2010). "Dynamics and Attenuation of Acidic Pharmaceuticals along a River Stretch." Environmental Science & Technology 44(8): 2968-2974.
Raymond, J. W., T. N. Rogers, D. R. Shonnard and A. A. Kline (2001). "A review of structure-based biodegradation estimation methods." Journal of Hazardous Materials 84(2): 189-215.
Razavi, B., S. Ben Abdelmelek, W. Song, K. E. O’Shea and W. J. Cooper (2011). "Photochemical fate of atorvastatin (lipitor) in simulated natural waters." Water Research 45(2): 625-631.
Razavi, B., W. Song, W. J. Cooper, J. Greaves and J. Jeong (2009). "Free-Radical-Induced Oxidative and Reductive Degradation of Fibrate Pharmaceuticals: Kinetic Studies and Degradation Mechanisms." The Journal of Physical Chemistry A 113(7): 1287-1294.
Real, F. J., J. L. Acero, F. J. Benitez, G. Roldán and L. C. Fernández (2010). "Oxidation of hydrochlorothiazide by UV radiation, hydroxyl radicals and ozone: Kinetics and elimination from water systems." Chemical Engineering Journal 160(1): 72-78.
Reif, R., S. Suárez, F. Omil and J. M. Lema (2008). "Fate of pharmaceuticals and cosmetic ingredients during the operation of a MBR treating sewage." Desalination 221(1–3): 511-517.
Reuter, H. I., L. R. Lado, T. Hengl and L. Montanarella (2008). Continental-cale digital soil mapping using european soil profile data: soil pH. SAGA – Seconds Out. Hamburger Beiträge zur Physischen Geographie und Landschaftsökologie. T. B. L. M. Jürgen Böhner, Institut für Geographie der Universität Hamburg 19: 113.
Richardson, M. L. and J. M. Bowron (1985). "The fate of pharmaceutical chemicals in the aquatic environment." J Pharm Pharmacol 37(1): 1-12.
Roberts, P. H. and K. V. Thomas (2006). "The occurrence of selected pharmaceuticals in wastewater effluent and surface waters of the lower Tyne catchment." Science of The Total Environment 356(1–3): 143-153.
Rodrı ́guez, I ., J. B. Quintana, J. Carpinteiro, A. M. Carro, R. A. Lorenzo and R. Cela (2003). "Determination of acidic drugs in sewage water by gas chromatography–mass spectrometry as tert.-butyldimethylsilyl derivatives." Journal of Chromatography A 985(1–2): 265-274.
Rodríguez-Rodríguez, C. E., A. Jelic, M. Llorca, M. Farré, G. Caminal, M. Petrovic, D. Barceló and T. Vicent (2011). "Solid-phase treatment with the fungus Trametes versicolor substantially reduces pharmaceutical concentrations and toxicity from sewage sludge." Bioresource Technology 102(10): 5602-5608.
Rodríguez-Rodríguez, C. E., A. Jelić, M. A. Pereira, D. Z. Sousa, M. Petrović, M. M. Alves, D. Barceló, G. Caminal and T. Vicent (2012). "Bioaugmentation of Sewage Sludge with Trametes versicolor in Solid-Phase Biopiles Produces Degradation of Pharmaceuticals and Affects Microbial Communities." Environmental Science & Technology 46(21): 12012-12020.
Rosal, R., A. Rodríguez, J. A. Perdigón-Melón, A. Petre, E. García-Calvo, M. J. Gómez, A. Agüera and A. R. Fernández-Alba (2010a). "Occurrence of emerging pollutants in urban wastewater and their removal through biological treatment followed by ozonation." Water Research 44(2): 578-588.
Rosal, R., I. Rodea-Palomares, K. Boltes, F. Fernández-Piñas, F. Leganés, S. Gonzalo and A. Petre (2010b). "Ecotoxicity assessment of lipid regulators in water and biologically treated
Bibiography
wastewater using three aquatic organisms." Environmental Science and Pollution Research 17(1): 135-144.
Rosenbaum, R. (2006). Multimedia and food chain modelling of toxics for comparative risk and life cycle assessment. PhD-‐thesis, École Polythecnique de Fédérale de Lausanne.
Rosenbaum, R. K., T. M. Bachmann, L. S. Gold, M. A. J. Huijbregts, O. Jolliet, R. Juraske, A. Koehler, H. F. Larsen, M. MacLeod, M. Margni, T. E. McKone, J. Payet, M. Schuhmacher, D. van de Meent and M. Z. Hauschild (2008). "USEtox-the UNEP-SETAC toxicity model: recommended characterisation factors for human toxicity and freshwater ecotoxicity in life cycle impact assessment." International Journal of Life Cycle Assessment 13(7): 532-546.
Rosenbaum, R. K., M. Margni and O. Jolliet (2007). "A flexible matrix algebra framework for the multimedia multipathway modeling of emission to impacts." Environment International 33(5): 624-634.
Rosenfeldt, E. J. and K. G. Linden (2004). "Degradation of Endocrine Disrupting Chemicals Bisphenol A, Ethinyl Estradiol, and Estradiol during UV Photolysis and Advanced Oxidation Processes." Environmental Science & Technology 38(20): 5476-5483.
Rua-Gomez, P. C. and W. Puttmann (2013). "Degradation of lidocaine, tramadol, venlafaxine and the metabolites O-desmethyltramadol and O-desmethylvenlafaxine in surface waters." Chemosphere 90(6): 1952-1959.
Röhricht, M., J. Krisam, U. Weise, U. R. Kraus and R.-A. Düring (2009). "Elimination of Carbamazepine, Diclofenac and Naproxen from Treated Wastewater by Nanofiltration." CLEAN – Soil, Air, Water 37(8): 638-641.
Sabourin, L., A. Beck, P. W. Duenk, S. Kleywegt, D. R. Lapen, H. X. Li, C. D. Metcalfe, M. Payne and E. Topp (2009). "Runoff of pharmaceuticals and personal care products following application of dewatered municipal biosolids to an agricultural field." Science of the Total Environment 407(16): 4596-4604.
Sanchez-Prado, L., M. Llompart, M. Lores, C. García-Jares, J. M. Bayona and R. Cela (2006). "Monitoring the photochemical degradation of triclosan in wastewater by UV light and sunlight using solid-phase microextraction." Chemosphere 65(8): 1338-1347.
Sanderson, H., D. J. Johnson, T. Reitsma, R. A. Brain, C. J. Wilson and K. R. Solomon (2004). "Ranking and prioritization of environmental risks of pharmaceuticals in surface waters." Regulatory Toxicology and Pharmacology 39(2): 158-183.
Sanderson, H. and M. Thomsen (2007). "Ecotoxicological Quantitative Structure–Activity Relationships for Pharmaceuticals." Bulletin of Environmental Contamination and Toxicology 79(3): 331-335.
Sanderson, H. and M. Thomsen (2009). "Comparative analysis of pharmaceuticals versus industrial chemicals acute aquatic toxicity classification according to the United Nations classification system for chemicals. Assessment of the (Q)SAR predictability of pharmaceuticals acute aquatic toxicity and their predominant acute toxic mode-of-action." Toxicology Letters 187(2): 84-93.
Santos, J. L., I. Aparicio and E. Alonso (2007). "Occurrence and risk assessment of pharmaceutically active compounds in wastewater treatment plants. A case study: Seville city (Spain)." Environment International 33(4): 596-601.
Bibliography
169
Santos, J. L., I. Aparicio, M. Callejón and E. Alonso (2009). "Occurrence of pharmaceutically active compounds during 1-year period in wastewaters from four wastewater treatment plants in Seville (Spain)." Journal of Hazardous Materials 164(2–3): 1509-1516.
Santos, L., A. N. Araujo, A. Fachini, A. Pena, C. Delerue-Matos and M. Montenegro (2010). "Ecotoxicological aspects related to the presence of pharmaceuticals in the aquatic environment." Journal of Hazardous Materials 175(1-3): 45-95.
Schmitt-Jansen, M., P. Bartels, N. Adler and R. Altenburger (2007). "Phytotoxicity assessment of diclofenac and its phototransformation products." Analytical and Bioanalytical Chemistry 387(4): 1389-1396.
Song, W., W. J. Cooper, S. P. Mezyk, J. Greaves and B. M. Peake (2008). "Free radical destruction of beta-blockers in aqueous solution." Environmental Science & Technology 42(4): 1256-1261.
Steen, B. (1997). "On uncertainty and sensitivity of LCA-based priority setting." Journal of Cleaner Production 5(4): 255-262.
Stuer-Lauridsen, F., M. Birkved, L. P. Hansen, H. C. Holten Lützhøft and B. Halling-Sørensen (2000). "Environmental risk assessment of human pharmaceuticals in Denmark after normal therapeutic use." Chemosphere 40(7): 783-793.
Suarez, S., J. M. Lema and F. Omil (2010). "Removal of Pharmaceutical and Personal Care Products (PPCPs) under nitrifying and denitrifying conditions." Water Research 44(10): 3214-3224.
Suzuki, Y., K. Komori, N. Nakada and A. Harada (2009). Status of Pharmaceuticals and Personal Care Products (PPCPs) in River Water and Wastewater and Evaluation of their Effects on AquaticOrganisms. 5th Japan-U.S. Governmental Conference on Drinking Water Quality Management and Wastewater Control, Las Vegas.
Suárez, S., M. Ramil, F. Omil and J. M. Lema (2005). "Removal of pharmaceutically active compounds in nitrifying-denitrifying plants." Water Sci Technol 52(8): 9-14.
Tabak, H. H. and R. L. Bunch (1970). "Steroid hormones as water pollutants." Dev Ind Microbiol 41(10): 735-736.
Tarazona, J. V., B. I. Escher, E. Giltrow, J. Sumpter and T. Knacker (2010). "Targeting the environmental risk assessment of pharmaceuticals: Facts and fantasies." Integrated Environmental Assessment and Management 6(S1): 603-613.
Tauxe-Wuersch, A., L. F. De Alencastro, D. Grandjean and J. Tarradellas (2005). "Occurrence of several acidic drugs in sewage treatment plants in Switzerland and risk assessment." Water Research 39(9): 1761-1772.
Ternes, T. A. (1998). "Occurrence of drugs in German sewage treatment plants and rivers." Water Research 32(11): 3245-3260.
Ternes, T. A., M. Bonerz, N. Herrmann, B. Teiser and H. R. Andersen (2007). "Irrigation of treated wastewater in Braunschweig, Germany: An option to remove pharmaceuticals and musk fragrances." Chemosphere 66(5): 894-904.
Bibiography
Ternes, T. A., J. Stüber, N. Herrmann, D. McDowell, A. Ried, M. Kampmann and B. Teiser (2003). "Ozonation: a tool for removal of pharmaceuticals, contrast media and musk fragrances from wastewater?" Water Research 37(8): 1976-1982.
Thiele-Bruhn, S. and I.-C. Beck (2005). "Effects of sulfonamide and tetracycline antibiotics on soil microbial activity and microbial biomass." Chemosphere 59(4): 457-465.
Thomas, K. V. and M. J. Hilton (2004). "The occurrence of selected human pharmaceutical compounds in UK estuaries." Marine Pollution Bulletin 49(5–6): 436-444.
Tixier, C., H. P. Singer, S. Canonica and S. R. Müller (2002). "Phototransfomation of ticlosan in surface waters: a relevant elimination process for this widely used biocide--laboratory studies, field measurements, and modeling." Environmental Science Technology 36(16): 3482-3489.
Tong, L., P. Eichhorn, S. Pérez, Y. Wang and D. Barceló (2011). "Photodegradation of azithromycin in various aqueous systems under simulated and natural solar radiation: Kinetics and identification of photoproducts." Chemosphere 83(3): 340-348.
Topp, E., S. C. Monteiro, A. Beck, B. B. Coelho, A. B. A. Boxall, P. W. Duenk, S. Kleywegt, D. R. Lapen, M. Payne, L. Sabourin, H. X. Li and C. D. Metcalfe (2008). "Runoff of pharmaceuticals and personal care products following application of biosolids to an agricultural field." Science of the Total Environment 396(1): 52-59.
Trapp, S. (2009). Bioaccumulation of polar and ionizable compounds in plants. Ecotoxicology Modeling, Emerging Topics in Ecotoxicology: Principles, Approaches and Perspectives 2. J. Devillers. New York, Springer.
Truhaut, R. (1977). "Ecotoxicology: objectives, principles and perspectives." Ecotoxicol Environ Saf 1(2): 151-173.
U.N. (2003). Consolidated list of products whose consumption and or sale have been banned, withdrawn, severely restricted or not approved by governments: pharmaceuticals. New York, United Nations.
Ulvi, V. (1998). "Spectrophotometric studies on the photostability of some thiazide diuretics in ethanolic solution." J. Pharm. Biomed. Anal. 17(1): 77-82.
USEPA (1999). GCSOLAR, 1.2, US Environmental Protection Agency.
USEPA (2007). ECOTOX Database Release 4.0, US Environmental Protection Agency.
USEPA (2008). BCFBAF, U.S. Environmental Protection Agency.
USEPA (2008). Estimation Program Interface (EPI) Suite, U.S. Environmental Protection Agency.
USEPA (2008). KOWWIN, U.S. Environmental Protection Agency.
USEPA (2009). BIOWIN, U.S. Environmental Protection Agency.
USEPA (2009). KOCWIN, U.S. Environmental Protection Agency.
USNLM (2011). TOXNET - Toxicity Data Network, U.S. National Library of Medicine.
Bibliography
171
van den Brandhof, E.-J. and M. Montforts (2010). "Fish embryo toxicity of carbamazepine, diclofenac and metoprolol." Ecotoxicology and Environmental Safety 73(8): 1862-1866.
van Zelm, R., M. A. J. Huijbregts, J. V. Harbers, A. Wintersen, J. Struijs, L. Posthuma and D. van de Meent (2007). "Uncertainty in msPAF-based ecotoxicological effect factors for freshwater ecosystems in life cycle impact assessment." Integrated Environmental Assessment and Management 3(4): e6-e37.
van Zelm, R., M. A. J. Huijbregts and D. van de Meent (2009). "USES-LCA 2.0-a global nested multi-media fate, exposure, and effects model." International Journal of Life Cycle Assessment 14(3): 282-284.
Van Zelm, R. (2010a). Damage Modeling in life cycle impact assessment. PhD-‐thesis, Radboud University.
van Zelm, R., M. A. J. Huijbregts and D. van de Meent (2010b). "Transformation Products in the Life Cycle Impact Assessment of Chemicals." Environmental Science & Technology 44(3): 1004-1009.
Verlicchi, P., M. Al Aukidy and E. Zambello (2012). "Occurrence of pharmaceutical compounds in urban wastewater: Removal, mass load and environmental risk after a secondary treatment—A review." Science of The Total Environment 429(0): 123-155.
Vieno, N. M., T. Tuhkanen and L. Kronberg (2005). "Seasonal Variation in the Occurrence of Pharmaceuticals in Effluents from a Sewage Treatment Plant and in the Recipient Water." Environmental Science & Technology 39(21): 8220-8226.
Vione, D., J. Feitosa-Felizzola, C. Minero and S. Chiron (2009). "Phototransformation of selected human-used macrolides in surface water: kinetics, model predictions and degradation pathways." Water Resources 43(7): 1959-1967.
Vogna, D., R. Marotta, R. Andreozzi, A. Napolitano and M. d’Ischia (2004). "Kinetic and chemical assessment of the UV/H2O2 treatment of antiepileptic drug carbamazepine." Chemosphere 54(4): 497-505.
Webb, S. F. (2004). A Data-based Perspective on the Environmental Risk Assessment of Human Pharmaceuticals I - Collation of Available Ecotoxicity Data. Pharmaceuticals in the Environment. Sources, Fate, Effects and Risks. K. Kümmerer. Berlin, Springer: 345-361.
Werner, J. J., K. McNeill and W. A. Arnold (2005). "Environmental photodegradation of mefenamic acid." Chemosphere 58(10): 1339-1346.
West, C. E. (2007). The Photodegradation of Diazepam and its Human Metabolites in Water. PhD, University of Plymouth.
Wick, A., G. Fink, A. Joss, H. Siegrist and T. A. Ternes (2009). "Fate of beta blockers and psycho-active drugs in conventional wastewater treatment." Water Research 43(4): 1060-1074.
Williams, C. F., C. F. Williams and F. J. Adamsen (2006). "Sorption-desorption of carbamazepine from irrigated soils." Journal of Environmental Quality 35(5): 1779-1783.
Wu, C., A. L. Spongberg and J. D. Witter (2008). "Determination of the persistence of pharmaceuticals in biosolids using liquid-chromatography tandem mass spectrometry." Chemosphere 73(4): 511-518.
Bibiography
Wu, C., A. L. Spongberg, J. D. Witter, M. Fang, K. P. Czajkowski and A. Ames (2010). "Dissipation and Leaching Potential of Selected Pharmaceutically Active Compounds in Soils Amended with Biosolids." Archives of Environmental Contamination and Toxicology 59(3): 343-351.
Wu, C. X., A. L. Spongberg and J. D. Witter (2009). "Sorption and biodegradation of selected antibiotics in biosolids." Journal of Environmental Science and Health Part a-Toxic/Hazardous Substances & Environmental Engineering 44(5): 454-461..
Wu, X., L. R. Whitfield and B. H. Stewart (2000). "Atorvastatin Transport in the Caco-2 Cell Model: Contributions of P-Glycoprotein and the Proton-Monocarboxylic Acid Co-Transporter." Pharmaceutical Research 17(2): 209-215.
Xu, J., L. Wu, W. Chen and A. Chang (2009a). "Adsorption and degradation of ketoprofen in soils." Journal of Environmental Quality 38(3): 1177-1182.
Xu, J., L. S. Wu and A. C. Chang (2009b). "Degradation and adsorption of selected pharmaceuticals and personal care products (PPCPs) in agricultural soils." Chemosphere 77(10): 1299-1305.
Yamamoto, H., Y. Nakamura, S. Moriguchi, Y. Honda, I. Tamura, Y. Hirata, A. Hayashi and J. Sekizawa (2009). "Persistence and partitioning of eight selected pharmaceuticals in the aquatic environment: Laboratory photolysis, biodegradation, and sorption experiments." Water Research 43(2): 351-362.
Yamamoto, H., Y. Nakamura, Y. Nakamura, C. Kitani, T. Imari, J. Sekizawa, Y. Takao, N. Yamashita, N. Hirai, S. Oda and N. Tatarazako (2007). "Initial ecological risk assessment of eight selected human pharmaceuticals in Japan." Environmental Sciences 14(4): 177-193.
Yang, Y.-Y., J. L. Gray, E. T. Furlong, J. G. Davis, R. C. ReVello and T. Borch (2012). "Steroid Hormone Runoff from Agricultural Test Plots Applied with Municipal Biosolids." Environmental Science & Technology 46(5): 2746-2754.
Yuan, F., C. Hu, X. X. Hu, J. H. Qu and M. Yang (2009). "Degradation of selected pharmaceuticals in aqueous solution with UV and UV/H(2)O(2)." Water Research 43(6): 1766-1774.
Zorita, S., L. Mårtensson and L. Mathiasson (2009). "Occurrence and removal of pharmaceuticals in a municipal sewage treatment system in the south of Sweden." Science of The Total Environment 407(8): 2760-2770.
Zuehlke, S., U. Duennbier and T. Heberer (2005). "Determination of estrogenic steroids in surface water and wastewater by liquid chromatography–electrospray tandem mass spectrometry." Journal of Separation Science 28(1): 52-58.
.
List of Figures
173
List of figures Figure 1: Five-compartment system for the dissipation of pharmaceuticals from
biosolids-amended soils. ................................................................................................. 32
Figure 2: Probability distribution mean and 90% confidence interval of overall transfer
fraction to freshwater of the detected pharmaceuticals in function of the probability
distribution mean of logKOC. .......................................................................................... 39
Figure 3: Probability distribution mean and 95% confidence interval of the residence
time in the freshwater compartment of the detected pharmaceuticals. ........................... 40
Figure 4: Probability distribution mean and 95% confidence interval of the impact on
freshwater ecosystems from the detected pharmaceuticals per m3 of dry weight
biosolids. ......................................................................................................................... 41
Figure 5: Five-compartment system for the dissipation of micropollutants from A) direct
emission to freshwater of WWTP effluent, B) emission to agricultural soil of WWTP
effluent as reclaimed water, C) emission to agricultural soil of biosolids as soil-
amendment.. .................................................................................................................... 50
Figure 6: Probability distribution median and 95% confidence interval of ecotoxicity
impacts on freshwater, in PAF.m3.day, for: A) direct emission of micropollutants to
freshwater per m3 of WWTP effluent, B) emission of micropollutants to agricultural soil
per m3 of WWTP effluent as reclaimed water, C) emission of micropollutants to
agricultural soil per kg of biosolids as soil-amendment. ................................................ 60
Figure 7: Three-compartment system for the dissipation of pharmaceuticals from direct
emissions to freshwater of WWTP effluents. ................................................................. 68
Figure 8: Probability distribution median and 95% confidence interval of ecotoxicity
impacts on freshwater, in PAF m3 day, of PCs per m3 of WWTP effluent. ................... 76
Figure 9: Contribution to variance of total freshwater ecotoxicity impact. .................... 77
Figure 10: Contribution of model parameters to impact variance of PCs of most
concern. ........................................................................................................................... 78
Figure 11: Five-compartment system for the dissipation of pharmaceuticals from A)
emission to agricultural soil of WWTP biosolids, B) emission to agricultural soil of
WWTP effluents, and C) direct emission to freshwater of WWTP effluents. ............... 89
Figure 12: Probability distribution median and 95% confidence interval of ecotoxicity
impacts of PC’s on freshwater, in PAF m3 day, per m3 of WWTP effluent as reclaimed
water for irrigation in agricultural soils. ......................................................................... 92
List of Figures
Figure 13: Contribution of PC’s to variance of total freshwater ecotoxicity impact for
the reclaimed water pathway .......................................................................................... 93
Figure 14: Contribution of model parameters to impact variance of PCs of most concern
for the reclaimed water pathway. ................................................................................... 94
Figure 15: Probability distribution median and 95% confidence interval of ecotoxicity
impacts of PC’s on freshwater, in PAF m3 day, per kg of WWTP biosolids (dry matter)
as agricultural soil amendment. ...................................................................................... 99
Figure 16: Contribution of PC’s to variance of total freshwater ecotoxicity impact for
the biosolids pathway ................................................................................................... 100
Figure 17: Contribution of model parameters to impact variance of PCs of most concern
for the biosolids pathway. ............................................................................................. 101
List of Tables
175
List of tables Table 1: Structures, molecular acidity, and concentrations of detected pharmaceuticals
in dewatered municipal biosolids ................................................................................... 30
Table 2: Contribution of model parameters to impact results variance for each
compound. Negative indices indicate that an increase in the parameter is associated with
a decrease in the output result. ........................................................................................ 43
Table 3: Probability distributions for the 16 regression error parameters (a1-a16),
experimental KOC values, experimental biodegradation rates (kbiodeg, water, kbiodeg, soil),
experimental bimolecular ˙OH rate constants in water (kOH, water), and environmental
parameters (pH and foc in agricultural soil, [˙OH] in freshwater, and rain rate) included
in the Monte Carlo simulation. . ..................................................................................... 56
Table 4: Probabilistic characterization factors of freshwater ecotoxicity for three
emission scenarios in PAF.m3.day.kgemitted-1 .................................................................. 59
Table 5: Summary of differences of USEtox results relatively to the alternative
approach. ......................................................................................................................... 62
Table 6: Research topics for PCs of most concern ......................................................... 82
Table 7: Research topics for PCs of most concern for the biosolids (‡) and reclaimed
water (†) pathways. ........................................................................................................ 104
Table 8: Bulk transport rate coefficients matrix. Indices b, ag, a, fw, fws, sw and sws
describe the illustrative compartments biosolids, agricultural soil, air, freshwater, and
freshwater sediment. ..................................................................................................... 116
Table 9: Fate factors matrix .......................................................................................... 117
Table 10: Experimental logKOC values, biodegradation half-lives in freshwater and soil,
direct photolysis quantum yields and biomolecular hydroxyl radical rate constants in
water. ............................................................................................................................ 122
Table 11: Acute L(E)C50s values in mg/L for the compounds under study ................ 125
Table 12: Probability distributions for the 10 regression error parameters (a1-a10),
experimental KOC values, experimental biodegradation rates (kbiodeg, water, kbiodeg, soil),
experimental bimolecular ˙OH rate constants in water (kOH, water), and environmental
parameters (pH and foc in agricultural soil, [˙OH] in freshwater, and rain rate) included
in the Monte Carlo simulation. ..................................................................................... 127
Table 13: Concentration of micropollutants in a conventional WWTP ....................... 128
List of Tables
Table 14: Experimental logKOC values, biodegradation half-lives in freshwater and soil,
direct photolysis quantum yields and biomolecular hydroxyl radical rate constants in
water. ............................................................................................................................ 129
Table 15: Contribution to sensitivity of characterization factor results for each
compound for the emission to agricultural soil as reclaimed water scenario. .............. 130
Table 16: Contribution to sensitivity of characterization factor results for each
compound for the direct emission to freshwater scenario. ........................................... 131
Table 17: Estimated concentration of PC’s in biosolids and reported concentration of
PC’s on WWTPs effluents and influents ...................................................................... 133
Table 18: Experimental log KOC values, biodegradation half-lives in freshwater and soil,
hydrolysis half-lives in freshwater, direct photolysis quantum yields and biomolecular
hydroxyl radical rate constants in water. ...................................................................... 141
Table 19: Ecotoxicity data for PCs under study ........................................................... 143
Table 20: Probability distributions for the 10 regression error parameters (a1-a10),
photodegradation rates, experimental KOC values, experimental biodegradation rates in
water and soil (kbiodeg, water and kbiodeg, water), experimental bimolecular ˙OH rate constants
in water (kOH, water), and environmental parameters (rain rate, fraction of organic matter
in agricultural soil, pH in freshwater and agricultural soil, and concentrations of
dissolved organic carbon (DOC), suspended matter (SM), and ˙OH in freshwater)
included in the Monte Carlo simulation. ...................................................................... 151