Embed Size (px)
Citation preview
A THEORETICAL MODEL OF NITRIFICATION IN FLOATING-BEAD FILTERS
by
William J. Golz
M.S. Thesis, Louisiana State University, 1997

ii
Copyright 1997
William Johnathan Golz
All rights reserved
W. J. Golz / M.S. Thesis, Louisiana State University, 1997
iii
Table of Contents
List of Tables ..............................................................................................................................v
List of Figures ............................................................................................................................vi
Abstract ....................................................................................................................................vii
Introduction.................................................................................................................................1
Objectives .............................................................................................................................3
Literature Review ........................................................................................................................4
Nitrification in Combined Systems.........................................................................................4
Experimental Studies.......................................................................................................5
Numerical Models...........................................................................................................8
Interspecific Competition in Multispecies Biofilms.........................................................10
Monod Kinetics.............................................................................................................13
Solids and Mean-Cell Residence Times................................................................................14
FBFs: Solids Capture and Biofiltration in RASs...................................................................15
Aquacultural Waste Production and Characteristics.......................................................15
Solids Decay.................................................................................................................16
Insitu Nitrification.........................................................................................................18
Floating-Bead Filters.....................................................................................................18
Summary: Potential Limitations on Oxygen Delivery and Transport .....................................19
Model Development...................................................................................................................23
Primary Solids ....................................................................................................................25
Biomass ..............................................................................................................................26
Total Solids.........................................................................................................................28
TAN ...................................................................................................................................28
BOD5 ..................................................................................................................................30
Dissolved Oxygen ...............................................................................................................30
Limits of the Model .............................................................................................................31
Model Calibration......................................................................................................................34
Calibration Against the BBF................................................................................................35
Calibration Against the PBF................................................................................................37
Summary ............................................................................................................................38
Results and Discussion ..............................................................................................................39
The Effects of Backwash Interval on Nitrification Rate in a Gently-Washed Filter................40
The Effects of Backwash Interval on Nitrification Rate in an Aggressively-Washed Filter.....41
Summary ............................................................................................................................43
W. J. Golz / M.S. Thesis, Louisiana State University, 1997
iv
Conclusions...............................................................................................................................45
Solids Limitations ...............................................................................................................45
Backwash-Regime Limitations.............................................................................................45
Recommendations......................................................................................................................46
Model Improvements ...........................................................................................................46
Filter Improvements ............................................................................................................46
References.................................................................................................................................47
Appendixes
A. BBF-System Model Values ...........................................................................................51
B. PBF-System Model Values............................................................................................53
C. Model Excretion Rates, Waste Characteristics, and Kinetic Constants............................55
D. VisSimTM Model ...........................................................................................................57
E. Model Calibration Output .............................................................................................65
W. J. Golz / M.S. Thesis, Louisiana State University, 1997
v
List of Tables
1. Definitions of variables........................................................................................................32
2. BBF calibration variables ....................................................................................................35
3. Comparison of predicted and experimental values for the BBF .............................................36
4. PBF calibration variables ....................................................................................................37
5. Comparison of predicted and experimental values for the PBF..............................................38
W. J. Golz / M.S. Thesis, Louisiana State University, 1997
vi
List of Figures
1. Gently-washed BBF, during backwashing ..............................................................................2
2. Aggressively-washed PBF, during backwashing. ....................................................................2
3. Influence of backwash interval on nitrification rate in a BBF and a PBF.................................3
4. Effect of influent BOD5 on RBC NH4+-N removal..................................................................5
5. Effect of short-term DO and COD variations on NH4+-N removal in a trickling filter ..............6
6. Relationship of COD loading to removal rate .........................................................................7
7. Effect of COD removal on zero-order nitrification..................................................................7
8. Predicted species distributions for increasing acetate concentrations (1.5 mg/NH4+ -N/L) ........9
9. Modeled nitrification rate as a function of measured oxygen concentration............................10
10. Steady-state substrate profiles in a heterotrophic-autotrophic biofilm....................................11
11. Biofilm NH4+-N and NO3
--N profiles at low DO concentrations............................................11
12. Effect of increased glucose on biofilm DO and NH4+-N profiles............................................12
13. Critical depth as a function of biofilm thickness ...................................................................12
14. Density as a function of biofilm thickness ............................................................................12
15. Model mass-balance diagram showing major fluxes .............................................................24
16. KSO versus biomass respiration and flow rate .......................................................................39
17. Solids concentration and flow rate in the BBF......................................................................40
18. Modeled oxygen consumption in the BBF ............................................................................41
19. Modeled CA in the BBF .......................................................................................................41
20. Solids concentration and flow rate in the PBF ......................................................................42
21. Modeled oxygen consumption in the PBF.............................................................................42
22. Modeled CA in the PBF........................................................................................................43
W. J. Golz / M.S. Thesis, Louisiana State University, 1997
vii
Abstract
Literature coefficients are used as the basis for a theoretical model that examines the major
factors that limit nitrification in a gently- and aggressively-washed floating-bead filter. Model
results are consistent with research, which indicated that nitrification can become limited by
oxygen delivery and transport as solids accumulate. The oxygen half-saturation constant (KSO) was
directly related (r2 = 0.95) to oxygen consumed during heterotrophic respiration and autotrophic
respiration for internally-loaded TAN, while it was inversely related to flow. KSO increased from
0.5-13 mg O2/L in the aggressively-washed filter, reflecting the comparatively-low solids
concentrations that resulted from a larger harvest fraction (hf = 0.57). KSO varied from 6.5-30 mg
O2/L in the gently-washed filter, because of the relatively-large solids concentrations that
accompanied a smaller harvest fraction (hf = 0.36). For the gently-washed filter (feed loading of
1.5-2 lbs/ft3/d), the model indicated that 80% of the initial biomass was retained in the filter
following backwashing. This large biofilm retention factor (BR) and the rapid increase in KSO
resulted in maximum nitrification (30.5 mg/ft2/d) occurring at an 8 hour backwash interval. In the
aggressively-washed filter (feed loading of 1.5 lbs/ft3/d), the model indicated that BR was 50%, and
the filter was initially biomass limited. The smaller value of BR and the slower growth of KSO may
explain why nitrification increased with backwash interval, reaching a maximum (31.6 mg/ft2/d) at
a backwash interval of 48 hours, before the solids-induced oxygen limitation inhibited nitrification.
W. J. Golz / M.S. Thesis, Louisiana State University, 1997
1
Introduction
Our global population is growing at an unprecedented rate, putting increased pressure on
shrinking supplies of food and water. Worldwide demand for seafood already exceeds the
sustainable harvest from our natural waters, and flow-through aquaculture contributes to the
degradation of surface water (Miller 1990). These factors have led to a decade-long expansion of
research and commercial production in recirculating aquaculture systems (RASs). Average
production costs in RASs are currently $1.25 per pound, which is about double the $0.60 per
pound cost of producing fish in a pond culture (Losordo and Westerman 1991). Reducing
production costs is, therefore, crucial to the future of the recirculating aquaculture industry.
When fish are stocked at high densities in a closed system, the recirculated water must be
maintained by an appropriate treatment train or water quality will rapidly decline. Total ammonia
nitrogen (TAN) removal and solids capture are well documented as two of the major factors
limiting fish production in recirculating systems (Drennan et al. 1995, Owsley 1993). Floating-
bead filters (FBFs) perform nitrification in conjunction with solids capture, which may lead to
lower treatment costs by reducing the number of system components, thereby lowering overall
production costs. However, nitrification capacity controls FBF design, because of the toxicity of
TAN to the fish and the strict environmental requirements of the nitrifying bacteria (Malone et al.
1993).
The use of FBFs in a RAS began at Dworshak National Fish Hatchery, with a pneumatically-
washed filter (Cooley 1979). More recently, a hydraulically-washed filter was developed and tested
at Louisiana State University (LSU) (Wimberly 1990). In both filters, nitrification increased with
washing frequency, establishing the importance of reducing the time that solids are held in the
filter.
W. J. Golz / M.S. Thesis, Louisiana State University, 1997 2
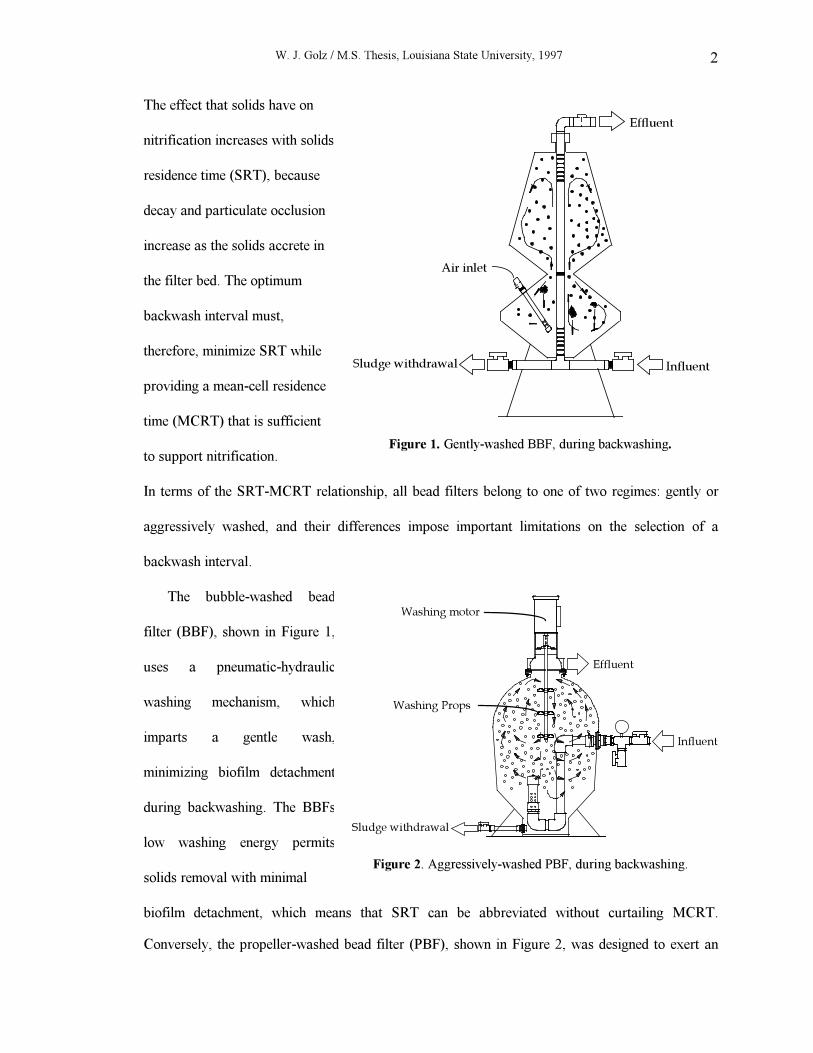
The effect that solids have on
nitrification increases with solids
residence time (SRT), because
decay and particulate occlusion
increase as the solids accrete in
the filter bed. The optimum
backwash interval must,
therefore, minimize SRT while
providing a mean-cell residence
time (MCRT) that is sufficient
to support nitrification.
Influent
Effluent
Sludge withdrawal
Air inlet
Figure 1. Gently-washed BBF, during backwashing.
In terms of the SRT-MCRT relationship, all bead filters belong to one of two regimes: gently or
aggressively washed, and their differences impose important limitations on the selection of a
backwash interval.
The bubble-washed bead
filter (BBF), shown in Figure 1,
uses a pneumatic-hydraulic
washing mechanism, which
imparts a gentle wash,
minimizing biofilm detachment
during backwashing. The BBFs
low washing energy permits
solids removal with minimal
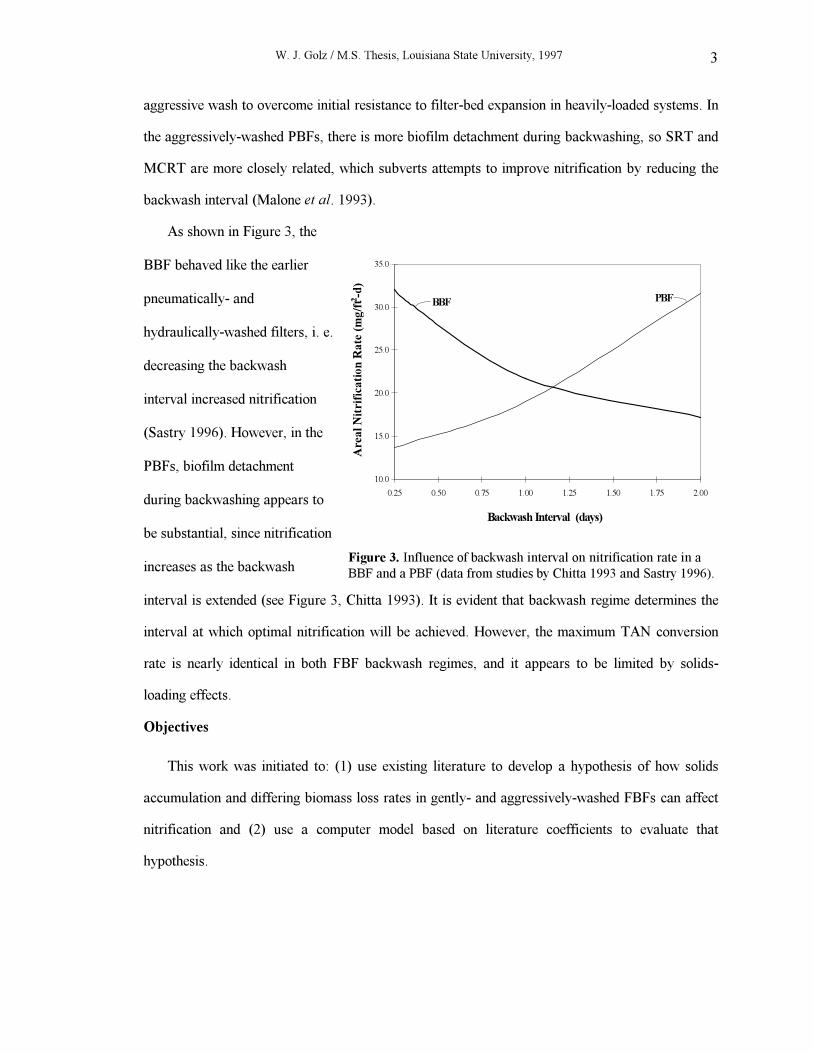
Sludge withdrawal
Effluent
Influent
Washing motor
Washing Props
Figure 2. Aggressively-washed PBF, during backwashing.
biofilm detachment, which means that SRT can be abbreviated without curtailing MCRT.
Conversely, the propeller-washed bead filter (PBF), shown in Figure 2, was designed to exert an
W. J. Golz / M.S. Thesis, Louisiana State University, 1997 3
aggressive wash to overcome initial resistance to filter-bed expansion in heavily-loaded systems. In
the aggressively-washed PBFs, there is more biofilm detachment during backwashing, so SRT and
MCRT are more closely related, which subverts attempts to improve nitrification by reducing the
backwash interval (Malone et al. 1993).
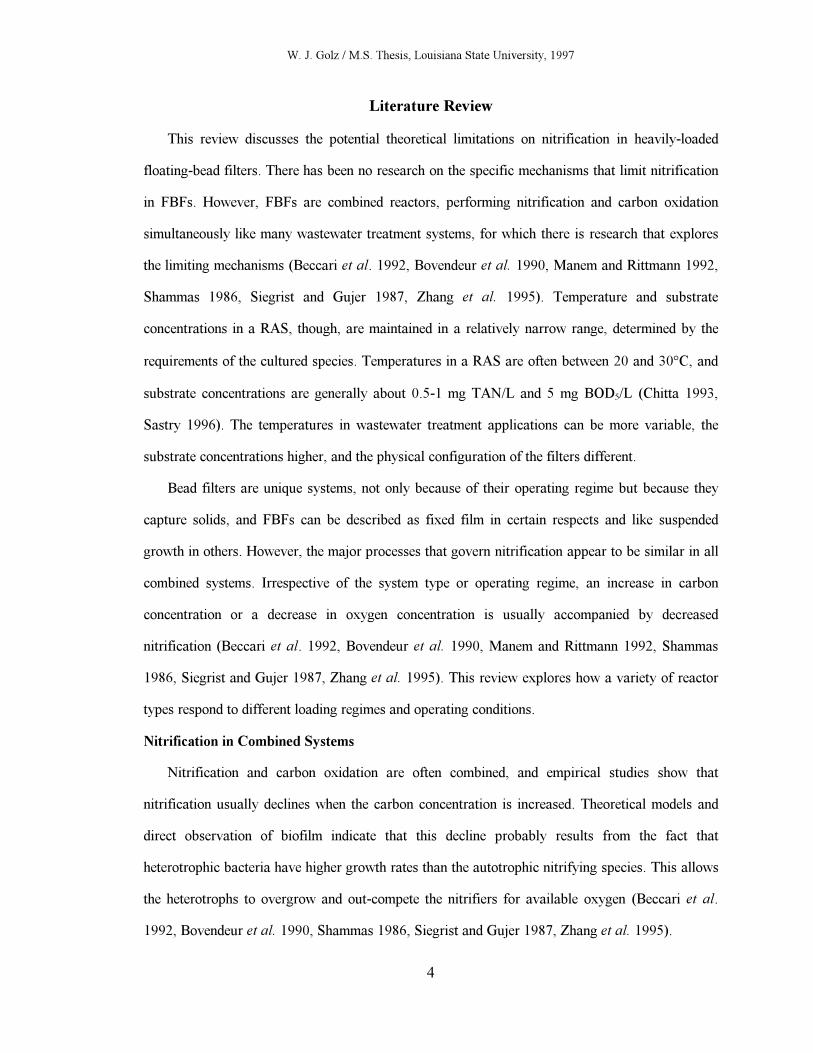
As shown in Figure 3, the
BBF behaved like the earlier
pneumatically- and
hydraulically-washed filters, i. e.
decreasing the backwash
interval increased nitrification
(Sastry 1996). However, in the
PBFs, biofilm detachment
during backwashing appears to
be substantial, since nitrification
increases as the backwash
10.0
15.0
20.0
25.0
30.0
35.0
0.25 0.50 0.75 1.00 1.25 1.50 1.75 2.00
Backwash Interval (days)
Are
al
Nit
rifi
cati
on
Ra
te (
mg
/ft2
-d)
BBFPBF
Figure 3. Influence of backwash interval on nitrification rate in a
BBF and a PBF (data from studies by Chitta 1993 and Sastry 1996).
interval is extended (see Figure 3, Chitta 1993). It is evident that backwash regime determines the
interval at which optimal nitrification will be achieved. However, the maximum TAN conversion
rate is nearly identical in both FBF backwash regimes, and it appears to be limited by solids-
loading effects.
Objectives
This work was initiated to: (1) use existing literature to develop a hypothesis of how solids
accumulation and differing biomass loss rates in gently- and aggressively-washed FBFs can affect
nitrification and (2) use a computer model based on literature coefficients to evaluate that
hypothesis.
W. J. Golz / M.S. Thesis, Louisiana State University, 1997
4
Literature Review
This review discusses the potential theoretical limitations on nitrification in heavily-loaded
floating-bead filters. There has been no research on the specific mechanisms that limit nitrification
in FBFs. However, FBFs are combined reactors, performing nitrification and carbon oxidation
simultaneously like many wastewater treatment systems, for which there is research that explores
the limiting mechanisms (Beccari et al. 1992, Bovendeur et al. 1990, Manem and Rittmann 1992,
Shammas 1986, Siegrist and Gujer 1987, Zhang et al. 1995). Temperature and substrate
concentrations in a RAS, though, are maintained in a relatively narrow range, determined by the
requirements of the cultured species. Temperatures in a RAS are often between 20 and 30°C, and
substrate concentrations are generally about 0.5-1 mg TAN/L and 5 mg BOD5/L (Chitta 1993,
Sastry 1996). The temperatures in wastewater treatment applications can be more variable, the
substrate concentrations higher, and the physical configuration of the filters different.
Bead filters are unique systems, not only because of their operating regime but because they
capture solids, and FBFs can be described as fixed film in certain respects and like suspended
growth in others. However, the major processes that govern nitrification appear to be similar in all
combined systems. Irrespective of the system type or operating regime, an increase in carbon
concentration or a decrease in oxygen concentration is usually accompanied by decreased
nitrification (Beccari et al. 1992, Bovendeur et al. 1990, Manem and Rittmann 1992, Shammas
1986, Siegrist and Gujer 1987, Zhang et al. 1995). This review explores how a variety of reactor
types respond to different loading regimes and operating conditions.
Nitrification in Combined Systems
Nitrification and carbon oxidation are often combined, and empirical studies show that
nitrification usually declines when the carbon concentration is increased. Theoretical models and
direct observation of biofilm indicate that this decline probably results from the fact that
heterotrophic bacteria have higher growth rates than the autotrophic nitrifying species. This allows
the heterotrophs to overgrow and out-compete the nitrifiers for available oxygen (Beccari et al.
1992, Bovendeur et al. 1990, Shammas 1986, Siegrist and Gujer 1987, Zhang et al. 1995).
W. J. Golz / M.S. Thesis, Louisiana State University, 1997 5
Experimental studies are necessary to predict the performance of a specific system that is
operated within a given operating regime because no general model exists that can reliably predict
the nitrification rate that will correspond to a given carbon concentration. This is because the
relationship of nitrification to carbon oxidation is complex, varying with filter type, loading regime,
and influent characteristics (Bovendeur et al. 1990, Figueroa and Silverstein 1992). This section
looks at studies of a rotating biological contactor (RBC) that was used to process domestic
wastewater and a trickling filter that was used in a RAS. Although their operating regimes were
very different, both systems demonstrated a linear decline in nitrification as C:N ratio increased.
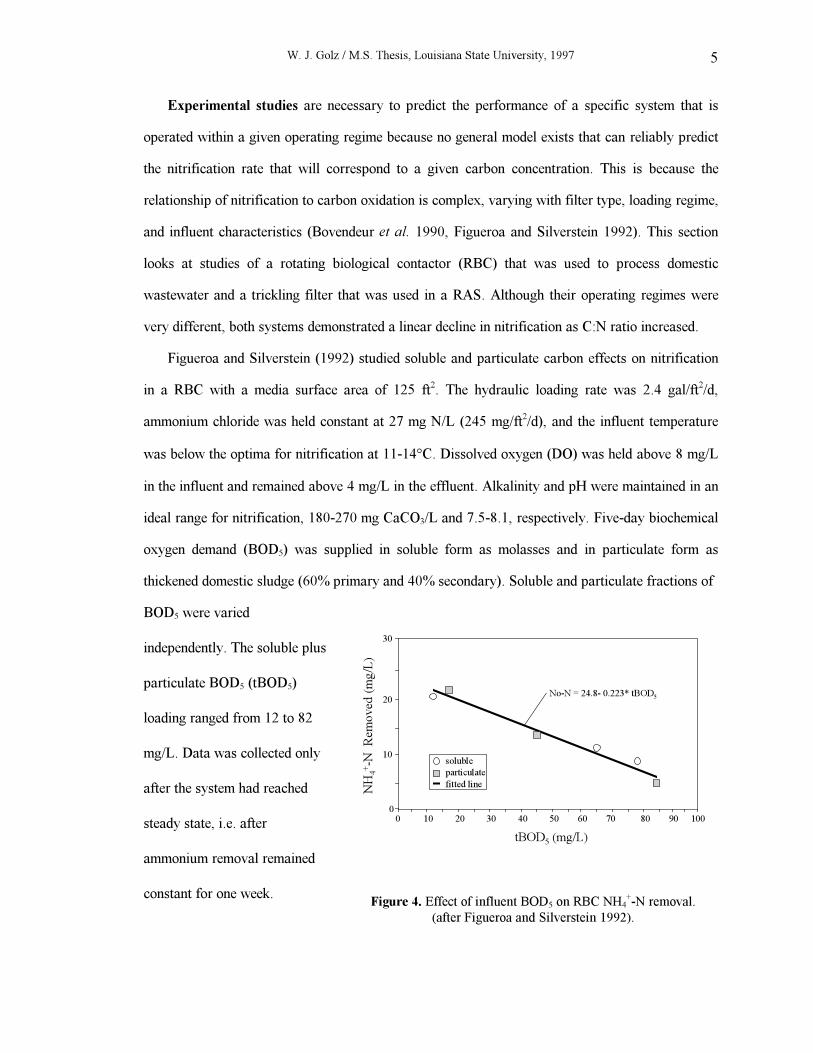
Figueroa and Silverstein (1992) studied soluble and particulate carbon effects on nitrification
in a RBC with a media surface area of 125 ft2. The hydraulic loading rate was 2.4 gal/ft2/d,
ammonium chloride was held constant at 27 mg N/L (245 mg/ft2/d), and the influent temperature
was below the optima for nitrification at 11-14°C. Dissolved oxygen (DO) was held above 8 mg/L
in the influent and remained above 4 mg/L in the effluent. Alkalinity and pH were maintained in an
ideal range for nitrification, 180-270 mg CaCO3/L and 7.5-8.1, respectively. Five-day biochemical
oxygen demand (BOD5) was supplied in soluble form as molasses and in particulate form as
thickened domestic sludge (60% primary and 40% secondary). Soluble and particulate fractions of
BOD5 were varied
independently. The soluble plus
particulate BOD5 (tBOD5)
loading ranged from 12 to 82
mg/L. Data was collected only
after the system had reached
steady state, i.e. after
ammonium removal remained
constant for one week.
tBOD5 (mg/L)
NH
4+-N
R
emo
ved
(m
g/L
)
00
10
20
30
10 20 30 40 50 60 70 80 90 100
soluble
particulate
fitted line
No-N = 24.8- 0.223* tBOD5
Figure 4. Effect of influent BOD5 on RBC NH4
+-N removal.
(after Figueroa and Silverstein 1992).
W. J. Golz / M.S. Thesis, Louisiana State University, 1997 6
Figure 4 shows that soluble and particulate BOD5 identically inhibited nitrification. As the
tBOD5 loading was increased from 12-82 mg/L (109-746 mg/ft2/d), ammonium removal declined
from 20-5 mg N/L (204-65 mg /ft2/d).
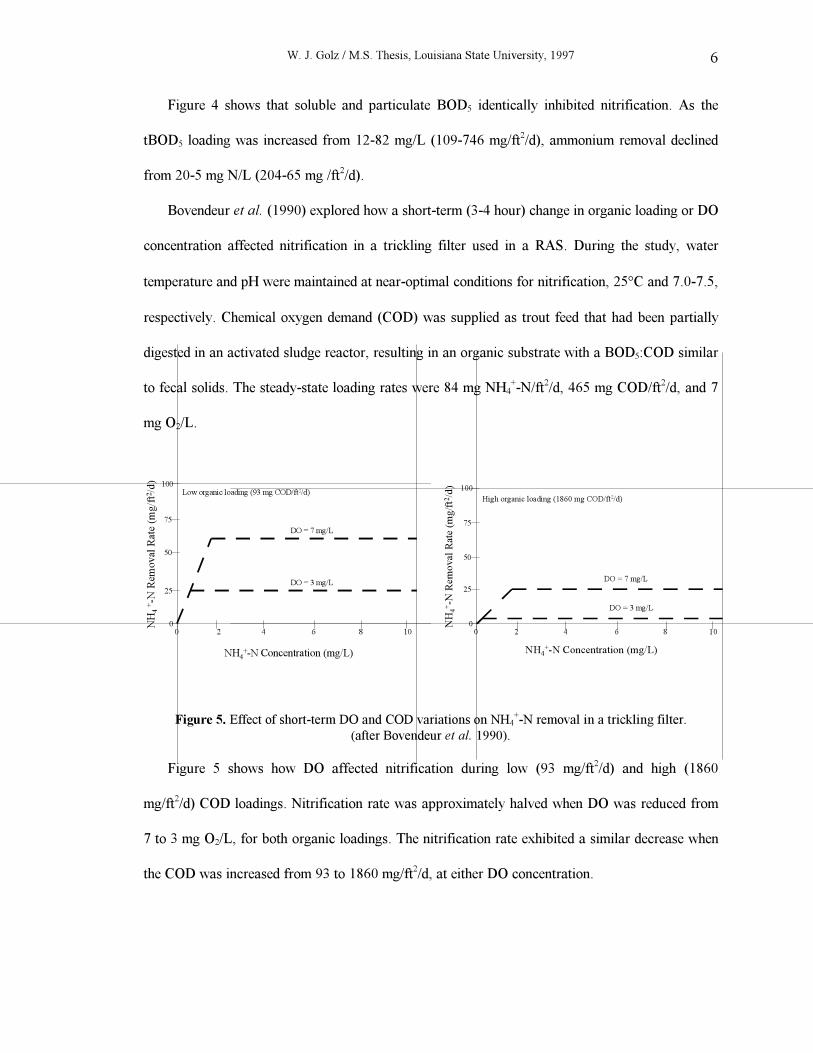
Bovendeur et al. (1990) explored how a short-term (3-4 hour) change in organic loading or DO
concentration affected nitrification in a trickling filter used in a RAS. During the study, water
temperature and pH were maintained at near-optimal conditions for nitrification, 25°C and 7.0-7.5,
respectively. Chemical oxygen demand (COD) was supplied as trout feed that had been partially
digested in an activated sludge reactor, resulting in an organic substrate with a BOD5:COD similar
to fecal solids. The steady-state loading rates were 84 mg NH4+-N/ft2/d, 465 mg COD/ft2/d, and 7
mg O2/L.
0
25
50
75
100
0 2 4 6 8 10
NH4
+-N Concentration (mg/L)
NH
4 +
-N R
emoval
Rat
e (m
g/f
t2/d
)
Low organic loading (93 mg COD/ft2/d)
DO = 7 mg/L
DO = 3 mg/L
0
25
50
75
100
0 2 4 6 8 10
NH4
+-N Concentration (mg/L)
NH
4+-N
Rem
oval
Rat
e (m
g/f
t2/d
)
High organic loading (1860 mg COD/ft2/d)
DO = 7 mg/L
DO = 3 mg/L
Figure 5. Effect of short-term DO and COD variations on NH4
+-N removal in a trickling filter.
(after Bovendeur et al. 1990).
Figure 5 shows how DO affected nitrification during low (93 mg/ft2/d) and high (1860
mg/ft2/d) COD loadings. Nitrification rate was approximately halved when DO was reduced from
7 to 3 mg O2/L, for both organic loadings. The nitrification rate exhibited a similar decrease when
the COD was increased from 93 to 1860 mg/ft2/d, at either DO concentration.
W. J. Golz / M.S. Thesis, Louisiana State University, 1997 7
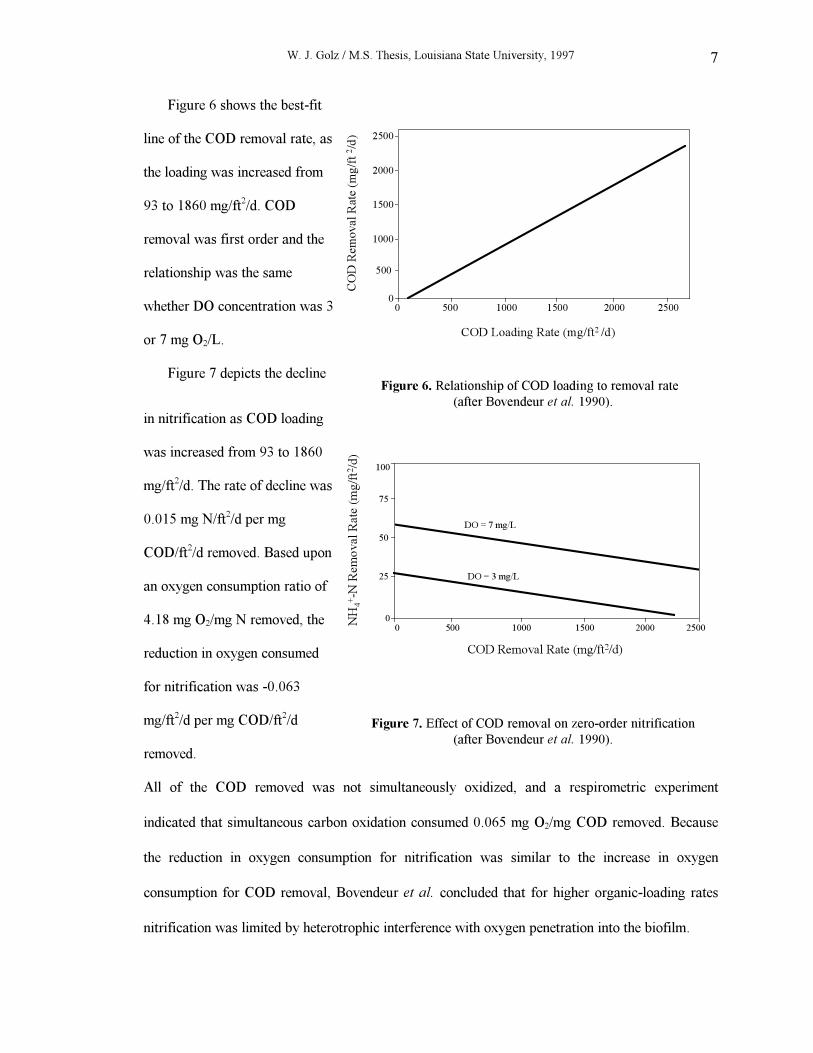
Figure 6 shows the best-fit
line of the COD removal rate, as
the loading was increased from
93 to 1860 mg/ft2/d. COD
removal was first order and the
relationship was the same
whether DO concentration was 3
or 7 mg O2/L.
Figure 7 depicts the decline
0
500
1000
1500
2000
2500
0 500 1000 1500 2000 2500
COD Loading Rate (mg/ft2 /d)
CO
D R
em
oval
Rat
e (m
g/f
t 2/d
)
Figure 6. Relationship of COD loading to removal rate
(after Bovendeur et al. 1990).
in nitrification as COD loading
was increased from 93 to 1860
mg/ft2/d. The rate of decline was
0.015 mg N/ft2/d per mg
COD/ft2/d removed. Based upon
an oxygen consumption ratio of
4.18 mg O2/mg N removed, the
reduction in oxygen consumed
for nitrification was -0.063
mg/ft2/d per mg COD/ft2/d
removed.
NH
4+-N
Rem
ov
al R
ate
(mg
/ft2
/d)
COD Removal Rate (mg/ft2/d)
0 500 1000 1500 2000 25000
25
50
75
100
DO = 7 mg/L
DO = 3 mg/L
Figure 7. Effect of COD removal on zero-order nitrification
(after Bovendeur et al. 1990).
All of the COD removed was not simultaneously oxidized, and a respirometric experiment
indicated that simultaneous carbon oxidation consumed 0.065 mg O2/mg COD removed. Because
the reduction in oxygen consumption for nitrification was similar to the increase in oxygen
consumption for COD removal, Bovendeur et al. concluded that for higher organic-loading rates
nitrification was limited by heterotrophic interference with oxygen penetration into the biofilm.
W. J. Golz / M.S. Thesis, Louisiana State University, 1997 8
Numerical models are capable of theoretically predicting nitrification over a wide range of
operating conditions, and they describe the resistance to substrate transfer with Fick’s law or
Monod half-saturation constants (Beccari et al. 1992, Bhaskar and Bhamidimarri 1991, Gonzalez-
Martinez and Duque-Luciano 1992, Rittmann and Manem 1992, Siegrist and Gujer 1987,
Timberlake et al. 1988).
Manem and Rittmann (1992) developed a steady-state model to quantify interspecific
competition in a submerged heterotrophic-autotrophic biofilm. The model was based on a
completely-mixed biofilm system with Monod expressions for growth and substrate utilization, and
Fick’s first law was used to describe diffusion into the biofilm. In the experimental system used to
calibrate the model, steady-state conditions were 15°C, influent ammonium was 2.5 mg N/L, and
effluent DO was maintained above 2 mg/L. Influent acetate concentration was varied incrementally
from 0-10 mg C/L (COD of 0.8 mg O2/mg C, Sawyer et al. 1994). The experimental system’s
substrate variations were accurately predicted by the model, and COD:N ratios within the modeled
range of 0-3 resulted in a decrease in nitrification that lasted up to 70 days.
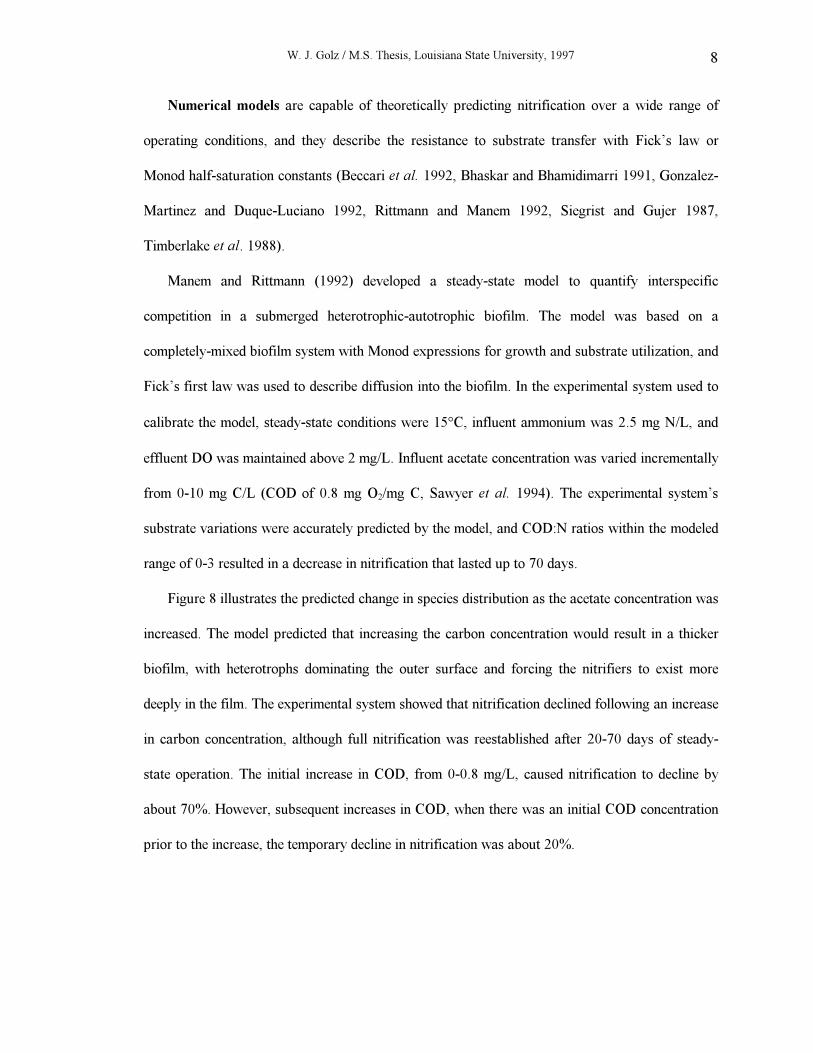
Figure 8 illustrates the predicted change in species distribution as the acetate concentration was
increased. The model predicted that increasing the carbon concentration would result in a thicker
biofilm, with heterotrophs dominating the outer surface and forcing the nitrifiers to exist more
deeply in the film. The experimental system showed that nitrification declined following an increase
in carbon concentration, although full nitrification was reestablished after 20-70 days of steady-
state operation. The initial increase in COD, from 0-0.8 mg/L, caused nitrification to decline by
about 70%. However, subsequent increases in COD, when there was an initial COD concentration
prior to the increase, the temporary decline in nitrification was about 20%.
W. J. Golz / M.S. Thesis, Louisiana State University, 1997 9
Siegrist and Gujer (1987)
developed a model to describe
the effect of oxygen diffusion on
nitrification in homogeneous
autotrophic and double-layer
heterotrophic-autotrophic
biofilms. A diffusion coefficient,
determined empirically, was
used to describe mass transfer
into the biofilm, and Monod
expressions were used for
biomass growth and substrate
utilization.
The laboratory trickling
filter used to evaluate the model
was operated under a pure
oxygen environment at a
constant temperature of 20°C.
Homogeneous nitrifying biofilms
were cultured by varying
ammonium from 15-80 mg N/L
to maintain the desired biofilm
thickness. Initial experiments
were conducted on a 310 µm
single-layer homogeneous
nitrifying biofilm.
0 0.40.2 0.6 0.8 1.0
0
20
40
100
60
80
Attachment surface Biofilm-water interface
COD ~ 0.8 mg/L Biofilm thickness = 26 um
Inert Biomass
Autotrophs
Heterotrophs
Inert Biomass
Autotrophs
Heterotrophs
0.40.2 0.6 0.8 1.0
0
20
40
100
60
80
0
COD ~ 2.4 mg/L Biofilm thickness = 92 um
Inert Biomass
0.40.2 0.6 0.8 1.0
0
20
40
100
60
80
Biofilm Depth
0
COD ~ 8 mg/L Biofilm thickness = 433 um
Per
centa
ge
of
Eac
h S
pec
ies
Figure 8. Predicted species distributions for increasing acetate
concentrations (1.5 mg NH4
+-N/L) (after Rittmann and Manem
1992).
W. J. Golz / M.S. Thesis, Louisiana State University, 1997 10
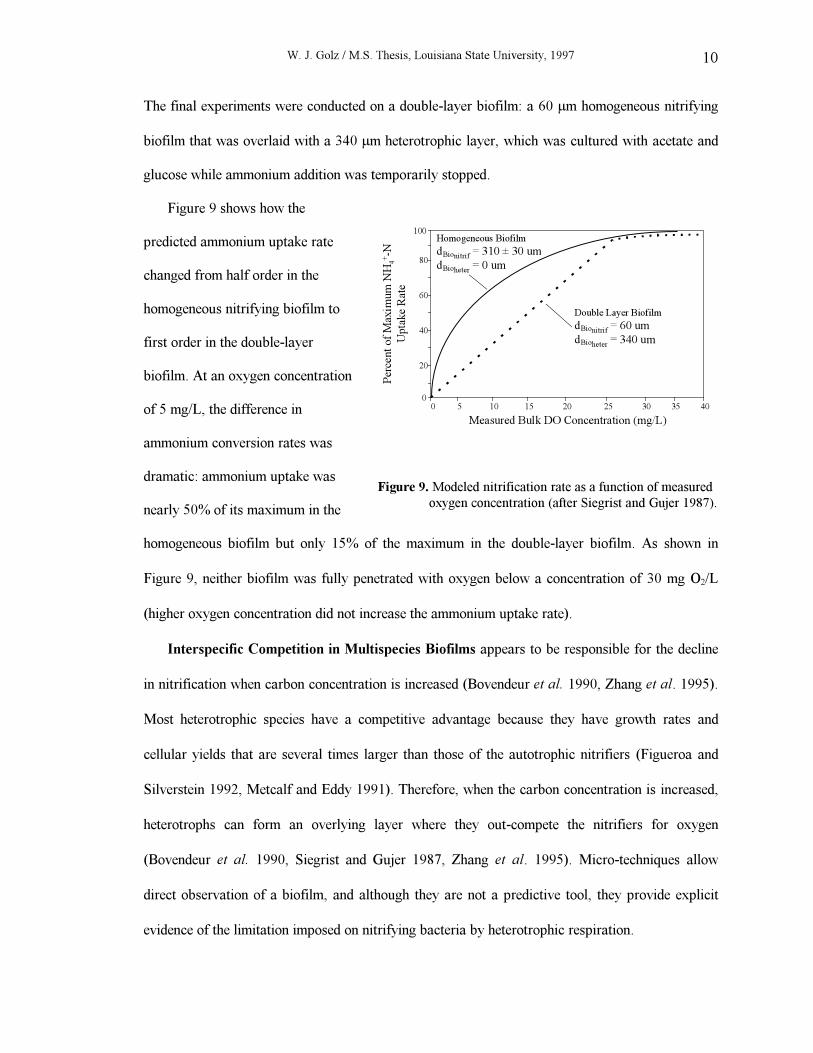
The final experiments were conducted on a double-layer biofilm: a 60 µm homogeneous nitrifying
biofilm that was overlaid with a 340 µm heterotrophic layer, which was cultured with acetate and
glucose while ammonium addition was temporarily stopped.
Figure 9 shows how the
predicted ammonium uptake rate
changed from half order in the
homogeneous nitrifying biofilm to
first order in the double-layer
biofilm. At an oxygen concentration
of 5 mg/L, the difference in
ammonium conversion rates was
dramatic: ammonium uptake was
nearly 50% of its maximum in the
Per
cent
of
Max
imum
NH
4
+-N
Upta
ke
Rat
e
Measured Bulk DO Concentration (mg/L)
Homogeneous Biofilm
dBionitrif = 310 ± 30 um
dBioheter = 0 um
Double Layer Biofilm
dBionitrif = 60 um
dBioheter = 340 um
0 5 10 15 20 25 30 35 40
0
20
40
60
80
100
Figure 9. Modeled nitrification rate as a function of measured
oxygen concentration (after Siegrist and Gujer 1987).
homogeneous biofilm but only 15% of the maximum in the double-layer biofilm. As shown in
Figure 9, neither biofilm was fully penetrated with oxygen below a concentration of 30 mg O2/L
(higher oxygen concentration did not increase the ammonium uptake rate).
Interspecific Competition in Multispecies Biofilms appears to be responsible for the decline
in nitrification when carbon concentration is increased (Bovendeur et al. 1990, Zhang et al. 1995).
Most heterotrophic species have a competitive advantage because they have growth rates and
cellular yields that are several times larger than those of the autotrophic nitrifiers (Figueroa and
Silverstein 1992, Metcalf and Eddy 1991). Therefore, when the carbon concentration is increased,
heterotrophs can form an overlying layer where they out-compete the nitrifiers for oxygen
(Bovendeur et al. 1990, Siegrist and Gujer 1987, Zhang et al. 1995). Micro-techniques allow
direct observation of a biofilm, and although they are not a predictive tool, they provide explicit
evidence of the limitation imposed on nitrifying bacteria by heterotrophic respiration.
W. J. Golz / M.S. Thesis, Louisiana State University, 1997 11
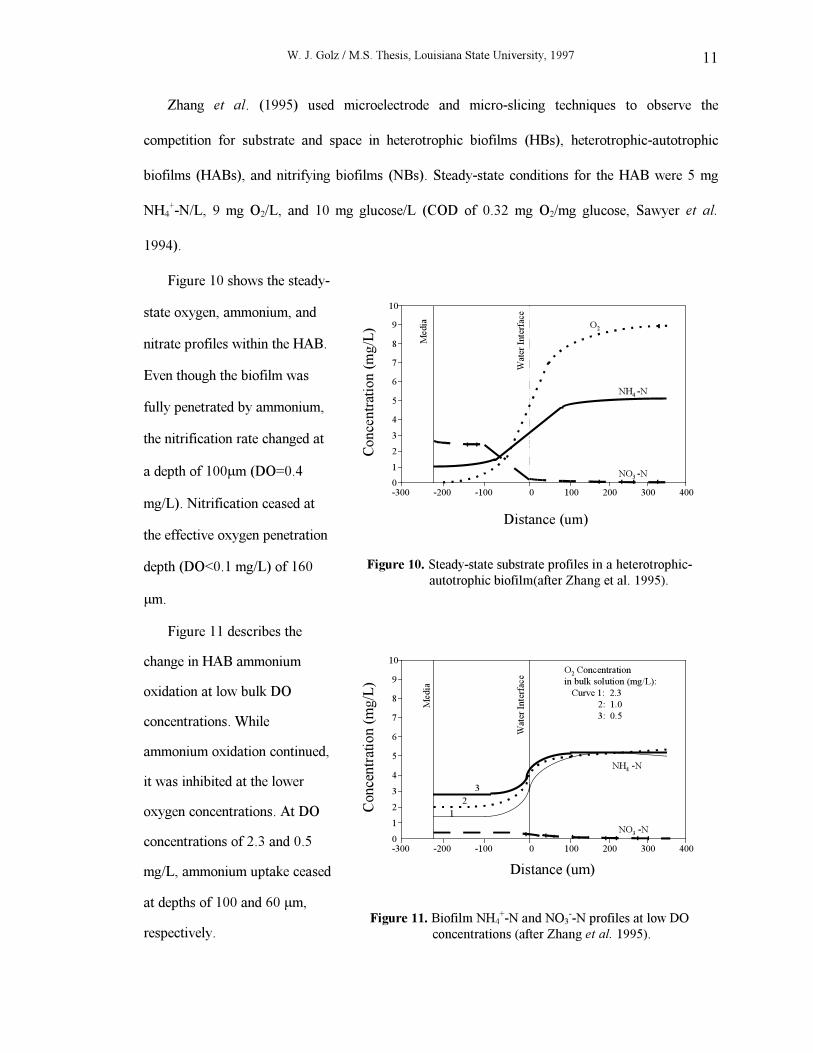
Zhang et al. (1995) used microelectrode and micro-slicing techniques to observe the
competition for substrate and space in heterotrophic biofilms (HBs), heterotrophic-autotrophic
biofilms (HABs), and nitrifying biofilms (NBs). Steady-state conditions for the HAB were 5 mg
NH4+-N/L, 9 mg O2/L, and 10 mg glucose/L (COD of 0.32 mg O2/mg glucose, Sawyer et al.
1994).
Figure 10 shows the steady-
state oxygen, ammonium, and
nitrate profiles within the HAB.
Even though the biofilm was
fully penetrated by ammonium,
the nitrification rate changed at
a depth of 100µm (DO=0.4
mg/L). Nitrification ceased at
the effective oxygen penetration
depth (DO<0.1 mg/L) of 160
µm.
Distance (um)
Concentr
atio
n (
mg/L
)
-300 -200 -100 0 100 200 300 400
0
1
2
3
4
5
6
7
8
9
10
Med
ia
Wate
r In
terf
ace
NO3 -N
NH4 -N
O2
Figure 10. Steady-state substrate profiles in a heterotrophic-
autotrophic biofilm(after Zhang et al. 1995).
Figure 11 describes the
change in HAB ammonium
oxidation at low bulk DO
concentrations. While
ammonium oxidation continued,
it was inhibited at the lower
oxygen concentrations. At DO
concentrations of 2.3 and 0.5
mg/L, ammonium uptake ceased
at depths of 100 and 60 µm,
respectively.
Distance (um)
Conce
ntr
atio
n (
mg/L
)
-300 -200 -100 0 100 200 300 4000
1
2
3
4
5
6
7
8
9
10
Media
Wate
r In
terf
ace
O2 Concentration
in bulk solution (mg/L):
Curve 1: 2.3
2: 1.0
3: 0.5
1
2
3
NH4 -N
NO3 -N
Figure 11. Biofilm NH4
+-N and NO3
--N profiles at low DO
concentrations (after Zhang et al. 1995).
W. J. Golz / M.S. Thesis, Louisiana State University, 1997 12
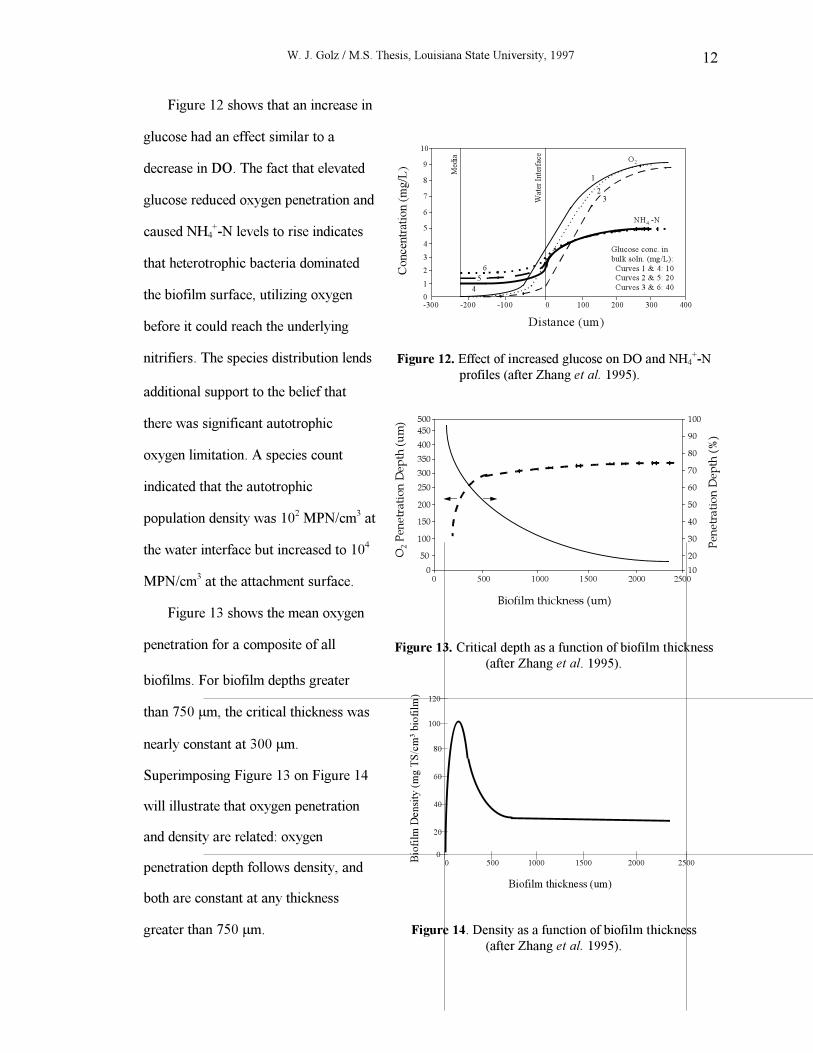
Figure 12 shows that an increase in
glucose had an effect similar to a
decrease in DO. The fact that elevated
glucose reduced oxygen penetration and
caused NH4+-N levels to rise indicates
that heterotrophic bacteria dominated
the biofilm surface, utilizing oxygen
before it could reach the underlying
nitrifiers. The species distribution lends
Distance (um)
Concen
trat
ion (
mg/L
)
-300 -200 -100 0 100 200 300 4000
1
2
3
4
5
6
7
8
9
10
Media
Wate
r In
terf
ace
NH4 -N
O2
1
32
6
5
4
Glucose conc. in
bulk soln. (mg/L):
Curves 1 & 4: 10
Curves 2 & 5: 20
Curves 3 & 6: 40
Figure 12. Effect of increased glucose on DO and NH4
+-N
profiles (after Zhang et al. 1995).
additional support to the belief that
there was significant autotrophic
oxygen limitation. A species count
indicated that the autotrophic
population density was 102 MPN/cm3 at
the water interface but increased to 104
MPN/cm3 at the attachment surface.
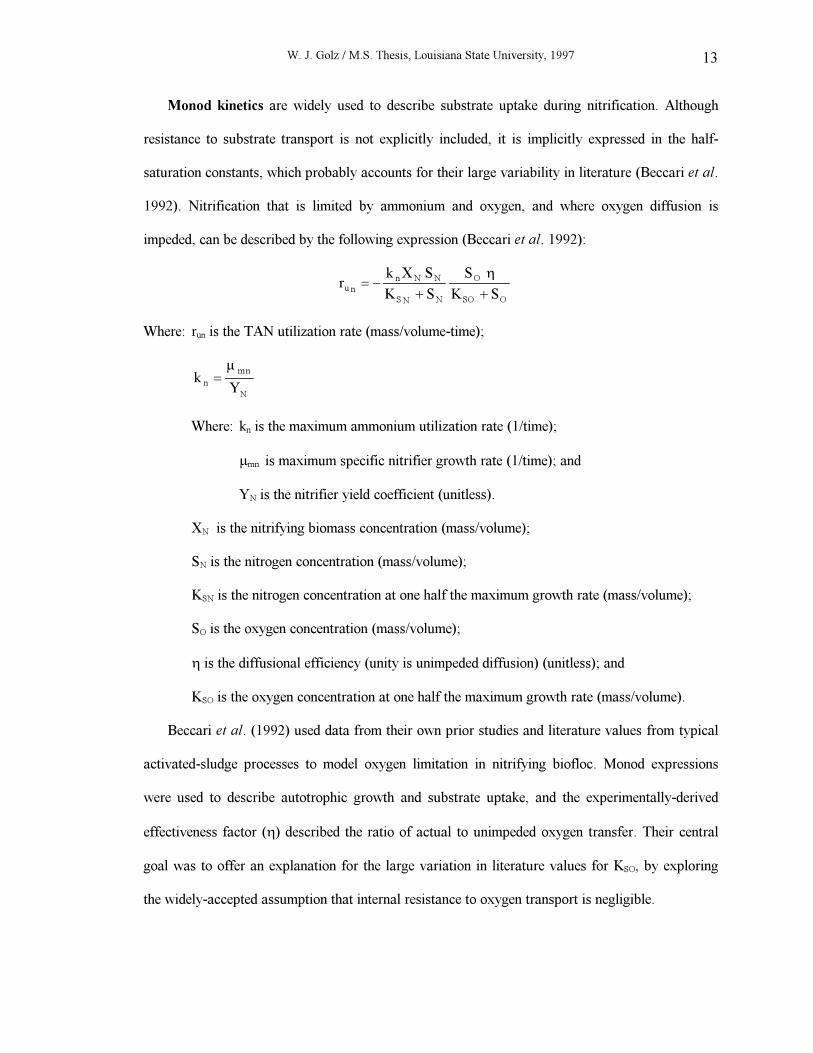
Figure 13 shows the mean oxygen
penetration for a composite of all
O2 P
enet
rati
on
Dep
th (
um
)
Biofilm thickness (um)
Pen
etra
tio
n D
epth
(%
)
500
450
400
350
300
250
200
150
100
50
0
100
90
80
70
60
50
40
30
20
10
500 1000 1500 2000 25000
Figure 13. Critical depth as a function of biofilm thickness
(after Zhang et al. 1995).
biofilms. For biofilm depths greater
than 750 µm, the critical thickness was
nearly constant at 300 µm.
Superimposing Figure 13 on Figure 14
will illustrate that oxygen penetration
and density are related: oxygen
penetration depth follows density, and
both are constant at any thickness
greater than 750 µm.
Bio
film
Densi
ty (
mg T
S/c
m3 b
iofi
lm)
Biofilm thickness (um)
0 500 1000 1500 2000 2500
0
20
40
60
80
100
120
Figure 14. Density as a function of biofilm thickness
(after Zhang et al. 1995).
W. J. Golz / M.S. Thesis, Louisiana State University, 1997 13
Monod kinetics are widely used to describe substrate uptake during nitrification. Although
resistance to substrate transport is not explicitly included, it is implicitly expressed in the half-
saturation constants, which probably accounts for their large variability in literature (Beccari et al.
1992). Nitrification that is limited by ammonium and oxygen, and where oxygen diffusion is
impeded, can be described by the following expression (Beccari et al. 1992):
rk X S
K S
S
K Su n
n N N
SN N
O
SO O
= −+ +
η
Where: run is the TAN utilization rate (mass/volume-time);
kY
n
mn
N
=
µ
Where: kn is the maximum ammonium utilization rate (1/time);
µmn is maximum specific nitrifier growth rate (1/time); and
YN is the nitrifier yield coefficient (unitless).
XN is the nitrifying biomass concentration (mass/volume);
SN is the nitrogen concentration (mass/volume);
KSN is the nitrogen concentration at one half the maximum growth rate (mass/volume);
SO is the oxygen concentration (mass/volume);
η is the diffusional efficiency (unity is unimpeded diffusion) (unitless); and
KSO is the oxygen concentration at one half the maximum growth rate (mass/volume).
Beccari et al. (1992) used data from their own prior studies and literature values from typical
activated-sludge processes to model oxygen limitation in nitrifying biofloc. Monod expressions
were used to describe autotrophic growth and substrate uptake, and the experimentally-derived
effectiveness factor (η) described the ratio of actual to unimpeded oxygen transfer. Their central
goal was to offer an explanation for the large variation in literature values for KSO, by exploring
the widely-accepted assumption that internal resistance to oxygen transport is negligible.
W. J. Golz / M.S. Thesis, Louisiana State University, 1997 14
For 40 µm diameter (φ) biofloc, a best fit of their experimental data resulted in a KSO of 0.83
mg O2/L. At φ=40 µm, and η was always >0.98 even when DO was 0.5 mg/L, meaning that
diffusional resistance was negligible. Similarly, when φ was in the range of 40-100 µm and DO
was ≥1.0 mg/L, η was always ≥0.90, so diffusional resistance remained small. However, as φ was
increased at ≥100 µm, η decreased rapidly, especially when DO was simultaneously lowered. They
concluded that internal diffusional resistance to oxygen transport could not be neglected, especially
when the biofloc diameter exceeded 100 µm.
Hanaki et al. (1990) studied how variations in COD and DO affected ammonia conversion in a
laboratory-scale suspended-growth reactor at a constant ammonia concentration of 80 mg N/L. In
a culture that was free of organic matter, the DO was lowered from 6 to 0.5 mg O2/L and the effect
on ammonia oxidation was negligible. However, nitrite oxidation was severely inhibited at 0.5 mg
O2/L, resulting in a reactor nitrite concentration of 60 mg N/L. In an organically-enriched culture,
where COD was 160 mg O2/L, ammonia conversion declined dramatically when DO was lowered
from 6 to 0.5 mg/L. In both cultures nitrite oxidation had a nearly-identical relationship to DO,
indicating that increased COD had a smaller impact than reduced DO concentration.
Solids and Mean-Cell Residence Times
When discussing suspended growth, MCRT and SRT are used equivocally, to describe the
average age of biomass in the reactor. In systems where nitrification and carbon oxidation are
combined, Metcalf and Eddy (1991) state that an MCRT in the range of 8-20 days can be required
for effective nitrification. Other authors report effective nitrification with MCRTs of 3-7 days
(Sharma and Ahlert 1977; Timberlake et al. 1988).
For floating-bead filters, SRT refers to the residence time of the interstitial solids, which
contain a large percentage of fecal matter, while MCRT describes the average age of the biomass.
Although differences between SRT and MCRT may be significant, only SRT has been previously
defined (Malone et al. 1993):
SRTh f
f b
=
1 1
W. J. Golz / M.S. Thesis, Louisiana State University, 1997 15
Where: SRT is the residence time of the interstitial solids (time);
hf is the fraction of solids harvested during a backwash (unitless); and
1
fb
is the backwash interval (time).
Backwash interval is the primary means of managing SRT in bead filters, because the range
within which hf can be adjusted is limited by the filter’s mechanical design. The minimum harvest
fraction can be as low as 0.25 in gently-washed filters and the maximum as high as 0.75 in
aggressively-washed filters (Chitta 1993, Malone et al. 1993, Sastry 1996). In aggressively-
washed filters, the nitrification-rate trends suggest that MCRT is approximately equal to SRT,
while in gently-washed filters MCRT appears to be much greater than SRT.
FBFs: Solids Capture and Biofiltration in RASs
Solids and backwash regime both have important, and sometimes competing, effects on
nitrification in FBFs. Achieving an optimal backwash interval calls for limiting the solids loading
in the context of providing a sufficient MCRT for effective nitrification. This section discusses
these factors, by looking at the waste burden under which FBFs operate and the opposite way that
gently- and aggressively-washed filters respond to similar changes in backwash interval.
Aquacultural waste production and characteristics are functions of the cultured species’
excretions, which are related to the feed. In the short term, solids excretions are simply a
particulate load, but if they are allowed to remain in the system, their decay yields TAN and BOD5,
which results in an increase in bacterial biomass. Less than 0.5% of the feed given to the fish on a
daily basis will be converted to nitrifying biomass, although the heterotrophic yield can be as much
as 6% of the daily feed (Chen et al. 1991).
Wimberly (1990) reported excretion rates and waste characteristics for channel catfish that
were fed at a rate of 0.01 kg feed/kg fish/d. He observed VSS:TSS, BOD5:TSS, and TKN:TSS
ratios of 0.878, 0.385, and 0.0892, respectively. Mean values for solids excretion (ES), soluble
BOD5 (EB), and TAN excretion (EA) were 0.430 kg TSS/kg fed, 0.0504 kg BOD5/kg feed, and
W. J. Golz / M.S. Thesis, Louisiana State University, 1997 16
0.0203 kg N/kg feed. The observed tBOD5 excretion was 0.216 kg BOD5/kg feed. It is notable that
the solids excretions have a BOD5:TKN ratio of about 4.3, while the soluble excretions have a
BOD5:TKN ratio of only about 3.
Several other authors who studied channel catfish reported values for ES (kg TSS/kg feed),
tBOD5 (kg BOD5/kg feed), and EA (kg N/kg feed): Page and Andrews (1973) reported ES as
0.180, BOD5 as 0.100, and EA as 0.021; Murphy and Lipper (1970) recorded a tBOD5 of 0.245;
Raune et al. (1977) observed ES, tBOD5 excretion, and EA as 0.692, 0.400, and 0.0462
respectively; Gordon (1974) reported ES as 0.393, tBOD5 excretion as 0.173, and EA as 0.0183.
Chen et al. (1991) studied the production and characteristics of sludge effluent from bead
filters that were used in a RAS that cultured channel catfish. Chen et al. (1991) observed a
BOD5:TSS ratios of 0.09-0.20 and TKN:TSS ratios of 0.038-0.061. The values observed by Chen
et al. (1991) result in BOD5:TKNs that vary from about 2.4 to 3.3. Ning (1995) collected data on
sludge effluent from bead filters used in a tilapia facility and reported mean TKN:TSS as 0.0449
and VSS:TSS as 0.880. Wang (1995) collected fresh fecal solids from tilapia and observed a
TKN:TSS of 0.0501.
Solids decay is usually treated as a first order reaction where the rate is considered constant
with time but variable with temperature (Corbitt 1990, Matsuda et al. 1988, Merritt 1983, Metcalf
and Eddy 1991, Viessman and Hammer 1985). However, there is research to indicate that decay
can be accurately represented by allowing the reaction rate (ks, 1/time) to vary not only with
temperature but with SRT (Rich 1982). In either case, solids decay is usually described by a
simple differential equation (Metcalf and Eddy 1991):
d
dtM k M
S S S( ) = −
Where: MS is the mass of biodegradable solids (mass)
Rich (1982) reviewed literature values for solids decay in batch reactors at 20°C. He cited
Goodman and Englande (1975) as having reported a kS of 0.48 SRT-0.415, and he plotted their
W. J. Golz / M.S. Thesis, Louisiana State University, 1997 17
resulting curve against kS values from seven other studies: Adams 1974, Barnard 1978, Barnhart
1961, Reece et al. 1979, Reynolds 1973, Rich and White 1976, Smith et al. 1975. For a SRT
above 15 days, most kS values fell close to the curve. However, all kS values for SRTs below 10
days existed above the curve, indicating that Goodman and Englande’s expression underestimated
decay at the lower solids ages.
Matsuda et al. (1988) studied the behavior of nutrients during the aerobic digestion of waste-
activated sludge. Digestion was carried out over a 30 day period at 30°C. Parallel experiments that
employed both continuous and intermittent aeration yielded similar results, where the observed
VSS reduction rate was 0.15 d-1. Beginning solids content was about 6000 mg TSS/L and 5000 mg
VSS/L. After 20 days the sludge stabilized, with 40% of the TSS and 30% of the VSS remaining.
When digestion was begun, TKN was about 550 mg/L--90% existed in biomass and 10% in the
liquid phase. Liquid-phase nitrogen was mainly ammonium and nitrate, while organic nitrogen and
nitrite were negligible, suggesting that ammonification and nitrification were nearly instantaneous.
Final biomass nitrogen was 11%, comparing favorably to the 12.4% nitrogen content in C5H7NO2,
the common component formula for a bacterial cell (Metcalf and Eddy 1991).
Wang (1995) studied the decay of fecal matter from tilapia at an ambient laboratory
temperature of about 20°C and reported a kS of 0.12 d-1. Ning (1995) collected data on the decay
of sludge effluent from floating-bead filters used for tilapia grow out, which had an initial SRT of
5-7 days. He reported kS values, independent of sludge age, as 0.072, 0.049, and 0.04 d-1 at 30, 20,
and 10°C, respectively. These decay rates are somewhat lower than those for domestic primary
solids and sludge.
Insitu nitrification is the percentage of TAN oxidation that takes place outside of the filter,
e.g. on tank and pipe walls. Malone et al. (1993) recommend a design value for insitu nitrification
in the range of 30-60%. Mia (1996) studied insitu nitrification in high-density RASs that used bead
W. J. Golz / M.S. Thesis, Louisiana State University, 1997 18
filters for solids capture and biofiltration. He found that the insitu nitrification factor (IS) had an
inverse relationship to nitrification rate, with values ranging from 0.43 to 0.82 and averaging about
0.71.
Floating-bead filters respond differently to similar changes in backwash interval, based upon
their backwash regime. Gently-washed studies by Wimberly (1990) and Sastry (1996) showed that
decreasing the backwash interval enhanced nitrification. Notably, a point has not been found where
a further decrease in backwash interval fails to increase the nitrification rate. The relationship
between backwash interval and nitrification is reversed for aggressively-washed filters: Chitta
(1993) found that as the backwash interval was extended in a PBF nitrification initially increased
but eventually declined.
Wimberly (1990) evaluated a hydraulically-washed bead filter, which was used for solids
capture and biofiltration in a RAS. Reducing the backwash interval from 24 to 3 hours allowed an
increase in feed loading rate (FLR) from 0.3 to 1.6 lbs feed/ft3/d. This FLR corresponds to a TAN
loading of about 18-94 mg N/ft2/d (EA= 27,000 mg N/kg feed and media specific surface area=350
ft2/ft3) and a soluble COD loading of 33-174 mg COD/ft2/d (EB=50,400, Wimberly 1990;
BOD5:COD=0.6, Metcalf and Eddy 1991). For this reduction in backwash interval and increase in
FLR, CA increased from 7.66 to 32.4 mg N/ft2/d, and oxygen consumed for nitrification increased
from 18 to 52% of the total oxygen consumed during filtration.
Sastry (1996) looked at how variations in backwash interval affected nitrification in a BBF.
Reducing the backwash interval from 48 to 8 hours produced the following results: CA increased
from 17.2 to 30.5 mg N/ft2/d, which allowed FLR to be increased from 1.5-2 lbs feed/ft3/d (88-117
mg N/ft2/d and 164-218 mg COD/ft2/d). The hydraulic loading rate increased slightly from 28-31
gal/ft2/d. The total oxygen consumed in filtration (OCF) remained approximately constant (228-
214 mg O2/ft2/d) while oxygen consumed in nitrification (OCN=4.18 mg O2/mg N, Hochheimer
and Wheaton 1991) increased from 72-127 mg O2/ft2/d. SRT was reduced from 8 to 1.3 days. The
W. J. Golz / M.S. Thesis, Louisiana State University, 1997 19
1.3 day SRT, corresponding to the higher nitrification rate, illustrates that MCRT is probably
much greater than SRT, since 1.3 days is well below the MCRT required for effective nitrification
(Metcalf and Eddy 1991, Sharma and Ahlert 1977; Timberlake et al. 1988).
Chitta (1993) explored the impact of backwash interval on CA in a PBF. The filter’s harvest
fraction was 0.57, the hydraulic loading rate averaged 42 gal/ft2/d, and FLR was held at 1.5 lb
feed/ft3/d (88 mg N/ft2/d and 164 mg COD/ft2/d). When the backwash interval was extended from
12 to 48 hours, CA more than doubled, from 15 to 31.6 mg N/ft2/d. OCF and OCN increased from
132-257 and 63-132 mg O2/ft2/d, respectively. When the backwash interval was extended to 3
days, OCF began to increase more slowly, reaching a maximum of about 296 mg O2/ft2/d while
OCN declined, leveling off at about 96 mg O2/ft2/d as CA declined to 23 mg/ft2/d.
Summary: Potential Limitations on Oxygen Delivery and Transport
The literature reviewed that discusses combined systems, other than FBFs, illustrates a
common trend that exists across a range of hydraulic-loading rates, substrate concentrations, and
operating conditions. That is, nitrification declines when the carbon concentration is increased or
when the oxygen concentration is lowered. Studies that look at both submerged and subaerial
fixed-film filters indicate that an increase in carbon concentration supports a proliferation of
heterotrophic bacteria, which, because of their higher growth rates, are able to overly and out-
compete the nitrifiers for oxygen (Bovendeur et al. 1990, Siegrist and Gujer 1987). A study that
used micro-techniques to observe competition in multispecies biofilms provided explicit evidence
that a biofilm surface can become dominated by heterotrophic bacteria, which exhaust oxygen
before it reaches the underlying nitrifying bacteria (Zhang et al. 1995).
Bead filters operate under a low bulk TAN loading, while solids are continuously augmented
by fecal matter and bacterial biomass. There is no doubt that the low-substrate regime and solids
accumulation complicate the comparison of FBFs to other filters. As solids accrete in the filter,
several important effects arise. Physical occlusion reduces the overall rate of bulk-substrate
W. J. Golz / M.S. Thesis, Louisiana State University, 1997 20
delivery, and probably also results in an uneven distribution of substrate within the filter bed. In
addition, fecal matter and biomass probably agglomerate into macroparticles. These macroparticles
may have a large volume to surface area ratio, which reduces their diffusional efficiency (Metcalf
and Eddy 1991). In addition, they produce substrate internally during solids decay and
endogeneous metabolism (Matsuda et al. 1988, Sawyer et al. 1994). These factors may have a
significant impact on the uptake of externally-loaded TAN, especially after extended backwash
intervals.
Bulk-TAN delivery is obviously most efficient for the shortest backwash intervals, when the
biofilm is thinnest and the flow is most-evenly distributed within the filter (Malone et al. 1993).
The transfer of bulk TAN is probably impeded at high solids concentrations, when biomass and
fecal solids agglomerate (Malone et al. 1993). At higher solids loads, there is also an increase in
the amount of TAN produced during solids ammonification and heterotrophic metabolism
(Matsuda et al. 1988, Sawyer et al. 1994). The overall effect of aggregated macroparticles, where
diffusion is physically limited and substrate is produced internally, is probably profound. While the
diffusion of bulk TAN becomes increasingly limited, the TAN concentration within macroparticles
may approach or even exceed the bulk-TAN concentration, and thereby diffusion from the bulk
solution into the accreting macroparticles may slow, cease, or even reverse direction, diffusing
from the macroparticles into the bulk liquid. This would preclude any increase in the TAN
limitation. Additionally, it would mean that an increasing percentage of the oxygen reaching the
nitrifying bacteria would be used in oxidation of internally-generated TAN. This could be viewed
as a preferential oxidation of the internal load.
Heterotrophic respiration may also limit nitrification in FBFs, as it does in other filters
(Bovendeur et al. 1990, Zhang et al. 1995). Longer backwash intervals result in higher MCRTs
and larger solids concentrations, both of which may favor heterotrophs. Several of the studies
reviewed indicated that heterotrophs, by virtue of their higher growth rates, can overly nitrifying
W. J. Golz / M.S. Thesis, Louisiana State University, 1997 21
bacteria and out-compete them for oxygen (Figueroa and Silverstein 1992, Manem and Rittmann
1992, Zhang et al. 1995). Longer backwash intervals probably encourage this layering, which is
favored by stasis, to develop more fully, and solids degradation may encourage increased
heterotrophic growth. Studies of aquacultural wastes indicate that the BOD5:TKN ratio of the
solids is higher than that of the soluble excretions (Chen 1991, Wimberly 1990), which would
elevate the soluble BOD5 as the solids decay, leading to an increased heterotrophic population.
Longer backwash intervals could, therefore, provide conditions favorable to heterotrophic growth
and over-layering, accentuating the oxygen limitation experienced by the nitrifying bacteria.
Solids accumulation apparently inhibits nitrification in FBFs through several separate, but
related, mechanisms. It is a simple matter to quantify the effects of a reduction in substrate delivery
due to declining flow. However, the effect of non-homogeneous flow and the diffusive
characteristics of large-thickness macroparticles, which generate substrate internally, are probably
worthy of further study.
Solids-loading effects become critical at different backwash intervals, depending on the type of
filter. Sastry’s study demonstrated that a gently-washed filter can have sufficient biomass for
effective nitrification at backwash intervals as short as 8 hours. This means that the solids load can
be mitigated by frequent washing, although the low harvest fraction allows the solids loading to
increase rather quickly when the backwash interval is extended. Flow rate declined at backwash
intervals greater than 8 hours, conducted at lower loading rates, while OCF remained
approximately constant and OCN declined. The increasing difference between OCF and OCN
probably reflects reduced oxygen delivery as well as increasing transport resistance. In an
aggressively-washed filter, Chitta observed an initial increase in nitrification as the backwash
interval was extended, indicating that filter was initially biomass limited. The larger harvest
fraction in this filter translated into lower solids loadings, extending the backwash interval at which
the solids loading became critical. However, a critical backwash interval was eventually reached,
W. J. Golz / M.S. Thesis, Louisiana State University, 1997 22
where nitrification began to decline. The flow in Chitta’s study was maintained at a nearly-constant
rate, so the impact of solids on oxygen transport is clearly depicted by the relationship between
OCF and OCN, which increased together up to the critical interval. However, beyond the critical
backwash interval, OCF began to increase more slowly while OCN declined, probably reflecting a
decline in oxygen transport.
W. J. Golz / M.S. Thesis, Louisiana State University, 1997
23
Model Development
The model discussed in this chapter was developed to illustrate how solids accumulation and
differing backwash regimes impact nitrification in FBFs. The model focuses on the effects of: (1)
the soluble substrate produced during solids degradation and (2) the different percentages of
biomass removed by each backwash regime. The model is based upon two related hypotheses that
derive from the discussion in the previous chapter.
The first hypothesis entails how nitrification becomes inhibited at longer backwash intervals by
the accumulation and decay of solids which produce soluble substrate. As solids accumulate, fecal
matter and biomass probably agglomerate, forming large macroparticles which obstruct flow in
local areas of the filter, severely limiting diffusion from the bulk liquid and producing soluble
substrate internally. The internal production of soluble substrate probably preempts autotrophic
TAN limitation, while simultaneously increasing oxygen demand and thereby accentuating the
oxygen limitation. The conditions that accompany longer backwash intervals favor heterotrophic
bacteria. The internally-loaded substrate may support an increase in the heterotrophic population,
and continuing static conditions probably foster the development of bacterial stratification, where
heterotrophs overly the nitrifying bacteria. The effects of diffusional limitation due to the formation
of macroparticles and increased heterotrophic competition for oxygen will be reflected by an
elevated KSO in the model (see Equation 5-a). KSO represents the concentration of oxygen required
for the nitrifying bacteria to achieve half their maximum growth rate (Metcalf and Eddy 1991).
Under ideal conditions, such as those for very short backwash intervals, KSO will be a relatively-
low baseline value, e.g. 0.4 (Beccari et al. 1992, Siegrist and Gujer 1987). However, impeded
oxygen transfer will increase the amount of bulk-liquid DO required to achieve half saturation
within the biofilm or biofloc (Beccari et al. 1992, Zhang et al. 1995).
W. J. Golz / M.S. Thesis, Louisiana State University, 1997 24
The backwash interval that will most effectively mitigate the solids-induced oxygen limitation
depends upon the backwash regime of the filter. This gives rise to a second hypothesis involving
the amount of original biomass retained after a backwash and its relationship to MCRT. Gently-
washed filters appear to retain a relatively-large percentage of their original biomass following a
backwash (Sastry 1996, Wimberly 1990). This means that gently-washed filters, like BBFs, can be
washed more frequently, which reduces solids-loading effects without curtailing MCRT (Sastry
1996). In juxtaposition, aggressively-washed filters like the PBF remove a larger percentage of
solids and appear to retain a much-smaller percentage of their biomass following a backwash.
Therefore, the backwash interval must be extended to provide a sufficient MCRT for effective
nitrification, and nitrification declines due to the solids load only after a critical backwash interval
is reached (Chitta 1993). The difference in biomass retention between gently- and aggressively-
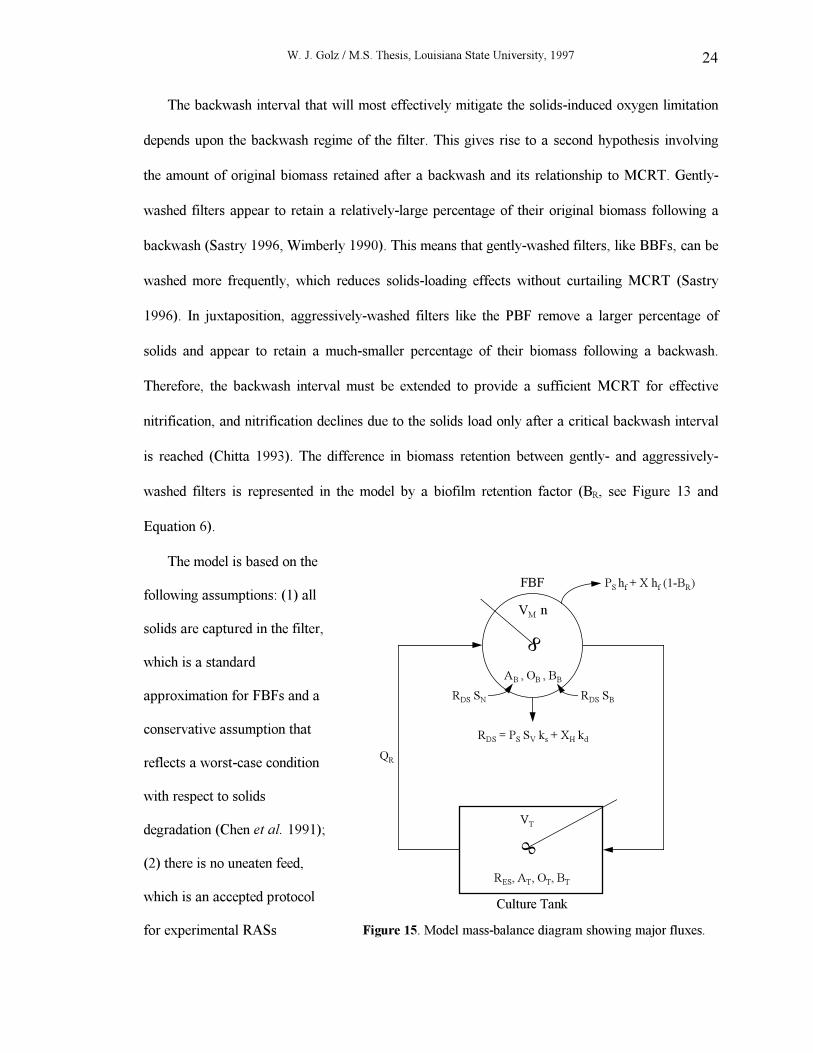
washed filters is represented in the model by a biofilm retention factor (BR, see Figure 13 and
Equation 6).
The model is based on the
following assumptions: (1) all
solids are captured in the filter,
which is a standard
approximation for FBFs and a
conservative assumption that
reflects a worst-case condition
with respect to solids
degradation (Chen et al. 1991);
(2) there is no uneaten feed,
which is an accepted protocol
for experimental RASs
Culture Tank
FBF
QR
8
8
RES, AT, OT, BT
VT
AB , OB , BB
VM
n
PS
hf + X h
f (1-B
R)
RDS SN RDS SB
RDS = PS SV ks + XH kd
Figure 15. Model mass-balance diagram showing major fluxes.
W. J. Golz / M.S. Thesis, Louisiana State University, 1997 25
(Sastry 1996); (3) the FBF and culture-tank behave like completely-mixed reactors, which is
reasonable in the context of the high flow rates and the small differences between influent and
effluent concentrations in FBFs (see Figure 13, Malone et al. 1993, Metcalf and Eddy 1991).
Primary Solids
For the period between backwashes, the primary solids (PS) flux consists of excretions (RES)
accreting in the filter and being reduced by decay (RDP):
d
dtP R RS ES DP= − (1)
Where: RF
V EES
LR
M S=
2 2.(1-a)
R P S kDP S V S
= (1-b)
The feed applied per unit volume of filter media per day (FLR) and the media volume (VM) are given
by the system being modeled, and the TSS excretion per unit mass of feed (ES) does not vary
greatly for fish fed at normal rates, i.e. 1-2% (0.01-0.02 kg dry feed/kg body weight/d). The
VSS:TSS ratio (SV) and first-order solids-decay rate (ks) are, reportedly, relatively constant for the
temperatures and SRTs modeled (Metcalf and Eddy 1991, Ning 1995, Wang 1995).
The primary-solids harvest ([HS]) during backwashing is described by the fraction of solids
removed (hf). This is analogous to a Heaviside function, performed as a discreet adjustment at each
backwash interval (1/fb):
[ ] [ ]H P h Executed at eger multiples of t fS S f b
= ∗int (2)
The post-backwash primary-solids mass (P′S) is, therefore:
′ = −P P hS S f
( )1 (2-a)
The average age of primary solids (SRT) can be approximated by a function of backwash
interval and harvest fraction (Coffin 1993):
W. J. Golz / M.S. Thesis, Louisiana State University, 1997 26
SRTh ff b
= ∗1 1
(3)
Research has shown that decreasing the backwash interval can enhance nitrification (Sastry 1996,
Wimberly 1990), and this is probably the result of a reduction in SRT, which is related to solids
concentration for a given FLR. However, the ability to minimize SRT is limited by the need to
provide a long enough biomass age to support nitrification.
Biomass
The net growth of heterotrophic bacteria (XH) is described by a Monod function where the
carbon substrate, expressed as oxygen uptake, is limiting:
d
dtX R R
H GH DH= − (4)
R
X B
K BGH
mh H B
SB B
=+
µ(4-a)
R k XDH d H
= (4-b)
RGH is the expression for heterotrophic growth, which depends upon their maximum growth rate
(µmh) and the BOD5 half-saturation constant (KSB). BOD5 removal is non-critical in FBF
performance, although it may limit nitrification through competition for oxygen, because
heterotrophic bacteria have relatively-large growth rates and utilize oxygen more efficiently than
the nitrifiers.
Net growth of nitrifying biomass (XN) that it is limited by TAN and DO can be described with
A Monod function (Beccari et al. 1992):
d
dtX R R
N GN DN= − (5)
Where: RX A
K A
O
K OGN
mn N B
SA B
B
SO B
=+
+
µ(5-a)
R k XDN d N
= (5-b)
W. J. Golz / M.S. Thesis, Louisiana State University, 1997 27
It is unlikely that KSA increases in an absolute sense, with respect to backwash interval. Bulk-TAN
delivery is most efficient for the shortest backwash intervals, when the biofilm is thinnest and the
flow is most-evenly distributed (Malone et al. 1993). The delivery of bulk TAN and oxygen
probably becomes impeded when the backwash interval is extended, as biomass and fecal solids
agglomerate occluding areas of the filter bed. However, the concomitant increase in solids
ammonification and heterotrophic metabolism will elevate TAN production within the occluded
areas (Matsuda et al. 1988, Sawyer et al. 1994). This may lead to TAN concentrations within
localized occlusions that approach or even exceed the bulk concentration, changing the direction of
diffusion. Longer backwash intervals may also favor heterotrophic competition for oxygen, through
solids decay and the development of bacterial stratification. The combined effect of these
conditions is probably the evolution of an environment where oxygen limits nitrification, due to the
impeded mass transfer and the competition by heterotrophic bacteria, which is most pronounced
within macroparticles in the most occluded areas of the filter. Therefore, as backwash intervals are
extended, KSO should increase to reflect the increasing oxygen limit on nitrifier growth and TAN
uptake. The ability to decrease the backwash interval to minimize KSO effects, though, is limited by
a SRT-MCRT relationship, which is related to the biomass-harvesting characteristics of the filter.
Biomass harvest ([HX]) is similar to primary-solids removal ([Hs]), with the important
exception of a biofilm-retention factor (BR), which is introduced to account for the biomass
retained on the filter media during backwashing. Although the model was developed to look at the
effect of BR on nitrifiers, the harvest of heterotrophic and nitrifying biomass is, of necessity,
identical since the model does not impose a structure on relative biomass location.
[ ] ( ) [ ]H X h B Executed at eger multiples of t fX f R b
= − ∗1 int (6)
Post-backwash biomass (X′) is, therefore:
( ){ }′ = − −X X h Bf R
1 1 (6-a)
W. J. Golz / M.S. Thesis, Louisiana State University, 1997 28
FBF research results indicate that BR is smaller in aggressively-washed filters, and increases as
washing energy decreases, e.g. in gently-washed filters (Chitta 1993, Sastry 1996, Wimberly
1990).
The average biomass age (MCRT) can be approximated with a function of solids residence
time and biofilm retention:
[ ]MCRTSRT
BB
R
R=
−
≤ <
10 1 (7)
Equation 7 illustrates the profound effect that biofilm retention has on partitioning MCRT and
SRT: As BR decreases, it becomes necessary to extend SRT to achieve a given MCRT, and
conversely, as BR increases, SRT can be reduced while a given MCRT is maintained.
Total Solids
Primary solids followed by heterotrophic biomass are the main constituents of the total solids
mass (MS) in the filter. The contribution of nitrifiers is negligible and is, therefore, excluded from
the expression:
M P XS S H= + (8)
Primary solids and biomass decay at different rates, although overall solids decay (RDS) is
largely determined by the decay of primary solids, since the percentage of heterotrophic bacteria is
relatively small at the backwash intervals modeled:
R R RDS DP DH
= + (9)
TAN
Biofilter TAN concentration (AB) is a function of substrate uptake (RUA), solids
ammonification (RDA), and mass exchange with the culture tank (RMA). These quantities become
concentrations relative to interstitial volume, the product of media volume (VM) and porosity (n):
( )d
dtA
R R R
VB
UA DA MA
M
=
− + +
n 28.3(10)
W. J. Golz / M.S. Thesis, Louisiana State University, 1997 29
Where: RR
YUA
GN
N
= (10-a)
R R SDA DS N
= (10-b)
( )R Q A AMA R T B
= −5451 (10-c)
A completely-mixed reactor volume must encompass all of the biologically-active volume,
including liquid, biomass, and primary solids (Metcalf and Eddy 1991). Inert matter probably
causes some small reduction in filter-bed porosity (n), which is neglected in the model. RUA reflects
substrate uptake by bringing cellular yield (YN) into the growth term (Equation 5-a). RDA describes
ammonification during the decay of solids that have a given TKN:VSS ratio (SN). The mass
exchange rate of TAN, between the culture tank and the biofilter, depends on recycle flow rate
(QR) and the amount of external TAN load removed by the filter (AT-AB), where AT is the culture-
tank TAN concentration. RMA can be described as an apparent nitrification rate since it does not
include oxidation of the internally-loaded TAN that results from solids ammonification.
Culture-tank TAN concentration is a function of the culture species net excretions (R′EA) and
the rate of mass exchange with the culture tank:
( )d
dtA
R R
VT
EA MA
M
=′ −
n 28.3(11)
Where: ( )RF
V E IEA
LR
M A S'
.= −
2 21 (11-a)
R′EA varies with the amount of insitu (IS) nitrification that occurs outside the filter, i.e. in the tank
and on pipe walls (Mia 1996).
The apparent areal nitrification rate (CA) is the nitrification rate per total media-surface area,
which is a product of the media volume (VM) and its specific surface area (SA):
CR
V SA
MA
M A
= (12)
W. J. Golz / M.S. Thesis, Louisiana State University, 1997 30
BOD5
The BOD5 equations introduced below are structurally identical to their TAN counterparts, as
previously discussed:
( )d
dtB
R R R
VB
UB DB MB
M
=
− + +
n 28.3(13)
Where: RR
YUB
GH
H
= (13-a)
R R SDB DS B
= (13-b)
( )R Q B BMB R T B
= −5451 (13-c)
d
dtB R R
T EB MB= ′ − (14)
Where: ( )RF
V E IEB
LR
M B S'
.= −
2 21 (14-a)
Insitu BOD5 removal and insitu nitrification appear to be similar, based upon BOD5 excretion
rates and substrate removal in the filter (Chitta 1993).
Dissolved Oxygen
The model assumes that DO in the culture tank (OT) is maintained at a constant level. The
biofilter DO (OB) is determined by oxygen use during the uptake of BOD5 (RUB) and TAN (RUOA),
and the mass exchange rate between the biofilter and tank (RMO):
( )d
dtO
R R R
VB
UB UOA MO
M
=
− − +
n 28.3(15)
Where: ( )R RUOA UA
= 418. (15-a)
( )R Q O OMO R T B
= −5451 (15-b)
BOD5 utilization is stated in terms of oxygen, so RUB is equivalent to the heterotrophic oxygen use.
Oxygen use for nitrification is 4.18 mg O2/mg TAN (Hochheimer and Wheaton 1991).
W. J. Golz / M.S. Thesis, Louisiana State University, 1997 31
Oxygen consumed in filtration (OCF) is a measurable quantity, reported in many FBF studies
(Chitta 1993, Sastry 1996, Wimberly 1990). It expresses total oxygen use within the biofilter, for
oxidation of the external and internal loads:
OCFR
V S
MO
M A
= (16)
Oxygen consumed in apparent nitrification (OCN) is reported in most FBF studies. It is a
calculated quantity, based on a stoichiometric ratio, and accounts only for the oxygen used for
apparent, i.e. externally loaded, nitrification.
( )OCN CA
= 418. (17)
Oxygen consumption in total nitrification (OCNT) is derived from the model and expresses
oxygen use for nitrification of the aggregate, i.e. internal and external, TAN load:
OCNR
V ST
UOA
M A
= (18)
Limits of the Model
This model was developed to illustrate the major factors that may limit nitrification in bead
filters, and not as a predictive tool. A limit on the predictive application of the model, i.e. outside
the calibration boundaries, exists because the insitu nitrification that corresponds to a given
apparent nitrification rate must be based upon an experimental observation. Presently, though, this
is an irreconcilable necessity. Although the inverse empirical relationship between IS and CA is well
documented (Mia 1996), it is not theoretically defined, entailing system-specific parameters, that
are complicated by biofilm kinetics that are affected by turbulent pipe-flow regimes.
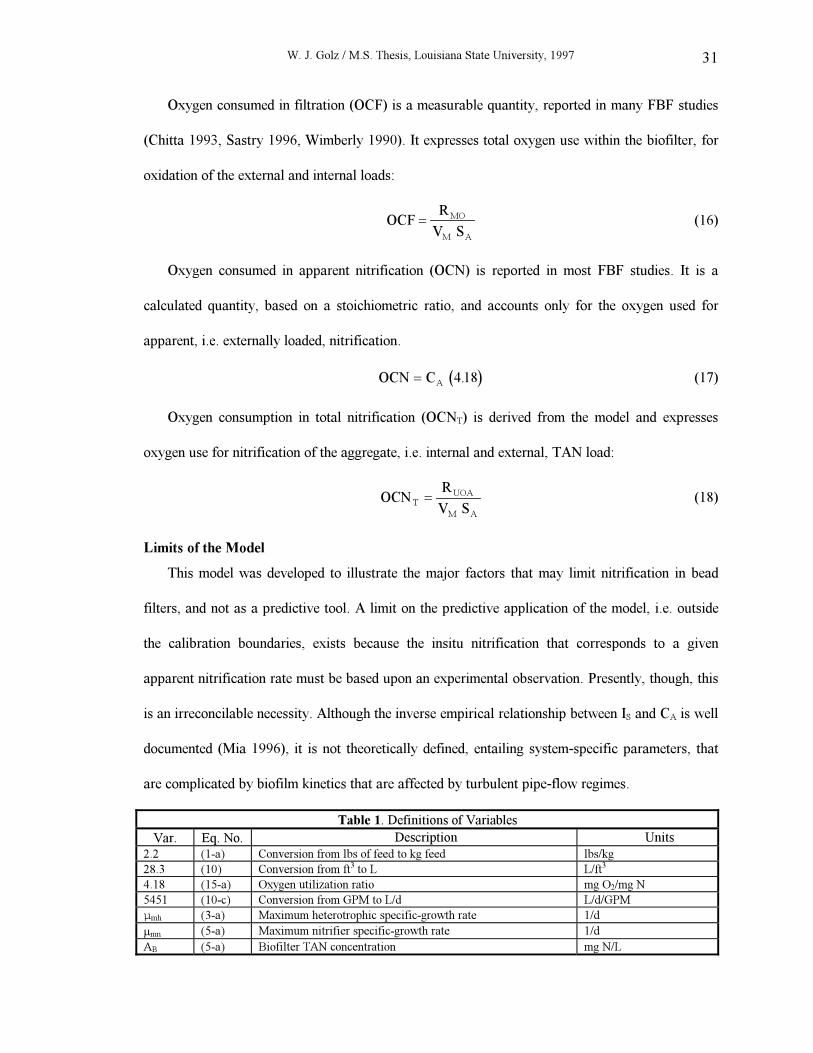
Table 1. Definitions of Variables
Var. Eq. No. Description Units
2.2 (1-a) Conversion from lbs of feed to kg feed lbs/kg
28.3 (10) Conversion from ft3 to L L/ft3
4.18 (15-a) Oxygen utilization ratio mg O2/mg N
5451 (10-c) Conversion from GPM to L/d L/d/GPM
µmh (3-a) Maximum heterotrophic specific-growth rate 1/d
µmn (5-a) Maximum nitrifier specific-growth rate 1/d
AB (5-a) Biofilter TAN concentration mg N/L
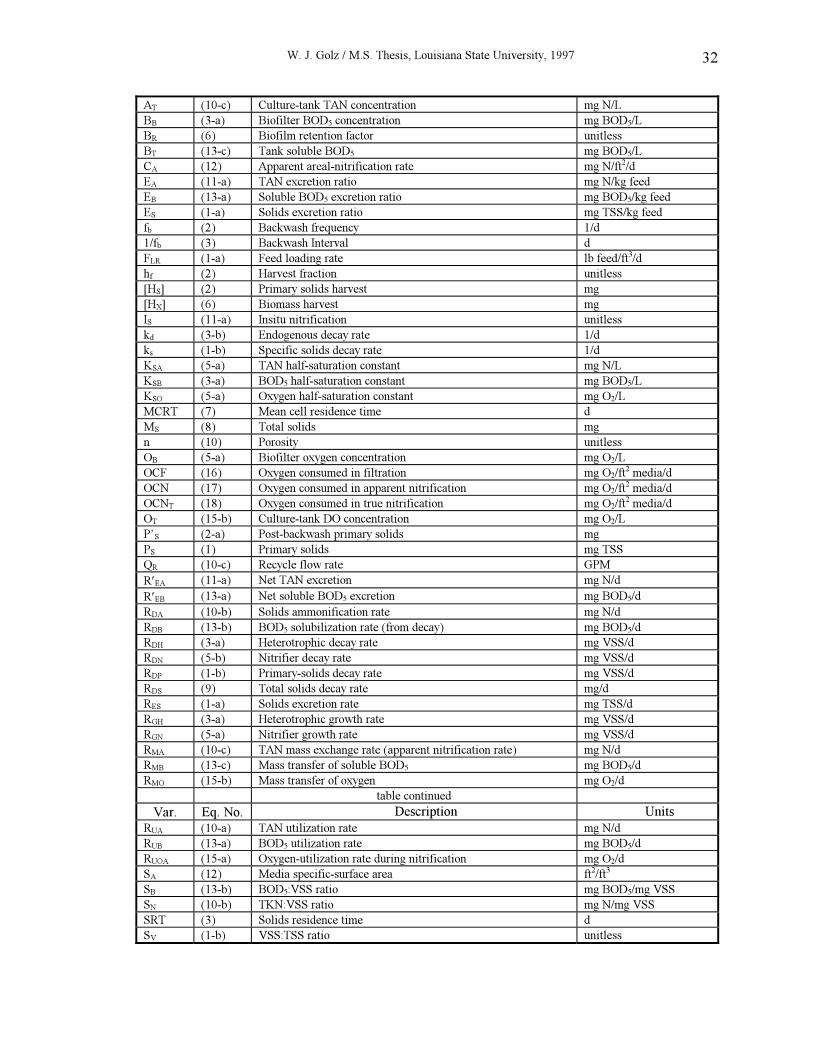
W. J. Golz / M.S. Thesis, Louisiana State University, 1997 32
AT (10-c) Culture-tank TAN concentration mg N/L
BB (3-a) Biofilter BOD5 concentration mg BOD5/L
BR (6) Biofilm retention factor unitless
BT (13-c) Tank soluble BOD5 mg BOD5/L
CA (12) Apparent areal-nitrification rate mg N/ft2/d
EA (11-a) TAN excretion ratio mg N/kg feed
EB (13-a) Soluble BOD5 excretion ratio mg BOD5/kg feed
ES (1-a) Solids excretion ratio mg TSS/kg feed
fb (2) Backwash frequency 1/d
1/fb (3) Backwash Interval d
FLR (1-a) Feed loading rate lb feed/ft3/d
hf (2) Harvest fraction unitless
[HS] (2) Primary solids harvest mg
[HX] (6) Biomass harvest mg
IS (11-a) Insitu nitrification unitless
kd (3-b) Endogenous decay rate 1/d
ks (1-b) Specific solids decay rate 1/d
KSA (5-a) TAN half-saturation constant mg N/L
KSB (3-a) BOD5 half-saturation constant mg BOD5/L
KSO (5-a) Oxygen half-saturation constant mg O2/L
MCRT (7) Mean cell residence time d
MS (8) Total solids mg
n (10) Porosity unitless
OB (5-a) Biofilter oxygen concentration mg O2/L
OCF (16) Oxygen consumed in filtration mg O2/ft2 media/d
OCN (17) Oxygen consumed in apparent nitrification mg O2/ft2 media/d
OCNT (18) Oxygen consumed in true nitrification mg O2/ft2 media/d
OT (15-b) Culture-tank DO concentration mg O2/L
P’S (2-a) Post-backwash primary solids mg
PS (1) Primary solids mg TSS
QR (10-c) Recycle flow rate GPM
R′EA (11-a) Net TAN excretion mg N/d
R′EB (13-a) Net soluble BOD5 excretion mg BOD5/d
RDA (10-b) Solids ammonification rate mg N/d
RDB (13-b) BOD5 solubilization rate (from decay) mg BOD5/d
RDH (3-a) Heterotrophic decay rate mg VSS/d
RDN (5-b) Nitrifier decay rate mg VSS/d
RDP (1-b) Primary-solids decay rate mg VSS/d
RDS (9) Total solids decay rate mg/d
RES (1-a) Solids excretion rate mg TSS/d
RGH (3-a) Heterotrophic growth rate mg VSS/d
RGN (5-a) Nitrifier growth rate mg VSS/d
RMA (10-c) TAN mass exchange rate (apparent nitrification rate) mg N/d
RMB (13-c) Mass transfer of soluble BOD5 mg BOD5/d
RMO (15-b) Mass transfer of oxygen mg O2/d
table continued
Var. Eq. No. Description Units
RUA (10-a) TAN utilization rate mg N/d
RUB (13-a) BOD5 utilization rate mg BOD5/d
RUOA (15-a) Oxygen-utilization rate during nitrification mg O2/d
SA (12) Media specific-surface area ft2/ft3
SB (13-b) BOD5:VSS ratio mg BOD5/mg VSS
SN (10-b) TKN:VSS ratio mg N/mg VSS
SRT (3) Solids residence time d
SV (1-b) VSS:TSS ratio unitless
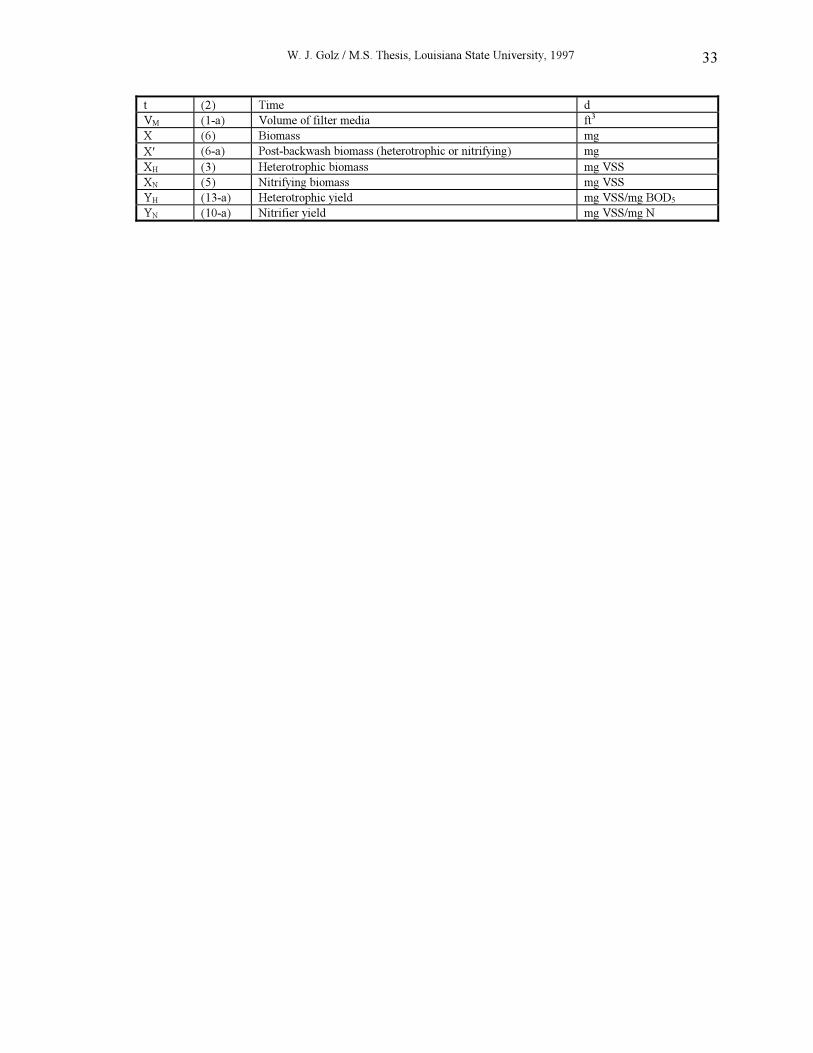
W. J. Golz / M.S. Thesis, Louisiana State University, 1997 33
t (2) Time d
VM (1-a) Volume of filter media ft3
X (6) Biomass mg
X′ (6-a) Post-backwash biomass (heterotrophic or nitrifying) mg
XH (3) Heterotrophic biomass mg VSS
XN (5) Nitrifying biomass mg VSS
YH (13-a) Heterotrophic yield mg VSS/mg BOD5
YN (10-a) Nitrifier yield mg VSS/mg N
W. J. Golz / M.S. Thesis, Louisiana State University, 1997
34
Model Calibration
The model developed in the previous chapter was calibrated to data from a BBF, representing
the gently-washed regime (Sastry 1996), and a PBF, exemplifying the aggressively-washed regime
(Chitta 1993). The BBF had 1 ft3 of media (Appendix A), so to allow the use of a single model, the
PBF data were normalized to 1 ft3 (Appendix B). The model was calibrated to three steady-state
backwash intervals for each system. The particular data sets, identified in each filter’s calibration
section, were chosen to reflect filter behavior at peak loading (1.5-2 lbs feed/ft3/d), near their
minimum and maximum recommended backwash intervals.
A calibration was sought that would provide an error of less than 5% for AT and AB, which are
reflected in CA. CA was most strongly affected by KSO, for all backwash intervals, and to BR for the
shortest intervals in each backwash regime. CA was less-strongly affected by OB, especially at
larger solids concentrations where the postulated oxygen limitation is greatest. OB was, therefore,
selected as a variable of secondary interest, as reflected in OCF. CA was not strongly affected by
variations in KSA, which is to be expected since AB increases with the solids concentration. (It is
quite possible that nitrifying bacteria preferentially utilize TAN that is produced by solids
ammonification and as a heterotrophic metabolite, although electron-donor proximity was not
addressed by this model because no structure was imposed on substrate production).
The model parameters can be divided into three classes. System constants are values imposed
on the model by the operational conditions of the experimental system and were not varied to
achieve calibration. These include the BBF and PBF system values--e.g. QR, VT, and OT
(Appendixes A and B). Aquacultural-waste excretion rates and characteristics, adopted from
average literature values, are also system constants (Appendix C).
Calibration constants were adjusted within literature norms to provide an initial calibration and
were fixed thereafter (Appendix C). The calibration constants included the Monod values for the
growth of heterotrophic and nitrifying bacteria, half saturation of BOD5 and TAN, and the specific
solids-decay rate. All of these values were held constant for both regimes, across all backwash
intervals. BR took on a single value specific to each filter type.
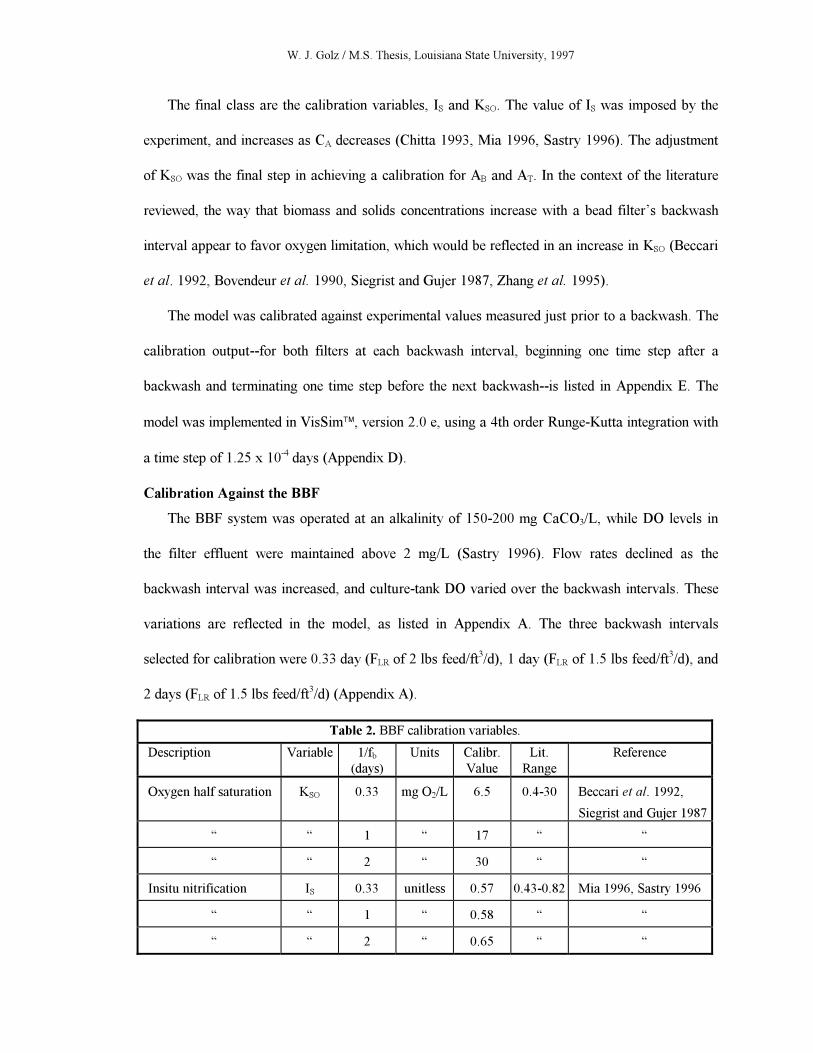
W. J. Golz / M.S. Thesis, Louisiana State University, 1997
The final class are the calibration variables, IS and KSO. The value of IS was imposed by the
experiment, and increases as CA decreases (Chitta 1993, Mia 1996, Sastry 1996). The adjustment
of KSO was the final step in achieving a calibration for AB and AT. In the context of the literature
reviewed, the way that biomass and solids concentrations increase with a bead filter’s backwash
interval appear to favor oxygen limitation, which would be reflected in an increase in KSO (Beccari
et al. 1992, Bovendeur et al. 1990, Siegrist and Gujer 1987, Zhang et al. 1995).
The model was calibrated against experimental values measured just prior to a backwash. The
calibration output--for both filters at each backwash interval, beginning one time step after a
backwash and terminating one time step before the next backwash--is listed in Appendix E. The
model was implemented in VisSim, version 2.0 e, using a 4th order Runge-Kutta integration with
a time step of 1.25 x 10⁻⁴ days (Appendix D).
Calibration Against the BBF
The BBF system was operated at an alkalinity of 150-200 mg CaCO3/L, while DO levels in
the filter effluent were maintained above 2 mg/L (Sastry 1996). Flow rates declined as the
backwash interval was increased, and culture-tank DO varied over the backwash intervals. These
variations are reflected in the model, as listed in Appendix A. The three backwash intervals
selected for calibration were 0.33 day (FLR of 2 lbs feed/ft3/d), 1 day (FLR of 1.5 lbs feed/ft3/d), and
2 days (FLR of 1.5 lbs feed/ft3/d) (Appendix A).
Table 2. BBF calibration variables.
Description Variable 1/fb(days)
Units Calibr.
Value
Lit.
Range
Reference
Oxygen half saturation KSO 0.33 mg O2/L 6.5 0.4-30 Beccari et al. 1992,
Siegrist and Gujer 1987
“ “ 1 “ 17 “ “
“ “ 2 “ 30 “ “
Insitu nitrification IS 0.33 unitless 0.57 0.43-0.82 Mia 1996, Sastry 1996
“ “ 1 “ 0.58 “ “
“ “ 2 “ 0.65 “ “
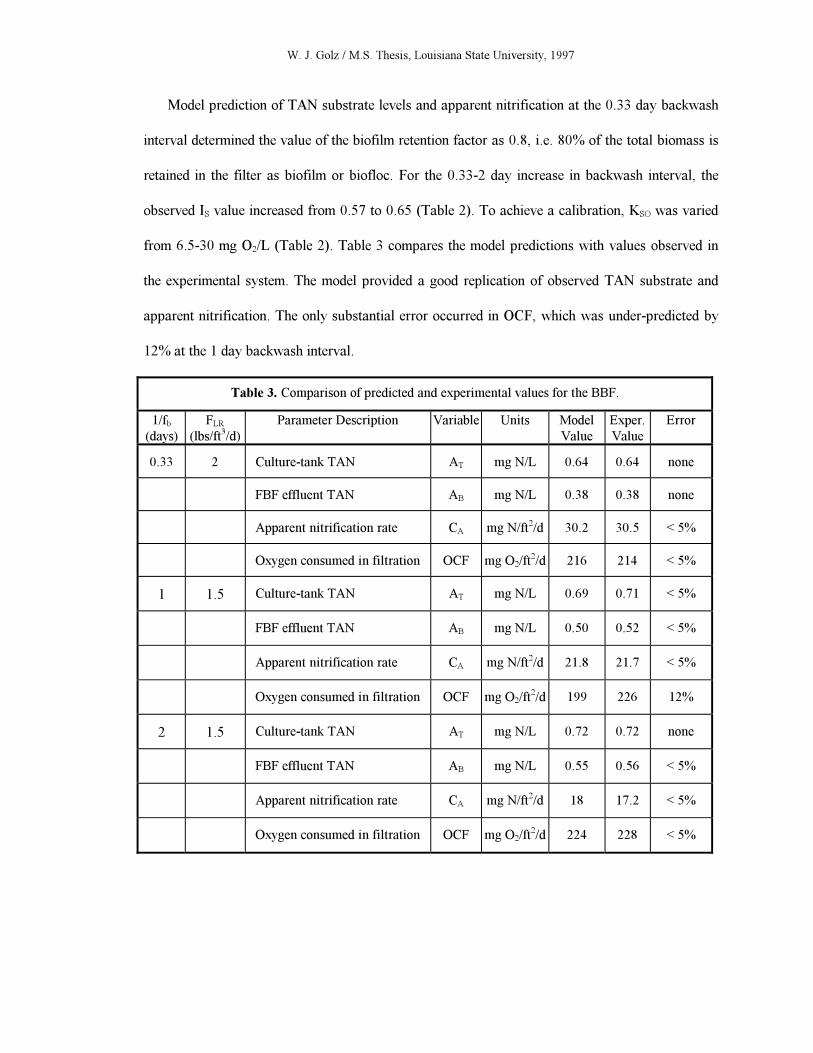
W. J. Golz / M.S. Thesis, Louisiana State University, 1997
Model prediction of TAN substrate levels and apparent nitrification at the 0.33 day backwash
interval determined the value of the biofilm retention factor as 0.8, i.e. 80% of the total biomass is
retained in the filter as biofilm or biofloc. For the 0.33-2 day increase in backwash interval, the
observed IS value increased from 0.57 to 0.65 (Table 2). To achieve a calibration, KSO was varied
from 6.5-30 mg O2/L (Table 2). Table 3 compares the model predictions with values observed in
the experimental system. The model provided a good replication of observed TAN substrate and
apparent nitrification. The only substantial error occurred in OCF, which was under-predicted by
12% at the 1 day backwash interval.
Table 3. Comparison of predicted and experimental values for the BBF.
1/fb(days)
FLR
(lbs/ft3/d)
Parameter Description Variable Units Model
Value
Exper.
Value
Error
0.33 2 Culture-tank TAN AT mg N/L 0.64 0.64 none
FBF effluent TAN AB mg N/L 0.38 0.38 none
Apparent nitrification rate CA mg N/ft2/d 30.2 30.5 < 5%
Oxygen consumed in filtration OCF mg O2/ft2/d 216 214 < 5%
1 1.5 Culture-tank TAN AT mg N/L 0.69 0.71 < 5%
FBF effluent TAN AB mg N/L 0.50 0.52 < 5%
Apparent nitrification rate CA mg N/ft2/d 21.8 21.7 < 5%
Oxygen consumed in filtration OCF mg O2/ft2/d 199 226 12%
2 1.5 Culture-tank TAN AT mg N/L 0.72 0.72 none
FBF effluent TAN AB mg N/L 0.55 0.56 < 5%
Apparent nitrification rate CA mg N/ft2/d 18 17.2 < 5%
Oxygen consumed in filtration OCF mg O2/ft2/d 224 228 < 5%
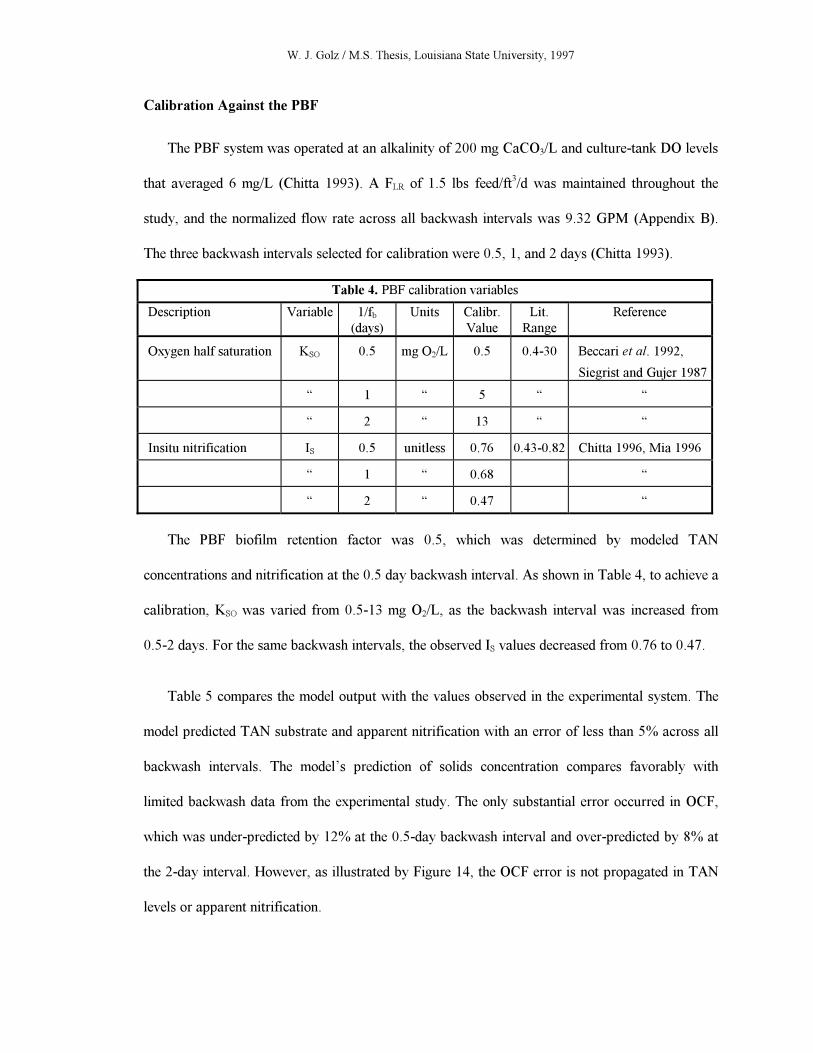
W. J. Golz / M.S. Thesis, Louisiana State University, 1997
Calibration Against the PBF
The PBF system was operated at an alkalinity of 200 mg CaCO3/L and culture-tank DO levels
that averaged 6 mg/L (Chitta 1993). A FLR of 1.5 lbs feed/ft3/d was maintained throughout the
study, and the normalized flow rate across all backwash intervals was 9.32 GPM (Appendix B).
The three backwash intervals selected for calibration were 0.5, 1, and 2 days (Chitta 1993).
Table 4. PBF calibration variables
Description Variable 1/fb(days)
Units Calibr.
Value
Lit.
Range
Reference
Oxygen half saturation KSO 0.5 mg O2/L 0.5 0.4-30 Beccari et al. 1992,
Siegrist and Gujer 1987
“ 1 “ 5 “ “
“ 2 “ 13 “ “
Insitu nitrification IS 0.5 unitless 0.76 0.43-0.82 Chitta 1996, Mia 1996
“ 1 “ 0.68 “
“ 2 “ 0.47 “
The PBF biofilm retention factor was 0.5, which was determined by modeled TAN
concentrations and nitrification at the 0.5 day backwash interval. As shown in Table 4, to achieve a
calibration, KSO was varied from 0.5-13 mg O2/L, as the backwash interval was increased from
0.5-2 days. For the same backwash intervals, the observed IS values decreased from 0.76 to 0.47.
Table 5 compares the model output with the values observed in the experimental system. The
model predicted TAN substrate and apparent nitrification with an error of less than 5% across all
backwash intervals. The model’s prediction of solids concentration compares favorably with
limited backwash data from the experimental study. The only substantial error occurred in OCF,
which was under-predicted by 12% at the 0.5-day backwash interval and over-predicted by 8% at
the 2-day interval. However, as illustrated by Figure 14, the OCF error is not propagated in TAN
levels or apparent nitrification.
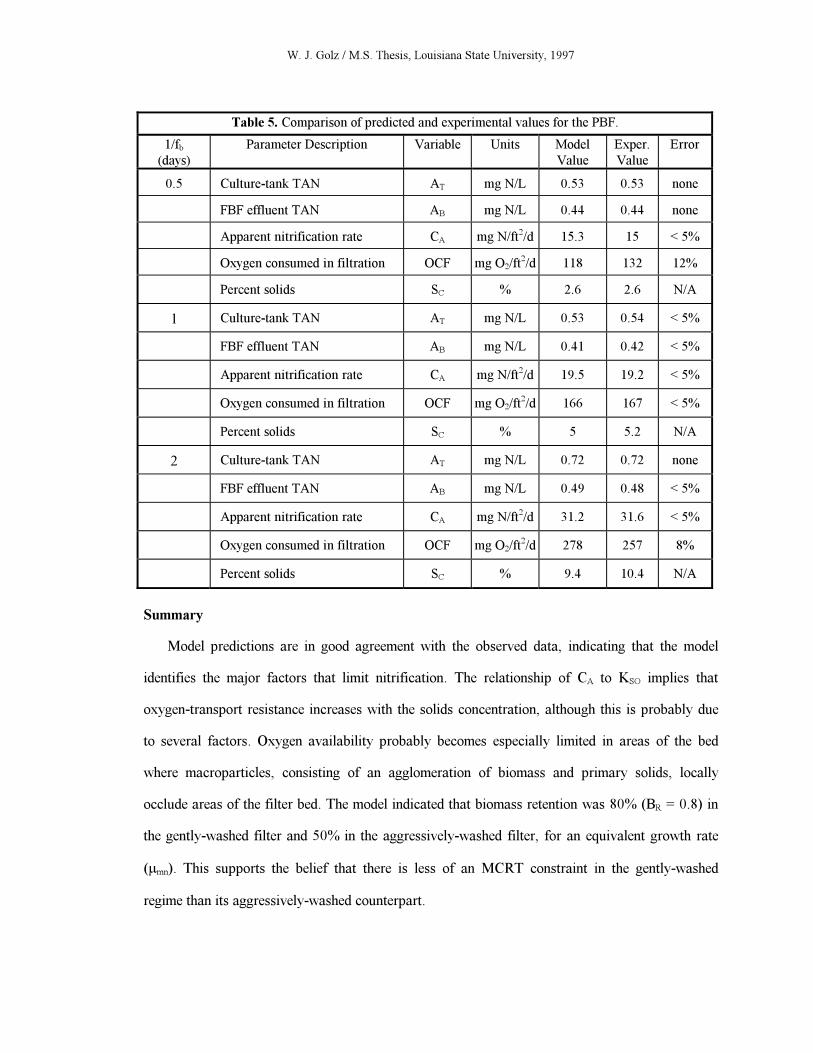
W. J. Golz / M.S. Thesis, Louisiana State University, 1997
Table 5. Comparison of predicted and experimental values for the PBF.
1/fb(days)
Parameter Description Variable Units Model
Value
Exper.
Value
Error
0.5 Culture-tank TAN AT mg N/L 0.53 0.53 none
FBF effluent TAN AB mg N/L 0.44 0.44 none
Apparent nitrification rate CA mg N/ft2/d 15.3 15 < 5%
Oxygen consumed in filtration OCF mg O2/ft2/d 118 132 12%
Percent solids SC % 2.6 2.6 N/A
1 Culture-tank TAN AT mg N/L 0.53 0.54 < 5%
FBF effluent TAN AB mg N/L 0.41 0.42 < 5%
Apparent nitrification rate CA mg N/ft2/d 19.5 19.2 < 5%
Oxygen consumed in filtration OCF mg O2/ft2/d 166 167 < 5%
Percent solids SC % 5 5.2 N/A
2 Culture-tank TAN AT mg N/L 0.72 0.72 none
FBF effluent TAN AB mg N/L 0.49 0.48 < 5%
Apparent nitrification rate CA mg N/ft2/d 31.2 31.6 < 5%
Oxygen consumed in filtration OCF mg O2/ft2/d 278 257 8%
Percent solids SC % 9.4 10.4 N/A
Summary
Model predictions are in good agreement with the observed data, indicating that the model
identifies the major factors that limit nitrification. The relationship of CA to KSO implies that
oxygen-transport resistance increases with the solids concentration, although this is probably due
to several factors. Oxygen availability probably becomes especially limited in areas of the bed
where macroparticles, consisting of an agglomeration of biomass and primary solids, locally
occlude areas of the filter bed. The model indicated that biomass retention was 80% (BR = 0.8) in
the gently-washed filter and 50% in the aggressively-washed filter, for an equivalent growth rate
(µmn). This supports the belief that there is less of an MCRT constraint in the gently-washed
regime than its aggressively-washed counterpart.
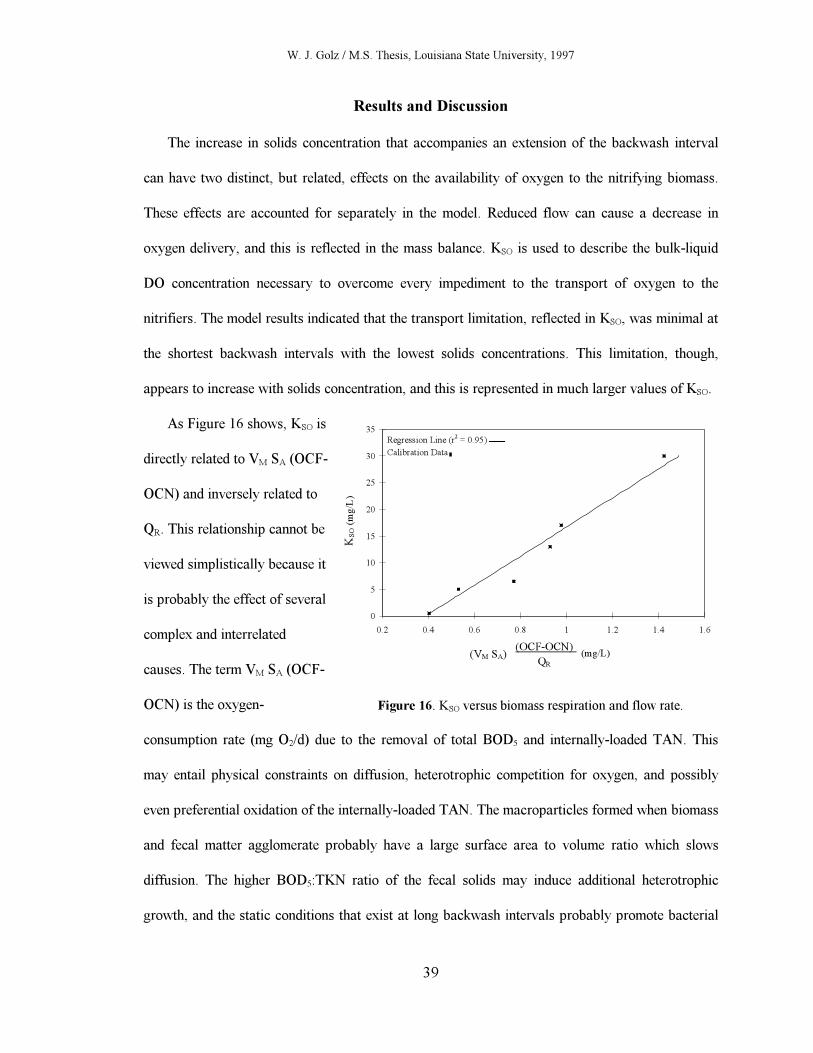
W. J. Golz / M.S. Thesis, Louisiana State University, 1997
39
Results and Discussion
The increase in solids concentration that accompanies an extension of the backwash interval
can have two distinct, but related, effects on the availability of oxygen to the nitrifying biomass.
These effects are accounted for separately in the model. Reduced flow can cause a decrease in
oxygen delivery, and this is reflected in the mass balance. KSO is used to describe the bulk-liquid
DO concentration necessary to overcome every impediment to the transport of oxygen to the
nitrifiers. The model results indicated that the transport limitation, reflected in KSO, was minimal at
the shortest backwash intervals with the lowest solids concentrations. This limitation, though,
appears to increase with solids concentration, and this is represented in much larger values of KSO.
As Figure 16 shows, KSO is
directly related to VM SA (OCF-
OCN) and inversely related to
QR. This relationship cannot be
viewed simplistically because it
is probably the effect of several
complex and interrelated
causes. The term VM SA (OCF-
OCN) is the oxygen-
0
5
10
15
20
25
30
35
0.2 0.4 0.6 0.8 1 1.2 1.4 1.6
(OCF-OCN)
QR
KSO
(mg/L
)
Regression Line (r2 = 0.95)
Calibration Data
(mg/L)(VM SA)
Figure 16. KSO versus biomass respiration and flow rate.
consumption rate (mg O2/d) due to the removal of total BOD5 and internally-loaded TAN. This
may entail physical constraints on diffusion, heterotrophic competition for oxygen, and possibly
even preferential oxidation of the internally-loaded TAN. The macroparticles formed when biomass
and fecal matter agglomerate probably have a large surface area to volume ratio which slows
diffusion. The higher BOD5:TKN ratio of the fecal solids may induce additional heterotrophic
growth, and the static conditions that exist at long backwash intervals probably promote bacterial
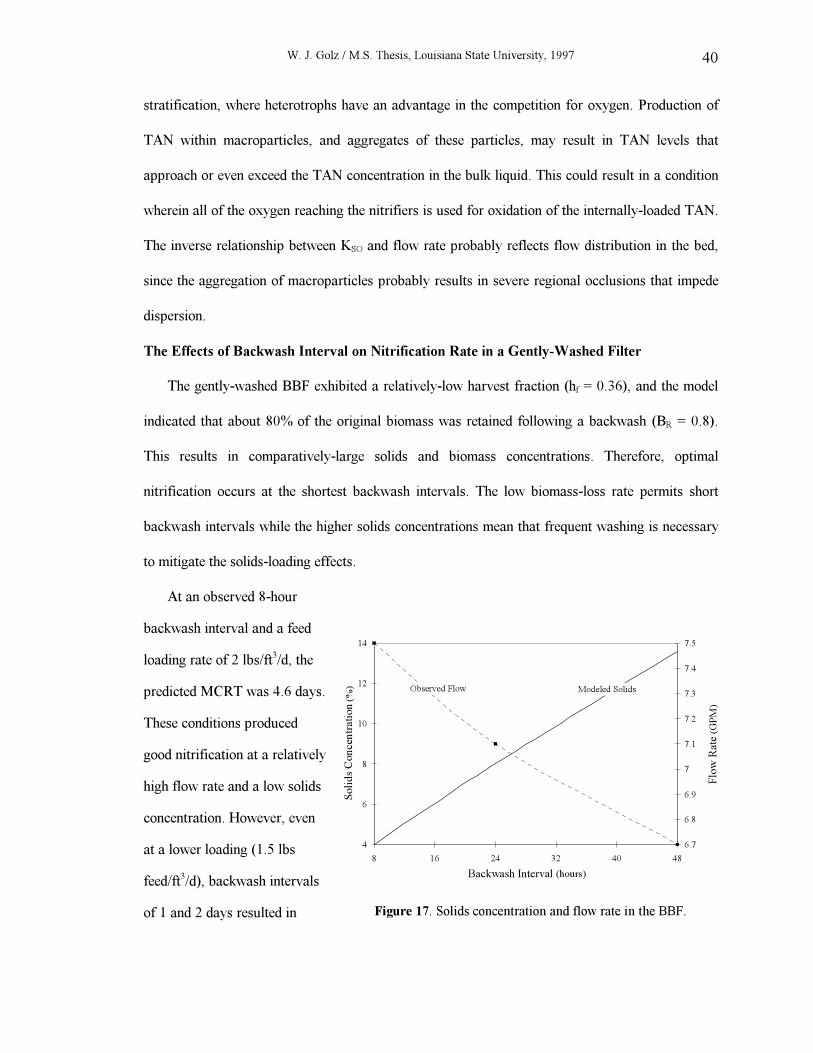
W. J. Golz / M.S. Thesis, Louisiana State University, 1997 40
stratification, where heterotrophs have an advantage in the competition for oxygen. Production of
TAN within macroparticles, and aggregates of these particles, may result in TAN levels that
approach or even exceed the TAN concentration in the bulk liquid. This could result in a condition
wherein all of the oxygen reaching the nitrifiers is used for oxidation of the internally-loaded TAN.
The inverse relationship between KSO and flow rate probably reflects flow distribution in the bed,
since the aggregation of macroparticles probably results in severe regional occlusions that impede
dispersion.
The Effects of Backwash Interval on Nitrification Rate in a Gently-Washed Filter
The gently-washed BBF exhibited a relatively-low harvest fraction (hf = 0.36), and the model
indicated that about 80% of the original biomass was retained following a backwash (BR = 0.8).
This results in comparatively-large solids and biomass concentrations. Therefore, optimal
nitrification occurs at the shortest backwash intervals. The low biomass-loss rate permits short
backwash intervals while the higher solids concentrations mean that frequent washing is necessary
to mitigate the solids-loading effects.
At an observed 8-hour
backwash interval and a feed
loading rate of 2 lbs/ft3/d, the
predicted MCRT was 4.6 days.
These conditions produced
good nitrification at a relatively
high flow rate and a low solids
concentration. However, even
at a lower loading (1.5 lbs
feed/ft3/d), backwash intervals
of 1 and 2 days resulted in
4
6
8
10
12
14
8 16 24 32 40 48
Backwash Interval (hours)
Soli
ds C
oncentr
ati
on
(%
)
6.7
6.8
6.9
7
7.1
7.2
7.3
7.4
7.5
Flo
w R
ate
(G
PM
)
Modeled SolidsObserved Flow
Figure 17. Solids concentration and flow rate in the BBF.
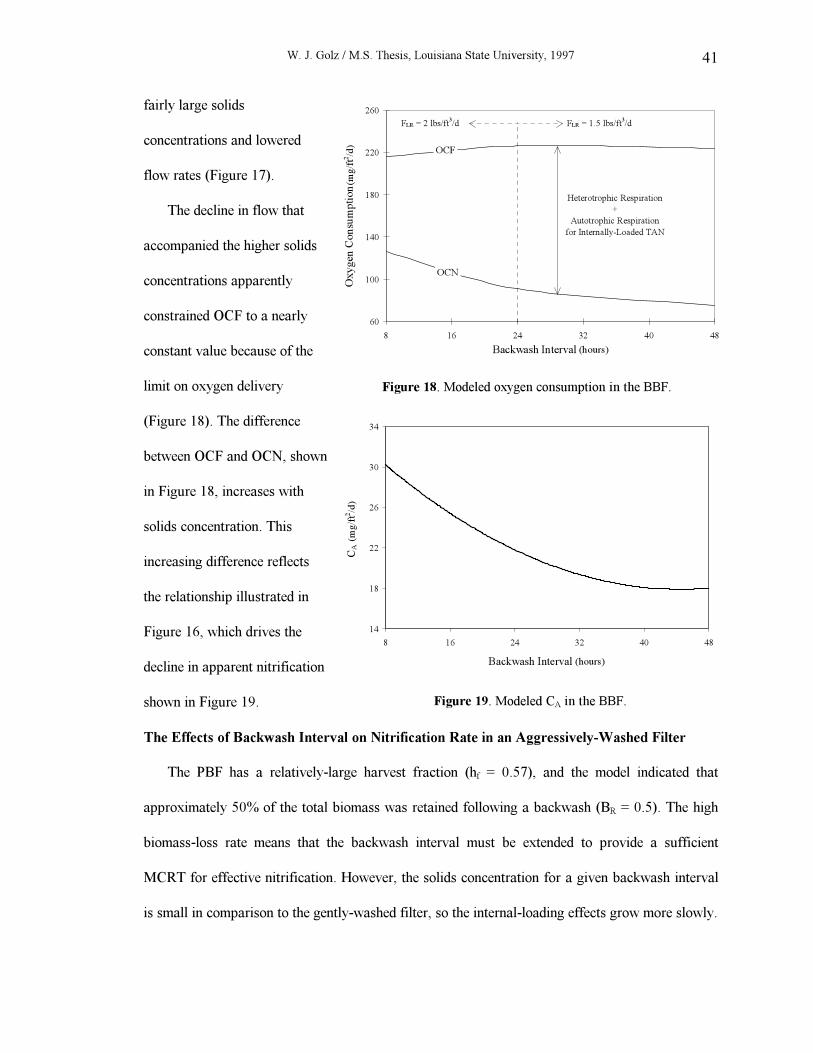
W. J. Golz / M.S. Thesis, Louisiana State University, 1997 41
fairly large solids
concentrations and lowered
flow rates (Figure 17).
The decline in flow that
accompanied the higher solids
concentrations apparently
constrained OCF to a nearly
constant value because of the
limit on oxygen delivery
60
100
140
180
220
260
8 16 24 32 40 48
Backwash Interval (hours)O
xygen
Consu
mpti
on (m
g/ft2/d)
OCN
Heterotrophic Respiration
+
Autotrophic Respiration
for Internally-Loaded TAN
OCF
FLR = 1.5 lbs/ft3/dFLR = 2 lbs/ft
3/d
Figure 18. Modeled oxygen consumption in the BBF.
(Figure 18). The difference
between OCF and OCN, shown
in Figure 18, increases with
solids concentration. This
increasing difference reflects
the relationship illustrated in
Figure 16, which drives the
decline in apparent nitrification
shown in Figure 19.
14
18
22
26
30
34
8 16 24 32 40 48
Backwash Interval (hours)
CA
(mg/ft2/d)
Figure 19. Modeled CA in the BBF.
The Effects of Backwash Interval on Nitrification Rate in an Aggressively-Washed Filter
The PBF has a relatively-large harvest fraction (hf = 0.57), and the model indicated that
approximately 50% of the total biomass was retained following a backwash (BR = 0.5). The high
biomass-loss rate means that the backwash interval must be extended to provide a sufficient
MCRT for effective nitrification. However, the solids concentration for a given backwash interval
is small in comparison to the gently-washed filter, so the internal-loading effects grow more slowly.
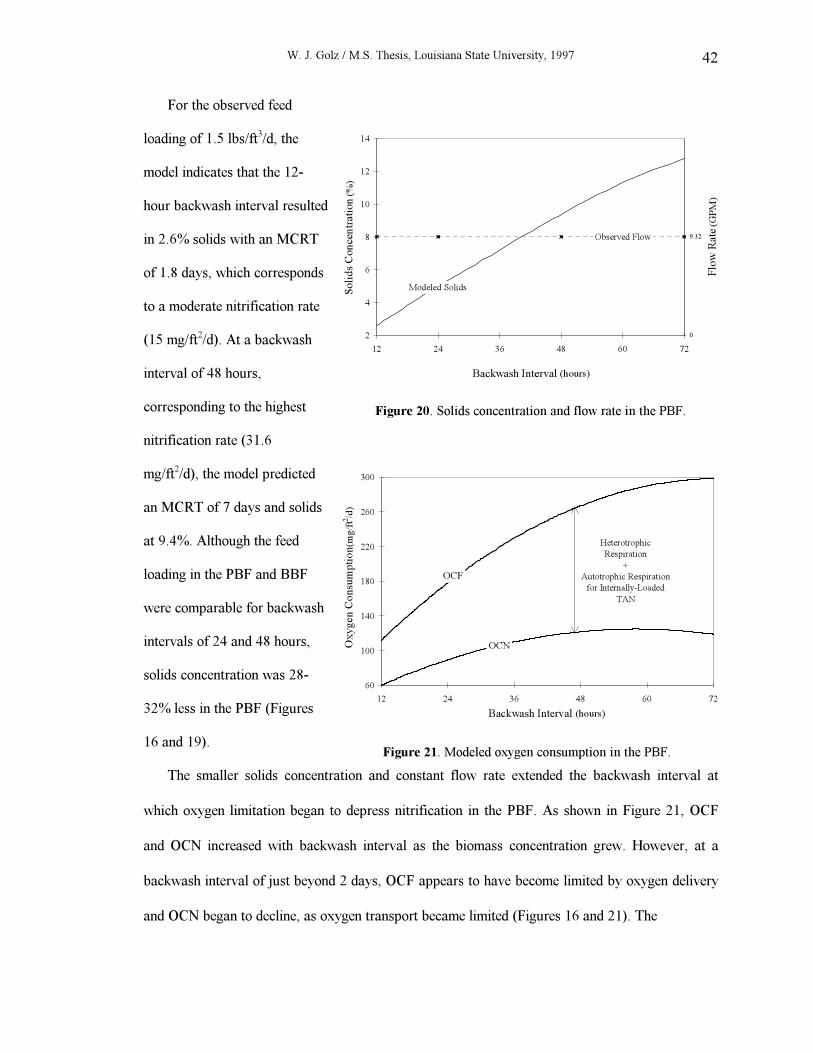
W. J. Golz / M.S. Thesis, Louisiana State University, 1997 42
For the observed feed
loading of 1.5 lbs/ft3/d, the
model indicates that the 12-
hour backwash interval resulted
in 2.6% solids with an MCRT
of 1.8 days, which corresponds
to a moderate nitrification rate
(15 mg/ft2/d). At a backwash
interval of 48 hours,
corresponding to the highest
2
4
6
8
10
12
14
12 24 36 48 60 72
Backwash Interval (hours)
Soli
ds C
oncentr
ati
on (%)
0
9.32
Flo
w R
ate
(GPM)
Observed Flow
Modeled Solids
Figure 20. Solids concentration and flow rate in the PBF.
nitrification rate (31.6
mg/ft2/d), the model predicted
an MCRT of 7 days and solids
at 9.4%. Although the feed
loading in the PBF and BBF
were comparable for backwash
intervals of 24 and 48 hours,
solids concentration was 28-
32% less in the PBF (Figures
16 and 19).
60
100
140
180
220
260
300
12 24 36 48 60 72
Backwash Interval (hours)
Ox
yg
en
Co
nsu
mp
tio
n (m
g/ft2/d)
OCF
OCN
Heterotrophic
Respiration
+
Autotrophic Respiration
for Internally-Loaded
TAN
Figure 21. Modeled oxygen consumption in the PBF.
The smaller solids concentration and constant flow rate extended the backwash interval at
which oxygen limitation began to depress nitrification in the PBF. As shown in Figure 21, OCF
and OCN increased with backwash interval as the biomass concentration grew. However, at a
backwash interval of just beyond 2 days, OCF appears to have become limited by oxygen delivery
and OCN began to decline, as oxygen transport became limited (Figures 16 and 21). The
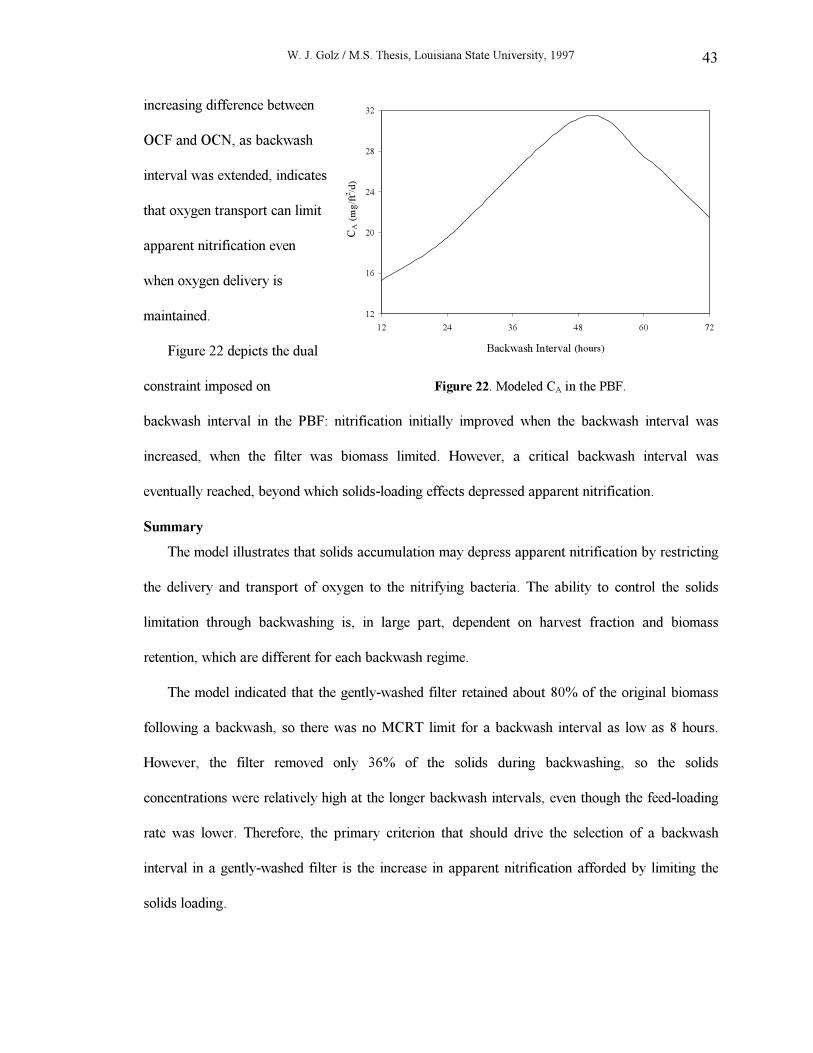
W. J. Golz / M.S. Thesis, Louisiana State University, 1997 43
increasing difference between
OCF and OCN, as backwash
interval was extended, indicates
that oxygen transport can limit
apparent nitrification even
when oxygen delivery is
maintained.
Figure 22 depicts the dual
constraint imposed on
12
16
20
24
28
32
12 24 36 48 60 72
Backwash Interval (hours)C
A
(mg/ft2/d)
Figure 22. Modeled CA in the PBF.
backwash interval in the PBF: nitrification initially improved when the backwash interval was
increased, when the filter was biomass limited. However, a critical backwash interval was
eventually reached, beyond which solids-loading effects depressed apparent nitrification.
Summary
The model illustrates that solids accumulation may depress apparent nitrification by restricting
the delivery and transport of oxygen to the nitrifying bacteria. The ability to control the solids
limitation through backwashing is, in large part, dependent on harvest fraction and biomass
retention, which are different for each backwash regime.
The model indicated that the gently-washed filter retained about 80% of the original biomass
following a backwash, so there was no MCRT limit for a backwash interval as low as 8 hours.
However, the filter removed only 36% of the solids during backwashing, so the solids
concentrations were relatively high at the longer backwash intervals, even though the feed-loading
rate was lower. Therefore, the primary criterion that should drive the selection of a backwash
interval in a gently-washed filter is the increase in apparent nitrification afforded by limiting the
solids loading.
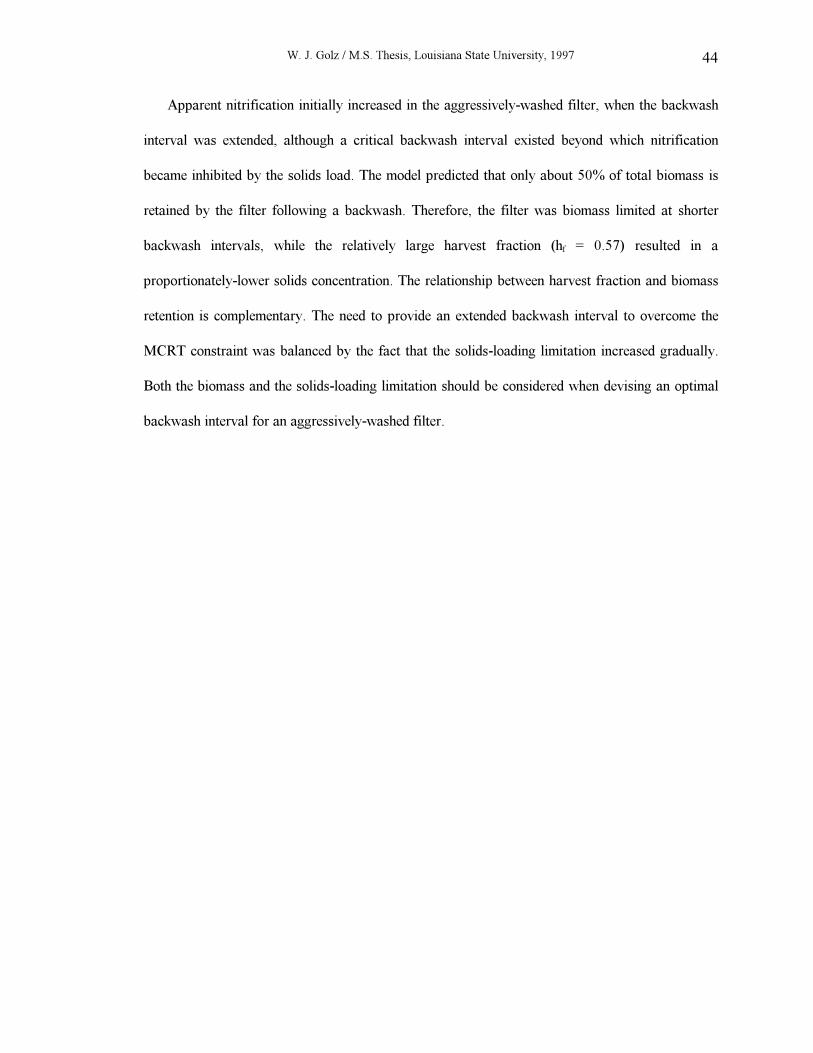
W. J. Golz / M.S. Thesis, Louisiana State University, 1997 44
Apparent nitrification initially increased in the aggressively-washed filter, when the backwash
interval was extended, although a critical backwash interval existed beyond which nitrification
became inhibited by the solids load. The model predicted that only about 50% of total biomass is
retained by the filter following a backwash. Therefore, the filter was biomass limited at shorter
backwash intervals, while the relatively large harvest fraction (hf = 0.57) resulted in a
proportionately-lower solids concentration. The relationship between harvest fraction and biomass
retention is complementary. The need to provide an extended backwash interval to overcome the
MCRT constraint was balanced by the fact that the solids-loading limitation increased gradually.
Both the biomass and the solids-loading limitation should be considered when devising an optimal
backwash interval for an aggressively-washed filter.
W. J. Golz / M.S. Thesis, Louisiana State University, 1997
45
Conclusions
Solids Limitations
The experimental results, the literature reviewed, and the modeled filter behavior are consistent
with a hypothesis wherein solids accumulation depresses apparent nitrification through:
(1) A reduction in the mass-delivery rate of oxygen caused by decreased flow.
(2) The inhibition of oxygen transport due to:
a) decreased flow, which constrains dispersion;
b) heterotrophic competition for oxygen; and
c) the preferential oxidation of internally-loaded TAN.
Backwash-Regime Limitations
It is well documented that the backwash interval at which optimal nitrification occurs is
determined by backwash regime (Chitta 1993, Sastry 1995, Wimberly 1990). Model results
indicate that this optimum interval is determined by biomass retention and harvest fraction:
(3) The gently-washed filter exhibited:
a) a low harvest fraction (hf = 0.36), resulting in a rapid growth of solids
concentration; b) high biomass retention (BR = 0.8), with no MCRT limit at an 8 hour
interval; and
c) optimal nitrification at the shortest backwash interval studied.
(4) The aggressively-washed filter exhibited:
a) a high harvest fraction (hf = 0.57), with a gradual growth in solids concentration;
b) high biomass loss (BR = 0.5), with an initial MCRT limit; and
c) optimal nitrification at a critical backwash interval.
W. J. Golz / M.S. Thesis, Louisiana State University, 1997
46
Recommendations
Model Improvements
The model’s predictive capability is limited by the relationship of insitu nitrification to
nitrification taking place in the filter:
(1) The relationship between insitu an in-filter nitrification should be defined to enable the
model to predict filter behavior outside of its calibration limits and
(2) The predictive model should be validated and, if necessary, recalibrated by comparing
model predictions to variations of the following parameters in an experimental system:
a) Oxygen;
b) Flow; and
c) Organic loading
Filter Improvements
The model and the literature indicate that an ideal nitrifying biofilter will have no organic or
particulate solids loading, high biomass retention, a large and sustainable flow rate, and a high
dissolved-oxygen concentration. The following design improvements should be studied collectively
(reasons):
(1) Increased harvest fraction (solids-loading reduction);
(2) Increased biomass retention (increased MCRT);
(3) Increased porosity (higher flow rates and more area for biomass growth);
(4) Increased oxygen concentrations (oxygen-limitation reduction); and
(5) Precise biofilm-thickness management (critical thickness of substrate penetration).
W. J. Golz / M.S. Thesis, Louisiana State University, 1997
47
References
Adams, C. E., Jr., W. W. Eckenfelder, Jr., and R. M. Stein (1974) “Modifications to Aerobic
Digester Design.” Wat. Res., 8:213-218. Cited by L. G. Rich (1982): p. 538.
Barnard, J. L. (1978) Private Communication. Cited by L. G. Rich (1982): p. 538.
Barnhart, E. L. (1961) “Application of Aerobic Digestion to Industrial Waste Treatment.”
Proceedings 16th Purdue Industrial Waste Conference:612-618. Cited by L. G. Rich (1982):
p. 538.
Beccari, M., A. C. Di Pinto, R. Ramadori, and M. C. Tomei (1992) “Effects of Dissolved Oxygen
and Diffusion Resistances on Nitrification Kinetics.” Wat. Res., 26:1099-1104.
Bhaskar, G. V. and S. M. Rao Bhamidimarri (1991) “Approximate Analytical Solutions for a
Biofilm Reactor Model with Monod Kinetics and Product Inhibition.” The Canadian Journal
of Chemical Engineering, 69:544-547.
Bovendeur, J., A. B. Zwaga, B. G. J. Lobee, and J. H. Blom (1990) “Fixed-Biofilm Reactors in
Aquacultural Water Recycle Systems: Effect of Organic Matter on Nitrification Kinetics.”
Wat. Res., 24:207-213.
Chen, S., D. E. Coffin, & R. F. Malone (1991) “Sludge Management for Recirculating
Aquaculture Systems,” in Design of High-Density Recirculating Aquaculture Systems, a
proceedings of a workshop, Louisiana State University, Baton Rouge, LA, September 25-27.
Chitta, B. S. (1993) “Effects of Backwash Frequency on Nitrification in Plastic Bead Media
Biofilters Used in Recirculating Finfish Culture Systems.” M.S. Thesis, Louisiana State
University.
Coffin, D. E. (1993) “Impact of Solids Retention Time on Sludge Production from Low Density
Media Expandable Granular Biofilters.” M.S. Thesis, Louisiana State University.
Cooley, P. E. (1979) “Nitrification of Fish-Hatchery Reuse Water Utilizing Low-Density
Polyethylene Beads as a Fixed-Film Media Type.” M.S. Thesis, University of Idaho.
Corbitt, R. A., ed. (1990) Standard Handbook of Environmental Engineering. New York:
McGraw-Hill.
Drennan, D. G., W. Golz, H. Ahmed, and R. F. Malone (1995) “Clarification Abilities of Floating-
Bead Filters Used In Recirculating Aquaculture Systems,” in Aquacultural Expo VIII:
Aquaculture in the Mid Atlantic, a proceedings of a conference of the US Aquaculture
Suppliers, 24-28 June.
Figueroa, L. A. and J. Silverstein (1992) “The Effect of Particulate Organic Matter on Biofilm
Nitrification.” Water Environ. Res., 64:728-733.
W. J. Golz / M.S. Thesis, Louisiana State University, 1997 48
Golz, W., K. A. Rusch, and R.F. Malone (1996) “Developing Backwash Protocols for Floating-
Bead Filters: A Model of Solids-Loading and Biofilm-Retention Effects on Nitrification,” in
Successes and Failures in Commercial Recirculating Aquaculture, a proceedings of a
conference of the Aquacultural Engineering Society, sponsored by Virginia Polytechnic
Institute and Northeast Regional Aquacultural Engineering Service, Roanoke, Virginia, July
19-21.
Gonza′les-Martinez, S. and J. Duque-Luciano (1992) “Aerobic Submerged Biofilm Reactors for
Wastewater Treatment.” Wat. Res., 26: 25-833.
Goodman, B. L., & A. J. Englande, Jr. (1975) “A Unified Model of the Activated Sludge Process.”
J. Water Pollut. Control Fed., 46:312-332. Cited by L. G. Rich (1982): p. 538.
Gordon, J. A. (1974) “Water Characterization Studies for High-Density Raceway Production of
Catfish-The Galatin Project,” in Proceedings of the 29th Purdue Industrial Waste
Conference. Chelsea, MD: Lewis Publishers.
Hanaki, K., C. Wantawin, and S. Ohgaki (1990) “Nitrification at Low Levels of Dissolved Oxygen
With and Without Organic Loading in a Suspended Growth Reactor.” Wat. Res., 24:297-302.
Hochheimer, J. N. and F. W. Wheaton (1991) “Understanding Biofilters, Practical Microbiology
for Ammonia Removal in Aquaculture,” in Engineering Aspects of Intensive Aquaculture, a
proceedings of the Aquaculture Symposium, Cornell University, Ithaca, New York April 4-6.
Losordo, T. M. and P. Westerman (1991) “An Analysis of Biological, Economic, and Engineering
Factors Affecting the Cost of Fish Production in Recirculating Aquaculture Systems,” in
Design of High-Density Recirculating Aquaculture Systems, a proceedings of a workshop,
Louisiana State University, Baton Rouge, LA, September 25-27.
Malone, R. F., B. S. Chitta, and D. G. Drennan (1993) “Optimizing Nitrification in Bead Filters
for Warmwater Recirculating Aquaculture Systems,” in Techniques for Modern Aquaculture,
a proceedings of an aquacultural engineering conference, sponsored by the aquacultural
engineering group, a unit of the American Society of Agricultural Engineers, Spokane,
Washington, June 21-23.
Manem, J. A. and B. E. Rittmann (1992) “The Effects of Fluctuations in Biodegradable Organic
Matter on Nitrification Filters.” Jour. AWWA, 84:147-151.
Matsuda, A., T. Ide, & S. Fuji (1988) “Behavior of Nitrogen and Phosphorus During Batch
Aerobic Digestion of Waste Activated Sludge-Continuous Aeration and Intermittent Aeration
by Control of DO.” Wat. Res., 22:1495-1501.
Merritt, F. S., ed. (1983) Standard Handbook for Civil Engineers. 3rd ed. New York: McGraw-
Hill.
Metcalf and Eddy (1991) Wastewater Engineering: Treatment, Disposal, and Reuse. 3rd ed., ed.
G. Tchobanoglous and F. Burton. New York: McGraw-Hill.
Mia, R. A. (1996) “Insitu Nitrification in High Density Recirculating Aquaculture Production
Systems.” M.S. Thesis, Louisiana State University.
W. J. Golz / M.S. Thesis, Louisiana State University, 1997 49
Miller, G. T. (1990) Resource Conservation and Management. Wadsworth Publishing Co:
Belmont, CA.
Murphy, J. P. & R. I. Lipper (1970) “BOD Production of Channel Catfish.” The Progressive Fish
Culturist, 32:195-198.
Ning, Z. (1995) Louisiana State University. Personal Communication, 19 July.
Owsley, D. E. (1993) “Status of U.S. Fish and Wildlife Service Hatcheries with Reuse Systems in
Region 1.” in Techniques for Modern Aquaculture, a proceedings of an aquacultural
engineering conference, sponsored by the aquacultural engineering group, a unit of the
American Society of Agricultural Engineers, Spokane, Washington, June 21-23.
Page, J. W. and J. W. Andrews (1974) “Chemical Composition of Effluents from High Density
Culture of Channel Catfish.” Water, Air, and Soil Pollution, 3:365.
Raune, R. J., T. Y. J. Chu, and V. E. Vandergriff (1977) “Characterization and Treatment of
Waste Discharged from High-Density Catfish Cultures.” Wat. Res., 11:789-800.
Reece, C. S., R. E. Roper, & C. P. L. Grady, Jr. (1979) “Aerobic Digestion of Waste Activated
Sludge.” J. Env. Eng., 105(EE2):261-272. Cited by L. G. Rich (1982): p. 538.
Reynolds, T. D. (1961) “Aerobic Digestion of Thickened Waste Activated Sludge,” in Proceedings
28th Purdue Industrial Waste Conference:12-37. Cited by L. G. Rich (1982): p. 538.
Rich, L. G. (1982) “A Cost Effective System for the Aerobic Stabilization and Disposal of Waste
Activated Sludge Solids.” Wat. Res., 16:535-542.
Rich, L. G., and S. White (1976) Unpublished Laboratory Studies. Cited by L. G. Rich (1982): p.
538.
Sastry, B. N. (1995) “A Comparison of Nitrification Capacity in Bead and Tubular Plastic
Media.” M.S. Thesis, Louisiana State University.
Shammas, N. K. (1986) “Interactions of Temperature, pH, and Biomass on the Nitrification
Process.” J. Water Pollut. Control Fed., 58:52-59.
Sharma, B. and R. C. Ahlert (1977) “Nitrification and Nitrogen Removal.” Wat. Res., 11:897-925.
Siegrist, H. and W. Gujer (1987) “Demonstration of Mass Transfer and pH Effects in a Nitrifying
Biofilm.” Wat. Res., 21:1481-1487.
Smith, J. E., Jr., K. W. Young, and R. B. Dean (1975) “Biological Oxidation and Disinfection of
Sludge.” Wat. Res., 9:17-24. Cited by L. G. Rich (1982): p. 538.
Timberlake, D. L., S. E. Strand, and K. J. Williamson (1988) “Combined Aerobic Heterotrophic
Oxidation, Nitrification, and Denitrification in a Permeable Support Biofilm.” Wat. Res.,
22:1513-1517.
W. J. Golz / M.S. Thesis, Louisiana State University, 1997 50
Viessman, W., Jr., and M. J. Hammer (1985) Water Supply and Pollution Control. 4th ed. New
York: Harper & Row.
Wang, L. (1995) Louisiana State University. Personal Communication, 10 May.
Wimberly, D. M. (1990) “Development and Evaluation of a Low-Density Media Biofiltration Unit
for use in Recirculating Finfish Systems.” M.S. Thesis, Louisiana State University.
Zhang, T. C., Y. C. Fu, and P. L. Bishop (1995) “Competition for Substrate and Space in
Biofilms.” Water Environ. Res. 67: 992-1003.

W. J. Golz / M.S. Thesis, Louisiana State University, 1997
51
Appendix A
BBF-System Model Values
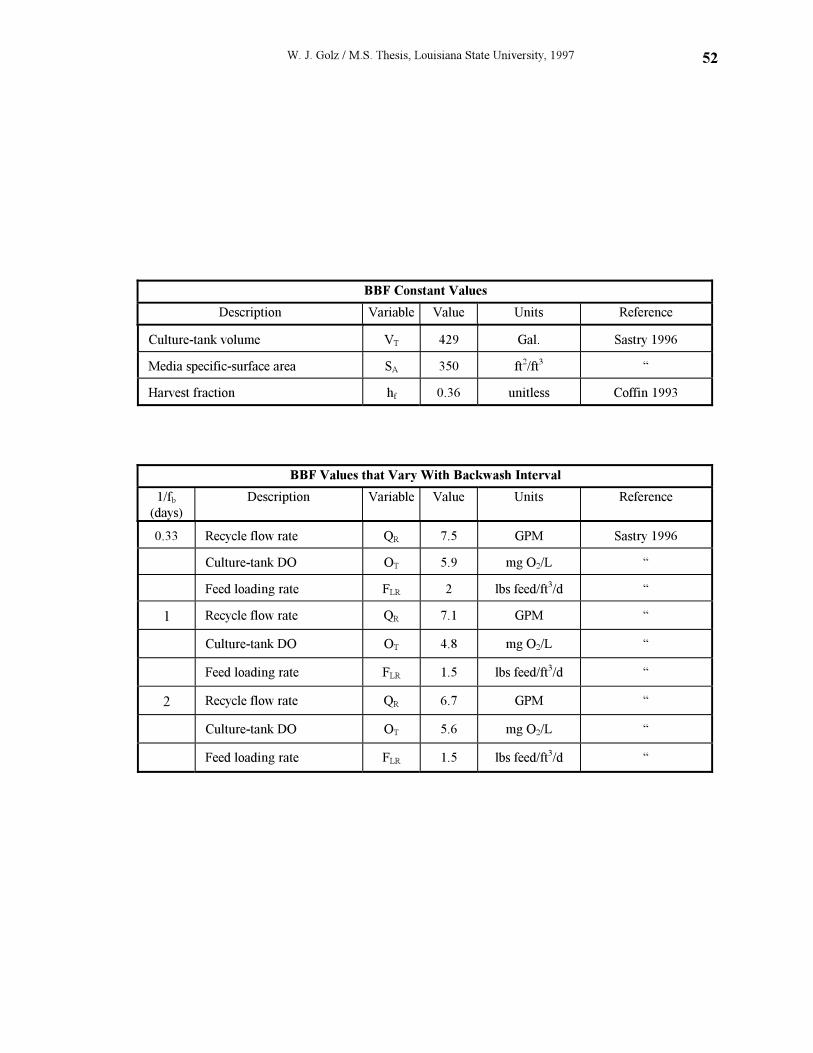
W. J. Golz / M.S. Thesis, Louisiana State University, 1997 52
BBF Constant Values
Description Variable Value Units Reference
Culture-tank volume VT 429 Gal. Sastry 1996
Media specific-surface area SA 350 ft2/ft
3“
Harvest fraction hf 0.36 unitless Coffin 1993
BBF Values that Vary With Backwash Interval
1/fb(days)
Description Variable Value Units Reference
0.33 Recycle flow rate QR 7.5 GPM Sastry 1996
Culture-tank DO OT 5.9 mg O2/L “
Feed loading rate FLR 2 lbs feed/ft3/d “
1 Recycle flow rate QR 7.1 GPM “
Culture-tank DO OT 4.8 mg O2/L “
Feed loading rate FLR 1.5 lbs feed/ft3/d “
2 Recycle flow rate QR 6.7 GPM “
Culture-tank DO OT 5.6 mg O2/L “
Feed loading rate FLR 1.5 lbs feed/ft3/d “
W. J. Golz / M.S. Thesis, Louisiana State University, 1997
53
Appendix B
PBF-System Model Values
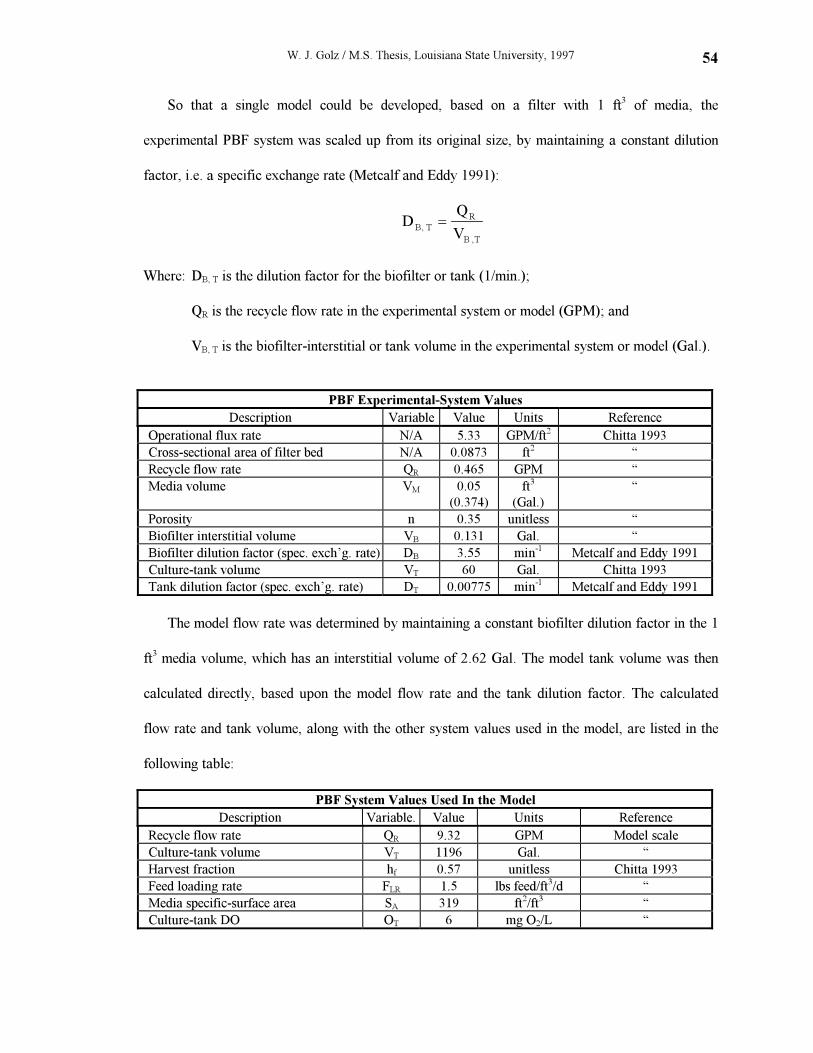
W. J. Golz / M.S. Thesis, Louisiana State University, 1997 54
So that a single model could be developed, based on a filter with 1 ft3 of media, the
experimental PBF system was scaled up from its original size, by maintaining a constant dilution
factor, i.e. a specific exchange rate (Metcalf and Eddy 1991):
DQ
VB T
R
B T
,
,
=
Where: DB, T is the dilution factor for the biofilter or tank (1/min.);
QR is the recycle flow rate in the experimental system or model (GPM); and
VB, T is the biofilter-interstitial or tank volume in the experimental system or model (Gal.).
PBF Experimental-System Values
Description Variable Value Units Reference
Operational flux rate N/A 5.33 GPM/ft2
Chitta 1993
Cross-sectional area of filter bed N/A 0.0873 ft2
“
Recycle flow rate QR 0.465 GPM “
Media volume VM 0.05
(0.374)
ft3
(Gal.)
“
Porosity n 0.35 unitless “
Biofilter interstitial volume VB 0.131 Gal. “
Biofilter dilution factor (spec. exch’g. rate) DB 3.55 min-1
Metcalf and Eddy 1991
Culture-tank volume VT 60 Gal. Chitta 1993
Tank dilution factor (spec. exch’g. rate) DT 0.00775 min-1
Metcalf and Eddy 1991
The model flow rate was determined by maintaining a constant biofilter dilution factor in the 1
ft3 media volume, which has an interstitial volume of 2.62 Gal. The model tank volume was then
calculated directly, based upon the model flow rate and the tank dilution factor. The calculated
flow rate and tank volume, along with the other system values used in the model, are listed in the
following table:
PBF System Values Used In the Model
Description Variable. Value Units Reference
Recycle flow rate QR 9.32 GPM Model scale
Culture-tank volume VT 1196 Gal. “
Harvest fraction hf 0.57 unitless Chitta 1993
Feed loading rate FLR 1.5 lbs feed/ft3/d “
Media specific-surface area SA 319 ft2/ft
3“
Culture-tank DO OT 6 mg O2/L “
W. J. Golz / M.S. Thesis, Louisiana State University, 1997
55
Appendix C
Model Excretion Rates, Waste Characteristics, and Kinetic Constants
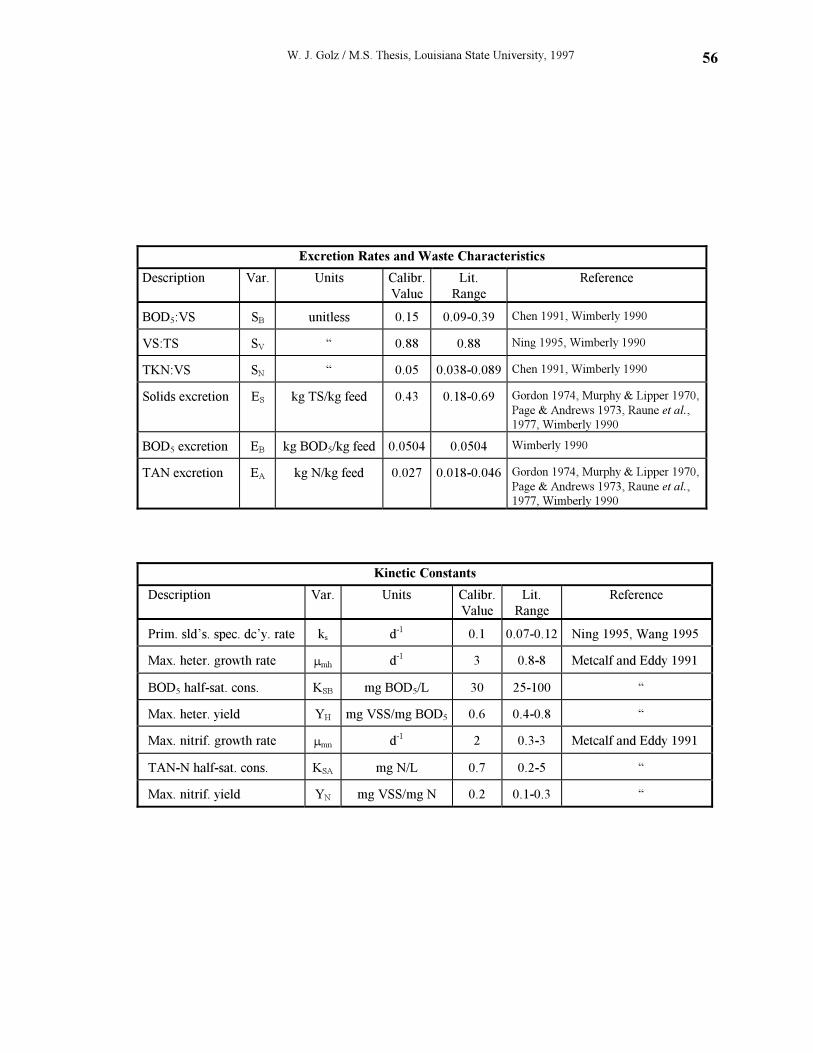
W. J. Golz / M.S. Thesis, Louisiana State University, 1997 56
Excretion Rates and Waste Characteristics
Description Var. Units Calibr.
Value
Lit.
Range
Reference
BOD5:VS SB unitless 0.15 0.09-0.39 Chen 1991, Wimberly 1990
VS:TS SV “ 0.88 0.88 Ning 1995, Wimberly 1990
TKN:VS SN “ 0.05 0.038-0.089 Chen 1991, Wimberly 1990
Solids excretion ES kg TS/kg feed 0.43 0.18-0.69 Gordon 1974, Murphy & Lipper 1970,
Page & Andrews 1973, Raune et al.,
1977, Wimberly 1990
BOD5 excretion EB kg BOD5/kg feed 0.0504 0.0504 Wimberly 1990
TAN excretion EA kg N/kg feed 0.027 0.018-0.046 Gordon 1974, Murphy & Lipper 1970,
Page & Andrews 1973, Raune et al.,
1977, Wimberly 1990
Kinetic Constants
Description Var. Units Calibr.
Value
Lit.
Range
Reference
Prim. sld’s. spec. dc’y. rate ks d-1
0.1 0.07-0.12 Ning 1995, Wang 1995
Max. heter. growth rate µmh d-1
3 0.8-8 Metcalf and Eddy 1991
BOD5 half-sat. cons. KSB mg BOD5/L 30 25-100 “
Max. heter. yield YH mg VSS/mg BOD5 0.6 0.4-0.8 “
Max. nitrif. growth rate µmn d-1
2 0.3-3 Metcalf and Eddy 1991
TAN-N half-sat. cons. KSA mg N/L 0.7 0.2-5 “
Max. nitrif. yield YN mg VSS/mg N 0.2 0.1-0.3 “
W. J. Golz / M.S. Thesis, Louisiana State University, 1997
57
Appendix D
VisSim Model
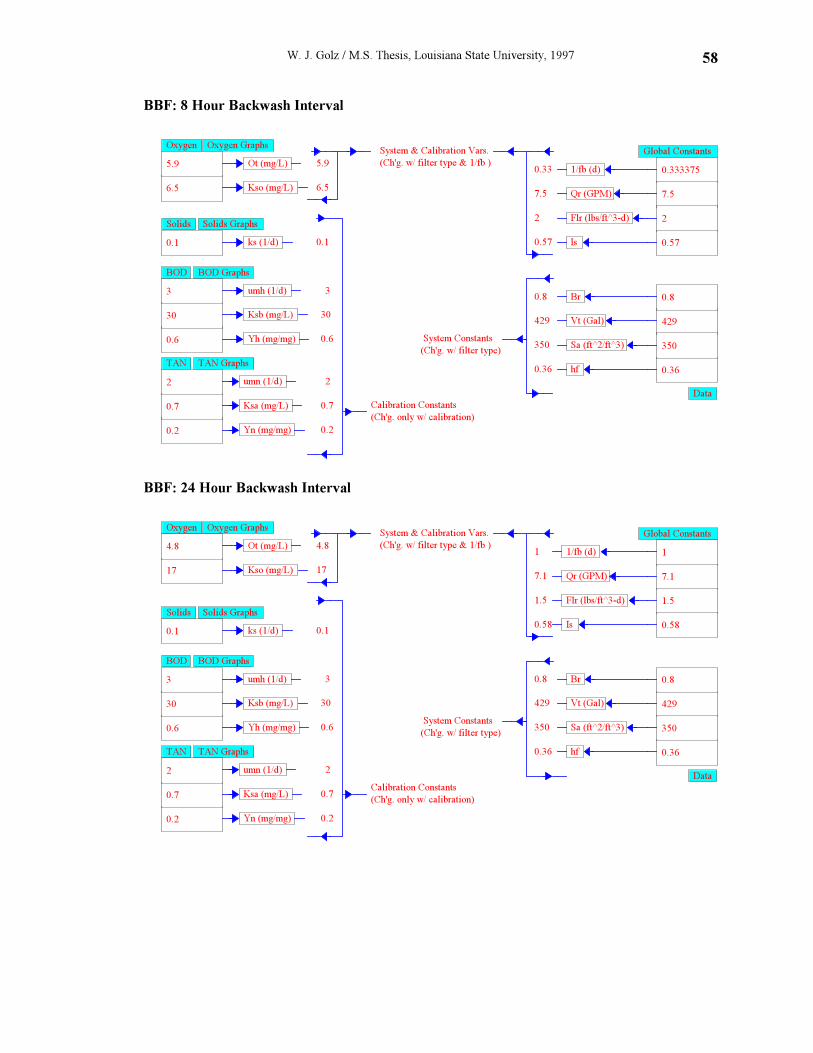
W. J. Golz / M.S. Thesis, Louisiana State University, 1997 58
BBF: 8 Hour Backwash Interval
0.36 hf
Global Constants
0.333375 1/fb (d)
Qr (GPM) 7.5
Flr (lbs/ft^3-d) 2
429 Vt (Gal)
Br 0.8
350 Sa (ft^2/ft^3)
Is 0.57
Solids Graphs
ks (1/d) 0.1
BOD BOD Graphs
0.6 Yh (mg/mg)
30 Ksb (mg/L)
umh (1/d) 3
TAN GraphsTAN
0.2 Yn (mg/mg)
0.7 Ksa (mg/L)
umn (1/d) 2
Oxygen Graphs
6.5 Kso (mg/L)
Oxygen
Ot (mg/L) 5.9
Calibration Constants
(Ch'g. only w/ calibration)
System Constants
(Ch'g. w/ filter type)
System & Calibration Vars.
(Ch'g. w/ filter type & 1/fb )5.9
6.5
0.33
7.5
2
0.57
0.8
429
350
0.36
0.1
3
30
0.6
2
0.7
0.2
Solids
Data
BBF: 24 Hour Backwash Interval
0.36 hf
Global Constants
1 1/fb (d)
Qr (GPM) 7.1
Flr (lbs/ft^3-d) 1.5
429 Vt (Gal)
Br 0.8
350 Sa (ft^2/ft^3)
Is 0.58 Solids Graphs
ks (1/d) 0.1
BOD BOD Graphs
0.6 Yh (mg/mg)
30 Ksb (mg/L)
umh (1/d) 3
TAN GraphsTAN
0.2 Yn (mg/mg)
0.7 Ksa (mg/L)
umn (1/d) 2
Oxygen Graphs
17 Kso (mg/L)
Oxygen
Ot (mg/L) 4.8
0.2
0.7
2
0.6
30
3
0.1
0.36
350
429
0.8
0.58
1.5
7.1
1
17
4.8
System & Calibration Vars.
(Ch'g. w/ filter type & 1/fb )
System Constants
(Ch'g. w/ filter type)
Calibration Constants
(Ch'g. only w/ calibration)
Solids
Data
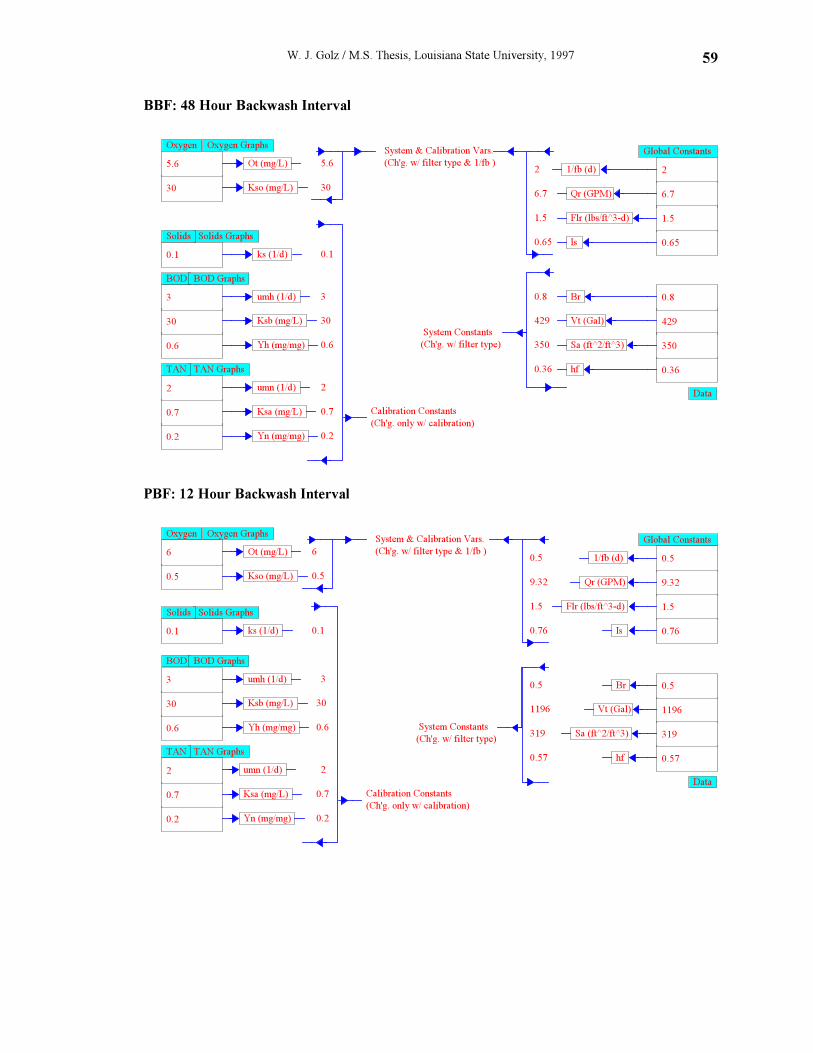
W. J. Golz / M.S. Thesis, Louisiana State University, 1997 59
BBF: 48 Hour Backwash Interval
0.36 hf
Global Constants
2 1/fb (d)
Qr (GPM) 6.7
Flr (lbs/ft^3-d) 1.5
429 Vt (Gal)
Br 0.8
350 Sa (ft^2/ft^3)
Is 0.65 Solids Graphs
ks (1/d) 0.1
BOD BOD Graphs
0.6 Yh (mg/mg)
30 Ksb (mg/L)
umh (1/d) 3
TAN GraphsTAN
0.2 Yn (mg/mg)
0.7 Ksa (mg/L)
umn (1/d) 2
Oxygen Graphs
30 Kso (mg/L)
Oxygen
Ot (mg/L) 5.6
Calibration Constants
(Ch'g. only w/ calibration)
System Constants
(Ch'g. w/ filter type)
System & Calibration Vars.
(Ch'g. w/ filter type & 1/fb )5.6
30
2
6.7
1.5
0.65
0.8
429
350
0.36
0.1
3
30
0.6
2
0.7
0.2
Solids
Data
PBF: 12 Hour Backwash Interval
0.57 hf
Global Constants
0.5 1/fb (d)
Qr (GPM) 9.32
Flr (lbs/ft^3-d) 1.5
1196 Vt (Gal)
Br 0.5
319 Sa (ft^2/ft^3)
Is 0.76
Solids Graphs
ks (1/d) 0.1
BOD BOD Graphs
0.6 Yh (mg/mg)
30 Ksb (mg/L)
umh (1/d) 3
TAN GraphsTAN
0.2 Yn (mg/mg)
0.7 Ksa (mg/L)
umn (1/d) 2
Oxygen Graphs
0.5 Kso (mg/L)
Oxygen
Ot (mg/L) 6
Calibration Constants
(Ch'g. only w/ calibration)
System Constants
(Ch'g. w/ filter type)
System & Calibration Vars.
(Ch'g. w/ filter type & 1/fb )6
0.5
0.5
9.32
1.5
0.76
0.5
1196
319
0.57
0.1
3
30
0.6
2
0.7
0.2
Solids
Data
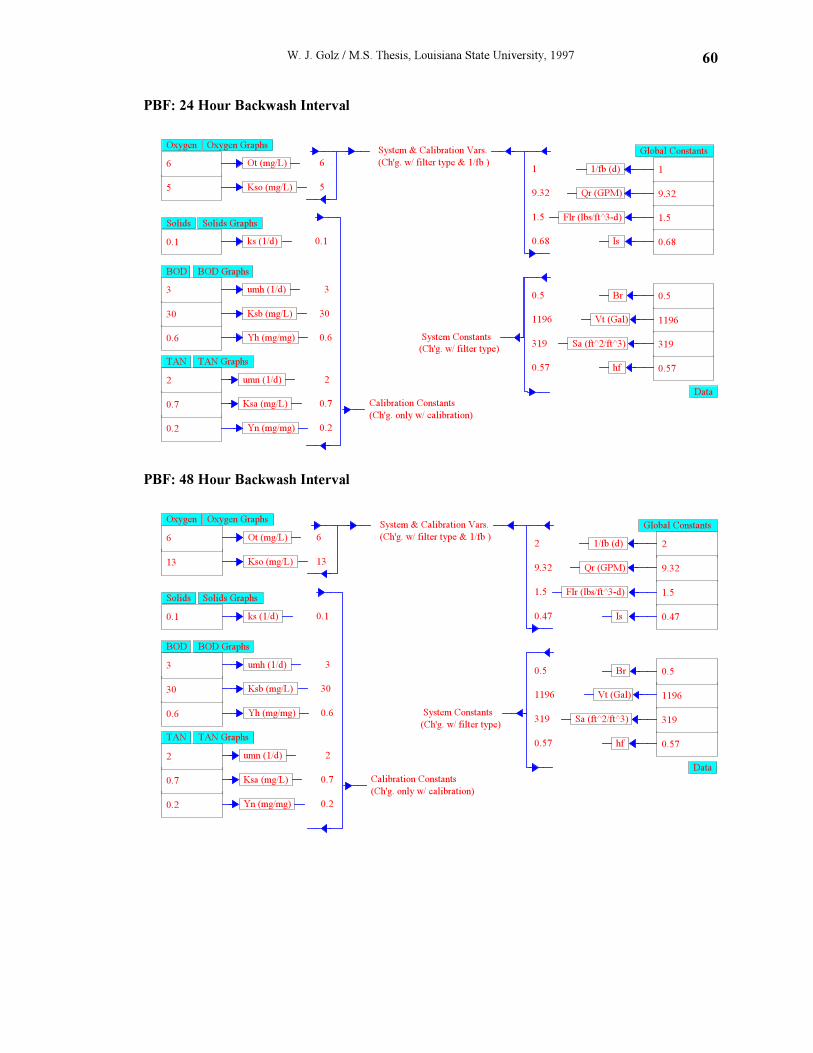
W. J. Golz / M.S. Thesis, Louisiana State University, 1997 60
PBF: 24 Hour Backwash Interval
0.57 hf
Global Constants
1 1/fb (d)
Qr (GPM) 9.32
Flr (lbs/ft^3-d) 1.5
1196 Vt (Gal)
Br 0.5
319 Sa (ft^2/ft^3)
Is 0.68
Solids Graphs
ks (1/d) 0.1
BOD BOD Graphs
0.6 Yh (mg/mg)
30 Ksb (mg/L)
umh (1/d) 3
TAN GraphsTAN
0.2 Yn (mg/mg)
0.7 Ksa (mg/L)
umn (1/d) 2
Oxygen Graphs
5 Kso (mg/L)
Oxygen
Ot (mg/L) 6
Calibration Constants
(Ch'g. only w/ calibration)
System Constants
(Ch'g. w/ filter type)
System & Calibration Vars.
(Ch'g. w/ filter type & 1/fb )6
5
1
9.32
1.5
0.68
0.5
1196
319
0.57
0.1
3
30
0.6
2
0.7
0.2
Solids
Data
PBF: 48 Hour Backwash Interval
0.57 hf
Global Constants
2 1/fb (d)
Qr (GPM) 9.32
Flr (lbs/ft^3-d) 1.5
1196 Vt (Gal)
Br 0.5
319 Sa (ft^2/ft^3)
Is 0.47
Solids GraphsSolids
ks (1/d) 0.1
BOD BOD Graphs
0.6 Yh (mg/mg)
30 Ksb (mg/L)
umh (1/d) 3
TAN GraphsTAN
0.2 Yn (mg/mg)
0.7 Ksa (mg/L)
umn (1/d) 2
Oxygen Graphs
13 Kso (mg/L)
Oxygen
Ot (mg/L) 6
0.2
0.7
2
0.6
30
3
0.1
0.57
319
1196
0.5
0.47
1.5
9.32
2
13
6
System & Calibration Vars.
(Ch'g. w/ filter type & 1/fb )
System Constants
(Ch'g. w/ filter type)
Calibration Constants
(Ch'g. only w/ calibration)
Data
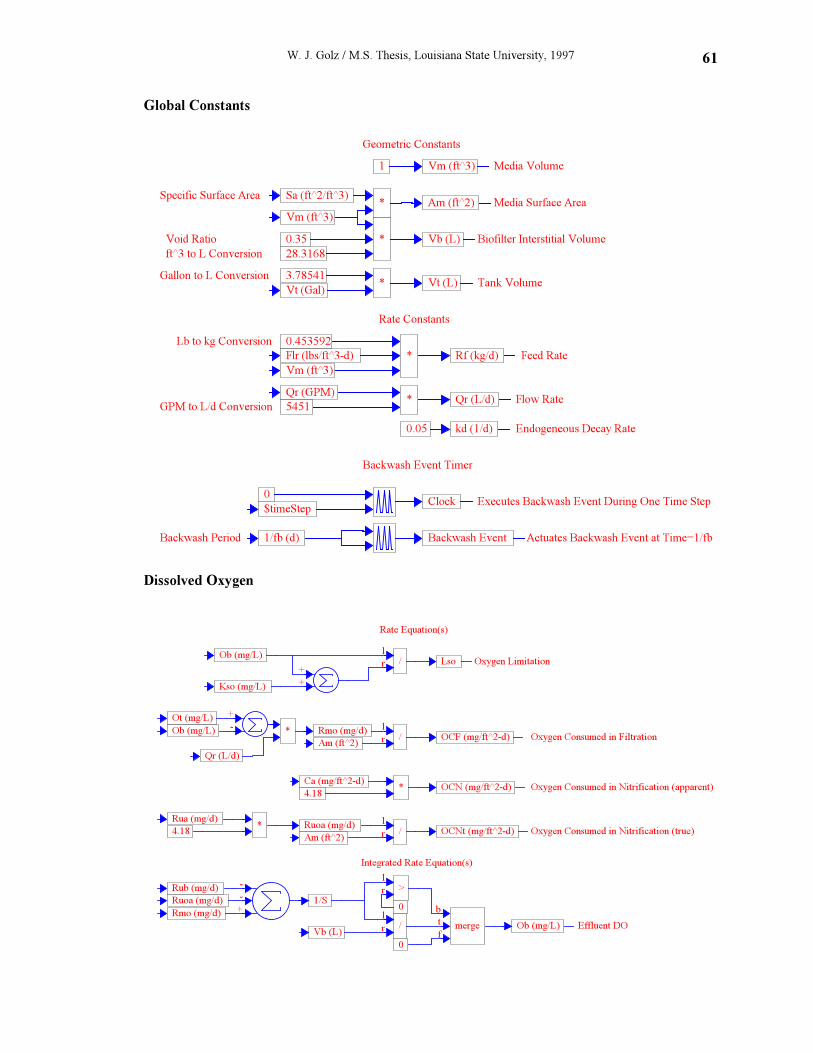
W. J. Golz / M.S. Thesis, Louisiana State University, 1997 61
Global Constants
$timeStep 0
Clock
Backwash Event 1/fb (d)
kd (1/d) 0.05
Rf (kg/d) *
0.453592
28.3168 Vb (L) *
0.35
1
Am (ft^2) *
Flr (lbs/ft^3-d)
Qr (L/d) *
Qr (GPM)
5451
Vt (L) *
Vt (Gal) 3.78541
Vm (ft^3)
Vm (ft^3)
Media Volume
Specific Surface Area
Void Ratio
ft^3 to L Conversion
Media Surface Area
Biofilter Interstitial Volume
Tank VolumeGallon to L Conversion
Lb to kg Conversion
Feed Rate
GPM to L/d ConversionFlow Rate
Endogeneous Decay Rate
Backwash Event Timer
Executes Backwash Event During One Time Step
Actuates Backwash Event at Time=1/fbBackwash Period
Geometric Constants
Rate Constants
Sa (ft^2/ft^3)
Vm (ft^3)
Dissolved Oxygen
/l
r
+
+
Kso (mg/L)
Ob (mg/L) Lso
OCF (mg/ft^2-d)
Ot (mg/L)
Ob (mg/L)
Qr (L/d)
+
-
*
/l
r
Am (ft^2) Rmo (mg/d)
Rub (mg/d)
Ruoa (mg/d)
Rmo (mg/d)
0
merge
b
t
f
0
>l
r
Vb (L) Ob (mg/L) /l
r
1/S
-
-
+
Rate Equation(s)
Oxygen Consumed in Filtration
Oxygen Limitation
Integrated Rate Equation(s)
Ruoa (mg/d) 4.18 *
Rua (mg/d)
OCNt (mg/ft^2-d) Oxygen Consumed in Nitrification (true)
OCN (mg/ft^2-d) *
4.18 Oxygen Consumed in Nitrification (apparent)Ca (mg/ft^2-d)
Am (ft^2) /l
r
Effluent DO
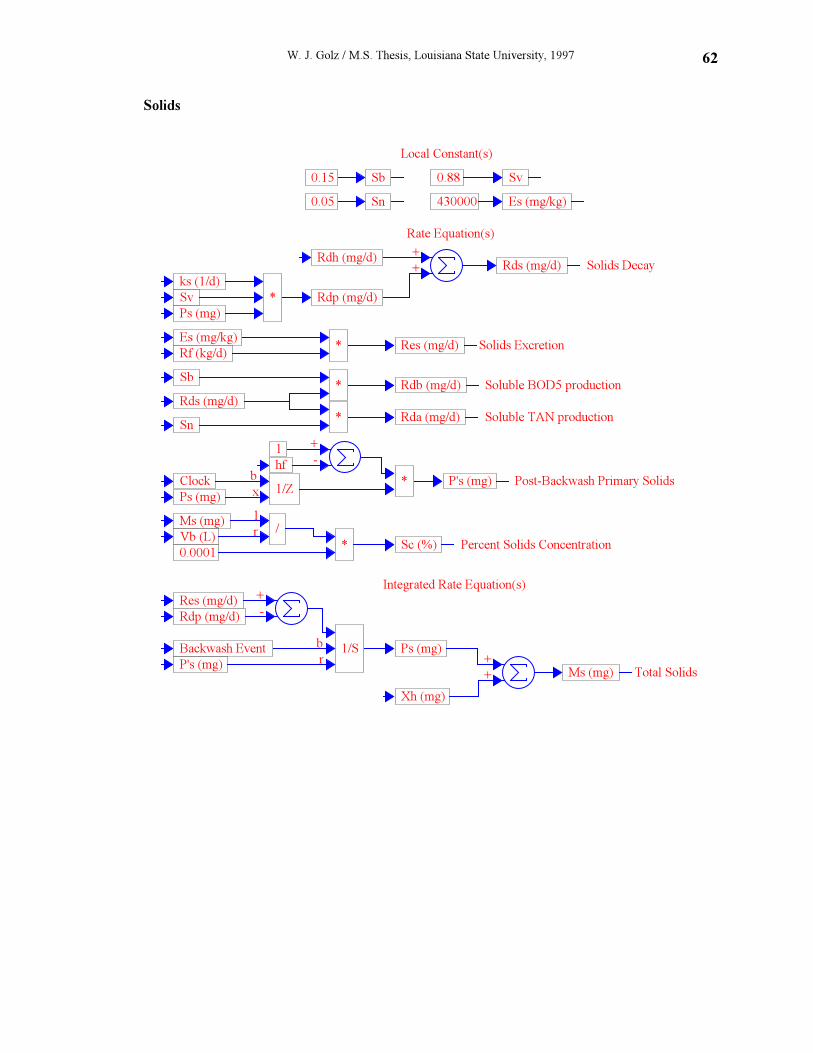
W. J. Golz / M.S. Thesis, Louisiana State University, 1997 62
Solids
Rds (mg/d)
*
ks (1/d)
*
Rdb (mg/d)
*
Rda (mg/d)
+
+ Rdh (mg/d)
Backwash Event 1/S
b
r
Rdp (mg/d)
+
-
Ps (mg)
Res (mg/d)
Sv
Sb
Sn
Ps (mg)
Sn
Sb Sv 0.15
0.05
0.88
Local Constant(s)
Rate Equation(s)
Rds (mg/d) Soluble BOD5 production
Solids Decay
P's (mg)
430000 Es (mg/kg)
Total Solids
Integrated Rate Equation(s)
Post-Backwash Primary Solids
Ps (mg)
hf
+
-
*
1/Zb
x Clock
Ms (mg)
Vb (L) /l
r
*
Sc (%)
0.0001 Percent Solids Concentration
P's (mg)
1
Es (mg/kg) Solids Excretion*
Rf (kg/d) Res (mg/d)
Soluble TAN production
+
+
Xh (mg)
Ms (mg)
Rdp (mg/d)
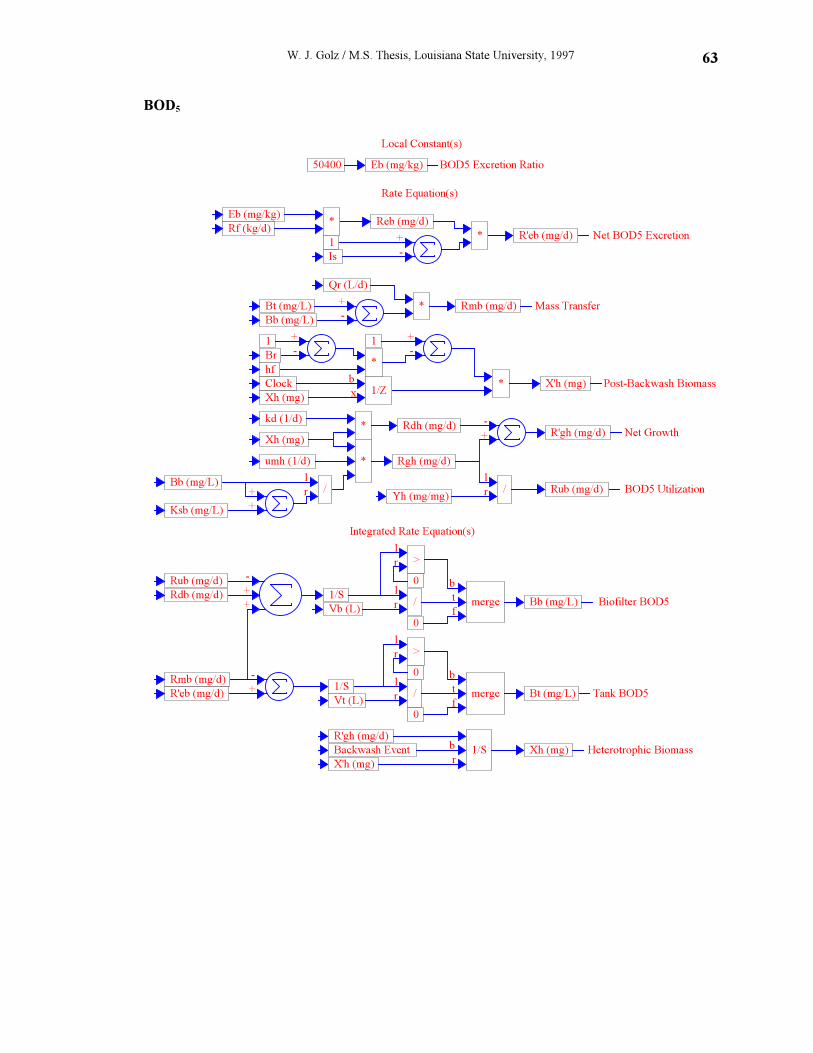
W. J. Golz / M.S. Thesis, Louisiana State University, 1997 63
BOD5
hf
1 +
-
*
1/Zb
x Clock
/l
r
+
+
Ksb (mg/L)
Bb (mg/L) Rub (mg/d)
Yh (mg/mg)
umh (1/d)
/l
r
*
R'gh (mg/d) -
+ *
kd (1/d)
50400
*
+
-
Qr (L/d)
Rdh (mg/d)
Br
Eb (mg/kg)
Bt (mg/L)
Bb (mg/L) Rmb (mg/d)
Xh (mg)
Xh (mg) X'h (mg)
Rgh (mg/d)
Local Constant(s)
Rate Equation(s)
Mass Transfer
Rmb (mg/d)
Vb (L) Bb (mg/L)
Bt (mg/L) Vt (L)
-
+ 1/S
1/S
-
+
+
Rub (mg/d)
Rdb (mg/d)
X'h (mg)
R'gh (mg/d)
Xh (mg) Backwash Event 1/S
b
r
Post-Backwash Biomass
Net Growth
BOD5 Utilization
Biofilter BOD5
Tank BOD5
Heterotrophic Biomass
Integrated Rate Equation(s)
R'eb (mg/d)
Net BOD5 ExcretionR'eb (mg/d) 1 +
-
*
Is
Reb (mg/d) Eb (mg/kg) *
Rf (kg/d)
/l
r
0
merge
b
t
f
0
>l
r
>l
r
0
merge
b
t
f
0
/l
r
*
+
- 1
BOD5 Excretion Ratio
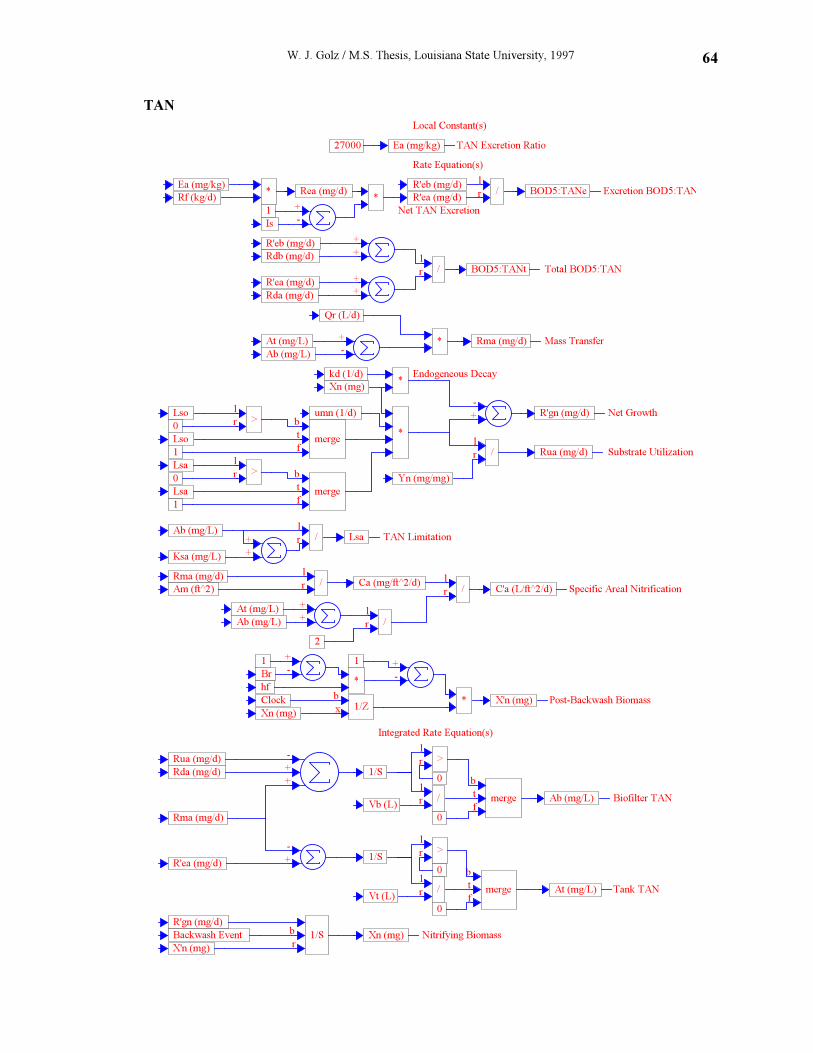
W. J. Golz / M.S. Thesis, Louisiana State University, 1997 64
TAN
kd (1/d) *
Lso
Rua (mg/d)
Yn (mg/mg)
umn (1/d)
*
/l
r
-
+
merge
b
t
f
>l
r
1 Lso
R'gn (mg/d)
Qr (L/d)
+
- *
27000
Rf (kg/d) *
Ea (mg/kg)
Local Constant(s)
Rate Equation(s)
Ea (mg/kg) Rea (mg/d)
Ab (mg/L) At (mg/L) Rma (mg/d) Mass Transfer
Xn (mg)
X'n (mg)
R'gn (mg/d)
Xn (mg) Backwash Event 1/S
b
r
Tank TAN
Biofilter TAN
Rma (mg/d)
R'ea (mg/d) >
l
r
0
merge
b
t
f
0
>l
r
0
merge
b
t
f
0
Rda (mg/d) Rua (mg/d) -
+
+
1/S
1/S -
+
Vt (L)
/l
r
/l
r At (mg/L)
Ab (mg/L) Vb (L)
Endogeneous Decay
Net Growth
Substrate Utilization
Integrated Rate Equation(s)
Nitrifying Biomass
TAN Excretion Ratio
Post-Backwash Biomass
Xn (mg)
Br
Clock 1/Z
b
x *
+
- 1
hf
Is
*
+
- 1
R'ea (mg/d)
Net TAN Excretion
*
+
-
X'n (mg)
1
0
Ab (mg/L)
Ksa (mg/L)
/l
r
+
+
merge
b
t
f
0
1
>l
r
Lsa
Lsa
Lsa
R'eb (mg/d) /
l
r BOD5:TANe
BOD5:TANt
R'eb (mg/d)
R'ea (mg/d)
+
+
+
+
Rda (mg/d)
Rdb (mg/d)
/l
r
TAN Limitation
Rma (mg/d)
Specific Areal NitrificationCa (mg/ft^2/d)
Am (ft^2) /l
r
/l
r
Ab (mg/L) At (mg/L) +
+
/l
r
2
C'a (L/ft^2/d)
Excretion BOD5:TAN
Total BOD5:TAN
W. J. Golz / M.S. Thesis, Louisiana State University, 1997
65
Appendix E
Model Calibration Output
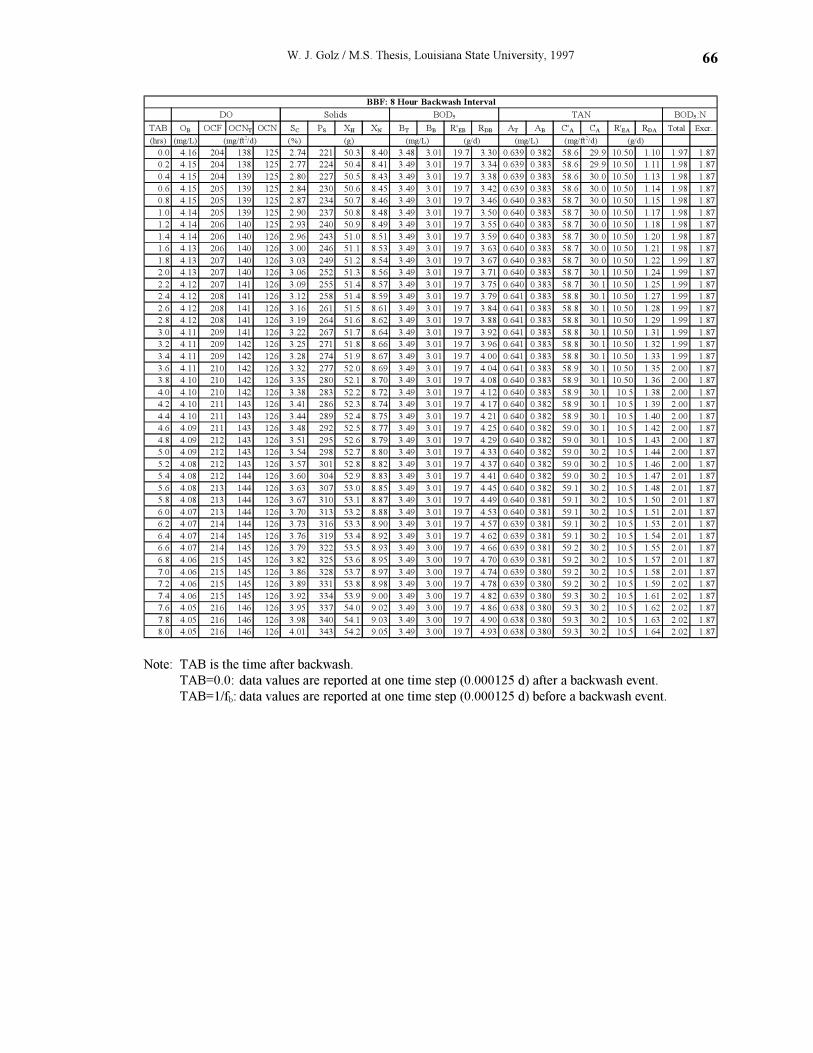
W. J. Golz / M.S. Thesis, Louisiana State University, 1997 66
BBF: 8 Hour Backwash Interval
DO Solids BOD5 TAN BOD5:N
TAB OB OCF OCNT OCN SC PS XH XN BT BB R'EB RDB AT AB C'A CA R'EA RDA Total Excr.
(hrs) (mg/L) (mg/ft2/d) (%) (g) (mg/L) (g/d) (mg/L) (mg/ft2/d) (g/d)
0.0 4.16 204 138 125 2.74 221 50.3 8.40 3.48 3.01 19.7 3.30 0.639 0.382 58.6 29.9 10.50 1.10 1.97 1.87
0.2 4.15 204 138 125 2.77 224 50.4 8.41 3.49 3.01 19.7 3.34 0.639 0.383 58.6 29.9 10.50 1.11 1.98 1.87
0.4 4.15 204 139 125 2.80 227 50.5 8.43 3.49 3.01 19.7 3.38 0.639 0.383 58.6 30.0 10.50 1.13 1.98 1.87
0.6 4.15 205 139 125 2.84 230 50.6 8.45 3.49 3.01 19.7 3.42 0.639 0.383 58.6 30.0 10.50 1.14 1.98 1.87
0.8 4.15 205 139 125 2.87 234 50.7 8.46 3.49 3.01 19.7 3.46 0.640 0.383 58.7 30.0 10.50 1.15 1.98 1.87
1.0 4.14 205 139 125 2.90 237 50.8 8.48 3.49 3.01 19.7 3.50 0.640 0.383 58.7 30.0 10.50 1.17 1.98 1.87
1.2 4.14 206 140 125 2.93 240 50.9 8.49 3.49 3.01 19.7 3.55 0.640 0.383 58.7 30.0 10.50 1.18 1.98 1.87
1.4 4.14 206 140 126 2.96 243 51.0 8.51 3.49 3.01 19.7 3.59 0.640 0.383 58.7 30.0 10.50 1.20 1.98 1.87
1.6 4.13 206 140 126 3.00 246 51.1 8.53 3.49 3.01 19.7 3.63 0.640 0.383 58.7 30.0 10.50 1.21 1.98 1.87
1.8 4.13 207 140 126 3.03 249 51.2 8.54 3.49 3.01 19.7 3.67 0.640 0.383 58.7 30.0 10.50 1.22 1.99 1.87
2.0 4.13 207 140 126 3.06 252 51.3 8.56 3.49 3.01 19.7 3.71 0.640 0.383 58.7 30.1 10.50 1.24 1.99 1.87
2.2 4.12 207 141 126 3.09 255 51.4 8.57 3.49 3.01 19.7 3.75 0.640 0.383 58.7 30.1 10.50 1.25 1.99 1.87
2.4 4.12 208 141 126 3.12 258 51.4 8.59 3.49 3.01 19.7 3.79 0.641 0.383 58.8 30.1 10.50 1.27 1.99 1.87
2.6 4.12 208 141 126 3.16 261 51.5 8.61 3.49 3.01 19.7 3.84 0.641 0.383 58.8 30.1 10.50 1.28 1.99 1.87
2.8 4.12 208 141 126 3.19 264 51.6 8.62 3.49 3.01 19.7 3.88 0.641 0.383 58.8 30.1 10.50 1.29 1.99 1.87
3.0 4.11 209 141 126 3.22 267 51.7 8.64 3.49 3.01 19.7 3.92 0.641 0.383 58.8 30.1 10.50 1.31 1.99 1.87
3.2 4.11 209 142 126 3.25 271 51.8 8.66 3.49 3.01 19.7 3.96 0.641 0.383 58.8 30.1 10.50 1.32 1.99 1.87
3.4 4.11 209 142 126 3.28 274 51.9 8.67 3.49 3.01 19.7 4.00 0.641 0.383 58.8 30.1 10.50 1.33 1.99 1.87
3.6 4.11 210 142 126 3.32 277 52.0 8.69 3.49 3.01 19.7 4.04 0.641 0.383 58.9 30.1 10.50 1.35 2.00 1.87
3.8 4.10 210 142 126 3.35 280 52.1 8.70 3.49 3.01 19.7 4.08 0.640 0.383 58.9 30.1 10.50 1.36 2.00 1.87
4.0 4.10 210 142 126 3.38 283 52.2 8.72 3.49 3.01 19.7 4.12 0.640 0.383 58.9 30.1 10.5 1.38 2.00 1.87
4.2 4.10 211 143 126 3.41 286 52.3 8.74 3.49 3.01 19.7 4.17 0.640 0.382 58.9 30.1 10.5 1.39 2.00 1.87
4.4 4.10 211 143 126 3.44 289 52.4 8.75 3.49 3.01 19.7 4.21 0.640 0.382 58.9 30.1 10.5 1.40 2.00 1.87
4.6 4.09 211 143 126 3.48 292 52.5 8.77 3.49 3.01 19.7 4.25 0.640 0.382 59.0 30.1 10.5 1.42 2.00 1.87
4.8 4.09 212 143 126 3.51 295 52.6 8.79 3.49 3.01 19.7 4.29 0.640 0.382 59.0 30.1 10.5 1.43 2.00 1.87
5.0 4.09 212 143 126 3.54 298 52.7 8.80 3.49 3.01 19.7 4.33 0.640 0.382 59.0 30.2 10.5 1.44 2.00 1.87
5.2 4.08 212 143 126 3.57 301 52.8 8.82 3.49 3.01 19.7 4.37 0.640 0.382 59.0 30.2 10.5 1.46 2.00 1.87
5.4 4.08 212 144 126 3.60 304 52.9 8.83 3.49 3.01 19.7 4.41 0.640 0.382 59.0 30.2 10.5 1.47 2.01 1.87
5.6 4.08 213 144 126 3.63 307 53.0 8.85 3.49 3.01 19.7 4.45 0.640 0.382 59.1 30.2 10.5 1.48 2.01 1.87
5.8 4.08 213 144 126 3.67 310 53.1 8.87 3.49 3.01 19.7 4.49 0.640 0.381 59.1 30.2 10.5 1.50 2.01 1.87
6.0 4.07 213 144 126 3.70 313 53.2 8.88 3.49 3.01 19.7 4.53 0.640 0.381 59.1 30.2 10.5 1.51 2.01 1.87
6.2 4.07 214 144 126 3.73 316 53.3 8.90 3.49 3.01 19.7 4.57 0.639 0.381 59.1 30.2 10.5 1.53 2.01 1.87
6.4 4.07 214 145 126 3.76 319 53.4 8.92 3.49 3.01 19.7 4.62 0.639 0.381 59.1 30.2 10.5 1.54 2.01 1.87
6.6 4.07 214 145 126 3.79 322 53.5 8.93 3.49 3.00 19.7 4.66 0.639 0.381 59.2 30.2 10.5 1.55 2.01 1.87
6.8 4.06 215 145 126 3.82 325 53.6 8.95 3.49 3.00 19.7 4.70 0.639 0.381 59.2 30.2 10.5 1.57 2.01 1.87
7.0 4.06 215 145 126 3.86 328 53.7 8.97 3.49 3.00 19.7 4.74 0.639 0.380 59.2 30.2 10.5 1.58 2.01 1.87
7.2 4.06 215 145 126 3.89 331 53.8 8.98 3.49 3.00 19.7 4.78 0.639 0.380 59.2 30.2 10.5 1.59 2.02 1.87
7.4 4.06 215 145 126 3.92 334 53.9 9.00 3.49 3.00 19.7 4.82 0.639 0.380 59.3 30.2 10.5 1.61 2.02 1.87
7.6 4.05 216 146 126 3.95 337 54.0 9.02 3.49 3.00 19.7 4.86 0.638 0.380 59.3 30.2 10.5 1.62 2.02 1.87
7.8 4.05 216 146 126 3.98 340 54.1 9.03 3.49 3.00 19.7 4.90 0.638 0.380 59.3 30.2 10.5 1.63 2.02 1.87
8.0 4.05 216 146 126 4.01 343 54.2 9.05 3.49 3.00 19.7 4.93 0.638 0.380 59.3 30.2 10.5 1.64 2.02 1.87
Note: TAB is the time after backwash.
TAB=0.0: data values are reported at one time step (0.000125 d) after a backwash event.
TAB=1/fb: data values are reported at one time step (0.000125 d) before a backwash event.
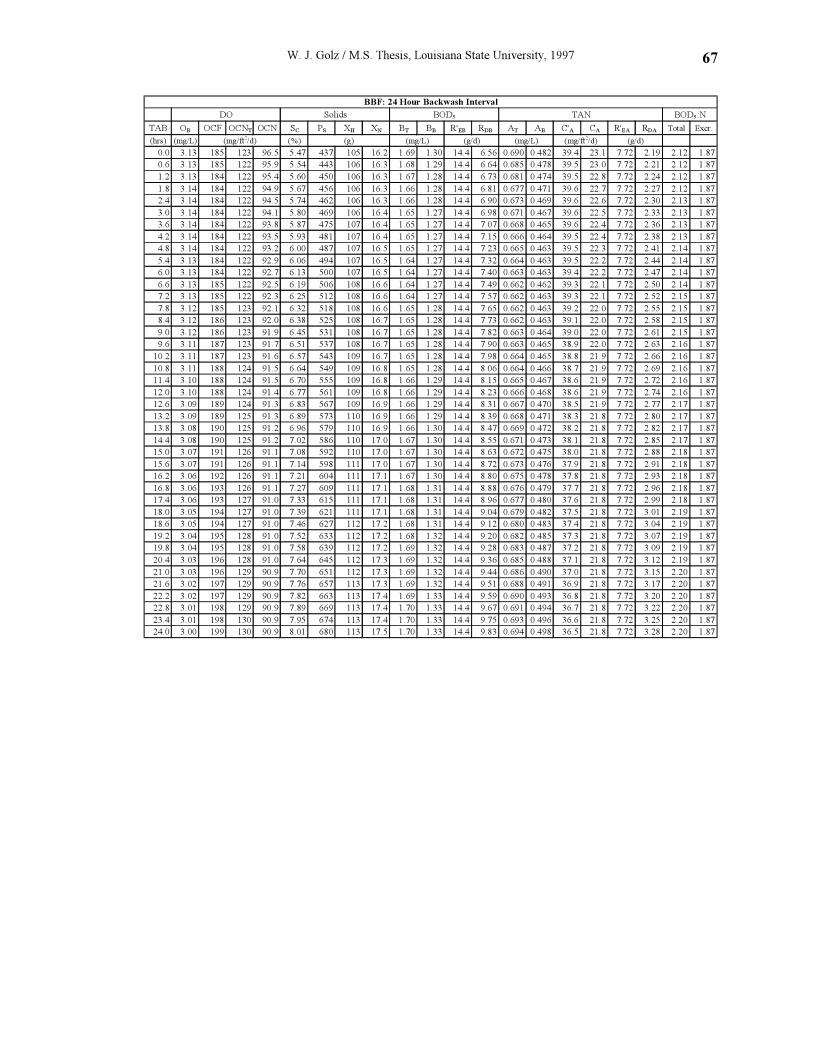
W. J. Golz / M.S. Thesis, Louisiana State University, 1997 67
BBF: 24 Hour Backwash Interval
DO Solids BOD5 TAN BOD5:N
TAB OB OCF OCNT OCN SC PS XH XN BT BB R'EB RDB AT AB C'A CA R'EA RDA Total Excr.
(hrs) (mg/L) (mg/ft2/d) (%) (g) (mg/L) (g/d) (mg/L) (mg/ft2/d) (g/d)
0.0 3.13 185 123 96.5 5.47 437 105 16.2 1.69 1.30 14.4 6.56 0.690 0.482 39.4 23.1 7.72 2.19 2.12 1.87
0.6 3.13 185 122 95.9 5.54 443 106 16.3 1.68 1.29 14.4 6.64 0.685 0.478 39.5 23.0 7.72 2.21 2.12 1.87
1.2 3.13 184 122 95.4 5.60 450 106 16.3 1.67 1.28 14.4 6.73 0.681 0.474 39.5 22.8 7.72 2.24 2.12 1.87
1.8 3.14 184 122 94.9 5.67 456 106 16.3 1.66 1.28 14.4 6.81 0.677 0.471 39.6 22.7 7.72 2.27 2.12 1.87
2.4 3.14 184 122 94.5 5.74 462 106 16.3 1.66 1.28 14.4 6.90 0.673 0.469 39.6 22.6 7.72 2.30 2.13 1.87
3.0 3.14 184 122 94.1 5.80 469 106 16.4 1.65 1.27 14.4 6.98 0.671 0.467 39.6 22.5 7.72 2.33 2.13 1.87
3.6 3.14 184 122 93.8 5.87 475 107 16.4 1.65 1.27 14.4 7.07 0.668 0.465 39.6 22.4 7.72 2.36 2.13 1.87
4.2 3.14 184 122 93.5 5.93 481 107 16.4 1.65 1.27 14.4 7.15 0.666 0.464 39.5 22.4 7.72 2.38 2.13 1.87
4.8 3.14 184 122 93.2 6.00 487 107 16.5 1.65 1.27 14.4 7.23 0.665 0.463 39.5 22.3 7.72 2.41 2.14 1.87
5.4 3.13 184 122 92.9 6.06 494 107 16.5 1.64 1.27 14.4 7.32 0.664 0.463 39.5 22.2 7.72 2.44 2.14 1.87
6.0 3.13 184 122 92.7 6.13 500 107 16.5 1.64 1.27 14.4 7.40 0.663 0.463 39.4 22.2 7.72 2.47 2.14 1.87
6.6 3.13 185 122 92.5 6.19 506 108 16.6 1.64 1.27 14.4 7.49 0.662 0.462 39.3 22.1 7.72 2.50 2.14 1.87
7.2 3.13 185 122 92.3 6.25 512 108 16.6 1.64 1.27 14.4 7.57 0.662 0.463 39.3 22.1 7.72 2.52 2.15 1.87
7.8 3.12 185 123 92.1 6.32 518 108 16.6 1.65 1.28 14.4 7.65 0.662 0.463 39.2 22.0 7.72 2.55 2.15 1.87
8.4 3.12 186 123 92.0 6.38 525 108 16.7 1.65 1.28 14.4 7.73 0.662 0.463 39.1 22.0 7.72 2.58 2.15 1.87
9.0 3.12 186 123 91.9 6.45 531 108 16.7 1.65 1.28 14.4 7.82 0.663 0.464 39.0 22.0 7.72 2.61 2.15 1.87
9.6 3.11 187 123 91.7 6.51 537 108 16.7 1.65 1.28 14.4 7.90 0.663 0.465 38.9 22.0 7.72 2.63 2.16 1.87
10.2 3.11 187 123 91.6 6.57 543 109 16.7 1.65 1.28 14.4 7.98 0.664 0.465 38.8 21.9 7.72 2.66 2.16 1.87
10.8 3.11 188 124 91.5 6.64 549 109 16.8 1.65 1.28 14.4 8.06 0.664 0.466 38.7 21.9 7.72 2.69 2.16 1.87
11.4 3.10 188 124 91.5 6.70 555 109 16.8 1.66 1.29 14.4 8.15 0.665 0.467 38.6 21.9 7.72 2.72 2.16 1.87
12.0 3.10 188 124 91.4 6.77 561 109 16.8 1.66 1.29 14.4 8.23 0.666 0.468 38.6 21.9 7.72 2.74 2.16 1.87
12.6 3.09 189 124 91.3 6.83 567 109 16.9 1.66 1.29 14.4 8.31 0.667 0.470 38.5 21.9 7.72 2.77 2.17 1.87
13.2 3.09 189 125 91.3 6.89 573 110 16.9 1.66 1.29 14.4 8.39 0.668 0.471 38.3 21.8 7.72 2.80 2.17 1.87
13.8 3.08 190 125 91.2 6.96 579 110 16.9 1.66 1.30 14.4 8.47 0.669 0.472 38.2 21.8 7.72 2.82 2.17 1.87
14.4 3.08 190 125 91.2 7.02 586 110 17.0 1.67 1.30 14.4 8.55 0.671 0.473 38.1 21.8 7.72 2.85 2.17 1.87
15.0 3.07 191 126 91.1 7.08 592 110 17.0 1.67 1.30 14.4 8.63 0.672 0.475 38.0 21.8 7.72 2.88 2.18 1.87
15.6 3.07 191 126 91.1 7.14 598 111 17.0 1.67 1.30 14.4 8.72 0.673 0.476 37.9 21.8 7.72 2.91 2.18 1.87
16.2 3.06 192 126 91.1 7.21 604 111 17.1 1.67 1.30 14.4 8.80 0.675 0.478 37.8 21.8 7.72 2.93 2.18 1.87
16.8 3.06 193 126 91.1 7.27 609 111 17.1 1.68 1.31 14.4 8.88 0.676 0.479 37.7 21.8 7.72 2.96 2.18 1.87
17.4 3.06 193 127 91.0 7.33 615 111 17.1 1.68 1.31 14.4 8.96 0.677 0.480 37.6 21.8 7.72 2.99 2.18 1.87
18.0 3.05 194 127 91.0 7.39 621 111 17.1 1.68 1.31 14.4 9.04 0.679 0.482 37.5 21.8 7.72 3.01 2.19 1.87
18.6 3.05 194 127 91.0 7.46 627 112 17.2 1.68 1.31 14.4 9.12 0.680 0.483 37.4 21.8 7.72 3.04 2.19 1.87
19.2 3.04 195 128 91.0 7.52 633 112 17.2 1.68 1.32 14.4 9.20 0.682 0.485 37.3 21.8 7.72 3.07 2.19 1.87
19.8 3.04 195 128 91.0 7.58 639 112 17.2 1.69 1.32 14.4 9.28 0.683 0.487 37.2 21.8 7.72 3.09 2.19 1.87
20.4 3.03 196 128 91.0 7.64 645 112 17.3 1.69 1.32 14.4 9.36 0.685 0.488 37.1 21.8 7.72 3.12 2.19 1.87
21.0 3.03 196 129 90.9 7.70 651 112 17.3 1.69 1.32 14.4 9.44 0.686 0.490 37.0 21.8 7.72 3.15 2.20 1.87
21.6 3.02 197 129 90.9 7.76 657 113 17.3 1.69 1.32 14.4 9.51 0.688 0.491 36.9 21.8 7.72 3.17 2.20 1.87
22.2 3.02 197 129 90.9 7.82 663 113 17.4 1.69 1.33 14.4 9.59 0.690 0.493 36.8 21.8 7.72 3.20 2.20 1.87
22.8 3.01 198 129 90.9 7.89 669 113 17.4 1.70 1.33 14.4 9.67 0.691 0.494 36.7 21.8 7.72 3.22 2.20 1.87
23.4 3.01 198 130 90.9 7.95 674 113 17.4 1.70 1.33 14.4 9.75 0.693 0.496 36.6 21.8 7.72 3.25 2.20 1.87
24.0 3.00 199 130 90.9 8.01 680 113 17.5 1.70 1.33 14.4 9.83 0.694 0.498 36.5 21.8 7.72 3.28 2.20 1.87
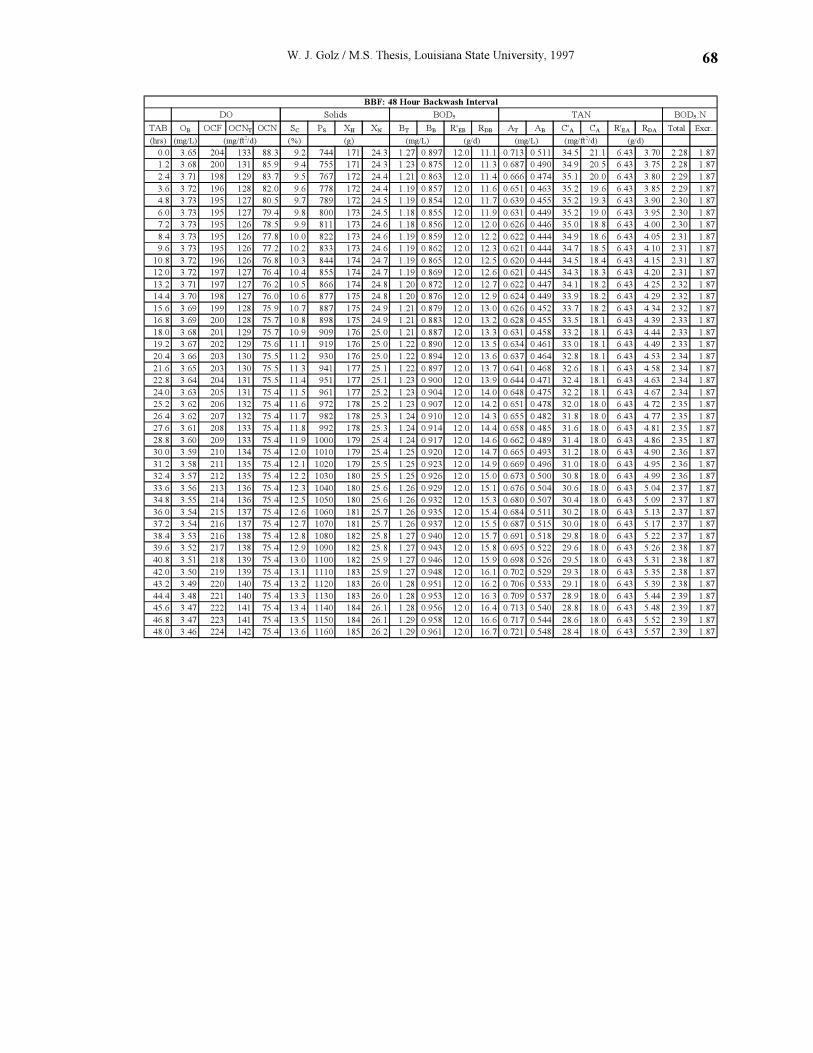
W. J. Golz / M.S. Thesis, Louisiana State University, 1997 68
BBF: 48 Hour Backwash Interval
DO Solids BOD5 TAN BOD5:N
TAB OB OCF OCNT OCN SC PS XH XN BT BB R'EB RDB AT AB C'A CA R'EA RDA Total Excr.
(hrs) (mg/L) (mg/ft2/d) (%) (g) (mg/L) (g/d) (mg/L) (mg/ft2/d) (g/d)
0.0 3.65 204 133 88.3 9.2 744 171 24.3 1.27 0.897 12.0 11.1 0.713 0.511 34.5 21.1 6.43 3.70 2.28 1.87
1.2 3.68 200 131 85.9 9.4 755 171 24.3 1.23 0.875 12.0 11.3 0.687 0.490 34.9 20.5 6.43 3.75 2.28 1.87
2.4 3.71 198 129 83.7 9.5 767 172 24.4 1.21 0.863 12.0 11.4 0.666 0.474 35.1 20.0 6.43 3.80 2.29 1.87
3.6 3.72 196 128 82.0 9.6 778 172 24.4 1.19 0.857 12.0 11.6 0.651 0.463 35.2 19.6 6.43 3.85 2.29 1.87
4.8 3.73 195 127 80.5 9.7 789 172 24.5 1.19 0.854 12.0 11.7 0.639 0.455 35.2 19.3 6.43 3.90 2.30 1.87
6.0 3.73 195 127 79.4 9.8 800 173 24.5 1.18 0.855 12.0 11.9 0.631 0.449 35.2 19.0 6.43 3.95 2.30 1.87
7.2 3.73 195 126 78.5 9.9 811 173 24.6 1.18 0.856 12.0 12.0 0.626 0.446 35.0 18.8 6.43 4.00 2.30 1.87
8.4 3.73 195 126 77.8 10.0 822 173 24.6 1.19 0.859 12.0 12.2 0.622 0.444 34.9 18.6 6.43 4.05 2.31 1.87
9.6 3.73 195 126 77.2 10.2 833 173 24.6 1.19 0.862 12.0 12.3 0.621 0.444 34.7 18.5 6.43 4.10 2.31 1.87
10.8 3.72 196 126 76.8 10.3 844 174 24.7 1.19 0.865 12.0 12.5 0.620 0.444 34.5 18.4 6.43 4.15 2.31 1.87
12.0 3.72 197 127 76.4 10.4 855 174 24.7 1.19 0.869 12.0 12.6 0.621 0.445 34.3 18.3 6.43 4.20 2.31 1.87
13.2 3.71 197 127 76.2 10.5 866 174 24.8 1.20 0.872 12.0 12.7 0.622 0.447 34.1 18.2 6.43 4.25 2.32 1.87
14.4 3.70 198 127 76.0 10.6 877 175 24.8 1.20 0.876 12.0 12.9 0.624 0.449 33.9 18.2 6.43 4.29 2.32 1.87
15.6 3.69 199 128 75.9 10.7 887 175 24.9 1.21 0.879 12.0 13.0 0.626 0.452 33.7 18.2 6.43 4.34 2.32 1.87
16.8 3.69 200 128 75.7 10.8 898 175 24.9 1.21 0.883 12.0 13.2 0.628 0.455 33.5 18.1 6.43 4.39 2.33 1.87
18.0 3.68 201 129 75.7 10.9 909 176 25.0 1.21 0.887 12.0 13.3 0.631 0.458 33.2 18.1 6.43 4.44 2.33 1.87
19.2 3.67 202 129 75.6 11.1 919 176 25.0 1.22 0.890 12.0 13.5 0.634 0.461 33.0 18.1 6.43 4.49 2.33 1.87
20.4 3.66 203 130 75.5 11.2 930 176 25.0 1.22 0.894 12.0 13.6 0.637 0.464 32.8 18.1 6.43 4.53 2.34 1.87
21.6 3.65 203 130 75.5 11.3 941 177 25.1 1.22 0.897 12.0 13.7 0.641 0.468 32.6 18.1 6.43 4.58 2.34 1.87
22.8 3.64 204 131 75.5 11.4 951 177 25.1 1.23 0.900 12.0 13.9 0.644 0.471 32.4 18.1 6.43 4.63 2.34 1.87
24.0 3.63 205 131 75.4 11.5 961 177 25.2 1.23 0.904 12.0 14.0 0.648 0.475 32.2 18.1 6.43 4.67 2.34 1.87
25.2 3.62 206 132 75.4 11.6 972 178 25.2 1.23 0.907 12.0 14.2 0.651 0.478 32.0 18.0 6.43 4.72 2.35 1.87
26.4 3.62 207 132 75.4 11.7 982 178 25.3 1.24 0.910 12.0 14.3 0.655 0.482 31.8 18.0 6.43 4.77 2.35 1.87
27.6 3.61 208 133 75.4 11.8 992 178 25.3 1.24 0.914 12.0 14.4 0.658 0.485 31.6 18.0 6.43 4.81 2.35 1.87
28.8 3.60 209 133 75.4 11.9 1000 179 25.4 1.24 0.917 12.0 14.6 0.662 0.489 31.4 18.0 6.43 4.86 2.35 1.87
30.0 3.59 210 134 75.4 12.0 1010 179 25.4 1.25 0.920 12.0 14.7 0.665 0.493 31.2 18.0 6.43 4.90 2.36 1.87
31.2 3.58 211 135 75.4 12.1 1020 179 25.5 1.25 0.923 12.0 14.9 0.669 0.496 31.0 18.0 6.43 4.95 2.36 1.87
32.4 3.57 212 135 75.4 12.2 1030 180 25.5 1.25 0.926 12.0 15.0 0.673 0.500 30.8 18.0 6.43 4.99 2.36 1.87
33.6 3.56 213 136 75.4 12.3 1040 180 25.6 1.26 0.929 12.0 15.1 0.676 0.504 30.6 18.0 6.43 5.04 2.37 1.87
34.8 3.55 214 136 75.4 12.5 1050 180 25.6 1.26 0.932 12.0 15.3 0.680 0.507 30.4 18.0 6.43 5.09 2.37 1.87
36.0 3.54 215 137 75.4 12.6 1060 181 25.7 1.26 0.935 12.0 15.4 0.684 0.511 30.2 18.0 6.43 5.13 2.37 1.87
37.2 3.54 216 137 75.4 12.7 1070 181 25.7 1.26 0.937 12.0 15.5 0.687 0.515 30.0 18.0 6.43 5.17 2.37 1.87
38.4 3.53 216 138 75.4 12.8 1080 182 25.8 1.27 0.940 12.0 15.7 0.691 0.518 29.8 18.0 6.43 5.22 2.37 1.87
39.6 3.52 217 138 75.4 12.9 1090 182 25.8 1.27 0.943 12.0 15.8 0.695 0.522 29.6 18.0 6.43 5.26 2.38 1.87
40.8 3.51 218 139 75.4 13.0 1100 182 25.9 1.27 0.946 12.0 15.9 0.698 0.526 29.5 18.0 6.43 5.31 2.38 1.87
42.0 3.50 219 139 75.4 13.1 1110 183 25.9 1.27 0.948 12.0 16.1 0.702 0.529 29.3 18.0 6.43 5.35 2.38 1.87
43.2 3.49 220 140 75.4 13.2 1120 183 26.0 1.28 0.951 12.0 16.2 0.706 0.533 29.1 18.0 6.43 5.39 2.38 1.87
44.4 3.48 221 140 75.4 13.3 1130 183 26.0 1.28 0.953 12.0 16.3 0.709 0.537 28.9 18.0 6.43 5.44 2.39 1.87
45.6 3.47 222 141 75.4 13.4 1140 184 26.1 1.28 0.956 12.0 16.4 0.713 0.540 28.8 18.0 6.43 5.48 2.39 1.87
46.8 3.47 223 141 75.4 13.5 1150 184 26.1 1.29 0.958 12.0 16.6 0.717 0.544 28.6 18.0 6.43 5.52 2.39 1.87
48.0 3.46 224 142 75.4 13.6 1160 185 26.2 1.29 0.961 12.0 16.7 0.721 0.548 28.4 18.0 6.43 5.57 2.39 1.87
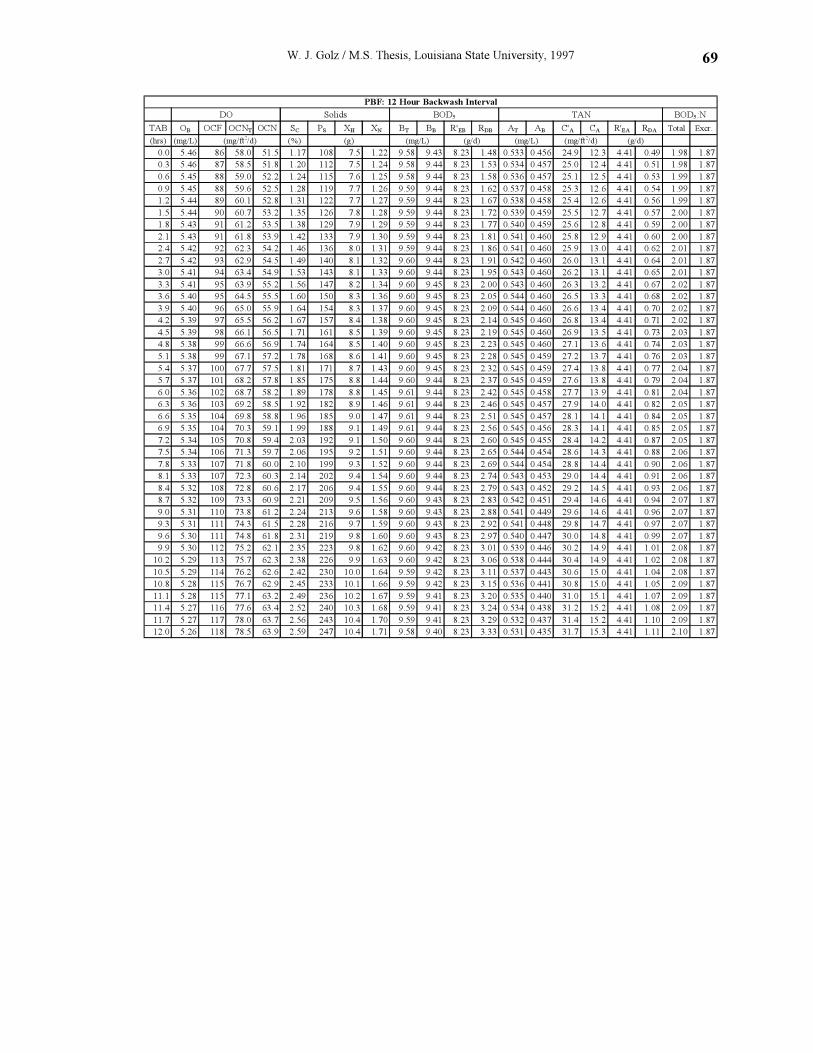
W. J. Golz / M.S. Thesis, Louisiana State University, 1997 69
PBF: 12 Hour Backwash Interval
DO Solids BOD5 TAN BOD5:N
TAB OB OCF OCNT OCN SC PS XH XN BT BB R'EB RDB AT AB C'A CA R'EA RDA Total Excr.
(hrs) (mg/L) (mg/ft2/d) (%) (g) (mg/L) (g/d) (mg/L) (mg/ft2/d) (g/d)
0.0 5.46 86 58.0 51.5 1.17 108 7.5 1.22 9.58 9.43 8.23 1.48 0.533 0.456 24.9 12.3 4.41 0.49 1.98 1.87
0.3 5.46 87 58.5 51.8 1.20 112 7.5 1.24 9.58 9.44 8.23 1.53 0.534 0.457 25.0 12.4 4.41 0.51 1.98 1.87
0.6 5.45 88 59.0 52.2 1.24 115 7.6 1.25 9.58 9.44 8.23 1.58 0.536 0.457 25.1 12.5 4.41 0.53 1.99 1.87
0.9 5.45 88 59.6 52.5 1.28 119 7.7 1.26 9.59 9.44 8.23 1.62 0.537 0.458 25.3 12.6 4.41 0.54 1.99 1.87
1.2 5.44 89 60.1 52.8 1.31 122 7.7 1.27 9.59 9.44 8.23 1.67 0.538 0.458 25.4 12.6 4.41 0.56 1.99 1.87
1.5 5.44 90 60.7 53.2 1.35 126 7.8 1.28 9.59 9.44 8.23 1.72 0.539 0.459 25.5 12.7 4.41 0.57 2.00 1.87
1.8 5.43 91 61.2 53.5 1.38 129 7.9 1.29 9.59 9.44 8.23 1.77 0.540 0.459 25.6 12.8 4.41 0.59 2.00 1.87
2.1 5.43 91 61.8 53.9 1.42 133 7.9 1.30 9.59 9.44 8.23 1.81 0.541 0.460 25.8 12.9 4.41 0.60 2.00 1.87
2.4 5.42 92 62.3 54.2 1.46 136 8.0 1.31 9.59 9.44 8.23 1.86 0.541 0.460 25.9 13.0 4.41 0.62 2.01 1.87
2.7 5.42 93 62.9 54.5 1.49 140 8.1 1.32 9.60 9.44 8.23 1.91 0.542 0.460 26.0 13.1 4.41 0.64 2.01 1.87
3.0 5.41 94 63.4 54.9 1.53 143 8.1 1.33 9.60 9.44 8.23 1.95 0.543 0.460 26.2 13.1 4.41 0.65 2.01 1.87
3.3 5.41 95 63.9 55.2 1.56 147 8.2 1.34 9.60 9.45 8.23 2.00 0.543 0.460 26.3 13.2 4.41 0.67 2.02 1.87
3.6 5.40 95 64.5 55.5 1.60 150 8.3 1.36 9.60 9.45 8.23 2.05 0.544 0.460 26.5 13.3 4.41 0.68 2.02 1.87
3.9 5.40 96 65.0 55.9 1.64 154 8.3 1.37 9.60 9.45 8.23 2.09 0.544 0.460 26.6 13.4 4.41 0.70 2.02 1.87
4.2 5.39 97 65.5 56.2 1.67 157 8.4 1.38 9.60 9.45 8.23 2.14 0.545 0.460 26.8 13.4 4.41 0.71 2.02 1.87
4.5 5.39 98 66.1 56.5 1.71 161 8.5 1.39 9.60 9.45 8.23 2.19 0.545 0.460 26.9 13.5 4.41 0.73 2.03 1.87
4.8 5.38 99 66.6 56.9 1.74 164 8.5 1.40 9.60 9.45 8.23 2.23 0.545 0.460 27.1 13.6 4.41 0.74 2.03 1.87
5.1 5.38 99 67.1 57.2 1.78 168 8.6 1.41 9.60 9.45 8.23 2.28 0.545 0.459 27.2 13.7 4.41 0.76 2.03 1.87
5.4 5.37 100 67.7 57.5 1.81 171 8.7 1.43 9.60 9.45 8.23 2.32 0.545 0.459 27.4 13.8 4.41 0.77 2.04 1.87
5.7 5.37 101 68.2 57.8 1.85 175 8.8 1.44 9.60 9.44 8.23 2.37 0.545 0.459 27.6 13.8 4.41 0.79 2.04 1.87
6.0 5.36 102 68.7 58.2 1.89 178 8.8 1.45 9.61 9.44 8.23 2.42 0.545 0.458 27.7 13.9 4.41 0.81 2.04 1.87
6.3 5.36 103 69.2 58.5 1.92 182 8.9 1.46 9.61 9.44 8.23 2.46 0.545 0.457 27.9 14.0 4.41 0.82 2.05 1.87
6.6 5.35 104 69.8 58.8 1.96 185 9.0 1.47 9.61 9.44 8.23 2.51 0.545 0.457 28.1 14.1 4.41 0.84 2.05 1.87
6.9 5.35 104 70.3 59.1 1.99 188 9.1 1.49 9.61 9.44 8.23 2.56 0.545 0.456 28.3 14.1 4.41 0.85 2.05 1.87
7.2 5.34 105 70.8 59.4 2.03 192 9.1 1.50 9.60 9.44 8.23 2.60 0.545 0.455 28.4 14.2 4.41 0.87 2.05 1.87
7.5 5.34 106 71.3 59.7 2.06 195 9.2 1.51 9.60 9.44 8.23 2.65 0.544 0.454 28.6 14.3 4.41 0.88 2.06 1.87
7.8 5.33 107 71.8 60.0 2.10 199 9.3 1.52 9.60 9.44 8.23 2.69 0.544 0.454 28.8 14.4 4.41 0.90 2.06 1.87
8.1 5.33 107 72.3 60.3 2.14 202 9.4 1.54 9.60 9.44 8.23 2.74 0.543 0.453 29.0 14.4 4.41 0.91 2.06 1.87
8.4 5.32 108 72.8 60.6 2.17 206 9.4 1.55 9.60 9.44 8.23 2.79 0.543 0.452 29.2 14.5 4.41 0.93 2.06 1.87
8.7 5.32 109 73.3 60.9 2.21 209 9.5 1.56 9.60 9.43 8.23 2.83 0.542 0.451 29.4 14.6 4.41 0.94 2.07 1.87
9.0 5.31 110 73.8 61.2 2.24 213 9.6 1.58 9.60 9.43 8.23 2.88 0.541 0.449 29.6 14.6 4.41 0.96 2.07 1.87
9.3 5.31 111 74.3 61.5 2.28 216 9.7 1.59 9.60 9.43 8.23 2.92 0.541 0.448 29.8 14.7 4.41 0.97 2.07 1.87
9.6 5.30 111 74.8 61.8 2.31 219 9.8 1.60 9.60 9.43 8.23 2.97 0.540 0.447 30.0 14.8 4.41 0.99 2.07 1.87
9.9 5.30 112 75.2 62.1 2.35 223 9.8 1.62 9.60 9.42 8.23 3.01 0.539 0.446 30.2 14.9 4.41 1.01 2.08 1.87
10.2 5.29 113 75.7 62.3 2.38 226 9.9 1.63 9.60 9.42 8.23 3.06 0.538 0.444 30.4 14.9 4.41 1.02 2.08 1.87
10.5 5.29 114 76.2 62.6 2.42 230 10.0 1.64 9.59 9.42 8.23 3.11 0.537 0.443 30.6 15.0 4.41 1.04 2.08 1.87
10.8 5.28 115 76.7 62.9 2.45 233 10.1 1.66 9.59 9.42 8.23 3.15 0.536 0.441 30.8 15.0 4.41 1.05 2.09 1.87
11.1 5.28 115 77.1 63.2 2.49 236 10.2 1.67 9.59 9.41 8.23 3.20 0.535 0.440 31.0 15.1 4.41 1.07 2.09 1.87
11.4 5.27 116 77.6 63.4 2.52 240 10.3 1.68 9.59 9.41 8.23 3.24 0.534 0.438 31.2 15.2 4.41 1.08 2.09 1.87
11.7 5.27 117 78.0 63.7 2.56 243 10.4 1.70 9.59 9.41 8.23 3.29 0.532 0.437 31.4 15.2 4.41 1.10 2.09 1.87
12.0 5.26 118 78.5 63.9 2.59 247 10.4 1.71 9.58 9.40 8.23 3.33 0.531 0.435 31.7 15.3 4.41 1.11 2.10 1.87
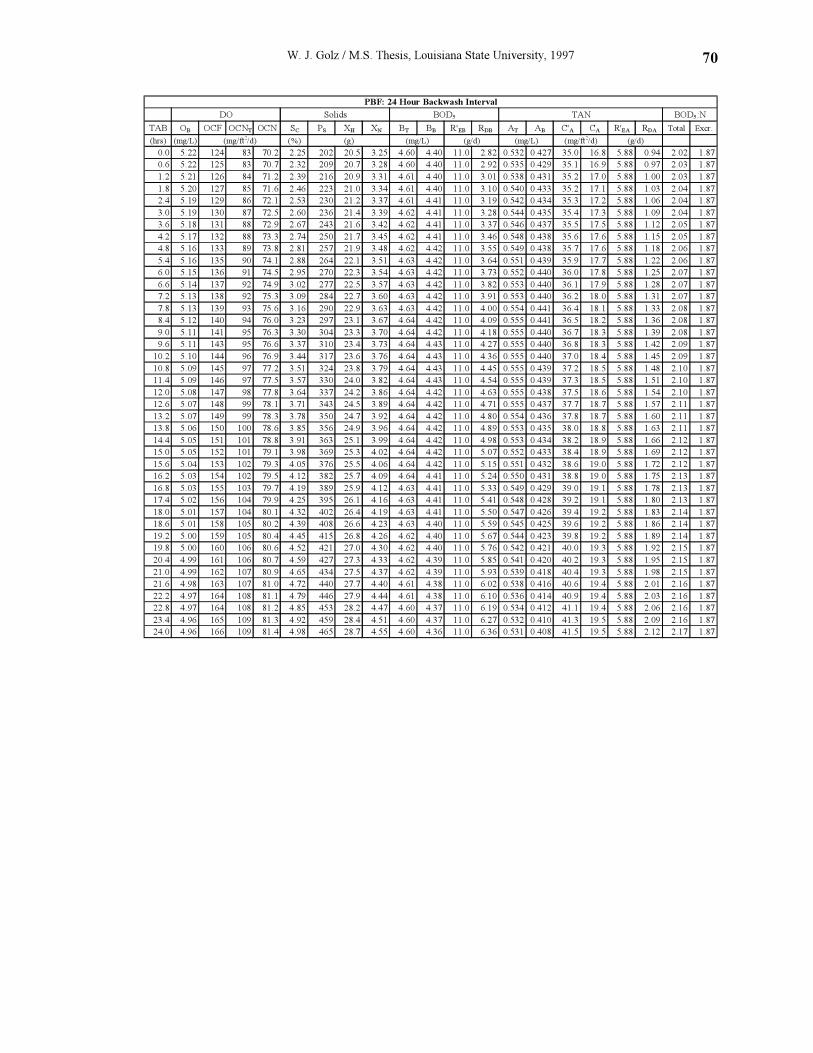
W. J. Golz / M.S. Thesis, Louisiana State University, 1997 70
PBF: 24 Hour Backwash Interval
DO Solids BOD5 TAN BOD5:N
TAB OB OCF OCNT OCN SC PS XH XN BT BB R'EB RDB AT AB C'A CA R'EA RDA Total Excr.
(hrs) (mg/L) (mg/ft2/d) (%) (g) (mg/L) (g/d) (mg/L) (mg/ft2/d) (g/d)
0.0 5.22 124 83 70.2 2.25 202 20.5 3.25 4.60 4.40 11.0 2.82 0.532 0.427 35.0 16.8 5.88 0.94 2.02 1.87
0.6 5.22 125 83 70.7 2.32 209 20.7 3.28 4.60 4.40 11.0 2.92 0.535 0.429 35.1 16.9 5.88 0.97 2.03 1.87
1.2 5.21 126 84 71.2 2.39 216 20.9 3.31 4.61 4.40 11.0 3.01 0.538 0.431 35.2 17.0 5.88 1.00 2.03 1.87
1.8 5.20 127 85 71.6 2.46 223 21.0 3.34 4.61 4.40 11.0 3.10 0.540 0.433 35.2 17.1 5.88 1.03 2.04 1.87
2.4 5.19 129 86 72.1 2.53 230 21.2 3.37 4.61 4.41 11.0 3.19 0.542 0.434 35.3 17.2 5.88 1.06 2.04 1.87
3.0 5.19 130 87 72.5 2.60 236 21.4 3.39 4.62 4.41 11.0 3.28 0.544 0.435 35.4 17.3 5.88 1.09 2.04 1.87
3.6 5.18 131 88 72.9 2.67 243 21.6 3.42 4.62 4.41 11.0 3.37 0.546 0.437 35.5 17.5 5.88 1.12 2.05 1.87
4.2 5.17 132 88 73.3 2.74 250 21.7 3.45 4.62 4.41 11.0 3.46 0.548 0.438 35.6 17.6 5.88 1.15 2.05 1.87
4.8 5.16 133 89 73.8 2.81 257 21.9 3.48 4.62 4.42 11.0 3.55 0.549 0.438 35.7 17.6 5.88 1.18 2.06 1.87
5.4 5.16 135 90 74.1 2.88 264 22.1 3.51 4.63 4.42 11.0 3.64 0.551 0.439 35.9 17.7 5.88 1.22 2.06 1.87
6.0 5.15 136 91 74.5 2.95 270 22.3 3.54 4.63 4.42 11.0 3.73 0.552 0.440 36.0 17.8 5.88 1.25 2.07 1.87
6.6 5.14 137 92 74.9 3.02 277 22.5 3.57 4.63 4.42 11.0 3.82 0.553 0.440 36.1 17.9 5.88 1.28 2.07 1.87
7.2 5.13 138 92 75.3 3.09 284 22.7 3.60 4.63 4.42 11.0 3.91 0.553 0.440 36.2 18.0 5.88 1.31 2.07 1.87
7.8 5.13 139 93 75.6 3.16 290 22.9 3.63 4.63 4.42 11.0 4.00 0.554 0.441 36.4 18.1 5.88 1.33 2.08 1.87
8.4 5.12 140 94 76.0 3.23 297 23.1 3.67 4.64 4.42 11.0 4.09 0.555 0.441 36.5 18.2 5.88 1.36 2.08 1.87
9.0 5.11 141 95 76.3 3.30 304 23.3 3.70 4.64 4.42 11.0 4.18 0.555 0.440 36.7 18.3 5.88 1.39 2.08 1.87
9.6 5.11 143 95 76.6 3.37 310 23.4 3.73 4.64 4.43 11.0 4.27 0.555 0.440 36.8 18.3 5.88 1.42 2.09 1.87
10.2 5.10 144 96 76.9 3.44 317 23.6 3.76 4.64 4.43 11.0 4.36 0.555 0.440 37.0 18.4 5.88 1.45 2.09 1.87
10.8 5.09 145 97 77.2 3.51 324 23.8 3.79 4.64 4.43 11.0 4.45 0.555 0.439 37.2 18.5 5.88 1.48 2.10 1.87
11.4 5.09 146 97 77.5 3.57 330 24.0 3.82 4.64 4.43 11.0 4.54 0.555 0.439 37.3 18.5 5.88 1.51 2.10 1.87
12.0 5.08 147 98 77.8 3.64 337 24.2 3.86 4.64 4.42 11.0 4.63 0.555 0.438 37.5 18.6 5.88 1.54 2.10 1.87
12.6 5.07 148 99 78.1 3.71 343 24.5 3.89 4.64 4.42 11.0 4.71 0.555 0.437 37.7 18.7 5.88 1.57 2.11 1.87
13.2 5.07 149 99 78.3 3.78 350 24.7 3.92 4.64 4.42 11.0 4.80 0.554 0.436 37.8 18.7 5.88 1.60 2.11 1.87
13.8 5.06 150 100 78.6 3.85 356 24.9 3.96 4.64 4.42 11.0 4.89 0.553 0.435 38.0 18.8 5.88 1.63 2.11 1.87
14.4 5.05 151 101 78.8 3.91 363 25.1 3.99 4.64 4.42 11.0 4.98 0.553 0.434 38.2 18.9 5.88 1.66 2.12 1.87
15.0 5.05 152 101 79.1 3.98 369 25.3 4.02 4.64 4.42 11.0 5.07 0.552 0.433 38.4 18.9 5.88 1.69 2.12 1.87
15.6 5.04 153 102 79.3 4.05 376 25.5 4.06 4.64 4.42 11.0 5.15 0.551 0.432 38.6 19.0 5.88 1.72 2.12 1.87
16.2 5.03 154 102 79.5 4.12 382 25.7 4.09 4.64 4.41 11.0 5.24 0.550 0.431 38.8 19.0 5.88 1.75 2.13 1.87
16.8 5.03 155 103 79.7 4.19 389 25.9 4.12 4.63 4.41 11.0 5.33 0.549 0.429 39.0 19.1 5.88 1.78 2.13 1.87
17.4 5.02 156 104 79.9 4.25 395 26.1 4.16 4.63 4.41 11.0 5.41 0.548 0.428 39.2 19.1 5.88 1.80 2.13 1.87
18.0 5.01 157 104 80.1 4.32 402 26.4 4.19 4.63 4.41 11.0 5.50 0.547 0.426 39.4 19.2 5.88 1.83 2.14 1.87
18.6 5.01 158 105 80.2 4.39 408 26.6 4.23 4.63 4.40 11.0 5.59 0.545 0.425 39.6 19.2 5.88 1.86 2.14 1.87
19.2 5.00 159 105 80.4 4.45 415 26.8 4.26 4.62 4.40 11.0 5.67 0.544 0.423 39.8 19.2 5.88 1.89 2.14 1.87
19.8 5.00 160 106 80.6 4.52 421 27.0 4.30 4.62 4.40 11.0 5.76 0.542 0.421 40.0 19.3 5.88 1.92 2.15 1.87
20.4 4.99 161 106 80.7 4.59 427 27.3 4.33 4.62 4.39 11.0 5.85 0.541 0.420 40.2 19.3 5.88 1.95 2.15 1.87
21.0 4.99 162 107 80.9 4.65 434 27.5 4.37 4.62 4.39 11.0 5.93 0.539 0.418 40.4 19.3 5.88 1.98 2.15 1.87
21.6 4.98 163 107 81.0 4.72 440 27.7 4.40 4.61 4.38 11.0 6.02 0.538 0.416 40.6 19.4 5.88 2.01 2.16 1.87
22.2 4.97 164 108 81.1 4.79 446 27.9 4.44 4.61 4.38 11.0 6.10 0.536 0.414 40.9 19.4 5.88 2.03 2.16 1.87
22.8 4.97 164 108 81.2 4.85 453 28.2 4.47 4.60 4.37 11.0 6.19 0.534 0.412 41.1 19.4 5.88 2.06 2.16 1.87
23.4 4.96 165 109 81.3 4.92 459 28.4 4.51 4.60 4.37 11.0 6.27 0.532 0.410 41.3 19.5 5.88 2.09 2.16 1.87
24.0 4.96 166 109 81.4 4.98 465 28.7 4.55 4.60 4.36 11.0 6.36 0.531 0.408 41.5 19.5 5.88 2.12 2.17 1.87
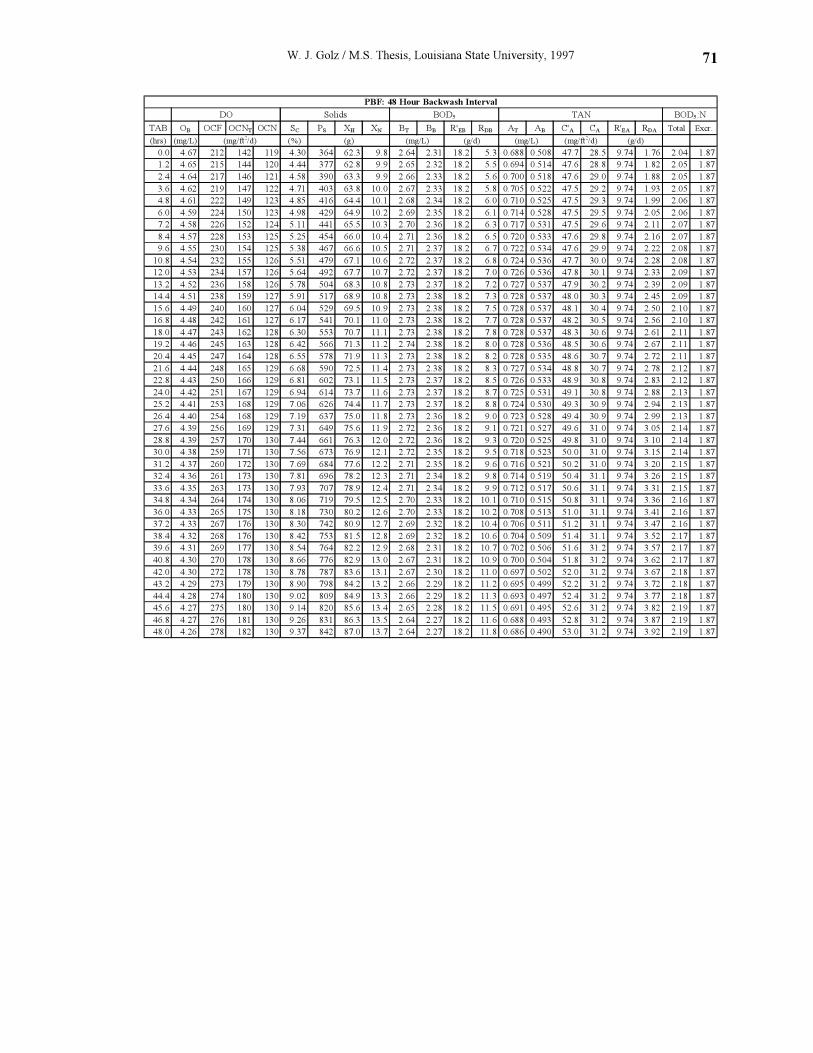
W. J. Golz / M.S. Thesis, Louisiana State University, 1997 71
PBF: 48 Hour Backwash Interval
DO Solids BOD5 TAN BOD5:N
TAB OB OCF OCNT OCN SC PS XH XN BT BB R'EB RDB AT AB C'A CA R'EA RDA Total Excr.
(hrs) (mg/L) (mg/ft2/d) (%) (g) (mg/L) (g/d) (mg/L) (mg/ft2/d) (g/d)
0.0 4.67 212 142 119 4.30 364 62.3 9.8 2.64 2.31 18.2 5.3 0.688 0.508 47.7 28.5 9.74 1.76 2.04 1.87
1.2 4.65 215 144 120 4.44 377 62.8 9.9 2.65 2.32 18.2 5.5 0.694 0.514 47.6 28.8 9.74 1.82 2.05 1.87
2.4 4.64 217 146 121 4.58 390 63.3 9.9 2.66 2.33 18.2 5.6 0.700 0.518 47.6 29.0 9.74 1.88 2.05 1.87
3.6 4.62 219 147 122 4.71 403 63.8 10.0 2.67 2.33 18.2 5.8 0.705 0.522 47.5 29.2 9.74 1.93 2.05 1.87
4.8 4.61 222 149 123 4.85 416 64.4 10.1 2.68 2.34 18.2 6.0 0.710 0.525 47.5 29.3 9.74 1.99 2.06 1.87
6.0 4.59 224 150 123 4.98 429 64.9 10.2 2.69 2.35 18.2 6.1 0.714 0.528 47.5 29.5 9.74 2.05 2.06 1.87
7.2 4.58 226 152 124 5.11 441 65.5 10.3 2.70 2.36 18.2 6.3 0.717 0.531 47.5 29.6 9.74 2.11 2.07 1.87
8.4 4.57 228 153 125 5.25 454 66.0 10.4 2.71 2.36 18.2 6.5 0.720 0.533 47.6 29.8 9.74 2.16 2.07 1.87
9.6 4.55 230 154 125 5.38 467 66.6 10.5 2.71 2.37 18.2 6.7 0.722 0.534 47.6 29.9 9.74 2.22 2.08 1.87
10.8 4.54 232 155 126 5.51 479 67.1 10.6 2.72 2.37 18.2 6.8 0.724 0.536 47.7 30.0 9.74 2.28 2.08 1.87
12.0 4.53 234 157 126 5.64 492 67.7 10.7 2.72 2.37 18.2 7.0 0.726 0.536 47.8 30.1 9.74 2.33 2.09 1.87
13.2 4.52 236 158 126 5.78 504 68.3 10.8 2.73 2.37 18.2 7.2 0.727 0.537 47.9 30.2 9.74 2.39 2.09 1.87
14.4 4.51 238 159 127 5.91 517 68.9 10.8 2.73 2.38 18.2 7.3 0.728 0.537 48.0 30.3 9.74 2.45 2.09 1.87
15.6 4.49 240 160 127 6.04 529 69.5 10.9 2.73 2.38 18.2 7.5 0.728 0.537 48.1 30.4 9.74 2.50 2.10 1.87
16.8 4.48 242 161 127 6.17 541 70.1 11.0 2.73 2.38 18.2 7.7 0.728 0.537 48.2 30.5 9.74 2.56 2.10 1.87
18.0 4.47 243 162 128 6.30 553 70.7 11.1 2.73 2.38 18.2 7.8 0.728 0.537 48.3 30.6 9.74 2.61 2.11 1.87
19.2 4.46 245 163 128 6.42 566 71.3 11.2 2.74 2.38 18.2 8.0 0.728 0.536 48.5 30.6 9.74 2.67 2.11 1.87
20.4 4.45 247 164 128 6.55 578 71.9 11.3 2.73 2.38 18.2 8.2 0.728 0.535 48.6 30.7 9.74 2.72 2.11 1.87
21.6 4.44 248 165 129 6.68 590 72.5 11.4 2.73 2.38 18.2 8.3 0.727 0.534 48.8 30.7 9.74 2.78 2.12 1.87
22.8 4.43 250 166 129 6.81 602 73.1 11.5 2.73 2.37 18.2 8.5 0.726 0.533 48.9 30.8 9.74 2.83 2.12 1.87
24.0 4.42 251 167 129 6.94 614 73.7 11.6 2.73 2.37 18.2 8.7 0.725 0.531 49.1 30.8 9.74 2.88 2.13 1.87
25.2 4.41 253 168 129 7.06 626 74.4 11.7 2.73 2.37 18.2 8.8 0.724 0.530 49.3 30.9 9.74 2.94 2.13 1.87
26.4 4.40 254 168 129 7.19 637 75.0 11.8 2.73 2.36 18.2 9.0 0.723 0.528 49.4 30.9 9.74 2.99 2.13 1.87
27.6 4.39 256 169 129 7.31 649 75.6 11.9 2.72 2.36 18.2 9.1 0.721 0.527 49.6 31.0 9.74 3.05 2.14 1.87
28.8 4.39 257 170 130 7.44 661 76.3 12.0 2.72 2.36 18.2 9.3 0.720 0.525 49.8 31.0 9.74 3.10 2.14 1.87
30.0 4.38 259 171 130 7.56 673 76.9 12.1 2.72 2.35 18.2 9.5 0.718 0.523 50.0 31.0 9.74 3.15 2.14 1.87
31.2 4.37 260 172 130 7.69 684 77.6 12.2 2.71 2.35 18.2 9.6 0.716 0.521 50.2 31.0 9.74 3.20 2.15 1.87
32.4 4.36 261 173 130 7.81 696 78.2 12.3 2.71 2.34 18.2 9.8 0.714 0.519 50.4 31.1 9.74 3.26 2.15 1.87
33.6 4.35 263 173 130 7.93 707 78.9 12.4 2.71 2.34 18.2 9.9 0.712 0.517 50.6 31.1 9.74 3.31 2.15 1.87
34.8 4.34 264 174 130 8.06 719 79.5 12.5 2.70 2.33 18.2 10.1 0.710 0.515 50.8 31.1 9.74 3.36 2.16 1.87
36.0 4.33 265 175 130 8.18 730 80.2 12.6 2.70 2.33 18.2 10.2 0.708 0.513 51.0 31.1 9.74 3.41 2.16 1.87
37.2 4.33 267 176 130 8.30 742 80.9 12.7 2.69 2.32 18.2 10.4 0.706 0.511 51.2 31.1 9.74 3.47 2.16 1.87
38.4 4.32 268 176 130 8.42 753 81.5 12.8 2.69 2.32 18.2 10.6 0.704 0.509 51.4 31.1 9.74 3.52 2.17 1.87
39.6 4.31 269 177 130 8.54 764 82.2 12.9 2.68 2.31 18.2 10.7 0.702 0.506 51.6 31.2 9.74 3.57 2.17 1.87
40.8 4.30 270 178 130 8.66 776 82.9 13.0 2.67 2.31 18.2 10.9 0.700 0.504 51.8 31.2 9.74 3.62 2.17 1.87
42.0 4.30 272 178 130 8.78 787 83.6 13.1 2.67 2.30 18.2 11.0 0.697 0.502 52.0 31.2 9.74 3.67 2.18 1.87
43.2 4.29 273 179 130 8.90 798 84.2 13.2 2.66 2.29 18.2 11.2 0.695 0.499 52.2 31.2 9.74 3.72 2.18 1.87
44.4 4.28 274 180 130 9.02 809 84.9 13.3 2.66 2.29 18.2 11.3 0.693 0.497 52.4 31.2 9.74 3.77 2.18 1.87
45.6 4.27 275 180 130 9.14 820 85.6 13.4 2.65 2.28 18.2 11.5 0.691 0.495 52.6 31.2 9.74 3.82 2.19 1.87
46.8 4.27 276 181 130 9.26 831 86.3 13.5 2.64 2.27 18.2 11.6 0.688 0.493 52.8 31.2 9.74 3.87 2.19 1.87
48.0 4.26 278 182 130 9.37 842 87.0 13.7 2.64 2.27 18.2 11.8 0.686 0.490 53.0 31.2 9.74 3.92 2.19 1.87