Embed Size (px)
Citation preview

0
A test of the ‘lose it or use it’ hypothesis
in labour markets around the world*
Karsten Albæk† SFI
Version of
July 27, 2015
Abstract: This paper investigates skills and the use of skills at work in 21 OECD countries. The skills included in the analysis are literacy, numeracy and problem-solving. The paper investigates the conjecture that the deterioration of skills with age might be more pronounced in occupations with a limited use of skills than in occupations with more intensive use of these skills – an implica-tion of the ‘use it or lose it’ hypothesis. I look at the development over age of both measured skills and the use of skills at work in two aggregate categories of occupations: a group of high-skilled workers (ISCO major occupations from 0 to 4) and a group of low-skilled workers (ISCO major occupations from 5 to 9). High-skilled workers have higher measured skills than low-skilled work-ers and high-skilled workers use skills more at work than low-skilled workers. Measured skills de-cline from the age of 35 both for high- and low-skilled workers at about the same pace. The use of skills at work also declines from the age of 35 for both high-skilled workers and low-skilled work-ers at about the same pace, and at about the same rate as measured skills. The evidence does not support the ‘use it or lose it’ hypothesis. Keywords: Skills; occupations; ageing. JEL classification: J14 _____________________________________________________________________ * I thank Jan-Erik Gustafsson, Erik Mellander, Anders Rosdahl and the participants in the SFI Advisory Board Conference June 2015 for constructive comments. This paper is an outcome of the joint Nordic project ‘Skill acquisition, skill loss, and age – A comparative study of Cognitive Foundation Skills (CFS) in Den-mark, Finland, Norway, and Sweden’. Financial support from NordForsk, Research Project #54861, is grate-fully acknowledged. †Karsten Albæk. SFI – The Danish National Centre for Social Research, Herluf Trolles Gade 11, DK-1053 Copenhagen K, email: [email protected]

1
1. Introduction
Training to obtain skills is generally considered a major element in skill formation, with educational
institutions encouraging students to work with their curriculum and its assignments. Economists
measure investment in schooling as the number of years spent in educational institutions, and firms
train workers with the aim of increasing the ability of their workforce and obtaining higher produc-
tivity. In physical activities such as sports, training is likewise essential for obtaining results, and
skills that are not used deteriorate rapidly. The deterioration of skills might be impeded by the use
of these skills, not only with respect to physical activity but also with respect to mental activity.
The hypothesis that engaging in cognitive-demanding activities can prevent or impede age-related
decline in cognitive abilities is known as the ‘use it or lose it’ hypothesis. This hypothesis appears
to be both intuitive and plausible, with considerable appeal. However, Salthouse (2006) makes a
careful review of the psychological literature on this topic but does not find much evidence for the
validity of the hypothesis. According to Salthouse (2006) much of the literature fails to distinguish
between the level of cognitive ability and the change in cognitive ability. Included in his review are
studies that compare the cognitive ageing of experts and amateurs (e.g. chess players), and of nar-
row occupational groups as architects, physicians and university professors.
This paper investigates the following conjecture: the deterioration of skills over age might be less
pronounced in occupations with intensive use of cognitive skills than in occupations with more lim-
ited use of these skills. I test this hypothesis by analysing how measured skills and the use of these
skills at work vary with age in major occupational groups in the workforce of 21 developed coun-
tries.
The level and use of cognitive abilities of the workforce is a topic of substantial interest. Cognitive
skills are considered a major element in individual success in the labour market and society (e.g.
Heckman et al. (2006)). A substantial part of skill formation takes place in formal education and a
major purpose of schools and educational institutions is formation of cognitive abilities (e.g.
Hanushek (1986)).
The data for the analysis is the PIACC survey, which is collected by the OECD. The survey meas-
ure ‘information-processing’ skills in three domains (types of skills): literacy, numeracy and prob-

2
lem-solving (use of information technology). The respondents answer questions in tests for these
three types of skills and also answer items about the intensity of their use of these skills at work.
The aim of the assessment of cognitive abilities in PIAAC is that the cognitive outcome measures
should reflect abilities amenable to policy initiatives.1
The survey also contains information about occupational groups of employed workers according to
the International Standard Classification of Occupations (ISCO). Although this classification con-
tains ten major occupational groups (the 1-digit ISCO level), the number of respondents in each
country is too limited for enabling analysis at the 1-digit level. To gain power in the analysis, I lump
employed workers in each country into two groups according to their skill-level as measured by the
1-digit ISCO classification: ‘high-skilled’ workers in ISCO levels 0 to 4 and ‘low-skilled’ workers
in ISCO levels 5 to 9. These two groups of workers classified according to ISCO levels are some-
times labelled ‘white-collar’ and ‘blue-collar’ workers (e.g. Heckman et al. (2006), p. 428).
I show the variation in skill and skill use over age groups and occupations for each of the 21 coun-
tries in a condensed graphical analysis, which also displays the uncertainty in the form of 95 per
cent confidence intervals. The combination of both averages and confidence intervals allows me to
assess to what extent significant differences exist between skills and skill use across ages, occupa-
tions, and countries. In addition to the graphical analysis, I perform regression analysis for those
ages that exhibit a negative relation between skills and age, that is, for the respondents aged 35 to
65.
Hanushek et al. (2015) analyse returns to skills on the PIAAC data and confirm that there are sub-
stantial returns to measured cognitive skills in the countries in the survey. However, to the extent
that the ‘use it or lose it’ hypothesis is valid, regressions of current wages on contemporaneous
measures of cognitive ability may be affected by reverse causality: individuals who secure high-
quality jobs with high earnings may tend to improve or maintain their basic skills (see Edin and
Gustavsson (2008) for an elaboration of this hypothesis).
1 According to the OECD (2013a), p. 28, the skills measured in PIAAC are ‘….“learnable”. That is, countries can shape the level and distribution of these skills in their populations through the quality and equity of learning opportunities both in formal educational institutions and in the workplace.’

3
The data have several advantages as they are representative within countries and comparable across
countries, and contain a relative large number of observations and a fairly large number of coun-
tries. However, as the data are cross-sectional, estimates of the change in cognitive ability with age
are potentially biased. There are (at least) two phenomena that might result in bias in the estimates
of the relation between cognitive skills and age from cross-sectional data. One is cohort effects, the
other retirement. A separate section following the empirical analysis contains a discussion of the
magnitude of the potential bias of the estimates.
The paper is organized as follows. Section 2 presents the data. Section 3 contains the results for
reading ability and reading at work. Section 4 presents the results for numeracy, and section 5 pre-
sents the results for problem-solving. Section 6 discusses the results, including a consideration of
potential bias of the estimates. Section 7 concludes.
2. The data
The data for the paper stem from the Programme for the International Assessment of Adult Compe-
tencies (PIAAC) data base. This survey of adult skills assesses the proficiency of adults aged 16-65
for the three measures of cognitive skills literacy, numeracy, and problem-solving in technology-
rich environments. These skills are intended to measure ‘key information-processing competencies’
that are relevant to adults in many social contexts and work situations. Whilst data was collected for
24 participating countries, I use 21 in the analysis: Austria, Belgium (only Flanders), Canada, the
Czech Republic, Denmark, Estonia, Finland, France, Germany, Ireland, Italy, Japan, Korea, Nether-
lands, Norway, Poland, the Slovak Republic, Spain, Sweden, the United Kingdom (England and
Northern Ireland) and the United States.2 The data was collected from August 2011 through March
2012 in most participating countries.
Representative samples of the adult population were interviewed in their homes in the language of
their country. Whilst questions were answered via computer, respondents with no computer experi-
ence could use paper and pencil. The interview included both a background questionnaire and ques-
tions for the assessment of cognitive skills.
2 Although Australia and Cyprus are included in the survey, the data are not present as public use files. The Russian Federation is omitted because the data according to OECD (2013a) are only preliminary.
4
According to the OECD (2013a), the assessment domains in PIAAC are as follows. Literacy is the
ability to understand, evaluate, use and engage with written texts to participate in society, to achieve
one’s goals, and to develop one’s knowledge and potential. Numeracy is the ability to access, use,
interpret and communicate mathematical information and ideas in order to engage in and manage
the mathematical demands of a range of situations in adult life. Problem-solving is the ability to use
digital technology, communication tools and networks to acquire and evaluate information, com-
municate with others and perform practical tasks.
This paper uses the scores for these three measures of cognitive skills and the corresponding
measures of skill use at work included in questionnaire (literacy, numeracy and problem-solving).
In addition, I use the background information on the age and occupation of the worker.
The countries use different sampling schemes in drawing samples of the adult populations and have
different response rates of different groups of the adult populations. The data contains weights to
align the respondents with the population, and I apply these sampling weights in all the analyses.
The respondents do not answer all items in the questionnaire. Estimates of individual cognitive abil-
ities are based on both item response theory and statistical modelling including latent regressions.
These estimates of individual cognitive abilities are given in the data as ten ‘plausible values’ for
each individual for each of the three measures of cognitive skills (literacy, numeracy and problem-
solving). As the plausible values for each individual are correlated, valid estimates of variance esti-
mators take this correlation into account.3 Throughout the paper I use the 10 plausible values for
each individual for the three measures of cognitive skills, and present standard errors that take into
account both the sampling variability and the imputation variance associated with the plausible val-
ues.
The measure of the three skills in PIAAC is on a 500-point scale. I normalise scores by subtracting
the country-specific means and divide by the country-specific standard deviations.
I investigate how both cognitive skills and the use of skills vary between occupations. The PIAAC
database contains variables that indicate the occupations of the respondents according to the catego- 3 See the OECD (2013b) and von Davier et al. (2009) for the construction and use of plausible values. The technique is an example of ‘multiple imputation’.

5
ries of the International Standard Classification of Occupations (ISCO). The ISCO numbers occupa-
tional categories so that the first digit indicates the major occupational category to which each oc-
cupation belongs. The 10 major occupational categories are as follows: (0) armed forces occupa-
tions, (1) managers, (2) professionals, (3) technicians and associate professionals, (4) clerical sup-
port workers, (5) service and sales workers, (6) skilled agricultural, forestry and fishery workers, (7)
craft and related trades workers, (8) plant and machine operators and assemblers, and (9) elemen-
tary occupations.
The number of observations per country is too small for me to trace a statistical significant devel-
opment over age for each of the major occupations. I thus lump together the major occupations in
two aggregate categories: (a) ‘ISCO 0-4’ containing major occupations from ‘0 army’ to ‘4 clerical
support workers’ and (b) ‘ISCO 5-9’ containing major occupations from ‘5 service and sales work-
ers’ to ‘9 elementary occupations’. The first group, ‘ISCO 0-4’, thus contains the first five major
occupations, whilst the second group, ‘ISCO 5-9’, contains the last five. In the rest of the paper, I
denote the group of workers in the ‘ISCO 0-4’ category ‘high-skilled’ workers, and workers in the
‘ISCO 5-9’ category ‘low-skilled’ workers.
For most countries data contains age as a continuous variable, but for four countries age is reported
only for age brackets (Austria, Canada, Germany and the US). For these four countries I construct a
continuous variable by applying the midpoint of the age brackets as data points. I have replicated
the procedure for the countries where the continuous measure is available and do not find large dif-
ferences in the results.
Drawing on the answers on the use of literacy, numeracy, and problem-solving at work, I construct
indices for the use of these three skills. I apply these indices in place of those indices for reading,
writing, numeracy and problem-solving at work included in the PIAAC data base and constructed
by the OECD. However, my indices are very close to those included in the PIAAC data base for
those workers for which the OECD has constructed indices (the correlation coefficients are 0.92 for
reading, 0.95 for numeracy and 0.90 for problem-solving). A main reason for applying my own
indices is that the indices in the PIAAC data base omit the category ‘never’ in the calculations, with
the implication that a non-negligible share of the respondents has missing values.4
4 Anders Rosdahl constructed these alternative measures for the use of skills and applied them in Rosdahl (2013).

6
I first look at the use of reading or literacy at work. The questionnaire contains eight items on this
topic. The participants were asked to state the intensity of the following activities at the workplace
by answering how often they usually: (a) read directions or instructions, (b) read letters, memos or
e-mails, (c) read articles in newspapers, magazines or newsletters, (d) read articles in professional
journals or scholarly publications, (e) read books, (f) read manuals or reference materials, (g) read
bills, invoices, bank statements or other financial statements, and (h) read diagrams, maps or sche-
matics.
The items have the same answer categories, and I assign a score value to each of the categories. The
answer categories are as follows (the parentheses contain the score values): ‘never’ (value 1), ‘less
than once a month’ (value 2), ‘less than once a week but at least once a month’ (value 3), ‘at least
once a week but not every day’ (value 4), and ‘every day’ (value 5). I then calculate the mean value
of the score for the eight items. These mean values form the basis for calculating the average use of
literacy at work for age categories and occupational groups.
Next I look at the use of numeracy at work, and assess it from the answers on the following six
items about how often they usually: (a) calculate prices, costs or budgets, (b) use or calculate frac-
tions, decimals or percentages, (c) use a calculator – either hand-held or computer based, (d) pre-
pare charts, graphs or tables, (e) use simple algebra or formulas, and (f) use more advanced math or
statistics such as calculus, complex algebra, trigonometry or use of regression techniques. From the
answers to these items, I calculate the mean score for use of numeracy at work in the same way that
I calculated the mean scores for reading at work.
Finally I look at the intensity of problem-solving with information and computer technology (ICT)
at work, and assess it from the answers to the following seven items about how often they usually:
(a) use email, (b) use the internet in order to better understand issues related to work, (c) conduct
transactions on the internet, for example buying or selling products or services, or banking, (d) use
spreadsheet software, for example Excel, (e) use a word processor, for example Word, (f) use a pro-
gramming language to program or write computer code, and (g) participate in real-time discussions
on the internet, for example online conferences, or chat groups. For each respondent, I calculate the

7
index of problem-solving at work the same way as for the mean scores for reading and numeracy at
work.
Table A1 in the appendix presents statistics for the sample of employed workers in the 21 countries.
Sample sizes range from 2,841 in Italy to 5,791 in England, with Canada as an upper outlier with
19,168. In most countries the group of high-skilled workers contains slightly more than half of the
observations, whilst the group of low-skilled workers contains slightly less than half (exceptions are
Korea, Poland, the Slovak Republic and Spain). The average share of employed workers increases
from 43 per cent at age 16-24 to about 80 per cent at age 25-54, after which age a decrease sets in
and results in an employment ratio of 51 per cent at age 55-65. The average number of years of
schooling decreases from 13.5 years in age category 25-34 to 11.8 years in age category 55-65.
3. Literacy and age
This section displays results for literacy skills and use of literacy in major occupational categories
over age for each of the 21 countries. I display graphs for the literacy skills and use in different age
categories, and I present regression results for the development of literacy skills and use with age.
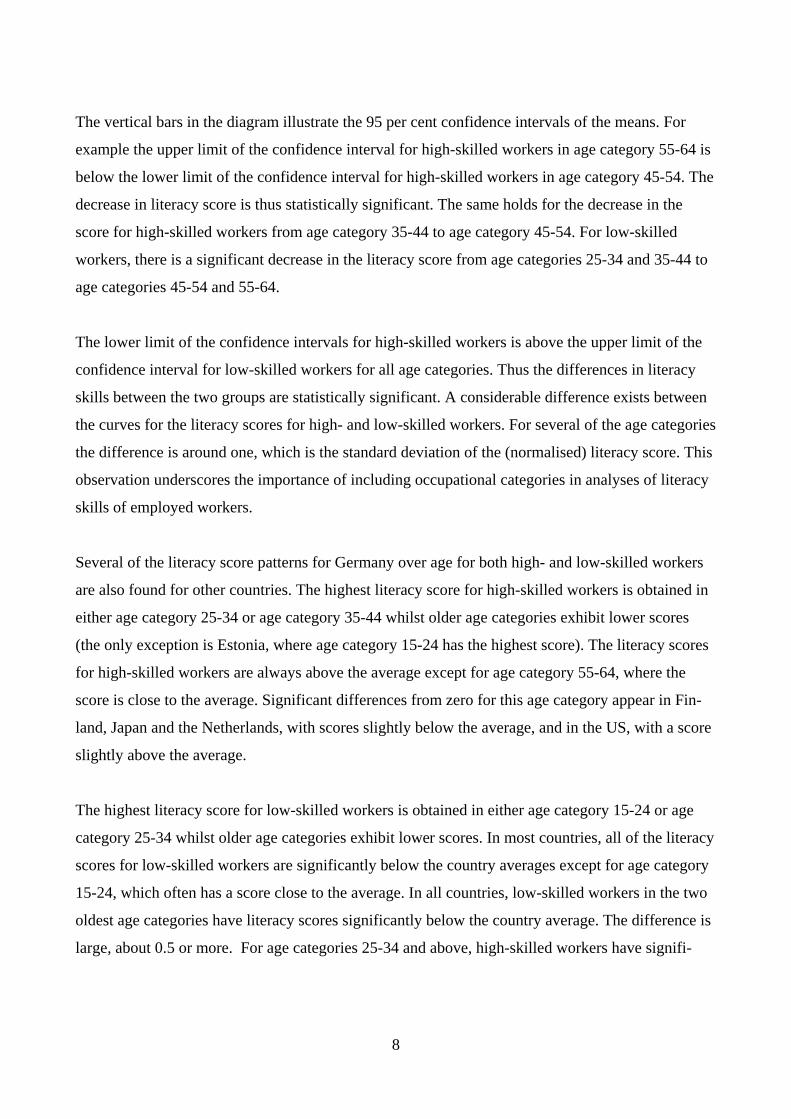
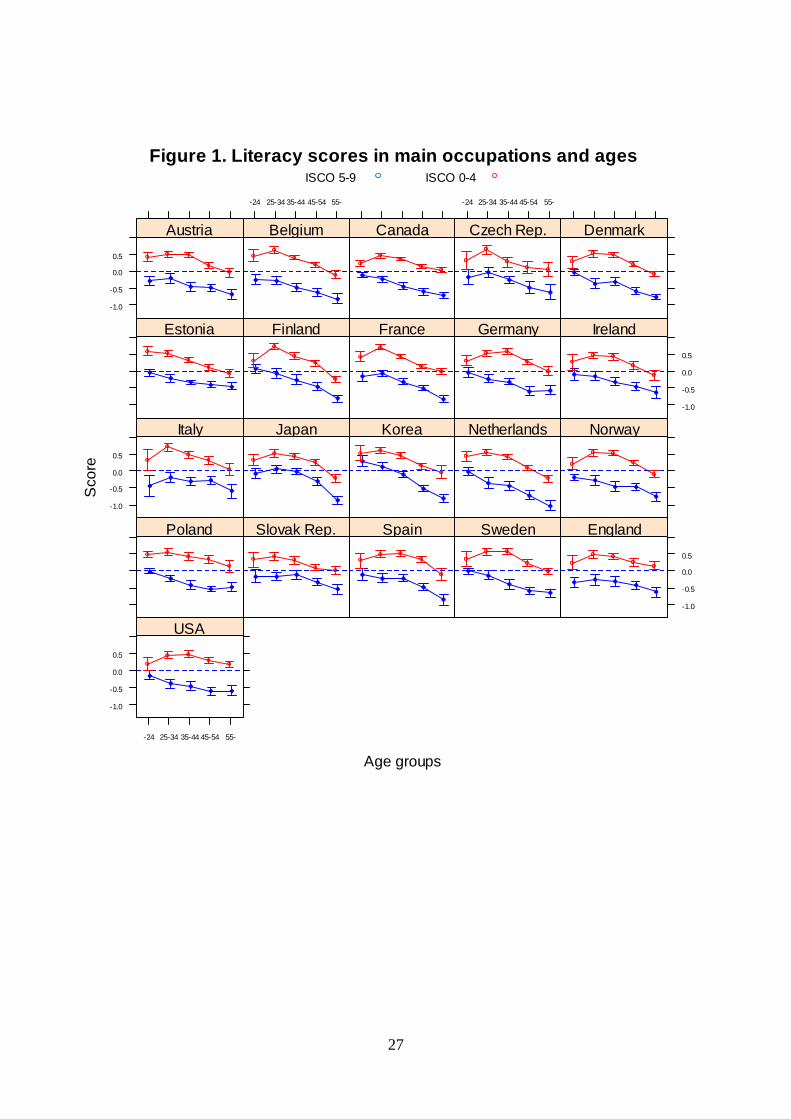
Figure 1 shows how the literacy score varies over ages and occupations in the different countries
(listed alphabetically). I start with Germany, which is representative for most countries.
[Figure 1 around here]
For the high-skilled workers in occupational categories ISCO 0-4, the literacy score in age category
16-24 is slightly above zero, which is the mean score for all workers in the sample for Germany. As
previously mentioned, the scores for each country are normalized by subtracting the average score
and dividing by the dispersion for each country. The score increases to about 0.5 in age category
25-34 and slightly more up to age category 35-44. However, the score decreases to a level of about
0.5 in age category 45-54 and even further to a level of about zero in age category 55-64. For the
low-skilled workers in occupational categories ISCO 5-9, the literacy score in age category 16-24 is
zero. The score decreases to about -0.5 in age categories 25-34 and 35-44, followed by a further
decrease to a level slightly below -0.5 in age categories 45-54 and 55-64.
8
The vertical bars in the diagram illustrate the 95 per cent confidence intervals of the means. For
example the upper limit of the confidence interval for high-skilled workers in age category 55-64 is
below the lower limit of the confidence interval for high-skilled workers in age category 45-54. The
decrease in literacy score is thus statistically significant. The same holds for the decrease in the
score for high-skilled workers from age category 35-44 to age category 45-54. For low-skilled
workers, there is a significant decrease in the literacy score from age categories 25-34 and 35-44 to
age categories 45-54 and 55-64.
The lower limit of the confidence intervals for high-skilled workers is above the upper limit of the
confidence interval for low-skilled workers for all age categories. Thus the differences in literacy
skills between the two groups are statistically significant. A considerable difference exists between
the curves for the literacy scores for high- and low-skilled workers. For several of the age categories
the difference is around one, which is the standard deviation of the (normalised) literacy score. This
observation underscores the importance of including occupational categories in analyses of literacy
skills of employed workers.
Several of the literacy score patterns for Germany over age for both high- and low-skilled workers
are also found for other countries. The highest literacy score for high-skilled workers is obtained in
either age category 25-34 or age category 35-44 whilst older age categories exhibit lower scores
(the only exception is Estonia, where age category 15-24 has the highest score). The literacy scores
for high-skilled workers are always above the average except for age category 55-64, where the
score is close to the average. Significant differences from zero for this age category appear in Fin-
land, Japan and the Netherlands, with scores slightly below the average, and in the US, with a score
slightly above the average.
The highest literacy score for low-skilled workers is obtained in either age category 15-24 or age
category 25-34 whilst older age categories exhibit lower scores. In most countries, all of the literacy
scores for low-skilled workers are significantly below the country averages except for age category
15-24, which often has a score close to the average. In all countries, low-skilled workers in the two
oldest age categories have literacy scores significantly below the country average. The difference is
large, about 0.5 or more. For age categories 25-34 and above, high-skilled workers have signifi-

9
cantly higher literacy scores than low-skilled workers in all countries. Again, the difference is sub-
stantial.
At the beginning of the age distribution, all countries (except Estonia) exhibit an increase in the
literacy score for high-skilled workers from age category 15-24 to age category 25-34. Many of
these increases are either statistically significant or close to significant. In contrast, for all other age
categories the literacy score is either at the same level or lower than that at the previous and young-
er age category – in many cases statistically significantly lower.
The likely reason for the increases in the literacy score for high-skilled workers from age category
15-24 to age category 25-34 is a composition effect. The high-skilled workers in age category 25-34
differ from the high-skilled workers in category 15-24. For example, many employees in major oc-
cupational category two (ISCO 2), professionals, have a tertiary education and often leave higher
educational institutions after the age of 24 (according to table A1, age group 16-24 has a low em-
ployment rate of 43 per cent at age 16-24 compared to 77 per cent at age 25-34). This group, which
scores high on literacy ability, is thus typically included in the group of high-skilled workers (ISCO
0-4), at ages 25-34, but not at ages 15-24. The number of persons belonging to the group of high-
skilled workers at age 15-24 is limited, a finding that is reflected in the comparatively large confi-
dence intervals for this group.
The test of the ‘use it or lose it’ hypothesis appears in Table 1, which contains the coefficients from
a regression of the literacy score on a dummy for belonging to the group of high-skilled workers,
age divided by ten, the interaction between the dummy and age, and the number of years of school-
ing.5 As I focus on the decline in cognitive ability, I confine the analysis to workers aged 35-65.
According to the graphical analysis, the decline in cognitive abilities in both the high- and the low-
skilled groups begins by age category 35 to 44 in most countries, whilst the decline in some coun-
tries sets in at age category 25-34.
[Table 1 around here]
5 The German data unfortunately do not contain information about the number of years of education. Thus Table 1 con-tains no regression results for Germany.
10
The first column of Table 1 contains the coefficient to the skill dummy. It shows that high-skilled
workers in 18 out of 20 countries have significantly higher scores than low-skilled workers. The
average difference for all countries is 0.468 standard deviations (calculated as the unweighted aver-
ages of the coefficients for the 20 countries). Norway and Austria are those countries that have the
highest difference (0.80 standard deviations), whilst the Slovak Republic and Japan have the lowest
(0.12 and 0.15 standard deviations, respectively).
Education has a significant impact on literacy skills in all countries and the impact is substantial, as
one more year of education implies increases in the literacy score of 0.12 standard deviations ac-
cording to the country average. The impact of schooling on literacy is highest in the US, where the
coefficient is 0.17 standard deviations.
The column containing the coefficient to age shows that literacy skills decline with age in all but
one of the 20 countries (Ireland) and that the decline is significant in 12 countries. The decline in
three countries (Canada, Sweden and the US) is borderline significant. The average decline is 0.128
standard deviations per decade, and according to this estimate, the average decline in literacy skills
from age 35 to 65 is thus 0.398 standard deviations. Most countries exhibit declines that are not
significantly different from the average for all countries. However, the decline in Japan of 0.340
standard deviations per decade shows a reduction that is substantially larger than that in most other
countries.
One reason for the decline in cognitive scores is that younger cohorts tend to have higher levels of
education than older cohorts. Indeed, Table A1 in the appendix shows that the number of years of
schooling declines with age from age 35 in all the countries in the sample. However, as schooling
enters as an explanatory variable in the regressions for literacy skills, the coefficients to age is the
association between literacy skills and age after accounting for the level of education.
The contention is that high-skilled workers have a higher use of literacy at work than low-skilled
workers (we will see shortly that this contention is correct). If the ‘use it or lose it’ hypothesis is
valid, high-skilled workers should thus exhibit a lower decline in literacy scores than low-skilled
workers, implying a positive coefficient to the interaction term between age and the occupation
dummy.
11
The coefficient to the interaction term estimates differences in the change in cognitive abilities over
age between the group of high-skilled and the group of low-skilled workers. The analysis in this
paper thus distinguishes between the level of cognitive ability and the change in cognitive ability,
which is in contrast to much of the literature according to Salthouse (2006).
According to the evidence from the coefficients to the interaction term in Table 1, the hypothesis of
positive coefficients to the interaction term is rejected. Out of the 20 countries, 16 have negative
coefficients and 9 of these coefficients are significantly different from zero. Only four countries
have positive interaction terms, and none of these are significantly different from zero. The average
interaction term for the 21 countries is -0.076 standard deviations. According to this estimate, the
literacy scores for high-skilled workers thus decline by 0.205 standards deviations per decade
(0.128+0.076) or 0.634 standard deviations from age 35 to 65. As the estimate is 0.398 standard
deviations for low-skilled workers, high-skilled workers thus experience a higher loss in literacy
skills.
I test the appropriateness of specifying the decline in reading scores as a linear function in age by
including age squared as an explanatory variable. A faster decline in scores at later ages will yield a
negative coefficient to age squared. The result of the specification test is that the coefficient to age
squared is significantly different from zero for four out of 20 countries, where all four coefficients
are negative (I do not report the results). Thus I conclude that the linear specification for the age
variable is valid for most countries. As a further specification test, I enter the logarithm of the test
score on the left-hand side of the regression instead of the level of the test score. This specification
entails that the decline in scores with age is described as a relative decline instead of the absolute
decline displayed in Figure 1. The result is no difference in the significance of the coefficients: all
significant coefficients in Table 1 are also significantly different from zero when the test scores
enter in log form, and all insignificant coefficients are also insignificant under the alternative speci-
fication.
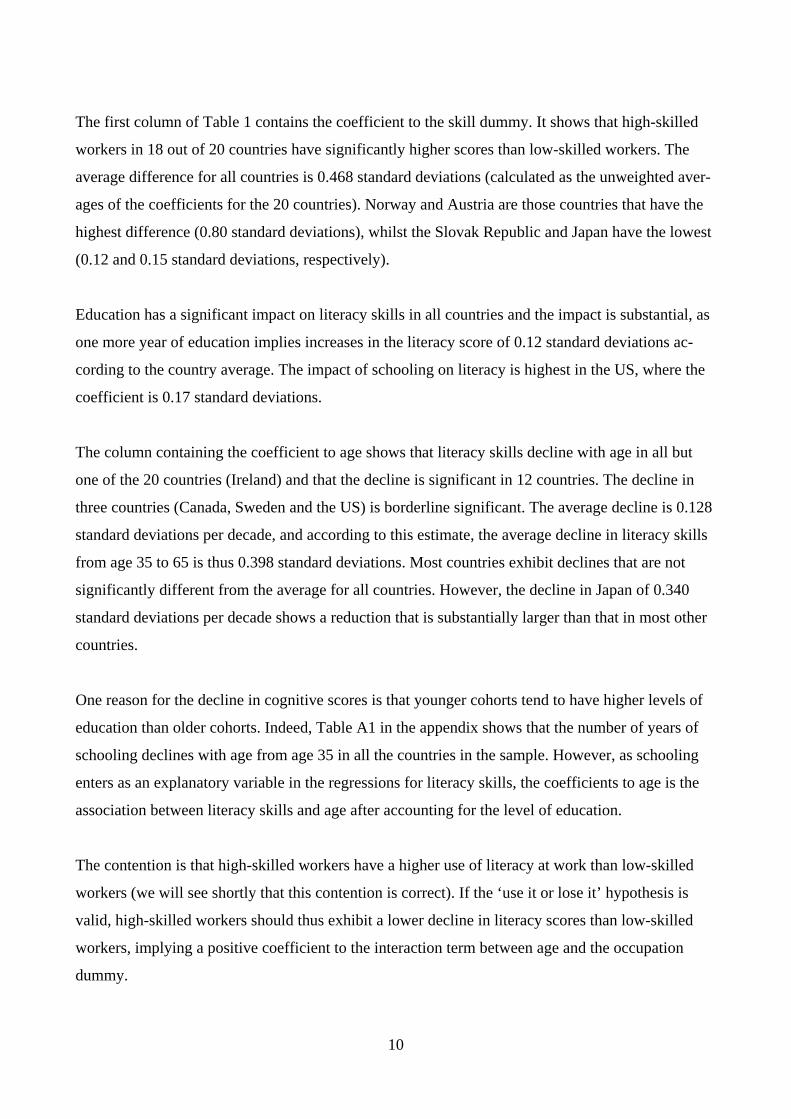
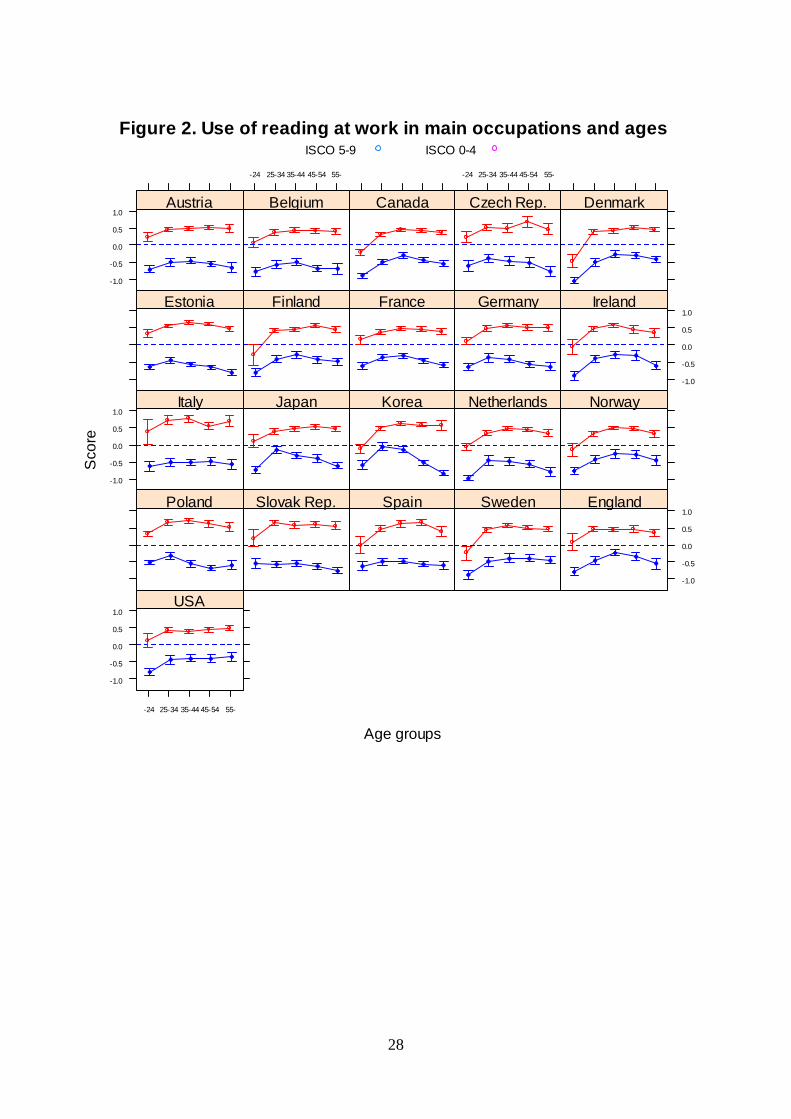
I next look at the use of reading at work (figure 2). For high-skilled workers, all countries exhibit a
steep increase in the use of reading at work from age category 15-24 to age category 25-34 and in
nearly all countries this increase is significant. However, afterwards the variation in the use of liter-
12
acy at work over ages for high-skilled workers appears to be limited – several of the curves are es-
sentially flat and there are few examples of significant differences in scores between age categories.
[Figure 2 around here]
For low-skilled workers as well, all countries exhibit an increase in the use of reading at work from
age category 15-24 to age category 25-34 that in many countries is significant. In some countries
(e.g. the Nordic countries) the increase continues to age category 35-44. From age category 35-44,
the curves for low-skilled workers decrease in several countries. The decrease is especially pro-
nounced in Japan and Korea, which both exhibit sharp, significant decreases in the use of reading at
work for low-skilled workers. In the other countries the curves are flat, except for the US, which
exhibits a slight (albeit insignificant) increase.
The level of use of reading for high-skilled workers is higher than the average in all countries ex-
cept for those in age category 15-24. Conversely, the level of use of reading for low-skilled workers
is lower than the average in all countries for all age categories.
Table 1 summarises the difference in the use of reading skills between high-skilled and low-skilled
workers and how this difference develops with age. The column containing the coefficient for the
dummy for high-skilled occupations shows that in all countries the use of reading skills amongst
high-skilled workers is significant larger than that amongst low-skilled workers. The average differ-
ence is 0.892 standard deviations. Countries with significantly smaller differences between high-
and low-skilled workers in the use of reading at work include Japan, Korea and two of the Nordic
countries (Denmark, Finland whilst Norway is borderline significant).
The column containing the coefficients on age shows that the use of reading for all workers declines
with age in all countries (except for the US), and 16 countries have coefficients that are significant-
ly below zero. The average decline is 0.107 standard deviations per decade, and only two countries
(Korea and the US) deviate significantly from the average. The average decline in the use of read-
ing for low-skilled workers is thus 0.321 standard deviations from age 35 to age 65.

13
The columns for the interaction term for literacy at work in Table 1 shows the coefficients to the
interaction term between age and the dummy for high-skilled workers, which are positive for 17
countries, and nine of these coefficients are significantly different from zero. The average coeffi-
cient is 0.070 standard deviations, implying that the use of reading at work amongst high-skilled
workers declines by the moderate amount of 0.037 (0.107-0.070) standard deviations per decade,
that is 0.111 standard deviations from age 35 to age 65. The decline in the use of reading at work
thus takes place primarily amongst low-skilled workers.
The average decline in the use of literacy at work is smaller than the average decline in literacy
scores. For low-skilled workers the decline in the use of literacy constitutes 83 per cent of the de-
cline in the literacy score (0.107/ 0.128), whilst the decline in the use of literacy for high-skilled
workers constitutes 18 per cent of the decline in literacy skills (0.037/ 0.204). The decline in litera-
cy skills over age is substantially stronger than the decline in the use of literacy.
Thus the analysis of literacy skills and the use of skills at work shows very little evidence for the
‘use it or lose it’ hypothesis. There is a pronounced decline in the use of literacy at work from age
35 for low-skilled workers and a smaller decline for high-skilled workers. However, literacy skills
declines substantially for both groups, and in most countries the decline for high-skilled workers is
larger than that for low-skilled workers. In many countries, high-skilled workers thus show a lower
decline in the use of literacy, but a larger decline in ability than low-skilled workers, a finding at
variance with the ‘use it or lose it’ hypothesis.
4. Numeracy and age
I next look at the numeracy, with respect to both ability and use at work. As in the previous section,
I present graphs for the scores for each country and the results of the regression analysis.
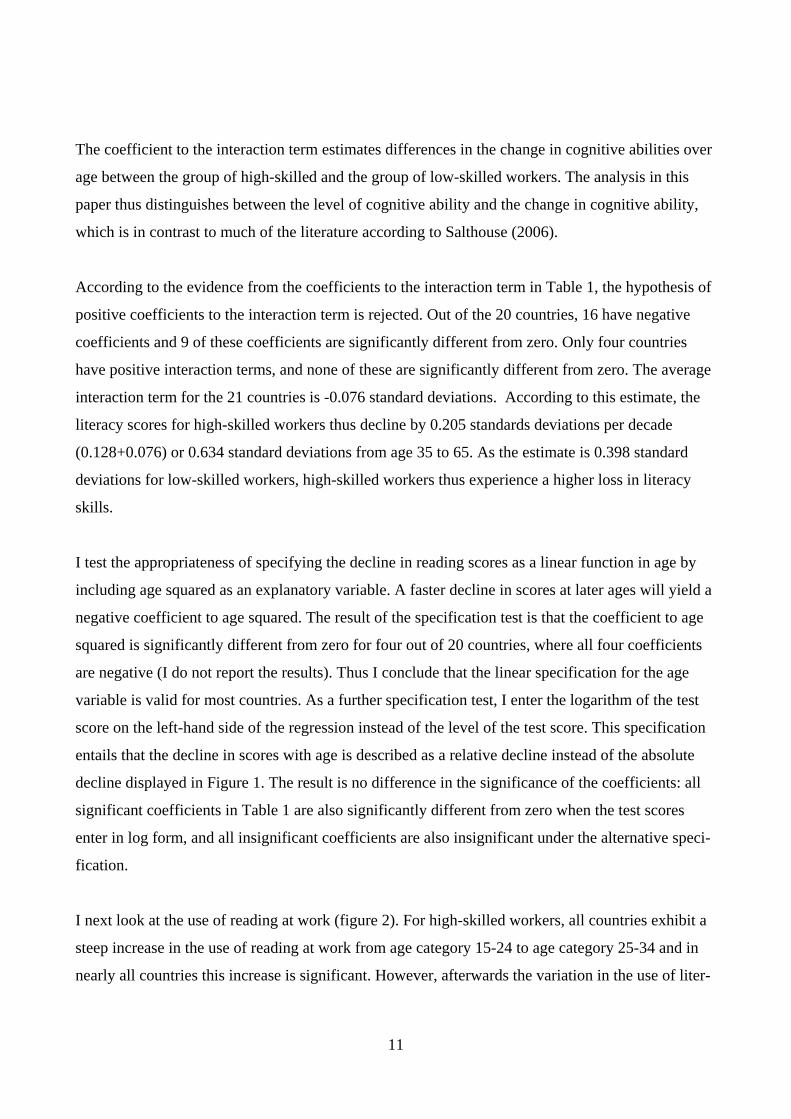
The scores for numeracy ability appear in Figure 3, which in many respects looks similar to Figure
1. In all countries, numeracy ability increases amongst high-skilled workers from age category 15-
24 to age category 25-34, and in all countries the decline in numeracy ability sets in at either age
category 25-34 or age category 35-44. The numeracy score of low-skilled workers decreases from
age category 35-44 in all countries, and in many countries the decrease begins before this age level.

14
[Figure 3 around here]
The numeracy score for high-skilled workers is above the country average in all countries except
for age category 55-65, which is close the average. With one exception (Korea, where the scores for
the two youngest age categories are above the average), low-skilled workers have numeracy scores
below the country averages in all countries for all age categories. Most of the scores are significant-
ly lower than the averages, and above age 45 all scores are significantly smaller than the average for
all countries.
[Table 2 around here]
Table 2 shows the results of the regression analysis. High-skilled workers have a significantly high-
er numeracy score than low-skilled workers in all countries but one (the Slovak Republic) with an
average difference of 0.430 standard deviations. The difference in numeracy scores is thus very
close to the average difference for the literacy score of 0.468 standard deviations.
The numeracy score for low-skilled workers declines with age in all countries. This decline is sig-
nificantly different from zero in 10 countries. The average decline in the numeracy score is 0.100
standard deviations per decade (0.309 standard deviations from age 35 to age 65), which also is
close to the decline in the literacy score of 0.128 standard deviations.
The interaction term between the dummy for high-skilled workers and age is negative for 15 coun-
tries and significantly different from zero for six of them. Of the five countries with positive inter-
action terms, only the one for Japan is significant. The average decline in numeracy skills average is
-0.047 standard deviations, which implies a skill loss for high-skilled workers of 0.147 standard
deviations per decade (0.455 standard deviations from age 35 to age 65). Except for Japan, the evi-
dence is that high-skilled workers lose numeracy skills at a faster pace than low-skilled workers.
The test of the validity of a linear decline in numeracy scores with age yields the result that the co-
efficient to age squared is significantly different from zero for three countries, where all three coef-
ficients are negative.

15
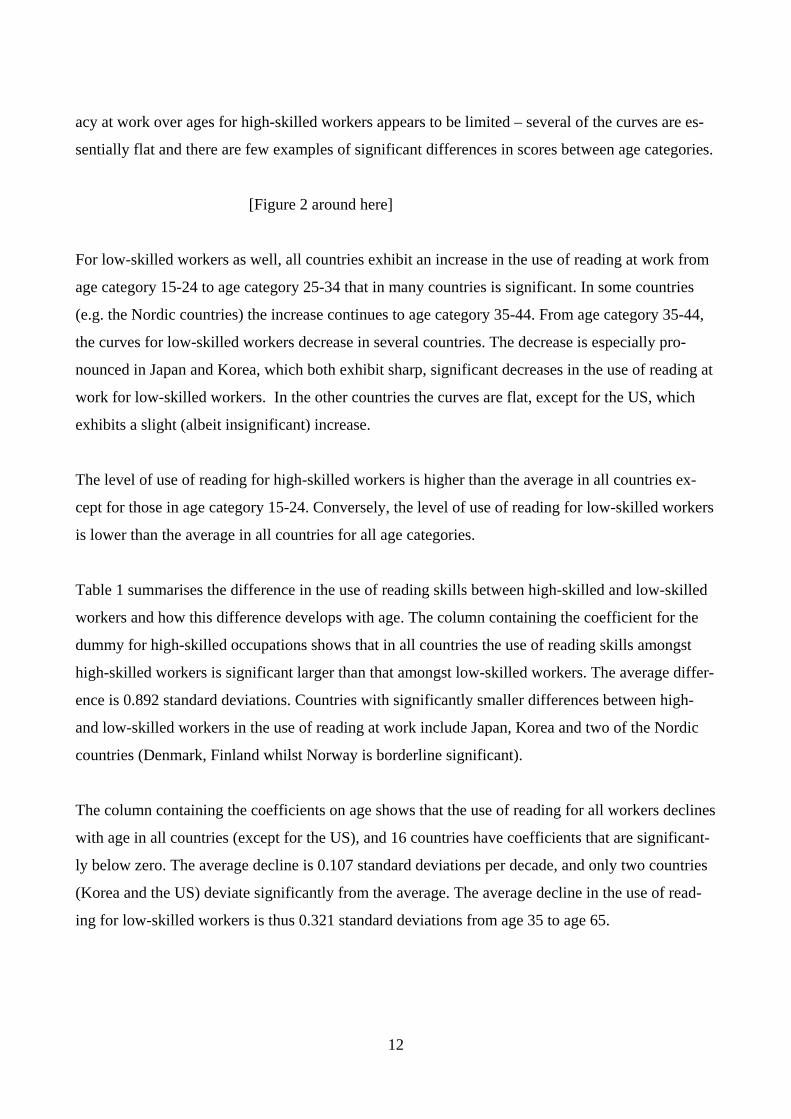
Figure 4 shows the use of numeracy at work for high- and low-skilled workers. The development of
the use of numeracy at work for high-skilled workers is comparable to the use of reading for the
younger age categories, where skills increase from age category 15-24 to either age category 25-34
or 35-44. From age category 35-44 the use of numeracy for high-skilled workers exhibits a decreas-
ing tendency in most countries. For low-skilled workers the decrease sets in from either age catego-
ry 25-34 or age category 35-44.
[Figure 4 around here]
Table 2 contains the regression analysis for use of numeracy at work. In all countries high-skilled
workers use numeracy at work significantly more than low-skilled workers. The average difference
in the use of numeracy at work is 0.786 standard deviations, which is smaller than the average dif-
ference in the use of literacy at work of 0.892 standard deviations.
For low-skilled workers the use of numeracy declines with age in all countries, and this decline is
significant in all countries except Italy and Spain. The average decline is 0.134 standard deviations
per decade (0.402 standard deviations from age 35 to age 65), slightly more than the decline in the
use of literacy.
The interaction term between the dummy for high-skilled workers and age gives mixed evidence for
differential development of the use of numeracy at work between low- and high-skilled workers.
The coefficient is positive for 11 countries and significant for four of them (Finland, Japan, Korea
and the US) but negative for 10 countries and significant for two of them (Italy and Spain). The
average coefficient to the interaction term is a moderate 0.010 standard deviations. The decline in
the use of numeracy for high-skilled workers is 0.124 standard deviations (0.134-0.010), corre-
sponding to a decline on 0.372 standard deviations from age 35 to age 65.
The average decline in the use of numeracy at work is smaller than the average decline in numeracy
scores. For low-skilled workers the average decline in the use of numeracy is higher than the aver-
age decline in the numeracy score (0.134 versus 0.100 standard deviations), whilst the decline in the
use of numeracy for high-skilled workers constitutes 84 per cent of the decline in numeracy skills
(0.124/ 0.147).

16
The ‘use it or lose it’ hypothesis gains little support from the analysis of numeracy skills and the use
of numeracy at work. In most countries the use of numeracy at work declines at about the same rate
for both high- and low-skilled workers from age 35. However, numeracy skills also decline for both
groups at approximately the same pace in many countries. Even though high-skilled workers use
numeracy skills at work substantially more than low-skilled workers, for most countries there is no
indication that high-skilled workers retain their numeracy skills to a higher degree than low-skilled
workers. The only exception is Japan, where high-skilled workers lose numeracy abilities at a sig-
nificantly slower pace than low-skilled workers.
5. Problem-solving and age
I next look at problem-solving, both the problem-solving score and the use of problem-solving at
work. Problem-solving score for high- and low-skilled workers by age categories appears in Figure
5. As three countries (France, Italy and Spain) decided not to participate in this part of the PIAAC
survey, the assessment of problem-solving is done for 18 countries.
[Figure 5 around here]
The problem-solving score is higher for high-skilled workers than for low-skilled workers in all age
categories and in most cases significantly higher. The main exception is age group 15-24, where the
difference is not significant in 10 countries.
In all countries the problem-solving score for high-skilled workers is higher than the average prob-
lem-solving score in the younger age categories and lower than the average in the older age catego-
ries. Low-skilled workers have problem-solving scores below the average in all countries from age
category 35-44, whilst younger age categories typically have scores on or above the average. For
high-skilled workers the decline begins in age category 25-34 with five exceptions where the de-
cline sets in from age category 15-24. For low-skilled workers the decline begins from age category
15-24, with three exceptions where the decline begins in age category 25-34.
Table 3 shows the results of the regression analysis of the problem-solving score. High-skilled
workers have a significantly higher score than low-skilled workers in all but two countries. The
17
average difference is 0.500 standard deviations, which is close to the difference for both the literacy
and the numeracy scores. Norway and Sweden are the two countries with the highest difference in
problem-solving scores between high- and low-skilled workers.
[Table 3 around here]
The problem-solving score for low-skilled workers decreases with age in all countries and the de-
crease is significant in all countries except the Czech Republic. The average decrease is 0.266
standard deviations per decade, amounting to a reduction in problem-solving ability of 0.824 stand-
ard deviations from age 35 to age 65. The decrease in the problem-solving score over age is thus
substantially larger than the reduction in either the literacy or the numeracy score.
The interaction term between the dummy for high-skilled workers and age is negative in all but two
countries and significantly different from zero in three, whilst none of the two positive coefficients
are significant. The average of -0.059 implies that high-skilled workers lose problem-solving abili-
ties in an amount of 0.325 standard deviations (0.266+0.059) per decade or 1.008 standard devia-
tions from age 35 to age 65. This amount of skills loss is thus substantially larger than the loss of
literacy ability or numeracy ability.
The use of problem-solving at work appears in Figure 6. High-skilled workers use problem-solving
significantly more at work than the average worker in all age categories except category 15-24,
where the use of problem-solving is close to the average in some countries (including all the Nordic
countries). Low-skilled workers use problem-solving significantly less than the average worker in
all age categories in all countries. A decline in the use of problem-solving at work typically begins
in age category 35-44 for both high-skilled and low-skilled workers.
[Figure 6 around here]
The regression results for the use of problem-solving at work appears in Table 3. In all countries
high-skilled workers use significantly more problem-solving at work than low-skilled workers. The
average difference is 1.272 standard deviations, which is substantially more than the difference in
the use of literacy and numeracy at work. The use of problem-solving for low-skilled workers de-

18
clines with age in all countries and is significant in all cases. The average decline is 0.130 standard
deviations per decade, amounting to 0.390 standard deviations from age 35 to age 65. The interac-
tion term is insignificantly different from zero in most countries. The average is a decline of 0.029
standard deviations per decade, implying a reduction of 0.155 standard deviations per decade in the
use of problem-solving at work for high-skilled workers, or 0.465 standard deviations, from age 35
to 65. The test for the validity of a linear decline in numeracy scores with age results in coefficients
to age squared that are significantly different from zero for only one country.
A considerable difference exists between the problem-solving scores and the use of problem-
solving compared to the scores and the use of literacy and numeracy. The difference between high-
skilled and low-skilled workers in both problem-solving scores and problem-solving use at work is
substantially larger those for literacy and numeracy. Furthermore, the decline with age in both
scores and the use of problem-solving is substantially larger than the decline of scores and use for
literacy and numeracy.
The average decline in the use of problem-solving at work is smaller than the average decline in
problem-solving scores. For low-skilled workers the decline in the use of problem-solving consti-
tutes 49 per cent of the decline in the problem-solving score (0.130/ 0.266), whilst the decline in the
use of problem-solving for high-skilled workers constitutes 47 per cent of the decline in problem-
solving skills (0.152/ 0.325). The decline in problem-solving skills over age is stronger than the
decline in the use of problem-solving.
One reason for the differences in decline with age between problem-solving on the one hand and
literacy and numeracy on the other, might be cohort effects. As younger cohorts have grown up
with ICT, they might thus be better to solve problems in relation to this technology. Furthermore,
younger cohorts might be more ready to use this type of technology at work.
Once again, the results for problem-solving are not favourable to the ‘use it or lose it’ hypothesis. In
most countries no significant difference appears in the decline in the use of problem-solving at work
between high-skilled and low-skilled workers. However, high-skilled workers lose their problem-
solving ability at about the same pace as low-skilled workers or even higher. In no country are high-
skilled workers significantly better able to retain their problem-solving abilities than low-skilled
19
workers. Despite a substantially more intensive use of problem-solving at work amongst high-
skilled workers, they are not better able to retain their problem-solving abilities than low-skilled
workers.
6. Discussion
This section first discusses two phenomena that might result in bias in the estimates of the relation
between cognitive skills and age from cross-sectional data such as that used in this paper. One is
cohort effects, and the other is retirement. Second, I discuss two other topics: the decline in the use
of skills over age, and the relation between age-earnings profiles and skill development over age.
The analyses have shown a more or less parallel decline in cognitive abilities for both high-skilled
and low-skilled workers. High-skilled workers do not retain more of their cognitive abilities than
low-skilled workers, despite their more intensive use of cognitive skills, a finding at variance with
the ‘use it or lose it’ hypothesis. Two issues are pertinent in relation to potential bias. One is the
possibility that despite the correlations that are present in the cross-sectional data, the decline in
cognitive ability over age is an artefact. The other issue is whether high-skilled workers might have
a slower decline in cognitive abilities over age than low-skilled workers despite the estimates to the
contrary obtained by means of the cross-sectional data.
The cohort effect arises when cohorts have different levels of cognitive skills at the same age. The
decline in cognitive ability over age, as shown through the cross-sectional data used in this paper,
could arise if younger cohorts have higher abilities that older cohorts.
Many studies actually show an increase in cognitive ability for younger cohorts, a phenomenon
named the ‘Flynn effect’ after the seminal contributions by Flynn (1984) and Flynn (1987). A typi-
cal estimate of the magnitude of the Flynn effect is an increase in cognitive abilities of 0.20 stand-
ard deviations per decade (Flynn (2000)). This figure is higher than the estimates of the decline in
cognitive abilities over age in this paper.6 Given the magnitude of the estimated Flynn effect is valid
for the countries analysed in this paper, I conclude that the higher measured cognitive abilities in
6 The regressions in this paper include education as an explanatory variable, and rising levels of education are a stand-ard explanation of the Flynn effect. Without education, the country averages of the coefficients to age are 0.19 for liter-acy and 0.16 for numeracy.
20
the younger ages are due to cohort effects, that the apparent decline in cognitive abilities over age is
an artefact, and that cognitive abilities consequently do not decrease with age.
However, no consensus exists about the magnitude of the Flynn effect. A few recent studies indi-
cate a cognitive stagnation or reversal of the Flynn effect, as younger cohorts born after 1970 do not
perform as well in tests as older cohorts (see Sundet et al. (2004) for Norway and Teasdale and
Owen (2005) for Denmark).
Furthermore, in the context of surveys of skills, Green and Riddell (2013) analyse data from the
International Adult Literacy Survey (IALS) and the International Adult Literacy and Life Skills
Survey (IALSS), which were carried out for Canada, US and Norway in 1994 and 2003, respective-
ly. Approximately 45 per cent of the items were identical across the surveys, implying that identify-
ing both age and cohort effect is possible. Green and Riddell (2013) first estimate the decline in
skills on the two cross-sections and then on the pooled data. As the younger cohorts have lower
levels of cognitive ability than the older ones, this result is at variance with the existence of a Flynn
effect. The estimates on the cross-sectional IALSS data underestimate the decline in cognitive abil-
ity over age.
The other phenomenon that might result in bias in the estimates of the relation between cognitive
abilities and age is retirement. In this paper I analyse employed workers in age categories both be-
fore and after the typical retirement age. Retirement can lead to either downward or upward bias in
the cross-sectional estimates of the effect of age on cognitive ability for employed workers. An up-
ward bias occurs if retirees have lower cognitive ability than workers, who continue in employment,
because e.g. low-ability workers have more difficulties staying employed than high-ability workers.
A downward bias occurs if retirees have higher cognitive ability than workers, who continue in em-
ployment, because e.g. retirement is contingent on a desired level of pension and high-ability work-
ers attain such a goal at a younger age than low-ability workers.
In principle, the decline in cognitive abilities with age for both high- and low-skilled workers as
obtained from the cross-sectional data in this paper, could be entirely due to retirement. Such would
be true if workers with high cognitive ability retire earlier than those with low cognitive ability
within both the group of high-skilled workers and that of low-skilled workers.

21
The ‘use it or lose it’ hypothesis could be valid despite the evidence in this paper. The hypothesis
could be valid if workers with high cognitive ability within the group of high-skilled workers retire
earlier than high-skilled workers with low cognitive ability, whilst there is no differential in retire-
ment behaviour between high- and low-ability workers within the group of low-skilled workers.
However, whilst the decline in cognitive ability for the two main occupational groups analysed in
this paper begins at about age 35, a significant amount of transitions to retirement first begins after
age 55. According to the sample statistics in Table A1, the average employment share in the sample
is 80 per cent for age category 35-44 and 79 per cent for age category 45-54. The substantial decline
in cognitive ability between ages 35 and 54 thus cannot be due to differential retirement patterns
amongst workers with high and low cognitive abilities. According to Table A1 a large number of
workers leave employment between age category 45-54 and age category 55-65. The employment
share decreases from 79 per cent to 51 per cent, corresponding to the retirement of about one third
of the employed. Measured cognitive abilities amongst the two thirds of the workers who remain
employed from age 45-54 to age 55-65 will thus be affected to the extent that the propensity to re-
tire differs between workers with different cognitive abilities.
The conclusion with respect to retirement and cognitive ability amongst employed workers is thus
that the substantial decline in cognitive abilities between age category 35-44 and age category 45-54
cannot be explained by retirement, as the employment ratio is the same in both age categories. In
contrast, measured cognitive ability amongst workers of 55-65 years of age may be influenced by
the considerable amount of retirement in this age category. However, I have reported specification
tests, which show that a linear decline in cognitive abilities with age cannot be rejected for most
countries. The decrease in scores for employed workers during the period of retirement from age
category 45-54 to age category 55-65 is thus of the same magnitude as the decrease in cognitive
abilities from age category 35-44 to age category 45-54, where retirement is limited.
This paper shows a considerable decline with age in the use of cognitive skills at work. There are
(at least) two possible explanations for this phenomenon. One is that older workers chose tasks at
work that do not have the same content of cognitive skills as younger workers. Employed workers
have reduced incentives for retaining skills as retirement approaches and may thus invest less in

22
activities that maintain cognitive abilities, a hyphothesis put forward by Rohwedder & Willis
(2010). Another explanation is that employers have a decreased propensity towards assigning older
workers tasks calling for the intensive use of cognitive skills, for example, because older workers
have fewer cognitive skills than younger workers.
This paper also shows that cognitive abilities for workers decline from about age 30 in most coun-
tries. However, wages are low at the beginning of the working life and continue to grow beyond age
30. Earnings profiles reach a maximum at an age (or labour market experience) much later than that
when cognitive skills reach a maximum. Age-earnings profiles typically show that a maximum is
reached after 25 years of experience in the labour market (e.g. Murphy & Welch (1990)). However,
returns to cognitive skills in the PIAAC data applied in this paper increases during the twenties but
is essentially constant from age 35 (Hanushek et al. (2015)). These observations raise the question
of why earnings continue to grow after the decline in cognitive abilities has begun, whilst returns to
these skills remain unchanged. One possible explanation is that other types of skills than those
measured in the PIAAC data are valued by employers.
The literature on cognitive abilities includes various categorizations, including the distinction be-
tween ‘fluid intelligence’, which is involved in abstract reasoning and problem-solving, and particu-
larly so with new content, and ‘crystallized intelligence’, which reflects conceptual and verbal
knowledge primary acquired through education and other systematic learning opportunities. Whilst
the level of fluid intelligence increases up to about 25 years of age, and declines thereafter, the level
of crystallized intelligence grows, or keeps stable, during most of the life-time.7 The age profile of
the PIAAC cognitive scores is similar to the age profile of fluid intelligence but not to the age pro-
file of crystallized intelligence, which is closer to age-earnings profiles. In addition to cognitive
skills, other types of skills may be valued by employers and contribute to the growth of earnings
over age (see e.g. Bowles et al. (2001) and Heckman et al. (2006) for a discussion of the importance
of non-cognitive skills for labour market outcome).
7 See, e.g., Gabrielsen et al. (2014) and the review of the literature on ageing and skills in Desjardins & Warnke (2012) for a treatment of these and other concepts of intelligence measurement in relation to ageing.

23
7. Conclusion
This paper analyses the amount of measured skills and the use of skills at work in 21 OECD coun-
tries. The skills contained in the analyses are literacy, numeracy, and problem-solving. The paper
looks at how both measured skills and the use of skills at work develop from age 35 to age 65 in
two aggregate categories of occupations: a group of high-skilled workers (ISCO major occupations
from 0 to 4) and a group of low-skilled workers (ISCO major occupations from 5 to 9).
When the level of education is taken into account, high-skilled workers have about 0.5 standard
deviations higher scores for both literacy and numerical skills than low-skilled workers. Both types
of skills decline with age by about 0.1 standard deviations per decade for both groups. The differ-
ence in the use of literacy and numeracy at work is about 0.8 standard deviations, and the decline in
the use of skills at work is also about 0.1 standard deviations per decade. These findings are re-
markably robust for the countries included in the analysis.
The paper investigates the conjecture that the deterioration of skills over age might be more pro-
nounced in occupations with a limited use of skills relative to occupations with more intensive use
of these skills – an implication of the ‘use it or lose it’ hypothesis. The analysis shows that skills for
both high- and low-skilled workers deteriorate at approximately the same pace over age. The evi-
dence in the present paper does not support the ‘use it or lose it’ hypothesis.
That investment in formal schooling at younger ages increases measured cognitive skills is well
established. However, this paper shows that more intensive use of cognitive skills at work does not
prevent a decline in cognitive skills with age.
24
Reference List
Bowles, S., Gintis, H., & Osborne, M. (2001). The determinants of earnings: A behavioral
approach. Journal of Economic Literature, 39, 1137-1176.
Desjardins, R. & Warnke, A. J. (2012). Ageing and skills. A review and analysis of skill
gain and skill loss over the lifespan and over time. Paris. OECD Education Working Papers No.72.
Edin, P. A. & Gustavsson, M. (2008). Time out of work and skill depreciation. Industrial &
Labor Relations Review, 61, 163-180.
Flynn, J. R. (1984). The Mean Iq of Americans - Massive Gains 1932 to 1978.
Psychological Bulletin, 95, 29-51.
Flynn, J. R. (1987). Massive Iq Gains in 14 Nations - What Iq Tests Really Measure.
Psychological Bulletin, 101, 171-191.
Flynn, J. R. (2000). IQ Trends over Time: Intelligence, Race, and Meritocracy. In K.Arrow,
S. Bowles, & S. Durlauf (Eds.), Meritocracy and Economic Inequality (pp. 35-60).
Gabrielsen, E., Lundetræ, K., Gusstafsson, J.-E., & Myrberg, M. (2014). Background. In
A.Malin (Ed.), Associations between age and cognitive foundation skills in the Nordic countries: A
closer look at the data (pp. 9-24). Jyväskylä: Finnish Institute for Educational Research, University
of Jyväskylä.
Green, D. A. & Riddell, W. C. (2013). Ageing and literacy skills: Evidence from Canada,
Norway and the United States. Labour Economics, 22, 16-29.

25
Hanushek, E. A. (1986). The Economics of Schooling - Production and Efficiency in Public-
Schools. Journal of Economic Literature, 24, 1141-1177.
Hanushek, E. A., Schwerdt, G., Wiederhold, S., & Woessmann, L. (2015). Returns to Skills
around the World: Evidence from PIAAC. European Economics Review, 73, 103-130.
Heckman, J. J., Stixrud, J., & Urzua, S. (2006). The effects of cognitive and noncognitive
abilities on labor market outcomes and social behavior. Journal of Labor Economics, 24, 411-482.
Murphy, K. M. & Welch, F. (1990). Empirical Age-Earnings Profiles. Journal of Labor
Economics, 8, 202-229.
OECD (2013a). OECD Skills Outlook 2013: First Results from the Survey of Adult Skills.
Paris: OECD.
OECD (2013b). Technical Report of the Survey of Adult Skills (PIAAC). Paris: OECD.
Rohwedder, S. & Willis, R. J. (2010). Mental Retirement. Journal of Economic
Perspectives, 24, 119-138.
Rosdahl, A. (2013). De beskæftigedes arbejdsopgaver og færdigheder. In A.Rosdahl, T.
Fridberg, V. Jakobsen, & M. Jørgensen (Eds.), Færdigheder i læsning, regning og problemløsning
med IT i Danmark (pp. 199-228). Copenhagen: SFI.
Salthouse, T. A. (2006). Mental Exercise and Mental Aging Evaluating the Validity of the
"Use It or Lose It" Hypothesis. Perspectives on Psychological Science, 1, 68-87.

26
Sundet, J. M., Barlaug, D. G., & Torjussen, T. M. (2004). The end of the Flynn effect? A
study of secular trends in mean intelligence test scores of Norwegian conscripts during half a
century. Intelligence, 32, 349-362.
Teasdale, T. W. & Owen, D. R. (2005). A long-term rise and recent decline in intelligence
test performance: The Flynn Effect in reverse. Personality and Individual Differences, 39, 837-843.
von Davier, M., Gonzales, E., & Mislevy, R. (2009). What are plausible values and why are
they useful? [Vol.2]. IERI Monograph Series: Issues and Methodologies in Large Scale
Assessments.
27
Figure 1. Literacy scores in main occupations and ages
Age groups
Sco
re
-1.0
-0.5
0.0
0.5
Austria
-24 25-34 35-44 45-54 55-
Belgium Canada
-24 25-34 35-44 45-54 55-
Czech Rep. Denmark
Estonia Finland France Germany
-1.0
-0.5
0.0
0.5
Ireland
-1.0
-0.5
0.0
0.5
Italy Japan Korea Netherlands Norway
Poland Slovak Rep. Spain Sweden
-1.0
-0.5
0.0
0.5
England
-1.0
-0.5
0.0
0.5
-24 25-34 35-44 45-54 55-
USA
ISCO 5-9 ISCO 0-4
28
Figure 2. Use of reading at work in main occupations and ages
Age groups
Sco
re
-1.0
-0.5
0.0
0.5
1.0Austria
-24 25-34 35-44 45-54 55-
Belgium Canada
-24 25-34 35-44 45-54 55-
Czech Rep. Denmark
Estonia Finland France Germany
-1.0
-0.5
0.0
0.5
1.0Ireland
-1.0
-0.5
0.0
0.5
1.0Italy Japan Korea Netherlands Norway
Poland Slovak Rep. Spain Sweden
-1.0
-0.5
0.0
0.5
1.0England
-1.0
-0.5
0.0
0.5
1.0
-24 25-34 35-44 45-54 55-
USA
ISCO 5-9 ISCO 0-4

29
Figure 3. Numeracy scores in main occupations and ages
Age groups
Sco
re
-1.0
-0.5
0.0
0.5
Austria
-24 25-34 35-44 45-54 55-
Belgium Canada
-24 25-34 35-44 45-54 55-
Czech Rep. Denmark
Estonia Finland France Germany
-1.0
-0.5
0.0
0.5
Ireland
-1.0
-0.5
0.0
0.5
Italy Japan Korea Netherlands Norway
Poland Slovak Rep. Spain Sweden
-1.0
-0.5
0.0
0.5
England
-1.0
-0.5
0.0
0.5
-24 25-34 35-44 45-54 55-
USA
ISCO 5-9 ISCO 0-4

30
Figure 4. Use of numeracy at work in main occupations and ages
Age groups
Sco
re
-0.5
0.0
0.5
1.0Austria
-24 25-34 35-44 45-54 55-
Belgium Canada
-24 25-34 35-44 45-54 55-
Czech Rep. Denmark
Estonia Finland France Germany
-0.5
0.0
0.5
1.0Ireland
-0.5
0.0
0.5
1.0Italy Japan Korea Netherlands Norway
Poland Slovak Rep. Spain Sweden
-0.5
0.0
0.5
1.0England
-0.5
0.0
0.5
1.0
-24 25-34 35-44 45-54 55-
USA
ISCO 5-9 ISCO 0-4

31
Figure 5. Problem solving scores in main occupations and ages
Age groups
Sco
re
-1.5
-1.0
-0.5
0.0
0.5
1.0Austria
-24 25-34 35-44 45-54 55-
Belgium Canada
-24 25-34 35-44 45-54 55-
Czech Rep. Denmark
Estonia Finland Germany Ireland
-1.5
-1.0
-0.5
0.0
0.5
1.0
Japan
-1.5
-1.0
-0.5
0.0
0.5
1.0
Korea Netherlands Norway Poland Slovak Rep.
-24 25-34 35-44 45-54 55-
Sweden England
-24 25-34 35-44 45-54 55-
-1.5
-1.0
-0.5
0.0
0.5
1.0
USA
ISCO 5-9 ISCO 0-4

32
Figure 6. Use of problem solving in main occupations and ages
Age groups
Sco
re
-1.0
-0.5
0.0
0.5
1.0
Austria
-24 25-34 35-44 45-54 55-
Belgium Canada
-24 25-34 35-44 45-54 55-
Czech Rep. Denmark
Estonia Finland France Germany
-1.0
-0.5
0.0
0.5
1.0
Ireland
-1.0
-0.5
0.0
0.5
1.0
Italy Japan Korea Netherlands Norway
Poland Slovak Rep. Spain Sweden
-1.0
-0.5
0.0
0.5
1.0
England
-1.0
-0.5
0.0
0.5
1.0
-24 25-34 35-44 45-54 55-
USA
ISCO 5-9 ISCO 0-4

0
Table A1. Sample statistics
Number of Occupation group, Employment share, Education, observations Share Age category Age category
ISCO 0‐4 ISCO 5‐9 16‐24 25‐34 35‐44 45‐54 55‐65 16‐24 25‐34 35‐44 45‐54 55‐65 Austria 3,667 0.573 0.427 0.597 0.813 0.852 0.823 0.379 10.5 12.5 12.4 12.0 11.4 Belgium 3,311 0.597 0.403 0.295 0.838 0.838 0.814 0.408 11.1 13.4 13.2 12.6 11.4 Canada 19,168 0.593 0.407 0.608 0.820 0.847 0.830 0.612 11.5 13.9 14.0 13.4 13.0 Czech Rep. 3,622 0.520 0.480 0.305 0.770 0.860 0.854 0.404 11.3 13.8 13.4 13.1 12.8 Denmark 5,298 0.586 0.414 0.549 0.778 0.853 0.840 0.575 10.3 13.5 13.3 12.6 12.4 Estonia 5,331 0.514 0.486 0.440 0.833 0.852 0.811 0.570 11.0 12.6 12.3 12.4 11.9 Finland 3,869 0.534 0.467 0.407 0.798 0.874 0.842 0.567 10.5 13.3 13.4 12.7 11.4 France 4,471 0.538 0.462 0.318 0.762 0.794 0.795 0.428 11.0 12.5 12.0 10.9 9.7 Germany 4,015 0.539 0.461 0.530 0.794 0.810 0.853 0.611 Ireland 3,638 0.552 0.448 0.373 0.721 0.671 0.672 0.494 13.9 15.8 15.1 14.1 12.7 Italy 2,841 0.513 0.487 0.215 0.674 0.729 0.677 0.334 9.9 12.6 11.1 10.1 8.7 Japan 3,844 0.509 0.491 0.496 0.762 0.783 0.825 0.625 11.5 13.7 13.5 13.4 12.4 Korea 4,354 0.447 0.553 0.302 0.721 0.793 0.792 0.574 11.4 14.5 13.9 12.3 10.1 Netherlands 3,899 0.646 0.354 0.657 0.836 0.841 0.815 0.528 11.7 14.1 13.7 13.3 12.7 Norway 3,491 0.568 0.432 0.564 0.741 0.786 0.720 0.579 12.0 14.7 14.8 14.2 13.9 Poland 5,052 0.419 0.581 0.343 0.767 0.797 0.706 0.377 11.2 14.0 13.1 12.4 11.3 Slovak Rep. 3,285 0.487 0.513 0.257 0.706 0.785 0.778 0.426 11.6 13.8 13.5 13.1 12.5 Spain 3,312 0.477 0.523 0.259 0.678 0.696 0.650 0.386 10.8 12.4 12.0 11.2 9.7 Sweden 3,312 0.572 0.428 0.425 0.785 0.867 0.872 0.665 10.6 12.7 12.7 12.4 11.7 England 5,791 0.565 0.435 0.495 0.771 0.794 0.797 0.534 12.4 13.5 13.3 12.9 12.8 USA 3,525 0.571 0.429 0.547 0.773 0.765 0.765 0.610 11.3 13.8 13.8 13.5 13.6 Total 99,096 0.546 0.454 0.428 0.769 0.804 0.787 0.509 11.3 13.5 13.2 12.6 11.8
Notes: The number of observations is the number of employed workers with registered occupational status. ISCO 1‐4 and ISCO 5‐9 is major occupational groups 1 to 4 and 5 to 9. Education is the number of years of schooling. Sample weights are applied to calculate the shares and the number of years of educa‐tion. Source: PIAAC.

1
Table 1. Regression coefficients for literacy skills and use of literacy at work for workers of age 35 to 65 in 21 OECD countries Literacy skills Use of literacy at work
Occupation Age/10 Interaction Education Occupation Age/10 Interaction Coeff. Std.err. Coeff. Std.err. Coeff. Std.err. Coeff. Std.err. Coeff. Std.err. Coeff. Std.err. Coeff. Std.err. Austria 0.793 0.089 ‐0.078 0.046 ‐0.187 0.056 0.104 0.008 0.893 0.076 ‐0.096 0.042 0.103 0.050 Belgium 0.626 0.084 ‐0.057 0.052 ‐0.167 0.060 0.146 0.008 0.982 0.078 ‐0.068 0.053 0.043 0.056 Canada 0.579 0.079 ‐0.064 0.034 ‐0.061 0.044 0.130 0.007 0.712 0.060 ‐0.116 0.035 0.082 0.041 Czech Rep. 0.243 0.119 ‐0.156 0.059 0.018 0.095 0.125 0.016 0.926 0.084 ‐0.104 0.044 0.137 0.049 Denmark 0.527 0.075 ‐0.191 0.037 ‐0.059 0.042 0.122 0.008 0.661 0.072 ‐0.064 0.029 0.089 0.036 Estonia 0.397 0.067 ‐0.076 0.028 ‐0.138 0.042 0.109 0.008 1.215 0.048 ‐0.128 0.024 0.026 0.032 Finland 0.520 0.093 ‐0.204 0.049 ‐0.115 0.054 0.089 0.009 0.750 0.065 ‐0.097 0.036 0.097 0.042 France 0.342 0.064 ‐0.156 0.029 ‐0.002 0.043 0.119 0.005 0.751 0.053 ‐0.126 0.033 0.108 0.038 Germany 0.939 0.087 ‐0.114 0.041 0.084 0.056 Ireland 0.542 0.095 0.001 0.048 ‐0.168 0.058 0.114 0.009 0.754 0.071 ‐0.174 0.043 0.070 0.051 Italy 0.498 0.095 ‐0.016 0.054 ‐0.172 0.066 0.080 0.008 1.241 0.071 ‐0.024 0.034 ‐0.056 0.054 Japan 0.149 0.079 ‐0.340 0.034 0.068 0.046 0.151 0.010 0.719 0.071 ‐0.136 0.032 0.140 0.045 Korea 0.368 0.065 ‐0.142 0.032 ‐0.102 0.047 0.122 0.007 0.619 0.055 ‐0.368 0.023 0.320 0.039 Netherlands 0.547 0.091 ‐0.239 0.051 ‐0.046 0.057 0.145 0.008 0.878 0.076 ‐0.169 0.040 0.104 0.050 Norway 0.793 0.086 ‐0.123 0.044 ‐0.150 0.049 0.098 0.009 0.727 0.084 ‐0.106 0.047 0.026 0.059 Poland 0.398 0.100 ‐0.020 0.044 ‐0.058 0.066 0.119 0.011 1.301 0.079 ‐0.033 0.042 ‐0.051 0.056 Slovak Rep. 0.117 0.095 ‐0.204 0.047 0.018 0.059 0.105 0.011 1.096 0.075 ‐0.121 0.031 0.081 0.049 Spain 0.314 0.080 ‐0.229 0.042 0.007 0.057 0.113 0.006 1.135 0.063 ‐0.070 0.033 ‐0.014 0.048 Sweden 0.733 0.100 ‐0.079 0.044 ‐0.167 0.056 0.128 0.011 0.975 0.074 ‐0.013 0.039 ‐0.040 0.045 England 0.461 0.109 ‐0.103 0.052 ‐0.003 0.066 0.103 0.011 0.667 0.060 ‐0.137 0.041 0.084 0.049 USA 0.425 0.106 ‐0.094 0.050 ‐0.036 0.060 0.168 0.010 0.783 0.078 0.015 0.046 0.034 0.053 Average 0.468 0.089 ‐0.128 0.044 ‐0.076 0.056 0.119 0.009 0.892 0.071 ‐0.107 0.037 0.070 0.048 Std.dev. 0.188 0.087 0.079 0.022 0.206 0.078 0.082 Notes: Figures in bold denotes significance at 5 per cent level. Occupation is a dummy variable taking the value one if the worker belongs to major occupational groups 0‐4 and zero for major occupational groups 5‐9. Interaction is the interaction between occupation and age divided by 10. The indices for skills and use of skills are normalized by dividing by the country specific standard deviations. Education is the number of years of schooling.

2
Table 2. Regression coefficients for numeracy skills and use of numeracy at work for workers of age 35 to 65 in 21 OECD countries Numeracy skills Use of numeracy at work
Occupation Age/10 Interaction Education Occupation Age/10 Interaction Coeff. Std.err. Coeff. Std.err. Coeff. Std.err. Coeff. Std.err. Coeff. Std.err. Coeff. Std.err. Coeff. Std.err. Austria 0.682 0.093 ‐0.057 0.046 ‐0.130 0.056 0.116 0.009 0.807 0.080 ‐0.094 0.039 ‐0.017 0.052 Belgium 0.573 0.086 ‐0.059 0.055 ‐0.150 0.061 0.146 0.010 0.799 0.067 ‐0.162 0.042 0.020 0.050 Canada 0.460 0.067 ‐0.072 0.033 ‐0.029 0.041 0.136 0.007 0.742 0.058 ‐0.102 0.031 0.011 0.035 Czech Rep. 0.262 0.117 ‐0.116 0.059 0.052 0.087 0.147 0.015 0.745 0.082 ‐0.135 0.049 0.086 0.052 Denmark 0.423 0.079 ‐0.127 0.034 ‐0.039 0.045 0.126 0.008 0.583 0.068 ‐0.146 0.026 0.024 0.037 Estonia 0.413 0.062 ‐0.068 0.031 ‐0.102 0.040 0.124 0.008 0.951 0.055 ‐0.166 0.022 ‐0.018 0.032 Finland 0.496 0.094 ‐0.148 0.041 ‐0.077 0.052 0.093 0.009 0.475 0.084 ‐0.165 0.043 0.137 0.052 France 0.894 0.050 ‐0.118 0.025 ‐0.048 0.032 Germany 0.394 0.056 ‐0.133 0.030 ‐0.001 0.037 0.134 0.005 0.835 0.091 ‐0.115 0.032 ‐0.001 0.050 Ireland 0.479 0.087 ‐0.009 0.049 ‐0.123 0.058 0.112 0.009 0.728 0.074 ‐0.179 0.034 ‐0.037 0.048 Italy 0.485 0.093 ‐0.045 0.048 ‐0.110 0.064 0.073 0.008 1.067 0.084 ‐0.013 0.039 ‐0.223 0.063 Japan 0.166 0.075 ‐0.214 0.033 0.116 0.045 0.164 0.009 0.563 0.069 ‐0.222 0.026 0.154 0.039 Korea 0.306 0.065 ‐0.145 0.040 ‐0.051 0.051 0.133 0.007 0.515 0.065 ‐0.323 0.024 0.153 0.041 Netherlands 0.503 0.096 ‐0.160 0.057 ‐0.035 0.061 0.146 0.009 0.843 0.073 ‐0.175 0.037 ‐0.022 0.046 Norway 0.782 0.084 ‐0.037 0.048 ‐0.168 0.055 0.111 0.010 0.778 0.084 ‐0.093 0.035 0.036 0.053 Poland 0.297 0.089 ‐0.002 0.043 ‐0.037 0.061 0.122 0.012 0.883 0.085 ‐0.081 0.037 0.005 0.055 Slovak Rep. 0.171 0.098 ‐0.169 0.043 0.038 0.058 0.125 0.011 0.880 0.084 ‐0.166 0.033 0.077 0.054 Spain 0.282 0.081 ‐0.225 0.040 0.027 0.055 0.114 0.007 1.003 0.073 ‐0.031 0.034 ‐0.169 0.050 Sweden 0.658 0.107 ‐0.033 0.049 ‐0.115 0.058 0.128 0.010 0.898 0.066 ‐0.065 0.031 ‐0.034 0.042 England 0.402 0.097 ‐0.090 0.048 0.021 0.063 0.103 0.012 0.912 0.082 ‐0.110 0.032 ‐0.026 0.050 USA 0.358 0.107 ‐0.082 0.046 ‐0.033 0.058 0.176 0.010 0.603 0.072 ‐0.150 0.036 0.101 0.044 Average 0.430 0.087 ‐0.100 0.044 ‐0.047 0.055 0.126 0.009 0.786 0.074 ‐0.134 0.034 0.010 0.047 Std.dev. 0.163 0.064 0.075 0.023 0.161 0.067 0.093 Notes: Figures in bold denotes significance at 5 per cent level. Occupation is a dummy variable taking the value one if the worker belongs to major occupational groups 0‐4 and zero for major occupational groups 5‐9. Interaction is the interaction between occupation and age divided by 10. The indices for skills and use of skills are normalized by dividing by the country specific standard deviations. Education is the number of years of schooling.

3
Table 3. Regression coefficients for problem‐solving skills and use of problem‐solving at work for workers of age 35 to 65 in 18 OECD countries Problem‐solving skills Use of problem‐solving at work
Occupation Age/10 Interaction Education Occupation Age/10 Interaction Coeff. Std.err. Coeff. Std.err. Coeff. Std.err. Coeff. Std.err. Coeff. Std.err. Coeff. Std.err. Coeff. Std.err. Austria 0.669 0.104 ‐0.211 0.071 ‐0.152 0.078 0.071 0.012 1.312 0.073 ‐0.092 0.035 ‐0.050 0.050 Belgium 0.599 0.093 ‐0.254 0.056 ‐0.139 0.065 0.116 0.008 1.306 0.073 ‐0.125 0.044 0.001 0.050 Canada 0.501 0.083 ‐0.246 0.044 ‐0.004 0.050 0.095 0.007 1.203 0.055 ‐0.155 0.029 0.018 0.032 Czech Rep. 0.462 0.157 ‐0.164 0.098 ‐0.010 0.116 0.089 0.016 1.368 0.084 ‐0.078 0.038 ‐0.006 0.047 Denmark 0.573 0.084 ‐0.337 0.041 ‐0.057 0.048 0.098 0.010 1.085 0.064 ‐0.112 0.027 0.020 0.036 Estonia 0.641 0.072 ‐0.214 0.038 ‐0.200 0.044 0.082 0.010 1.563 0.039 ‐0.101 0.018 ‐0.114 0.024 Finland 0.572 0.096 ‐0.403 0.045 ‐0.087 0.051 0.077 0.011 1.179 0.065 ‐0.157 0.036 0.050 0.039 Germany 1.260 0.070 ‐0.121 0.030 ‐0.008 0.042 Ireland 0.399 0.102 ‐0.170 0.081 ‐0.085 0.079 0.136 0.013 1.240 0.066 ‐0.216 0.025 ‐0.058 0.041 Japan 0.229 0.106 ‐0.507 0.061 0.088 0.072 0.115 0.013 1.086 0.054 ‐0.172 0.024 0.010 0.036 Korea 0.358 0.088 ‐0.303 0.057 ‐0.061 0.073 0.097 0.013 1.060 0.050 ‐0.321 0.020 0.037 0.038 Netherlands 0.653 0.103 ‐0.244 0.056 ‐0.114 0.065 0.124 0.009 1.254 0.069 ‐0.139 0.040 ‐0.012 0.044 Norway 0.677 0.078 ‐0.333 0.046 ‐0.055 0.049 0.105 0.012 1.196 0.065 ‐0.105 0.039 0.014 0.044 Poland 0.258 0.157 ‐0.270 0.097 0.036 0.128 0.085 0.021 1.528 0.065 ‐0.046 0.023 ‐0.173 0.043 Slovak Rep. 0.209 0.131 ‐0.179 0.076 ‐0.032 0.093 0.096 0.016 1.393 0.062 ‐0.096 0.025 ‐0.070 0.042 Sweden 0.763 0.107 ‐0.265 0.046 ‐0.136 0.059 0.113 0.012 1.357 0.065 ‐0.094 0.034 ‐0.041 0.038 England 0.504 0.108 ‐0.227 0.054 0.009 0.065 0.096 0.011 1.277 0.060 ‐0.135 0.034 ‐0.010 0.038 USA 0.432 0.148 ‐0.191 0.077 ‐0.009 0.092 0.134 0.014 1.238 0.065 ‐0.082 0.036 0.004 0.039 Average 0.500 0.107 ‐0.266 0.061 ‐0.059 0.072 0.102 0.012 1.272 0.064 ‐0.130 0.031 ‐0.022 0.040 Std.dev. 0.167 0.090 0.075 0.019 0.137 0.062 0.055 Notes: Figures in bold denotes significance at 5 per cent level. Occupation is a dummy variable taking the value one if the worker belongs to major occupational groups 0‐4 and zero for major occupational groups 5‐9. Interaction is the interaction between occupation and age divided by 10. The indices for skills and use of skills are normalized by dividing by the country specific standard deviations. Education is the number of years of schooling.