Embed Size (px)
Citation preview

Medora Corporation
A Systems Approach to Freshwater
Management: Waterbody Treatments
US Environmental Protection Agency Webinar
May 14, 2014
H. Kenneth Hudnell, PhD
• Medora Corp., VP & Director of Science; Consultant
• The University of North Carolina at Chapel Hill - Department of
Environmental Sciences and Engineering, Adjunct Associate Professor
• US Environmental Protection Agency, Neurotoxicologist, 1984-2007
• Phone: 252-288-6870 Email: [email protected]

OverviewThe Clean Water Act
• Calls for Watershed and Waterbody Management
A Systems Approach to Freshwater Management
• Uses Most Cost-Effective Watershed & Waterbody Tools
• Quicker, Less Expensive Water Quality Improvement
Waterbody Management Technologies
• Suppress Cyanobacteria
• Remove or Inactivate Nutrients
Will Jordan Lake, NC, become the 1st Large, Eutrophic
Waterbody to attain Water Quality Standards?

The Clean Water Act
Watershed Management Program - reduce nutrient input
* Point sources, Implemented NPDES - now 5-10% nutrient input
• 1972-1986: $49B Title II grants• 1987: Replaced Title II with Title VI CW State Revolving Fund
• 1987-2012: $36B to capitalize CWSRF loan program• Jurisdiction & locality spending is approximately $63B annually
* Non-point sources, Implemented BMPs - now 90-95% input• 1987-2012: $3.2B Section 319 grants, $200M/yr since 1999
• Almost all spent on BMP implementation• 1989-2012: $650M CWSRF used for BMP implementation• Jurisdiction & locality spending is $??B annually

The Clean Water Act
Clean Lakes Program- treat impaired waterbodies
* Waterbody mangement - Not Currently implemented
• 1972-1995: $145M Section 314 grants, none since• Reauthorized in 2000, but no appropriation requests• 2000: Encourage use of 5% Section 319 grant funds for
Waterbody Management• 2002: Focused Section 319 funding on Nonpoint source
BMP implementation
Safe Drinking Water Act, some source water protection funding
HABHRCA - The Harmful Algal Bloom and Hypoxia Research andControl Act• Research grant funds for NOAA and coastal HABs, but not for
EPA and all freshwater
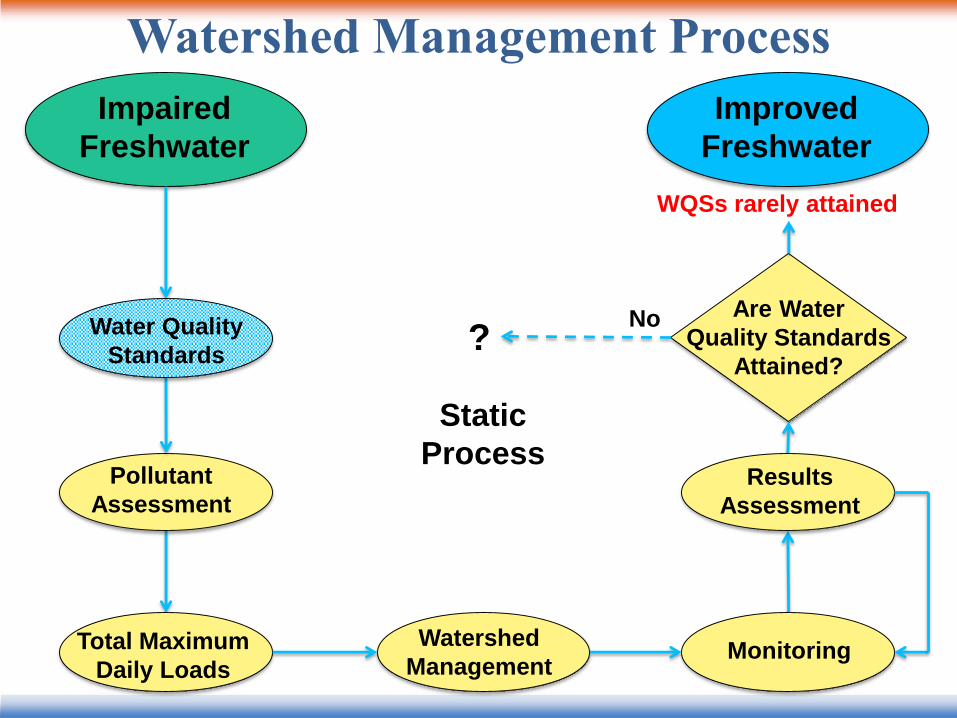
Watershed Management Process
Static
ProcessPollutant
Assessment
Water Quality
Standards
No
Watershed
ManagementMonitoringTotal Maximum
Daily Loads
Are Water
Quality Standards
Attained?
Improved
Freshwater
Impaired
Freshwater
?
WQSs rarely attained
Results
Assessment

Watershed Management Results 44% of river & stream miles, & 64% of lake & reservoir
acres are Impaired (CWA Section 303(d))
• EPA estimate - 7.9% pre-2003 impaired now attain WQSs
• Most small & point source dominated
Eutrophication - 1972: 10-20% US lakes & reservoirs
- 2007: approximately 50%
Cyanotoxin health risks - 2007: 27-41% moderate to high
Rivers & streams with excessive phosphorus - 2004 = 47%,
2008-2009 = 66%, primarily agricultural sources
EPA data, OW, 10 regions - No impaired reservoir > 1,000 ac
& > 90% input from nonpoint sources ever attained WQSs
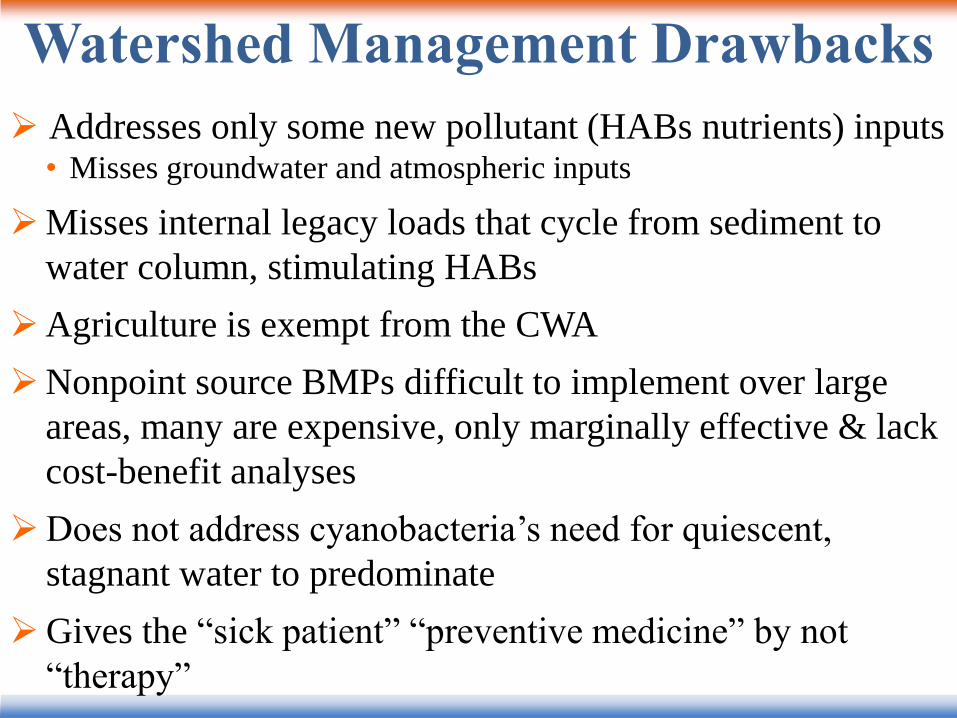
Watershed Management Drawbacks
Addresses only some new pollutant (HABs nutrients) inputs• Misses groundwater and atmospheric inputs
Misses internal legacy loads that cycle from sediment to
water column, stimulating HABs
Agriculture is exempt from the CWA
Nonpoint source BMPs difficult to implement over large
areas, many are expensive, only marginally effective & lack
cost-benefit analyses
Does not address cyanobacteria’s need for quiescent,
stagnant water to predominate
Gives the “sick patient” “preventive medicine” by not
“therapy”

Watershed Management Alone is Not
Preventing HABs
Watershed Management
HAB
Occurrence
• TMDLs, Nutrient Management Strategies
Point
Sources
• NPDESNonpoint
Sources
• BMPs Potential
Drinking Water
Exposure
Recreational Exposure
Residential
Exposure
Relatively
Ineffective
Expensive
No Therapy
when Ill
Effective
Diminishing
Returns
Preventive
Medicine
Only

Systems Approach Process
Watershed
& Waterbody
ManagementMonitoring
Dynamic
Process
Improved
Freshwater
Yes
Action Options
Cost-Benefit
Desired Future
Condition
Is Desired
Condition
Attainable?
Scientific
Analyses
No
Impaired
Freshwater
Yes
No Is Desired
Condition
Attained?
Results
Assessment
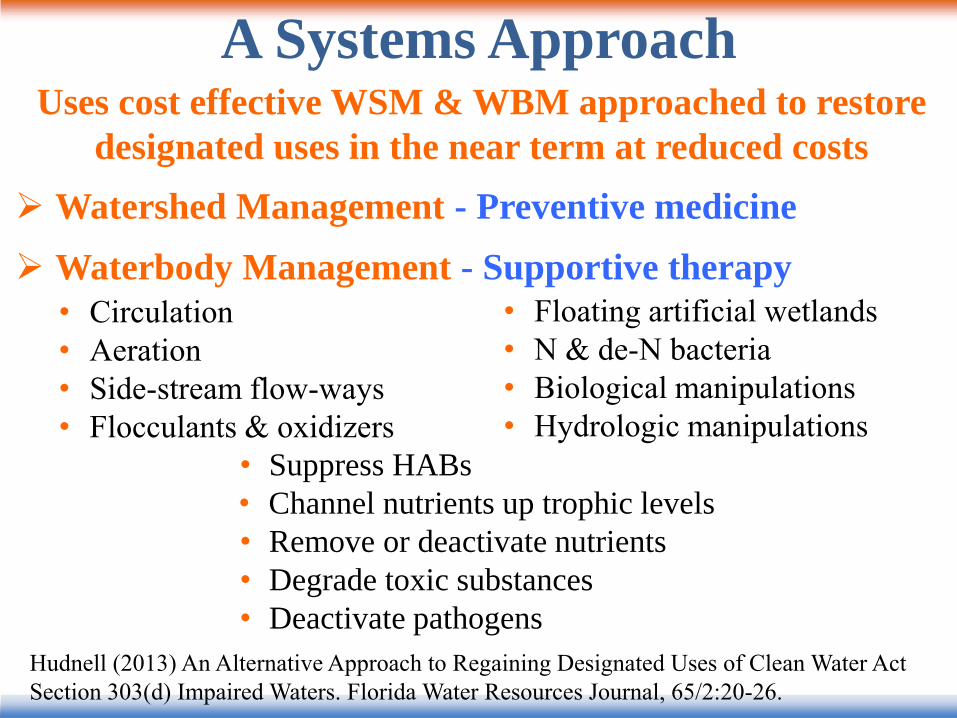
A Systems Approach
Hudnell (2013) An Alternative Approach to Regaining Designated Uses of Clean Water Act
Section 303(d) Impaired Waters. Florida Water Resources Journal, 65/2:20-26.
Watershed Management - Preventive medicine
Waterbody Management - Supportive therapy
• Floating artificial wetlands
• N & de-N bacteria
• Biological manipulations
• Hydrologic manipulations
• Circulation
• Aeration
• Side-stream flow-ways
• Flocculants & oxidizers
• Suppress HABs
• Channel nutrients up trophic levels
• Remove or deactivate nutrients
• Degrade toxic substances
• Deactivate pathogens
Uses cost effective WSM & WBM approached to restore
designated uses in the near term at reduced costs
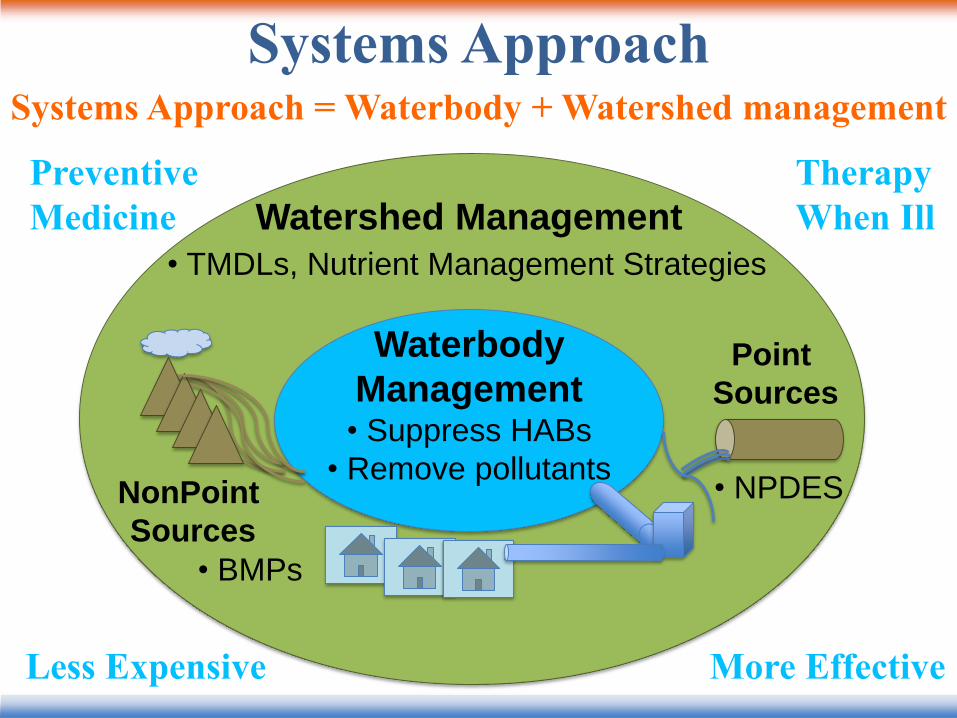
Systems ApproachSystems Approach = Waterbody + Watershed management
Watershed Management
Waterbody
Management• Suppress HABs
• Remove pollutants
• TMDLs, Nutrient Management Strategies
Point
Sources
• NPDESNonPoint
Sources
• BMPs
More Effective
Therapy
When Ill
Less Expensive
Preventive
Medicine

Waterbody Management Technologies
Before
During
Solar-powered, long-distance circulation
HAB control in
300+ U.S., 350+ worldwide, waterbodies
24/7 operation,
radial, near-laminar
inflow
10K gal/min upflow

Solar-Powered Long-Distance CirculationHudnell et al.
(2010)
Freshwater
harmful algal
bloom (HAB)
suppression with
solar-powered
circulation
(SPC). Harmful
Algae, 9, 208-
217
HAB
suppression in
3 source water
reservoirs
Increased densities of: Green algae
Diatoms
Zooplankton35 acres/unit
treatment area

Waterbody Management TechnologiesHAB Suppression: Oxidizers, Peroxygen
Jeff Morgan
www.peroxygensolutions.com
336-272-0127EPA registered
An Environmentally Safe Algaecide
• White, granular, free flowing, non-dusting
• Active ingredient: hydrogen peroxide (H2O2)
• Inert Ingredient: Soda ash
2 Na2CO3 • 3 H2O2
2 Na2CO3 + 3 H2O2
Penetrates cyanobacteria membrane and kills cell
Degrades2 H2O2 2 H2O + O2
• Effective dosing rate dependent on:
•Water Quality•Metals Concentration•Turbidity•Organic Content
•Species•Stage of Algae Growth•Density of Algae•Light Intensity•Water Temperature

HAB Suppression: Oxidizers, Peroxygen
California Department of Water Resources - Dyer Reservoir Study
Cyanobacteria cells/mL
During the spring of 2012, Dyer Reservoir developed a cyanobacterial bloom
of Aphanizomenon flos-aquae and Anabaena flos-aquae. This bloom adversely
affected the water utility by clogging the intake filters of the pumping station.

Waterbody Management TechnologiesHAB Suppression: Ultrasound
Kirk Whatley
www.sonicsolutionsllc.com
866-562-5423
24volts DC
Grid or Solar
0.2 to 0.7 amps
Blue-Green Algae - Ruptures Gas vesicles
Green Algae - Vibration breaks bond
between cell wall and inside of cell
Bef
ore
Aft
er
Bef
ore
Aft
er
Submerge transducer • 2 feet minimum depth
• Above first thermocline
• “Line of Sight” device
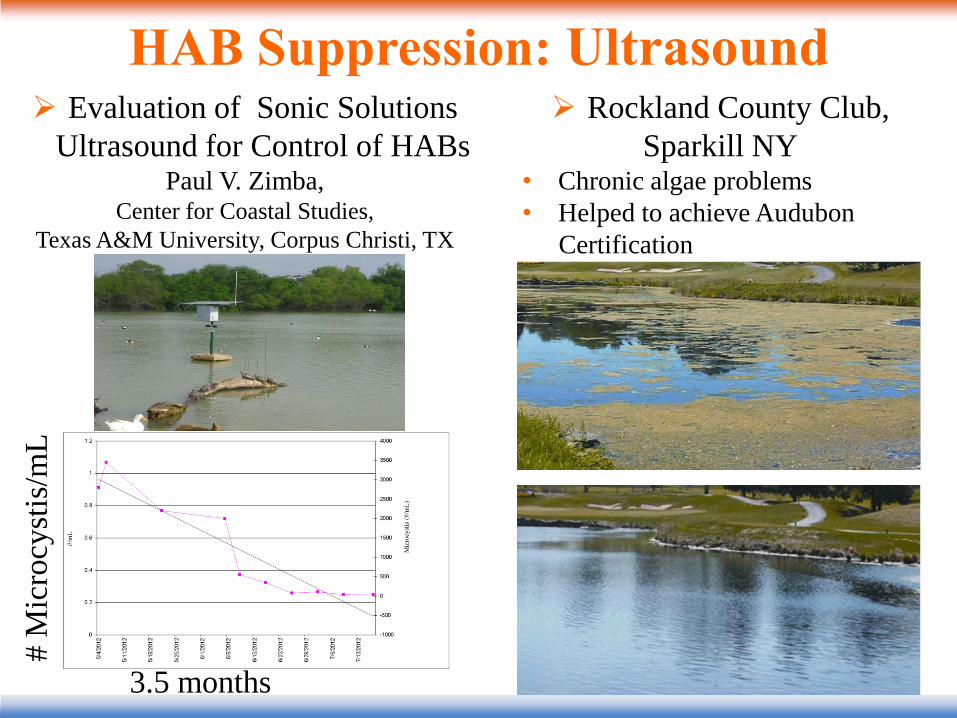
HAB Suppression: Ultrasound Evaluation of Sonic Solutions
Ultrasound for Control of HABsPaul V. Zimba,
Center for Coastal Studies,
Texas A&M University, Corpus Christi, TX
# M
icro
cyst
is/m
L
Rockland County Club,
Sparkill NY• Chronic algae problems
• Helped to achieve Audubon
Certification
3.5 months

Waterbody Management TechnologiesNutrient Reduction: Flocculants, Anionic Polyacrylamide
Applied Polymer Systems, Inc
Seva Iwinski
386-428-8578
>150,000 chained monomers/molecule
EPA registered
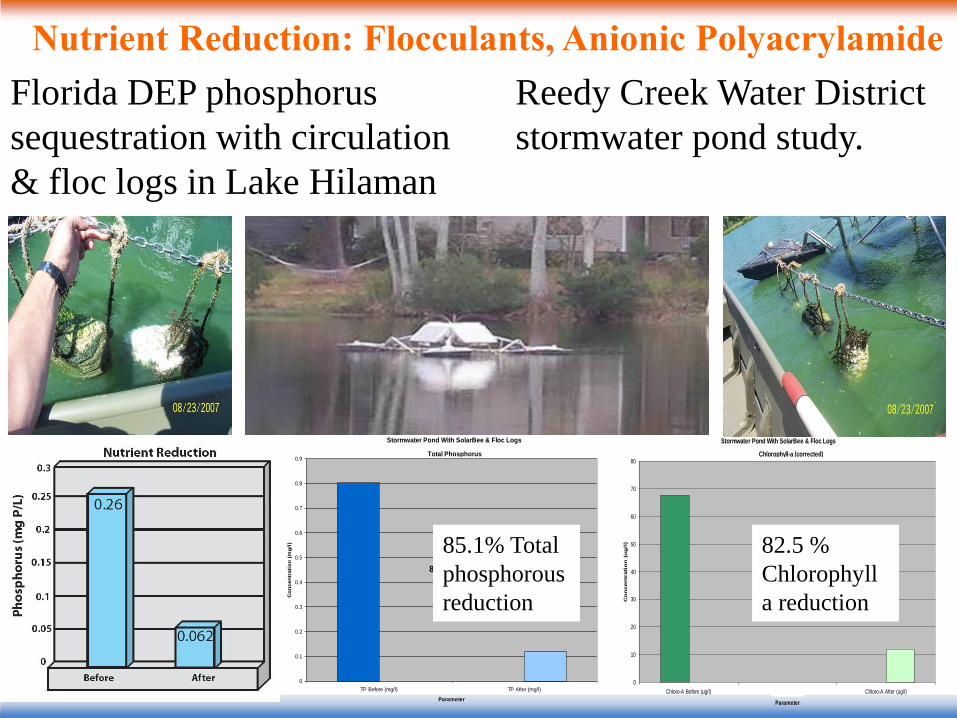
Nutrient Reduction: Flocculants, Anionic Polyacrylamide
Florida DEP phosphorus
sequestration with circulation
& floc logs in Lake Hilaman
Reedy Creek Water District
stormwater pond study.
Stormwater Pond With SolarBee & Floc Logs
0
10
20
30
40
50
60
70
80
Chloro-A Before (ug/l) Chloro-A After Chloro-A After (ug/l)
Parameter
Co
ncen
trati
on
(u
g/l
)
Chlorophyll-a (corrected)
82.5% Reduction
Stormwater Pond With SolarBee & Floc Logs
0
0.1
0.2
0.3
0.4
0.5
0.6
0.7
0.8
0.9
TP Before (mg/l) TP After (mg/l)
Parameter
Co
ncen
trati
on
(m
g/l
)
Total Phosphorus
85.1 % Reduction
85.1% Total
phosphorous
reduction
82.5 %
Chlorophyll
a reduction

Waterbody Management Technologies
Steve Beeman
www.beemats.com
386-428-8578
Floating Lettuce Garden
• Mats ½”
pva foam
• 2.5 plant
holes/ft2
Nutrient Reduction: Floating Artificial Wetlands: Beemats

Input0.07mg/L
Input0.49mg/L
Input0.70mg/L
Input0.76mg/L
Input1.02mg/L
Input1.31mg/L
Input1.34mg/L
Input3.00mg/L
Input4.86mg/L
Input6.77mg/L
Clemson 08 14.67
UCF 13.28
Patrick 45.4
Lake Leon 9.9
Mulloch Creek 39.91
Deep Creek 261
Deer Creek 165.55
Clemson 10 52.2
D.O.T. 74.78
Beeman's 125
0
50
100
150
200
250
300
Load
Re
du
ctio
n g
/m2
/yr
Nitrogen - Biomasss Uptake Rates
Input0.02mg/L
Input0.03mg/L
Input0.06mg/L
Input0.07mg/L
Input0.15mg/L
Input0.21mg/L
Input0.22mg/L
Input0.22mg/L
Input0.42mg/L
Input0.53mg/L
UCF 0.54
Mulloch 2.54
Lake Leon 0.54
Clemson 08 0.94
Patrick 25
Deer Creek 4.7
D.O.T. 3.62
Clemson 10 4.5
Beeman's 8
Deep Creek 19.31
0
5
10
15
20
25
30
Load
Re
du
ctio
n g
/m2
/yr
Phosphorus - Biomass Uptake Rates
Nutrient Reduction: Floating Artificial Wetlands: Beemats

Waterbody Management TechnologiesNutrient Reduction: Bacteria, MicrobeLift
Ecological
Laboratories, Inc.Doug Dent
www.microbelift.com
215-208-0815
Clean Room Pressurized
Fermentation area
Photosynthesis
growth process
• 29 Species
12 Genius
(including purple
sulfur eating
bacteria)
• Vegetative
cultures
adapt to variety
of environments
Multistage fermentation process: Aerobic,
facultative, anaerobic, photosynthetic bacteria
• Enhance organic matter, sludge digestion
• Enhance ammonia conversion to nitrate
• Enhance nitrate conversion to nitrogen gas
• Enhance H2S conversion to sulfate
• Compete with algae for nutrients
Bioaugmentation

Nutrient Reduction: Bacteria, MicrobeLift
Biochemical Oxygen Demand
Total Nitrogen
Total Phosphorus
Turbidity
Xiba River, China, Study

Waterbody Management TechnologiesNutrient Reduction: Flow-way, Algal Turf Scrubber
Mark Zivojnovich
http://www.hydromentia.com/35
2-804-5126
• A culture unit for native attached algae
• The algae remove nitrogen and phosphorus and add dissolved
oxygen to source water
• The algae is regularly recovered and processed
• Recovery of algal biomass maintains the culture units in an
accelerated growth phase
• Optimally, nutrients are continuously recovered and removed
from the treatment unit
What is an Algal Turf Scrubber®?

Nutrient Reduction: Flow-way, Algal Turf Scrubber
0
200
400
600
800
1,000
1,200
0.3% 0.5% 1.0% 2.0% 3.0% 4.0% 5.0% 6.0% 7.0%
Tissue Nutrient Concentration
Are
al
Rem
oval
Rate
(g
/m2-y
r)
0
2,000
4,000
6,000
8,000
10,000
12,000
Are
al
Rem
oval
Rate
(lb
s/a
re-y
r)
10 dry-g/m2-yr
20-dry-g/m2-yr
30-dry-g/m2-yr
40-dry-g/m2-yr
50-dry-g/m2-yr
Figure 1. Nutrient Areal Removal Rates Based on Algal
Productivity (dry-g/m2-yr) and Tissue Nutrient
Concentrations.
Nitrogen
Removal
Phosphorus
Removal
Removal Rates Affected by:
• Nutrient concentrations in water
• Temperature
• Sunlight
• Available carbon (alkalinity)

Will Jordan Lake Become the 1st Large,
Eutrophic Waterbody to Attain Water Quality Stds?
Jordan Lake Watershed

Jordan LakeHistory
• 13,940 ac reservoir completed in 1982 to provide flood control and designated uses – drinking source water, wildlife habitat, recreation
• Algal impairment predicted due to high nutrients & low flow rate
Water Quality
• Harmful algal blooms (HABs) cause impairments: chlorophyll-a exceedances of state standard (40 μg/L), high pH, and turbidity
NCDENR TMDL & Nutrient Strategy Rules
• 9 rules to reduce nutrient input (8 nonpoint-, 1 point-source)
• Estimated cost of up to $2 billion
2013 NC Legislation
• Suspends 8 unimplemented rules for 3 years
• Budgets demonstration project in Jordan Lake to stop HABs
• Committee oversee systems approach plan development

Jordan Lake
Cyanobacterial Harmful Algal Bloom
Phosphorus Chlorophyll-a Phycocyanin
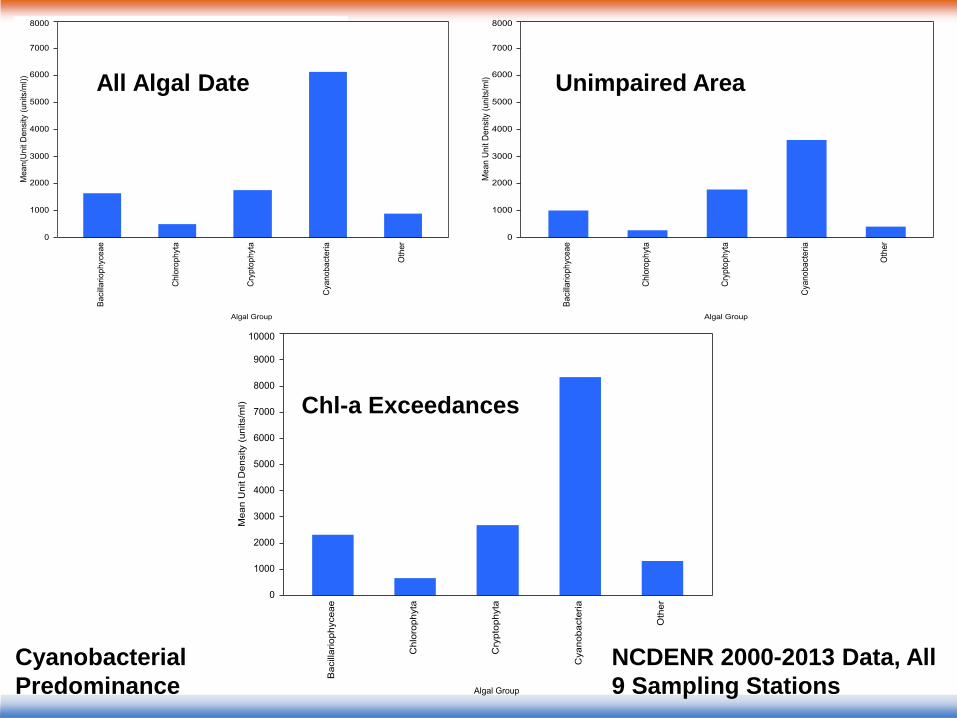
All Algal Date
Chl-a Exceedances
Unimpaired Area
NCDENR 2000-2013 Data, All
9 Sampling Stations
Cyanobacterial
Predominance
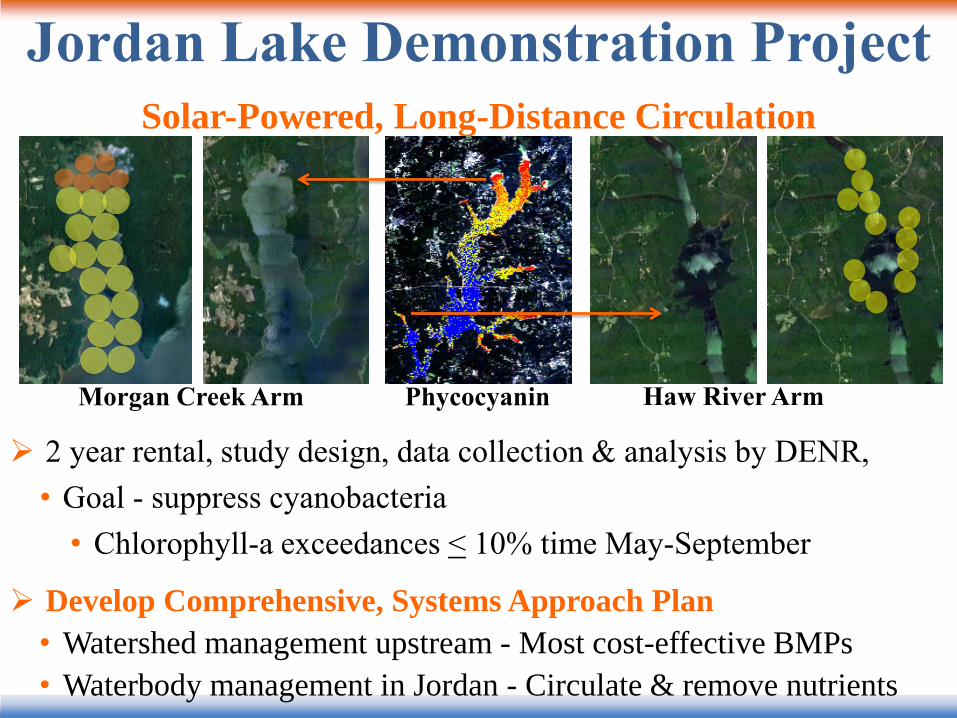
Jordan Lake Demonstration Project
Solar-Powered, Long-Distance Circulation
2 year rental, study design, data collection & analysis by DENR,
• Goal - suppress cyanobacteria
• Chlorophyll-a exceedances < 10% time May-September
Develop Comprehensive, Systems Approach Plan
• Watershed management upstream - Most cost-effective BMPs
• Waterbody management in Jordan - Circulate & remove nutrients
Morgan Creek Arm Haw River ArmPhycocyanin

Jordan Lake
Phycocyanin
Suppress
Cyanobacteria
& Channel
Nutrients Up
Trophic
Levels
Waterbody
Treatments• Whole Lake
Protection
with ~155
Circulation
Units

Phosphorus
Jordan Lake
Suppress
Cyanobacteria
&
Remove
Nutrients
Waterbody
Treatments• Circulation
• Flocculants
• Bacteria
• Floating
Artificial
Wetlands
• Side-stream
Flow Ways

Jordan Lake & Watershed
Management
Watershed
& Waterbody
ManagementMonitoring
A Dynamic Systems
Approach Can Enable
Jordan Lake to Attain
Water Quality Standards in
the Near Term at a Reduced
Overall Cost
Improved
Freshwater
Reservoir
Yes
Action Options
Cost-Benefit
Desired Future
Condition
Is Desired
Condition
Attainable?
Scientific
Analyses
No
Impaired
Freshwater
ReservoirYes
No Is Desired
Condition
Attained?
Results
Assessment

January 2011
Before Heading Home, Thank You!
Questions?
Ken Hudnell 252-288-6870 [email protected]
Medora Corporation