Embed Size (px)
Citation preview
Portland State University Portland State University
PDXScholar PDXScholar
TREC Friday Seminar Series Transportation Research and Education Center (TREC)
5-25-2018
A Survey of Ride-Hailing Passengers A Survey of Ride-Hailing Passengers
Steven Gehrke Boston Metropolitan Area Planning Council
Follow this and additional works at: https://pdxscholar.library.pdx.edu/trec_seminar
Part of the Transportation Commons, Transportation Engineering Commons, Urban Studies
Commons, and the Urban Studies and Planning Commons
Let us know how access to this document benefits you.
Recommended Citation Recommended Citation Gehrke, Steven, "A Survey of Ride-Hailing Passengers" (2018). TREC Friday Seminar Series. 152. https://pdxscholar.library.pdx.edu/trec_seminar/152
This Book is brought to you for free and open access. It has been accepted for inclusion in TREC Friday Seminar Series by an authorized administrator of PDXScholar. Please contact us if we can make this document more accessible: [email protected].

Friday Transportation Seminar … 05.25.2018
Steven R. Gehrke, PhDSenior Research AnalystMetropolitan Area Planning Council
A Survey of Ride-Hailing Passengers
2Introduction … Fare Choices … Share of Choices … Conclusion
Presentation Outline
• Introduction• Agency overview• Ride-hailing research context
• Ride-hailing in Metro Boston• Survey design and administration• Findings and main themes from Fare Choices report
• Ride-hailing in Massachusetts• Legislatively-mandated data and methods• Findings from Share of Choices brief
• Conclusions• What have we learned from this work?• What are the next steps for research?
3Introduction … Fare Choices … Share of Choices … Conclusion
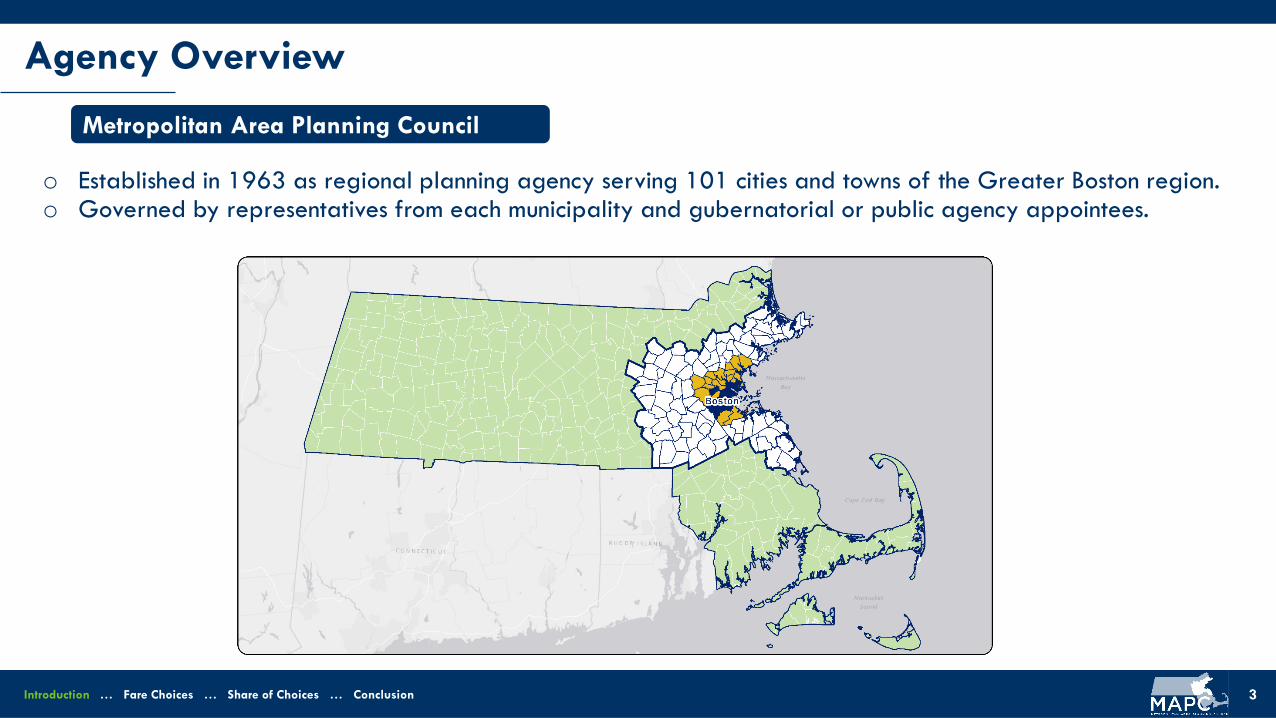
Agency Overview
o Established in 1963 as regional planning agency serving 101 cities and towns of the Greater Boston region.o Governed by representatives from each municipality and gubernatorial or public agency appointees.
Metropolitan Area Planning Council
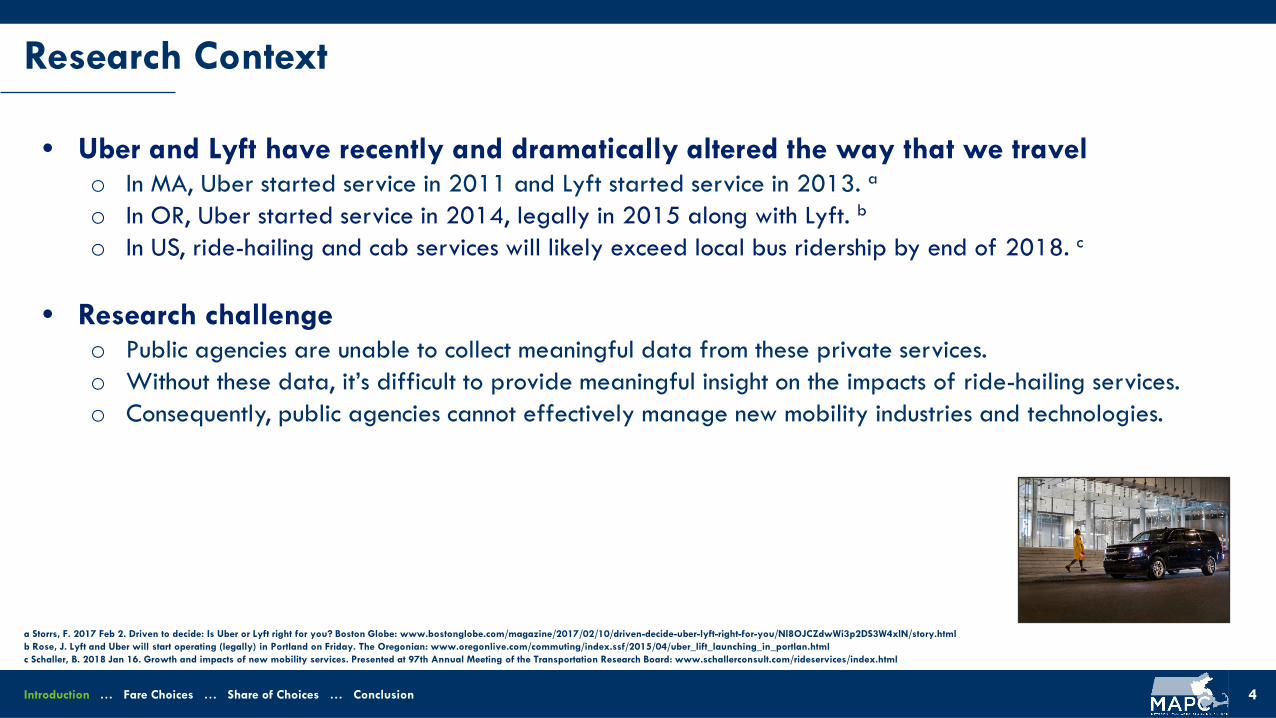
• Uber and Lyft have recently and dramatically altered the way that we travelo In MA, Uber started service in 2011 and Lyft started service in 2013. a
o In OR, Uber started service in 2014, legally in 2015 along with Lyft. b
o In US, ride-hailing and cab services will likely exceed local bus ridership by end of 2018. c
• Research challengeo Public agencies are unable to collect meaningful data from these private services.o Without these data, it’s difficult to provide meaningful insight on the impacts of ride-hailing services.o Consequently, public agencies cannot effectively manage new mobility industries and technologies.
4Introduction … Fare Choices … Share of Choices … Conclusion
Research Context
a Storrs, F. 2017 Feb 2. Driven to decide: Is Uber or Lyft right for you? Boston Globe: www.bostonglobe.com/magazine/2017/02/10/driven-decide-uber-lyft-right-for-you/Nl8OJCZdwWi3p2DS3W4xlN/story.htmlb Rose, J. Lyft and Uber will start operating (legally) in Portland on Friday. The Oregonian: www.oregonlive.com/commuting/index.ssf/2015/04/uber_lift_launching_in_portlan.htmlc Schaller, B. 2018 Jan 16. Growth and impacts of new mobility services. Presented at 97th Annual Meeting of the Transportation Research Board: www.schallerconsult.com/rideservices/index.html
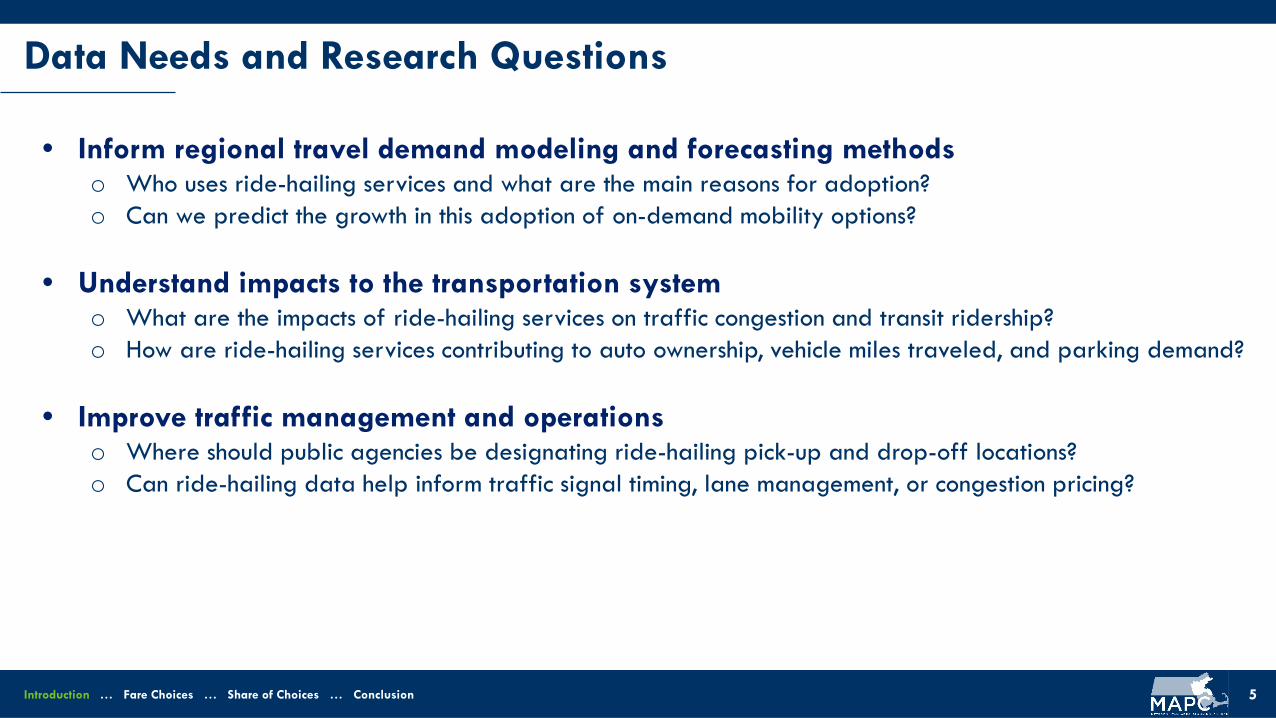
• Inform regional travel demand modeling and forecasting methodso Who uses ride-hailing services and what are the main reasons for adoption?o Can we predict the growth in this adoption of on-demand mobility options?
• Understand impacts to the transportation systemo What are the impacts of ride-hailing services on traffic congestion and transit ridership?o How are ride-hailing services contributing to auto ownership, vehicle miles traveled, and parking demand?
• Improve traffic management and operationso Where should public agencies be designating ride-hailing pick-up and drop-off locations? o Can ride-hailing data help inform traffic signal timing, lane management, or congestion pricing?
5Introduction … Fare Choices … Share of Choices … Conclusion
Data Needs and Research Questions

• Strategy 1: Inquire ride-hailing companies directly ………………………...........
• Strategy 2: Inquire ride-hailing drivers directly …………………………….........
• Strategy 3: Acquire trip-level data from a driver reporting app …………..........
• Strategy 4: Acquire ‘big data’ source from Northeastern University ……………
• Strategy 5: Collect ride-hailing passenger survey ……………………………....
• Strategy 6: Utilize legislatively-mandated data reporting ………………….......
6Introduction … Fare Choices … Share of Choices … Conclusion
Data Collection Efforts
?
x
x
x
Fare Choices Reportwww.mapc.org/farechoices
AuthorsSteven R. GehrkeAlison FelixTimothy Reardon
Additional ContributorsJessie Partridge GuerreroEric Bourassa
7Introduction … Fare Choices … Share of Choices … Conclusion
Ride-Hailing in Metro Boston

• Study objectiveso To better describe regional ride-hailing passengers and trips.o To examine if services are substituting travel by more sustainable and affordable modes.
• Understand ride-hailing impacts on regional equity goalso Do ride-hailing services provide a viable mobility option to areas underserved by rapid transit?o Is this new shared mobility option exacerbating or improving economic inequities?
8Introduction … Fare Choices … Share of Choices … Conclusion
Report Overview
• In Fall 2017, MAPC recruited and trained 10 drivers to ask passengers if they would take a tablet-based survey during their ride-hailing trip
• Survey instrument recorded passenger responses pertaining to:o Passenger sociodemographic and economic characteristics.o General travel patterns and mobility options.o Specific ride-hailing trip context.
• Nearly 1,000 responses collected over four-week period
9Introduction … Fare Choices … Share of Choices … Conclusion
Survey Administration
10Introduction … Fare Choices … Share of Choices … Conclusion
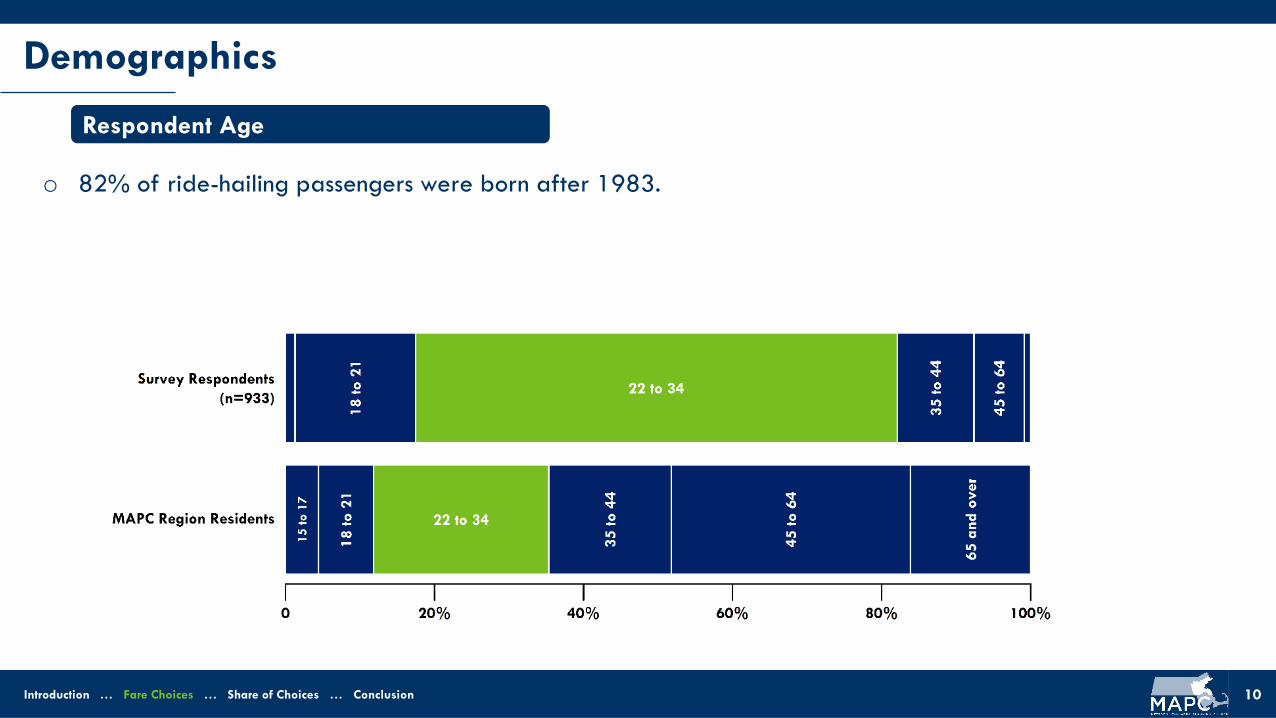
Respondent Age
Demographics
o 82% of ride-hailing passengers were born after 1983.
11Introduction … Fare Choices … Share of Choices … Conclusion
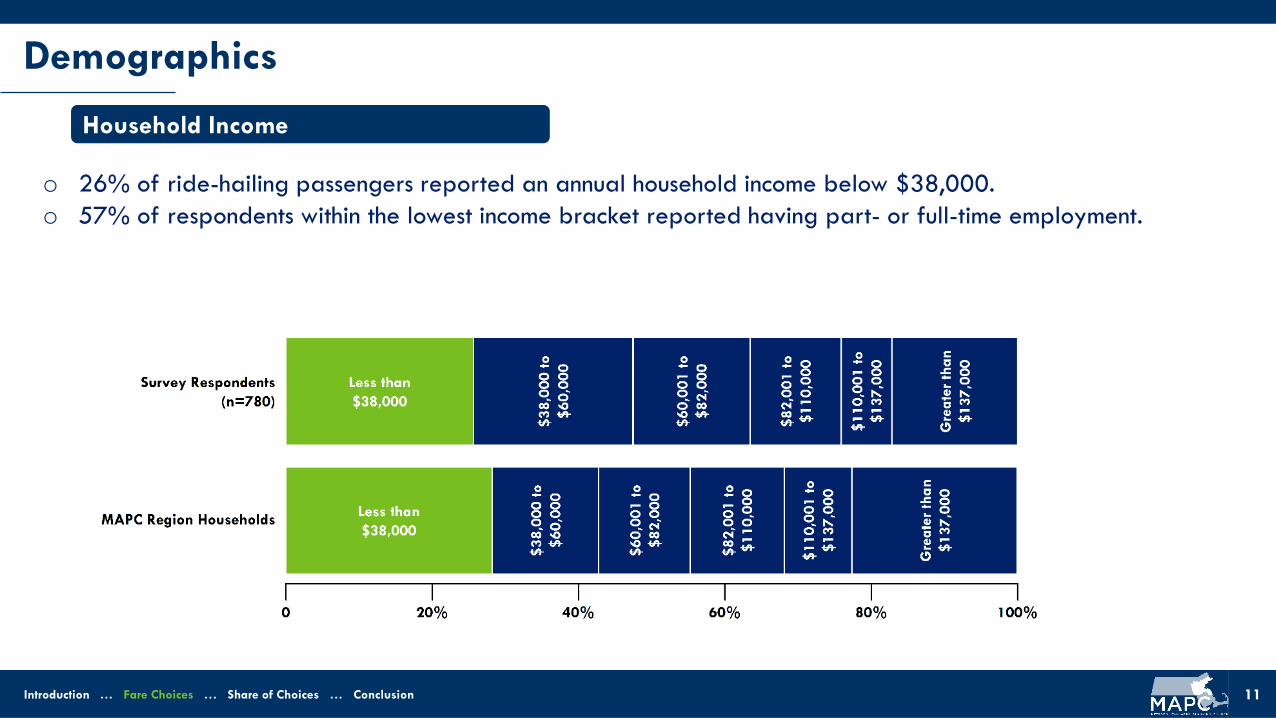
Household Income
Demographics
o 26% of ride-hailing passengers reported an annual household income below $38,000.o 57% of respondents within the lowest income bracket reported having part- or full-time employment.
12Introduction … Fare Choices … Share of Choices … Conclusion
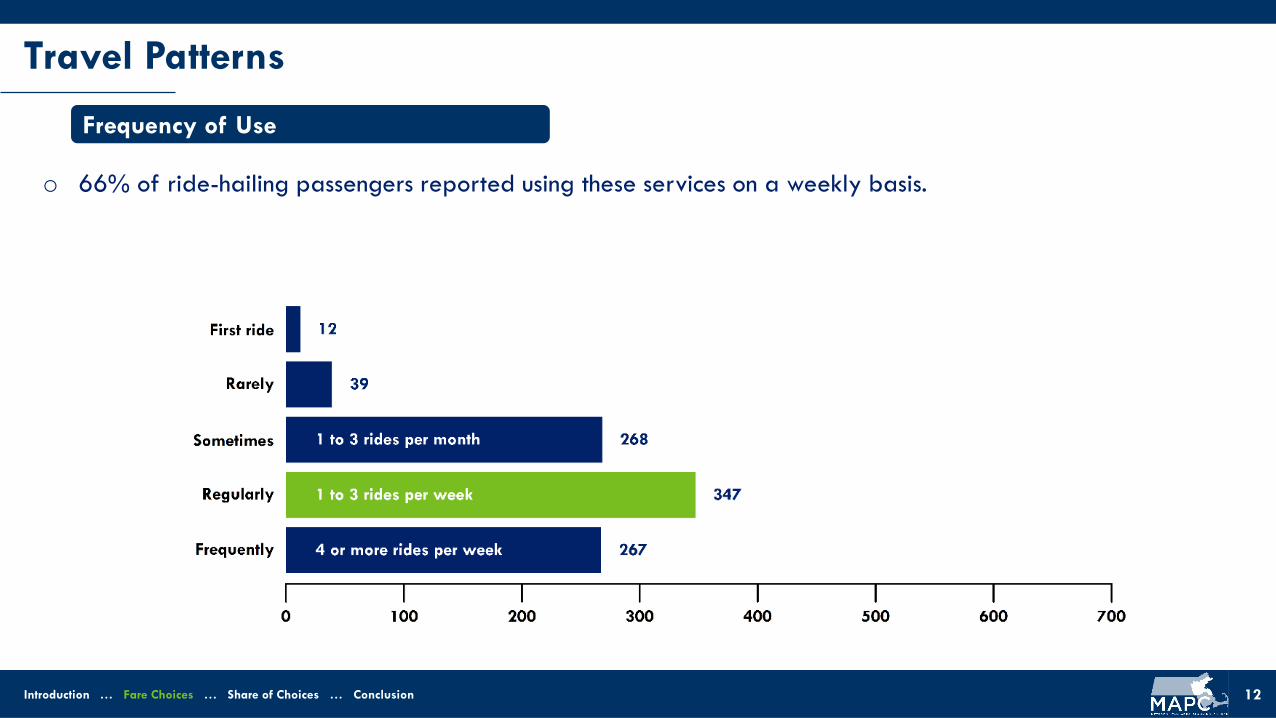
Travel Patterns
Frequency of Use
o 66% of ride-hailing passengers reported using these services on a weekly basis.

13Introduction … Fare Choices … Share of Choices … Conclusion
Trip Context
Vehicle Occupancy
o 80% of surveyed ride-hailing trips used the standard (non-pooling) service option.
14Introduction … Fare Choices … Share of Choices … Conclusion
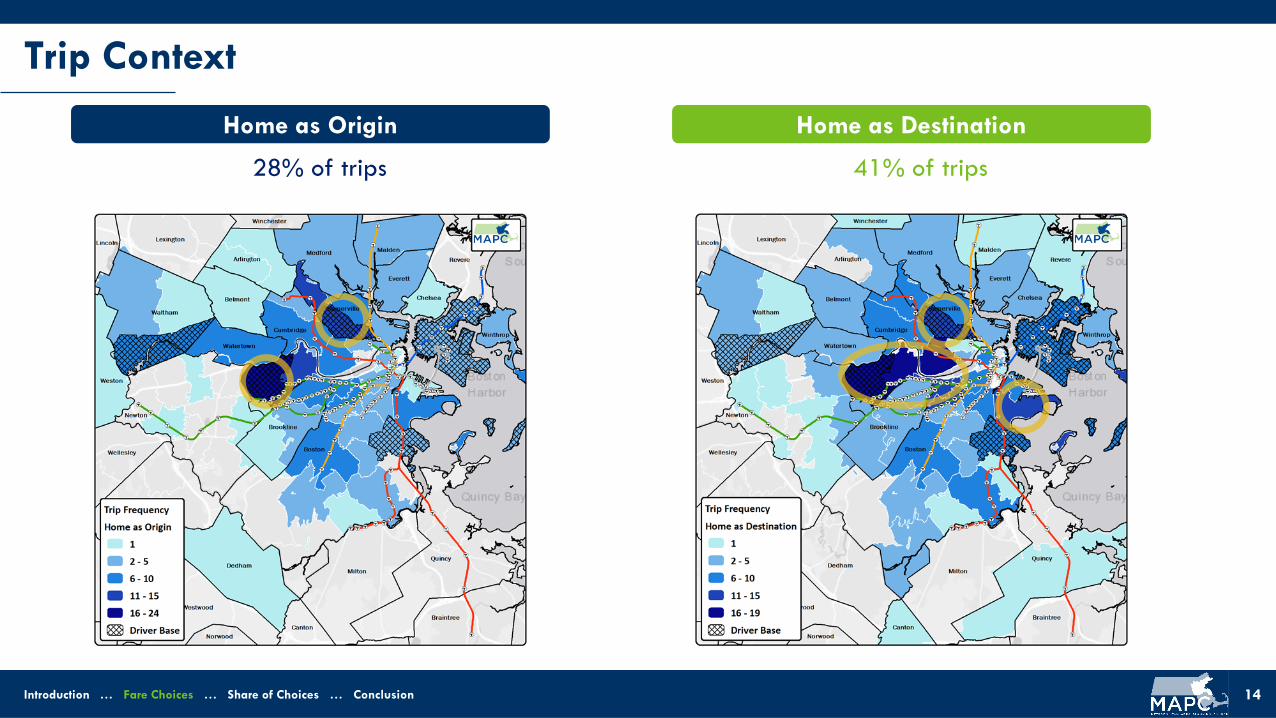
Trip Context
Home as Origin Home as Destination
28% of trips 41% of trips
15Introduction … Fare Choices … Share of Choices … Conclusion
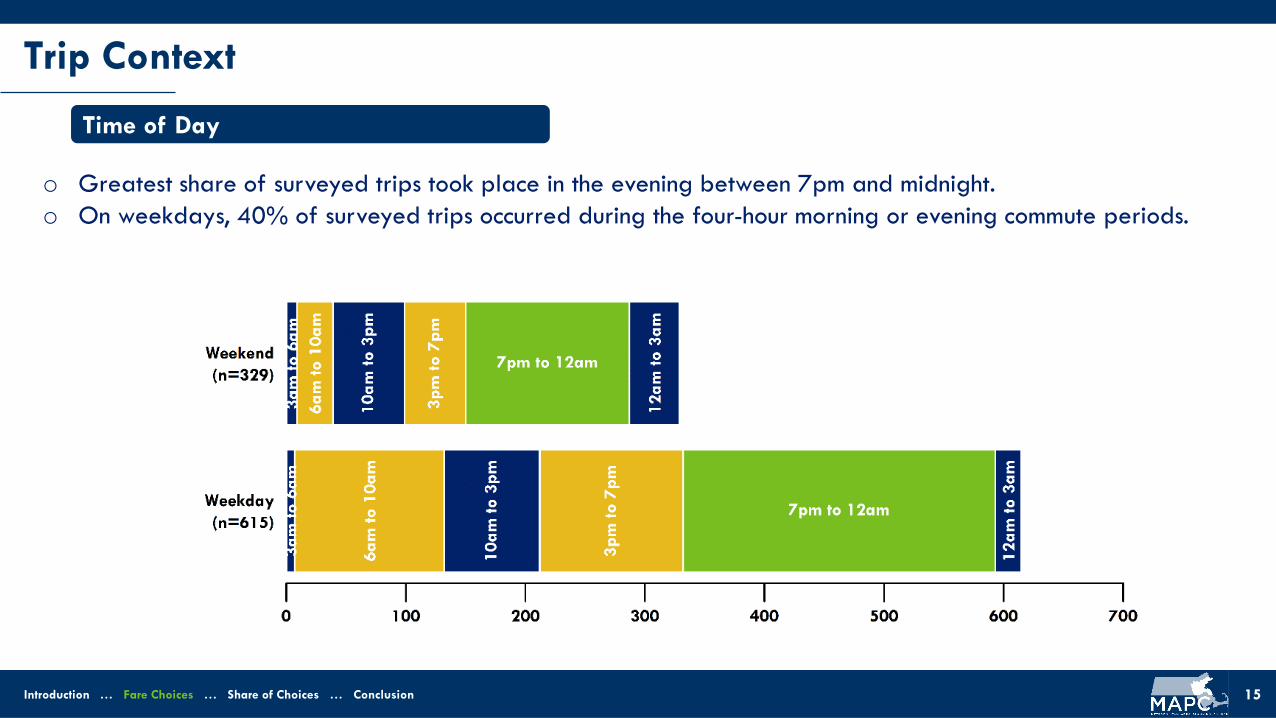
Trip Context
Time of Day
o Greatest share of surveyed trips took place in the evening between 7pm and midnight.o On weekdays, 40% of surveyed trips occurred during the four-hour morning or evening commute periods.
16Introduction … Fare Choices … Share of Choices … Conclusion
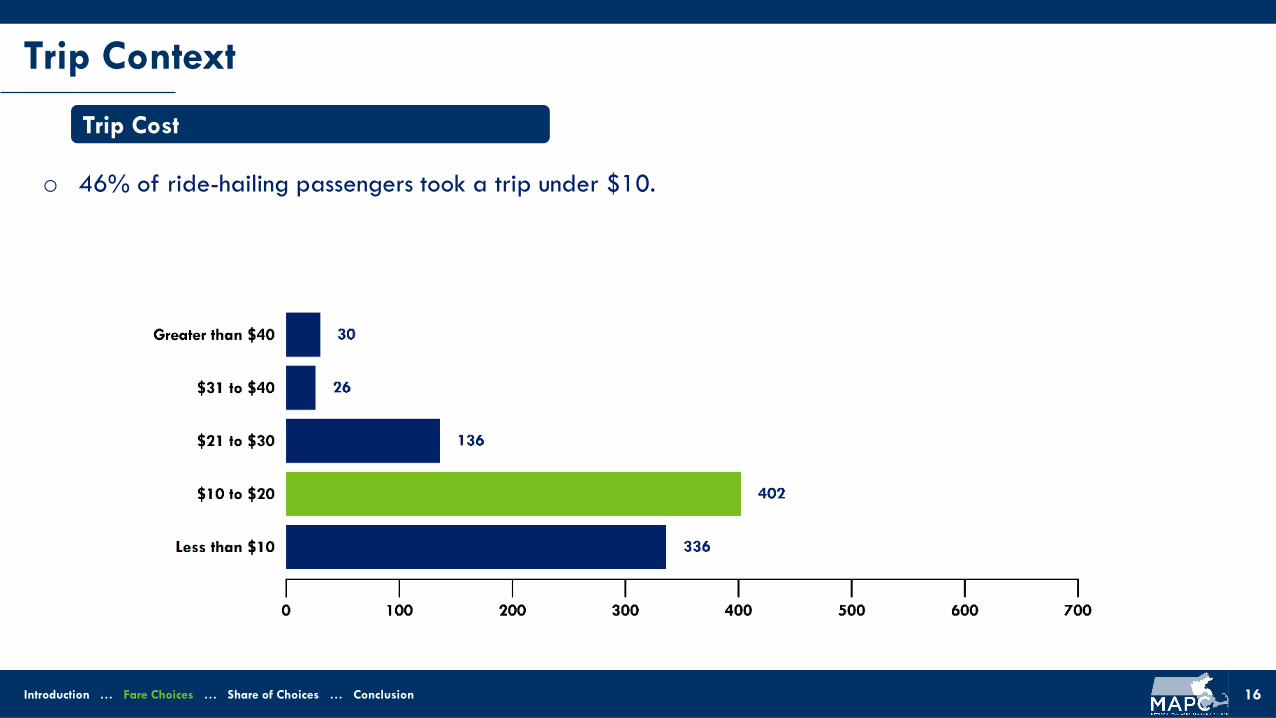
Trip Context
Trip Cost
o 46% of ride-hailing passengers took a trip under $10.
17Introduction … Fare Choices … Share of Choices … Conclusion
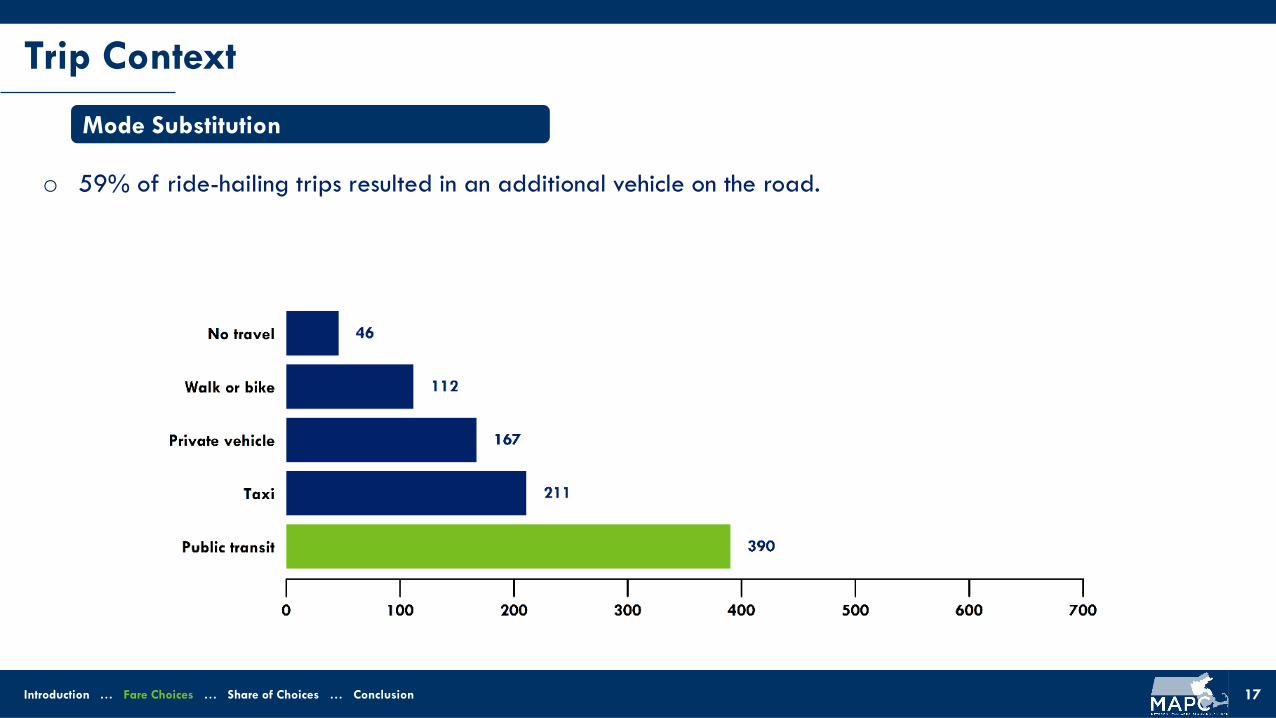
Trip Context
Mode Substitution
o 59% of ride-hailing trips resulted in an additional vehicle on the road.
18Introduction … Fare Choices … Share of Choices … Conclusion
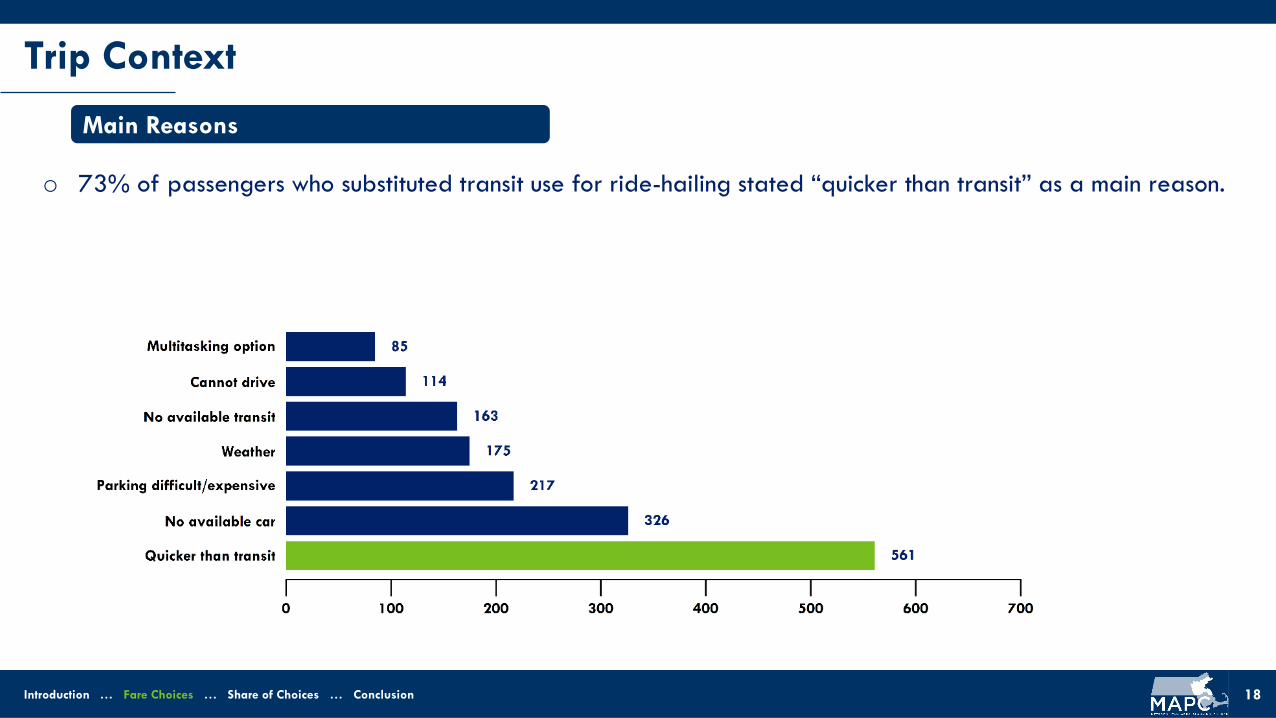
Trip Context
Main Reasons
o 73% of passengers who substituted transit use for ride-hailing stated “quicker than transit” as a main reason.

19Introduction … Fare Choices … Share of Choices … Conclusion
Major Theme
Traffic Congestion
o 15% of all ride-hailing trips replaced more sustainable modes during peak periods.
20Introduction … Fare Choices … Share of Choices … Conclusion
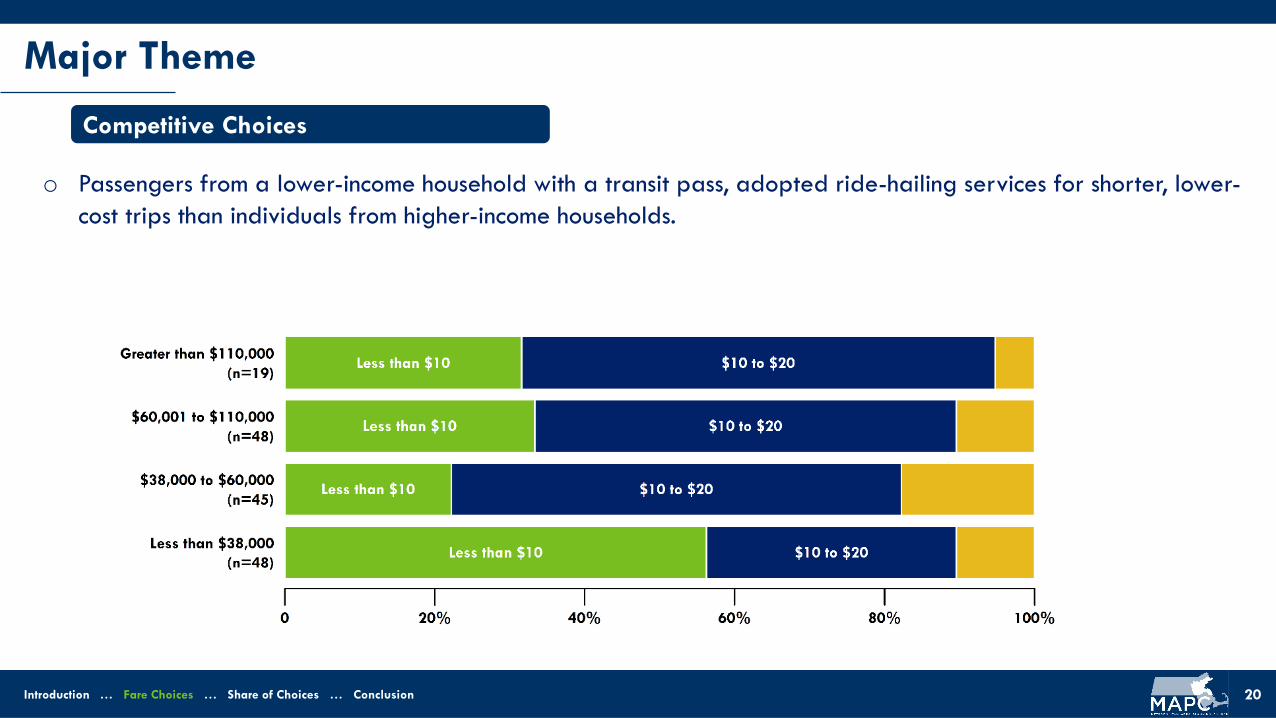
Major Theme
Competitive Choices
o Passengers from a lower-income household with a transit pass, adopted ride-hailing services for shorter, lower-cost trips than individuals from higher-income households.
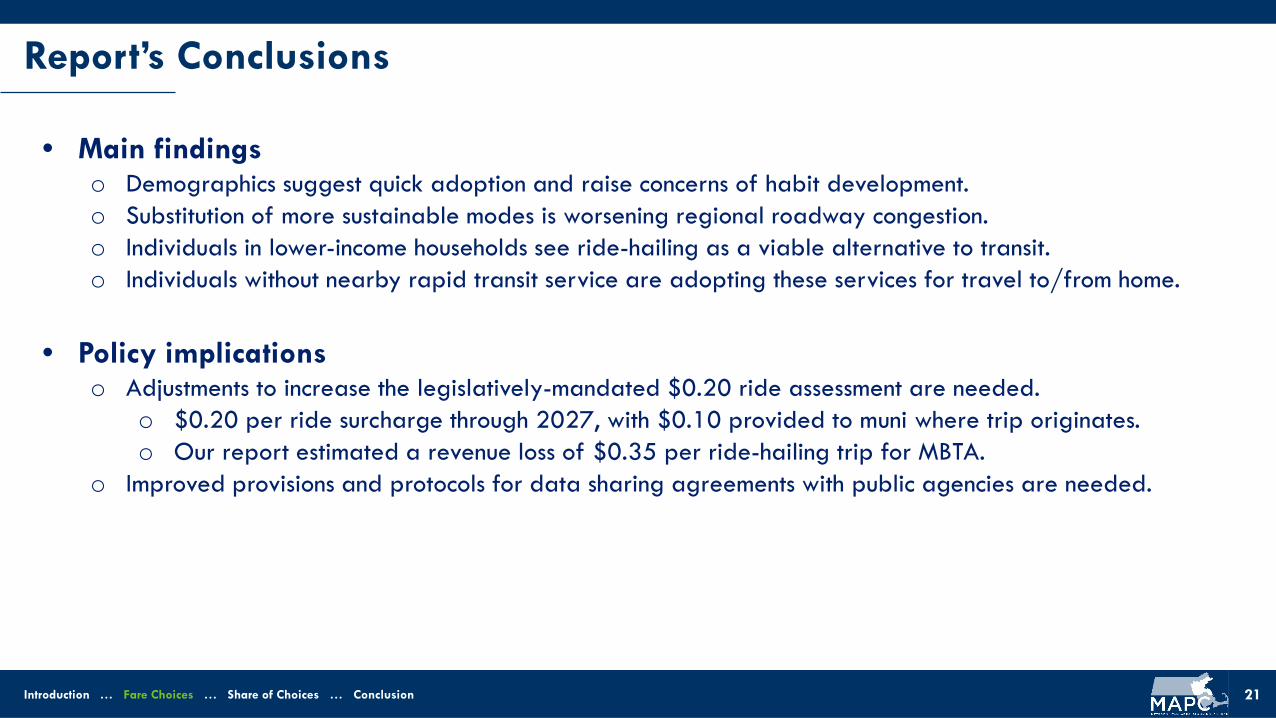
• Main findingso Demographics suggest quick adoption and raise concerns of habit development.o Substitution of more sustainable modes is worsening regional roadway congestion.o Individuals in lower-income households see ride-hailing as a viable alternative to transit.o Individuals without nearby rapid transit service are adopting these services for travel to/from home.
• Policy implicationso Adjustments to increase the legislatively-mandated $0.20 ride assessment are needed.
o $0.20 per ride surcharge through 2027, with $0.10 provided to muni where trip originates.o Our report estimated a revenue loss of $0.35 per ride-hailing trip for MBTA.
o Improved provisions and protocols for data sharing agreements with public agencies are needed.
21Introduction … Fare Choices … Share of Choices … Conclusion
Report’s Conclusions
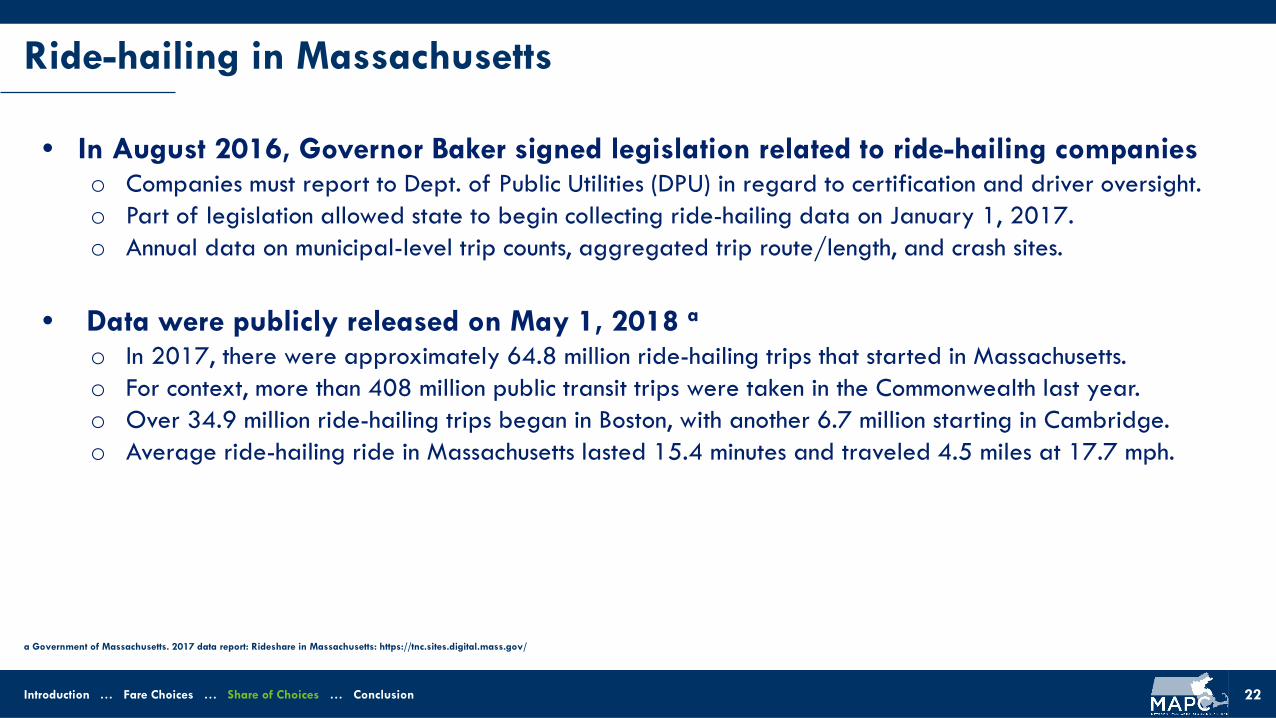
• In August 2016, Governor Baker signed legislation related to ride-hailing companieso Companies must report to Dept. of Public Utilities (DPU) in regard to certification and driver oversight.o Part of legislation allowed state to begin collecting ride-hailing data on January 1, 2017.o Annual data on municipal-level trip counts, aggregated trip route/length, and crash sites.
• Data were publicly released on May 1, 2018 ao In 2017, there were approximately 64.8 million ride-hailing trips that started in Massachusetts.o For context, more than 408 million public transit trips were taken in the Commonwealth last year.o Over 34.9 million ride-hailing trips began in Boston, with another 6.7 million starting in Cambridge.o Average ride-hailing ride in Massachusetts lasted 15.4 minutes and traveled 4.5 miles at 17.7 mph.
22Introduction … Fare Choices … Share of Choices … Conclusion
Ride-hailing in Massachusetts
a Government of Massachusetts. 2017 data report: Rideshare in Massachusetts: https://tnc.sites.digital.mass.gov/
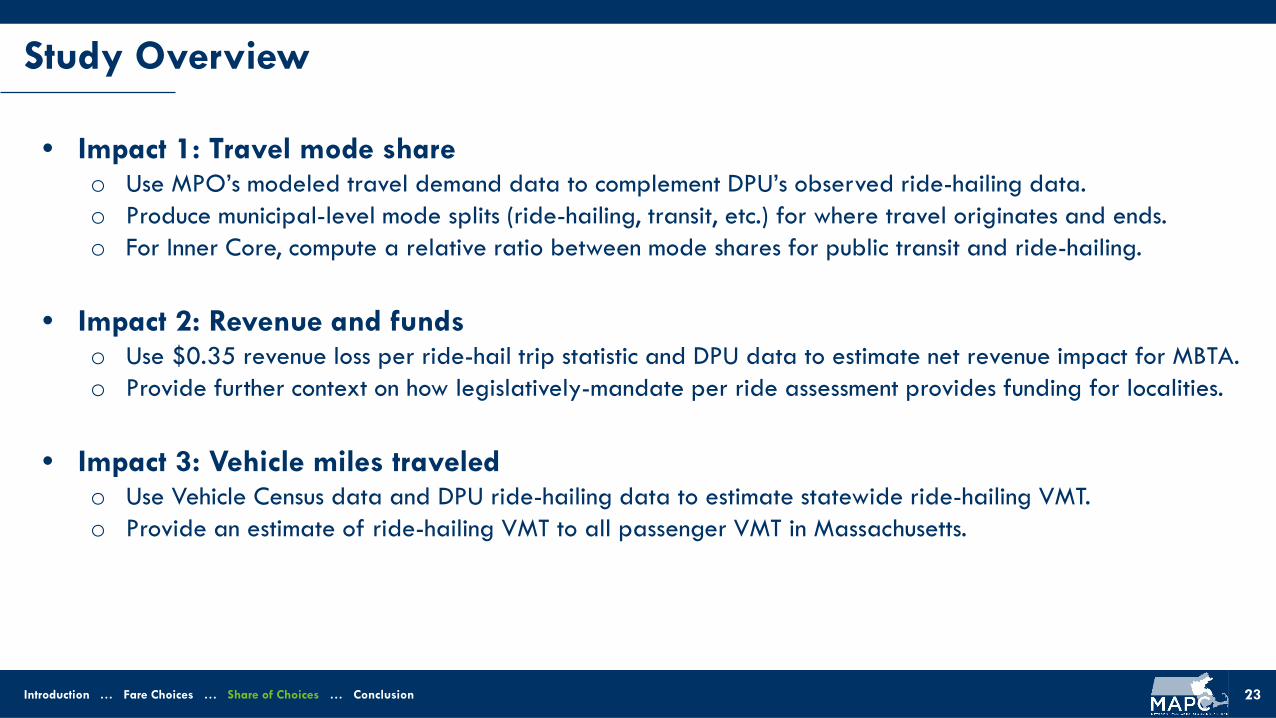
• Impact 1: Travel mode shareo Use MPO’s modeled travel demand data to complement DPU’s observed ride-hailing data.o Produce municipal-level mode splits (ride-hailing, transit, etc.) for where travel originates and ends.o For Inner Core, compute a relative ratio between mode shares for public transit and ride-hailing.
• Impact 2: Revenue and fundso Use $0.35 revenue loss per ride-hail trip statistic and DPU data to estimate net revenue impact for MBTA.o Provide further context on how legislatively-mandate per ride assessment provides funding for localities.
• Impact 3: Vehicle miles traveledo Use Vehicle Census data and DPU ride-hailing data to estimate statewide ride-hailing VMT.o Provide an estimate of ride-hailing VMT to all passenger VMT in Massachusetts.
23Introduction … Fare Choices … Share of Choices … Conclusion
Study Overview

24Introduction … Fare Choices … Share of Choices … Conclusion
Ride-hailing Travel Mode Share
25Introduction … Fare Choices … Share of Choices … Conclusion
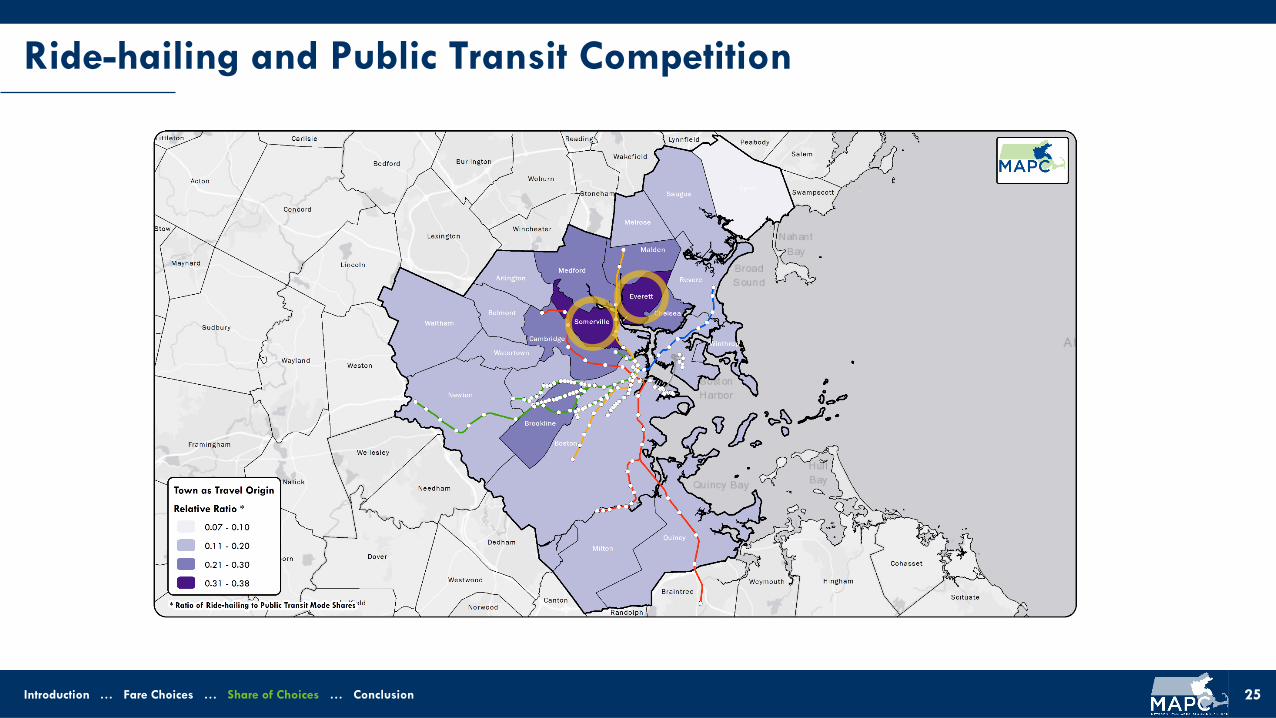
Ride-hailing and Public Transit Competition
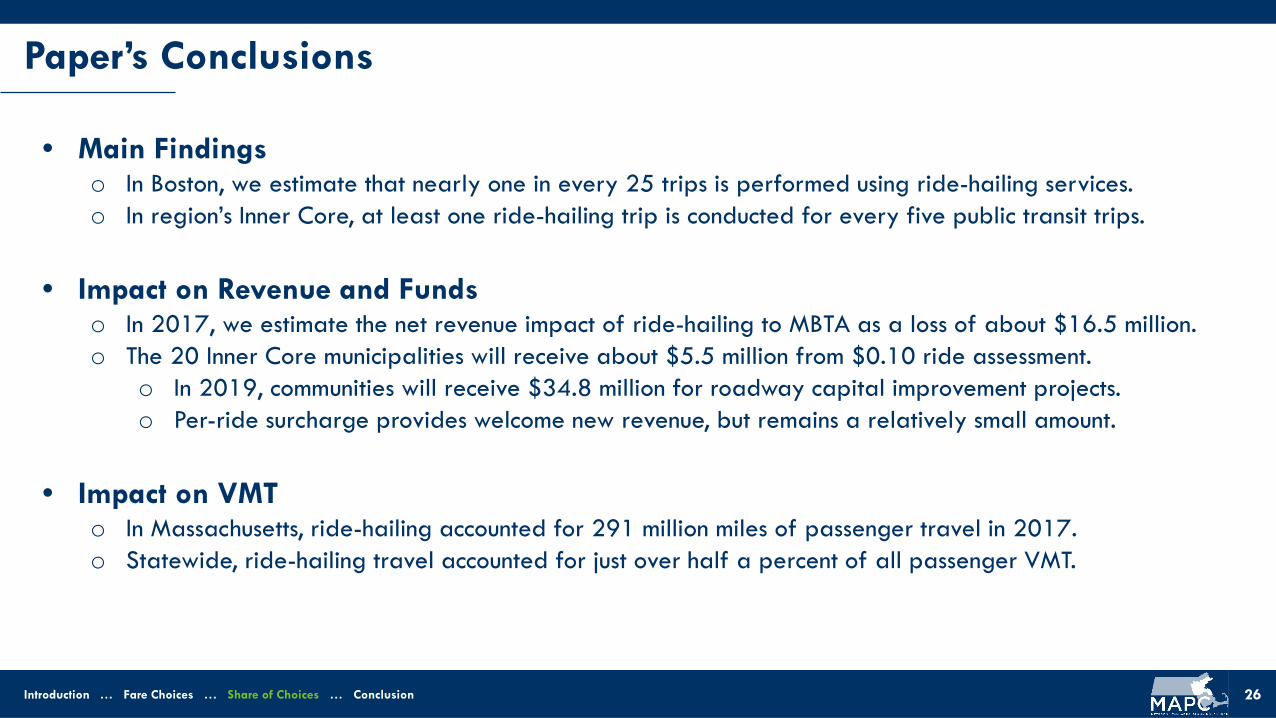
• Main Findingso In Boston, we estimate that nearly one in every 25 trips is performed using ride-hailing services.o In region’s Inner Core, at least one ride-hailing trip is conducted for every five public transit trips.
• Impact on Revenue and Fundso In 2017, we estimate the net revenue impact of ride-hailing to MBTA as a loss of about $16.5 million.o The 20 Inner Core municipalities will receive about $5.5 million from $0.10 ride assessment.
o In 2019, communities will receive $34.8 million for roadway capital improvement projects.o Per-ride surcharge provides welcome new revenue, but remains a relatively small amount.
• Impact on VMTo In Massachusetts, ride-hailing accounted for 291 million miles of passenger travel in 2017.o Statewide, ride-hailing travel accounted for just over half a percent of all passenger VMT.
26Introduction … Fare Choices … Share of Choices … Conclusion
Paper’s Conclusions
• Conclusionso Ride-hailing has become a viable travel option as well as competing alternative to public transit.
o 42-percent of surveyed passengers substituted public transit use with ride-hailing services.o Ratio of ride-hailing-to-public transit mode shares highest in areas without rapid transit service.
o Ride-hailing adoption and utilization is largely led by millennials and urban residents.o 80-percent of surveyed passengers were under 35 years of age.o 84-percent of ride-hailing trips in Massachusetts took place in 20 Inner Core communities.
• Next Stepso Greater insight needed into ride-hailing trip distribution, travel patterns, and routes.
o Available data sets do not track trips from origin to destination.o Data valuable for understanding impact on transportation system and traffic operations.
o Build evidence base on ride-hailing adoption to plan for automated vehicle fleet introduction.
27Introduction … Fare Choices … Share of Choices … Conclusion
Discussion