Embed Size (px)
Citation preview
Data in Brief 33 (2020) 106459
Contents lists available at ScienceDirect
Data in Brief
journal homepage: www.elsevier.com/locate/dib
Data Article
A survey dataset to evaluate the changes in
mobility and transportation due to COVID-19
travel restrictions in Australia, Brazil, China,
Ghana, India, Iran, Italy, Norway, South Africa,
United States
Diego Maria Barbieri a , ∗, Baowen Lou
b , Marco Passavanti c , Cang Hui d , e , Daniela Antunes Lessa
f , Brij Maharaj g , Arunabha Banerjee
h , Fusong Wang
i , Kevin Chang
j , Bhaven Naik
k , Lei Yu
l , Zhuangzhuang Liu
m , Gaurav Sikka
n , Andrew Tucker o , Ali Foroutan Mirhosseini p , Sahra Naseri q , Yaning Qiao
r , Akshay Gupta
s , Montasir Abbas t , Kevin Fang
u , Navid Ghasemi v , Prince Peprah
w , Shubham Goswami x , Amir Hessami y , Nithin Agarwal z , Louisa Lam
$ , Solomon Adomako
#
a Department of Civil and Environmental Engineering, Norwegian University of Science and Technology,
Høgskoleringen 7A, Trondheim, 7491, Trøndelag, Norway, b Chang’an University, School of Highway, Nan Er Huan Road (Mid-section), Xi’an, 710064, Shaanxi, China, c Italian Society of Cognitive Behavioral Therapy (CBT-Italy), Mannelli St. 139, Florence, 50132, Toscana, Italy d Centre for Invasion Biology, Department of Mathematical Sciences, Stellenbosch University, Matieland, 7602, South
Africa e Biodiversity Informatics Unit, African Institute for Mathematical Sciences, Cape Town 7945, South Africa, f Department of Civil Engineering, Federal University of Ouro Preto, Rua Nove, Bauxita, Ouro Preto, 3540 0-0 0 0,
Minas Gerais, Brazil g Department of Geography, University of KwaZulu-Natal, Howard College City, Durban, 40 0 0, KwaZulu, South Africa h Department of Civil Engineering, Indian Institute of Technology Guwahati, IIT Guwahati, Guwahati, 781039,
Assam, India i State Key Laboratory of Silicate Materials for Architectures, Wuhan University of Technology, Luoshi road 122,
Wuhan, 430070, Hubei, China j Department of Civil and Environmental Engineering, University of Idaho, 875 Perimeter Drive, Mailstop 1022,
Moscow, 83844, Idaho, United States k Department of Civil Engineering/Russ College of Engineering & Technology, Ohio University, 28 W. Green Drive,
Athens, 45701, Ohio, United States l Sun Yat-sen University, School of Civil Engineering, Xingang Xi Road 135, Guangzhou, 510275, Guangdong, China m Chang’an University, School of Highway, Nan Er Huan Road (Mid-section), Xi’an, 710064, Shaanxi, China n Department of Geography, Lalit Narayan Mithila University, Darbhanga, 846004, Bihar, India, o University of Connecticut, Connecticut Transportation Safety Research Center, 270 Middle Turnpike, Unit 5202
Longley Building, Storrs, 06269, Connecticut, United States
https://doi.org/10.1016/j.dib.2020.106459
2352-3409/© 2020 The Author(s). Published by Elsevier Inc. This is an open access article under the CC BY license
( http://creativecommons.org/licenses/by/4.0/ )
2 D.M. Barbieri, B. Lou and M. Passavanti et al. / Data in Brief 33 (2020) 106459
p Department of Civil and Environmental Engineering, Norwegian University of Science and Technology,
Høgskoleringen 7A, Trondheim, 7491, Trøndelag, Norway q Bam University of Medical Sciences, School of Medicine, Bam, 76615-336, Kerman, Iran r China University of Mining and Technology, School of Mechanics and Civil Engineering, Daxue Road 1, Xuzhou,
22116, Jiangsu, China s Department of Civil Engineering, Transportation Engineering Group, Indian Institute of Technology Roorkee,
321-A&B, Roorkee, 247667, Uttarakhand, India t Department of Civil and Environmental Engineering, Virginia Tech, 301-D3 Patton Hall, Blacksburg, 24061, Virginia,
United States u Department of Geography, Environment, and Planning, Sonoma State University, 1801 East Cotati Avenue, Rohnert
Park, 94928, California, United States v Department of Civil Chemical Environmental and Materials Engineering, University of Bologna, Viale del
Risorgimento, 2, Bologna, 40136, Emilia-Romagna, Italy w Department of Social Policy Research Centre, University of New South Wales, John Goodsell Building, Kensington,
Sydney, 2052, New South Wales, Australia x Department of Civil Engineering, Indian Institute of Science Bangalore, C V Raman Avenue, Bangalore, 560012,
Karnataka, India y Department of Civil and Architectural Engineering, Texas A&M University – Kingsville, 917 W. Ave B, Kingsville,
78363, Texas, United States z Department of Civil & Coastal Engineering, University of Florida, 2100 NE Waldo Rd., Sta 106, Gainesville, 32609,
Florida, United States $ Federation University Australia, School of Health, 72-100 Clyde Rd, Berwick, 3806, Victoria, Australia # Department of Engineering and Science, University of Agder, Jon Lilletuns vei 9, Grimstad, 4879, Agder, Norway
a r t i c l e i n f o
Article history:
Received 7 September 2020
Revised 20 October 2020
Accepted 21 October 2020
Available online 24 October 2020
Keywords:
Survey data
COVID-19
Mobility
Transportation
Travel behavior
Modal share
Risk perception
a b s t r a c t
COVID-19 pandemic has heavily impacted the global commu-
nity. To curb the viral transmission, travel restrictions have
been enforced across the world. The dataset documents the
mobility disruptions and the modal shifts that have occurred
as a consequence of the restrictive measures implemented in
ten countries: Australia, Brazil, China, Ghana, India, Iran, Italy,
Norway, South Africa and the United States. An online ques-
tionnaire was distributed during the period from the 11st to
the 31st of May 2020, with a total of 9 394 respondents. The
first part of the survey has characterized the frequency of use
of all transport modes before and during the enforcement of
the restrictions, while the second part of the survey has dealt
with perceived risks of contracting COVID-19 from different
transport modes and perceived effectiveness of travel miti-
gation measures. Overall, the dataset (stored in a repository
publicly available) can be conveniently used to quantify and
understand the modal shifts and people’s cognitive behavior
towards travel due to COVID-19. The collected responses can
be further analysed by considering other demographic and
socioeconomic covariates.
© 2020 The Author(s). Published by Elsevier Inc.
This is an open access article under the CC BY license
( http://creativecommons.org/licenses/by/4.0/ )
∗ Corresponding author.
E-mail addresses: [email protected] (D.M. Barbieri), [email protected] (B. Lou),
[email protected] (M. Passavanti), [email protected] (C. Hui), [email protected] (D.A. Lessa),
[email protected] (B. Maharaj), [email protected] (F. Wang), [email protected] (K. Chang), [email protected]
(B. Naik), [email protected] (L. Yu), [email protected] (Z. Liu), [email protected] (A. Tucker),
[email protected] (A. Foroutan Mirhosseini), [email protected] (Y. Qiao), [email protected] (A. Gupta),
[email protected] (M. Abbas), [email protected] (K. Fang), [email protected] (N. Ghasemi), [email protected] (S.
Goswami), [email protected] (A. Hessami), [email protected] (N. Agarwal), [email protected] (L. Lam),
[email protected] (S. Adomako).

D.M. Barbieri, B. Lou and M. Passavanti et al. / Data in Brief 33 (2020) 106459 3
Specifications Table
Subject Social Sciences
Specific subject area Mobility, Transportation, Modal share, Perceived risk
Type of data Primary data, Table
How data were acquired The data were obtained from a web-based survey created on two platforms:
Google Forms (English, Italian, Norwegian, Persian, Portuguese languages) and
WenJuanXing (Chinese language). The survey, promoted on both professional
and social networks, is available in English in the data repository.
Data format Raw Analyzed
Parameters for data collection The survey data were collected from 9 394 respondents older than 18 years
old having internet access
Description of data collection The web-based survey was promoted using a combination of snowball and
purposive techniques
Data source location Countries: Australia, Brazil, China, Ghana, India, Iran, Italy, Norway, South
Africa and the United States
Data accessibility Dataset is uploaded on Harvard Dataverse
Repository name:
Mobility and perceived risk associated to mobility in Australia, Brazil, China,
Ghana, India, Iran, Italy, Norway, South Africa, USA before and during COVID-19
restrictions
Data identification number: https://doi.org/10.7910/dvn/eiquga
Direct URL to data: https://doi.org/10.7910/dvn/eiquga
Value of the Data
• The data are related to the mobility disruptions for all transport modes (walk, bicycle, mo-
torcycle, car driven alone, car driven in company, bus, subway, tram, train, ferry, airplane)
occurring during the COVID-19 restrictions as experienced by a large survey pool comprising
9 394 respondents located in ten countries on six continents.
• The data can be useful for transport practitioners and policy makers to develop mobility
strategies and intervention mechanisms to tackle the COVID-19 crisis and future pandemics
facilitating the interventions according to a user’s perspectives.
• The data can be used to thoroughly quantify the transport disruptions, the modal share and
the cognitive behavior towards travel related to the COVID-19 mobility restrictions. A soft-
ware for statistical analysis can be efficiently employed to delve into the dataset.
1. Data Description
The COVID-19 pandemic is a major challenge for the entire global community [1 , 2] , as both
the amount of confirmed cases and the death toll are rising at a staggering rate at this moment
[3] . The two most important causes that have led to the large spread of the new respiratory
syndrome are its high transmissibility and our hypermobile society [4 , 5] . Due to the lack of any
vaccine, unprecedented measures promoting social distancing and reducing individual mobility
have been enforced worldwide in the attempt to contain the pandemic [6 , 7] . Notwithstanding
the “stay-at-home” message promoted globally, it is unclear to what extent individuals have
modified their travel attitudes and behaviours in response to the bans on free movement [8] .
The greatest risk for contracting and transmitting infectious diseases, for instance from shared
travel modes, originates in the fact that people are in proximity in a closed environment [9] .
As mobility is intimately related to habits and routines, the mitigation measures and perceived
risks can entail structural alterations among all transport modes [10–12] .
This survey dataset gathers information regarding the travel habits of individuals in ten coun-
tries: Australia, Brazil, China, Ghana, India, Iran, Italy, Norway, South Africa and the United States
(hereafter, also referred to by their acronyms AU, BR, CH, GH, IN, IR, IT, NO, ZA and USA, respec-
tively). An online survey was distributed during the period from the 11st to the 31st May 2020.
4 D.M. Barbieri, B. Lou and M. Passavanti et al. / Data in Brief 33 (2020) 106459
B
w
“
f
c
p
s
t
[
m
f
a
t
w
y this time, all the investigated countries had undergone travel restrictions [13] ; therefore, it
as possible for all the 9 394 respondents to compare their mobility habits concerning both
before” and “during” pandemic scenarios, as well as perceived risks of contracting COVID-19
rom different transport modes.
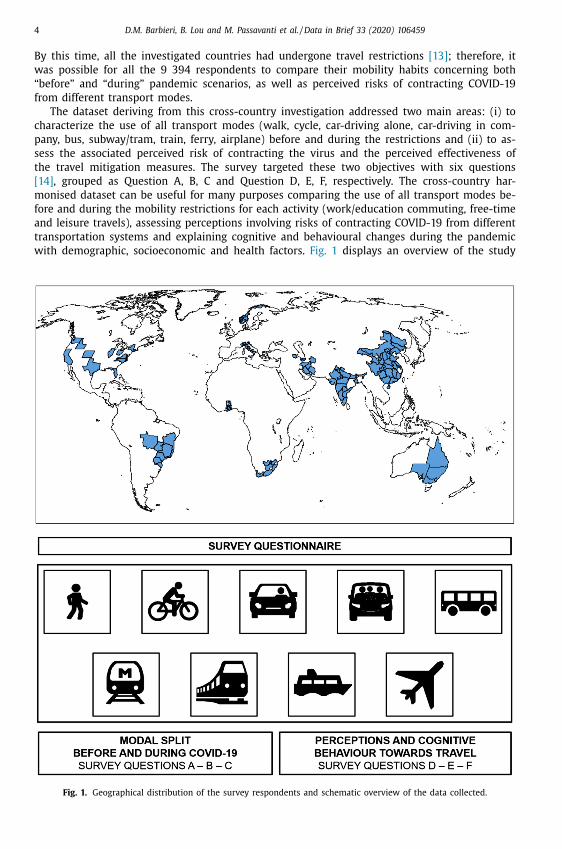
The dataset deriving from this cross-country investigation addressed two main areas: (i) to
haracterize the use of all transport modes (walk, cycle, car-driving alone, car-driving in com-
any, bus, subway/tram, train, ferry, airplane) before and during the restrictions and (ii) to as-
ess the associated perceived risk of contracting the virus and the perceived effectiveness of
he travel mitigation measures. The survey targeted these two objectives with six questions
14] , grouped as Question A, B, C and Question D, E, F, respectively. The cross-country har-
onised dataset can be useful for many purposes comparing the use of all transport modes be-
ore and during the mobility restrictions for each activity (work/education commuting, free-time
nd leisure travels), assessing perceptions involving risks of contracting COVID-19 from different
ransportation systems and explaining cognitive and behavioural changes during the pandemic
ith demographic, socioeconomic and health factors. Fig. 1 displays an overview of the study
Fig. 1. Geographical distribution of the survey respondents and schematic overview of the data collected.

D.M. Barbieri, B. Lou and M. Passavanti et al. / Data in Brief 33 (2020) 106459 5
Fig. 2. Number of COVID-19-related confirmed cases per 100 000 inhabitants in each surveyed country [3] .
Fig. 3. Number of COVID-19-related deaths per 100 000 inhabitants in each surveyed country [3] .
and all the regions/provinces/states/counties where survey respondents have been located. In ad-
dition, temporal information regarding the number of confirmed cases and deaths are reported
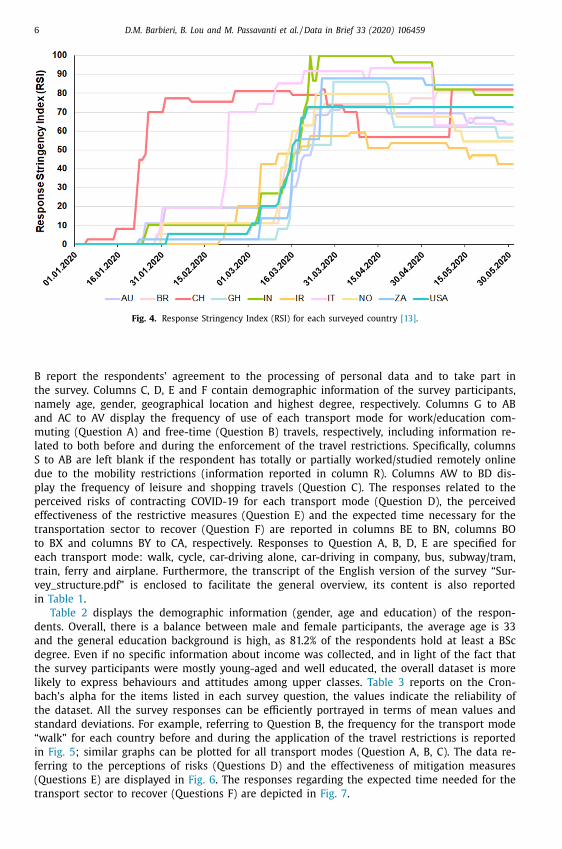
in Fig. 2 and Fig. 3 , respectively [3] . Additional information that can be useful to characterize
the dynamics of the pandemic is the Response Stringency Index (RSI) [13] , which is associated
to the quality of the pandemic-related policies enforced in each country and is expressed by a
value ranging from 0 to 100 ( Fig. 4 ).
The dataset is publicly available on Harvard Dataverse ( https://doi.org/10.7910/dvn/eiquga ).
The records are stored as a single file “Mobility_10_countries.xlsx” containing ten spreadsheets
referring to each country; all the responses have been translated into English. Columns A and
6 D.M. Barbieri, B. Lou and M. Passavanti et al. / Data in Brief 33 (2020) 106459
Fig. 4. Response Stringency Index (RSI) for each surveyed country [13] .
B
t
n
a
m
l
S
d
p
p
e
t
t
e
t
v
i
d
a
d
t
l
b
t
s
“
i
f
(
t
report the respondents’ agreement to the processing of personal data and to take part in
he survey. Columns C, D, E and F contain demographic information of the survey participants,
amely age, gender, geographical location and highest degree, respectively. Columns G to AB
nd AC to AV display the frequency of use of each transport mode for work/education com-
uting (Question A) and free-time (Question B) travels, respectively, including information re-
ated to both before and during the enforcement of the travel restrictions. Specifically, columns
to AB are left blank if the respondent has totally or partially worked/studied remotely online
ue to the mobility restrictions (information reported in column R). Columns AW to BD dis-
lay the frequency of leisure and shopping travels (Question C). The responses related to the
erceived risks of contracting COVID-19 for each transport mode (Question D), the perceived
ffectiveness of the restrictive measures (Question E) and the expected time necessary for the
ransportation sector to recover (Question F) are reported in columns BE to BN, columns BO
o BX and columns BY to CA, respectively. Responses to Question A, B, D, E are specified for
ach transport mode: walk, cycle, car-driving alone, car-driving in company, bus, subway/tram,
rain, ferry and airplane. Furthermore, the transcript of the English version of the survey “Sur-
ey_structure.pdf” is enclosed to facilitate the general overview, its content is also reported
n Table 1 .
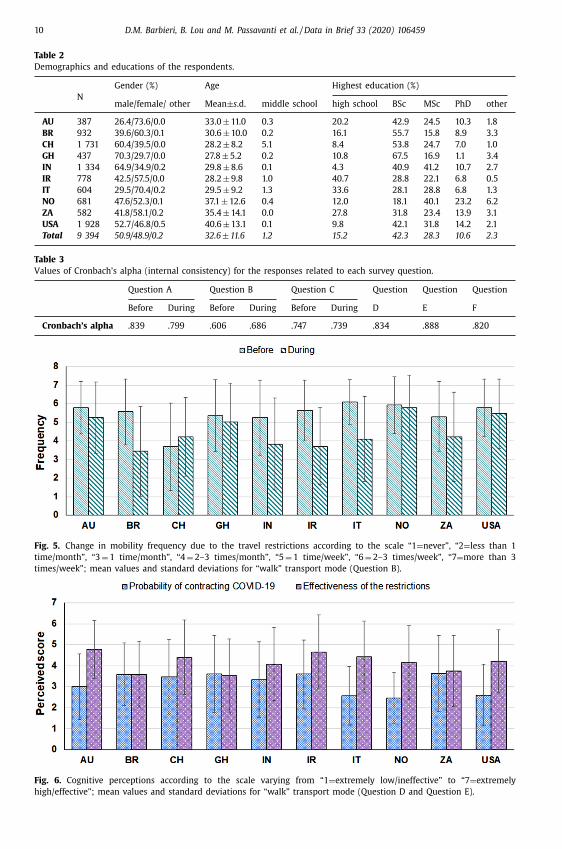
Table 2 displays the demographic information (gender, age and education) of the respon-
ents. Overall, there is a balance between male and female participants, the average age is 33
nd the general education background is high, as 81.2% of the respondents hold at least a BSc
egree. Even if no specific information about income was collected, and in light of the fact that
he survey participants were mostly young-aged and well educated, the overall dataset is more
ikely to express behaviours and attitudes among upper classes. Table 3 reports on the Cron-
ach’s alpha for the items listed in each survey question, the values indicate the reliability of
he dataset. All the survey responses can be efficiently portrayed in terms of mean values and
tandard deviations. For example, referring to Question B, the frequency for the transport mode
walk” for each country before and during the application of the travel restrictions is reported
n Fig. 5 ; similar graphs can be plotted for all transport modes (Question A, B, C). The data re-
erring to the perceptions of risks (Questions D) and the effectiveness of mitigation measures
Questions E) are displayed in Fig. 6 . The responses regarding the expected time needed for the
ransport sector to recover (Questions F) are depicted in Fig. 7 .
D.M. Barbieri, B. Lou and M. Passavanti et al. / Data in Brief 33 (2020) 106459 7
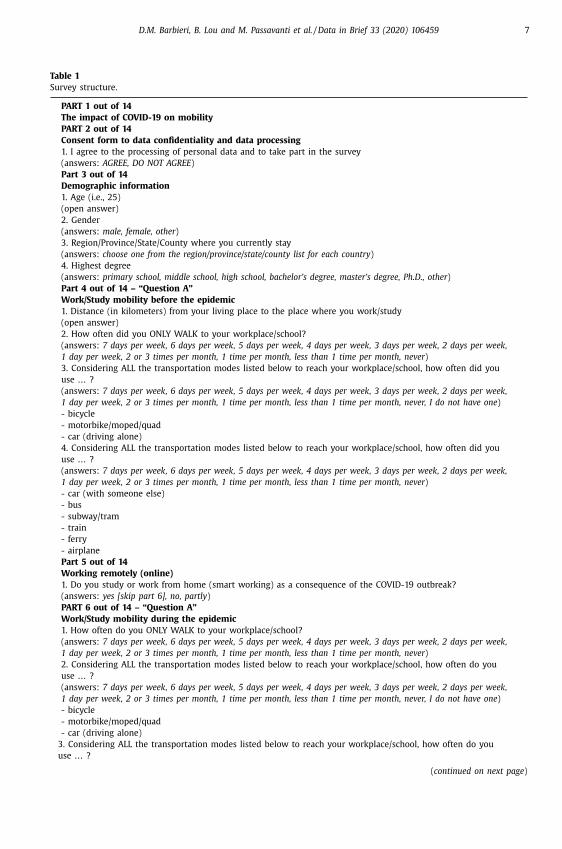
Table 1
Survey structure.
PART 1 out of 14
The impact of COVID-19 on mobility
PART 2 out of 14
Consent form to data confidentiality and data processing
1. I agree to the processing of personal data and to take part in the survey
(answers: AGREE, DO NOT AGREE )
Part 3 out of 14
Demographic information
1. Age (i.e., 25)
(open answer)
2. Gender
(answers: male, female, other )
3. Region/Province/State/County where you currently stay
(answers: choose one from the region/province/state/county list for each country )
4. Highest degree
(answers: primary school, middle school, high school, bachelor’s degree, master’s degree, Ph.D., other )
Part 4 out of 14 – “Question A”
Work/Study mobility before the epidemic
1. Distance (in kilometers) from your living place to the place where you work/study
(open answer)
2. How often did you ONLY WALK to your workplace/school?
(answers: 7 days per week, 6 days per week, 5 days per week, 4 days per week, 3 days per week, 2 days per week,
1 day per week, 2 or 3 times per month, 1 time per month, less than 1 time per month, never )
3. Considering ALL the transportation modes listed below to reach your workplace/school, how often did you
use … ?
(answers: 7 days per week, 6 days per week, 5 days per week, 4 days per week, 3 days per week, 2 days per week,
1 day per week, 2 or 3 times per month, 1 time per month, less than 1 time per month, never, I do not have one )
- bicycle
- motorbike/moped/quad
- car (driving alone)
4. Considering ALL the transportation modes listed below to reach your workplace/school, how often did you
use … ?
(answers: 7 days per week, 6 days per week, 5 days per week, 4 days per week, 3 days per week, 2 days per week,
1 day per week, 2 or 3 times per month, 1 time per month, less than 1 time per month, never )
- car (with someone else)
- bus
- subway/tram
- train
- ferry
- airplane
Part 5 out of 14
Working remotely (online)
1. Do you study or work from home (smart working) as a consequence of the COVID-19 outbreak?
(answers: yes [skip part 6], no, partly )
PART 6 out of 14 – “Question A”
Work/Study mobility during the epidemic
1. How often do you ONLY WALK to your workplace/school?
(answers: 7 days per week, 6 days per week, 5 days per week, 4 days per week, 3 days per week, 2 days per week,
1 day per week, 2 or 3 times per month, 1 time per month, less than 1 time per month, never )
2. Considering ALL the transportation modes listed below to reach your workplace/school, how often do you
use … ?
(answers: 7 days per week, 6 days per week, 5 days per week, 4 days per week, 3 days per week, 2 days per week,
1 day per week, 2 or 3 times per month, 1 time per month, less than 1 time per month, never, I do not have one )
- bicycle
- motorbike/moped/quad
- car (driving alone)
3. Considering ALL the transportation modes listed below to reach your workplace/school, how often do you
use … ?
( continued on next page )

8 D.M. Barbieri, B. Lou and M. Passavanti et al. / Data in Brief 33 (2020) 106459
Table 1 ( continued )
(answers: 7 days per week, 6 days per week, 5 days per week, 4 days per week, 3 days per week, 2 days per week,
1 day per week, 2 or 3 times per month, 1 time per month, less than 1 time per month, never )
- car (with someone else)
- bus
- subway/tram
- train
- ferry
- airplane
Part 7 out of 14 – “Question B”
Free time mobility before the epidemic
1. How often did you go out for a walk or to do sports?
(answers : more than 3 times per week, 2 or 3 times per week, 1 time per week, 2 or 3 times per month, 1 time
per month, less than 1 time per month, never )
2. How often did you use a … ?
(answers: more than 3 times per week, 2 or 3 times per week, 1 time per week, 2 or 3 times per month, 1 time
per month, less than 1 time per month, never, I do not have one )
- bicycle
- motorbike/moped/quad
- car (driving alone)
3. How often did you use a … ?
(answers: more than 3 times per week, 2 or 3 times per week, 1 time per week, 2 or 3 times per month, 1 time
per month, less than 1 time per month, never )
- car (with someone else)
- bus
- subway/tram
- train
- ferry
- airplane
Part 8 out of 14 – “Question B”
Free time mobility during the epidemic
1. How often do you go out for a walk or to do sports?
(answers : more than 3 times per week, 2 or 3 times per week, 1 time per week, 2 or 3 times per month, 1 time
per month, less than 1 time per month, never )
2. How often do you use a … ?
(answers: more than 3 times per week, 2 or 3 times per week, 1 time per week, 2 or 3 times per month, 1 time
per month, less than 1 time per month, never, I do not have one )
- bicycle
- motorbike/moped/quad
- car (driving alone)
3. How often do you use a … ?
(answers: more than 3 times per week, 2 or 3 times per week, 1 time per week, 2 or 3 times per month, 1 time
per month, less than 1 time per month, never )
- car (with someone else)
- bus
- subway/tram
- train
- ferry
- airplane
Part 9 out of 14 – “Question C”
General mobility before the epidemic
1. … how often did you go out and … ?
(answers : more than 3 times per week, 2 or 3 times per week, 1 time per week, 2 or 3 times per month, 1 time
per month, less than 1 time per month, never )
- visit family members/relatives
- hang out with friends
- buy essential goods
- buy nonessential goods
Part 10 out of 14 – “Question C”
( continued on next page )
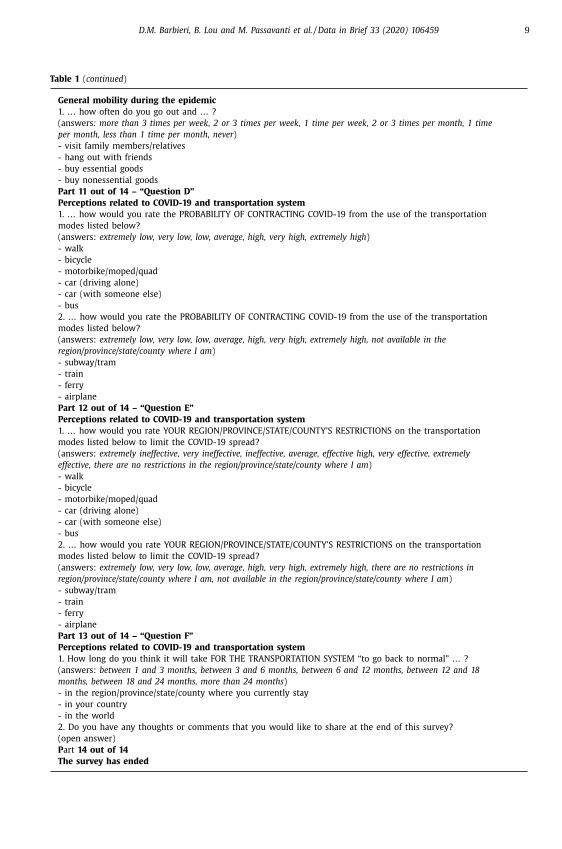
D.M. Barbieri, B. Lou and M. Passavanti et al. / Data in Brief 33 (2020) 106459 9
Table 1 ( continued )
General mobility during the epidemic
1. … how often do you go out and … ?
(answers : more than 3 times per week, 2 or 3 times per week, 1 time per week, 2 or 3 times per month, 1 time
per month, less than 1 time per month, never )
- visit family members/relatives
- hang out with friends
- buy essential goods
- buy nonessential goods
Part 11 out of 14 – “Question D”
Perceptions related to COVID-19 and transportation system
1. … how would you rate the PROBABILITY OF CONTRACTING COVID-19 from the use of the transportation
modes listed below?
(answers: extremely low, very low, low, average, high, very high, extremely high )
- walk
- bicycle
- motorbike/moped/quad
- car (driving alone)
- car (with someone else)
- bus
2. … how would you rate the PROBABILITY OF CONTRACTING COVID-19 from the use of the transportation
modes listed below?
(answers: extremely low, very low, low, average, high, very high, extremely high, not available in the
region/province/state/county where I am )
- subway/tram
- train
- ferry
- airplane
Part 12 out of 14 – “Question E”
Perceptions related to COVID-19 and transportation system
1. … how would you rate YOUR REGION/PROVINCE/STATE/COUNTY’S RESTRICTIONS on the transportation
modes listed below to limit the COVID-19 spread?
(answers: extremely ineffective, very ineffective, ineffective, average, effective high, very effective, extremely
effective, there are no restrictions in the region/province/state/county where I am )
- walk
- bicycle
- motorbike/moped/quad
- car (driving alone)
- car (with someone else)
- bus
2. … how would you rate YOUR REGION/PROVINCE/STATE/COUNTY’S RESTRICTIONS on the transportation
modes listed below to limit the COVID-19 spread?
(answers: extremely low, very low, low, average, high, very high, extremely high, there are no restrictions in
region/province/state/county where I am, not available in the region/province/state/county where I am )
- subway/tram
- train
- ferry
- airplane
Part 13 out of 14 – “Question F”
Perceptions related to COVID-19 and transportation system
1. How long do you think it will take FOR THE TRANSPORTATION SYSTEM “to go back to normal” … ?
(answers: between 1 and 3 months, between 3 and 6 months, between 6 and 12 months, between 12 and 18
months, between 18 and 24 months, more than 24 months )
- in the region/province/state/county where you currently stay
- in your country
- in the world
2. Do you have any thoughts or comments that you would like to share at the end of this survey?
(open answer)
P art 14 out of 14
The survey has ended
10 D.M. Barbieri, B. Lou and M. Passavanti et al. / Data in Brief 33 (2020) 106459
Table 2
Demographics and educations of the respondents.
N
Gender (%) Age Highest education (%)
male/female/ other Mean ±s .d. middle school high school BSc MSc PhD other
AU 387 26.4/73.6/0.0 33.0 ± 11.0 0.3 20.2 42.9 24.5 10.3 1.8
BR 932 39.6/60.3/0.1 30.6 ± 10.0 0.2 16.1 55.7 15.8 8.9 3.3
CH 1 731 60.4/39.5/0.0 28.2 ± 8.2 5.1 8.4 53.8 24.7 7.0 1.0
GH 437 70.3/29.7/0.0 27.8 ± 5.2 0.2 10.8 67.5 16.9 1.1 3.4
IN 1 334 64.9/34.9/0.2 29.8 ± 8.6 0.1 4.3 40.9 41.2 10.7 2.7
IR 778 42.5/57.5/0.0 28.2 ± 9.8 1.0 40.7 28.8 22.1 6.8 0.5
IT 604 29.5/70.4/0.2 29.5 ± 9.2 1.3 33.6 28.1 28.8 6.8 1.3
NO 681 47.6/52.3/0.1 37.1 ± 12.6 0.4 12.0 18.1 40.1 23.2 6.2
ZA 582 41.8/58.1/0.2 35.4 ± 14.1 0.0 27.8 31.8 23.4 13.9 3.1
USA 1 928 52.7/46.8/0.5 40.6 ± 13.1 0.1 9.8 42.1 31.8 14.2 2.1
Total 9 394 50.9/48.9/0.2 32.6 ± 11.6 1.2 15.2 42.3 28.3 10.6 2.3
Table 3
Values of Cronbach’s alpha (internal consistency) for the responses related to each survey question.
Question A Question B Question C Question Question Question
Before During Before During Before During D E F
Cronbach’s alpha .839 .799 .606 .686 .747 .739 .834 .888 .820
Fig. 5. Change in mobility frequency due to the travel restrictions according to the scale “1 = never”, “2 = less than 1
time/month”, “3 = 1 time/month”, “4 = 2–3 times/month”, “5 = 1 time/week”, “6 = 2–3 times/week”, “7 = more than 3
times/week”; mean values and standard deviations for “walk” transport mode (Question B).
Fig. 6. Cognitive perceptions according to the scale varying from “1 = extremely low/ineffective” to “7 = extremely
high/effective”; mean values and standard deviations for “walk” transport mode (Question D and Question E).

D.M. Barbieri, B. Lou and M. Passavanti et al. / Data in Brief 33 (2020) 106459 11
Fig. 7. Expected time necessary for the transportation sector to recover according to the scale “1 = less than 3 months”,
“2 = between 3 and 6 months”, “3 = between 6 and 12 months”, “4 = between 12 and 18 months”, “5 = between 18 and 24
months”, “6 = more than 24 months”; mean values and standard deviations (Question F).
2. Experimental Design, Materials and Methods
The data were collected in Australia, Brazil, China, Ghana, India, Iran, Italy, Norway, South
Africa and the United States with an online survey hosted on Google Forms and WenJuanX-
ing platforms. The same questionnaire was conveniently translated into Chinese, English, Ital-
ian, Norwegian, Persian, Portuguese and was distributed via email, social media and professional
networks using a combination of purposive and snowball techniques [15] . Members of the re-
search team shared or posted a link of the survey, along with the purpose of the study, using
methods that included, but were not limited to, group lists, social media platforms and personal
correspondences. Given the time-sensitive nature of this study, the non-stratified nature of the
responses allowed for a relatively easy means of implementation. The dataset was generated
during the period from the 11st and the 31st May 2020 (single cross-sectional survey), with
daily supervision and appropriate cleaning measures implemented to remove cases of obviously
unrealistic responses. The final number of accepted survey participants was 9 394. Because of
the international nature of the questionnaire, the survey was designed to be flexible enough for
rapid deployment and, at the same time, for application in local contexts.
Overall, the survey content was related to two topics. The first part dealt with the mobility
habits before and during the enforcement of the travel restriction measures, where respondents
have reported on their use of all the transport modes (Questions A, B, C). Matrix-level ques-
tions have been deployed to investigate modal share derived from three main activity patterns:
work/education, free-time and leisure travels [16] . The second part collected information regard-
ing the perceived risks regarding the probability of contracting the virus from particular trans-
portation systems and the perceived effectiveness of travel restrictions, as well as the amount
of time necessary for the transportation sector to recover (Questions D, E, F). Respondents have
expressed their perceptions according to Likert scales. Overall, the survey responses referring to
the condition “before” the pandemic are not likely to be biased as, notwithstanding the possi-
ble distortions or telescoped facts typical of human memory [17–20] , retrospective questions are
deemed to be reliable up to about a year [21 , 22] .
When employing the data for socioeconomic modeling, it is important to highlight some
caveats typical of this survey investigation approach: the overall survey sample, albeit substan-
tial, was skewed from the overall population demographic composition and, therefore, the entire
survey sample should only be considered as indicative of the actual perception of the general
public. Anyway, the data belonging to the overall dataset can be easily stratified to create new
subdatasets if one would like to build a pool of responses meeting some given demographic
criteria. Furthermore, inadequate internet connections may have been encountered in develop-
ing countries during the survey.

12 D.M. Barbieri, B. Lou and M. Passavanti et al. / Data in Brief 33 (2020) 106459
r
[
2
t
c
E
s
C
s
L
W
v
i
c
r
B
L
v
I
g
D
c
c
S
D
m
c
w
A
s
C
D
t
s
d
S
A
Finally, the survey dataset presented here is the major companion of another survey dataset
eferring to the perceived air quality “before” and “during” the pandemic-related restrictions
23] . As the two datasets were formed at the same time (between the 11st and the 31st May
020) but made available at two different times due to the time needed by the research team
o organize and timely present the collected responses, further analyses can be performed by
onsidering these two datasets simultaneously.
thics Statement
All the survey respondents have informed their consent before joining the questionnaire con-
istent with the Declaration of Helsinki.
RediT Author Statement
Diego Maria Barbieri: Conceptualization, Methodology, Formal analysis, Investigation, Re-
ources,Data curation, Writing - Original Draft, Visualization, Project administration; Baowen
ou: Conceptualization, Methodology, Formal analysis, Investigation, Resources,Data curation,
riting - Original Draft, Visualization; Marco Passavanti: Conceptualization, Methodology, In-
estigation, Writing - Original Draft, Visualization; Cang Hui: Investigation, Data curation, Writ-
ng - Review & Editing, Visualization, Supervision; Daniela Antunes Lessa: Investigation, Data
uration; Brij Maharaj: Investigation, Data curation; Arunabha Banerjee: Investigation, Data cu-
ation; Fusong Wang: Investigation, Data curation; Kevin Chang Investigation, Data curation;
haven Naik: Investigation, Data curation; Lei Yu: Investigation, Data curation; Zhuangzhuang
iu: Investigation, Data curation; Gaurav Sikka: Investigation, Data curation; Andrew Tucker: In-
estigation, Data curation; Ali Foroutan Mirhosseini: Investigation, Data curation; Sahra Naseri:
nvestigation, Data curation; Yaning Qiao: Investigation, Data curation; Akshay Gupta: Investi-
ation, Data curation; Montasir Abbas: Investigation, Data curation; Kevin Fang: Investigation,
ata curation; Navid Ghasemi: Investigation, Data curation; Prince Peprah: Investigation, Data
uration; Shubham Goswami: Investigation, Data curation; Amir Hessami: Investigation, Data
uration; Nithin Agarwal: Investigation, Data curation; Louisa Lam: Investigation, Data curation;
olomon Adomako: Investigation, Data curation.
eclaration of Competing Interest
This research has not received any specific grant from funding agencies in the public, com-
ercial, or not-for-profit sectors. The authors declare that they have no known competing finan-
ial interests or personal relationships which have or could be perceived to have influenced the
ork reported in this article.
cknowledgments
The precious support kindly provided by the following academics, researchers and profes-
ionals has been greatly appreciated: Mr. Fabio Selva (Heilongjiang International University,
hina), Mr. Marius Tangerås (Norwegian National Railway Administration Bane NOR, Norway),
r. Azadeh Lak (Shahid Beheshti University, Iran), Dr. Barbara Stolte Bezerra (Universidade Es-
adual Paulista, Brazil), Dr. Xiaolong Sun (Guangdong University of Technology, China), Dr. Ka-
un Wijayaratna (University of Technology Sydney, Australia), Dr. Abdul Rahaman (Bharathi-
asan University, India), Dr. Dok Yen David Mbabil (Tamale Technical University, Ghana), Mr.
mit Bharat Thakkar (Queensland University of Technology, Australia), Mr. Solomon Kwadwo
chinah (University of Cape Coast, Ghana), Dr. Olaf Weyl (South African Institute for Aquatic
D.M. Barbieri, B. Lou and M. Passavanti et al. / Data in Brief 33 (2020) 106459 13
Biodiversity, South Africa), Mr. Ayush Dhankute (Atkins Ltd., India), Mr. Mohammadreza Zare
Reisabadi (University of Adelaide, Australia), Dr. Sachin Gunthe (Indian Institute of Technology
Madras, India), Dr. Issam Qamhia (University of Illinois at Urbana-Champaign, United States), Dr.
Parama Bannerji (West Bengal College, India), Mr. Amirhosein Mousavi (University of Southern
California, United States), Mr. Anshu Bamney (Rewa Engineering College, India), Dr. Yuefeng Zhu
(Shijiazhuang Tiedao University, China), Dr. Jorge Ubirajara Pedreira Junior (Federal University
of Bahia, Brazil), Dr. Andrea Colagrossi (Politecnico di Milano, Italy), Ms. Soumi Sarkar (Indian
Institute of Technology Guwahati, India) and Dr. Akhilesh Kumar Maurya (Indian Institute of
Technology Guwahati, India).
References
[1] WHO, Coronavirus disease (COVID-19) pandemic, (2020). https://www.who.int/emergencies/diseases/
novel-coronavirus-2019 (accessed August 1, 2020). [2] T. Acter, N. Uddin, J. Das, A. Akhter, T.R. Choudhury, S. Kim, Evolution of severe acute respiratory syndrome coro-
navirus 2 (SARS-CoV-2) as coronavirus disease 2019 (COVID-19) pandemic: a global health emergency, Sci. TotalEnviron. 730 (2020) 138996, doi: 10.1016/j.scitotenv.2020.138996 .
[3] WHO, Coronavirus disease (COVID-19) dashboard, (2020). https://covid19.who.int/ (accessed August 1, 2020).
[4] A. Browne, S.S. t. O. Ahmad, C.R. Beck, J.S. Nguyen-Van-Tam, The roles of transportation and transportation hubs inthe propagation of influenza and coronaviruses: a systematic review, J. Travel Med 23 (2016) 1–7, doi: 10.1093/jtm/
tav002 . [5] C.R. Wells, P. Sah, S.M. Moghadas, A. Pandey, A. Shoukat, Y. Wang, Z. Wang, L.A. Meyers, B.H. Singer, A.P. Galvani,
Impact of international travel and border control measures on the global spread of the novel 2019 coronavirusoutbreak, Proc. Natl. Acad. Sci. USA. 117 (2020) 7504–7509, doi: 10.1073/pnas.2002616117 .
[6] J. de Vos, The effect of COVID-19 and subsequent social distancing on travel behavior, Transp. Res. Interdiscip. Per-spect. 5 (2020) 100121, doi: 10.1016/j.trip.2020.100121 .
[7] A. Wilder-Smith, D.O. Freedman, Isolation, quarantine, social distancing and community containment: pivotal role
for old-style public health measures in the novel coronavirus (2019-nCoV) outbreak, J. Travel Med 27 (2020) 1–4,doi: 10.1093/jtm/taaa020 .
[8] C. Musselwhite, E. Avineri, Y. Susilo, Editorial JTH 16 –The Coronavirus disease COVID-19 and implications for trans-port and health, J. Transp. Heal. 16 (2020) 4–7, doi: 10.1016/j.jth.2020.100853 .
[9] J. Troko, P. Myles, J. Gibson, A. Hashim, J. Enstone, S. Kingdon, C. Packham, S. Amin, A. Hayward, J.N. Van-Tam, Is public transport a risk factor for acute respiratory infection? BMC Infect. Dis. 11 (2011) 2–7, doi: 10.1186/
1471- 2334- 11- 16 .
[10] H. Müggenburg, A. Busch-Geertsema, M. Lanzendorf, Mobility biographies: a review of achievements and challengesof the mobility biographies approach and a framework for further research, J. Transp. Geogr. 46 (2015) 151–163,
doi: 10.1016/j.jtrangeo.2015.06.004 . [11] R. Schoenduwe, M.G. Mueller, A. Peters, M. Lanzendorf, Analysing mobility biographies with the life course calendar:
a retrospective survey methodology for longitudinal data collection, J. Transp. Geogr. 42 (2015) 98–109, doi: 10.1016/j.jtrangeo.2014.12.001 .
[12] S.A. Abdulkareem, E.W. Augustijn, T. Filatova, K. Musial, Y.T. Mustafa, Risk perception and behavioral change during
epidemics: comparing models of individual and collective learning, PLoS ONE 15 (2020) 1–22, doi: 10.1371/journal.pone.0226483 .
[13] Oxford University, Coronavirus government response tracker, (2020). https://www.bsg.ox.ac.uk/research/ research-projects/coronavirus-government-response-tracker (accessed August 1, 2020).
[14] W. Brög, Surveys on daily mobility are not “surveys to go,”, Transp. Res. Procedia. 11 (2015) 98–107, doi: 10.1016/j.trpro.2015.12.009 .
[15] D. Stockemer, Quantitative Methods for the Social Sciences, Springer, Cham, 2019, doi: 10.1007/978- 3- 319- 99118- 4 .
[16] A. Kramer, K.Z. Kramer, The potential impact of the Covid-19 pandemic on occupational status, work from home,and occupational mobility, J. Vocat. Behav. 119 (2020) 1–4, doi: 10.1016/j.jvb.2020.103442 .
[17] A.J. Barsky, Forgetting, fabricating, and telescoping, Arch. Intern. Med. 162 (2002) 981, doi: 10.1001/archinte.162.9.981 .
[18] S.S. Coughlin, Recall bias in epidemiologic studies, J. Clin. Epidemiol. 43 (1990) 87–91, doi: 10.1016/0895-4356(90)90060-3 .
[19] E. Jaspers, M. Lubbers, N.D. De Graaf, Measuring once twice: an evaluation of recalling attitudes in survey research,
Eur. Sociol. Rev. 25 (2009) 287–301, doi: 10.1093/esr/jcn048 . [20] H. Solga, Longitudinal surveys and the study of occupational mobility: panel and retrospective design in compari-
son, Qual. Quant. 35 (2001) 291–309, doi: 10.1023/A:1010387414959 . [21] L. Hipp, M. Bünning, S. Munnes, A. Sauermann, Problems and pitfalls of retrospective survey questions in COVID-19
studies, Surv. Res. Methods. 14 (2020) 109–114, doi: 10.18148/srm/2020.v14i2.7741 . [22] T.W. Smith, Recalling attitudes: an analysis of retrospective questions on the 1982 GSS, Public Opin. Q. 48 (1984)
639–649, doi: 10.1086/268865 .
[23] D.M. Barbieri, B. Lou, M. Passavanti, C. Hui, D.A. Lessa, B. Maharaj, A. Banerjee, F. Wang, K. Chang, B. Naik, L. Yu,Z. Liu, G. Sikka, A. Tucker, A. Foroutan Mirhosseini, S. Naseri, Y. Qiao, A. Gupta, M. Abbas, K. Fang, N. Ghasemi,
P. Peprah, S. Goswami, A. Hessami, N. Agarwal, L. Lam, S. Adomako, Survey data regarding perceived air quality inAustralia, Brazil, China, Ghana, India, Iran, Italy, Norway, South Africa, United States before and during COVID-19
restrictions, Data Br 32 (2020) 106169, doi: 10.1016/j.dib.2020.106169 .


![Probabilistic Matrix Factorization for Automated … that is more expensive to evaluate. More recently, Feurer et al. [2015] used optimization "traces" from related dataset as initialization](https://img.pdfslide.us/doc/110x75/5aae64197f8b9a59478c028a/probabilistic-matrix-factorization-for-automated-that-is-more-expensive-to-evaluate.jpg)
![Stanford University · 3.1 Dataset SQuAD dataset is a machine comprehension dataset on Wikipedia articles with more than 100,000 questions [1]. The dataset is randomly partitioned](https://img.pdfslide.us/doc/110x75/602d75745c2a607275039f53/stanford-university-31-dataset-squad-dataset-is-a-machine-comprehension-dataset.jpg)