Embed Size (px)
Citation preview
PNNL-17497
Prepared for the U.S. Department of Energy under Contract DE-AC05-76RL01830
A Summary of Fault Recurrence and Strain Rates in the Vicinity of the Hanford Site
Topical Report BN Bjornstad K Winsor SD Unwin August 2012
PNNL-17497
A Summary of Fault Recurrence and Strain Rates in the Vicinity of the Hanford Site Topical Report BN Bjornstad K Winsor SD Unwin August 2012 Prepared for the U.S. Department of Energy under Contract DE-AC05-76RL01830 Pacific Northwest National Laboratory Richland, Washington 99352

iii
Abstract
This document is one in a series of three topical reports compiled by the Pacific Northwest National Laboratory to summarize technical information on selected topics important to the performance of a probabilistic seismic hazard analysis of the Hanford Site. The data used to compile this report are based on scientific studies and a literature search current through 2008.
The purpose of this report is to summarize available data and analyses relevant to fault recurrence and strain rates within the Yakima Fold Belt. Strain rates have met with contention in the expert community and may have a significant potential for impact on the seismic hazard estimate at the Hanford Site.
This report defines alternative conceptual models relevant to this technical issue and the arguments and data that support those models. It provides a brief description of the technical issue and principal uncertainties; a general overview on the nature of the technical issue, along with alternative conceptual models, supporting arguments and information, and uncertainties; and finally, suggests some prospective approaches to reducing uncertainties about earthquake recurrence rates for the Yakima Fold Belt.

v
Acronyms and Abbreviations
ACM alternative conceptual model
BP before present
CLEW Cle Elum-Wallula lineament
CRB Columbia River Basalt
CRBG Columbia River Basalt Group
DOE U.S. Department of Energy
GMA ground motion attenuation
GPS Global Positioning System
ka kilo-annum; thousands of years before present
kyr kiloyear(s); one thousand years
LiDAR light detection and ranging
Ma mega-annum; millions of years before present
m/my meters per million years
mm/yr millimeters per year
my 1 million years
NGA next generation attenuation
OSL optically stimulated luminescence
OWL Olympic-Wallowa lineament
PSHA probabilistic seismic hazard analysis
PNNL Pacific Northwest National Laboratory
RAW Rattlesnake-Wallula alignment
SSC seismic source characterization
SSHAC Senior Seismic Hazard Analysis Committee
TI technical integrator
TR topical report
WFZ Wallula fault zone
YFB Yakima Fold Belt

vii
Glossary of Terms
deformation rate – see strain rate.
growth rate – rate of the vertical component of strain or deformation – Determined via amount of structural relief, measured along a geologic structure (i.e., fold or fault). Measured in millimeters per year.
recurrence interval – the average period of time between occurrence of earthquakes of a given size on a particular fault (Reiter 1990, p. 64).
recurrence rate – usually expressed as the average number of events greater than or equal to a certain magnitude per unit time – Recurrence may be referred to also as recurrence interval.
slip rate – net displacement along a fault plane averaged over a certain period of time – Because most faults dip at an oblique angle, slip rates normally are greater than either the vertical or horizontal strain rate. Measured in millimeters per year.
strain rate – relative movement of the Earth surface averaged over a certain period of time – Same as deformation rate. Measured in millimeters per year in either the vertical or horizontal direction.

ix
Contents
Abstract ................................................................................................................................................. iii
Acronyms and Abbreviations ............................................................................................................... v
Glossary of Terms ................................................................................................................................. vii
1.0 Introduction .................................................................................................................................. 1.1
1.1 Programmatic Background ................................................................................................... 1.1
1.2 Selection of Topical Report Issues ....................................................................................... 1.2
1.3 Report Objectives and Structure .......................................................................................... 1.4
2.0 Technical Background .................................................................................................................. 2.1
2.1 Strain Rate ............................................................................................................................ 2.2
2.2 Recurrence Rate ................................................................................................................... 2.7
2.3 Geologic Record of Stress and Strain................................................................................... 2.10
2.3.1 Reported Slip and Recurrence Rates of Exposed Quaternary Faults Within the Yakima Fold Belt .................................................................................... 2.13
2.3.2 Contemporary Stress and Strain ................................................................................ 2.17
2.4 Principal Uncertainties ......................................................................................................... 2.20
3.0 Technical Positions ....................................................................................................................... 3.1
3.1 Alternative Conceptual Model 1 .......................................................................................... 3.1
3.2 Alternative Conceptual Model 2 .......................................................................................... 3.2
3.3 Alternative Conceptual Model 3 .......................................................................................... 3.3
4.0 Approaches to Reducing Uncertainty ........................................................................................... 4.1
4.1 Apply Promising New Age-Dating Techniques ................................................................... 4.1
4.2 Conduct Aerial LiDAR Survey ............................................................................................ 4.1
4.3 Continue Investigations of Known or New Exposed Faults ................................................ 4.2
4.4 Conduct Supplemental Geomorphic Analyses ..................................................................... 4.2
5.0 Cited References ........................................................................................................................... 5.1
Appendix A – Identification of Topical Reports to Be Prepared for the Future Hanford Site-Wide Probabilistic Seismic Hazard Analysis ......................................................... A.1
Appendix B – Annotated Bibliography ................................................................................................ B.1
Appendix C – Summary of Known or Suspected Quaternary Faults Within the Yakima Fold Belt ................................................................................................................... C.1
Appendix D – Detailed Description of the Goose Hill Fault ................................................................ D.1
x
Figures
2.1 Displacement Along Hypothetical Low-Angle Reverse (Thrust) Fault Within the Yakima Fold Belt ........................................................................................................ 2.3
2.2 Growth Rates and Tectonic Rotation Within the Saddle Mountains ............................................ 2.6
2.3 Locations of Known or Suspected Quaternary Faults Listed in Table 2.4 and Appendix C ............................................................................................................ 2.9
2.4 Recurrence Rate Based on Observed Shallow Seismicity for the Central Yakima Fold Belt with That Predicted Using Uncoupled, Fold-Model Source Parameters ...................................... 2.10
2.5 Closeup of Fault Displacement on Goose Hill Fault .................................................................... 2.16
2.6 Modern geodetic tectonic deformation measured in the Pacific Northwest ................................. 2.19
4.1 Lineaments Identified via an Aerial LiDAR Survey in Puget Sound ........................................... 4.2
Tables
2.1 Long-Term Growth Rates of Vertical Uplift Along Individual Yakima Fold Belt Structures ..... 2.4
2.2 Growth Versus Horizontal Shortening Along Yakima Fold Belt Structures ................................ 2.5
2.3 Other Long-Term Vertical Strain Rates Reported for the Yakima Fold Belt ............................... 2.6
2.4 Known Quaternary-Age Faults with Data Available on Slip Rate and/or Recurrence Interval Within the Yakima Fold Belt ........................................................................................................ 2.8
2.5 Fault Events Associated with the Mill Creek Thrust Fault, Toppenish Ridge .............................. 2.14
2.6 Fault Events Associated with the Ahtanum Ridge Fault .............................................................. 2.15
2.7 Published Geodetic Strain Rates ................................................................................................... 2.17
2.8 Uncertainties in Slip Rates and Recurrence Intervals ................................................................... 2.20
1.1
1.0 Introduction
This document is one in a series of three topical reports (TRs) compiled by the Pacific Northwest National Laboratory (PNNL). Based on scientific investigations and a literature search performed up to 2008, the TRs are intended as technical resources in the performance of a probabilistic seismic hazard analysis (PSHA) of the Hanford Site. The purpose of this report is to summarize available data and analyses relevant to fault recurrence and strain rates within the Yakima Fold Belt (YFB). Strain rates have met with contention in the expert community and may have a significant potential for impact on the seismic hazard estimate at the Hanford Site. The other two TRs address additional technical issues pertinent to a seismic hazard analysis of the Hanford Site, including the behavior of the YFB as a structural entity (Last et al. 2012) and angulation of the coupled versus uncoupled tectonic models proposed for the YFB (Chamness et al. 2012).
1.1 Programmatic Background
In conducting any PSHA, there are numerous sources of technical uncertainty. Among such sources are individual technical issues about which the appropriate resolution is uncertain and, often, about which there are opposing viewpoints and contention in the technical community. The Senior Seismic Hazard Analysis Committee (SSHAC) guidance for conducting PSHAs, to which the Hanford study will adhere, recommends that such uncertainties be characterized by the attachment of probabilities to the alternative resolutions of the issues (Budnitz et al. 1977).
These probabilities, which represent so-called epistemic uncertainties—that is, uncertainties reflecting limitations in technical knowledge—can be generated in one of several ways. The SSHAC guidance identifies four alternative bases for generating epistemic probabilities. These alternative methods are denoted as SSHAC Levels 1 through 4, representing increasing degrees of formality and effort. The SSHAC levels selected for the Hanford Site PSHA are
SSHAC Level 3 for the seismic source characterization (SSC) elements of the analysis SSHAC Level 2 for the ground motion attenuation (GMA) modeling elements of the analysis.
The rationale for the selection of these SSHAC levels is documented elsewhere.1 For both Level 3 and Level 2 studies, the technical integrator (the TI, where the SSC and GMA elements of the Hanford PSHA each will have its own TI) has ultimate responsibility for development of the epistemic probabilities assigned within each of the technical issues. Per SSHAC guidance, these probabilities must reflect the range of opinions held in the expert technical community. The principal distinction between the Level 3 and Level 2 approaches is that, in the former, the TI assembles a panel of subject matter experts who meet physically to discuss the technical issues for which uncertainties or conflicting opinions exist. This dialog, along with any subsequent communications, provides the basis for the TI to attach the appropriate probabilities to the alternative issue resolutions. In contrast, a Level 2 analysis relies on less formal interactions of the TI with the subject matter experts, generally involving written and telephone communication, based on which the TI formulates the appropriate probabilities.
1 Draft PSHA Work Plan, June 11, 2007, prepared by Kevin J. Coppersmith, Coppersmith Consulting, for Pacific Northwest National Laboratory under Contract 42259.
1.2
The purpose of the TRs is to provide a convenient encapsulation of technical information to serve as a resource to the TI and the subject matter experts in their deliberations. Each TR addresses a single technical issue (or family of related issues) of relevance to the PSHA. The criteria for selection of technical issues for the TRs are described in the next subsection.
The intent of a TR is not to advocate a specific resolution to a technical issue; that is, a TR is not intended to conclude that, despite contention in the technical community, one technical resolution should be preferred to another. Instead, the intent is to lay out the range of expert opinions and competing technical resolutions, and to identify the data and analyses that have been judged within the expert community to support each of these alternative resolutions. Thus, a TR does not advocate a specific viewpoint on the technical matter it expounds, but, rather, is prepared as a convenience for the TI and team by assembling relevant data and analyses upon which they may deliberate.
1.2 Selection of Topical Report Issues
The conduct of a PSHA demands that varying degrees of uncertainty about numerous technical issues be addressed and reflected in the seismic hazard model. Uncertainty on the part of a PSHA TI with regard to the appropriate technical resolution of an issue can be the result of one of two situations:
Case 1. There is broad consensus among the technical community that uncertainty exists regarding the appropriate technical resolution of an issue.
Case 2. A range of competing opinions is held within the technical community regarding the appropriate resolution of a technical issue. In this case, any one member of the expert community may strongly favor a particular resolution, and the TI’s uncertainty stems from the question of which competing opinion reflects the correct resolution of the issue.
Modeling the uncertainties associated with Case 1 is the more straightforward task because the TI can adopt the consensus view of the expert community. Case 2 is more problematic because the TI is left to evaluate the range of competing opinions and, based upon that evaluation (for SSHAC Level 2 and Level 3 studies), develop a probabilistic characterization of uncertainty for the subject issue. Given that this latter situation is the more challenging for the TI, the TR topics were selected to focus on issues that are defined by Case 2.
Another discriminating factor in technical uncertainties is the degree to which uncertainty about a specific issue contributes to the resultant uncertainty in the seismic hazard. That is, some technical uncertainties are more important than others with respect to their impact on the results of the PSHA. Therefore, in selecting the issues addressed in the TRs, both the following criteria had to be met:
1. The issue is important to the seismic hazard. That is, the sensitivity of the calculated seismic hazard to the specific resolution of the issue is significant. Equivalently, uncertainty in the appropriate resolution of the issue results in a significant contribution to the total uncertainty in the estimate of the seismic hazard
2. The correct resolution of the issue is a matter of contention in the expert community. That is, there are opposing schools of thought on the correct resolution, in contrast to a situation in which there is broad agreement that the correct resolution is uncertain.
1.3
As a first step in identifying TR topics, Coppersmith Consulting developed a set of technical issues (Appendix A) expected to contribute to uncertainty in the seismic hazard at the Hanford site. In that analysis, Coppersmith characterized qualitatively (in terms of high, medium, and low categories) each issue with regard to
its anticipated importance to the hazard; that is, the degree to which it would be expected to contribute to the uncertainty in the seismic hazard – This evaluation was based not on the performance of detailed sensitivity analyses but rather on a limited base of existing sensitivity analyses for the technical issue as well as on the broad experience of the consultant in conducting PSHAs.
the level of contention within the technical community regarding resolution to the issue.
Both SSC and GMA modeling issues were included in this evaluation. The SSC issue list drew primarily on the technical review by Zachariasen et al. (2006), on behalf of the U.S. Army Corps of Engineers, of the previous PSHA of the Hanford Site (Geomatrix 1996). The list of GMA issues was based on the experience of the consultant Coppersmith and his discussions with ground motion specialists.
Based on this list of issues and the associated assessments of importance and levels of contention (Appendix A), PNNL personnel, supported by Coppersmith and Steve Reidel (a geology consultant with Washington State University), applied the selection criteria described previously to determine which technical issues would be addressed in the TRs. Three issues were identified as meeting the selection criteria, all of which are related to SSC. Although certain GMA issues, such as those associated with the next generation attenuation (NGA) models, were identified as having the potential to have significant impact on uncertainty in the seismic hazard analysis, these issues were not assessed to be sources of significant contention within the expert community. The three SSC issues selected as TR topics (Appendix A) were
whether coupled or uncoupled tectonic models should be used for the YFB – The 1996 PSHA of the Hanford Site (Geomatrix 1996) attached greater weight to the model in which the faults coring the Yakima folds are unconnected to the faults in the basement. This weighting was questioned in the review of the PSHA model by Zachariasen et al. (2006). This issue is addressed in a companion TR by Chamness et al. (2012).
whether observation of activity along one Yakima fold structure should be considered an indicator of behavior along all Yakima fold structures – The 1996 PSHA of the Hanford Site (Geomatrix 1996) was based on the assumption that if one fold structure were active, then this did not necessarily imply that all Yakima fold structures were active. This assumption was questioned in the review of the PSHA model by Zachariasen et al. (2006).
whether the uncertainty ranges in recurrence rates should be wider than those used in the previous Hanford PSHA, which were based on post-Columbia River Basalt Group ages – This issue was raised in the review of the 1996 PSHA model by Zachariasen et al. (2006). This issue is addressed in a companion TR by Last et al. (2012).
This current TR addresses whether recurrence rates on faults should be greater than those used in the previous Hanford PSHA, which were based on post-Columbia River Basalt Group ages. Because of the paucity of published recurrence rates for the Yakima Fold Belt (YFB), slip (i.e., strain) rates are also
1.4
reported in this TR as an alternative measure and indicator of seismicity and fault activity. The issue has been rated moderate to high in its impact on the seismic hazard because the hazard varies proportionally with recurrence rate (Appendix A). Therefore, the sensitivity of the calculated seismic hazard to the specific resolution of the issue is significant. Uncertainty in the appropriate resolution on rate of recurrence of Quaternary-age faulting and slip rates results in a significant contribution to the total uncertainty in the estimate of the seismic hazard. This issue affects the SSC.
This TR presents the available data that pertains to recurrence rates and slip rates on known Quaternary-age faults within the Columbia Basin and YFB of eastern Washington State. Also discussed is contemporary tectonic deformation based on geodetic strain rates measured via the Global Positioning System (GPS).
The Quaternary Period currently is defined as that time between 1.6 million years ago (Ma) and present. The Quaternary includes the Pleistocene (10,000 years to 1.6 million years before present [BP]) and Holocene (10,000 years ago to present) epochs—that is, the period since the last Ice Age. Recent scientific debate has proposed extending the Quaternary back to the beginning of the Ice Age (~2.6 million years ago) (Pillans and Naish 2004). This is significant because, if adopted, it would proportionally expand the time interval covered by the Quaternary Period by a third, potentially requiring a redefinition of the period of time over which fault activity is expected to be evaluated.
The correct resolution of the issue—the appropriate estimation of fault-recurrence rates—is a matter of low to moderate contention in the expert community (Appendix A). That is, there are opposing schools of thought on the correct resolution, in contrast to a situation in which there is broad agreement that the correct resolution is uncertain. On the other hand, the issue has moderate to high potential for impact on the seismic hazard estimate because seismic hazard varies linearly with fault recurrence. Thus, this issue is given importance.
1.3 Report Objectives and Structure
This topical report addresses the issue of strain rates and fault-recurrence rates for the YFB for which there are widely divergent sets of published numbers available. The objective of this report is to encapsulate the competing technical positions on this subject as a resource to analysts conducting a PSHA to determine the best way to numerically characterize the uncertainties.
The objectives of this topical report are to summarize the range of opinions on earthquake fault-recurrence rates and slip rates expressed by the expert community and to encapsulate the data and publications that support those opinions. Further, this report provides a summary and compilation of all identified applicable data and information that pertain to the issue of earthquake recurrence rates and long-term as well as short-term slip rates. Also considered are modern estimates of the strain rate based on geodetic measurements obtained over the last few decades. Comparison between modern, short-term, and long-term rates of tectonic deformation provides an independent means for determining confidence and verification between the two data sets.
The remainder of this report is structured as follows. Section 2 provides a brief description of the technical issue and principal uncertainties. Section 3 provides a general overview on the nature of the technical issue, alternative conceptual models, supporting arguments and information, and uncertainties. Section 4 suggests some possible approaches for reducing uncertainties regarding this issue. Section 5 is

1.5
a listing of the references cited in the main body of this report. Appendix A includes a description of the process and information used to identify the three TRs for preparation by PNNL. Appendix B is an annotated bibliography of literature sources relevant to the YFB issue. Appendix C, provided in electronic format, is an Excel spreadsheet that summarizes the information available on each known or suspected Quaternary-Age fault within the YFB. Appendix D provides a detailed discussion of the Goose Hill fault, which prior to this report has been undocumented.

2.1
2.0 Technical Background
Tectonic stress induced by converging plates along the Cascadia subduction zone are leading to strain, expressed as large-scale, clockwise, block rotation over the entire Pacific Northwest (McCaffrey et al. 2007) as well as localized north-south compression and rotation in the vicinity of the YFB (Reidel et al. 1989, 1994). Tectonic movements are founded on both the geologic record of the last 17 million years as well as recent geodetic measurements (Prescott and Savage 1984; Miller et al. 2001; McCaffrey et al. 2007) and earthquake focal-mechanism solutions (DOE 1988).
Within the YFB, tectonic stress is being released in the form of tectonic rotation, folding, fracturing, and faulting. Ongoing contraction across the region suggests that the Yakima folds are favorably oriented in the current strain field and accommodate the strain through active folding and possibly faulting (Zachariasen et al. 2006). Some tectonic deformation and strain release may be distributed aseismically throughout the rock column (Reidel et al. 1994) while other deformation may be concentrated along preferred planes of weakness (i.e., faults). The amount of fault displacement (i.e., slip) and the period of fault recurrence dictate the seismic hazard of the region. Larger faults produce more slippage along the fault plane and thus produce larger earthquakes and more ground motion. Faults with longer recurrence rates, which release less often, may generate higher-magnitude seismic events due to long-term build-up of stress.
The primary technical issue at the focus of this report as defined in Appendix A is
Recurrence rates may be higher than those estimated using post-Columbia River Basalt Group ages.
Slip rates and recurrence-rate data are critical factors in a probabilistic seismic hazard analysis of the Hanford Site. Seismic hazard is related to mostly periodic displacements along organized fault planes. Some confusion, however, exists with the use of the term slip rate. Geomatrix (1996) calculated slip rates based on the existing amount of structural relief on folds, assuming all deformation occurred along a single reverse fault active throughout the development of each of the Yakima folds (assuming a coupled YFB model). In the Geomatrix estimates, calculated slip rates varied depending on the attitude of this hypothetical fault. However, not all the deformation necessarily occurs along a single fault plane or results in seismicity. A certain amount of deformation may occur aseismically and be dispersed throughout the rock column without being limited to a single fault plane. Furthermore, in an uncoupled YFB model, a considerable amount of strain may take place prior to slippage along an organized fault plane, which may develop and produce seismicity only late in the stage of fold development. To date, a model for a coupled versus uncoupled tectonic deformation of the YFB has yet to be resolved; arguments for and against the two models are presented in a companion TR (Chamness et al. 2012).
Zachariasen et al. (2006) provide an overview of the issue of Quaternary recurrence rates (and associated strain rates) as they relate to seismic hazard. They argue that because slip rates are averaged over time extending back to the Miocene and the age of initiation of folding may be younger, the average slip rate may be underestimated and Quaternary slip rates may be greater. Their argument for greater Quaternary strain rates is based on contemporary GPS strain measurements that indicate deformation rates one to two orders of magnitude greater than those estimated using long-term average rates. To summarize, strain (slip) rates and recurrence rates have been estimated via
2.2
1. relative short-term motion within a GPS-instrumented geodetic network for the Pacific Northwest (horizontal component of strain only)
2. long-term rate based on differences in relief of geologic units; e.g., Miocene basalt flows, geomorphic surfaces (vertical component of strain only) – The horizontal component of slip can be determined from the vertical when a fault attitude is known or approximated.
3. paleomagnetic rotation of Miocene basalt flows (horizontal component of strain only)
4. measured offset along excavated fault planes with multiple dated horizons (vertical and horizontal components of strain as well as oblique component of fault slip).
True fault-slip rates can be measured only off exposed faults (estimation technique 4, above). However, due to the rarity of exposed faults and sparseness of known slip rates, average strain rates using the structural relief or tectonic rotation have been used as a less-than-perfect substitute or proxy for absolute fault-slip rates.
2.1 Strain Rate
The amount of tectonic deformation has been estimated based on a limited number of observed fault displacements as well as the amount of uplift, tilting, or folding of Miocene- to Quaternary-age deposits (Error! Reference source not found.). Growth rates for Yakima folds have been estimated using the amount of structural relief on basalt flows and/or geomorphic surfaces. Geomatrix (1996, Table 3-4) estimated fault-slip rates for each of the Yakima folds, ranging from 0.007 to 0.176 mm/yr (7 to 176 m/my), based on structural relief of the folds, presuming all deformation occurred along a single fault plane on each fold. Not all slip necessarily occurs along organized fault planes or a single plane, however. Further, without knowing how the entire structure has deformed, it is not possible to determine what proportion of the deformation occurred seismically along faults versus aseismically during folding or bending of the strata. Thus, the term slip rate used by Geomatrix (1996) is the same as the strain rate, without regard to the exact mode of deformation.
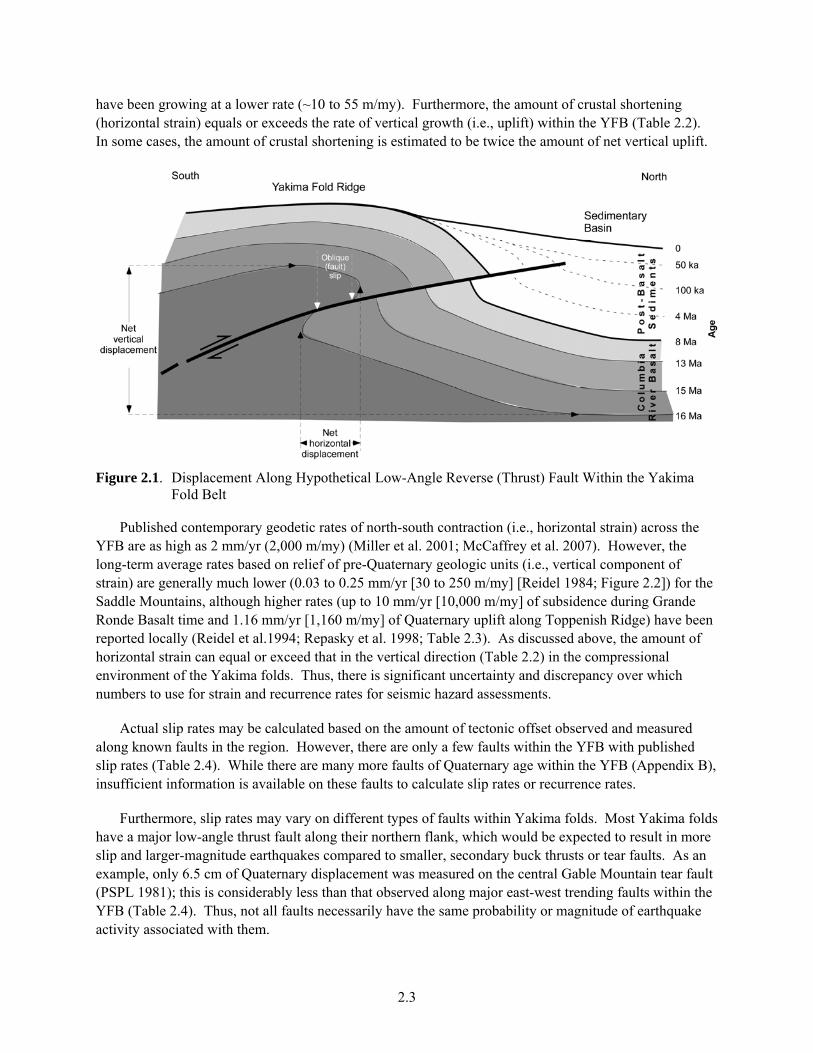
Structural relationships in Figure 2.1 indicate long-term cumulative deformation along the fault that last slipped between 50 to 100 ky before present. Knowing the ages of the rock and sediment units allows one to estimate the long-term rate of deformation as well as shorter-term slip rates and recurrence rate(s) for the fault. Dips on reverse faults, like the one illustrated in Figure 2.1, generally increase with depth from about 30 degrees to up to 70 degrees (Geomatrix 1996, p. 3-20).
Horizontal strain rates have been estimated based on the amount of crustal shortening or tectonic rotation during folding and faulting. Some or most of the crustal shortening may be from movements along low-angle reverse or thrust faults, but this is difficult to demonstrate in most cases. Thus, the horizontal strain rate is calculated based on either 1) fold geometry, 2) amounts of paleomagnetic tectonic rotation, or 3) recent GPS (geodetic) measurements, without knowing how much of the strain occurs seismically as slip along faults as opposed to how much occurs aseismically.
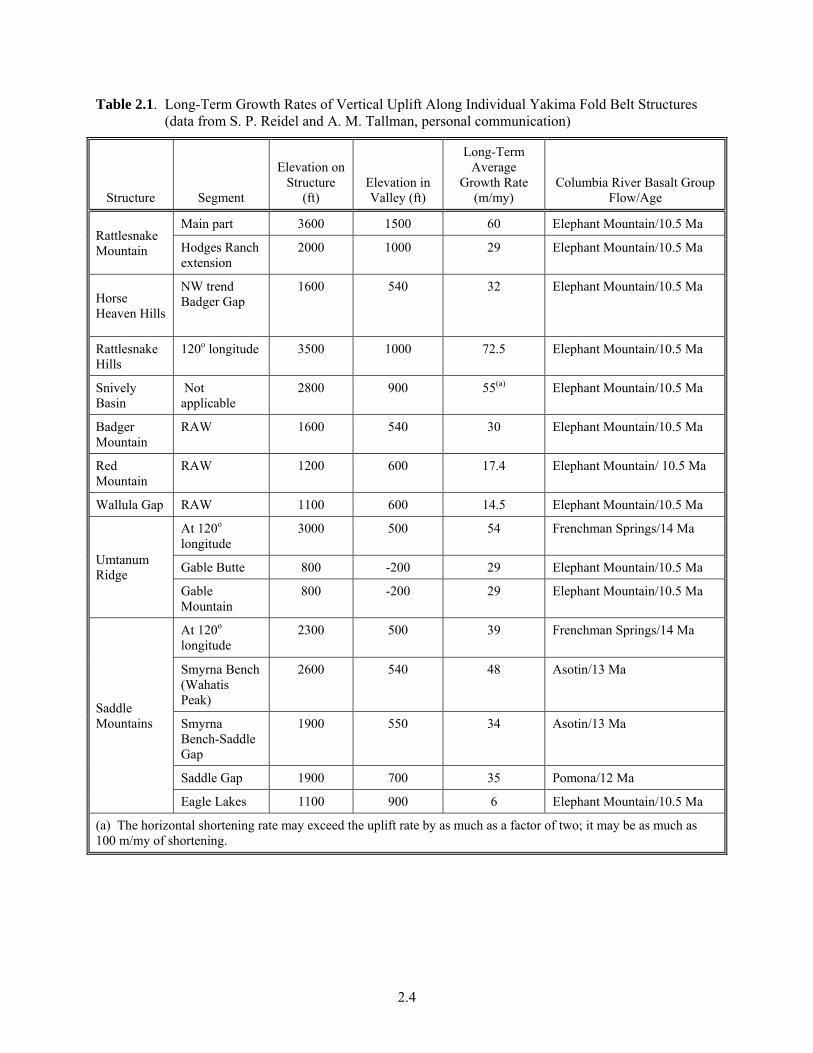
Calculated long-term growth rates for Yakima folds are low, typically less than 0.1 mm/yr (100 m/my) (Zacharisen et al. 2006). More detailed estimates of the long-term rates of net vertical uplift within the YFB are presented in Table 2.1. The maximum amount of uplift appears to be along the Rattlesnake Hills-Rattlesnake Mountain structure (60 to 72.5 m/my). Most of the other ridge structures
2.3
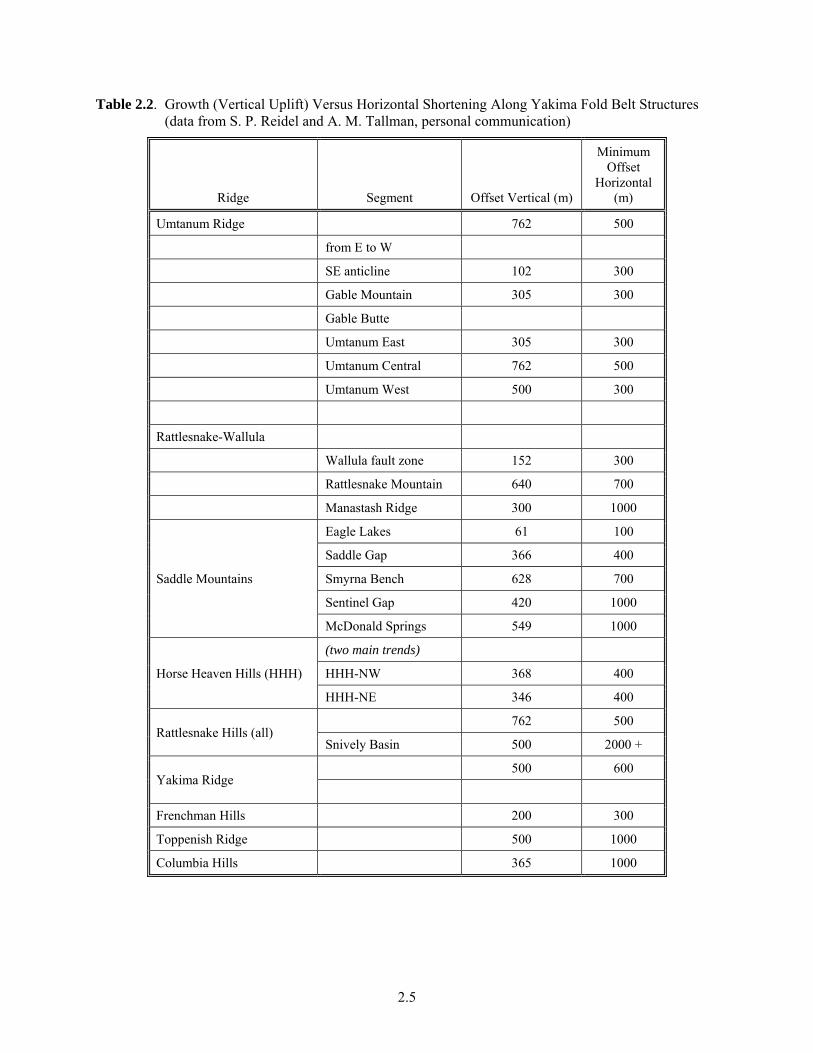
have been growing at a lower rate (~10 to 55 m/my). Furthermore, the amount of crustal shortening (horizontal strain) equals or exceeds the rate of vertical growth (i.e., uplift) within the YFB (Table 2.2). In some cases, the amount of crustal shortening is estimated to be twice the amount of net vertical uplift.
Figure 2.1. Displacement Along Hypothetical Low-Angle Reverse (Thrust) Fault Within the Yakima Fold Belt
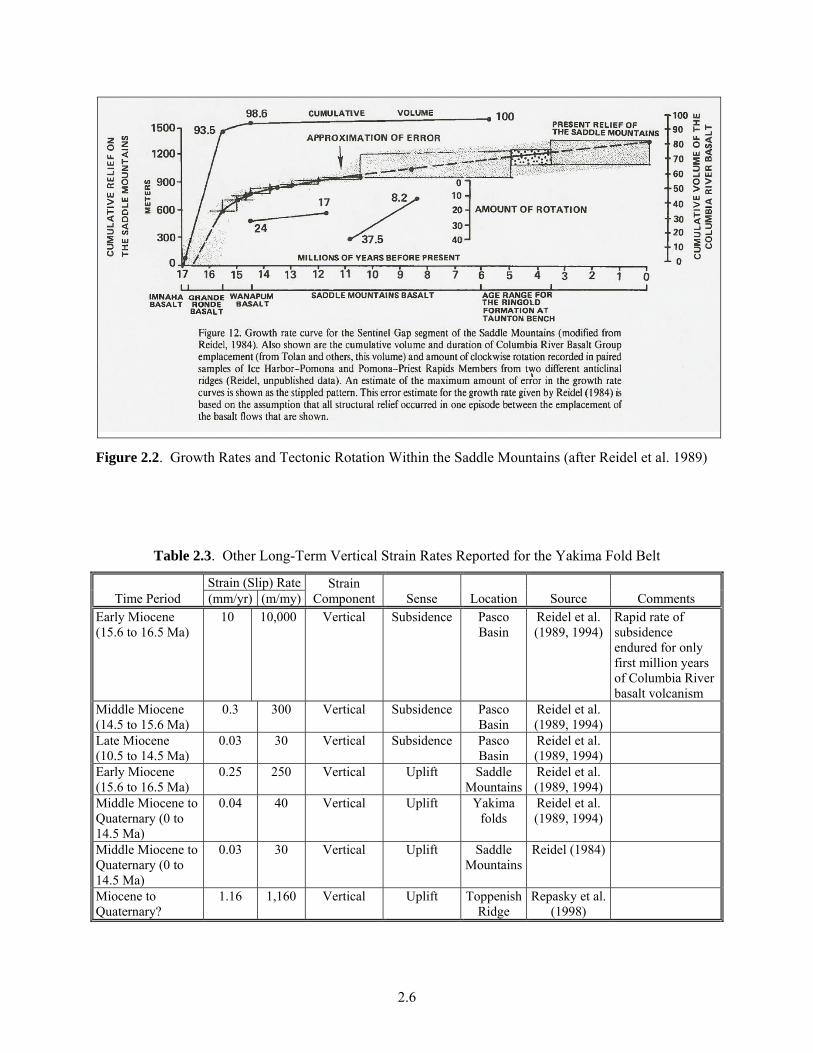
Published contemporary geodetic rates of north-south contraction (i.e., horizontal strain) across the YFB are as high as 2 mm/yr (2,000 m/my) (Miller et al. 2001; McCaffrey et al. 2007). However, the long-term average rates based on relief of pre-Quaternary geologic units (i.e., vertical component of strain) are generally much lower (0.03 to 0.25 mm/yr [30 to 250 m/my] [Reidel 1984; Figure 2.2]) for the Saddle Mountains, although higher rates (up to 10 mm/yr [10,000 m/my] of subsidence during Grande Ronde Basalt time and 1.16 mm/yr [1,160 m/my] of Quaternary uplift along Toppenish Ridge) have been reported locally (Reidel et al.1994; Repasky et al. 1998; Table 2.3). As discussed above, the amount of horizontal strain can equal or exceed that in the vertical direction (Table 2.2) in the compressional environment of the Yakima folds. Thus, there is significant uncertainty and discrepancy over which numbers to use for strain and recurrence rates for seismic hazard assessments.
Actual slip rates may be calculated based on the amount of tectonic offset observed and measured along known faults in the region. However, there are only a few faults within the YFB with published slip rates (Table 2.4). While there are many more faults of Quaternary age within the YFB (Appendix B), insufficient information is available on these faults to calculate slip rates or recurrence rates.
Furthermore, slip rates may vary on different types of faults within Yakima folds. Most Yakima folds have a major low-angle thrust fault along their northern flank, which would be expected to result in more slip and larger-magnitude earthquakes compared to smaller, secondary buck thrusts or tear faults. As an example, only 6.5 cm of Quaternary displacement was measured on the central Gable Mountain tear fault (PSPL 1981); this is considerably less than that observed along major east-west trending faults within the YFB (Table 2.4). Thus, not all faults necessarily have the same probability or magnitude of earthquake activity associated with them.
2.4
Table 2.1. Long-Term Growth Rates of Vertical Uplift Along Individual Yakima Fold Belt Structures (data from S. P. Reidel and A. M. Tallman, personal communication)
Structure Segment
Elevation on Structure
(ft) Elevation in Valley (ft)
Long-Term Average
Growth Rate (m/my)
Columbia River Basalt Group Flow/Age
Rattlesnake Mountain
Main part 3600 1500 60 Elephant Mountain/10.5 Ma
Hodges Ranch extension
2000 1000 29 Elephant Mountain/10.5 Ma
Horse Heaven Hills
NW trend Badger Gap
1600 540 32 Elephant Mountain/10.5 Ma
Rattlesnake Hills
120o longitude 3500 1000 72.5 Elephant Mountain/10.5 Ma
Snively Basin
Not applicable
2800 900 55(a) Elephant Mountain/10.5 Ma
Badger Mountain
RAW 1600 540 30 Elephant Mountain/10.5 Ma
Red Mountain
RAW 1200 600 17.4 Elephant Mountain/ 10.5 Ma
Wallula Gap RAW 1100 600 14.5 Elephant Mountain/10.5 Ma
Umtanum Ridge
At 120o longitude
3000 500 54 Frenchman Springs/14 Ma
Gable Butte 800 -200 29 Elephant Mountain/10.5 Ma
Gable Mountain
800 -200 29 Elephant Mountain/10.5 Ma
Saddle Mountains
At 120o longitude
2300 500 39 Frenchman Springs/14 Ma
Smyrna Bench (Wahatis Peak)
2600 540 48 Asotin/13 Ma
Smyrna Bench-Saddle Gap
1900 550 34 Asotin/13 Ma
Saddle Gap 1900 700 35 Pomona/12 Ma
Eagle Lakes 1100 900 6 Elephant Mountain/10.5 Ma
(a) The horizontal shortening rate may exceed the uplift rate by as much as a factor of two; it may be as much as 100 m/my of shortening.
2.5
Table 2.2. Growth (Vertical Uplift) Versus Horizontal Shortening Along Yakima Fold Belt Structures (data from S. P. Reidel and A. M. Tallman, personal communication)
Ridge Segment Offset Vertical (m)
Minimum Offset
Horizontal (m)
Umtanum Ridge 762 500
from E to W
SE anticline 102 300
Gable Mountain 305 300
Gable Butte
Umtanum East 305 300
Umtanum Central 762 500
Umtanum West 500 300
Rattlesnake-Wallula
Wallula fault zone 152 300
Rattlesnake Mountain 640 700
Manastash Ridge 300 1000
Saddle Mountains
Eagle Lakes 61 100
Saddle Gap 366 400
Smyrna Bench 628 700
Sentinel Gap 420 1000
McDonald Springs 549 1000
Horse Heaven Hills (HHH)
(two main trends)
HHH-NW 368 400
HHH-NE 346 400
Rattlesnake Hills (all) 762 500
Snively Basin 500 2000 +
Yakima Ridge 500 600
Frenchman Hills 200 300
Toppenish Ridge 500 1000
Columbia Hills 365 1000
2.6
Figure 2.2. Growth Rates and Tectonic Rotation Within the Saddle Mountains (after Reidel et al. 1989)
Table 2.3. Other Long-Term Vertical Strain Rates Reported for the Yakima Fold Belt
Time Period Strain (Slip) Rate Strain
Component Sense Location Source Comments (mm/yr) (m/my) Early Miocene (15.6 to 16.5 Ma)
10 10,000 Vertical Subsidence Pasco Basin
Reidel et al. (1989, 1994)
Rapid rate of subsidence endured for only first million years of Columbia River basalt volcanism
Middle Miocene (14.5 to 15.6 Ma)
0.3 300 Vertical Subsidence Pasco Basin
Reidel et al. (1989, 1994)
Late Miocene (10.5 to 14.5 Ma)
0.03 30 Vertical Subsidence Pasco Basin
Reidel et al. (1989, 1994)
Early Miocene (15.6 to 16.5 Ma)
0.25 250 Vertical Uplift Saddle Mountains
Reidel et al. (1989, 1994)
Middle Miocene to Quaternary (0 to 14.5 Ma)
0.04 40 Vertical Uplift Yakima folds
Reidel et al. (1989, 1994)
Middle Miocene to Quaternary (0 to 14.5 Ma)
0.03 30 Vertical Uplift Saddle Mountains
Reidel (1984)
Miocene to Quaternary?
1.16 1,160 Vertical Uplift Toppenish Ridge
Repasky et al. (1998)
2.7
2.2 Recurrence Rate
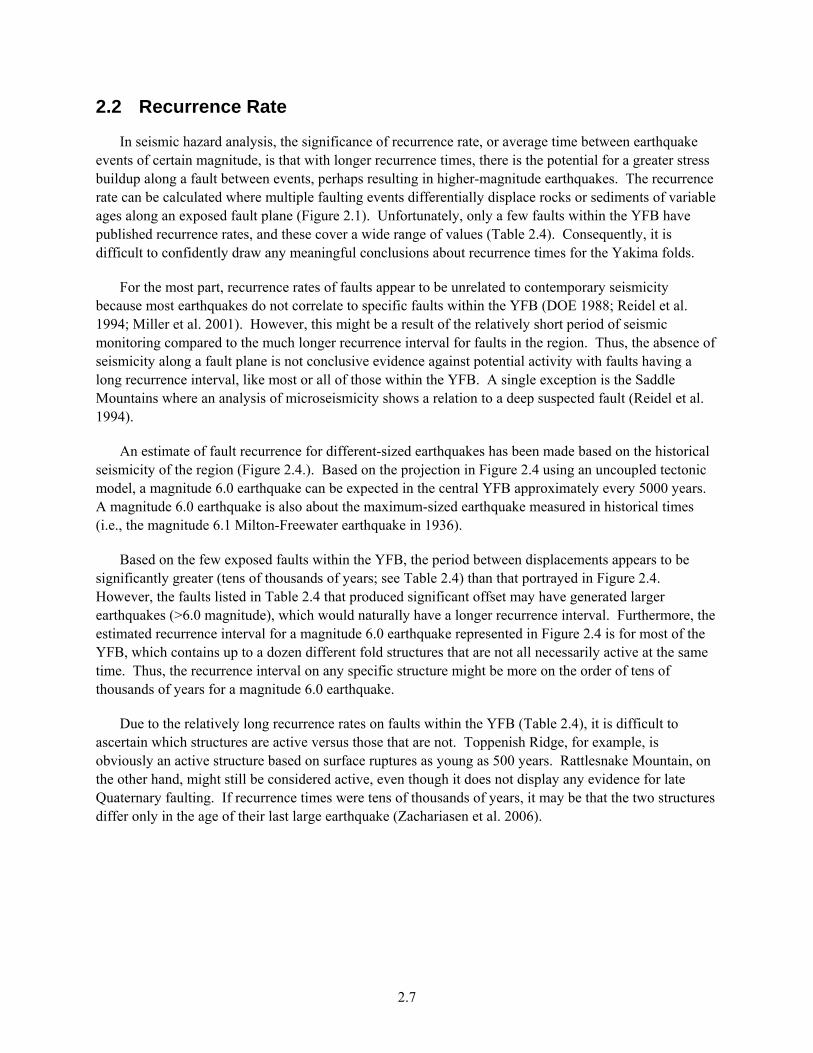
In seismic hazard analysis, the significance of recurrence rate, or average time between earthquake events of certain magnitude, is that with longer recurrence times, there is the potential for a greater stress buildup along a fault between events, perhaps resulting in higher-magnitude earthquakes. The recurrence rate can be calculated where multiple faulting events differentially displace rocks or sediments of variable ages along an exposed fault plane (Figure 2.1). Unfortunately, only a few faults within the YFB have published recurrence rates, and these cover a wide range of values (Table 2.4). Consequently, it is difficult to confidently draw any meaningful conclusions about recurrence times for the Yakima folds.
For the most part, recurrence rates of faults appear to be unrelated to contemporary seismicity because most earthquakes do not correlate to specific faults within the YFB (DOE 1988; Reidel et al. 1994; Miller et al. 2001). However, this might be a result of the relatively short period of seismic monitoring compared to the much longer recurrence interval for faults in the region. Thus, the absence of seismicity along a fault plane is not conclusive evidence against potential activity with faults having a long recurrence interval, like most or all of those within the YFB. A single exception is the Saddle Mountains where an analysis of microseismicity shows a relation to a deep suspected fault (Reidel et al. 1994).
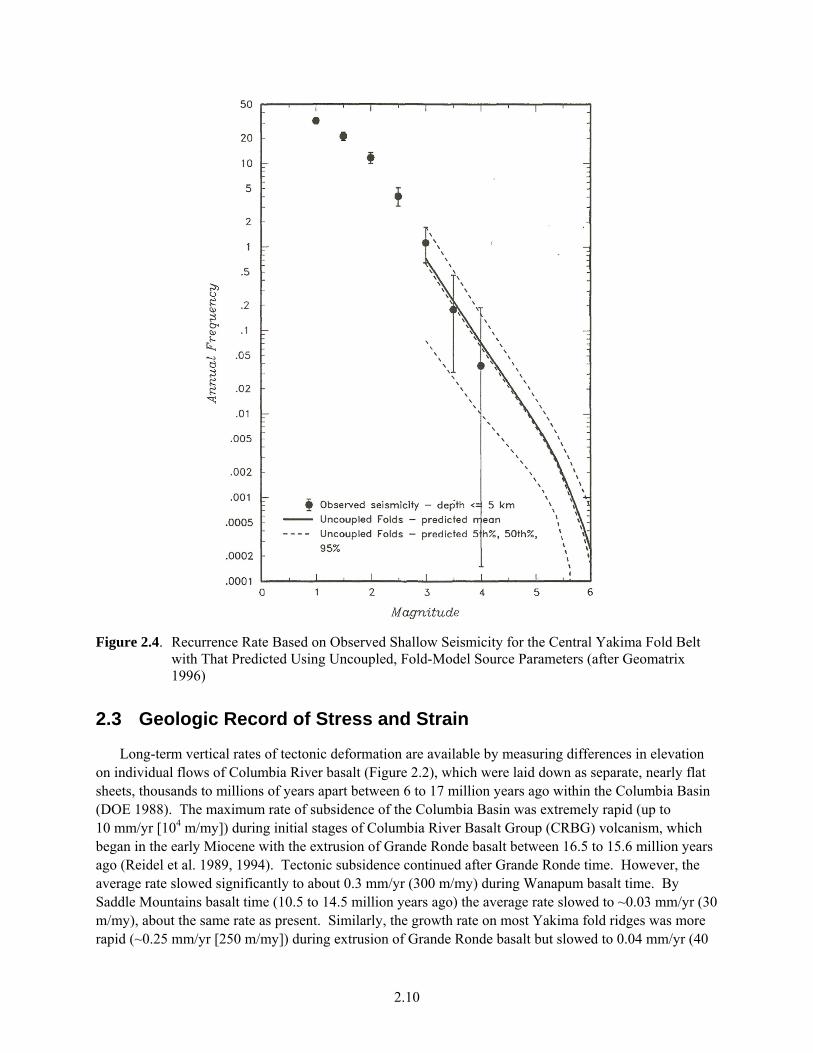
An estimate of fault recurrence for different-sized earthquakes has been made based on the historical seismicity of the region (Figure 2.4.). Based on the projection in Figure 2.4 using an uncoupled tectonic model, a magnitude 6.0 earthquake can be expected in the central YFB approximately every 5000 years. A magnitude 6.0 earthquake is also about the maximum-sized earthquake measured in historical times (i.e., the magnitude 6.1 Milton-Freewater earthquake in 1936).
Based on the few exposed faults within the YFB, the period between displacements appears to be significantly greater (tens of thousands of years; see Table 2.4) than that portrayed in Figure 2.4. However, the faults listed in Table 2.4 that produced significant offset may have generated larger earthquakes (>6.0 magnitude), which would naturally have a longer recurrence interval. Furthermore, the estimated recurrence interval for a magnitude 6.0 earthquake represented in Figure 2.4 is for most of the YFB, which contains up to a dozen different fold structures that are not all necessarily active at the same time. Thus, the recurrence interval on any specific structure might be more on the order of tens of thousands of years for a magnitude 6.0 earthquake.
Due to the relatively long recurrence rates on faults within the YFB (Table 2.4), it is difficult to ascertain which structures are active versus those that are not. Toppenish Ridge, for example, is obviously an active structure based on surface ruptures as young as 500 years. Rattlesnake Mountain, on the other hand, might still be considered active, even though it does not display any evidence for late Quaternary faulting. If recurrence times were tens of thousands of years, it may be that the two structures differ only in the age of their last large earthquake (Zachariasen et al. 2006).
2.8
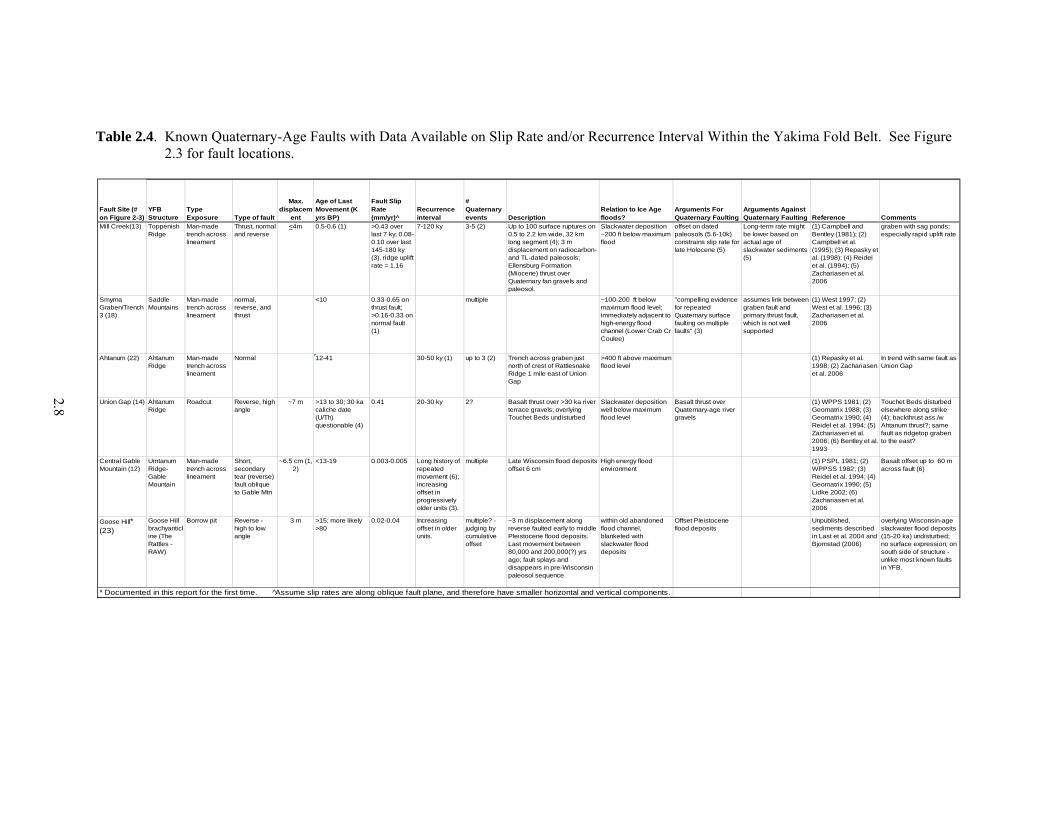
Table 2.4. Known Quaternary-Age Faults with Data Available on Slip Rate and/or Recurrence Interval Within the Yakima Fold Belt. See Figure 2.3 for fault locations.
Fault Site (# on Figure 2-3)
YFB Structure
Type Exposure Type of fault
Max. displacem
ent
Age of Last Movement (K yrs BP)
Fault Slip Rate (mm/yr)^
Recurrence interval
# Quaternary events Description
Relation to Ice Age floods?
Arguments For Quaternary Faulting
Arguments Against Quaternary Faulting Reference Comments
Mill Creek(13) Toppenish Ridge
Man-made trench across lineament
Thrust, normal and reverse
<4m 0.5-0.6 (1) >0.43 over last 7 ky; 0.08-0.10 over last 145-180 ky (3), ridge uplift rate = 1.16
7-120 ky 3-5 (2) Up to 100 surface ruptures on 0.5 to 2.2 km wide, 32 km long segment (4); 3 m displacement on radiocarbon- and TL-dated paleosols; Ellensburg Formation (Miocene) thrust over Quaternary fan gravels and paleosol.
Slackwater deposition ~200 ft below maximum flood
offset on dated paleosols (5.6-10k) constrains slip rate for late Holocene (5)
Long-term rate might be lower based on actual age of slackwater sediments (5)
(1) Campbell and Bentley (1981); (2) Campbell et al. (1995); (3) Repasky et al. (1998); (4) Reidel et al. (1994); (5) Zachariasen et al. 2006
graben with sag ponds; especially rapid uplift rate
Smyrna Graben/Trench 3 (18)
Saddle Mountains
Man-made trench across lineament
normal, reverse, and thrust
<10 0.33-0.65 on thrust fault; >0.16-0.33 on normal fault (1)
multiple ~100-200 ft below maximum flood level; immediately adjacent to high-energy flood channel (Lower Crab Cr Coulee)
"compelling evidence for repeated Quaternary surface faulting on multiple faults" (3)
assumes link between graben fault and primary thrust fault, which is not well supported
(1) West 1997; (2) West et al. 1996; (3) Zachariasen et al. 2006
Ahtanum (22) Ahtanum Ridge
Man-made trench across lineament
Normal 12-41 30-50 ky (1) up to 3 (2) Trench across graben just north of crest of Rattlesnake Ridge 1 mile east of Union Gap
>400 ft above maximum flood level
(1) Repasky et al. 1998; (2) Zachariasen et al. 2006
In trend with same fault as Union Gap
Union Gap (14) Ahtanum Ridge
Roadcut Reverse, high angle
~7 m >13 to 30; 30 ka caliche date (U/Th) questionable (4)
0.41 20-30 ky 2? Basalt thrust over >30 ka river terrace gravels; overlying Touchet Beds undisturbed
Slackwater deposition well below maximum flood level
Basalt thrust over Quaternary-age river gravels
(1) WPPS 1981; (2) Geomatrix 1988; (3) Geomatrix 1990; (4) Reidel et al. 1994; (5) Zachariasen et al. 2006; (6) Bentley et al. 1993
Touchet Beds disturbed elsewhere along strike (4); backthrust ass./w Ahtanum thrust?; same fault as ridgetop graben to the east?
Central Gable Mountain (12)
Umtanum Ridge-Gable Mountain
Man-made trench across lineament
Short, secondary tear (reverse) fault oblique to Gable Mtn
~6.5 cm (1, 2)
<13-19 0.003-0.005 Long history of repeated movement (6); increasing offset in progressively older units (3).
multiple Late Wisconsin flood deposits offset 6 cm
High energy flood environment
(1) PSPL 1981; (2) WPPSS 1982; (3) Reidel et al. 1994; (4) Geomatrix 1990; (5) Lidke 2002; (6) Zachariasen et al. 2006
Basalt offset up to 60 m across fault (6)
Goose Hill* (23)
Goose Hill brachyanticline (The Rattles - RAW)
Borrow pit Reverse - high to low angle
3 m >15; more likely >80
0.02-0.04 Increasing offset in older units.
multiple? - judging by cumulative offset
~3 m displacement along reverse faulted early to middle Pleistocene flood deposits. Last movement between 80,000 and 200,000(?) yrs ago; fault splays and disappears in pre-Wisconsin paleosol sequence
within old abandoned flood channel, blanketed with slackwater flood deposits
Offset Pleistocene flood deposits
Unpublished, sediments described in Last et al. 2004 and Bjornstad (2006)
overlying Wisconsin-age slackwater flood deposits (15-20 ka) undisturbed; no surface expression; on south side of structure - unlike most known faults in YFB.
* Documented in this report for the first time. Assume slip rates are along oblique fault plane, and therefore have smaller horizontal and vertical components.
2.9
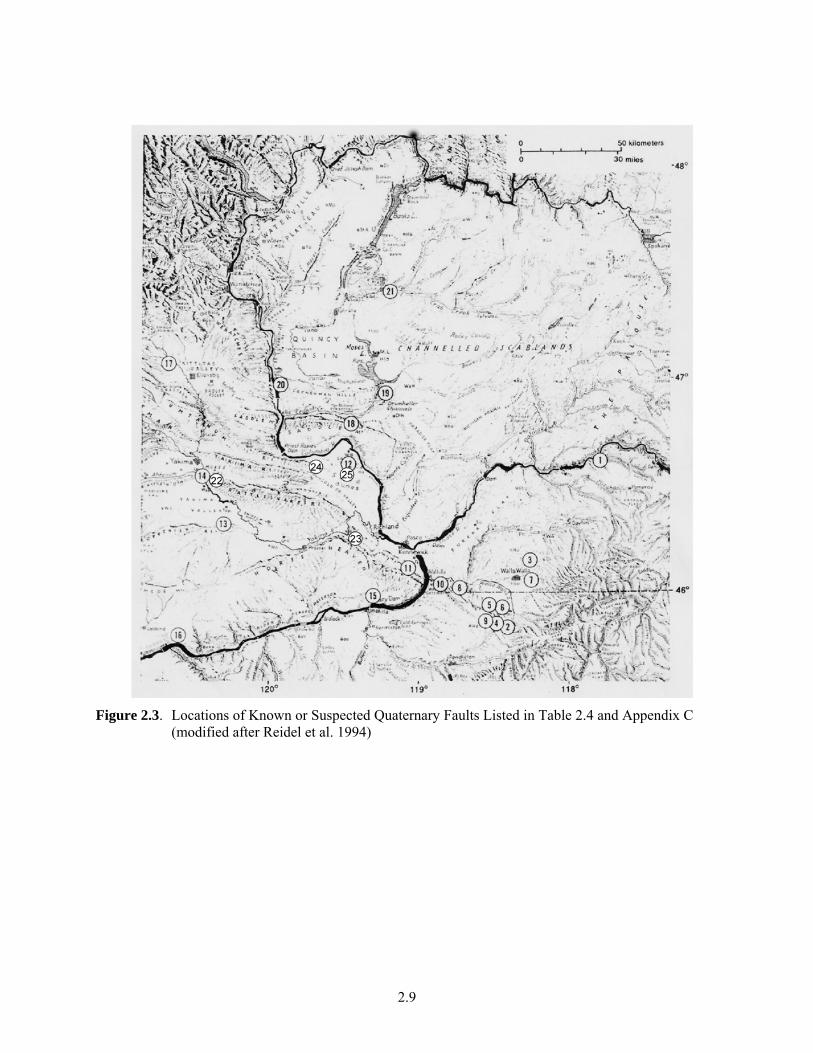
Figure 2.3. Locations of Known or Suspected Quaternary Faults Listed in Table 2.4 and Appendix C (modified after Reidel et al. 1994)
2.10
Figure 2.4. Recurrence Rate Based on Observed Shallow Seismicity for the Central Yakima Fold Belt with That Predicted Using Uncoupled, Fold-Model Source Parameters (after Geomatrix 1996)
2.3 Geologic Record of Stress and Strain
Long-term vertical rates of tectonic deformation are available by measuring differences in elevation on individual flows of Columbia River basalt (Figure 2.2), which were laid down as separate, nearly flat sheets, thousands to millions of years apart between 6 to 17 million years ago within the Columbia Basin (DOE 1988). The maximum rate of subsidence of the Columbia Basin was extremely rapid (up to 10 mm/yr [104 m/my]) during initial stages of Columbia River Basalt Group (CRBG) volcanism, which began in the early Miocene with the extrusion of Grande Ronde basalt between 16.5 to 15.6 million years ago (Reidel et al. 1989, 1994). Tectonic subsidence continued after Grande Ronde time. However, the average rate slowed significantly to about 0.3 mm/yr (300 m/my) during Wanapum basalt time. By Saddle Mountains basalt time (10.5 to 14.5 million years ago) the average rate slowed to ~0.03 mm/yr (30 m/my), about the same rate as present. Similarly, the growth rate on most Yakima fold ridges was more rapid (~0.25 mm/yr [250 m/my]) during extrusion of Grande Ronde basalt but slowed to 0.04 mm/yr (40
2.11
m/my) as CRBG volcanism waned (Reidel et al. 1994). The long-term rate of ridge growth appears to have stabilized at approximately 0.04 mm/yr (40 m/my) into the present. This slower rate has continued through the Quaternary based on present relief on YFB structures (Reidel et al 1989, 1994). However, because of the long periods separating some of the dated strata, it is possible there could have been shorter-term periods of accelerated deformation between data points, including the Quaternary Period. The amount of horizontal strain (crustal shortening) may equal or exceed the amount of uplift and subsidence within the YFB (Table 2.2).
Another method for evaluating the tectonic deformation with the YFB is to observe the history of slip displacement along known faults in the region. Geomorphic expression for faulting is variable across the YFB, perhaps because
1. Recurrence times vary across the region.
2. Displacement varies.
3. Locus of activity is variable over time.
The tectonic regime and stresses can vary over time so that the tectonic forces that operated early in the deformation in the YFB may not be exactly the same today. To predict tectonic deformation and seismic hazard within the YFB over the design life of engineered facilities, it is prudent to examine the types of faulting and deformation that have occurred over the last few tens of thousands of years (West 1997). Thus, where possible, it is more important to determine recurrence intervals and slip rates on the Yakima folds during the late Quaternary because these are most likely to represent the type of movement expected over the next few thousand years (Zachariasen et al. 2006). Furthermore, it is advised (Zachariasen et al. 2006) to use the most recent available data (including GPS [geodetic] and paleoseismic data) in conjunction with Miocene deformation rates to provide the best estimate of activity rates and encompass the full range of uncertainty.
Some Quaternary faulting may be associated with rapid crustal loading and stress release events during Pleistocene Ice Age floods (Baker et al. 1991; DOE 2002; Bjornstad 2006). During these cataclysmic floods, low areas were rapidly loaded and stressed with up to hundreds of feet of floodwater over an extremely short period (a few weeks or less; Denlinger and O’Connell 2010), which likely triggered earthquakes and landslides (Bjornstad 2006). Ubiquitous clastic dikes in slackwater Ice Age flood deposits may be the result of earthquake shaking and liquefaction during or soon after some Ice Age floods (Fecht et al. 1999).
Deterministic values for Quaternary fault-slip and recurrence rates are sparse for the YFB (Table 2.4). There are a number of reasons why these data are sparse or indeterminate for faults within the YFB:
5. Higher elevations and steep slopes of Yakima folds are often devoid of Quaternary sedimentary cover with which to determine the existence of Quaternary faulting or to date post-Miocene fault movements.
6. Lowland areas between Yakima folds were eroded and stripped clean of sedimentary deposits or blanketed with more recent flood deposits during Ice Age flooding. These floods occurred repeatedly throughout the Pleistocene and tended to destroy or bury all evidence for Quaternary faulting except that which occurred during or after the last Ice Age flood (~15,000 years before present).
2.12
7. Where Quaternary sediments overlie faults, there are usually significant gaps in the sedimentary record and a paucity of reliable age dates, which make determination of age of faulting and recurrence rates difficult.
8. Datable material in sediments to obtain chronology of fault movement is absent. Until recently, only a few types of sediment have provided accurate age dates. Traditional dating methods of sediments have generally been limited to organic carbon, pedogenic calcium carbonate (caliche), and volcanic tephra horizons, which are distributed sparsely and unevenly in the stratigraphic record.
9. Active faults with longer recurrence intervals may be covered with sediments that were deposited since the last fault episode, thus giving the false impression of inactivity. For example, where not completely eroded by Ice Age floods, flanks of Yakima folds and intervening basins are often filled with or covered with late Pleistocene- to Holocene-age deposits (e.g., slackwater flood deposits, loess), which may postdate the last movement along the fault. Therefore, any surface expression such as scarps or lineaments, indicating fault movement, would be covered beneath the blanket of younger deposits.
10. Not all faulting is expressed at the surface, and lack of surface rupture does not preclude activity of subsurface faulting (Zachariasen et al. 2006). For example, reverse faults in compressional regimes are commonly blind.
Common geomorphic features used to identify Quaternary faulting include lineaments, linear escarpments, and disrupted stream systems at the surface (Burbank and Anderson 2001). To confirm that these features are tectonic in origin, trenching is normally performed to look for evidence of offset in the subsurface rock and sediment layers. In some cases, trenching has confirmed the presence of Quaternary faulting along lineaments (e.g., Mill Creek along Toppenish Ridge, Smyrna Bench [Table 2.4]). In other cases (e.g., central fault on Gable Mountain), repeated trenching efforts were required to locate any Quaternary fault displacement (Converse, Davis and Associates 1969; PSPL 1981). However, there have been other examples in which trenching has uncovered inconclusive evidence for faulting or not revealed any evidence for faulting. In these cases, the cause of the lineament is open to other interpretations, including a non-tectonic origin.
Examples of non-tectonic lineaments include Ice Age flood erosional scarps, strandlines,(a) clastic dikes (Fecht et al. 1999), alluvial terrace scarps, or cultural features (e.g., ancient trails of native Americans [Rice 1981]). Similarly, stream offsets can develop in ways other than lateral fault slip, such as streams shifting along different joint patterns in basalt bedrock. Formation of grabens and sag ponds, which can occur in areas undergoing tectonic extension, may also develop because of landsliding. The north slope of the Saddle Mountains, including the area around Smyrna Bench, underwent extreme erosion along Lower Crab Creek Coulee and subsequent landsliding associated with repeated Pleistocene cataclysmic floods. Therefore, some of the features attributed to tectonic deformation along the Smyrna Bench graben might be attributed to the combination of Ice Age flooding and subsequent landsliding. Linear escarpments, especially along tightly folded north limbs of the Yakima folds, simply represent steep dip slopes of individual basalt flows referred to as flatirons. Therefore, before a tectonic origin is
(a) Letter report from Woodward-Clyde Consultants to the U.S. Nuclear Regulatory Commission regarding Washington Public Power Supply System, Nuclear Project WNP-2 and WNP-1/4, “Report on the Nature and Genesis of the Northeast Rattlesnake Mountain Lineaments – Preliminary Draft Responses to Some of the Concerns Raised to USNRC Geosciences Staff During 10 February 1982 Meeting,” April 8, 1982.
2.13
automatically attributed to lineaments, escarpments, stream offsets, or other features, it would appear other possible origins should first be eliminated for seismic hazard analysis.
There appears to be no pattern of faulting in the YFB that would suggest that Quaternary faulting is more concentrated in one part of the basin than in another (Reidel et al. 1994). However, not all deformation necessarily occurs along upfolded anticlines. Earthquake locations and focal mechanisms indicate most stress release is occurring in the synclinal areas under north-south compression (Reidel et al. 1994). There appears to be less direct evidence for faulting in synclines because of thick cover of basin-fill sediments, the upper part of which is relatively young (late Pleistocene to Holocene) and thus masks any surface expression of recent faulting.
Based on borehole studies on the Hanford Site, there are at least two possible faults (Cold Creek and May Junction faults) within the Cold Creek syncline. Both of these buried faults appear to represent near-vertical, north-south trending structures that run transverse to the structural grain of the Yakima folds. Boreholes drilled on either side of these structures constrain tectonic relief to an extremely narrow zone, so these structures therefore are likely faults (Reidel and Fecht 1994; Williams et al. 2000). Alternatively, these transverse features may represent tight folds (DOE 1988, p. 1.3-68; PSPL 1981) or a combination of folding and faulting. Tectonic deformation on both structures appears to have been active during extrusion of the Miocene Columbia River basalt and deposition of the overlying Ringold Formation (late Miocene to Pliocene age). There is no surface expression of either structure, however, because they lie buried under a thick sequence of late Pleistocene cataclysmic flood deposits. It is unknown at present if any movement occurred along these structures earlier in the Quaternary. Similar transverse structures are known to occur as tear faults with Quaternary-age displacement along some YFB anticlines (e.g., Gable Mountain [PSPL 1981]).
2.3.1 Reported Slip and Recurrence Rates of Exposed Quaternary Faults Within the Yakima Fold Belt
To date, there are about 30 suspected cases for Quaternary faulting within the YFB (Appendix C). However, only 6 of these faults have enough information from which to calculate slip rates and/or recurrence intervals (Table 2.4). Confirmed Quaternary faulting exists for only 5 of the 11 Yakima folds. Quaternary slip rates and recurrence intervals are not available for most faults within the YFB because either 1) no Quaternary sediments overlie the faults or 2) the age of the sediments associated with the faults is unknown or contentious. The 6 confirmed Quaternary faults listed in Table 2.4 and shown on Figure 2.3 are described briefly in the following paragraphs.
2.3.1.1 Mill Creek (Toppenish Ridge)
Toppenish Ridge displays a number of surface lineaments and scarps that indicate late Pleistocene to Holocene fault movement (Bentley et al. 1980; Campbell and Bentley 1981; Campbell et al. 1995; Repasky et al. 1998). The structures consist of the Mill Creek thrust at the northern foot of Toppenish Ridge and subparallel normal faults and grabens along the crest of the main anticline. Geomorphic expression of the Mill Creek thrust includes three east-striking zones of fault scarps following a sinuous pattern and extending for least 24 km (Zachariasen et al. 2006). Trenches across the Mill Creek thrust expose a shallowly dipping thrust fault that places Miocene basalt over Quaternary soils and gravels. This shows definite evidence for repeated late Quaternary surface faulting. The Mill Creek thrust fault
2.14
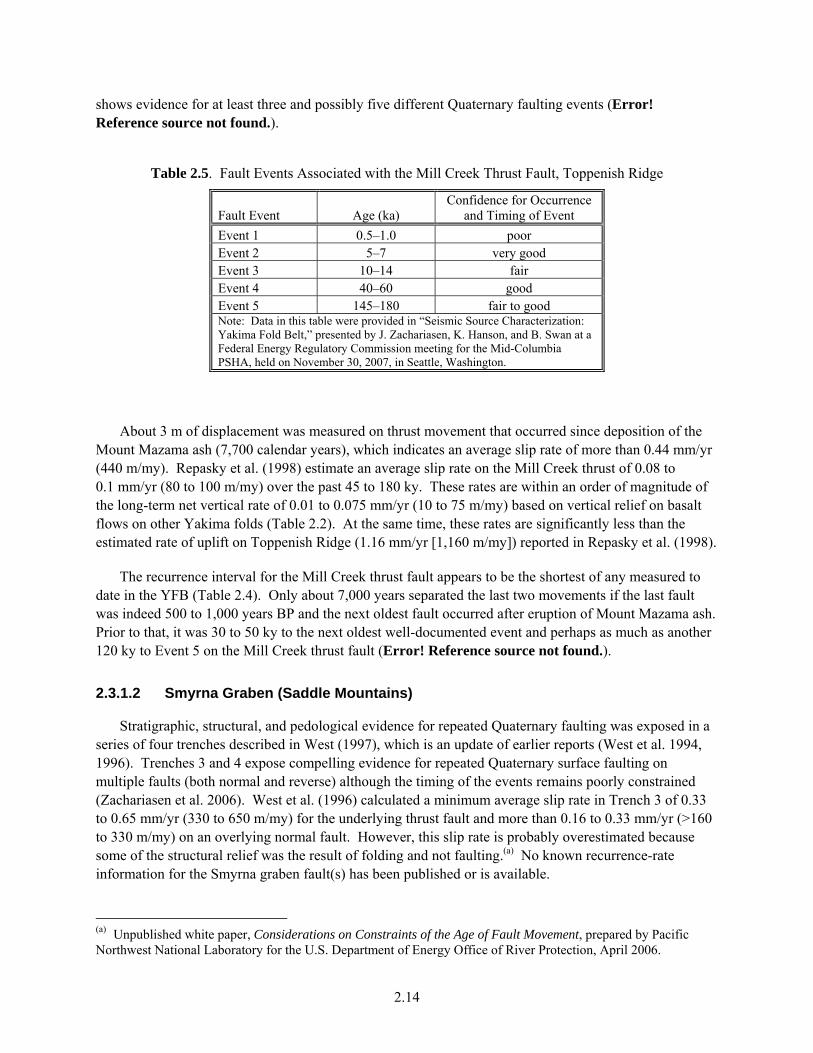
shows evidence for at least three and possibly five different Quaternary faulting events (Error! Reference source not found.).
Table 2.5. Fault Events Associated with the Mill Creek Thrust Fault, Toppenish Ridge
Fault Event Age (ka) Confidence for Occurrence
and Timing of Event
Event 1 0.5–1.0 poor Event 2 5–7 very good Event 3 10–14 fair Event 4 40–60 good Event 5 145–180 fair to good Note: Data in this table were provided in “Seismic Source Characterization: Yakima Fold Belt,” presented by J. Zachariasen, K. Hanson, and B. Swan at a Federal Energy Regulatory Commission meeting for the Mid-Columbia PSHA, held on November 30, 2007, in Seattle, Washington.
About 3 m of displacement was measured on thrust movement that occurred since deposition of the Mount Mazama ash (7,700 calendar years), which indicates an average slip rate of more than 0.44 mm/yr (440 m/my). Repasky et al. (1998) estimate an average slip rate on the Mill Creek thrust of 0.08 to 0.1 mm/yr (80 to 100 m/my) over the past 45 to 180 ky. These rates are within an order of magnitude of the long-term net vertical rate of 0.01 to 0.075 mm/yr (10 to 75 m/my) based on vertical relief on basalt flows on other Yakima folds (Table 2.2). At the same time, these rates are significantly less than the estimated rate of uplift on Toppenish Ridge (1.16 mm/yr [1,160 m/my]) reported in Repasky et al. (1998).
The recurrence interval for the Mill Creek thrust fault appears to be the shortest of any measured to date in the YFB (Table 2.4). Only about 7,000 years separated the last two movements if the last fault was indeed 500 to 1,000 years BP and the next oldest fault occurred after eruption of Mount Mazama ash. Prior to that, it was 30 to 50 ky to the next oldest well-documented event and perhaps as much as another 120 ky to Event 5 on the Mill Creek thrust fault (Error! Reference source not found.).
2.3.1.2 Smyrna Graben (Saddle Mountains)
Stratigraphic, structural, and pedological evidence for repeated Quaternary faulting was exposed in a series of four trenches described in West (1997), which is an update of earlier reports (West et al. 1994, 1996). Trenches 3 and 4 expose compelling evidence for repeated Quaternary surface faulting on multiple faults (both normal and reverse) although the timing of the events remains poorly constrained (Zachariasen et al. 2006). West et al. (1996) calculated a minimum average slip rate in Trench 3 of 0.33 to 0.65 mm/yr (330 to 650 m/my) for the underlying thrust fault and more than 0.16 to 0.33 mm/yr (>160 to 330 m/my) on an overlying normal fault. However, this slip rate is probably overestimated because some of the structural relief was the result of folding and not faulting.(a) No known recurrence-rate information for the Smyrna graben fault(s) has been published or is available.
(a) Unpublished white paper, Considerations on Constraints of the Age of Fault Movement, prepared by Pacific Northwest National Laboratory for the U.S. Department of Energy Office of River Protection, April 2006.
2.15
2.3.1.3 Ahtanum Ridge
Two known faults of Quaternary age are documented along Ahtanum Ridge—one at Union Gap and the other within a graben structure along the top of the ridge. These faults are in alignment and therefore may represent movement associated with the same fault.
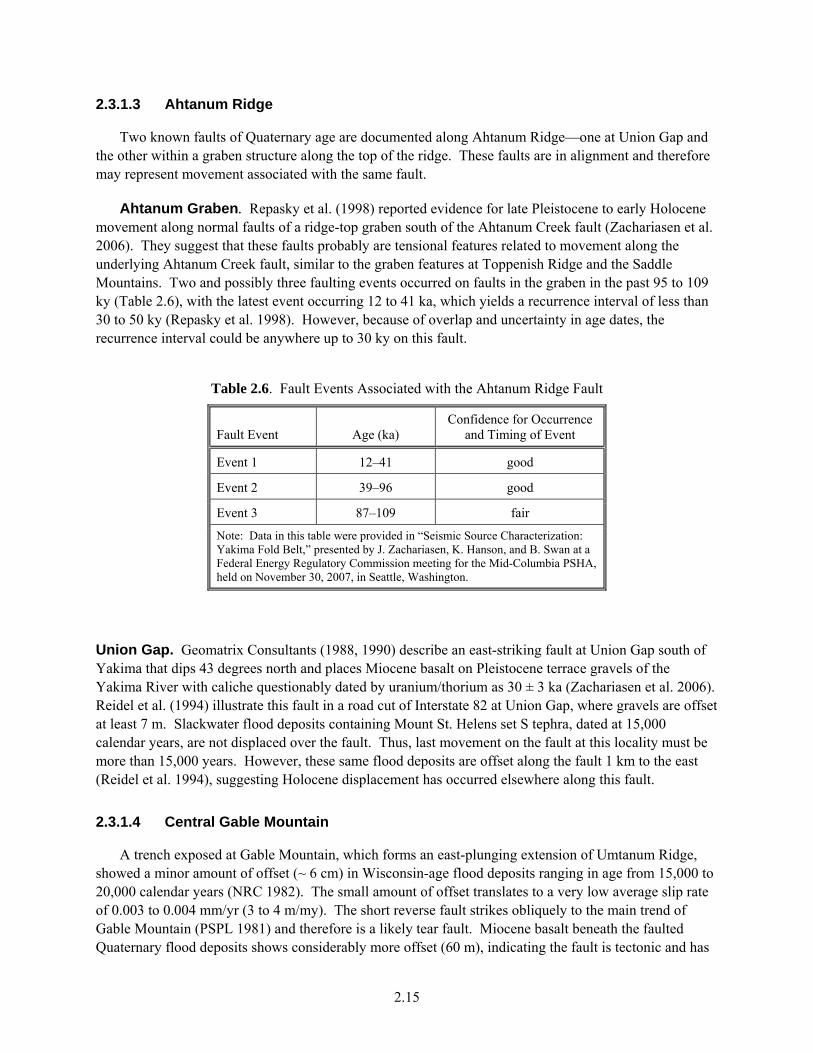
Ahtanum Graben. Repasky et al. (1998) reported evidence for late Pleistocene to early Holocene movement along normal faults of a ridge-top graben south of the Ahtanum Creek fault (Zachariasen et al. 2006). They suggest that these faults probably are tensional features related to movement along the underlying Ahtanum Creek fault, similar to the graben features at Toppenish Ridge and the Saddle Mountains. Two and possibly three faulting events occurred on faults in the graben in the past 95 to 109 ky (Table 2.6), with the latest event occurring 12 to 41 ka, which yields a recurrence interval of less than 30 to 50 ky (Repasky et al. 1998). However, because of overlap and uncertainty in age dates, the recurrence interval could be anywhere up to 30 ky on this fault.
Table 2.6. Fault Events Associated with the Ahtanum Ridge Fault
Fault Event Age (ka) Confidence for Occurrence
and Timing of Event
Event 1 12–41 good
Event 2 39–96 good
Event 3 87–109 fair
Note: Data in this table were provided in “Seismic Source Characterization: Yakima Fold Belt,” presented by J. Zachariasen, K. Hanson, and B. Swan at a Federal Energy Regulatory Commission meeting for the Mid-Columbia PSHA, held on November 30, 2007, in Seattle, Washington.
Union Gap. Geomatrix Consultants (1988, 1990) describe an east-striking fault at Union Gap south of Yakima that dips 43 degrees north and places Miocene basalt on Pleistocene terrace gravels of the Yakima River with caliche questionably dated by uranium/thorium as 30 ± 3 ka (Zachariasen et al. 2006). Reidel et al. (1994) illustrate this fault in a road cut of Interstate 82 at Union Gap, where gravels are offset at least 7 m. Slackwater flood deposits containing Mount St. Helens set S tephra, dated at 15,000 calendar years, are not displaced over the fault. Thus, last movement on the fault at this locality must be more than 15,000 years. However, these same flood deposits are offset along the fault 1 km to the east (Reidel et al. 1994), suggesting Holocene displacement has occurred elsewhere along this fault.
2.3.1.4 Central Gable Mountain
A trench exposed at Gable Mountain, which forms an east-plunging extension of Umtanum Ridge, showed a minor amount of offset (~ 6 cm) in Wisconsin-age flood deposits ranging in age from 15,000 to 20,000 calendar years (NRC 1982). The small amount of offset translates to a very low average slip rate of 0.003 to 0.004 mm/yr (3 to 4 m/my). The short reverse fault strikes obliquely to the main trend of Gable Mountain (PSPL 1981) and therefore is a likely tear fault. Miocene basalt beneath the faulted Quaternary flood deposits shows considerably more offset (60 m), indicating the fault is tectonic and has
2.16
probably had repeated displacements (Zachariasen et al. 2006), perhaps some occurring earlier in the Quaternary.
2.3.1.5 Goose Hill
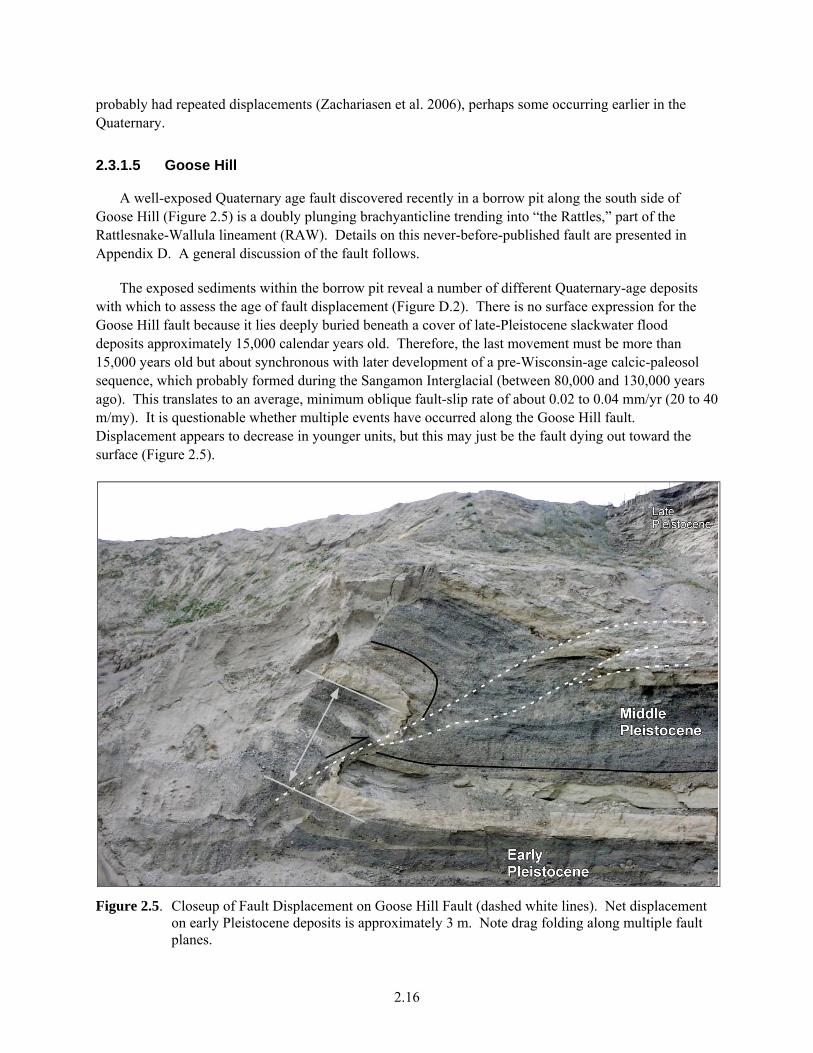
A well-exposed Quaternary age fault discovered recently in a borrow pit along the south side of Goose Hill (Figure 2.5) is a doubly plunging brachyanticline trending into “the Rattles,” part of the Rattlesnake-Wallula lineament (RAW). Details on this never-before-published fault are presented in Appendix D. A general discussion of the fault follows.
The exposed sediments within the borrow pit reveal a number of different Quaternary-age deposits with which to assess the age of fault displacement (Figure D.2). There is no surface expression for the Goose Hill fault because it lies deeply buried beneath a cover of late-Pleistocene slackwater flood deposits approximately 15,000 calendar years old. Therefore, the last movement must be more than 15,000 years old but about synchronous with later development of a pre-Wisconsin-age calcic-paleosol sequence, which probably formed during the Sangamon Interglacial (between 80,000 and 130,000 years ago). This translates to an average, minimum oblique fault-slip rate of about 0.02 to 0.04 mm/yr (20 to 40 m/my). It is questionable whether multiple events have occurred along the Goose Hill fault. Displacement appears to decrease in younger units, but this may just be the fault dying out toward the surface (Figure 2.5).
Figure 2.5. Closeup of Fault Displacement on Goose Hill Fault (dashed white lines). Net displacement on early Pleistocene deposits is approximately 3 m. Note drag folding along multiple fault planes.
2.17
2.3.1.6 Summary
Evidence discovered to date suggests that fault-slip rates are relatively low and recurrence intervals are long. Fault-specific recurrence and slip-rate data are sparse and limited to only a few of the faults listed in Table 2.4. Among these data, a wide range occurs in reported slip rates. The long-term average rate of vertical growth along Toppenish Ridge appears to be occurring at over 1 mm/yr (1,000 m/my), while slip along individual faults ranges from approximately 0.2 to 0.65 mm/yr (~200 to 650 m/my). Slip rates on faults at Saddle Mountain are somewhat less than those at Toppenish Ridge. The Gable Mountain fault has a late-Quaternary rate that is two orders of magnitude lower (0.003 to 0.004 mm/yr [3 to 4 m/my]). The Goose Hill fault appears to have a slip rate between these two extremes (0.02 to 0.04 mm/yr [20 to 40 m/my]), more consistent with the long-term average slip rate for the Yakima folds. Where information on Quaternary faulting is available, the fault-recurrence interval is generally 20 to 50 ky but may range from 5 to 120 ky (Table 2.4). Slip rates and recurrence intervals may vary as well, depending on the type of fault (e.g., main thrust fault versus secondary tear fault)
2.3.2 Contemporary Stress and Strain
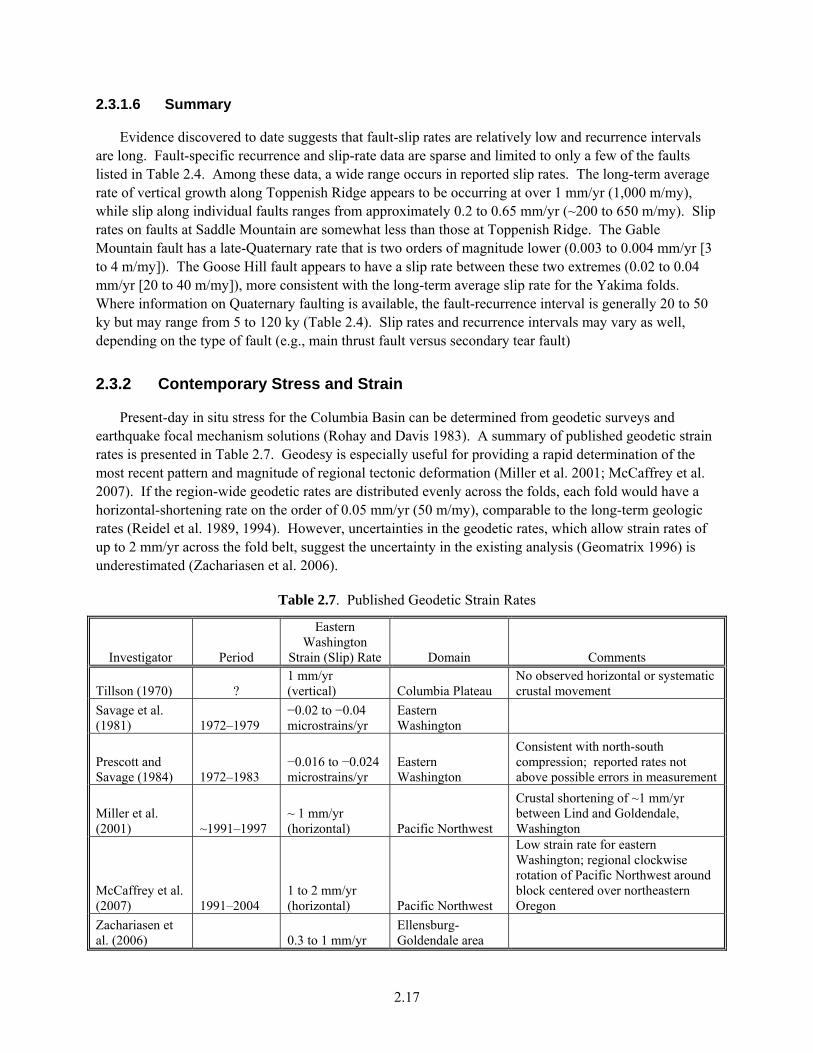
Present-day in situ stress for the Columbia Basin can be determined from geodetic surveys and earthquake focal mechanism solutions (Rohay and Davis 1983). A summary of published geodetic strain rates is presented in Table 2.7. Geodesy is especially useful for providing a rapid determination of the most recent pattern and magnitude of regional tectonic deformation (Miller et al. 2001; McCaffrey et al. 2007). If the region-wide geodetic rates are distributed evenly across the folds, each fold would have a horizontal-shortening rate on the order of 0.05 mm/yr (50 m/my), comparable to the long-term geologic rates (Reidel et al. 1989, 1994). However, uncertainties in the geodetic rates, which allow strain rates of up to 2 mm/yr across the fold belt, suggest the uncertainty in the existing analysis (Geomatrix 1996) is underestimated (Zachariasen et al. 2006).
Table 2.7. Published Geodetic Strain Rates
Investigator Period
Eastern Washington
Strain (Slip) Rate Domain Comments
Tillson (1970) ? 1 mm/yr (vertical) Columbia Plateau
No observed horizontal or systematic crustal movement
Savage et al. (1981) 1972–1979
−0.02 to −0.04 microstrains/yr
Eastern Washington
Prescott and Savage (1984) 1972–1983
−0.016 to −0.024 microstrains/yr
Eastern Washington
Consistent with north-south compression; reported rates not above possible errors in measurement
Miller et al. (2001) ~1991–1997
~ 1 mm/yr (horizontal) Pacific Northwest
Crustal shortening of ~1 mm/yr between Lind and Goldendale, Washington
McCaffrey et al. (2007) 1991–2004
1 to 2 mm/yr (horizontal) Pacific Northwest
Low strain rate for eastern Washington; regional clockwise rotation of Pacific Northwest around block centered over northeastern Oregon
Zachariasen et al. (2006) 0.3 to 1 mm/yr
Ellensburg-Goldendale area
2.18
Over the last few decades, the observed seismic activity in the vicinity of the Saddle Mountains has contributed an estimated 0.02 to 0.04 mm/yr (20 to 40 m/my) of both uplift and north-south contraction (i.e., horizontal shortening) (Rohay and Davis 1983). Estimates of the long-term uplift and north-south shortening on this structure based on geologic evidence suggest a comparable rate of 40 m/my (0.04 mm/yr). Although these estimates are not significantly different, there is a suggestion that some proportion of the observed geologic deformation may be occurring aseismically (Rohay and Davis 1983).
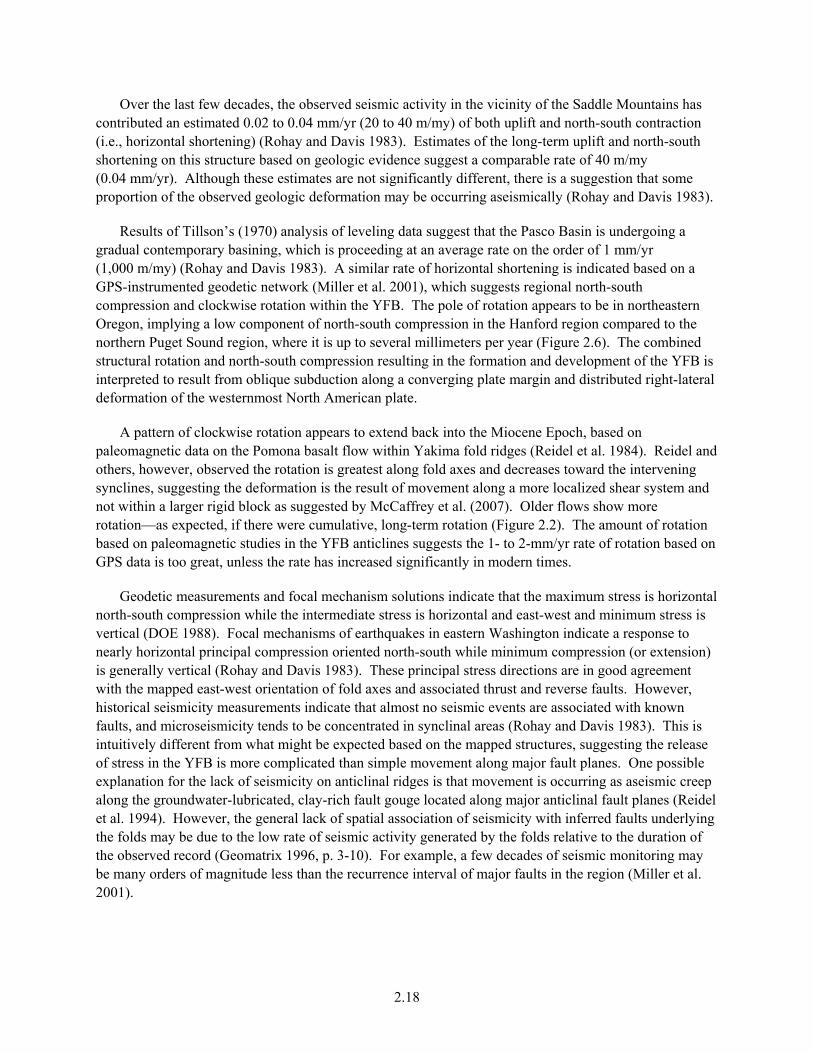
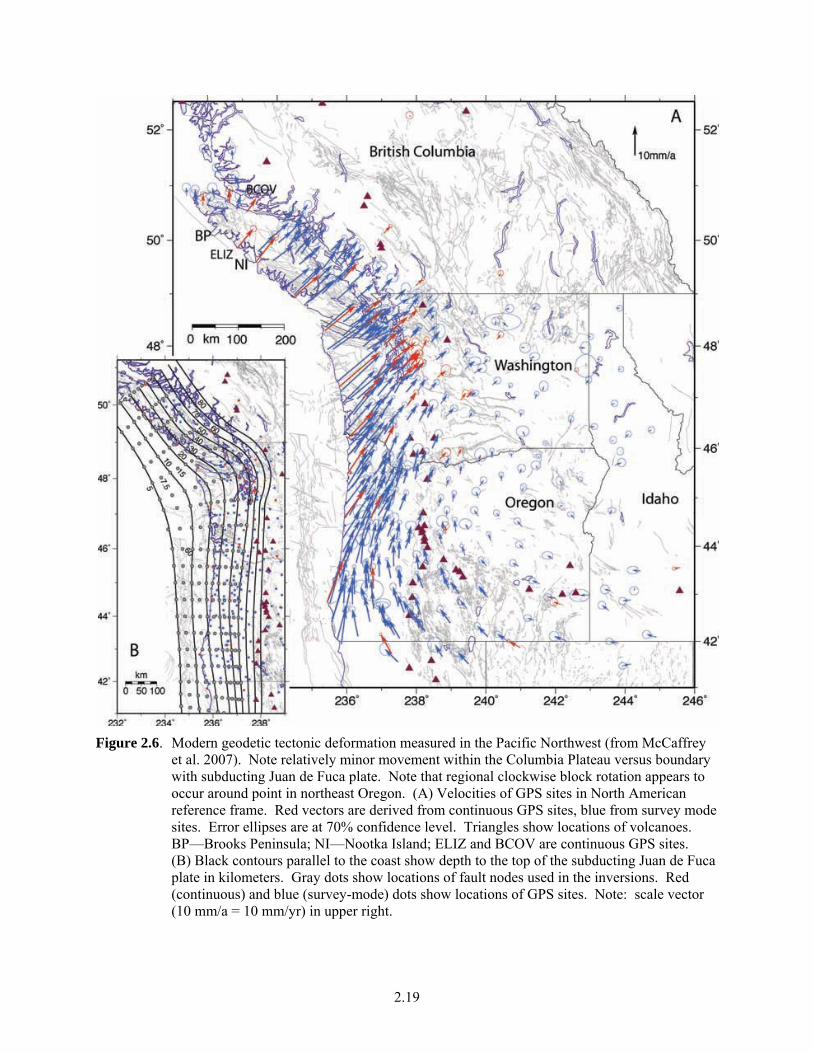
Results of Tillson’s (1970) analysis of leveling data suggest that the Pasco Basin is undergoing a gradual contemporary basining, which is proceeding at an average rate on the order of 1 mm/yr (1,000 m/my) (Rohay and Davis 1983). A similar rate of horizontal shortening is indicated based on a GPS-instrumented geodetic network (Miller et al. 2001), which suggests regional north-south compression and clockwise rotation within the YFB. The pole of rotation appears to be in northeastern Oregon, implying a low component of north-south compression in the Hanford region compared to the northern Puget Sound region, where it is up to several millimeters per year (Figure 2.6). The combined structural rotation and north-south compression resulting in the formation and development of the YFB is interpreted to result from oblique subduction along a converging plate margin and distributed right-lateral deformation of the westernmost North American plate.
A pattern of clockwise rotation appears to extend back into the Miocene Epoch, based on paleomagnetic data on the Pomona basalt flow within Yakima fold ridges (Reidel et al. 1984). Reidel and others, however, observed the rotation is greatest along fold axes and decreases toward the intervening synclines, suggesting the deformation is the result of movement along a more localized shear system and not within a larger rigid block as suggested by McCaffrey et al. (2007). Older flows show more rotation—as expected, if there were cumulative, long-term rotation (Figure 2.2). The amount of rotation based on paleomagnetic studies in the YFB anticlines suggests the 1- to 2-mm/yr rate of rotation based on GPS data is too great, unless the rate has increased significantly in modern times.
Geodetic measurements and focal mechanism solutions indicate that the maximum stress is horizontal north-south compression while the intermediate stress is horizontal and east-west and minimum stress is vertical (DOE 1988). Focal mechanisms of earthquakes in eastern Washington indicate a response to nearly horizontal principal compression oriented north-south while minimum compression (or extension) is generally vertical (Rohay and Davis 1983). These principal stress directions are in good agreement with the mapped east-west orientation of fold axes and associated thrust and reverse faults. However, historical seismicity measurements indicate that almost no seismic events are associated with known faults, and microseismicity tends to be concentrated in synclinal areas (Rohay and Davis 1983). This is intuitively different from what might be expected based on the mapped structures, suggesting the release of stress in the YFB is more complicated than simple movement along major fault planes. One possible explanation for the lack of seismicity on anticlinal ridges is that movement is occurring as aseismic creep along the groundwater-lubricated, clay-rich fault gouge located along major anticlinal fault planes (Reidel et al. 1994). However, the general lack of spatial association of seismicity with inferred faults underlying the folds may be due to the low rate of seismic activity generated by the folds relative to the duration of the observed record (Geomatrix 1996, p. 3-10). For example, a few decades of seismic monitoring may be many orders of magnitude less than the recurrence interval of major faults in the region (Miller et al. 2001).
2.19
Figure 2.6. Modern geodetic tectonic deformation measured in the Pacific Northwest (from McCaffrey et al. 2007). Note relatively minor movement within the Columbia Plateau versus boundary with subducting Juan de Fuca plate. Note that regional clockwise block rotation appears to occur around point in northeast Oregon. (A) Velocities of GPS sites in North American reference frame. Red vectors are derived from continuous GPS sites, blue from survey mode sites. Error ellipses are at 70% confidence level. Triangles show locations of volcanoes. BP—Brooks Peninsula; NI—Nootka Island; ELIZ and BCOV are continuous GPS sites. (B) Black contours parallel to the coast show depth to the top of the subducting Juan de Fuca plate in kilometers. Gray dots show locations of fault nodes used in the inversions. Red (continuous) and blue (survey-mode) dots show locations of GPS sites. Note: scale vector (10 mm/a = 10 mm/yr) in upper right.
2.20
Prescott and Savage (1984) and Savage et al. (1981) reported geodetic strain measurements at a trilateration network at Hanford. They found principal compressive strains of −0.016 and −0.024 ± 0.013 microstrains/year in nearly north-south and east-west directions, respectively. (Strains are expressed as the proportional lengthening (positive) or shortening (negative) of the baseline distance; one microstrain therefore represents a length change of one unit in one million units.) The error estimates for both measurements was 0.013 microstrains/year. This represents an average strain for the whole network, which was approximately 60 km in north-south aperture and 40 km east-west aperture, or about 1 mm/yr across either dimension of the network. The network extends from the Horse Heaven Hills structure to the Frenchman Hills structure in the eastern part of the YFB, so the north-south extent of the network is somewhat less than that of the entire YFB. The larger of the two strains is notably east-west, inconsistent with the orientation of the folds or with stress inferred from earthquake focal mechanisms. Savage et al. (1981) noted “…we are not confident that a real accumulation of strain has been measured at this site”.
In summary, GPS data indicate relatively low (<1 mm/yr) but non-zero convergence across the YFB (Zachariasen et al. 2007). Rates are higher to the west where there are more structures and structural relief. The contemporary convergence rate ranges from 0.3 to 2 mm/yr (300 to 2,000 m/my), with large uncertainty. In general, these rates are higher than those calculated on Quaternary faults. One possible explanation is a significant increase in the rate of convergence has occurred during modern times. The change in rates of convergence might be explained by recent changes in the tectonic regime (e.g., changes in subduction dynamics or hot-spot, mantle-plume migration).
2.4 Principal Uncertainties
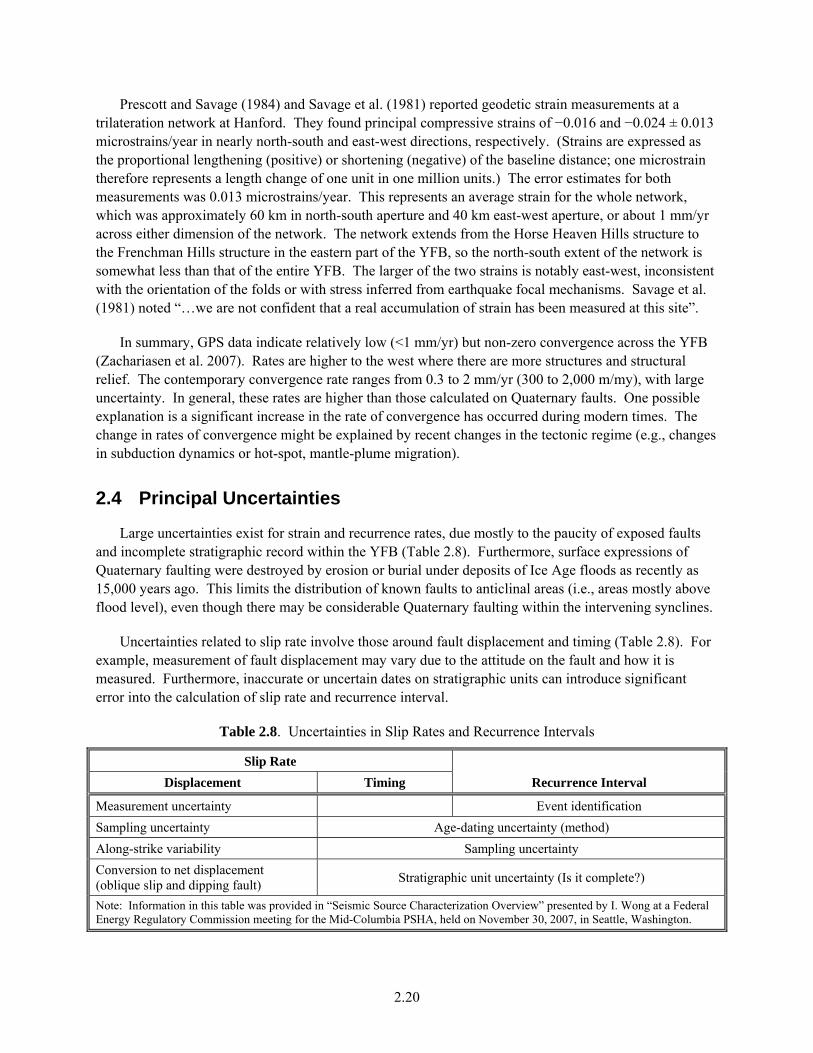
Large uncertainties exist for strain and recurrence rates, due mostly to the paucity of exposed faults and incomplete stratigraphic record within the YFB (Table 2.8). Furthermore, surface expressions of Quaternary faulting were destroyed by erosion or burial under deposits of Ice Age floods as recently as 15,000 years ago. This limits the distribution of known faults to anticlinal areas (i.e., areas mostly above flood level), even though there may be considerable Quaternary faulting within the intervening synclines.
Uncertainties related to slip rate involve those around fault displacement and timing (Table 2.8). For example, measurement of fault displacement may vary due to the attitude on the fault and how it is measured. Furthermore, inaccurate or uncertain dates on stratigraphic units can introduce significant error into the calculation of slip rate and recurrence interval.
Table 2.8. Uncertainties in Slip Rates and Recurrence Intervals
Slip Rate
Recurrence Interval Displacement Timing
Measurement uncertainty Event identification
Sampling uncertainty Age-dating uncertainty (method)
Along-strike variability Sampling uncertainty
Conversion to net displacement (oblique slip and dipping fault)
Stratigraphic unit uncertainty (Is it complete?)
Note: Information in this table was provided in “Seismic Source Characterization Overview” presented by I. Wong at a Federal Energy Regulatory Commission meeting for the Mid-Columbia PSHA, held on November 30, 2007, in Seattle, Washington.
2.21
Large uncertainties are associated with extremely short duration (few decades) of trilateration and GPS geodetic data, compared to long-term deformation rates averaged over millions years. Uncertainties in the strain rates are on the order of the signal size (Zachariasen et al. 2006). Errors in measurement or short-term changes tend to disappear when averaged over the long term. Geodetic measurements, especially those from some of the early geodetic surveys (e.g., Tillson 1970), were less than the magnitude of the errors associated with the measurements (Rohay and Davis 1983). Although signals are small and uncertainties large, geodetic results are consistent with regional north-south compression and tectonic rotation for eastern Washington (Zachariasen et al. 2006). Thus, even though the data confirm the model for plate subduction and tectonic rotation, the absolute values for plate movements using the GPS data remain highly uncertain.

3.1
3.0 Technical Positions
The long-term rate of tectonic deformation has varied, both temporally and spatially. Reidel et al. (1989) showed that the net vertical offset during initial development of the YFB occurred very rapidly (up to 10 mm/y [10,000 m/my]) but had slowed to as little as 0.03 mm/y (30 m/my) by the late Miocene. However, spatially, some structures (e.g., Toppenish Ridge) appear to have large net slip rates (up to 1,000 m/my) that continued into, or did not start until, the Quaternary. Nevertheless, the relatively rapid rate of net Quaternary slip at Toppenish Ridge is atypical and may just be an artifact of the relatively recent activity along this structure. Thus, long-term rates of tectonic deformation should not be applied uniformly to all Yakima fold structures.
In general, the highest rates of vertical displacement occurred at the beginning but slowed considerably within the first million years of Columbia River basalt volcanism. Long-term rates are much lower than modern geodetic measurements (1 to 2 mm/yr [1,000 to 2,000 m/my]) of crustal shortening across the YFB. Because it has been shown that long-term rates of tectonic uplift may exceed crustal shortening by a factor of two (Table 2.2) it appears that either 1) the rates of modern (e.g., GPS) crustal shortening are many times greater today than in the post-10 Ma geologic past or 2) geodetic GPS measurements are not yet capable of resolving the low deformation rates.
Based on literature review, three alternative conceptual models (ACMs), accounting for the rate of tectonic deformation including strain rates and recurrence rates, have been identified. The evidence cited in the expert community to support (or contradict) the three ACMs is presented in the following paragraphs.
In the evaluation of ACMs, the long-term rates of tectonic deformation over the last 17 million years; that is, the period since the initiation of the Columbia River Basalt Group, is used as the standard with which to compare deformation over the next few thousand years. The long-term average strain rate ranges from approximately 0.01 to 0.03 mm/yr (10 to 30 m/my) at the low end to approximately 0.075 to 0.25 mm/yr (75 to 250 m/my) at the upper end (Reidel et al. 1994; Table 2.2).
The data to support the alternative conceptual models on possible future rates of deformation are conflicting and inconclusive at this time. Clearly more data are needed before the models can be adequately evaluated and compared.
3.1 Alternative Conceptual Model 1
The long-term average rate of tectonic uplift (vertical component of strain) within the YFB, based on relief measured on basalt flows and other geomorphic surfaces, covers an extremely wide range (0.01 to 10 mm/yr [10 to 10,000 m/my]). More typically, most estimates are within the range of 0.1 to 1.0 mm/y (100 to 1,000 m/my). Because of the extremely wide range, most strain rates calculated on Quaternary faults automatically fall into this same range. This suggests that long-term tectonic deformations, which started in the Miocene, have continued at roughly the same, albeit highly variable, rates through the
Strain and recurrence rates over the next few thousand years will be about the same as those based on long-term geologic rates of tectonic deformation within the Yakima folds.
3.2
Quaternary. However, significant statistical uncertainty surrounds this hypothesis due to the very low number of observations for the Quaternary within the YFB (Table 2.4).
Calculated slip rates on the Mill Creek thrust fault (Toppenish Ridge) range from 0.08 to 0.1 mm/y (80 to 100 m/my) for the last 145 to 180 ky to more than 0.43 mm/y (>430 m/my) over approximately the last 7 ky. The longer-term rate falls neatly within the long-term average rate for the YFB. The much higher short-term rate, while still within the overall range, may be biased by the more recent activity on this structure. Of the other known faults with measured slip rates, reported fault-slip rates on the Saddle Mountains (>0.16 to 0.65 mm/y [160 to 650 m/my]), and Union Gap (0.41 mm/y [410 m/my]) fall within the normal long-term average net slip rate for the YFB. The Goose Hill fault falls into the lower range (0.02 to 0.04 mm/yr [20 to 40 m/my]), comparable to those calculated for deformation during the late Miocene (Saddle Mountains Basalt) by Reidel et al. (1989). The central Gable Mountain fault, on the other hand, has a net slip rate (0.003 to 0.005 mm/y [3 to 5 m/my]) that is less than the regional long-term net strain rate. The central Gable Mountain fault, however, appears to be a cross or tear fault and therefore would not be expected to produce as much offset as one of the principal east-west trending primary faults.
There are no known estimates of recurrence rates for pre-Quaternary faulting and only three estimates of recurrence on Quaternary-age faults. These are 5 to 120 ky at Toppenish Ridge, 30 to 50 ky on Ahtanum Ridge, and 20 to 30 ky at Union Gap (Table 2.4). Thus, no data are available from which to determine longer-term recurrence intervals back to the Miocene. In summary, there is considerable evidence to suggest present rates of tectonic deformation are within the range of those observed since the Miocene.
3.2 Alternative Conceptual Model 2
Modern geodetic measurements appear to support a model for higher strain rates compared to those averaged since the Miocene. The geodetic rate of horizontal shortening over the YFB may be on the order of 1 to 2 mm/yr (1,000 to 2,000 m/my) (Savage et al. 1981; Miller et al. 2001; McCaffrey et al. 2007), which is significantly larger than the long-term late-Miocene geologic strain rates (0.01 to 0.075 mm/yr [10 to 75 m/my]) (Table 2.1). In fact, these rates of deformation are unprecedented, except during earliest eruptions of Grand Ronde Basalt, which produced deformation rates as high as 10,000 m/my (Reidel et al. 1989, 1994) but only for a relatively short period (~1 my duration) during the early Miocene. It seems extremely unlikely that the modern rate of deformation would match that of the early Miocene, however, without other indicators of deformation, such as dramatic increases in fault activity and/or seismicity. In general, increased activity is absent with the possible exception of Toppenish Ridge.
Because of the extremely short duration of geodetic measurements and the uncertainty in the accuracy of the data, it is not understood at the present time if these modern rates of deformation are accurate or representative of rates that might occur over the next few thousand years. If contemporary strain rates are truly occurring at a higher rate, it is possible recurrence intervals may get shorter in the future due to a more rapid rate of stress buildup. However, this is not supported by other indicators (e.g., faulting or seismicity) to suggest an increase in stress levels. Thus, based on all available information, it appears
Strain and recurrence rates over the next few thousand years will be significantly greater than those based on long-term tectonic deformation within the Yakima folds.
3.3
relatively high rates of tectonic deformation observed via GPS measurements are anomalous and should not be expected to continue far into the future.
3.3 Alternative Conceptual Model 3
The long-term rates of tectonic deformation were shown to have slowed considerably from up to 10,000 m/my to as little as 30 m/my between the beginning and end of CRB volcanism (Reidel et al. 1989). Based on the amount of relief existing on a few geomorphic surfaces within the YFB, Reidel et al. (1989) estimated the long-term low-average rate continued at approximately 30 m/my into the Quaternary. While it is possible the rate of deformation might have slowed further through the Pleistocene and into the Holocene, there currently are not enough data to support such a finding.
One hypothesis for the YFB is that the basaltic volcanism and folding are directly related to wrinkle-ridge development over a mantle-plume hot spot. According to the theory of Mege and Ernst (2001), Yakima fold ridges formed as the crust moved over the Yellowstone hot spot when it lay beneath the Columbia Plateau 14 to 17 million years ago. Accordingly, fold development and growth would subside after passage of the hot spot, which has migrated southwestward beneath southern Idaho (Snake River Plain) and now resides in the Yellowstone area of northwest Wyoming. Therefore, according to this model, tectonic activity within the YFB should have subsided or ceased with the migration of the Yellowstone hot spot away from the Columbia Plateau to the southwest.
Among YFB characteristics, extremely rapid subsidence and net vertical offset at the beginning of CRB volcanism is consistent with deformation above a mantle plume (Mege and Ernst 2001). On the other hand, geologic and geodetic data suggest tectonic deformation continues at rates equal to or greater than those in the late Miocene. Furthermore, the main Columbia River basalt activity occurred 400 km north of the Yellowstone plume track, suggesting other factors like plate convergence had a stronger influence on volcanism and tectonism (Reidel et al. 2005). This is inconsistent with the mantle-plume model, which suggests tectonic deformation should have subsided or ceased long ago as the mantle plume migrated away from the Columbia Plateau. In summary, available information on rates of tectonic deformation for the Pacific Northwest do not suggest reductions in strain rate. Instead, folding and faulting are expected to continue at about the same, or perhaps a greater, rate than that observed since the Miocene.
Strain and recurrence rates over the next few thousand years will be significantly less than those based on long-term tectonic deformation within the Yakima folds.

4.1
4.0 Approaches to Reducing Uncertainty
While the principal intent of this report is to provide information resources that could be used to inform a characterization of the current state of uncertainty regarding slip rates and recurrence intervals in the YFB, this section suggests areas of research and analysis that could, in the future, result in narrowing of these uncertainties.
4.1 Apply Promising New Age-Dating Techniques
Two principal limiting factors in the determination of slip rates and recurrence intervals on faults have been the 1) lack of sediments and 2) lack of dateable materials associated with faults. In the past, reliable age dates have been dependent on obtaining sediments with organic matter on which to perform radiocarbon dating, which itself is limited due to the relatively short half-life of radioactive 14C (5,730 years), which is effective at dating late Quaternary deposits only less than about 40,000 years old. Other dating methods include radiometric dating (U/Th isotope ratio) of pedogenic calcium carbonate (caliche) and dating of volcanic-tephra marker horizons. A problem with these methods is the sporadic and uneven distribution of sediments containing these datable materials in the sedimentary record. Thus, reliable age dates on which to assess strain rates and recurrence intervals are relatively few; with these traditional methods, it has been rare to obtain more than one reliable age date associated with any particular fault.
In the last 20 years, a number of promising new age-dating techniques have been developed for Quaternary deposits, including optically stimulated luminescence (OSL), exposure to cosmogenic-isotopes (i.e., 10Be, 26Al, 36Cl, 21Ne), and cosmogenic-isotope burial dating (Walker 2005; Siame et al. 2006). These methods can be applied to any sediment or rock material that has, sometime in the geologic past, been exposed at the land surface. Because sedimentation normally occurs in discrete pulses separated by tens to hundreds or thousands of years, a separate cosmogenic-burial age may be obtained from each sedimentary pulse. This method significantly expands the number of potential horizons and types of materials that can be dated compared to the more traditional methods. These methods could significantly refine the history of faulting and more accurately derive strain rates and recurrence intervals through soil chronosequencing (Zachariasen et al. 2006). These methods are particularly good for dating paleosols, with or without caliche horizons, and thus may be applied to many more fault structures than in the past.
A comprehensive campaign could be initiated to sample the sediment profile at any existing and new outcrops of exposed faults using the most modern age-dating techniques, including OSL and cosmogenic-isotope dating. These results would provide a significantly expanded number of age dates on which to base more reliable estimates of fault slip and recurrence.
4.2 Conduct Aerial LiDAR Survey
An aerial light detection and ranging (LiDAR) survey of the YFB could be used to further identify and characterize lineaments and other tectonic features (Zachariasen et al. 2006). LiDAR is a new remote-sensing technique that can provide highly detailed images of surface features using reflected laser beams. The result provides much higher resolution than radar. The primary difference between LiDAR and radar is that with LiDAR, much shorter wavelengths of the electromagnetic spectrum are used. In
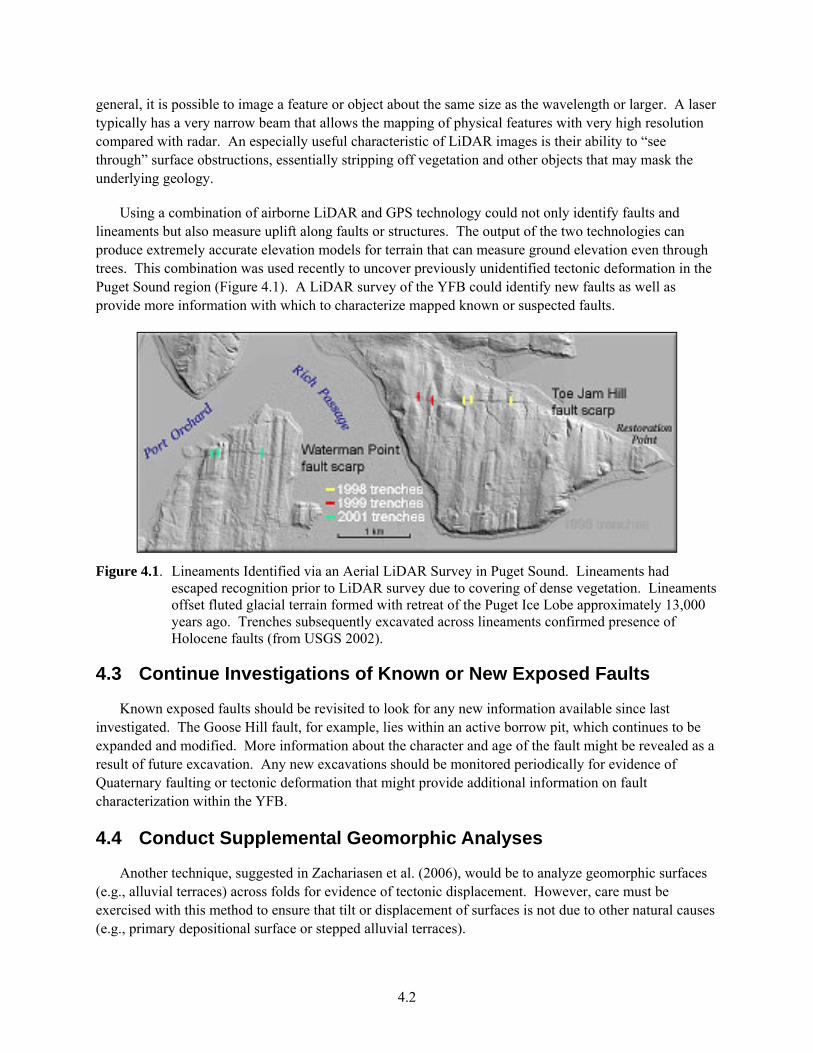
4.2
general, it is possible to image a feature or object about the same size as the wavelength or larger. A laser typically has a very narrow beam that allows the mapping of physical features with very high resolution compared with radar. An especially useful characteristic of LiDAR images is their ability to “see through” surface obstructions, essentially stripping off vegetation and other objects that may mask the underlying geology.
Using a combination of airborne LiDAR and GPS technology could not only identify faults and lineaments but also measure uplift along faults or structures. The output of the two technologies can produce extremely accurate elevation models for terrain that can measure ground elevation even through trees. This combination was used recently to uncover previously unidentified tectonic deformation in the Puget Sound region (Figure 4.1). A LiDAR survey of the YFB could identify new faults as well as provide more information with which to characterize mapped known or suspected faults.
Figure 4.1. Lineaments Identified via an Aerial LiDAR Survey in Puget Sound. Lineaments had escaped recognition prior to LiDAR survey due to covering of dense vegetation. Lineaments offset fluted glacial terrain formed with retreat of the Puget Ice Lobe approximately 13,000 years ago. Trenches subsequently excavated across lineaments confirmed presence of Holocene faults (from USGS 2002).
4.3 Continue Investigations of Known or New Exposed Faults
Known exposed faults should be revisited to look for any new information available since last investigated. The Goose Hill fault, for example, lies within an active borrow pit, which continues to be expanded and modified. More information about the character and age of the fault might be revealed as a result of future excavation. Any new excavations should be monitored periodically for evidence of Quaternary faulting or tectonic deformation that might provide additional information on fault characterization within the YFB.
4.4 Conduct Supplemental Geomorphic Analyses
Another technique, suggested in Zachariasen et al. (2006), would be to analyze geomorphic surfaces (e.g., alluvial terraces) across folds for evidence of tectonic displacement. However, care must be exercised with this method to ensure that tilt or displacement of surfaces is not due to other natural causes (e.g., primary depositional surface or stepped alluvial terraces).
5.1
5.0 Cited References
Baker VR, BN Bjornstad, AJ Busacca, KR Fecht, EP Kiver, UL Moody, JG Rigby, DF Stradling, and AM Tallman. 1991. Quaternary geology of the Columbia Plateau. In Quaternary Nonglacial Geology: Conterminous U.S., RB Morrison (ed), The Geology of North America, Volume K-2. Geological Society of America, Boulder, Colorado.
Bentley RD, JL Anderson, NP Campbell, and DA Swanson. 1980. Stratigraphy and Structure of the Yakima Indian Reservation, with Emphasis on the Columbia River Basalt Group. Open-File Report 80-200, U.S. Geological Survey, Reston, Virginia.
Bentley RD, NP Campbell, and JE Powell. 1993. Geologic Maps of Part of the Yakima Fold Belt, Northeastern Yakima County, Washington. Open File Report 93-3, Washington State Department of Natural Resources, Division of Geology and Earth Resources, Olympia.
Bjornstad BN. 2006. On the Trail of the Ice Age Floods: A Geological Field Guide to the Mid-Columbia Basin. Keokee Company Publishing, Inc., Sandpoint, Idaho.
Budnitz RJ, G Apostolakis, DM Boore, LS Cluff, KJ Coppersmith, CA Cornell, and PA Morris. 1997. Recommendations for Probabilistic Seismic Hazard Analysis: Guidance on Uncertainty and Use of Experts. NUREG/CR-6372, U.S. Nuclear Regulatory Commission, Washington, D.C.
Burbank DW and RS Anderson. 2001. Tectonic Geomorphology: A Frontier in Earth Science. Blackwell Scientific Publications, Inc., Boston.
Campbell NP and RD Bentley. 1981. Late Quaternary deformation of the Toppenish Ridge uplift in south-central Washington. Geology 9:519–524.
Chamness MA, K Winsor, and SD Unwin. 2012. A Summary of Coupled, Uncoupled, and Hybrid Tectonic Models for the Yakima Fold Belt – Topical Report. PNNL-17500, Pacific Northwest National Laboratory, Richland, Washington.
Converse, Davis and Associates. 1969. Logs of Exploratory Trenches on Gable Mountain at the Hanford Works of the U.S. Atomic Energy Commission, Richland, Washington. Project No. 69-504-H, Atlantic Richfield Hanford Company, Richland, Washington.
Denlinger RP and DRH O’Connell. 2010. Simulations of cataclysmic outburst floods from Pleistocene glacial Lake Missoula. Geological Society of America Bulletin 122:678–689.
DOE (U.S. Department of Energy). 1988. Consultation Draft: Site Characterization Plan, Reference Repository Location, Hanford Site, Washington. DOE/RW-0164, U.S. Department of Energy, Office of Civilian Radioactive Waste Management, Washington, D.C.
DOE (U.S. Department of Energy). 2002. Standardized Stratigraphic Nomenclature for the Post-Ringold Formation Sediments Within the Central Pasco Basin. DOE/RL-2002-39, Rev. 0, U.S. Department of Energy, Richland Operations Office, Richland, Washington.
5.2
Fecht KR, KA Lindsey, BN Bjornstad, DG Horton, GV Last, and SP Reidel. 1999. Clastic Injection Dikes of the Pasco Basin and Vicinity – Geologic Atlas Series. BHI-01103 Rev. 1, Bechtel Hanford, Inc., Richland, Washington.
Geomatrix Consultants, Inc. 1988. Seismotectonic Evaluation of the Northern Cascade Mountains Geomorphic Province for Bumping Lake, Tieton, Keechelus, Kachess, Cle Elum, and Clear Creek Dams. Oakland, California.
Geomatrix Consultants, Inc. 1990. Seismotectonic Evaluation – Walla Walla Section of the Columbia Plateau Geomorphic Province. Oakland, California.
Geomatrix Consultants, Inc. 1996. Probabilistic Seismic Hazard Analysis, DOE Hanford Site, Washington. WHC-SD-W236A-TI-002, Rev. 1, Westinghouse Hanford Company, Richland, Washington.
Hagood MC. 1986. Structure and Evolution of the Horse Heaven Hills in South-Central Washington. Rockwell Hanford Operations, Richland, Washington.
Last GV, BN Bjornstad, and AJ Busacca. 2004. The Influence of Ice-Age Floods on the Terrior of Washington Wines, Field Guide. Ice Age Floods Institute Field Trip Guidebook, October 30, 2004. PNWD-SA-6753, Pacific Northwest National Laboratory, Richland, Washington.
Last GV, K Winsor, and SD Unwin. 2012. A Summary of Information on the Behavior of the Yakima Fold Belt as a Structural Entity – Topical Report. PNNL-17471, Pacific Northwest National Laboratory, Richland, Washington.
Lidke DJ. 2002. Fault number 563b, Umtanum Ridge structures, folds and other faults of the Umtanum Ridge-Gable Mountain uplift. In Quaternary Fault and Fold Database of the United States – Version 1.0. Open-File Report 03-417, U.S. Geological Survey. Available at http://qfaults.cr.usgs.gov.
McCaffrey R, AI Qamar, RW King, R Wells, G Khazaradze, CA Williams, CW Stevens, JJ Vollick, and PC Zwick. 2007. Fault locking, block rotation and crustal deformation in the Pacific Northwest. Geophysical Journal International 169(3):1315–1340.
McQuarrie N. 1993. Structural analysis of the Wallula Gap Fault, southeastern Washington. Abstracts with Programs 25:119, Geological Society of America, Boulder, Colorado.
Mege D and RE Ernst. 2001. Contractional effects of mantle plumes on Earth, Mars, and Venus. In Mantle Plumes: Their Identification Through Time, RE Ernst and KL Buchanan (eds), Special Paper 352, pp. 103–140. Geological Society of America, Boulder, Colorado.
Miller MM, DJ Johnson, CM Rubin, H Dragert, K Wang, A Qamar, and C Goldfinger. 2001. GPS-determination of along-strike variation in Cascadia margin kinematics: Implications for relative plate motion, subduction zone coupling, and permanent deformation. Tectonics 20:161–176.
NRC (U.S. Nuclear Regulatory Commission). 1982. Safety Evaluation Report Related to the Operation of WPPS Nuclear Project No. 2, Docket No. 50-397 – Washington Public Power Supply System. NUREG-0892, Supplement No. 1, U.S. Nuclear Regulatory Commission, Office of Nuclear Reactor Regulation, Washington, D.C.
5.3
PSPL (Puget Sound Power & Light Company). 1981. Skagit Hanford Nuclear Project, Application for Site Certification/Environmental Report. Puget Sound Power & Light Company, Bellevue, Washington.
Pillans B and T Naish. 2004. Defining the Quaternary. Quaternary Science Reviews 23:2271–2282.
Prescott WH and JC Savage. 1984. Crustal Deformation near Hanford, WA. Open-File Report 84-797, U.S. Geological Survey, Menlo Park, California.
Reidel SP. 1984. The Saddle Mountains: the evolution of an anticline in the Yakima Fold Belt. American Journal of Science 284(8):942–978.
Reidel SP, GR Scott, DR Bazard, RW Cross, and B Dick. 1984. Post-12 million year clockwise rotation in the central Columbia Plateau, Washington. Tectonics 3(2):251–273.
Reidel SP and KR Fecht. 1994. Geologic Map of the Priest Rapids 1:100,000 quadrangle, Washington. Open File Report 94-13, Washington State Department of Natural Resources, Division of Geology and Earth Resources, Olympia.
Reidel SP, KR Fecht, MC Hagood, and TL Tolan. 1989. The geologic evolution of the central Columbia Plateau.In Volcanism and Tectonism in the Columbia River Flood-Basalt Province, SP Reidel and PR Hooper (eds), Special Paper 239, pp. 247–264. Geological Society of America, Boulder, Colorado.
Reidel SP, NP Campbell, KR Fecht, and KA Lindsey. 1994. Late Cenozoic structure and stratigraphy of south-central Washington. In Regional Geology of Washington, ES Cheney and R Lasmanis (eds), Washington Division of Geology and Earth Resources Bulletin 80, pp. 159–180. Washington State Department of Natural Resources, Division of Geology and Earth Resources, Olympia.
Reidel SP, J Bush, D Garwood, J Kauffman, and BS Martin. 2005. The tectonic evolution of the northern Columbia River basalt province. Abstracts with Programs 37(7):126, Geological Society of America, Boulder, Colorado.
Reiter L. 1990. Earthquake Hazard Analysis: Issues and Insights. Columbia University Press, New York.
Repasky TR, NP Campbell, and AJ Busacca.. 1998. Earthquake Hazard Study in the Vicinity of Toppenish Basin, South-Central Washington. U.S. Geological Survey, National Earthquake Hazards Reduction Program, Menlo Park, California.
Rice DG. 1981. Evaluation of a Linear Surface Feature on the Army’s Yakima Firing Center near Priest Rapids Dam, Washington. Washington Public Power Supply System, Richland, Washington.
Rohay AC and JD Davis. 1983. Contemporary deformation in the Pasco Basin area of the central Columbia Plateau. In Preliminary Interpretation of the Tectonic Stability of the Reference Repository Location, Cold Creek Syncline, JA Caggiano and DW Duncan (eds), pp. 6-1–6.29. RHO-BW-ST-19P, Rockwell Hanford Operations, Richland, Washington.
Savage JC, M Lisowski, and WH Prescott. 1981. Geodetic measurements in Washington. Journal of Geophysical Research 86:4929–4940.
5.4
Siame LL, DL Bourles, and ET Brown (eds). 2006. In Situ-Produced Cosmogenic Nuclides and Quantification of Geological Processes. Special Paper 415, Geological Society of America, Boulder, Colorado.
Tillson DD. 1970. Analysis of crustal changes in the Columbia Plateau area from contemporary triangulation and leveling measurements. BNWL-CC-2174, Battelle-Northwest, Richland, Washington.
USGS (U.S. Geological Survey). 2002. Lidar discovers active faults. Available at http://geomaps.wr.usgs.gov/pacnw/resfzplr1.html (March 2008).
WPPSS (Washington Public Power Supply System). 1981. Late Cenozoic tectonics of the Pacific Northwest with special reference to the Columbia Plateau. In Washington Public Power Supply System Nuclear Project Number 2, Final Safety Analysis Report, Amendment 18, Appendix 2.5N, pp. 2.5N-1–2.5N-44. Washington Public Power Supply System, Richland, Washington.
WPPSS, 1982, Safety evaluation report related to the operation of WPPS Nuclear Project No. 2, Docket No 50-397, U.S. Nuclear Regulatory Commission NUREG-0892, Supplement No. 1.
Walker M. 2005. Quaternary Dating Methods. John Wiley & Sons Ltd., Chichester, West Sussex, England.
West MW, AJ Busacca, GW Berger, ME Shaffer, and FX Ashland. 1994. A “Pilot” Study of Quaternary Surface Deformation, Saddle Mountains Anticline, Northern Pasco Basin, Washington. U.S. Geological Survey, Menlo Park, California.
West MW, FX Ashland, AJ Busacca, GW Berger, and ME Shaffer. 1996. Late Quaternary deformation, Saddle Mountains anticline, south-central Washington. Geology 24(12):1123–1126.
West MW. 1997. A Continuation of a “Pilot” Study of Quaternary Surface Deformation, Saddle Mountains Anticline, Northern Pasco Basin, Washington. U.S. Geological Survey, Menlo Park, California.
Williams BA, BN Bjornstad, R Schalla, and WD Webber. 2000. Revised Hydrogeology for the Suprabasalt Aquifer System, 200-East Area and Vicinity, Hanford Site, Washington. PNNL-12261, Pacific Northwest National Laboratory, Richland, Washington.
Wong I, M Hemphill-Haley, M Dober, and R Schapiro. 2002. Probabilistic Seismic Hazard Analyses – Bumping Lake, Clear Creek, French Canyon, and Tieton Dams. U.S. Bureau of Reclamation, Denver, Colorado.
Zachariasen J, S Olig, I Wong, and RS Yeats. 2006. Technical Review of the Seismic Source Model for the Yakima Fold Belt. URS Corporation, Oakland, California.
Appendix A
Identification of Topical Reports to Be Prepared for the Future Hanford Site-Wide
Probabilistic Seismic Hazard Analysis

A.1
Appendix A
Identification of Topical Reports to Be Prepared for the Future Hanford Site-Wide Probabilistic Seismic Hazard
Analysis
August 1, 2007
A.1 Background
A series of topical reports will be prepared as a resource to conducting a future probabilistic seismic hazard analysis (PSHA) of the Hanford Site. These topical reports will focus on technical issues that satisfy both following criteria:
3. It is an issue that is important to the seismic hazard. That is, the sensitivity of the calculated seismic hazard to the specific resolution of the issue is significant. Equivalently, uncertainty in the appropriate resolution of the issue results in a significant contribution to the total uncertainty in the estimate of the seismic hazard.
4. The correct resolution of the issue is a matter of contention in the expert community. That is, there are opposing schools of thought on the correct resolution, in contrast to a situation in which there is broad agreement that the correct resolution is uncertain.
The purpose of the topical reports is to summarize the range of opinions expressed by the expert community and to encapsulate the data and publications that support those opinions.
For a PSHA performed in conformance with Senior Seismic Hazard Analysis Committee (SSHAC) Study Level 2 or 3 (as in the case of the future Hanford Site PSHA), it is the function of the technical integrator (TI) to identify appropriate models and, in light of opinions expressed by the expert community, develop a probabilistic characterization of the aleatory variabilities and epistemic uncertainties associated with the models and their quantifications. The topical reports are not intended to resolve the technical issues they address but rather to provide clear expressions of the issues to the TIs, the TI teams, and the subject matter experts assembled to support the PSHA. Further, they provide a summary and compilation of all applicable data and information that pertain to the issues.
Here we identify the topical reports that will be developed as a resource to the future Hanford site-wide PSHA. The areas to be addressed in the topical reports were selected during a meeting on July 12, 2007, involving the following participants:
Tom Brouns, PNNL Ken Buxton, PNNL Kevin Coppersmith, Coppersmith Consulting Steve Reidel, Washington State University Alan Rohay, PNNL Steve Unwin, PNNL.
A.2
The principal resource supporting the deliberations of this group was a report prepared by Kevin Coppersmith, Coppersmith Consulting, in which issues and data needs for a future PSHA were identified and evaluated (draft report of June 11, 2007). For convenience, the tabulation of issues from the Coppersmith report is included in this appendix as Table A.1. This table identifies technical issues related both to seismic source characterization (SSC) and to the analysis of ground motion attenuation (GMA).
A.2 Conclusions
With respect to the selection criteria identified previously, the following conclusions were drawn:
A.2.1 Seismic Source Characterization
Based on review of the SSC issues identified in Table A.1, the recommendation is to prepare topical reports addressing the following issues:
SSC Issue 1: use of coupled versus uncoupled fault models – This issue is assessed to have a High level of contention with Moderate potential for impact on hazard estimation.
SSC Issue 6: whether observation of activity along one Yakima fold structure should be considered an indicator of behavior along all Yakima fold structures – This topic is assessed to have a High level of contention with up to Moderate potential for impact on the hazard estimate.
SSC Issue 7: whether slip rates should be greater than those used in the previous Hanford PSHA, which were based on post-Columbia River Basalt Group ages – This topic is assessed to be Moderately contentious with up to High potential for impact on the hazard estimation.
A.2.2 Ground Motion Attenuation
While the issue of using next generation attenuation (NGA) models could potentially have a high impact on the mean hazard and hazard uncertainty estimates, there is not a high level of contention associated with this or any of the GMA-related issues. Therefore, none of the topical reports will focus on GMA issues.
In addition to the three recommended topical reports identified above, an annotated bibliography of reports and data relevant to all SSC and GMA issues will be assembled, along with copies of all reports for use by the TIs, peer reviewers, and experts.
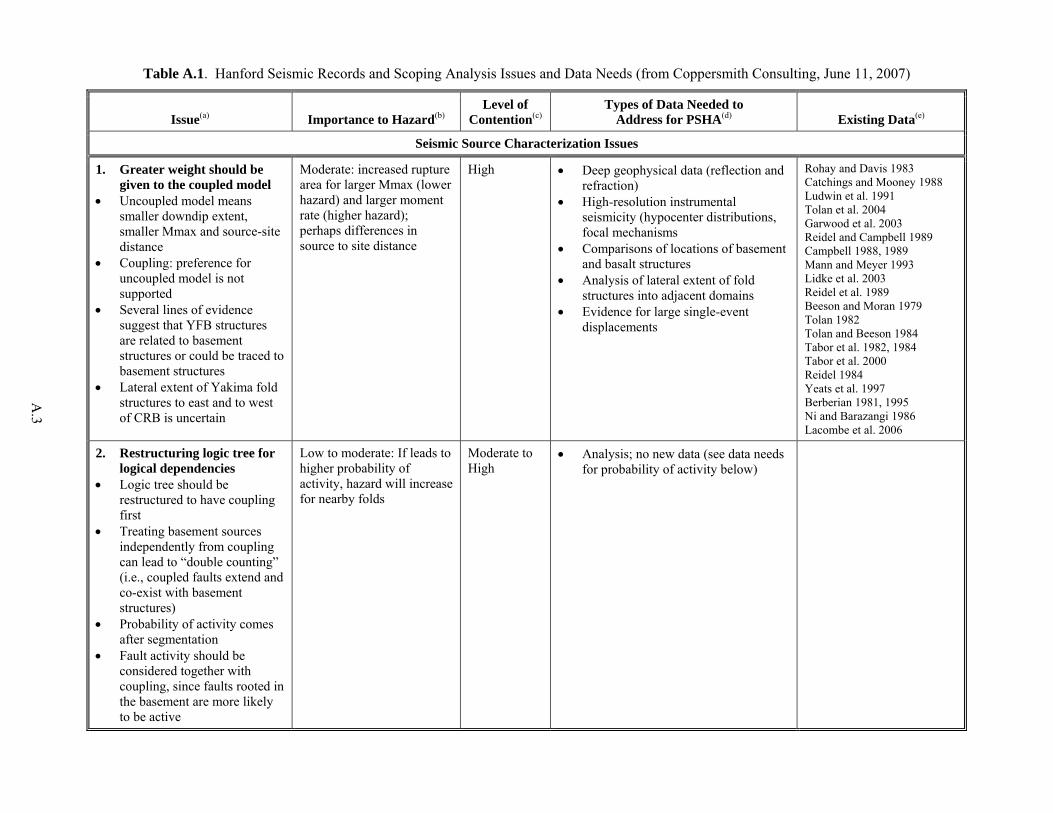
A.3
Table A.1. Hanford Seismic Records and Scoping Analysis Issues and Data Needs (from Coppersmith Consulting, June 11, 2007)
Issue(a) Importance to Hazard(b) Level of
Contention(c) Types of Data Needed to
Address for PSHA(d) Existing Data(e)
Seismic Source Characterization Issues
1. Greater weight should be given to the coupled model
Uncoupled model means smaller downdip extent, smaller Mmax and source-site distance
Coupling: preference for uncoupled model is not supported
Several lines of evidence suggest that YFB structures are related to basement structures or could be traced to basement structures
Lateral extent of Yakima fold structures to east and to west of CRB is uncertain
Moderate: increased rupture area for larger Mmax (lower hazard) and larger moment rate (higher hazard); perhaps differences in source to site distance
High Deep geophysical data (reflection and refraction)
High-resolution instrumental seismicity (hypocenter distributions, focal mechanisms
Comparisons of locations of basement and basalt structures
Analysis of lateral extent of fold structures into adjacent domains
Evidence for large single-event displacements
Rohay and Davis 1983 Catchings and Mooney 1988 Ludwin et al. 1991 Tolan et al. 2004 Garwood et al. 2003 Reidel and Campbell 1989 Campbell 1988, 1989 Mann and Meyer 1993 Lidke et al. 2003 Reidel et al. 1989 Beeson and Moran 1979 Tolan 1982 Tolan and Beeson 1984 Tabor et al. 1982, 1984 Tabor et al. 2000 Reidel 1984 Yeats et al. 1997 Berberian 1981, 1995 Ni and Barazangi 1986 Lacombe et al. 2006
2. Restructuring logic tree for logical dependencies
Logic tree should be restructured to have coupling first
Treating basement sources independently from coupling can lead to “double counting” (i.e., coupled faults extend and co-exist with basement structures)
Probability of activity comes after segmentation
Fault activity should be considered together with coupling, since faults rooted in the basement are more likely to be active
Low to moderate: If leads to higher probability of activity, hazard will increase for nearby folds
Moderate to High
Analysis; no new data (see data needs for probability of activity below)
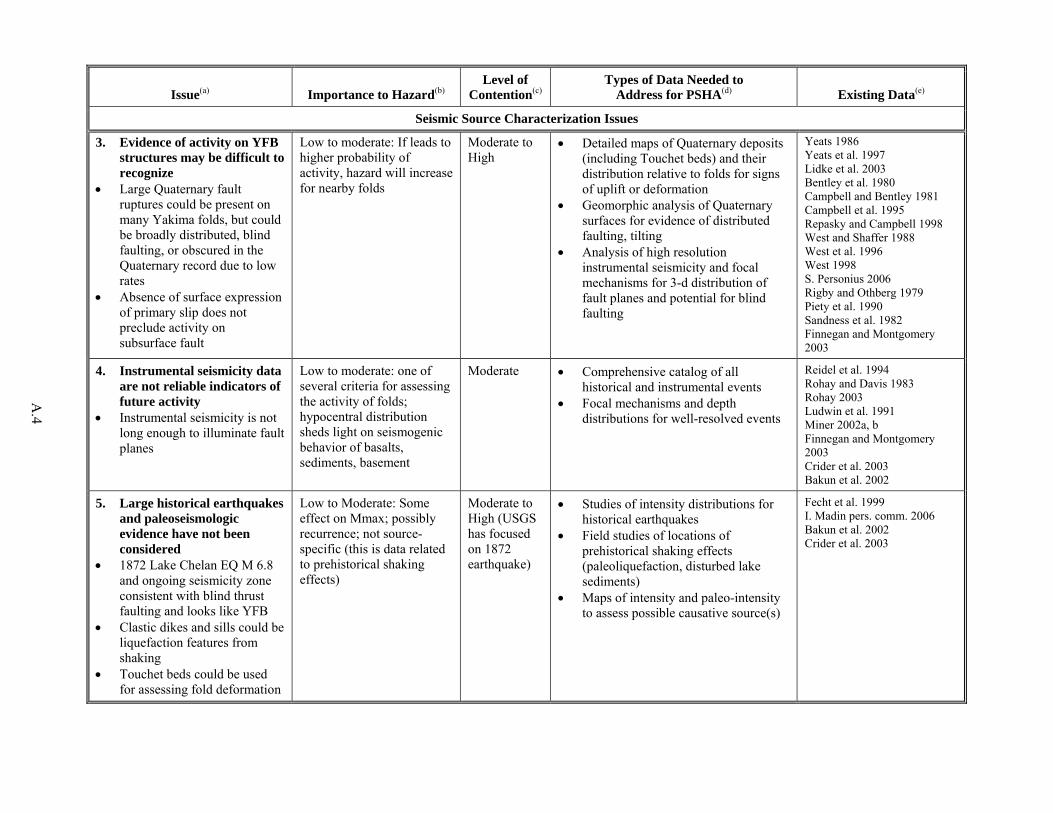
A.4
Issue(a) Importance to Hazard(b) Level of
Contention(c) Types of Data Needed to
Address for PSHA(d) Existing Data(e)
Seismic Source Characterization Issues
3. Evidence of activity on YFB structures may be difficult to recognize
Large Quaternary fault ruptures could be present on many Yakima folds, but could be broadly distributed, blind faulting, or obscured in the Quaternary record due to low rates
Absence of surface expression of primary slip does not preclude activity on subsurface fault
Low to moderate: If leads to higher probability of activity, hazard will increase for nearby folds
Moderate to High
Detailed maps of Quaternary deposits (including Touchet beds) and their distribution relative to folds for signs of uplift or deformation
Geomorphic analysis of Quaternary surfaces for evidence of distributed faulting, tilting
Analysis of high resolution instrumental seismicity and focal mechanisms for 3-d distribution of fault planes and potential for blind faulting
Yeats 1986 Yeats et al. 1997 Lidke et al. 2003 Bentley et al. 1980 Campbell and Bentley 1981 Campbell et al. 1995 Repasky and Campbell 1998 West and Shaffer 1988 West et al. 1996 West 1998 S. Personius 2006 Rigby and Othberg 1979 Piety et al. 1990 Sandness et al. 1982 Finnegan and Montgomery 2003
4. Instrumental seismicity data are not reliable indicators of future activity
Instrumental seismicity is not long enough to illuminate fault planes
Low to moderate: one of several criteria for assessing the activity of folds; hypocentral distribution sheds light on seismogenic behavior of basalts, sediments, basement
Moderate Comprehensive catalog of all historical and instrumental events
Focal mechanisms and depth distributions for well-resolved events
Reidel et al. 1994 Rohay and Davis 1983 Rohay 2003 Ludwin et al. 1991 Miner 2002a, b Finnegan and Montgomery 2003 Crider et al. 2003 Bakun et al. 2002
5. Large historical earthquakes and paleoseismologic evidence have not been considered
1872 Lake Chelan EQ M 6.8 and ongoing seismicity zone consistent with blind thrust faulting and looks like YFB
Clastic dikes and sills could be liquefaction features from shaking
Touchet beds could be used for assessing fold deformation
Low to Moderate: Some effect on Mmax; possibly recurrence; not source-specific (this is data related to prehistorical shaking effects)
Moderate to High (USGS has focused on 1872 earthquake)
Studies of intensity distributions for historical earthquakes
Field studies of locations of prehistorical shaking effects (paleoliquefaction, disturbed lake sediments)
Maps of intensity and paleo-intensity to assess possible causative source(s)
Fecht et al. 1999 I. Madin pers. comm. 2006 Bakun et al. 2002 Crider et al. 2003
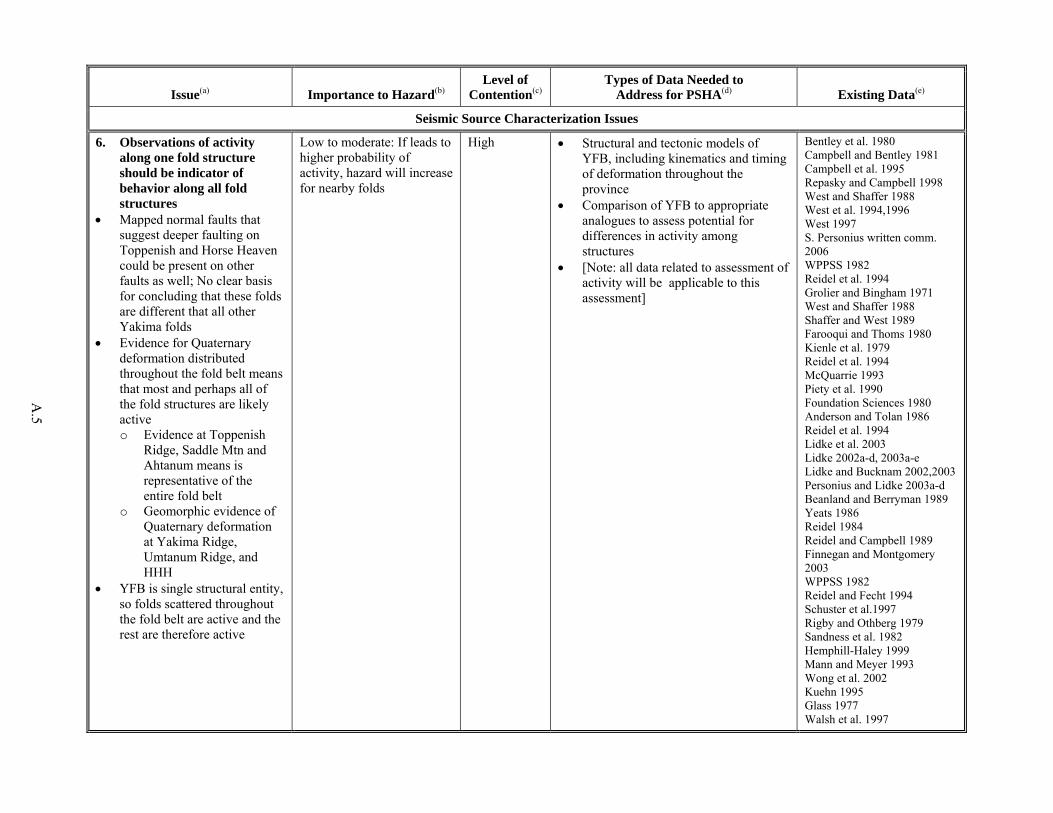
A.5
Issue(a) Importance to Hazard(b) Level of
Contention(c) Types of Data Needed to
Address for PSHA(d) Existing Data(e)
Seismic Source Characterization Issues
6. Observations of activity along one fold structure should be indicator of behavior along all fold structures
Mapped normal faults that suggest deeper faulting on Toppenish and Horse Heaven could be present on other faults as well; No clear basis for concluding that these folds are different that all other Yakima folds
Evidence for Quaternary deformation distributed throughout the fold belt means that most and perhaps all of the fold structures are likely active o Evidence at Toppenish
Ridge, Saddle Mtn and Ahtanum means is representative of the entire fold belt
o Geomorphic evidence of Quaternary deformation at Yakima Ridge, Umtanum Ridge, and HHH
YFB is single structural entity, so folds scattered throughout the fold belt are active and the rest are therefore active
Low to moderate: If leads to higher probability of activity, hazard will increase for nearby folds
High Structural and tectonic models of YFB, including kinematics and timing of deformation throughout the province
Comparison of YFB to appropriate analogues to assess potential for differences in activity among structures
[Note: all data related to assessment of activity will be applicable to this assessment]
Bentley et al. 1980 Campbell and Bentley 1981 Campbell et al. 1995 Repasky and Campbell 1998 West and Shaffer 1988 West et al. 1994,1996 West 1997 S. Personius written comm. 2006 WPPSS 1982 Reidel et al. 1994 Grolier and Bingham 1971 West and Shaffer 1988 Shaffer and West 1989 Farooqui and Thoms 1980 Kienle et al. 1979 Reidel et al. 1994 McQuarrie 1993 Piety et al. 1990 Foundation Sciences 1980 Anderson and Tolan 1986 Reidel et al. 1994 Lidke et al. 2003 Lidke 2002a-d, 2003a-e Lidke and Bucknam 2002,2003 Personius and Lidke 2003a-d Beanland and Berryman 1989 Yeats 1986 Reidel 1984 Reidel and Campbell 1989 Finnegan and Montgomery 2003 WPPSS 1982 Reidel and Fecht 1994 Schuster et al.1997 Rigby and Othberg 1979 Sandness et al. 1982 Hemphill-Haley 1999 Mann and Meyer 1993 Wong et al. 2002 Kuehn 1995 Glass 1977 Walsh et al. 1997
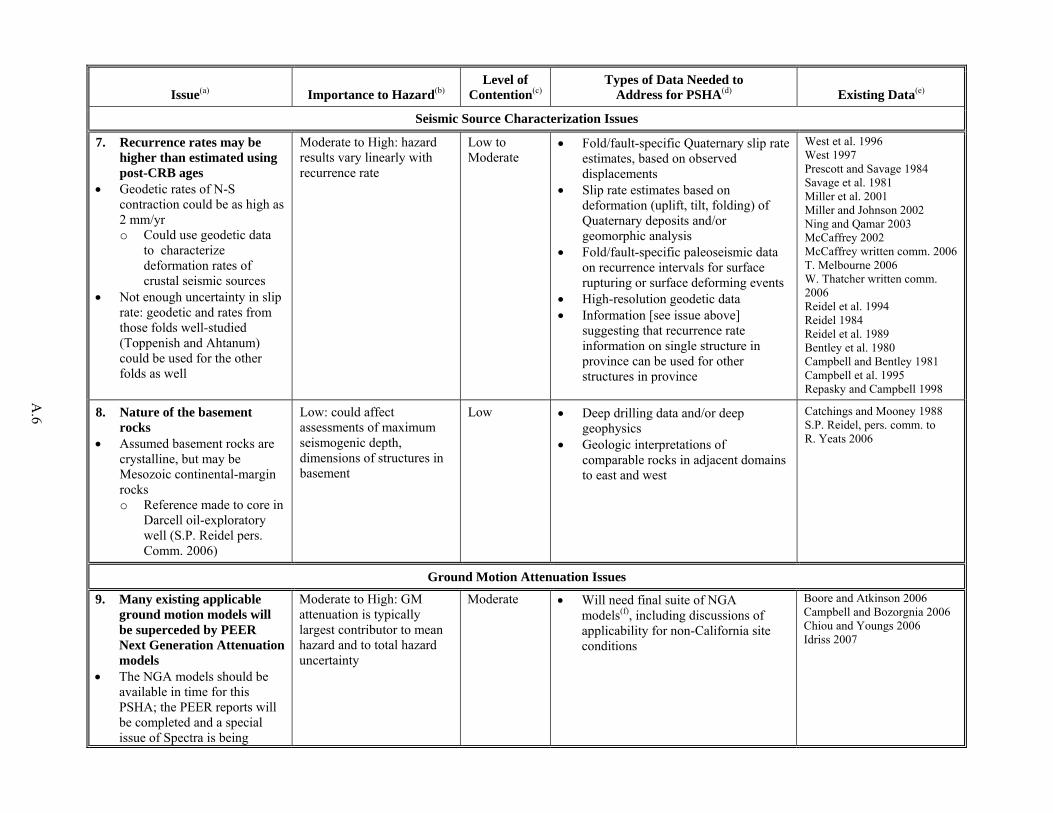
A.6
Issue(a) Importance to Hazard(b) Level of
Contention(c) Types of Data Needed to
Address for PSHA(d) Existing Data(e)
Seismic Source Characterization Issues
7. Recurrence rates may be higher than estimated using post-CRB ages
Geodetic rates of N-S contraction could be as high as 2 mm/yr o Could use geodetic data
to characterize deformation rates of crustal seismic sources
Not enough uncertainty in slip rate: geodetic and rates from those folds well-studied (Toppenish and Ahtanum) could be used for the other folds as well
Moderate to High: hazard results vary linearly with recurrence rate
Low to Moderate
Fold/fault-specific Quaternary slip rate estimates, based on observed displacements
Slip rate estimates based on deformation (uplift, tilt, folding) of Quaternary deposits and/or geomorphic analysis
Fold/fault-specific paleoseismic data on recurrence intervals for surface rupturing or surface deforming events
High-resolution geodetic data Information [see issue above]
suggesting that recurrence rate information on single structure in province can be used for other structures in province
West et al. 1996 West 1997 Prescott and Savage 1984 Savage et al. 1981 Miller et al. 2001 Miller and Johnson 2002 Ning and Qamar 2003 McCaffrey 2002 McCaffrey written comm. 2006 T. Melbourne 2006 W. Thatcher written comm. 2006 Reidel et al. 1994 Reidel 1984 Reidel et al. 1989 Bentley et al. 1980 Campbell and Bentley 1981 Campbell et al. 1995 Repasky and Campbell 1998
8. Nature of the basement rocks
Assumed basement rocks are crystalline, but may be Mesozoic continental-margin rocks o Reference made to core in
Darcell oil-exploratory well (S.P. Reidel pers. Comm. 2006)
Low: could affect assessments of maximum seismogenic depth, dimensions of structures in basement
Low Deep drilling data and/or deep geophysics
Geologic interpretations of comparable rocks in adjacent domains to east and west
Catchings and Mooney 1988 S.P. Reidel, pers. comm. to R. Yeats 2006
Ground Motion Attenuation Issues
9. Many existing applicable ground motion models will be superceded by PEER Next Generation Attenuation models
The NGA models should be available in time for this PSHA; the PEER reports will be completed and a special issue of Spectra is being
Moderate to High: GM attenuation is typically largest contributor to mean hazard and to total hazard uncertainty
Moderate Will need final suite of NGA models(f), including discussions of applicability for non-California site conditions
Boore and Atkinson 2006 Campbell and Bozorgnia 2006 Chiou and Youngs 2006 Idriss 2007
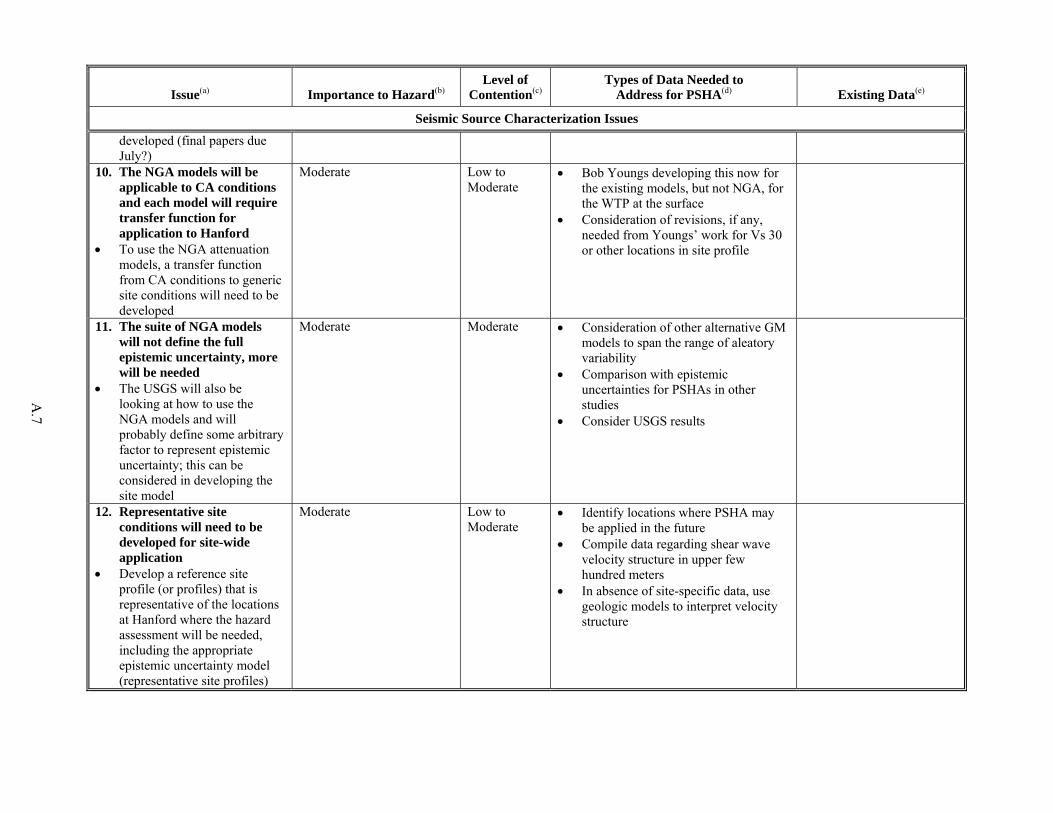
A.7
Issue(a) Importance to Hazard(b) Level of
Contention(c) Types of Data Needed to
Address for PSHA(d) Existing Data(e)
Seismic Source Characterization Issues
developed (final papers due July?)
10. The NGA models will be applicable to CA conditions and each model will require transfer function for application to Hanford
To use the NGA attenuation models, a transfer function from CA conditions to generic site conditions will need to be developed
Moderate Low to Moderate
Bob Youngs developing this now for the existing models, but not NGA, for the WTP at the surface
Consideration of revisions, if any, needed from Youngs’ work for Vs 30 or other locations in site profile
11. The suite of NGA models will not define the full epistemic uncertainty, more will be needed
The USGS will also be looking at how to use the NGA models and will probably define some arbitrary factor to represent epistemic uncertainty; this can be considered in developing the site model
Moderate Moderate Consideration of other alternative GM models to span the range of aleatory variability
Comparison with epistemic uncertainties for PSHAs in other studies
Consider USGS results
12. Representative site conditions will need to be developed for site-wide application
Develop a reference site profile (or profiles) that is representative of the locations at Hanford where the hazard assessment will be needed, including the appropriate epistemic uncertainty model (representative site profiles)
Moderate Low to Moderate
Identify locations where PSHA may be applied in the future
Compile data regarding shear wave velocity structure in upper few hundred meters
In absence of site-specific data, use geologic models to interpret velocity structure
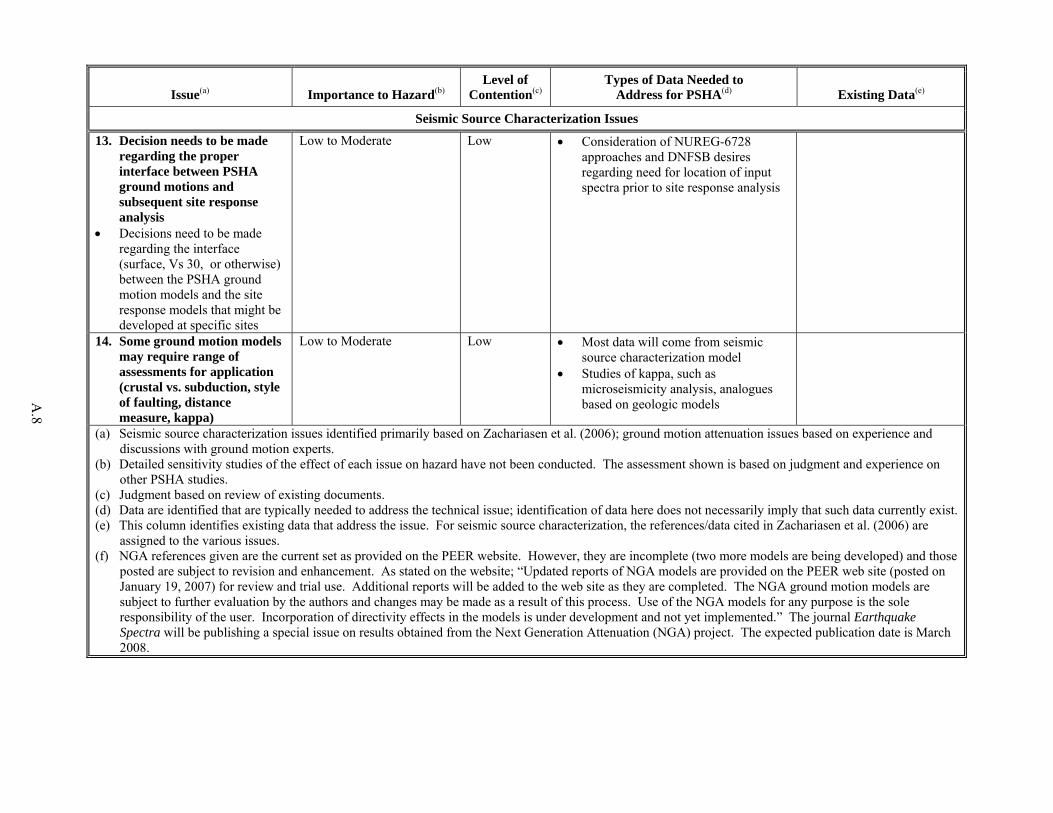
A.8
Issue(a) Importance to Hazard(b) Level of
Contention(c) Types of Data Needed to
Address for PSHA(d) Existing Data(e)
Seismic Source Characterization Issues
13. Decision needs to be made regarding the proper interface between PSHA ground motions and subsequent site response analysis
Decisions need to be made regarding the interface (surface, Vs 30, or otherwise) between the PSHA ground motion models and the site response models that might be developed at specific sites
Low to Moderate Low Consideration of NUREG-6728 approaches and DNFSB desires regarding need for location of input spectra prior to site response analysis
14. Some ground motion models may require range of assessments for application (crustal vs. subduction, style of faulting, distance measure, kappa)
Low to Moderate Low Most data will come from seismic source characterization model
Studies of kappa, such as microseismicity analysis, analogues based on geologic models
(a) Seismic source characterization issues identified primarily based on Zachariasen et al. (2006); ground motion attenuation issues based on experience and discussions with ground motion experts.
(b) Detailed sensitivity studies of the effect of each issue on hazard have not been conducted. The assessment shown is based on judgment and experience on other PSHA studies.
(c) Judgment based on review of existing documents. (d) Data are identified that are typically needed to address the technical issue; identification of data here does not necessarily imply that such data currently exist. (e) This column identifies existing data that address the issue. For seismic source characterization, the references/data cited in Zachariasen et al. (2006) are
assigned to the various issues. (f) NGA references given are the current set as provided on the PEER website. However, they are incomplete (two more models are being developed) and those
posted are subject to revision and enhancement. As stated on the website; “Updated reports of NGA models are provided on the PEER web site (posted on January 19, 2007) for review and trial use. Additional reports will be added to the web site as they are completed. The NGA ground motion models are subject to further evaluation by the authors and changes may be made as a result of this process. Use of the NGA models for any purpose is the sole responsibility of the user. Incorporation of directivity effects in the models is under development and not yet implemented.” The journal Earthquake Spectra will be publishing a special issue on results obtained from the Next Generation Attenuation (NGA) project. The expected publication date is March 2008.
A.9
A.3 Sources Cited in Table A.1
Anderson JL and TL Tolan. 1986. Ages of wrench faulting in interridge basins, southwest Columbia Plateau, Washington and Oregon. Abstracts with Programs 18:82, Geological Society of America, Boulder, Colorado.
Bakun WH, RA Haugerud, MG Hopper, and RS Ludwin. 2002. The December 1872 Washington State earthquake. Bulletin of the Seismological Society of America 92:3239–3258.
Beanland S and KR Berryman. 1989. Style and episodicity of late Quaternary activity on the Pisa-Grandview Fault Zone, Central Otago, New Zealand. New Zealand Journal of Geology and Geophysics 32:451–461.
Beeson MH and MR Moran. 1979. Columbia River Basalt Group stratigraphy in western Oregon. Oregon Geology 41:11–14.
Bentley RD, JL Anderson, NP Campbell, and DA Swanson. 1980. Stratigraphy and Structure of the Yakima Indian Reservation, with Emphasis on the Columbia River Basalt Group. Open-File Report 80-200, U.S. Geological Survey, Reston, Virginia.
Bentley RD, NP Campbell, and JE Powell. 1993. Geologic Maps of Part of the Yakima Fold Belt, Northeastern Yakima County, Washington. Open File Report 93-3, Washington State Department of Natural Resources, Division of Geology and Earth Resources, Olympia.
Bentley RD and NP Campbell. 1983. Geologic map of the Yakima quadrangle, Washington (1 sheet, scale 1:62,500). Map GM-29, Washington State Department of Natural Resources, Division of Geology and Earth Resources, Olympia.
Berberian M. 1981. Active faulting and tectonics of Iran. In Zagros-Hindu-Kush-Himalaya Geodynamic Evolution, HK Gupta and FM Delany (eds), Geodynamic Series 3, pp. 33–69. American Geophysics Union, Washington, D.C.
Berberian M. 1995. Master “blind” thrust faults hidden under the Zagros folds: Active basement tectonics and surface morphotectonics. Tectonophysics 241:193–224.
Boore DM and GM Atkinson. 2006. Boore-Atkinson Provisional NGA Empirical Ground-Motion Model for the Average Horizontal Component of PGA, PGV and SA at Spectral Periods of 0.05, 0.1,0.2, 0.3, 0.5, 1, 2, 3, 4, and 5 seconds. PEER-Lifelines Next Generation Project (Revised 27 October 2006), Pacific Earthquake Engineering Research Center, University of California, Berkeley.
Campbell KW and Y Bozorgnia. 2006. Campbell-Bozorgnia NGA Empirical Ground Motion Model for the Average Horizontal Component of PGA, PGV, PGD and SA at Selected Spectral Periods Ranging from 0.01–10.0 Seconds (Version 1.1). Pacific Earthquake Engineering Research Center, University of California, Berkeley.
Campbell NP. 1983. Correlation of late Cenozoic gravel deposits along the Yakima River drainage from Ellensburg to Richland, Washington. Northwest Science 57:179–193.
A.10
Campbell NP. 1988. Structural Geology Along the Northwestern Columbia River Basalt Margin, Washington. Open File Report 88-5, Washington State Department of Natural Resources, Geology and Earth Resources Division, Olympia.
Campbell NP. 1989. Structural and stratigraphic interpretation of rocks under the Yakima fold belt, Columbia Basin, based on recent surface mapping and well data. In Volcanism and Tectonism in the Columbia River Flood-Basalt Province, SP Reidel and PR Hooper (eds). Special Paper 239, Geological Society of America, Boulder, Colorado.
Campbell NP and RD Bentley. 1981. Late Quaternary deformation of the Toppenish Ridge uplift in south-central Washington. Geology 9:519–524.
Campbell NP, T Ring, and T Repasky. 1995. Earthquake Hazard Study of the Vicinity of Toppenish Basin, South-Central Washington. U.S. Geological Survey, Reston, Virginia.
Catchings RD and WD Mooney. 1988. Crustal structure of the Columbia Plateau: Evidence for continental rifting. Journal of Geophysical Research 93:459–474.
Chiou BS-J. and RR Youngs. 2006. Chiou and Youngs PEER-NGA Empirical Ground Motion Model for the Average Horizontal Component of Peak Acceleration and Pseudo-Spectral Acceleration for Spectral Periods of 0.01 to 10 Seconds. Pacific Earthquake Engineering Research Center, University of California – Berkeley
Crider JG, RS Crosson, and J Brooks. 2003. The Chelan seismic zone, the Great Terrace and the December 1872 Washington State earthquake. Abstracts with Programs 35:645, Geological Society of America, Boulder, Colorado.
Farooqui SM and RC Thoms. 1980. Geologic Evaluation of Selected Faults and Lineaments, Pasco and Walla Walla Basins, Southeast Washington. Shannon & Wilson, Inc., Richland, Washington.
Fecht KR, SP Reidel, and AM Tallman. 1987. Paleodrainage of the Columbia River system on the Columbia Plateau of Washington State – A summary. In Selected Papers on the Geology of Washington, JJ Schuster (ed), Bulletin 77, pp. 219–248. Washington State Department of Natural Resources, Division of Geology and Earth Resources, Olympia.
Fecht KR, KA Lindsey, BN Bjornstad, DG Horton, GV Last, and SP Reidel. 1999. Clastic Injection Dikes of the Pasco Basin and Vicinity. Geologic Atlas Series BHI-01103 Rev. 1, U.S. Department of Energy, Office of Environmental Restoration, Washington, D.C.
Finnegan NJ and DR Montgomery. 2003. Geomorphic and seismic evidence for recent deformation in the Yakima Fold Belt between Ellensburg and Yakima, WA. Abstracts with Programs 35:512, Geological Society of America, Boulder, Colorado.
Foundation Sciences, Inc. 1980. Geologic Reconnaissance of Parts of the Walla Walla and Pullman, Washington, and Pendleton, Oregon 1°x2° AMS Quadrangles. U.S. Army Corps of Engineers, Seattle, Washington.
Frankel AD, MD Petersen, CS Muller, KM Haller, RL Wheeler, EV Leyendecker, RL Wesson, SC Harmsen, CH Cramer, DM Perkins, and KS Rukstales. 2002. Documentation for the 2002 Update of the National Seismic Hazard Maps. Open-File Report 02-420, U.S. Geological Survey, Reston, Virginia.
A.11
Garwood DL, JH Bush,, JD Kauffman, and TE Jones. 2003. New interpretations of structures in the Columbia River Basalt Group of the Clearwater Embayment, Idaho. Abstracts with Programs 35:551, Geological Society of America, Boulder, Colorado.
Geomatrix Consultants, Inc. 1988. Seismotectonic Evaluation of the Northern Cascade Mountains Geomorphic Province for Bumping Lake, Tieton, Keechelus, Kachess, Cle Elum, and Clear Creek Dams. Oakland, California.
Geomatrix Consultants, Inc. 1989. Seismotectonic Evaluation, Northwest Rocky Mountains-Okanogan Uplands Geomorphic Province. Oakland, California.
Glass CE. 1977. Remote sensing analysis of the Columbia Plateau. In WPPSS Nuclear Project No. 1, Washington Public Power Supply System Docket No. 50-460: Preliminary Safety Analysis Report, Amendment 23, v. 2B, Appendix 2R, Subappendix 2R K. Preliminary Safety Analysis Report, Washington Public Power Supply System, Richland, Washington.
Grolier MJ and JW Bingham. 1971. Geologic map and sections of parts of Grant, Adams and Franklin counties, Washington (1 sheet, scale 1:62,500). Geology Investigations Map I-589, U.S. Geological Survey, Reston, Virginia.
Hemphill-Haley M. Multi-Scaled Analyses of Contemporary Crustal Deformation of Western North America. PhD dissertation, University of Oregon, Eugene.
Idriss IM. 2007. Empirical Model for Estimating the Average Horizontal Values of Pseudo-Absolute Spectral Accelerations Generated by Crustal Earthquakes Volume 1 Sites with Vs30 = 450 to 900 m/s. Pacific Earthquake Engineering Research Center, University of California, Berkeley.
Kienle CF Jr., ML Hamill, and DN Clayton. 1979. Geologic Reconnaissance of the Wallula Gap, Washington-Blue Mountains-La Grande, Oregon Region. Shannon & Wilson, Inc., Richland, Washington.
Kuehn SC. 1995. The Olympic-Wallowa Lineament, Hite Fault System, and Columbia River Basalt Group Stratigraphy in Northeast Umatilla County, Oregon. M.S. thesis, Washington State University, Pullman.
Lacombe S, F Mouthereau, S Kargar, and B Meyer. 2006. Late Cenozoic and modern stress fields in the western Fars (Iran): Implications for the tectonic and kinematic evolution of central Zagros. Tectonics 25:TC1003.
Lidke DJ. 2002a. Fault number 562a, Saddle Mountains structures, Saddle Mountains fault. In Quaternary Fault and Fold Database of the United States – Version 1.0. Open-File Report 03-417, U.S. Geological Survey, Reston, Virginia. Available at http://qfaults.cr.usgs.gov.
Lidke DJ. 2002b. Fault number 562b, Saddle Mountains structures, folds and other faults of the Saddle Mountains. In Quaternary Fault and Fold Database of the United States – Version 1.0. Open-File Report 03-417, U.S. Geological Survey, Reston, Virginia. Available at http://qfaults.cr.usgs.gov.
Lidke DJ. 2002c. Fault number 563a, Umtanum Ridge structures, Central Gable Mountain fault. In Quaternary Fault and Fold Database of the United States – Version 1.0. Open-File Report 03-417, U.S. Geological Survey, Reston, Virginia. Available at http://qfaults.cr.usgs.gov.
A.12
Lidke DJ. 2002d. Fault number 563b, Umtanum Ridge structures, folds and other faults of the Umtanum Ridge-Gable Mountain uplift. In Quaternary Fault and Fold Database of the United States – Version 1.0. Open-File Report 03-417, U.S. Geological Survey. Available at http://qfaults.cr.usgs.gov.
Lidke DJ. 2003a. Fault number 561a, Frenchman Hills structures, Frenchman Hills fault. In Quaternary Fault and Fold Database of the United States – Version 1.0. Open-File Report 03-417, U.S. Geological Survey, Reston, Virginia. Available at http://qfaults.cr.usgs.gov.
Lidke DJ. 2003b. Fault number 561b, Frenchman Hills structures, Lind Coulee fault. In Quaternary Fault and Fold Database of the United States – Version 1.0. Open-File Report 03-417, U.S. Geological Survey. Available at http://qfaults.cr.usgs.gov.
Lidke DJ. 2003c. Fault number 561c, Frenchman Hills structures, Folds and other faults of the Frenchman Hills uplift. In Quaternary Fault and Fold Database of the United States – Version 1.0. Open-File Report 03-417, U.S. Geological Survey, Reston, Virginia. Available at http://qfaults.cr.usgs.gov.
Lidke DJ. 2003d. Fault number 564a, Ahtanum Ridge structures, Ahtanum Creek fault. In Quaternary Fault and Fold Database of the United States – Version 1.0. Open-File Report 03-417, U.S. Geological Survey, Reston, Virginia. Available at http://qfaults.cr.usgs.gov.
Lidke DJ. 2003e. Fault number 564b, Ahtanum Ridge structures, folds and other faults of the Ahtanum Ridge uplift. In Quaternary Fault and Fold Database of the United States – Version 1.0. Open-File Report 03-417, U.S. Geological Survey, Reston, Virginia. Available at http://qfaults.cr.usgs.gov.
Lidke DJ and RC Bucknam. 2002. Fault number 566a, Toppenish Ridge structures, Mill Creek fault. In Quaternary Fault and Fold Database of the United States – Version 1.0. Open-File Report 03-417, U.S. Geological Survey, Reston, Virginia. Available at http://qfaults.cr.usgs.gov.
Lidke DJ and RC Bucknam. 2003. Fault number 566b, Toppenish Ridge structures, folds and other faults of the Toppenish Ridge uplift. In Quaternary Fault and Fold Database of the United States – Version 1.0. Open-File Report 03-417, U.S. Geological Survey, Reston, Virginia. Available at http://qfaults.cr.usgs.gov.
Lidke DJ, SY Johnson, PA McCrory, SF Personius, AR Nelson, RL Dart, L-A Bradley, KM Haller, and MN Machette. 2003. Map and Data for Quaternary Faults and Folds in Washington State. Open-File Report 03-428, U.S. Geological Survey, Reston, Virginia. Available at http://pubs.usgs.gov/of/2003/428.
Ludwin RS, CS Weaver, and RS Crosson. 1991. Seismicity of Washington and Oregon. In Neotectonics of North America, DB Slemmons, ER Engdahl, MD Zoback, and DD Blackwell (eds). Decade Map 1:77–98, Geological Society of America, Boulder, Colorado.
Mann GM and CE Meyer. 1993. Late Cenozoic structure and correlations to seismicity along the Olympic-Wallowa Lineament, northwest United States. Geological Society of America Bulletin 105:853–871.
McCaffrey R. 2001. GPS Velocity Field and Hazards Assessment for the Pacific Northwest. Collaborative research with Rensselaer Polytechnic Institute, University of Washington, and U.S. Geological Survey. Report 01HQ-GR-0026. Available at http://ees2.geo.rpi.edu/rob/www/gps/g0026.html.
A.13
McCaffrey R. 2002. Crustal block rotations and plate coupling. In Plate Boundary Zones, Geodynamic Series 30, S Stein and J Freymueller (eds), pp. 101–122. American Geophysics Union, Washington, D.C.
McQuarrie N. 1993. Structural analysis of the Wallula Gap Fault, southeastern Washington. Abstracts with Programs 25:119, Geological Society of America, Boulder, Colorado.
Meghraoui M, R Jaegy, K Lammali, and F Albarede. 1988. Late Holocene earthquake sequences on the El Asnam (Algeria) thrust fault. Earth and Planetary Science Letters 90:187–203.
Miller MM, DJ Johnson, CM Rubin, H Dragert, K Wang, A Qamar, and C Goldfinger. 2001. GPS-determination of along-strike variation in Cascadia margin kinematics: Implications for relative plate motion, subduction zone coupling, and permanent deformation. Tectonics 20:161–176.
Miller MM and DJ Johnson. 2002. Fate of the Eastern California shear zone along the Cascadia margin and entrainment of the Cascadia fore-arc in oblique subduction. Abstracts with Programs 34:A 106, Geological Society of America, Boulder, Colorado.
Miner A. 2002a. Seismicity and structure of the Columbia Basin: preliminary correlations. Abstracts with Programs, Cordillaren Section 98th Annual Meeting, Geological Society of America, Boulder, Colorado.
Miner A. 2002b. Eocene Tectonics and Active Deformation in Cascadia. MS thesis, Central Washington University, Ellensburg.
Ni JF and M Barazangi. 1986. Seismotectonics of the Zagros continental collision zone and a comparison with the Himalayas. Journal of Geophysical Research 91:8205–8218.
Ning Z and A Qamar. 2003. Seismicity and horizontal strain rate in the Pacific Northwest. Abstracts with Programs 35:582, Geological Society of America, Boulder, Colorado.
Personius SF and DJ Lidke. 2003a. Fault number 565, Rattlesnake Hills structures. In Quaternary Fault and Fold Database of the United States – Version 1.0. Open-File Report 03-417, U.S. Geological Survey, Reston, Virginia. Available at http://qfaults.cr.usgs.gov.
Personius SF and DJ Lidke. 2003b. Fault number 567, Horse Heaven Hills structures. In Quaternary Fault and Fold Database of the United States – Version 1.0. Open-File Report 03-417, U.S. Geological Survey, Reston, Virginia. Available at http://qfaults.cr.usgs.gov.
Personius SF and DJ Lidke. 2003c. Fault number 579, Luna Butte fault. In Quaternary Fault and Fold Database of the United States – Version 1.0. Open-File Report 03-417, U.S. Geological Survey, Reston, Virginia. Available at http://qfaults.cr.usgs.gov.
Personius SF and DJ Lidke. 2003d. Fault number 847, Arlington-Shutler Butte fault. In Quaternary Fault and Fold Database of the United States – Version 1.0. Open-File Report 03-417, U.S. Geological Survey, Reston, Virginia. Available at http://qfaults.cr.usgs.gov.
Piety A, RC LaForge, and LL Foley. 1990. Seismic Sources and Maximum Credible Earthquakes for Cold Springs and McKay Dams, Umatilla Project, North-Central Oregon. Seismotectonic Report 90-1, U.S. Bureau of Reclamation, Denver, Colorado.
A.14
Prescott WH and JC Savage. 1984. Crustal Deformation near Hanford, WA. Open-File Report 84-797, U.S. Geological Survey, Reston, Virginia.
Reidel SP. 1984. The Saddle Mountains: the evolution of an anticline in the Yakima Fold Belt. American Journal of Science 284(8):942–978.
Reidel SP and KR Fecht. 1994. Geologic map of the Priest Rapids 1:100,000 quadrangle, Washington. Open File Report 94-13, Washington State Department of Natural Resources, Division of Geology and Earth Resources, Olympia.
Reidel SP, NP Campbell, KR Fecht, and KA Lindsey. 1994. Late Cenozoic structure and stratigraphy of south-central Washington. In Regional Geology of Washington, ES Cheney and R Lasmanis (eds), Washington Division of Geology and Earth Resources Bulletin 80, pp. 159-180. Washington State Department of Natural Resources, Division of Geology and Earth Resources, Olympia.
Reidel SP, KR Fecht, MC Hagood, and TL Tolan. 1989. The geologic evolution of the central Columbia Plateau.In Volcanism and Tectonism in the Columbia River Flood-Basalt Province, SP Reidel and PR Hooper (eds), pp. 247–264. Special Paper 239, Geological Society of America, Boulder, Colorado.
Reidel SP and NP Campbell. 1989. Guide to the structure of the Yakima Fold Belt. In Field Trips for the Geological Society of America Cordilleran and Rocky Mountain Sections Joint Meeting, Spokane, Washington,N Joseph (ed), pp. 275–304. Circular 86 (geologic guidebook for Washington and adjacent areas), Washington State Department of Natural Resources, Division of Geology and Earth Resources, Olympia.
Reidel SP and TL Tolan. 1994. Late Cenozoic structure and correlations to seismicity along the Olympic-Wallowa lineament, northwestern United States: Discussion. Geological Society of America Bulletin 106:1634–1638.
Repasky TR and NP Campbell. 1998. Earthquake Hazard Study in the Vicinity of Toppenish Basin, South-Central Washington. U.S. Geological Survey, Reston, Virginia.
Rigby JG and KL Othberg. 1979. Reconnaissance Surficial Geologic Mapping of the Late Cenozoic Sediments of the Columbia Basin, Washington. Open-File Report 79-3, Washington Department of Natural Resources, Division of Geology and Earth Resources, Olympia.
Rohay AC and JD Davis. 1983. Contemporary deformation in the Pasco Basin area of the central Columbia Plateau. In Preliminary Interpretation of the Tectonic Stability of the Reference Repository Location, Cold Creek Syncline, JA Caggiano and DW Duncan (eds). RHO-BW-ST-19P, Rockwell Hanford Operations, Richland, Washington.
Rohay A. 2003. Ongoing deformation and state of stress in the Columbia River flood basalts. Abstracts with Programs 35:136, Geological Society of America, Boulder, Colorado.
Sandness GA, CS Kimball, KE Schmeirer, and JW Lindberg. 1982. Report on Geologic Remote Sensing of the Columbia Plateau. PNL-3140, Pacific Northwest Laboratory, Richland, Washington.
Savage JC, M Lisowski, and WH Prescott. 1981. Geodetic measurements in Washington. Journal of Geophysical Research 86:4929–4940.
A.15
Schuster EJ, CW Gulick, SP Reidel, KR Fecht, and S Zurenko. 1997. Geologic map of Washington-southeast quadrant (2 sheets, scale 1:250,000). Geologic Map GM-45, Washington State Department of Natural Resources, Division of Geology and Earth Resources, Olympia.
Shaffer ME and MW West. 1989. Quaternary faulting in the Frenchman Hills anticline, Yakima fold belt, central Columbia Basin, Washington. Abstracts with Programs 21:142, Geological Society of America, Boulder, Colorado.
SSHAC (Senior Seismic Hazard Analysis Committee). 1997. Recommendations for Probabilistic Seismic Hazard Analysis: Guidance on Uncertainty and Use of Experts. NUREG/CR-6372, U.S. Nuclear Regulatory Commission, Washington, D.C.
Tabor RW, RB Waitt, VA Frizzell, Jr., DA Swanson, GR Byerly, and RD Bentley. 1982. Geologic map of the Wenatchee 1:100,000 quadrangle, central Washington. Miscellaneous Investigations Series Map I-1311, U.S. Geological Survey, Reston, Virginia.
Tabor RW, VA Frizzell Jr., JA Vance, and CW Naeser. 1984. Ages and stratigraphy of lower and middle Tertiary sedimentary and volcanic rocks of the central Cascades, Washington: Application to the tectonic history of the Straight Creek fault. Geological Society of America Bulletin 95:26–44.
Tabor RW, VA Frizzell Jr., DB Booth, and RB Waitt. 2000. Geologic map of the Snoqualmie Pass 30 x 60 minute quadrangle, Washington (scale 1:100,000). Geologic Investigations Series Map I-2538, U.S. Geological Survey, Reston, Virginia
Tolan TL and SP Reidel. 1989. Structure map of a portion of the Columbia River flood-basalt province (plate, scale 1:500,000). In Volcanism and Tectonism in the Columbia River Flood-Basalt Province, SP Reidel and PR Hooper (eds), Special Paper 239. Geological Society of America, Boulder, Colorado.
Tolan TL. 1982. The Stratigraphic Relationships of the Columbia River Basalt Group in the Lower Columbia River Gorge of Oregon and Washington. M.S. thesis, Portland State University, Portland, Oregon.
Tolan TL and MH Beeson. 1984. Intracanyon flows of the Columbia River Basalt Group in the lower Columbia River Gorge and their relationship to the Troutdale Formation. Geological Society of America Bulletin 95:463–477.
Tolan TL, NP Campbell, and KA Lindsey. 2004. 3D mapping of the Columbia River Basalt Group (CRBG) and the structural geology of the eastern Yakima fold belt (YFB) and the western Palouse slope: new structural features revealed and expanding the eastern limit of the YFB. Abstracts with Programs 36(4):34, Geological Society of America, Boulder, Colorado.
Walsh TJ, MA Korosec, WM Phillips, RL Logan, and HW Schasse. 1987. Geologic map of Washington – southwest quadrant (1:250,000). Geologic Map GM-34, Washington State Department of Natural Resources, Division of Geology and Earth Resources, Olympia.
WPPSS (Washington Public Power Supply System). 1981. Late Cenozoic tectonics of the Pacific Northwest with special reference to the Columbia Plateau. In Washington Public Power Supply System Nuclear Project Number 2, Final Safety Analysis Report, Amendment 18, Appendix 2.5N, pp. 2.5N-1–2.5N-44. Washington Public Power Supply System, Richland, Washington.
A.16
WPPSS (Washington Public Power Supply System). 1982. Safety Evaluation Report Related to the Operation of WPPS Nuclear Project No. 2, Docket No. 50-397. Washington Public Power Supply System, Richland, Washington.
West MW. 1997. A Continuation of a “Pilot” Study of Quaternary Surface Deformation, Saddle Mountains Anticline, Northern Pasco Basin, Washington. U.S. Geological Survey, Reston, Virginia.
West MW, FX Ashland, AJ Busacca, GW Berger, and ME Shaffer. 1996. Late Quaternary deformation, Saddle Mountains anticline, south-central Washington. Geology 24(12):1123–1126.
West MW, AJ Busacca, GW Berger, ME Shaffer, and FX Ashland. 1994. A “Pilot” Study of Quaternary Surface Deformation, Saddle Mountains Anticline, Northern Pasco Basin, Washington. U.S. Geological Survey, Reston, Virginia.
West MW and ME Shaffer. 1988. Interim Draft Report - Probabilistic and Deterministic Seismotectonic Studies - O’Sullivan Dam and Potholes Reservoir, Washington. U.S. Bureau of Reclamation, Denver, Colorado.
West DO. 1987. The Wenas Valley fault – Holocene normal faulting or gravitational sliding in the Yakima Fold Belt, Columbia Plateau? Abstracts with Programs 19:463, Geological Society of America, Boulder, Colorado.
Wong I, M Hemphill-Haley, M Dober, and R Schapiro. 2002. Probabilistic Seismic Hazard Analyses – Bumping Lake, Clear Creek, French Canyon, and Tieton Dams. U.S. Department of the Interior, Bureau of Reclamation, Denver, Colorado.
Yeats RS. 1986. Active faults related to folding. In Active Tectonics: Impact on Society, Geophysics Study Committee, Geophysics Research Forum, National Research Council, pp. 63–79. The National Academies Press, Washington, D.C.
Yeats RS, K Sieh, and CR Allen. 1997. The Geology of Earthquakes. Oxford University Press, New York.

Appendix B
Annotated Bibliography

B.1
Appendix B
Annotated Bibliography
Relevant published documents are summarized here, with particular emphasis on any information pertinent to this topical report. No interpretations were made by the authors of this topical report of the original works. While some raw data is included, most annotations focus on the authors’ observations and interpretations of the content. The annotated documents that form the foundation for this topical report are
Bentley et al. (1980) Campbell and Bentley (1981) DOE (1988) Farooqui and Thoms (1980) Geomatrix (1996) Lidke (2002) Mann and Meyer (1993) McCaffrey et al. (2007) Mege and Ernst (2001) Miller et al. (2001) PSPL (1981) Piety et al. (1990) Prescott and Savage (1984) Reidel and Tolan (1994) Reidel et al. (1989) Reidel et al. (1994) Reidel et al. (2005) Reidel (1984) Repasky et al. (1998) Rohay and Davis (1983) Savage et al. (1981) Shaffer and West (1989) West (1997) West et al. (1994) West et al. (1996) Wong et al. (2002) Zachariasen et al. (2006).
B.2
Bentley, R.D., Anderson, J.L., Campbell, N.P., and Swanson, D.A., 1980. Stratigraphy and Structure of the Yakima Indian Reservation, with Emphasis on the Columbia River Basalt Group. U.S. Geological Survey Open-File Report 80-200, 73 pp.
The Horse Heaven and Simcoe Mountains anticlines are part of the same uplift, divided by the Pine Creek syncline. Symmetry of the Simcoe anticline changes across a NW-trending strike-slip fault that is part of the Arlington-Shutler Butte fault. Displacement of the Simcoe anticline is greatest in the west. Most of the uplift is paralleled by complex splayed fault systems, which includes the Milk Ranch and Satus Creek fault systems. Displacement on the Milk Ranch fault decreases to the west. Lineaments are formed by normal cross faults, several of which divide the Simcoe anticline into en echelon segments. Faults and fracture systems also cross the Satus Basin, forming lineaments that occasionally stretch from the Horse Heaven-Simcoe uplift into Toppenish Basin. Toppenish uplift is divided into three segments (Hembre Mountain, Satus Peak, and Peavine) that are themselves be segmented and change geometry at NW-trending cross faults. The Hembre Mountain segment only shows Quaternary deformation in the far west. Late Quaternary surface rupture that is evident for 30 km starting at the eastern end of the Satus Peak segment and that includes up to 100 individual ruptures is interpreted as tectonic in origin. The Ahtanum Creek fault cuts the Tampico segment of the Ahtanum uplift. Sedge Ridge should be included in the main group of YFB uplifts, and shows what is likely Pliocene tilting in the west.
Campbell, N.P., and Bentley, R.D., 1981, Late Quaternary deformation of the Toppenish Ridge uplift in south-central Washington: Geology, v. 9, pp. 519-524.
Satus Peak, a section of Toppenish Ridge, is the only Yakima fold showing abundant surface ruptures originating in the late Quaternary. Sag pond bottom material on the peak’s slope is dated at 500-600 yr, and faults cut through many Quaternary sediments. Mount St. Helens “set S” tephra (13 ka) constrain the lower age date of another set of faults. Quaternary landslide distribution is partially attributed to rupture location. There are three sets of ruptures grouped by location on the peak- the crestal, hinge, and fan sets. The former two are a result of extension, the latter likely due to slip along an older thrust fault and suggesting a décollement. The anticline also contains large displacement faults of an older age.
DOE, 1988, Consultation Draft: Site Characterization Plan, Reference Repository Location, Hanford Site, Washington, DOE/RW-0164, U.S. Department of Energy, Washington, D.C.
This nine-volume document summarizes the site characterization information produced at the end of the Basalt Waste Isolation Project for a proposed deep geologic repository in basalt for high-level commercial nuclear waste for the U.S. Department of Energy. The report summarizes the state of knowledge and the conceptual models for the site after a decade of geologic and hydrologic studies performed on the Columbia Plateau and Pasco Basin. Included in the report is a comprehensive history of folding and faulting, seismicity, and tectonic models and proposed studies to fully characterize the site.
Farooqui, S.M. and Thoms, R.C., 1980, Geologic evaluation of selected faults and lineaments, Pasco and Walla Walla Basins, southeast Washington: Shannon & Wilson, Inc., prepared for the Washington Public Power Supply System.
Seven less well-studied potential faults are examined. The main north fault in the Finley Quarry fault zone has experienced late Pleistocene movement no younger than 7 Ka. The Kennewick-Cold Creek lineament parallels the RAW but appears to be erosional in origin. The base of a Pleistocene loess unit is cut by the Buroker fault, which is a N-S striking reverse fault. Field studies of a supposed Game Farm
B.3
Hill fault indicate there is no evidence of faulting in this area. The Silver Dollar fault is a reverse or normal fault in Yakima Ridge basalts and decreases in displacement toward the east. Tight fold geometry and presence of an escarpment suggest that, if it does exist, the Badger Mountain fault is confined to the SE Hill of Badger Mountain. Evidence for the presence of a Badger Canyon fault is speculative.
Geomatrix Consultants, Inc., 1996, Probabilistic seismic hazard analysis DOE Hanford site, Washington: Technical report WHC-SD-W236A-TI-002, Rev. 1, Westinghouse Hanford Company, Richland, Washington.
This document represents the most recent probabilistic seismic hazard analysis performed at the Hanford Site, based on a similar study of seismic hazard analysis as well as seismic source characterization and attenuation performed previously for the Washington Public Power Supply System. The report includes horizontal and vertical equal-hazard spectra for each of five areas (100 K, 200 East, 200 West, 300 Area, and 400 Area) within the Hanford Site.
Lidke, D.J., compiler, 2002, Fault number 563a, Umtanum Ridge structures, Central Gable Mountain fault, in Quaternary fault and fold database of the United States: U.S. Geological Survey website, http://earthquakes.usgs.gov/regional/qfaults.
For details regarding the Umtanum Ridge-Gable Mountain structures, see annotation for Fault 563b. The Central Gable Mountain fault is a northeast-striking oblique-slip fault cutting almost perpendicular to the east-striking anticlinal uplift of the Umtanum Ridge, Gable Mountain, and Gable Butte. Latest Pleistocene activity has resulted in about 6 cm of offset along the central Gable Mountain fault, with a total of 60 m offset starting in the Miocene. Only the bottom portion of glacial flood deposits (19 to 13 ka) are offset. The fault has been trenched and drilled by NESCO.
Mann, G.M, and Meyer, C.E., 1993, Late Cenozoic structure and correlations to seismicity along the Olympic-Wallowa Lineament, northwest United States: Geological Society of America Bulletin, v. 105, pp. 853-871.
Like other NW-trending fault zones in the NW Cordillera, the Olympic-Wallowa Lineament (OWL) is probably a right-slip fault system accommodating eastern basin-and-range extension. A 1936 earthquake of magnitude 6.1 occurred in the Wallula fault zone (WFZ), the section of the OWL passing through the Columbia Plateau. The WFZ is a right-slip extensional duplex. Surface features in several areas throughout the OWL are a result of basement right-slip fault zones- for instance, ‘disrupted zone’ fault segments in the Long Valley fault system. The OWL experiences an abrupt change in structural style when crossing a crustal boundary at Wallula Gap, perhaps due to a change in basalt thickness. Like this crustal boundary, the Kennewick lineament possesses a magnetic anomaly. Holocene faulting may be recorded in Kennewick lineament sediments and appear to branch out from this structure. Earthquake hypocenters (2-5 km deep) and anticlinal structure west of Wallula Gap suggest a progressive crustal detachment in the area. Because the WFZ is historically active and the Rattlesnake-Wallula alignment (RAW) runs parallel to the WFZ, it is likely that the RAW is also active.
McCaffrey, R., A.I Qamar, R.W. King, R. Wells, G. Khazaradze, C.A. Williams, C.W. Stevens, J.J. Vollick, and P.C. Zwick, 2007, Fault locking, block rotation and crustal deformation in the Pacific Northwest, Geophysical Journal International, v. 169, no. 3, pp. 1315-1340 .
Results of strain measurements, based on recent GPS data collected within the Pacific Northwest, are presented in this paper. The results indicate relative clockwise rotation of the Pacific Northwest around
B.4
northeastern Oregon. The relative rate of movement is low within the Columbia Plateau compared to rates up to 10 mm/yr or more in western Washington and Oregon along the Cascadia Subduction Zone.
Mege, D., and R.E. Ernst, 2001, Contractional effects of mantle plumes on Earth, Mars, and Venus, in Ernst, R.E. and K.L. Buchanan, eds. Mantle Plumes: Their Identification Through Time, Geological Society of America Special Paper 352, Boulder, Colorado, pp. 103-140.
In this paper, the Yakima fold ridges are attributed to contraction that formed as a result of a passing mantle plume from northwest to southeast beneath the Columbia Plateau.
Miller, M.M., Johnson, D.J., Rubin, C.J., Dragert, H., Wang, K., Qamar, A., and Goldfinger, C., 2001, GPS-determination of along-strike variation in Cascadia margin kinematics: Implications for relative plate motion, subduction zone coupling, and permanent deformation: Tectonics, v. 20, issue 2, pp. 161-176.
In eastern Washington between Lind and Goldendale, present-day shortening is about 1 mm/yr, which fits with low but active contraction in the YFB. Seismicity in the YFB is diffuse and earthquakes have not been attributed to any individual faults. Small strain is also visible in the OWL, the southern portion of which possesses evidence for Quaternary dextral and normal-oblique displacement. Data originates from continuous GPS records.
PSPL, 1981, Skagit Hanford Nuclear Project, Application for Site Certification/Environmental Report, Puget Sound Power and Light Company, Bellevue, WA.
A considerable number of new trenches were excavated to evaluate the timing and rate of Quaternary faulting within the Pasco Basin for licensing of this nuclear power plant project., located in the south-central portion of the Hanford Site.
Piety, L.A., LaForge, R.C., and Foley, L.L., 1990, Seismic sources and maximum credible earthquakes for Cold Springs and McKay dams, Umatilla Project, north-central Oregon: U.S. Bureau of Reclamation Seismotectonic Report 90-1, 62 p.
Seismic activity in the Columbia Plateau is diffuse and variable, with occasional shallow swarms. A structure is here considered a potential seismic source if it possesses late Quaternary (<125 ka) surface deformation or surface deformation of an unknown age. Additionally, microseismicity indicates continuing N-S compression in the YFB, and the YFB’s structures and tectonic setting are similar to other historically active fold belts. This leads to the conservative conclusion that even anticlines without surface scarps are potential seismic sources. Synclines in the YFB do not possess seismogenic faults. The Horse Heaven Hills and Columbia Hills anticlines should be given similar values for a maximum credible earthquake as Toppenish Ridge, based on the similarity in anticlinal length. Furthermore, because only a portion of Toppenish Ridge and Saddle Mountains is active, it is assumed that only a portion of the Horse Heaven Hills is active. A section up to 58 km long on the Columbia Hills may have Quaternary displacement, so this section is considered a potential seismic source. Although connection of YFB faults and folds to deeper faults is debated, the El Asnam earthquake indicates that regardless of a deeper connection, seismic hazard remains large. Stress direction has changed in the YFB, resulting in differences in orientation between younger displacements and the older structures on which they formed. Also, different types of displacement formed at different times. Direction of stress possibly changes with depth. Anticlines in the southern YFB are relatively varied in orientation, and while they do not show surface faulting, it is assumed they have the same type of underlying thrust to reverse faults as similarly-
B.5
shaped folds in the northern YFB. The number and continuity of cross faults dividing anticlinal uplifts into segments increases from east to west. Some interaction between different stress regimes (i.e., N-S compression in the Columbia Plateau and E-NE extension in north-central Oregon) may be evident toward the edge of the Plateau.
Prescott, W.H., and J.C. Savage, 1984, Crustal Deformation near Hanford, Washington, USGS-Open-File Report 84-797, U.S. Geological Survey, Menlo Park, CA.
Results of a network of geodetic measurements were summarized in this 1984 report, before the general availability of widespread GPS measurements, which are now the standard method for determining small-scale movements within the Earth’s crust. Based on the geodetic data available at the time Prescott and Savage were unable to detect any systematic strain accumulation. Furthermore, the observed rates of deformation were not above possible errors in the measurements.
Reidel, S.P., and Tolan, T.L., 1994, Late Cenozoic structure and correlation to seismicity along the Olympic-Wallowa Lineament, northwestern United States: Discussion: Geological Society of America Bulletin, v. 106, pp. 1634-1648.
The OWL is not a single, continuous structure. Mann and Meyer’s duplex model of the Wallula Fault Zone is incorrect, and this zone has little or no strike-slip. Magnetic anomalies surrounding the Kennewick-Cold Creek lineament are a result of basalt-cored anticlines, and the lineament is a break in slope from flood terraces.
Reidel, S.P., 1984, The Saddle Mountains: The evolution of an anticline in the Yakima Fold Belt: American Journal of Science, v. 284, pp. 942-978.
The Saddle Mountains compose an anticlinal ridge that can be divided into six segments based on fold geometry. A high-angle reverse or thrust fault, the Saddle mountains fault, has caused displacement of at least 2.5 km along the ridge. Secondary tectonic structures are present on the Saddle Mountains. The Smyrna anticline and Hog Ranch-Naneum Ridge anticline extend beyond the anticlinal uplift. Local thrust faults occur near Saddle Gap and are common west of Sentinel Gap. Distinct fault zones are present on the Saddle Mountains, which are also modified by a northwest-trending shear system. Uplift rate has slowed since the early Miocene. Frequent, low-magnitude displacements during continuous deformation are indicated by lack of fault scarps and presence of folded basalts and sediments. Different areas of the Saddle mountains fault show deformation of different ages. Uplift probably occurred in stages, marked by changes in growth rate. Because other YFB anticlinal folds indicate similar ages and rates of growth, the Saddle Mountains can act as a model for these other folds. This model is consistent with the known Columbia Plateau tectonic context. Furthermore, similarity between age and supply of the Columbia River Basalt Group and the growth rate of the Saddle Mountains indicates that the YFB and CRBG are caused by the same tectonic processes. Shallow earthquake swarms in the area indicate persisting growth. Segments of the Saddle Mountains may be partially controlled by basement structures and reactivation of basement faults, and the Hog Ranch-Naneum Ridge anticline is directly connected to basement structures.
Reidel S.P., Bush, J., Garwood, D., Kauffman, J., and Martin, B.S., 2005, The tectonic evolution of the northern Columbia River flood-basalt province: Geological Society of America Abstracts with Programs, v. 37, no. 7, p. 126.
B.6
Subsidence during basalt eruption formed basins at the boundary of the continental craton and accreted terrains. In the YFB, fold growth, subsidence, basalt eruption, and pole rotation have closely correlated rates.
Reidel S.P., Campbell, N.P., Fecht, K.R., and Lindsey, K.A., 1994, Late Cenozoic structure and stratigraphy of south-central Washington: Washington Division of Geology and Earth Resources Bulletin, v. 80, pp. 159-180.
The OWL is parallel to but not connected to basement structures, and causes change in ridge trends from Manastash Ridge to Rattlesnake Mountain. In general, the trends of anticlines reflect the trends of the areas they cross. Folds in the YFB are north-verging with the exception of some anticlines including Columbia Hills, Cleman Mountain, and other anticlinal segments, which are south-verging. The boundary between Saddle Mountains segments Eagle Lake and Saddle Gap occurs above the suture zone between the continental craton and accreted terranes. The Hog-Ranch-Naneum Ridge anticline may not, as was previously thought, be connected to the basement. In the YFB, evidence for continued displacement is generally only present in frontal fault zones. Quaternary faulting appears equally distributed in CLEW and non-CLEW regions, and fold belt development has likely been evenly distributed since the Miocene. Although stresses are evenly distributed, seismicity is concentrated in the YFB’s competent synclines, for movement in the incompetent anticlines can occur aseismically. The Saddle Mountains fault is the only YFB fault known to be associated with seismicity.
Reidel, S.P., Fecht, K.R., Hagood, M.C., and Tolan, T.L., 1989, The geologic evolution of the central Columbia Plateau, in Reidel, S.P., and Hooper, P.R., eds., Volcanism and tectonism in the Columbia River flood-basalt province: Boulder, Colorado, Geological Society of America, Special Paper 239, pp. 247-264.
Ridges in the eastern and central portion of the YFB are more closely spaced than ridges to the west, and ridges within the CLEW are the most closely spaced. Anticlinal trends- such as those of the Yakima and Umtanum Ridges- change direction when crossing the CLEW, and the Yakima Ridge decreases in structural relief in this area. For most frontal faults in the YFB, as anticlinal structural relief decreases, the fault itself dies out. Because crustal shortening in the YFB is small, the CRBG is more likely connected via local or limited décollements than via a regional décollement.
Repasky, T.R., N.P. Campbell, and A.J. Busacca, 1998, Earthquake hazard study in the vicinity of Toppenish Basin, south-central Washington, Yakama Indian Nation 1997 Earthquake Hazards Study, National Earthquake Hazards Reduction Program, under Contract 1434-HQ-97-GR-03013.
This report summarizes characterization studies that occurred on two ridges of the Yakima Folds: Toppenish and Ahtanum Ridges. High-resolution seismic lines and trenching studies indicated multiple seismic events and fault activity occurred on these structures during the Quaternary. Three and possibly five earthquakes up to magnitude 7.1 have occurred on Toppenish Ridge in the past 165,000 years and three or more seismic events have occurred on Rattlesnake Hills/Ahtanum Ridge over the past 109,000 years.. Furthermore, crude calculations indicate vertical uplift of at least 1.16 mm/yr over the last 60,000 years on Toppenish Ridge.
Rohay, A.C., and J.D. Davis, 1983, Contemporary deformation in the Pasco Basin area of the central Columbia Plateau, in Caggiano, J.A., ed., Preliminary interpretation of the tectonic stability of the Reference Repository Location, Cold Creek Syncline, Hanford Site, pp. 6-1 through 6-29.
B.7
Rohay and Davis concluded that contemporary deformation was indicated within the central Columbia Plateau based on the pattern of seismicity and change in length of the precisely measured geodetic survey lines. In the study seismicity was compared with the Yakima folds and known faults. No correlation was observed between mapped geologic structures and deep seismicity. Focal mechanism solutions support a nearly horizontal principle component of stress, consistent with north-south compression, and east-west trending ridges and faults. Seismicity and geodetic surveying suggested continuing deformation at low rates of strain similar to those suggested by geologic analysis over a longer period of time.
Savage, J.C., M. Lisowski, and W.H. Prescott, 1981, Geodetic strain measurements in Washington, Journal of Geophysical Research, v. 86, pp. 4929-4940.
Geodetic strain measurements collected between 1972-1979 are roughly consistent with a crude dislocation model that represents subduction of the Juan de Fuca plate in western Washington. The Hanford geodetic network, on the other hand, failed to show a consistent, significant strain rate in eastern Washington. Hanford strain rates are at best only marginally significant, and it is quite possible no measurable strain accumulated there during the survey interval.
Shaffer, M.E., and West, M.W., 1989, Quaternary faulting in the Frenchman Hills anticline, Yakima Fold Belt, central Columbia Basin, Washington: Geological Society of America in Abstracts with Programs, v. 21, p. 142.
The Frenchman Hills anticline, northernmost fold in the YFB, shows faulting of Ringold sediments, which have been displaced about 4.5 m. Loess (older than 790 ka) and paleosols above the Ringold Formation are also faulted, but glacial flood deposits (about 40 to 50 ka) are not. Timing of tectonic activity is thus constrained, but only insofar as these dates are accurate.
West, M.W., 1997, A continuation of a “pilot” study of Quaternary surface deformation, Saddle Mountains anticline, northern Pasco Basin, Washington: Final Technical Report to the U.S. Geological Survey, under Award No. 1434-HQ-97-GR-02999.
See West et al. (1994) for details. Secondary tear faults in the Gable Mountain area have displaced 13 ka ash and therefore may still be active. Fault scarps on the Smyrna Bench segment decrease in height and complexity in the western portion of the segment. Here, faults associated with the graben are likely listric and shallow. The Smyrna Bench and Saddle Gap segments are not aligned, either as a result of imbricate thrusts or a change in strike of the Saddle Mountains fault. Historical seismic activity in the north-central YFB shows earthquakes occurring in clusters and swarms. Seismicity is also concentrated in a band running parallel to and north of the Saddle Mountains, though seismicity has not been correlated with mapped surface faults. At the west end of Smyrna Bench, three zones of differing composition show different degrees of displacement. In these zones, displacement occurred either simultaneously or in sequence, and movement was probably localized by the relative shear strength of zone material. If rupturing occurred simultaneously, single event displacement amounts to 2.6 to 4.5 m. Otherwise, single event displacements in the late Pleistocene to Holocene are actually less than older displacements, suggesting a decrease in slip rate. The author mentions the critical taper model, which, if applied to the YFB, would indicate that past and current activity cannot be used to predict future activity.
West, M.W., Ashland, F.X., Busacca, A.J., Berger, G.W., and Shaffer, M.E., 1996, Late Quaternary deformation, Saddle Mountains anticline, south-central Washington: Geology, v. 24, no. 12, pp. 1123-1126.
B.8
See West el al. (1994) for details. Revisions from that paper state that fault slip along thrusts active 100-400 ka show 0.3 m displacement, and a 5 m scarp on Smyrna Bench is due to coseismic surface rupture. Additionally, loess flows in this area are due to recurrent movement on an active thrust. Interpretations using short-term versus long-term strain rates may result in very different conclusions, and it is recommended to use slip rates from the past few tens of thousands of years when determining probabilistic seismic hazard.
West, M.W., Busacca, A.J., Berger, G.W., Shaffer, M.E., and Ashland, F.X., 1994, A “pilot” study of Quaternary surface deformation, Saddle Mountains anticline, northern Pasco Basin, Washington: Final Technical Report to the U.S. Geological Survey, under Contract 1434-94-G-2392.
The Smyrna Bench segment of the Saddle Mountains shows late Quaternary tectonic activity, as evidenced by disruption of drainage systems due to graben development. A 5m tall scarp present in this area appears to be aggradational as opposed to tectonic in origin, though may be a result of landsliding due to upslope surface rupture. Because the Saddle Mountains anticline cannot accommodate more strain by folding, it must move via fault slip. Several relatively large earthquakes were recorded in the Saddle Mountains area, including an intensity IV in 1918 and a magnitude 4.4 in 1973. Recent seismicity is not exactly aligned with mapped faults or with the fold axis. Trenching reveals both normal and thrust faults of varying age in Smyrna Bench, and it is likely that the normal faults merge with the subsurface thrust plane. In one locality, thrust faults show less than 0.5 m of displacement with an age of 100-400 ka, whereas nearby normal faults show greater than 6.5 m displacement over the last 20-40 kyr. The difference in ages indicates that there is another, active thrust fault to the north of the graben, buried by loess. Surface expression of thrust faults is often difficult to identify and can be very irregular- secondary features such as normal faults and grabens can often be used as indicators of buried thrust faults. Translating vertical displacement to slip along the fault plane gives a slip rate of at least 0.33-0.65 mm/yr, which is far greater than the estimated slip rate by Geomatrix. Thus, probabilistic seismic hazard for the Saddle Mountains fault is probably much greater than previously acknowledged, with potential earthquake magnitudes as great as 7.0.
Wong, I., Dober, M. Hemphill-Haley, M., and Schapiro, R., 2002, Screening/scoping level probabilistic seismic hazard analyses: Technical Memorandum no. D-8330-2003-05 prepared for the U.S. Department of the Interior, Bureau of Reclamation.
Individual fault segments are thought to usually rupture with the same magnitude, and greater magnitude events have a longer period of recurrence. No faults within 100 km of the Grand Coulee and North Dams are considered seismogenic, although the Badger Mountain anticline may have been active in the early Pleistocene. For a maximum magnitude event of M = 6.5, the return period is between 10 and 50 kyr. The Columbia Plateau has a return period of 3234 yrs for events with a magnitude of at least a 6.
Zachariasen, J., S. Olig, I. Wong, and R. S. Yeats. 2006. Technical Review of the Seismic Source Model for the Yakima Fold Belt. URS Corporation, Oakland, California.
This report presents a good summary of the technical issues related to seismic hazard assessment within the Columbia Plateau and Yakima Fold Belt. Also presented are summaries of the evidence of Quaternary faulting for the different Yakima fold ridges and additional studies that could be used to refine the history of faulting and seismicity within the region.
Appendix C
Summary of Known or Suspected Quaternary Faults Within the Yakima Fold Belt

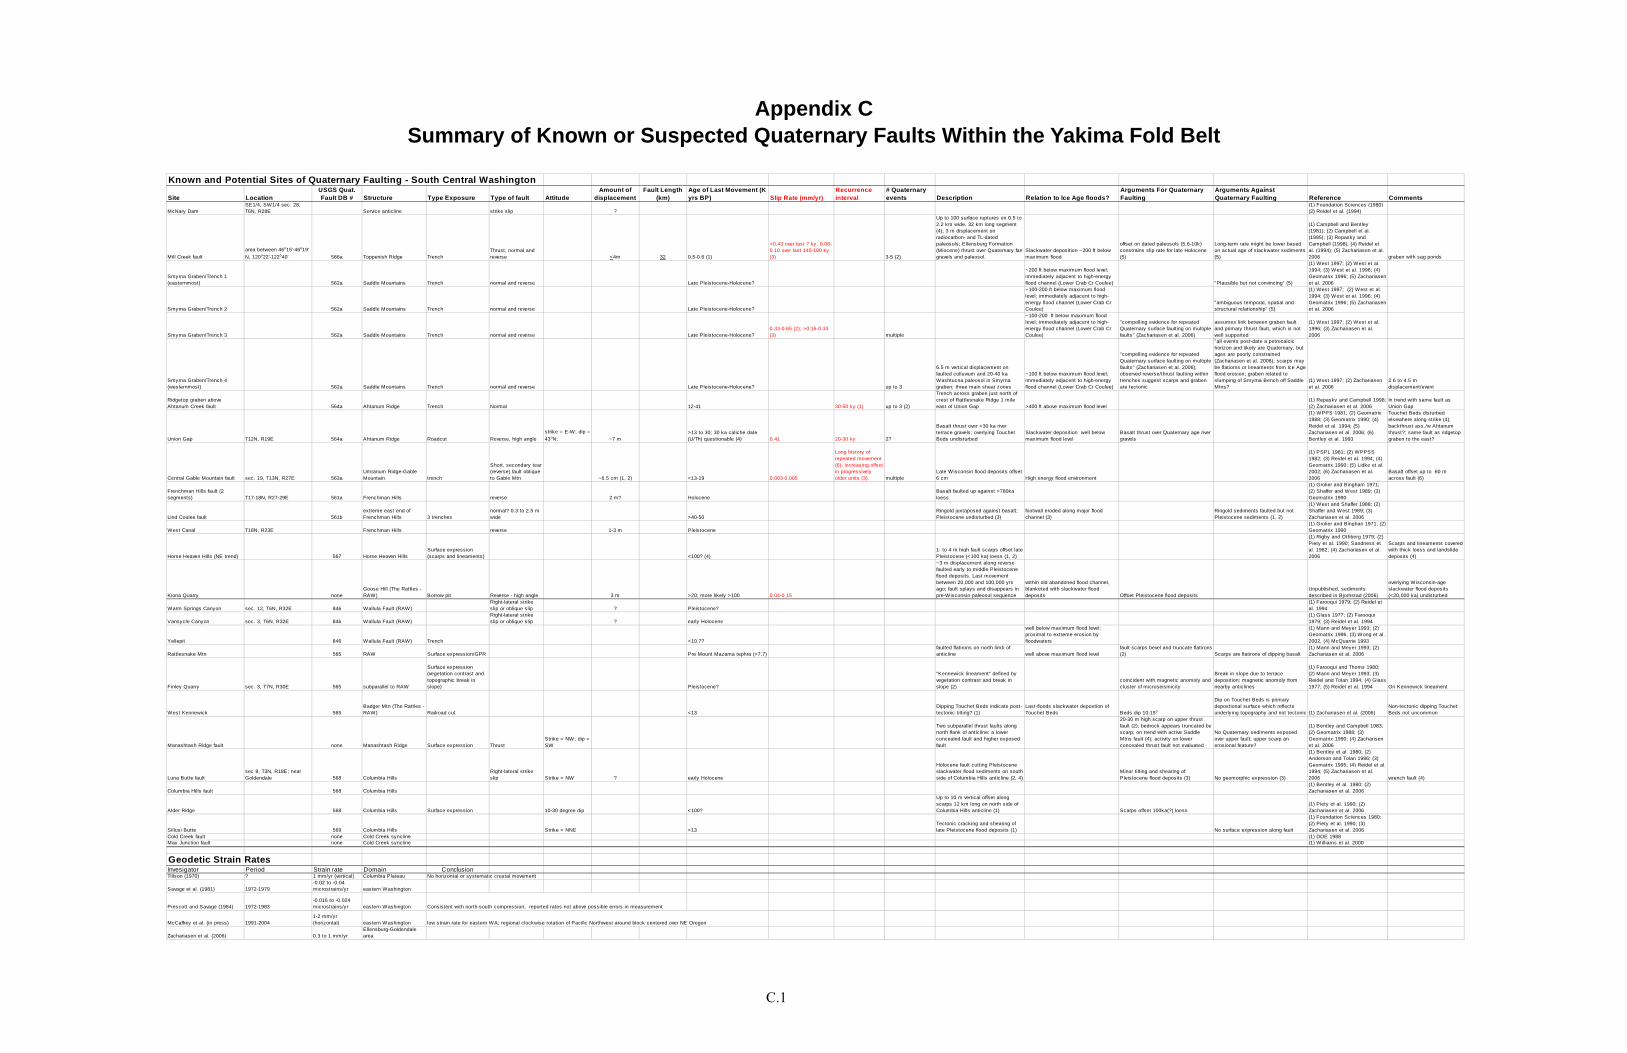
C.1
Appendix C Summary of Known or Suspected Quaternary Faults Within the Yakima Fold Belt
Known and Potential Sites of Quaternary Faulting - South Central Washington
Site LocationUSGS Quat. Fault DB # Structure Type Exposure Type of fault Attitude
Amount of displacement
Fault Length (km)
Age of Last Movement (K yrs BP) Slip Rate (mm/yr)
Recurrence interval
# Quaternary events Description Relation to Ice Age floods?
Arguments For Quaternary Faulting
Arguments Against Quaternary Faulting Reference Comments
McNary DamSE1/4, SW1/4 sec. 28, T6N, R28E Service anticline strike slip ?
(1) Foundation Sciences (1980) (2) Reidel et al. (1994)
Mill Creek fault
area between 46o15'-46o19'
N, 120o22'-122o40' 566a Toppenish Ridge TrenchThrust, normal and reverse <4m 32 0.5-0.6 (1)
>0.43 over last 7 ky; 0.08-0.10 over last 145-180 ky (3) 3-5 (2)
Up to 100 surface ruptures on 0.5 to 2.2 km wide, 32 km long segment (4); 3 m displacement on radiocarbon- and TL-dated paleosols; Ellensburg Formation (Miocene) thrust over Quaternary fan gravels and paleosol.
Slackwater deposition ~200 ft below maximum flood
offset on dated paleosols (5.6-10k) constrains slip rate for late Holocene (5)
Long-term rate might be lower based on actual age of slackwater sediments (5)
(1) Campbell and Bentley (1981); (2) Campbell et al. (1995); (3) Repasky and Campbell (1998); (4) Reidel et al. (1994); (5) Zachariasen et al. 2006 graben with sag ponds
Smyrna Graben/Trench 1 (easternmost) 562a Saddle Mountains Trench normal and reverse Late Pleistocene-Holocene?
~200 ft below maximum flood level; immediately adjacent to high-energy flood channel (Lower Crab Cr Coulee) "Plausible but not convincing" (5)
(1) West 1997; (2) West et al. 1994; (3) West et al. 1996; (4) Geomatrix 1996; (5) Zachariasen et al. 2006
Smyrna Graben/Trench 2 562a Saddle Mountains Trench normal and reverse Late Pleistocene-Holocene?
~100-200 ft below maximum flood level; immediately adjacent to high-energy flood channel (Lower Crab Cr Coulee)
"ambiguous temporal, spatial and structural relationship" (5)
(1) West 1997; (2) West et al. 1994; (3) West et al. 1996; (4) Geomatrix 1996; (5) Zachariasen et al. 2006
Smyrna Graben/Trench 3 562a Saddle Mountains Trench normal and reverse Late Pleistocene-Holocene?0.33-0.65 (2); >0.16-0.33 (3) multiple
~100-200 ft below maximum flood level; immediately adjacent to high-energy flood channel (Lower Crab Cr Coulee)
"compelling evidence for repeated Quaternary surface faulting on multiple faults" (Zachariasen et al. 2006)
assumes link between graben fault and primary thrust fault, which is not well supported
(1) West 1997; (2) West et al. 1996; (3) Zachariasen et al. 2006
Smyrna Graben/Trench 4 (westernmost) 562a Saddle Mountains Trench normal and reverse Late Pleistocene-Holocene? up to 3
6.5 m vertical displacement on faulted colluvium and 20-40 ka Washtucna paleosol in Smyrna graben; three main shear zones
~100 ft below maximum flood level; immediately adjacent to high-energy flood channel (Lower Crab Cr Coulee)
"compelling evidence for repeated Quaternary surface faulting on multiple faults" (Zachariasen et al. 2006); observed reverse/thrust faulting within trenches suggest scarps and graben are tectonic
"all events post-date a petrocalcic horizon and likely are Quaternary, but ages are poorly constrained (Zachariasen et al. 2006); scarps may be flatiorns or lineaments from Ice Age flood erosion; graben related to slumping of Smyrna Bench off Saddle Mtns?
(1) West 1997; (2) Zachariasen et al. 2006
2.6 to 4.5 m displacement/event
Ridgetop graben above Ahtanum Creek fault 564a Ahtanum Ridge Trench Normal 12-41 30-50 ky (1) up to 3 (2)
Trench across graben just north of crest of Rattlesnake Ridge 1 mile east of Union Gap >400 ft above maximum flood level
(1) Repasky and Campbell 1998; (2) Zachariasen et al. 2006
In trend with same fault as Union Gap
Union Gap T12N, R19E 564a Ahtanum Ridge Roadcut Reverse, high angle
strike = E-W; dip =
43oN; ~7 m>13 to 30; 30 ka caliche date (U/Th) questionable (4) 0.41 20-30 ky 2?
Basalt thrust over >30 ka river terrace gravels; overlying Touchet Beds undisturbed
Slackwater deposition well below maximum flood level
Basalt thrust over Quaternary age river gravels
(1) WPPS 1981; (2) Geomatrix 1988; (3) Geomatrix 1990; (4) Reidel et al. 1994; (5) Zachariasen et al. 2006; (6) Bentley et al. 1993
Touchet Beds disturbed elsewhere along strike (4); backthrust ass./w Ahtanum thrust?; same fault as ridgetop graben to the east?
Central Gable Mountain fault sec. 19, T13N, R27E 563aUmtanum Ridge-Gable Mountain trench
Short, secondary tear (reverse) fault oblique to Gable Mtn ~6.5 cm (1, 2) <13-19 0.003-0.005
Long history of repeated movement (6); increasing offset in progressively older units (3). multiple
Late Wisconsin flood deposits offset 6 cm High energy flood environment
(1) PSPL 1981; (2) WPPSS 1982; (3) Reidel et al. 1994; (4) Geomatrix 1990; (5) Lidke et al. 2002; (6) Zachariasen et al. 2006
Basalt offset up to 60 m across fault (6)
Frenchman Hills fault (2 segments) T17-18N, R27-29E 561a Frenchman Hills reverse 2 m? Holocene
Basalt faulted up against >780ka loess
(1) Grolier and Bingham 1971; (2) Shaffer and West 1989; (3) Geomatrix 1990
Lind Coulee fault 561bextreme east end of Frenchman Hills 3 trenches
normal? 0.3 to 2.5 m wide >40-50
Ringold juxtaposed against basalt; Pleistocene undisturbed (3)
footwall eroded along major flood channel (3)
Ringold sediments faulted but not Pleistocene sediments (1, 2)
(1) West and Shaffer 1988; (2) Shaffer and West 1989; (3) Zachariasen et al. 2006
West Canal T18N, R23E Frenchman Hills reverse 1-3 m Pleistocene(1) Grolier and Binghan 1971; (2) Geomatrix 1990
Horse Heaven Hills (NE trend) 567 Horse Heaven HillsSurface expression (scarps and lineaments) <100? (4)
1- to 4 m high fault scarps offset late Pleistocene (<100 ka) loess (1, 2)
(1) Rigby and Othberg 1979; (2) Piety et al. 1990; Sandness et al. 1982; (4) Zachariasen et al. 2006
Scarps and lineaments covered with thick loess and landslide deposits (4)
Kiona Quarry noneGoose Hill (The Rattles - RAW) Borrow pit Reverse - high angle 3 m >20; more likely >100 0.04-0.15
~3 m displacement along reverse faulted early to middle Pleistocene flood deposits. Last movement between 20,000 and 100,000 yrs ago; fault splays and disappears in pre-Wisconsin paleosol sequence
within old abandoned flood channel, blanketed with slackwater flood deposits Offset Pleistocene flood deposits
Unpublished, sediments described in Bjornstad (2006)
overlying Wisconsin-age slackwater flood deposits (<20,000 ka) undisturbed
Warm Springs Canyon sec. 12, T6N, R32E 846 Wallula Fault (RAW)Right-lateral strike slip or oblique slip ? Pleistocene?
(1) Farooqui 1979; (2) Reidel et al. 1994
Vansycle Canyon sec. 3, T6N, R32E 846 Wallula Fault (RAW)Right-lateral strike slip or oblique slip ? early Holocene
(1) Glass 1977; (2) Farooqui 1979; (3) Reidel et al. 1994
Yellepit 846 Wallula Fault (RAW) Trench <10.7?
well below maximum flood level; proximal to extreme erosion by floodwaters
(1) Mann and Meyer 1993; (2) Geomatrix 1996, (3) Wong et al. 2002, (4) McQuarrie 1993
Rattlesnake Mtn 565 RAW Surface expression/GPR Pre Mount Mazama tephra (>7.7)faulted flatirons on north limb of anticline well above maximum flood level
fault scarps bevel and truncate flatirons (2) Scarps are flatirons of dipping basalt
(1) Mann and Meyer 1993; (2) Zachariasen et al. 2006
Finley Quarry sec. 3, T7N, R30E 565 subparallel to RAW
Surface expression (vegetation contrast and topographic break in slope) Pleistocene?
"Kennewick lineament" defined by vegetation contrast and break in slope (2)
coincident with magnetic anomoly and cluster of microseismicity
Break in slope due to terrace deposition; magnetic anomoly from nearby anticlines
(1) Farooqui and Thoms 1980; (2) Mann and Meyer 1993; (3) Reidel and Tolan 1994; (4) Glass 1977; (5) Reidel et al. 1994 On Kennewick lineament
West Kennewick 565Badger Mtn (The Rattles - RAW) Railroad cut <13
Dipping Touchet Beds indicate post-tectonic tilting? (1)
Last-floods slackwater depostion of Touchet Beds Beds dip 10-15o
Dip on Touchet Beds is primary depostional surface which reflects underlying topography and not tectonic (1) Zachariasen et al. (2006)
Non-tectonic dipping Touchet Beds not uncommon
Manashtash Ridge fault none Manashtash Ridge Surface expression ThrustStrike = NW; dip = SW
Two subparallel thrust faults along north flank of anticline: a lower concealed fault and higher exposed fault
20-30 m high scarp on upper thrust fault (2); bedrock appears truncated by scarp; on trend with active Saddle Mtns fault (4); activity on lower concealed thrust fault not evaluated
No Quaternary sediments exposed over upper fault; upper scarp an erosional feature?
(1) Bentley and Campbell 1983; (2) Geomatrix 1988; (3) Geomatrix 1990; (4) Zacharisen et al. 2006
Luna Butte faultsec 8, T3N, R18E; near Goldendale 568 Columbia Hills
Right-lateral strike slip Strike = NW ? early Holocene
Holocene fault cutting Pleistocene slackwater flood sediments on south side of Columbia Hills anticline (2, 4)
Minor tilting and shearing of Pleistocene flood deposits (3) No geomorphic expression (3)
(1) Bentley et al. 1980; (2) Anderson and Tolan 1986; (3) Geomatrix 1995; (4) Reidel et al. 1994; (5) Zachariasen et al. 2006 wrench fault (4)
Columbia Hills fault 568 Columbia Hills(1) Bentley et al. 1980; (2) Zachariasen et al. 2006
Alder Ridge 568 Columbia Hills Surface expression 10-30 degree dip <100?
Up to 10 m vertical offset along scarps 12 km long on north side of Columbia Hills anticline (1) Scarps offset 100ka(?) loess
(1) Piety et al. 1990; (2) Zachariasen et al. 2006
Sillusi Butte 569 Columbia Hills Strike = NNE <13Tectonic cracking and shearing of late Pleistocene flood deposits (1) No surface expression along fault
(1) Foundation Sciences 1980; (2) Piety et al. 1990; (3) Zachariasen et al. 2006
Cold Creek fault none Cold Creek syncline (1) DOE 1988May Junction fault none Cold Creek syncline (1) Williams et al. 2000
Geodetic Strain RatesInvesigator Period Strain rate Domain ConclusionTillson (1970) ? 1 mm/yr (vertical) Columbia Plateau No horizontal or systematic crustal movement
Savage et al. (1981) 1972-1979-0.02 to -0.04 microstrains/yr eastern Washington
Prescott and Savage (1984) 1972-1983-0.016 to -0.024 microstrains/yr eastern Washington Consistent with north-south compression; reported rates not above possible errors in measurement
McCaffrey et al. (in press) 1991-20041-2 mm/yr (horizontal) eastern Washington low strain rate for eastern WA; regional clockwise rotation of Pacific Northwest around block centered over NE Oregon
Zachariasen et al. (2006) 0.3 to 1 mm/yrEllensburg-Goldendale area

Appendix D
Detailed Description of the Goose Hill Fault

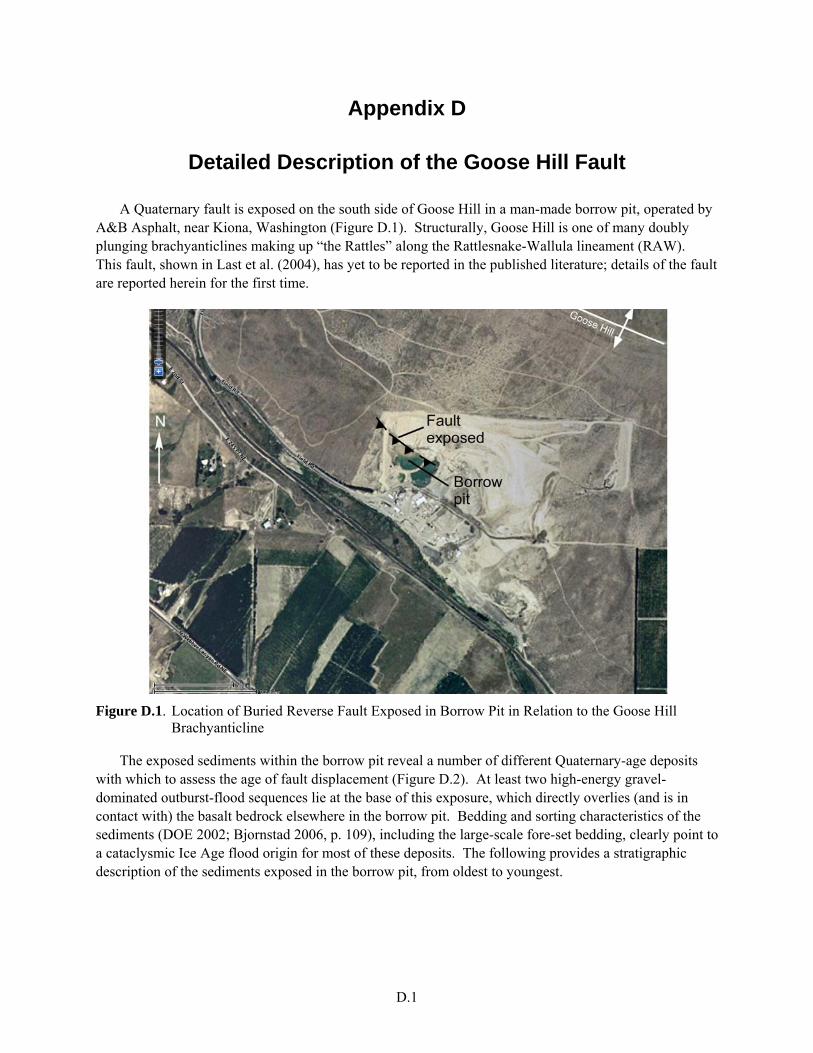
D.1
Appendix D
Detailed Description of the Goose Hill Fault
A Quaternary fault is exposed on the south side of Goose Hill in a man-made borrow pit, operated by A&B Asphalt, near Kiona, Washington (Figure D.1). Structurally, Goose Hill is one of many doubly plunging brachyanticlines making up “the Rattles” along the Rattlesnake-Wallula lineament (RAW). This fault, shown in Last et al. (2004), has yet to be reported in the published literature; details of the fault are reported herein for the first time.
Figure D.1. Location of Buried Reverse Fault Exposed in Borrow Pit in Relation to the Goose Hill Brachyanticline
The exposed sediments within the borrow pit reveal a number of different Quaternary-age deposits with which to assess the age of fault displacement (Figure D.2). At least two high-energy gravel-dominated outburst-flood sequences lie at the base of this exposure, which directly overlies (and is in contact with) the basalt bedrock elsewhere in the borrow pit. Bedding and sorting characteristics of the sediments (DOE 2002; Bjornstad 2006, p. 109), including the large-scale fore-set bedding, clearly point to a cataclysmic Ice Age flood origin for most of these deposits. The following provides a stratigraphic description of the sediments exposed in the borrow pit, from oldest to youngest.
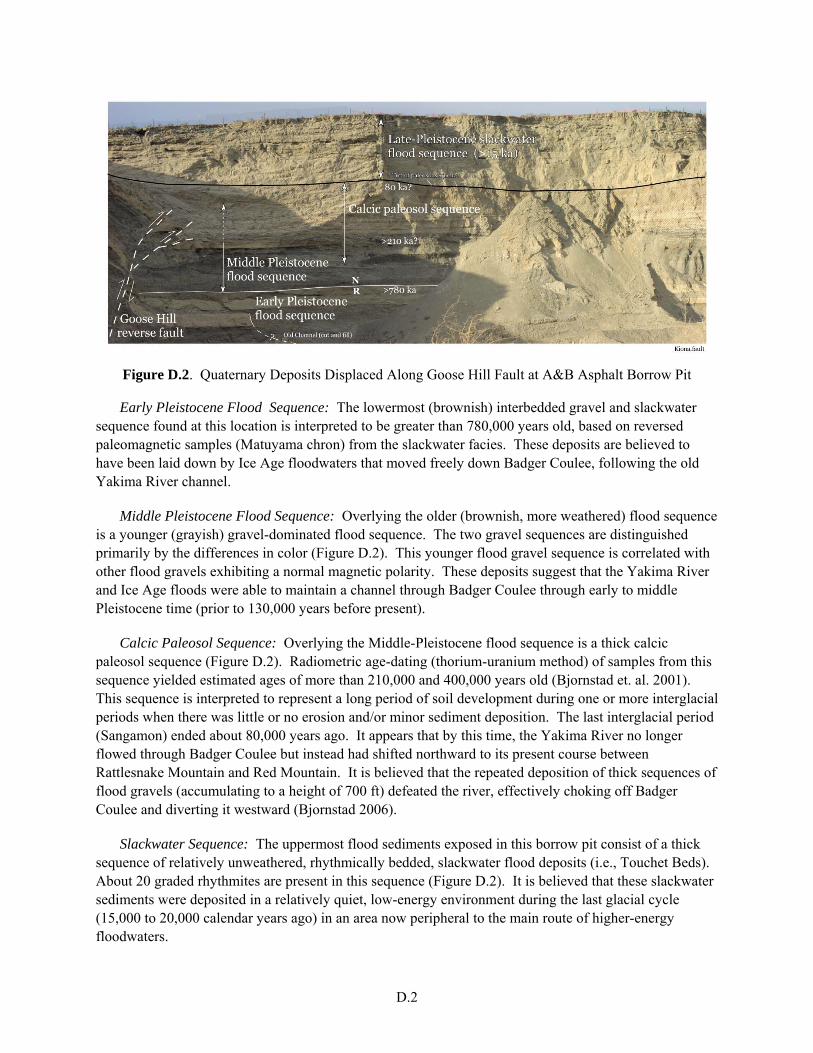
D.2
Figure D.2. Quaternary Deposits Displaced Along Goose Hill Fault at A&B Asphalt Borrow Pit
Early Pleistocene Flood Sequence: The lowermost (brownish) interbedded gravel and slackwater sequence found at this location is interpreted to be greater than 780,000 years old, based on reversed paleomagnetic samples (Matuyama chron) from the slackwater facies. These deposits are believed to have been laid down by Ice Age floodwaters that moved freely down Badger Coulee, following the old Yakima River channel.
Middle Pleistocene Flood Sequence: Overlying the older (brownish, more weathered) flood sequence is a younger (grayish) gravel-dominated flood sequence. The two gravel sequences are distinguished primarily by the differences in color (Figure D.2). This younger flood gravel sequence is correlated with other flood gravels exhibiting a normal magnetic polarity. These deposits suggest that the Yakima River and Ice Age floods were able to maintain a channel through Badger Coulee through early to middle Pleistocene time (prior to 130,000 years before present).
Calcic Paleosol Sequence: Overlying the Middle-Pleistocene flood sequence is a thick calcic paleosol sequence (Figure D.2). Radiometric age-dating (thorium-uranium method) of samples from this sequence yielded estimated ages of more than 210,000 and 400,000 years old (Bjornstad et. al. 2001). This sequence is interpreted to represent a long period of soil development during one or more interglacial periods when there was little or no erosion and/or minor sediment deposition. The last interglacial period (Sangamon) ended about 80,000 years ago. It appears that by this time, the Yakima River no longer flowed through Badger Coulee but instead had shifted northward to its present course between Rattlesnake Mountain and Red Mountain. It is believed that the repeated deposition of thick sequences of flood gravels (accumulating to a height of 700 ft) defeated the river, effectively choking off Badger Coulee and diverting it westward (Bjornstad 2006).
Slackwater Sequence: The uppermost flood sediments exposed in this borrow pit consist of a thick sequence of relatively unweathered, rhythmically bedded, slackwater flood deposits (i.e., Touchet Beds). About 20 graded rhythmites are present in this sequence (Figure D.2). It is believed that these slackwater sediments were deposited in a relatively quiet, low-energy environment during the last glacial cycle (15,000 to 20,000 calendar years ago) in an area now peripheral to the main route of higher-energy floodwaters.
D.3
Character and Age of Quaternary Faulting. The Goose Hill fault is a buried south-dipping reverse fault along the south side of Goose Hill (Figure D.1). The strike of the fault is northwest, approximately parallel to the Goose Hill anticlinal axis. The dip on the fault is approximately 45 degrees at the exposed base of the fault where only a single plane of movement is visible (see Figure 2.35). The dip flattens upward to near horizontal where the fault splays into several subsidiary reverse faults before dying out in the calcic-paleosol sequence above.
There is no surface expression for the Goose Hill fault because it is deeply buried beneath a cover of late-Pleistocene slackwater flood deposits approximately 15,000 calendar years old. Therefore, the last movement must be greater than 15,000 years old but about synchronous with later development of a pre-Wisconsin-age calcic-paleosol sequence, which probably formed during the Sangamon Interglacial (between 80,000 and 130,000 years ago). This translates to an average slip rate of about 0.02 to 0.04 mm/yr (20 to 40 m/my). It is questionable whether multiple events have occurred along the Goose Hill fault. Displacement appears to decrease in younger units, but this may just be the fault dying out toward the surface.
D.1 References Bjornstad BN. 2006. On the Trail of the Ice Age Floods: A Geological Field Guide to the Mid-Columbia Basin. Keokee Company Publishing, Inc., Sandpoint, Idaho. Bjornstad BN, KR Fecht, and CJ Pluhar. 2001. Long history of pre-Wisconsin, Ice Age cataclysmic floods: evidence from southeastern Washington State. Journal of Geology 109:695–713. DOE (U.S. Department of Energy). 2002. Standardized Stratigraphic Nomenclature for the Post-Ringold Formation Sediments Within the Central Pasco Basin. DOE/RL-2002-39, Rev. 0, U.S. Department of Energy, Richland Operations Office, Richland, Washington. Last GV, BN Bjornstad, and AJ Busacca. 2004. The Influence of Ice-Age Floods on the Terrior of Washington Wines, Field Guide. Ice Age Floods Institute Field Trip Guidebook, October 30, 2004. PNWD-SA-6753, Pacific Northwest National Laboratory, Richland, Washington.