Embed Size (px)
Citation preview

A study to determine the soil moisture and temperature dynamics
In the Baakse Beek-Veengoot catchment
Bachelor Thesis Report
Yimeng Zou
880904101
International water management
Van Hall Larenstein University of Applied Sciences
Supervisors: Hans van den Dool (Van Hall Larenstein)
Martine van der Ploeg (Wageningen University)
2012-12-20

A Study to determine the soil moisture and temperature dynamics
1
SUMMARY Climate change results in more and more extreme weather conditions and more consequently severe soil moisture stress would be faced in the Netherlands. The Baakse Beek catchment area is a watershed in the East of the Netherlands, which consists of the Baakse Beek and the Veengoot that flow into the IJssel River. There are two issues currently presenting, drought problems in the upstream area, and flooding in the downstream area. In order to deal with the problems faced now, Waterboard takes measures to decrease drought and prevent flooding to improve the ecological status of the area (Dijksma, et al., 2011). This Bachelor research thesis is to understand the water dynamics in the dry periods and wet periods to reduce negative consequences, resulting from the extreme weather conditions. When extreme rainfall occurs on soil with a low water retention capacity in the upstream area, flood might occur in the downstream area of a catchment. So the Waterboard is trying to make the soils hold water as long as possible to prevent drought in the upstream, meanwhile the flooding problem in the downstream can be solved to some extent. The object of this study is also to indicate the hydrological effects of adaptation measures in order to strengthen understanding. In order to evaluate the drought and flooding problems, the soil moisture content is considered in the research. The water-holding capacity of soil influences how much water flows downstream. If the soils could not keep enough water in the upstream when the extreme rainfall happened, the amount of water flows downstream, the flood will occur in the downstream. Because the soil temperature may influence the water movement in the soil (Miyazaki, T., 1993), the higher soil temperature occur the higher evaporation of soil water. Soil temperature and temperature of underlying geologic formations are also strongly linked with global climate. Soil moisture gradients affects soil moisture and soil hydraulic conductivity (Huang, P.M., et al., 2012). A better understanding of the soil thermal regime and its connection with global climate is needed. This research is focused on the relation between the soil temperature and soil moisture content and some other factors would influence soil moisture. In order to determine the soil temperature and soil moisture, in the study area the Baakse Beek-Veengoot catchment, there are two sets of soil moisture sensors and a set of soil temperature sensors used in the field. The soil temperature was measured by T107 temperature sensors which from Campbell Scientific. Two soil moisture sensors, one is the EC-10 moisture sensor which comes from Decagon Devices, and the other is CS616 water content reflectometer that is from Campbell Scientific. The sensors measure soil moisture and temperature in the same area but different measuring depth

A Study to determine the soil moisture and temperature dynamics
2
range. The measurement result showed that the curve of soil moisture change and temperature change are almost the same. The results from soil temperature sensors also indicated that both the highest and lowest observed soil temperatures occur at the surface and the fluctuations of soil temperature are more regular in the top soil than in the lower soil layers, because of soil temperature variations are primarily driven by the fluctuating temperature of the soil surface. Heat is both absorbed at and lost from the surface of the soil (Huang, P.M., et al., 2012). The same phenomenon is also indicated by the soil moisture sensors that soil moisture of measuring points which are closer to the surface have more irregular fluctuations; otherwise, the soil moisture of deeper points are more stable. Because the entire measuring circumstance was the same, the measuring length and depth were only 350cm and 75cm. In this case, the factors that influence the soil moisture are primarily the distance to the river, the distance to the surface and the soil temperature. The results proofed the soil moisture is different under different soil conditions. The soil moisture content can be influenced by the soil layer depth and the soils layer’s distance to river. The soil moisture of deeper soil layer always stable and precipitation did not influence it directly. The moisture content was higher at deeper soil layer than the soil moisture at the upper layer. The responses of the moisture content of different layers were different: the response from the soil moisture sensors indicated that moisture content at deeper soil layer was slow while the response of moisture content at the upper soil layers was quick. At the same temperature condition, the soil moisture content followed the rules that the soils closer to the river (surface water) or the deeper soil has the higher moisture content. The results indicated that the soil temperature related the soil moisture content to a great extent. Even in the case of the soil further away from the river which had higher moisture content than the soil closer to the river, due to the lower temperature. Soil temperature can be recognized as a factor which is strongly related to the soil the moisture content. So in case the temperature would rise in the future, the water holding capacity might be affected by higher soil temperature. The dryer soil is less able to hold the rain water immediately and will run off to the river.

A Study to determine the soil moisture and temperature dynamics
3
Acknowledgement This thesis was written while I was doing my final internship in the Group of Soil physics, Ecohydrology and Groundwater management within Center for Water and Climate at Wageningen University. I was under the stewardship of Assistant Professor Martine van der Ploeg. There are many people I would like to thank for trying to help me during the final thesis’s working. Big thanks to my supervisor in the Wageningen University Martine van der Ploeg who has a charming personality for providing the means and inspiration for this thesis. Although a 20 minute interview was short, she was still brave enough to take me into the group. I thank her for introducing me to colleagues in the group, puts me as a group member. She also teaching me how to improve English, and encourage me communicate with people, which are hard things for me. I also appreciated that she always taking the time out of her busy schedules to talk and discuss with me when I needed a talk. Thanks go to my tutor Hans van den Dool at Van Hall Larenstein who has helped so much and in many ways, when I need advice, he is the person who stands by my side and gave me advices, understanding and support all the time without hesitation. I appreciated the helps from him; these influenced me during the undergraduate stage. I am grateful to Professor Sjoerd van der Zee, who responded my application email for final thesis position. He provided me the first interview to get know about me and after that gave me an opportunity to work with Martine and learn from her. Finally, I would like to show my love and gratitude to my colleagues in the Soil physics, Ecohydrology and Groundwater management Group and teachers at Van Hall Larenstein. They always try to be patient to me and did their best to help me. Yimeng Zou Wageningen, the Netherlands 8th June, 2012

A Study to determine the soil moisture and temperature dynamics
4
CONTENT 1. INTRODUCTION ..................................................................... 6
1.1. Background information ................................................. 6
1.2. Area description ................................................................ 8
1.3. Soil moisture ................................................................... 10
2. METHODOLOGY .................................................................. 11
2.1. Study area ........................................................................ 11
2.2. Soil moisture measurements ....................................... 15
2.3. Soil temperature measurement .................................. 16
2.4. Calibration of EC-10 soil moisture sensors .............. 16
2.5. Calibration of CS616 water content reflectometer . 17
3. RESULTS AND INTERPRETATION ............................... 18
3.1. Soil moisture tendency and soil temperature .......... 19
3.2. Water content and soil temperature related to
distance to river ................................................................................ 21
3.3. Water content and soil temperature related to depth
22
3.4. Relation between soil temperature and water
content ...................................................................................... 23
3.5. Soil moisture content tendency .................................. 25
4. CONCLUSION ........................................................................ 26
5. RECOMMENDATION ........................................................ 27

A Study to determine the soil moisture and temperature dynamics
5
REFERENCE ................................................................................ 29
APPENDIX A-Project proposal ............................................ 31
* On the CD-RAW:
Thesis Report
Raw Data
Data after calibration
Graphs of comparison

A Study to determine the soil moisture and temperature dynamics
6
1. INTRODUCTION
1.1. Background information There are increasing extreme weather conditions occurring presently, with no doubt that the climate change is a significant reason. More and more extraordinary rainfall and flash flood happen in the Netherlands. Although extreme conditions do not influence the amount of water so much in the entire water system, the extreme weather situation has happened more than before, for instance the recent droughts and too much precipitation. The sudden flash flood happened resulted in flooding of cities, highways and agricultural fields, and considerable financial loss (Brauer, et al., 2011). Because of the new European laws and regulations (Wageningen, 2012), the Waterboard ‘Rijn en IJssel’ in the Netherlands is working on a new water management plan for the catchment, and try to assess adaptation measures to mitigate serious situation in the water area. The Baakse Beek and Veengoot catchment area is one of studies. So this bachelor thesis is paying attention to the Baakse Beek and Veengoot catchment area in east of The Netherlands. Baakse Beek and Veengoot originate in eastern Dutch Plateau (known as the Tertiary Plateau) and are two relatively large brooks, which are partly natural and partly man-made surface waters that drain into the IJssel River, from the neighborhood of Lichtenvoorde to Zutphen and cover almost the entire geomorphology of eastern Netherlands (Waterboard ‘Rijn en IJssel’, 2010). The brooks begin in the Tertiary Plateau and flow westwardly to the Pleistocene Basin before discharging into the river IJssel (Engel, et al., 2011). The catchment area is bordered to the north and northwest by the Groenlose Slinge/Berkel system and to the south and southwest by the Oude IJssel (Wageningen, 2012). The area of Baakse Beek-Veengoot is given in the Figure 1.

A Study to determine the soil moisture and temperature dynamics
7
Figure 1 Baakse Beek-Veengoot area (Waterboard, 2010)
According to the KNMI’s research, “the intensity (precipitation over 1 hour or less) of extreme showers rise with 14% for each degree temperature rise. The observed upward trend in intense precipitation of 15% in the Netherlands can be full explained by the temperature rise in the recent decades” (KNMI, 2011). Because of the climate change, the warmer air can contain more water vapour, the simple argument is that if there is more water vapour in the air also more rain can be produced (KNMI, 2011). So, the more temperature rises, the more precipitation will occur in The Netherlands. This causes not only flooding in the downstream area but drought to become a major issue in the upstream area (Krajenbrink, 2007). There are several assignments for the Baakse Beek-Veengoot catchment based on the established policies and the current function of it. This research is to explain the water dynamics in the dry period and wet period with the ultimate aim to reduce negative consequences, which caused by extreme weather conditions. Retaining the water in the soils upstream as long as possible to prevent drought; meanwhile it will solve the flooding problem in the downstream to some extent, which means that increase water retention in the upstream part help to prevent drought and to reduce flooding in the downstream part. At the same time, to deal with the extreme conditions also can improve the water quality and the ecosystem in the study area. Combating drought situation has long been on the agenda of the Waterboard. Waterboard agreed that a list of provinces specifically to address desiccated area, due to stagnation in the reducing drought in 2006, to deal with the drought condition problems is the TOP national objective until 2013 (Waterboard,
Study area
Baakse Beek
Veengoot

A Study to determine the soil moisture and temperature dynamics
8
2010). Baakse Beek-Veengoot catchment area is one of the designated as TOP area. On the other hand, the flooding is another problem why Waterboard focusing on in this area. The research focusing on soil moisture and temperature because soil temperature affects soil moisture and soil moisture influences the soil water-holding capacity. When the soil becomes dryer, the ability of infiltrating water of soil becomes lower. The flash flood will be happened in a very short time. The major factors that affect soil temperature are two types (Bottomley, J.J., 1978):
1) Those that influence the amount of heat available at the soil surface. 2) Factors that influence the dissipation of the available heat.
In order to meet the objective of research and discuss the results, the following main research question is presented: What the relation between soil moisture and temperature dynamics?
− What the relation between soil moisture and soil distance to river? − What the relation between soil moisture and measuring depth?
The soil moisture and temperature sensors were inserted into the soil to measuring the soil moisture and temperature. The measuring points are in the same weather condition and the same rainfall. The rainfall (soil close to the surface) and surface water (soil close to the river) will influence the soil temperature and moisture these two parameters will be mentioned in the following text. The other parameters of the water balance will not be considered in this report. This research is only to do the survey and give results to the Waterboard, they will assume responsibility for the actions which will be taken in the future based on the research results. So how to deal with the problem facing now and might be faced in the future will not addressed in this report. In this report, the basic information about Baakse Beek-Veengoot catchment will be presented, and analyse the situation face now in the study area. This paper pays attention to the relationship between soil moisture and temperature, to see will the temperature influence the soil moisture. In the end, this paper gives some suggestions to deal with the problems can be faced in the study area.
1.2. Area description The Baakse Beek-Veengoot area (Figure 2) is located in the eastern part of The Netherlands in the province of Gelderland (Frenken, et al., 2011). The size of the entire catchment is about 20,000 (ha) (Krajenbrink, 2007). This area is managed by the Waterboard ‘Rijn en IJssel’ as mentioned.

A Study to determine the soil moisture and temperature dynamics
9
Figure 2 The Baakse Beek-Veengoot area (Krajenbrink, 2007)
The area Lichtenvoorde-Ruurlo is a part of ‘de Graafschap’. It is an old cultural land scape that forms the transition between the rivers of the (oude) IJssel and the eastern Dutch plateau, near Winterswijk. This whole area can be roughly divided into three different landscapes (Waterboard, 2010):
i. The eastern Dutch plateau ii. Central of sand area
iii. River area The transition between the sand cover area and the plateau is sharp and is marked by a clear steep ridge. The area Lichtenvoorde-Ruurlo covers a portion of the plateau edge and a large part of the sand area. The plateau edge is articulated by the streams which gush and small valleys have incised. Among these valleys, large gaps appear such as the Essen van Vragender and Lievelde. West of the plateau edge is almost flat areas, which is surrounded by sand area. These bowl-shaped depressions which had poor drainage and forests and marshes formed. In some place a layer of peat development to come, so that peat extraction took place. The streams of the plateau edge discharged their water in this wet area. On the other side, the north and west of the wetland, the water collected in streams again as the Hissinkbeek, the Ruurlosche Beek (part of the current Baakse Beek), the Meibeek and the Lebbinkbeek. In the course of history, there was various attempts were made to improve water management. In the thirteenth century, the Greven canal built around the area of

A Study to determine the soil moisture and temperature dynamics
10
Zieuwent to dewater. Between the eighteenth and nineteenth century, Baakse Beek and Veengoot were constructed, could start with the peat mining and intensive agricultural use. This has led to the broad and open area.
1.3. Soil moisture The biggest impact is of course the parameters of the water balance which include runoff, evapotranspiration and the water change in storage. There are many factors influencing the soil moisture content, such as rainfall, groundwater level, soil texture and evapotranspiration. The equation of water balance in a representative elementary volume (REV) under the effects of a temperature gradient is
∆θ = (P + I + C) − E + q Where ∆θ is the increase of water in REV, P is the precipitation, I is the irrigation, C is condensation from the atmosphere, E is the evaporation, and q is the flux of water in the soil (liquid flux and vapor flux). The measuring points are in the same area, the ground level, rainfall and soil texture were in the same condition. The catchment response can be divided into four phases (Brauer, et al., 2011):
i. Soil moisture reservoir filling Water is used to replenish soil moisture and discharge hardly rises.
ii. Groundwater response Groundwater levels rise and discharge rise slowly.
iii. Surface depression filling and surface runoff Ponds form in local depressions on the land surface leading to surface runoff, and rapid rise of discharge.
iv. Backwater effects & Storage Brook discharges exceed maximum discharge capacity of culverts in the brook. Water is stored behind the culverts, discharge hardly increases and local gradients that drive subsurface flow are reduced.
The first 35mm of rainfall is stored in the soil without a significant increase in discharge. Relatively dry initial conditions prevent an even faster and more extreme hydrological response (Brauer, et al., 2011). Soil moisture is an important component of the land surface water budget. Large-scale soil moisture data are useful in many research fields such as hydrology, agriculture, and ecology (Liu, et al., 2011). The temperature gradient of soil is a driving force for movement of both liquid water and water vapor. Therefore, a daily change in the temperature profile may influence water movement in the soil (Miyazaki, T., 1993). Soil moisture impacts on surface runoff, and it is the important parameter for groundwater level. The soil moisture determines whether the water as infiltration goes into the soils or become runoff. Because of water can be stored above the phreatic

A Study to determine the soil moisture and temperature dynamics
11
surface, the moisture content of the soil plays an important role to determine the water stored in the zone below the groundwater level. From soil moisture data, the actual storage capacity of the soil can be determined. The storage capacity of the soils has been defined as the volume of water which will cause a given water table to raise reach the land surface (Dijksma, et al., 2011). The moisture content in soils is usually expressed as a dimensionless ratio of two masses or two volumes, or is given as a ratio of a mass per unit volume. These dimensionless ratios can be prevented as decimal fractions or percentages. The soil volumetric moisture content in this research is the ratio between volume of moisture and total volume of soil; the units is cm3/cm3 (Vos, H., 2012).
2. METHODOLOGY
2.1. Study area The studied area is located near the Baakse Beek. An objective of this measurement is to get the real data about the soil moisture at different soil depth and temperature to study the soils condition in the Baakse Beek catchment. Try to figure out ways to explain the relevance between soil temperature and soil moisture content, the result of the soil moisture and temperature dynamics used to determine the soil and water condition. The equipment set up in the place where is next to the Baakse Beek river basin. The position of the setup of the measures (red point) given in the Figure 3. Figure 3 Measurement location (Bing Map)
The measurements started on 29th March 2012. The data in this report is from 29th March 2012 to 29th May 2012. The measuring frequency was 5 minutes measuring once in the entire measurement. A trench was ditched in order to insert the sensors, the entire measuring distance is 350cm, and measuring depth is 75cm. The soil texture and surface plant mulching are the same. According to the location of the measuring place, there is a river nearby, so surface water will influence the soil moisture content and soil temperature. The cable connector and data logger were setting up in the

A Study to determine the soil moisture and temperature dynamics
12
beginning of the ditch. The detailed description of EC-10 soil moisture sensors and CS616 water content reflectometer, which is in the equipment box, can be found in the following text. The equipment box can be found in the Figure 4, which contained the cable connector, data logger, battery for the measurement. A solar panel connected with the equipment, to keep the machine continually working after the battery died. And the picture of the instrument placement and equipment box can be found in the Figure 4. Figure 4 Picture of instrument placement and equipment box
In order to compare the results from the different measuring equipment and to in case there is something wrong with a set of soil moisture sensors, the soil moisture content measured by two different types of soil moisture sensors to limited the error to the minimum, which are EC-10 soil moisture sensors and CS616 water content reflectometer. There were twelve EC-10 probes and eight CS616 sensors inserted into soils, to collect the data. The different soil moisture sensor distinguished by different numbers, for example, the EC1 and CS1 in the report were standing for the first measuring point of EC-10 and CS616 soil moisture sensors at soils layer. The reference level is at the water level, so the measuring points are above the water table level, and the highest ground surface level was 75cm above the water table level. The entire measuring length was 350cm, the first measuring point (EC1) which was at the length of 350cm. It was the closest point next to the basin. The Figure 5 showed the measuring area was close to the basin
A Study to determine the soil moisture and temperature dynamics
13
Figure 5 Surface level and River
In the measuring length of 50cm, there were six EC-10 probes inserted into the soil in the different depths (0, 10, 20, 30, 40 and 50cm). In measuring length of 150cm, there were three probes in the different depths of 0, 10 and 20cm. There were two probes inserted into soils in the measuring length of 250cm, which was in the different depths of 0 and 10cm. Last one in the measuring length of 350cm, it was in the relatively 0 point (which also the reference level at the water table in this case). The Figure 6 and Table 1 indicated the twelve EC-10’s position. Table 1 EC-10 moisture sensor at different depths
Depths (cm) EC-10 moisture sensor 0 EC-θ1, EC-θ2, EC-θ7 10 EC-θ5 20 EC-θ6, EC-θ9 30 ECθ10 40 EC-θ11
Figure 6 Cross-section instrument placement---EC-10
As mentioned above, there were eight CS616 sensors inserted into the soil, which were at six depths and four different lengths. There were two CS616 sensors in the relatively zero point, but in the different measuring length, which respectively in the 200cm and 300cm. Each two CS616 sensors in the depths of 20cm and 40cm and length of relatively zero point and 100cm. The rest of sensors, one was in the measuring depth 60cm and relatively zero point in measuring length, another one was in the measuring length of 300cm and relatively zero point in measuring depth (reference level at the water table). The specified positions are given in the Figure 7

A Study to determine the soil moisture and temperature dynamics
14
and Table 2. Table 2 CS616 water content reflectometer at the different depths
Depths (cm) CS616 water content reflectometer
0 CS616-θ1, CS616-θ3 10 CS616-θ2 20 CS616-θ5, CS616-θ8 40 CS616-θ4, CS616-θ7 60 CS616-θ6
Figure 7 Cross-section instrument placement---CS616
Soil temperature was measured by T107 temperature sensors from Campbell Scientific at six different depths in the soil. The T107 temperature sensors were inserted into the soil at reference level (which means reference level at the water table), 10cm, 40 cm in two different measuring lengths and one at the height of 60cm. The specified positions are given in the Figure 8 and Table 3. Table 3 T107 temperature probe at the different depths
Depths (cm) T107 temperature probe 0 T1 10 T2 20 T3 40 T4, T5 60 T6
Figure 8 Cross-section instrument placement---T107

A Study to determine the soil moisture and temperature dynamics
15
2.2. Soil moisture measurements The dielectric behavior of a material is characterized by its permittivity. The relative permittivity of a non-conducting material is generally introduced as the factor by which the capacitance of a plate capacitor increases when the vacuum or air between the plates is replaced by that medium (Dirksen, 1999). The dielectric constant (also generally called permittivity) depends on the first place on the polarization in an electrical field. The permanent dipole of water molecules yield the high valve ϵwater≈81 (at 18℃) while for most mineral soil components, ϵs≈5 (Dirksen, 1999). The volumetric water content of a soil can be determined indirectly by measuring its effective permittivity, due to the large difference It is also the operating principle of the EC-10 soil moisture sensor which working in the field. The EC-10 soil moisture sensor from Decagon Devices (Figure 9) measures the dielectric constant of the soil in order to find its volumetric water content (VWC). Since the dielectric constant of water is much higher than that of air or soil minerals, the dielectric constant of the soil is a sensitive measure of water content (Decagon Devices, 2010). The EC-10 comes with a 3.5mm plug connector (Decagon Devices, 2010). This allows for quick connection directly to data logger. After the data logger gets the data, the data will be send to the receiver in the laboratory by the wireless modem to the computer. Some specifications of EC-10 soil moisture sensor are given in the following Table 4. Table 4 Specifications of EC-10 soil moisture sensor (Decagon Devices, 2010)
Dimension 𝟏𝟏.𝟓𝟓𝟓 × 𝟑.𝟏𝟏𝟓𝟓 × 𝟎.𝟏𝟓𝟓𝟓 Accuracy ±0.04𝑚3/𝑚3(±4%) < 0.5𝑑𝑑/𝑚,
with soil-specific calibration: ±0.2 𝑚3/𝑚3(±2%) Resolution 0.002𝑚3/𝑚3 Measurement Range 0 to 40% VWC
The CS616 water content reflectometer from Campbell Scientific (Figure 10) measures the volumetric water content of porous media using time-domain measurement methods. The probe consists of two stainless steel rods connected to a printed circuit board (PCB). A shielded 4-conductor cable is connected to the circuit board to supply power, enabling the probe and monitor to pulse output. The circuit board is encapsulated in an epoxy block (Campbell Scientific, 2011). The fundamental principle for CS616 is the same as the EC-10, which dependent on the dielectric permittivity of the material surrounding the sensors (Campbell Scientific, 2011). When the sensors receive the signal, the signal will reflect from the rod ends travelling to the probe head, will be measured by the data logger. The specifications of CS616 water content reflectometer are given in the Table 5.

A Study to determine the soil moisture and temperature dynamics
16
Table 5 Specifications of CS616 water content reflectometer (Campbell Scientific, 2008; Campbell Scientific, 2011)
Dimensions Rods: 300mm; 3.2mm diameter; 32mm spacing Probe Head: 𝟖𝟓𝟓𝟓 × 𝟔𝟑𝟓𝟓 × 𝟏𝟖𝟓𝟓
Accuracy ±2.5% VWC when bulk electrical conductivity≤ 0.5 dS/m
Resolution 0.1% VWC Measurement Range 0% to 50% VWC when
bulk density ≤ 1.55g/𝑐𝑚3 Figure 9 EC-10 probe from Decagon Devices (left) (Decagon Devices, 2010)
Figure 10 CS616 sensor from Campbell Scientific (right) (Campbell Scientific, 2011)
2.3. Soil temperature measurement The 107 Temperature Probe from Campbell Scientific uses a thermistor to measure temperature. It should be placed horizontally at the desired depth to avoid thermal conduction from the surface to the thermistor (Campbell Scientific, 2012). The specifications of the 107 Temperature Probes are given in the Table 6. Table 6 Specifications of the 107 Temperature Proves
Dimensions Probe length: 10.4cm; 0.762cm diameter
Accuracy -35°C to 50°C <±0.5°C; -24°C to +48°C <±0.1°C Measurement Range −35℃ to 50℃
2.4. Calibration of EC-10 soil moisture sensors The raw sensor output data need to be converted into soil moisture figure, θ as a symbol of volumetric water content (VWC) in the following formula. The data was measured in the raw period should be in the millivolt (mV) and mV is the millivolt output of the sensor. In order to calculate the water content in the soil, convert the raw data to the real date, because the data logger of this measurement is using a non-Decagon data logger, the following formula can be used (Decagon Devices,

A Study to determine the soil moisture and temperature dynamics
17
2010): θ = 11.9 ∗ 10−4 ∗ 𝑟𝑟𝑟 − 0.401 The ‘raw’ mentioned above is the measured raw period from the EC-10 in mV. This equation is the general calibration equation of the EC-10 soil moisture sensor and can be applied for all mineral soils (Decagon Devices, 2010). The equation will reach a maximum of about 60% VWC in pure water. To display data on a scale from 0 to 100%, VWC should be modeled with a quadratic equation (which should result in a 100% VWC in water). But a linear equation fits the mineral soil VWC range as well as the quadratic, and linear equations are easier to deal with, especially since mineral soil typically saturated at approximately 40 to 50% VWC (Decagon Devices, 2010), so according to the measurement range of the EC-10 as mentioned above is from 0 to 40% VWC, the linear equations are suitable for this place.
2.5. Calibration of CS616 water content reflectometer The choice of linear or quadratic equations depends on the expected range of water content and accuracy requirements (Campbell Scientific, 2011). There are three different calibration coefficients for the calibration equation, which the difference between the three coefficients is the bulk density and electrical conductivity. And these three classifications are: 1. Standard, coefficient should provide accurate volumetric water content in mineral
soils with bulk electrical conductivity less than 0.5 dS/m; bulk density less than 1.55g/cm3, and clay content less than 30% (Campbell Scientific, 2011), under this situation also general called standard calibration coefficient. The standard calibration coefficient for linear and quadratic equation can be found in the Table 7. Table 7 Standard calibration coefficients for linear and quadratic equation (Campbell Scientific, 2011)
Linear Quadratic C0 C1 C0 C1 C2
-0.4677 0.0283 -0.0663 -0.0063 0.0007
2. Calibration coefficient for sandy clay loam with bulk density 1.6g/cm3 and electrical conductivity at saturation 0.4 dS/m, which means the high bulk density and low electrical conductivity. The calibration coefficients are given in the Table 8. Table 8 Calibration coefficient for sandy clay loam with high bulk density and low electrical conductivity (Campbell Scientific, 2011)
Linear Quadratic C0 C1 C0 C1 C2
-0.6200 0.0329 0.0950 -0.0211 0.0010

A Study to determine the soil moisture and temperature dynamics
18
3. Calibration coefficient for sandy clay loam with bulk density 1.6g/cm3 and
electrical conductivity at saturation 0.75 dS/m, which means the high bulk density and high electrical conductivity. The standard calibration coefficient for linear and quadratic equation can be found in the Table 9. Table 9 Calibration coefficient for sandy clay loam with high bulk density and high electrical conductivity
Linear Quadratic C0 C1 C0 C1 C2
-0.4470 0.0254 -0.0180 -0.0070 0.0006 According to these three classifications, there are linear (formula a.) and quadratic equation (formula b.)(Campbell Scientific, 2011) can be provided to the calculation, a) VWC = C0 + C1 ∗ period b) VWC = C0 + C1 ∗ period + C2 ∗ period The period is in the microseconds.
3. RESULTS AND INTERPRETATION
According to the different soil moisture measurement inserted into the soil, the signal which is the raw data collected from the field can be calculated in the different calibration equations under two kinds of methodologies. So the measured results could be in different value for the soil moisture content. However, the EC-10 soil moisture sensors and CS616 water content reflectometer are both measuring moisture content. The results will not get a significant difference. Because of the soil moisture content has defined that should be within zero to one, the results should be considered whether realistic or not. The values of the result, which is outside the range, are impossible in this case. Some EC-10 data deleted because incorrect results were outside of the range. The deleted EC-10 soil moisture sensors are EC-θ3 (250, 10), EC-θ4 (150, 0), EC-θ8 (50, 10) and E-θC12 (50, 50) at different depths. These data are not reliable are not using in the analysis. The relations between different values were compared in the following text. The detailed measuring depths can be found in the following Figure 11.

A Study to determine the soil moisture and temperature dynamics
19
Figure 11 Cross-section instrument placement
3.1. Soil moisture tendency and soil temperature At first, the Figure 12 and Figure 13 showed the soil moisture values at the different depths. Figure 12 was the soil moisture sensor at 0cm (reference level at the water table), and the Figure 13 presented the moisture sensor at the 20cm. The soil moisture content measured with different measurement techniques, to be compared to with the soil temperature. In order to figure out the relationship between soil moisture and temperature, the tendency of soil moisture and temperature should be find out. In Figure 12 and Figure 13, the values measured by two different soil moisture sensors at the same level, one was at 0cm (point of surface water table), and the another measuring point was at 20cm. According to the figures, the overall tendency of the soil moisture content was followed by the temperature. These two graphs selected from 13 comparison graphs randomly. The rest graphs contained all values of soil moisture content, which were compared with temperature and all presented the similar tendency like the result showed in the Figure 12 and 13. So this is the relationship between temperature and soil moisture content. The temperature was one of the factors influencing the water moisture content.

A Study to determine the soil moisture and temperature dynamics
20
Figure 12 Comparison of EC-10 and CS616 at the water table level (after calibration)
Figure 13 Comparison of EC-10 and CS616 at depth of 20cm (after calibration)
The values of temperature were transformed by the signal from the field directly. In the following diagram, Figure 14 presented the tendency of different temperature sensors. From the results of the soil temperature measuring, the situation can be found that the measuring point, which is closer to the surface and easier to be influenced by the temperature, certainly the change of temperature reflected faster in these points. This point of view can be proved in the tendencies in the graph which showed in T4 and T6 in the following Figure 14. At the same time, the measuring point like T1 showed that the temperature of soils also influenced by the river, the measuring point T1 was closest to the river nearby.

A Study to determine the soil moisture and temperature dynamics
21
Figure 14 All T107 sensors at different depths
In Table 10 and Figure 14 were given the values of moisture sensors, which calibrated by the equations mentioned in the methodology section. And the EC1 and CS1 were at the same measuring depths 0cm (reference level at the water table) and they all set at 15cm from the surface (SD: distance to the surface), but these two sensors were in the different measuring lengths. EC1 was at the point 350cm (edge of the river); CS1 was at point 300cm, 50cm to the river (RD: distance to the river).
3.2. Water content and soil temperature related to distance to river According to the values in the Table 10, the points at the same temperature condition and the same distance to surface, the soil moisture content were different. Both the average value of soil moisture content and the minimum/maximum values of soil moisture content presented by EC1 sensor was larger than the value presented in the CS1 sensor. The position of EC1 was closer than CS1 to the river, and the higher soil moisture content. It showed that the distance to the river also determined the soil moisture content in this measuring area. So the soil closer to the river has the higher moisture content.
Table 10 Different values of EC1 and CS1 (after calibration) EC1 CS1 SD (cm) 15 15 RD (cm) 0 50 Moisture content (cm3/cm3)
Average 0.54 0.42 Minimum 0.51 0.41 Maximum 0.57 0.45
Temperature (℃)
Max 25.44 Min 5.54 Mean 13.00

A Study to determine the soil moisture and temperature dynamics
22
Figure 15 Comparison of soil moisture and temperature (after calibration)
3.3. Water content and soil temperature related to depth Turn to Table 11 and Figure16, in the Table 11, the values calibrated by the equation mentioned. In this situation were soil moisture sensors at the same measuring lengths (same distance to the river), and at the same temperature condition. The moisture content values of EC5 and EC6 were different, because of two moisture sensors were at different measuring depths. The EC6 is closer to the surface than EC5 and the soil moisture at point EC5 is higher than EC6. The results indicated that the different distance from the surface also can affect the soil moisture content. Table 11 Different values of CS2 and CS3 (after calibration)
EC5 EC6 SD (cm) 15 5 RD (cm) 200 200 Moisture content (cm3/cm3)
Average 0.62 0.57 Minimum 0.59 0.54 Maximum 0.66 0.62
Temperature (℃)
Max 22.21 Min 7.77 Mean 12.79

A Study to determine the soil moisture and temperature dynamics
23
Figure 16 Comparison of soil moisture and temperature (after calibration)
3.4. Relation between soil temperature and water content There were three factors influenced the soil moisture content, which were temperature, measuring depth (to the surface level) and measuring length (to the river). To find which one influenced the soil moisture most, some comparison provided in the following report. When the different soil moisture at the same temperature condition, they followed the rules that, the soil closer to the river and deeper from ground surface, the higher moisture content. Soils with the different temperature the soil moisture situation changed. When compared the EC1 with EC5 in the Table 12 and Figure 17&18, following the closer to the river and deeper than the ground surface, the higher moisture content theory, the moisture content of EC1 should be higher than the moisture content at EC5. The situation was the moisture content of EC1 was lower than EC5; the distance to the surface level of these two positions is the same, so the rainfall has effect for them. When we compare the temperature found that the temperature in the EC5 is lower than temperature in the EC1. It is shows that the higher temperature degree, the lower soil moisture content. The temperature became a factor to determine the soil moisture content. So within the three different factors which influenced the soil moisture content, according to soil layers are in the same weather condition, same rainfall, the soil temperature can be one to determine the soil moisture content in this case.

A Study to determine the soil moisture and temperature dynamics
24
Table 12 Values measured by different moisture sensors and different measuring depths (after calibration) EC1 EC5 SD (cm) 15 15 RD (cm) 0 150 Moisture content (cm3/cm3)
Average 0.54 0.62 Minimum 0.51 0.66 Maximum 0.57 0.59
Temperature (℃)
Max 25.44 22.21 Min 5.54 7.77 Mean 13.00 12.79
Figure 17 Comparison of moisture content and temperature at 0cm measuring depth (after calibration)
A Study to determine the soil moisture and temperature dynamics
25
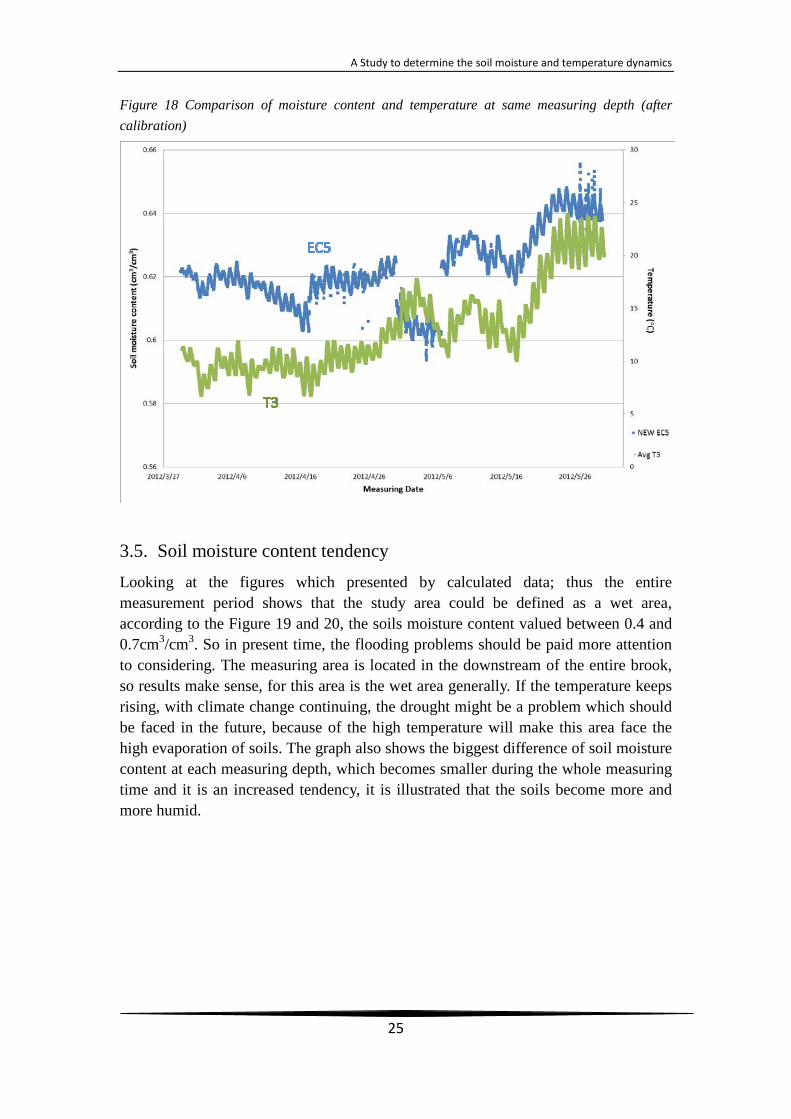
Figure 18 Comparison of moisture content and temperature at same measuring depth (after calibration)
3.5. Soil moisture content tendency Looking at the figures which presented by calculated data; thus the entire measurement period shows that the study area could be defined as a wet area, according to the Figure 19 and 20, the soils moisture content valued between 0.4 and 0.7cm3/cm3. So in present time, the flooding problems should be paid more attention to considering. The measuring area is located in the downstream of the entire brook, so results make sense, for this area is the wet area generally. If the temperature keeps rising, with climate change continuing, the drought might be a problem which should be faced in the future, because of the high temperature will make this area face the high evaporation of soils. The graph also shows the biggest difference of soil moisture content at each measuring depth, which becomes smaller during the whole measuring time and it is an increased tendency, it is illustrated that the soils become more and more humid.

A Study to determine the soil moisture and temperature dynamics
26
Figure 19 Soil moisture content measured with the EC-10 at different depths (after calibration)
Figure 20 Soil moisture content measured with the CS616 at different depths (after calibration)
4. CONCLUSION

A Study to determine the soil moisture and temperature dynamics
27
The soil moisture content was measured by two different moisture sensors, they both presented the soil moisture content was between 0.4-0.7cm3/cm3. So this area is wet and might be facing flooding now. The drought might be a problem which should be met in the future, because of the higher temperature that might lead higher evaporation of soils. Based on the data measured by EC-10 soil moisture sensor and CS616 water content reflectometer at the Baakse Beek-Veengoot catchment area, it showed that the soil moisture content in the upper soil layer is influenced by the precipitation earlier than the soil in the deeper layer. The soil moisture of deeper soil layer is always stable, and it did not influence by precipitation directly. The soil moisture content was higher at deeper soil layer than the soil moisture at the upper layer. The changes in the moisture content of different layers were different: the response of moisture content at deeper soil layer was slow while the response of moisture content at the upper soil layers was quick. In this case, the soil moisture also influenced by the river nearby. The measuring area is connected to the river, the discharge of the river influence the moisture content of soil layer, which was closest to the river. Study area will not have the different precipitation, and the rainfall influence the upper layer, and it is response slow in the deeper soil layer. When soil at the same temperature condition, soil moisture content followed rules that the soil closer to the river and ground surface, the higher soil moisture content. When soils with the different temperature, the soil moisture condition changed, it did not follow the closer to the river and ground surface, the higher moisture content theory. The soil temperature became an influential factor to determine the soil moisture content. According to the results and comparison between the values in different condition, the temperature was strongly related to the soil moisture content in this case. To use the soil moisture sensors and soil temperature probes were the way to understand the soils condition and improved understanding of drought and waterlogged situation in the specific period, in the Baakse Beek-Veengoot catchment. The results presented the soil moisture related with soil temperature, meanwhile the moisture of soils also influenced by the depth of the soil layer and length to the basin nearby.
5. RECOMMENDATION After the data analysis and discussion, there are some issues might be faced in the Baakse Beek-Veengoot catchment area. First of all, flooding issue has to be handled in the current time. Because of the result of the measuring can indicate that the study

A Study to determine the soil moisture and temperature dynamics
28
area is a wet area in the current time, maybe it will face the drought problem in downstream in the future because of the increasing global temperature. The drought and flooding aspect both need the recommendations to deal with. Keeping soils in moisture condition
Heavy rainfall may lead to flash flooding as a result of the drought conditions. Because of dry condition, compacted soils mean that rainfall is less easily absorbed into the ground, increasing the likelihood of flooding if the area is hit by storms.
The weir in downstream can be more sufficiently than presently. Technology upgrading can be an excellent way to use the weir in the downstream sufficiently. To determine the maximum and minimum limited water table value for the weir to control the water table by itself. The weir will open to drainage the water, when the water table higher than the set value.
Giving more room to the water. This is an ideal mentioned in the earlier time. The Baakse Beek-Veengoot catchment could take full advantage of this ideal, to broaden the surface area to temporary storage of water. During the flood period, give the room back to the water, other time could be the ecosystem area or farm land.
The Waterboard had already working on the study area. There are some weirs in the entire water system, and there is one near the study area. The Waterboard has already used it. At this time, the weir only perform the role of preventing the flooding, it also can display the function of storage water when the catchment encounters the drought problem.

A Study to determine the soil moisture and temperature dynamics
29
REFERENCE Boxem, F., Gosselink, K., Hobbelt, L., Pieters, B.: Meandering in the Veengoot
Feasible or not?, Wageningen University, 2011.
Bottomley, J.J., Soil moisture movement by temperature gradients, University of Auckland, 1978.
C. C. Braue, A.J. Teuling, A. Overeem, Y. van der Velde, P. Hazenberg, P.M.M. Warmerdam and R. Uijlenhoet: Anatomy of extraordinary rainfall and flash flood in a Dutch lowland catchment, Hyfrol. Earth Syst. Sci., 15, 1991-2005, DOI: 10.5194/hess-15-1991-2011, 2011.
Campbell Scientific CS616 and CS625 Water Content Reflectometer User’s Guide, Campbell Scientific Inc., 2011.
Campbell Scientific Model 107 Temperature Probe Instruction Manual, Campbell Scientific Inc., 2012.
Decagon Devices EC-20, EC-10, EC-5 Soil Moisture Sensors User’s Manual, version 10. Decagon Devices Inc., 2010.
Dijksma, R., Van Lanen, H., Teuling R., Brauer, C., De Klein, J., Moene, A. and Hartogensis, O.: Field Practical Hydrology, Wter Quality and Meteorology, Hydrology and Quantitative Water Management Group, Aquatic Ecology and Water Quality Management Group, Meteorology and Air Quality Section, Wageningen University, 19-20, 2011.
Dirksen, C.: Soil Physics Measurements GeoEcology paperback, Chapter 3 Soil water content, 25-26, 1999.
Frenken, T., Khanal G., Ronde, V., Vreugdenhil, I.: A Study to Decrease Man-induced Drought in the Baakse Beek Catchment, Wageningen University, 2011.
Huang, P.M., Li, Y. and Sumner, M.E., Handbook of Soil Sciences: Properties and Processes, Chapter 9: soil thermal regime, 9-1-9-17, 2012.
KNMI, Royal Netherlands Meteorological Institute: Project Future Weather, 2011. (http://www.knmi.nl/samenw/regioklim/FW/page2.html)
Krajenbrink G.J.W.: Landschapsherstel in het stroomgebied van Baakse

A Study to determine the soil moisture and temperature dynamics
30
Beek-Veengoot, Waterboard ‘Rijn en IJssel’, 2007.
Krajenbrink G.J.W.: Leren van 15 jaar beekherstel in de Achterhoek, Naar een duurzaam landschap, Waterbord ‘Rijn en IJssel’, 2007.
Liu, Q., Reichle, R.H., Bindlish, R., Cosh, M.H., Crow, W.T., De Jeu, R., De Lannoy, G.J.M., Huffman and G.J., Jackson, T.J.: The Contribution of Precipitation and Soil Moisture Observations to the Skill of Soil Moisture Estimates in a Land Data Assimilation System, Journal of Hydrometeorology, 750-765, DOI: 10.1175/JHM-D-10-05000.1, 2011.
Miyazaki, T., Water flow in soils, Chapter 6 : water flow under the effects of temperature gradients, 169-196, 1993.
Uehlinger, U., Wantzen, K.M., Leuven, R.S.E.W., Arndt, H.: The Rhine River Basin, Rivers of Europe/Klement Tockner U.A. – London: Acad. Pr., 2009, pp. 199-245-ISBN 978-0-12-369449-2, 2009.
Vos, H., Potential use of swell and shrinkage measurements of clays in hydrology, 14, 2012.
Vorage, R.: Investerings agenda agrarische sector Baakse Beek–Veengoot, Waterboard ‘Rijn en IJssel’, 2009.
Waterboard ‘Rijn en IJssel’: Boven-en Middenloop Baakse Beek-Veengoot, Cultuurhistorische Verkening, 2010.
Waterboard ‘Rijn en IJssel’: Bouwsteen Water Baakse Beek-Veengoot, 16-17, 22-23, 2010.
Wageningen University: Master course, Environmental Data Collection and Analyse, 2012.

A Study to determine the soil moisture and temperature dynamics
31
APPENDIX A-Project proposal
Thesis Proposal
A study to determine the soil moisture and temperature
dynamics
Yimeng Zou 880904001
IWM
Background information The study area is the Baakse Beek-Veengoot catchment, a watershed in the East of the Netherlands, which consists of both the Baakse Beek and the Veengoot brooks, partly natural and partly artificial surface waters that flow into the Ijssel River. During the last centuries, people want to develop this swamp area to agricultural lands. The large increase in the agricultural area, to accommodate draining of the peat areas, two brooks developed known as the Veengoot and the Baakse Beek. These streams significantly changed the landscape of the catchment area, in particular the flat middle section, which was once a wetland (Adriaan et al., 2011). The area has been drained and locally, the natural drainage pattern had been changed drastically (Wardenaar et al., 2006). Because the climate change, the extreme condition happened more than before. For instance the drought and too much precipitation in a specific period, although the amount of water is not influencing so much in the entire water system. This caused drought to become a major issue in the upstream and flooding in the downstream area (Krajenbrink, 2007).
Problem analysis Because of the climate change, more and more extreme weather condition happened in the Netherlands. To review adaptation measures to mitigate drought and flood in the Baakse Beek-Veengoot catchment. There are many reasons to occur flooding and drought, this report is focusing on the soil moisture content. Meanwhile, there are many factors influence the soil moisture content, the soil temperature will be the point which this research pay attention to.
Objective

A Study to determine the soil moisture and temperature dynamics
32
The objective of this study is also to understand the hydrological effects of adaptation measures in order to process understanding. This research is to explain the water dynamics in the dry period, and wet condition with the aim to decrease negative consequences, which caused during extreme weather conditions. Retaining the water in the soil upstream as long as possible to prevent drought, and at the same time, the flooding problem in the downstream will be solved to some extent, at the same time, to deal with the extreme conditions also can improve the water quality and the ecosystem in the study area.
Research question What is the historical background of this part of the catchment area? What are the current conditions in the catchment area? What is the geology in this part of the catchment area? What are the different soil types?
What about the soil condition? What kind of measures already have right now? What kind of methodology and equipment will be used in the research? What kind of problems the catchment faced now? Drought? The reason why?
Flooding?? What relation between soil moisture and soil temperature dynamics? How to deal with the problems faced now? How to keep water in the soil in the upstream to prevent the drought? How to deal with the consequences from the peak discharges or drought
condition?
Methodology There are some measurements available to collect the data in the field to analyse the current temperature and soil moisture condition of the Baakse Beek-Veengoot catchment. Then soil moisture content will be measured with the EC-10 soil moisture content sensor from Decagon Devices and CS616 water content reflectometer from Campbell Scientific. The soil temperature will be measured with the T-107 temperature probe from Campbell Scientific. The data getting from the field will be calculated and calibrated by the equations, after that compare the different data to get the results of comparison between soil moisture and temperature. The resulting fields will analysed with computer software and system.
Time schedule

A Study to determine the soil moisture and temperature dynamics
33
Activity Amount of time Period
Literature Review 2 weeks 13th – 24th February Proposal Writing 1 weeks 27th February – 2nd March Field work & Analyse data 5 weeks 5th March – 6th April Discuss result 6 weeks 9th April – 18th May Writing report 3 weeks 21th May – 7th June Prepare & Presentation 2 weeks 11th – 22th June Colloquia 1 day 27th June
Reference De Bourgraaf, A., Engel, W., Huza, J. and Stegerman, A., 2011.
Increasing the River Bed Height in the middle section of Veengoot at the Baakse Beek Catchment Area.
Krajenbrink, G.J.W., 2007. Leren van 15 jaar beekherstel in de Achterhoek. Naar een duurzaam landschap. Project nummer: KP0650 SN, Waterschap Rijn en Ijssel, Stiching Landschapsbeheer Gelderland.
Wardenaar, K.J., Zondervan, M., Haartsen, A.H. and Storms-Smeets, E., 2006. Landgoederenzone Baakse Beek. Ontwerpstudie waterbeheer. Cultuurhistorie als inspiratiebron voor ruimtelijke ontwikkeling. Vista landscapeand urban design and Bureau Lantschap.