Embed Size (px)
Citation preview

A Study on Unsteady Flow Phenomena at Near-Stallin a Multi-Stage Axial Flow Compressorby Large-Scale DES with K Computer
Kazutoyo Yamada1, Masato Furukawa1, Satoshi Nakakido1, Yuki Tamura1, Akinori Matsuoka2 and Kentaro Nakayama2
1Department of Mechanical Engineering, Kyushu University744 Motooka, Nishi-ku, Fukuoka 819-0395, Japan
2Kawasaki Heavy Industries, Ltd.1-1, Kawasaki-cho, Akashi, Hyogo 673-8666, Japan
ABSTRACTThe paper presents the results of large-scale numerical simula-
tions which were conducted for better understanding of unsteadyflow phenomena in a multi-stage axial flow compressor at near-stallcondition. The compressor is a test rig compressor which was usedfor development of the industrial gas turbine, Kawasaki L30A. Thecompressor consists of 14 stages, the front two stages and the fronthalf stages of which were investigated in the present study. Accord-ing to the test data, it is considered that the 2nd stage and the 5th or6th stage are suspected of leading to the stall. The final goal of thisstudy is to elucidate the flow mechanism of the rotating stall incep-tion in the multi-stage axial compressor for actual gas turbines.
In order to capture precise flow physics in the compressor, acomputational mesh for the simulation was generated to have atleast several million cells per passage, which amounted to 650 mil-lion cells for the front 2-stage simulation and two billion cells forthe front 7-stage simulation (three hundred million cells for eachstage). Since these were still not enough for the large-eddy sim-ulation (LES), the detached-eddy simulation (DES) was employed,which can calculate flow fields except near-wall region by LES. Therequired computational resources were quite large for such sim-ulations, so the computations were conducted on the K computer(RIKEN AICS in Japan).
Unsteady flow phenomena in the present compressor at near-stallcondition were analyzed by using data mining techniques such asvortex identification and limiting streamline drawing with the LIC(line integral convolution) method. The simulation showed that thestall in the present compressor could be related to the corner sepa-ration on the hub side.
INTRODUCTIONThe lower limit of the operating range of compressors is de-
termined by the surge, which is an unstable phenomenon of flow.The surge is sometimes provoked by another unsteady flow phe-nomenon: the rotating stall. The rotating stall poses efficiencydegradation, noise generation and blade vibration, at worst whichcould lead to breakdown of the compressor. Therefore, it is criticalto predict the condition of stall inception for design as well as de-velopment of compressors. After many researches addressing theissue of the rotating stall, it has been revealed that the disturbanceappears as a sign of the rotating stall, and is categorized into twotypes in axial compressors: the spike-type (short length-scale dis-turbance) and the modal-type (long length-scale disturbance)[1–3].The spike disturbance occurs at the stall inception, and rapidly de-velops into the rotating stall, which is often finished within several
rotor revolutions. Generally, it would be too late to control the stalleven if detecting the spike disturbance. It follows that the better un-derstanding of the flow physics behind the spike-type stall inceptionis more important, because it allows predicting and improving thestall margin in design stage.
It is widely accepted that the tip clearance flow has a great influ-ence on the compressor stability. Also from the aspect of accessi-bility in measurements, the tip clearance flow has been investigated.Hoying et al. have explained about the flow field at the stall incep-tion from the numerical simulation, and described the phenomenonthat the tip clearance vortex is pushed upstream from the rotor withincreasing incidence [4]. Vo et al. have proposed the flow phe-nomenon called ”spillage”, which indicates that the tip clearanceflow spills into the next passage ahead of the next blade leading-edge below the tip, as criteria for the spike stall [5]. Meanwhile,it is also considered that the spike disturbance is related to a lo-cal separation of the boundary layer on the blade suction surfacenear the rotor tip [6]. The spike stall has been identified as propa-gating low-pressure regions on the casing wall around the leading-edge [7,8], and it was confirmed that the low-pressure regions havealready appeared as the pre-stall disturbance, forming in the for-ward part of the blade passage [9]. Recently, it has been revealedthat the tornado-like radial vortex (Figure 1), which results fromthe leading-edge separation near the tip, generates the low-pressureregion, and its propagation leads to the spike disturbance [10–12].Moreover, it was explained that the tornado vortex carries the tipclearance flow to the upstream of the rotor, which results in thespillage [12]. In most cases, those findings are from researches forsingle stage and/or low speed compressors. It is unknown whetherthey are applicable for actual multi-stage machines, which includeunclear effects such as wake interaction and Mach number.
The final goal is to clarify the flow mechanism of the rotating stallinception in an actual axial compressor, conducting a large-scalefull annulus simulation of a 14-stage compressor (which includeinlet guide vane and outlet guide vane). In the present study, asdescribed hereinbelow, two kinds of simulations that are front 2-stage simulation and front 7-stage simulation have been conductedbased on the experimental results.
MULTI-STAGE AXIAL FLOW COMPRESSORThe compressor analyzed in this study is a multi-stage axial com-
pressor developed for a 30MW-class high-efficiency industrial gasturbine in Kawasaki Heavy Industries, Ltd.[13]. Figure 2 shows anoverview of the gas turbine and its compressor rotor. The compres-sor consists of 14 stages. In order to achieve a high cycle efficiency,
Presented at International Gas Turbine Congress 2015 Tokyo November 15-20, Tokyo, Japan Review Completed on August 10, 2016
Copyright © 2017 Gas Turbine Society of Japan
18
International Journal of Gas Turbine, Propulsion and Power Systems February 2017, Volume 9, Number 1
SimulationIllustration
Tip clearance flow
Tornado-like vortex
Low pressure region
Separated boundary layer flow
Fig.1 Tornado-like separation vortex at the spike stall inception
(a) Overview
(b) Rig compressor rotor
Fig.2 30MW class gas turbine
Table 1 Specifications of test compressor
Tip radius of 1st rotor at leading-edge 272 mmTip clearance of 1st rotor 0.3 mmAspect ratio (rotor, stator) 1.4 ∼ 1.1, 2.9 ∼ 1.1Drive shaft speed 14,810 rpmMass flow rate 33.7 kg/sTotal pressure ratio (14stages) 22
the compressor has been designed with the pressure ratio of 24 at thedesign point, which is one of the highest pressure ratios in the mid-dle class gas turbine. The compressor rig test were conducted usinga down-scaled compressor in the development of the gas turbine.In this study, the simulations have been conducted for this test-rigcompressor instead of the actual one in order to compare the resultswith the measurement data in the rig test. The specifications of thetest rig compressor are given in Table 1.
In the rig test, measurements have been conducted to understandthe internal flow condition as well as the overall aerodynamic per-formance of the compressor. To assess the stage matching duringoperation, total pressure and total temperature have been measuredby the leading-edge sensors mounted on the stator vanes at severalstations, and moreover static pressure on the casing wall has beenmeasured at all stations between blade rows. In addition, for thepurpose of monitoring the occurrence of the surge or the rotatingstall, Kulite sensors have been mounted on the casing wall at theinlet and the exit of the 1st stage and at the exits of the 6th rotorand the 14th rotor, measuring pressure fluctuations. Furthermore,
measurements of internal flow fields have been conducted at the up-stream and the downstream of the 1st rotor by traversing the three-hole probe and the total temperature probe.
NUMERICAL METHODFlow Solver
The present simulations were conducted using the in-house codethat had been successfully developed by the authors [14, 15] andwell validated for various turbomachinery flows. The code solvesthe three-dimensional compressible Navier-Stokes equations byusing a fully-implicit scheme with a cell-centered finite volumemethod. The numerical schemes of the code are outlined in thefollowing. The inviscid flux is evaluated by the Simple High-resolution Upwind Scheme (SHUS) [16], which is extended up tothird-order accuracy by the MUSCL interpolation with the Van Al-bada limiter [17]. The viscous flux is determined in a central differ-encing manner with Gauss’s theorem. The point relaxation methodbased on MFGS (Matrix Free Gauss-Seidel) implicit algorithm [18]is used for the time integration. To obtain a time-accurate solu-tion, the second-order backward difference is applied to the tempo-ral derivative and the inner iteration is conducted at each time step.In this study, we set the inner iteration to 5 times. A nondimensionaltime step size, which was normalized by the rotor tip radius and theinlet sound speed, was set to 0.000521. It follows that the time pe-riod of one rotor revolution is resolved with 10,000 time steps.
In this study, the DES approach was employed for the turbulencemodeling. The DES in the present study is formulated based on thelow Reynolds number k-ω turbulence model [19]. The dissipationterm in the k-equation of the k-ω turbulence model is modified asfollows [20]:
DkDES = ρk3/2/l̃ (1)
l̃ = min(lk−ω ,CDES∆) (2)
where l is the turbulent length scale, ∆ is the local grid spacing, andCDES is a calibration constant of the DES formulation, which wasset to 1.60 in this study. The CDES was calibrated by another testsimulation. In order to capture the unsteady phenomena associatedwith the stall in the tip clearance flow field, the DDES model hasnot been used in the present study. The tip clearance flow is gen-erally immersed in the thick casing boundary layer, which leads toa problem that the tip clearance flow is calculated by RANS if theDDES model is applied.
Computational GridAs mentioned above, off-design flow fields were analyzed for
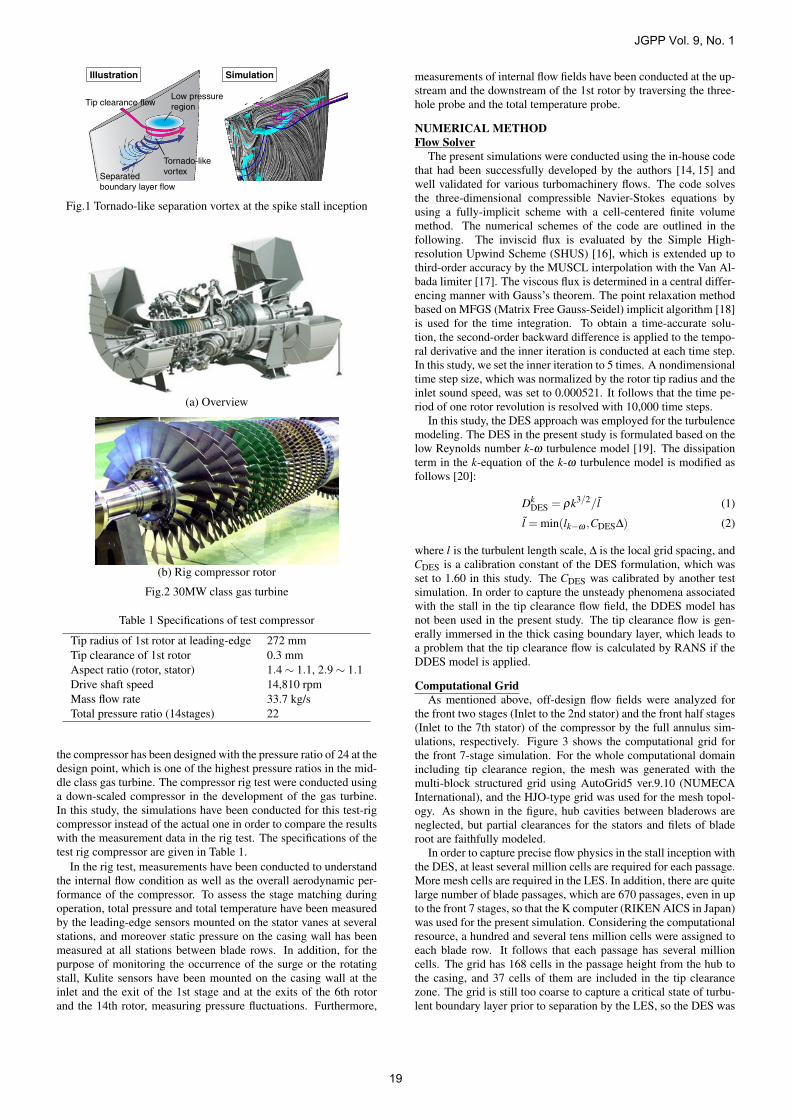
the front two stages (Inlet to the 2nd stator) and the front half stages(Inlet to the 7th stator) of the compressor by the full annulus sim-ulations, respectively. Figure 3 shows the computational grid forthe front 7-stage simulation. For the whole computational domainincluding tip clearance region, the mesh was generated with themulti-block structured grid using AutoGrid5 ver.9.10 (NUMECAInternational), and the HJO-type grid was used for the mesh topol-ogy. As shown in the figure, hub cavities between bladerows areneglected, but partial clearances for the stators and filets of bladeroot are faithfully modeled.
In order to capture precise flow physics in the stall inception withthe DES, at least several million cells are required for each passage.More mesh cells are required in the LES. In addition, there are quitelarge number of blade passages, which are 670 passages, even in upto the front 7 stages, so that the K computer (RIKEN AICS in Japan)was used for the present simulation. Considering the computationalresource, a hundred and several tens million cells were assigned toeach blade row. It follows that each passage has several millioncells. The grid has 168 cells in the passage height from the hub tothe casing, and 37 cells of them are included in the tip clearancezone. The grid is still too coarse to capture a critical state of turbu-lent boundary layer prior to separation by the LES, so the DES was
JGPP Vol. 9, No. 1
19
(a) Overview (every three lines)
(b) Closeup view of fillet and partial clearanceFig.3 Computational grid
applied in the present study as stated before. The number of compu-tational cells for the front 7-stage simulation amounts to about twobillion in total (650 million for the front 2-stage simulation). Theminimum spacing on the wall was set small enough to satisfy withthe condition of y+ < 1, so as to evaluate the viscous flux at the wallwithout the wall function method.
Boundary ConditionsIn the flow solver, fictitious cells are introduced just outside all
the boundaries of computational domain, in which the conservedvariables are given so as to meet the boundary condition. As the in-flow boundary condition, total pressure, total temperature and flowangles in tangential and radial directions are specified, and the con-served variables in the fictitious cells are calculated based on thosefixed values. At the outflow boundary, a mass flow rate is speci-fied for accelarating the simulation by starting from the steady-stateRANS simulation result. All conserved variables for the fictitiouscells are extrapolated from the interior cells, scaling the velocitymagnitude so as to maintain the imposed total mass flow rate. Inthe front 7-stage simulation, instead a static pressure is specified,because there are large discrepancies in the flow field and the stallpoint from the steady-state simulation. For the fictitious cells nextto solid wall boundaries, the conserved variables are given so thatno-slip and adiabatic conditions can be satisfied. As for the cas-ing wall boundary, however, the isothermal condition is applied tofix the temperature with the value estimated from the test result.Since temperature of fluids increases in the axial direction in high-pressure multi-stage compressors, heat transfer can no longer beneglected especially at near-stall [21]. The mixing plane approachis used for the steady-state RANS simulation, whose results are uti-lized as the intial condition for the full annulus DES calculations.In the DES calculation, the flow field goes into a quasi-steady statein a couple of revolutions after starting this initial condition.
RESULTS AND DISCUSSIONS
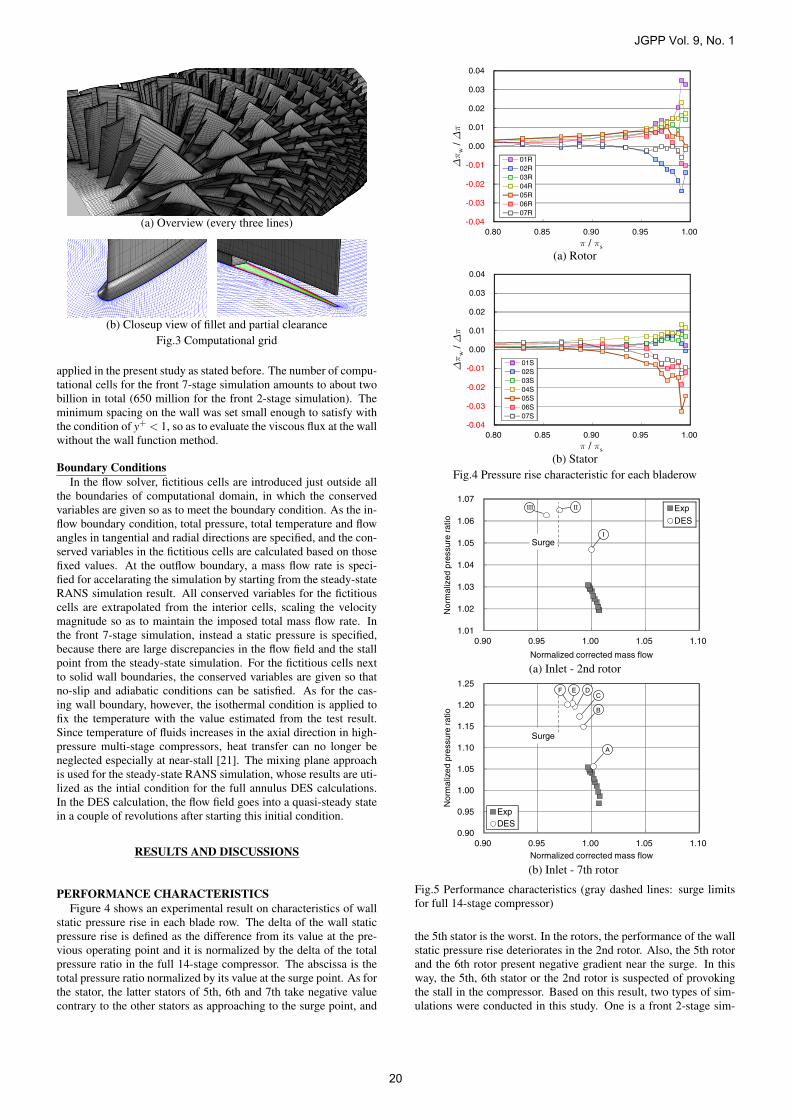
PERFORMANCE CHARACTERISTICSFigure 4 shows an experimental result on characteristics of wall
static pressure rise in each blade row. The delta of the wall staticpressure rise is defined as the difference from its value at the pre-vious operating point and it is normalized by the delta of the totalpressure ratio in the full 14-stage compressor. The abscissa is thetotal pressure ratio normalized by its value at the surge point. As forthe stator, the latter stators of 5th, 6th and 7th take negative valuecontrary to the other stators as approaching to the surge point, and
-0.04
-0.03
-0.02
-0.01
0.00
0.01
0.02
0.03
0.04
0.80 0.85 0.90 0.95 1.00
01R02R03R04R05R06R07R
π / πs
∆π
w/ ∆
π
(a) Rotor
-0.04
-0.03
-0.02
-0.01
0.00
0.01
0.02
0.03
0.04
0.80 0.85 0.90 0.95 1.00
01S02S03S04S05S06S07S
π / πs∆π
w/ ∆
π(b) Stator
Fig.4 Pressure rise characteristic for each bladerow
1.01
1.02
1.03
1.04
1.05
1.06
1.07
0.90 0.95 1.00 1.05 1.10
Exp
DES
Normalized corrected mass flow
Nor
mal
ized
pre
ssur
e ra
tio
Surge
III
I
II
(a) Inlet - 2nd rotor
0.90
0.95
1.00
1.05
1.10
1.15
1.20
1.25
0.90 0.95 1.00 1.05 1.10
ExpDES
Normalized corrected mass flow
Nor
mal
ized
pre
ssur
e ra
tio
Surge
A
B
CDEF
(b) Inlet - 7th rotor
Fig.5 Performance characteristics (gray dashed lines: surge limitsfor full 14-stage compressor)
the 5th stator is the worst. In the rotors, the performance of the wallstatic pressure rise deteriorates in the 2nd rotor. Also, the 5th rotorand the 6th rotor present negative gradient near the surge. In thisway, the 5th, 6th stator or the 2nd rotor is suspected of provokingthe stall in the compressor. Based on this result, two types of sim-ulations were conducted in this study. One is a front 2-stage sim-
JGPP Vol. 9, No. 1
20

Blockage
0.300.60 zC
Fig.6 Pitchwise-averaged axial velocity distribution on meridionalplane (Front 2-stage simulation, Point II)
nH
M
Hub Corner Separation
Vortex
0.0
1.4
-1.0
1.0Leakage Vortex
Fig.7 Instantaneous flow field of 2nd stator (Front 2-stage simula-tion, Point II)
ulation from inlet to the 2nd stator, and the other is a front 7-stagesimulation from inlet to the 7th stator.
Figure 5 shows the performance maps for the front 2-stage andthe front 7-stage of the compressor. The pressure ratio of the exper-iment was obtained from the measurement data of the leading-edgesensors mounted on the stator vanes. In the figure, the pressureratio and the mass flow are normalized by the respective design val-ues. The gray dashed lines denote a predicted surge limit for thefull 14-stage compressor. The simulations were conducted at 100%speed. The nondimensional mass flow conditions analyzed by thefront 2-stage simulation were 1.0 (Point I: design point), 0.97 (PointII: surge point in the experiment) and 0.96 (Point III: stall point inthe simulation). The front 7-stage simulations were conducted atsix operating points from near-design point (Point A: 1.00) to stallpoint (Point F: 0.977), increasing the outlet pressure little by little.Both front 2-stage and 7-stage simulations have slightly overpre-dicted the pressure ratio compared to the experimental results, buttheir discrepancies are small with less than two percentage points.Comparing the stall point, the stall has started at higher mass flow inthe front 7-stage simulation. It implies that a latter stage has falleninto a stall state prior to the 2nd stage.
FRONT 2-STAGE SIMULATIONIn this section, unsteady flow phenomena at the stall inception,
which were confirmed in the front 2-stage simulation, are described.Figure 6 shows pitchwise-averaged axial velocity distribution on
a meridional plane at Point II. There is no low velocity region nearthe casing wall. Instead, it has appeared on the hub side in the 2ndstator. Figure 7 illustrates a flow field around the 2nd stator at pointII. The figure shows an instantaneous flow field around a represen-tative 2nd stator vane. Vortex cores colored with the normalized he-licity, limiting streamlines on the blade suction surface and a Machnumber contour on the crossflow plane just downstream of the sta-tor are described. As seen from the limiting streamlines and vortexcores, the corner separation has occurred on the hub side. This hubcorner separation can be found in all 2nd stator vanes at this oper-ating condition. As a result, the low velocity region is seen on thehub side in the 2nd stator, as shown in Figure 6.
0.0
0.1
0.2
0.3
0.4
0.5
0.6
0.7
0.8
0.9
1.0
Point III
Point IV
0.0
0.1
0.2
0.3
0.4
0.5
0.6
0.7
0.8
0.9
1.0
Point III
Point IV
Non
dim
entio
nals
pan
Relative flow angle [deg]
Non
dim
entio
nals
pan
Absolute flow angle [deg]
1010
(a) 2nd rotor (b) 2nd statorFig.8 Inlet flow angle distributions of 2nd rotor and stator (Front2-stage simulation, Point II)
0.90
0.95
1.00
1.05
26.0 27.0 28.0 29.0 30.0 31.0 32.0 33.0
1st Rotor2nd Rotor
Rotation
Tot
al p
ress
ure
ratio A
B
0.90
0.95
1.00
1.05
26.0 27.0 28.0 29.0 30.0 31.0 32.0 33.0
1st Stator2nd Stator
Rotation
Sta
tic p
ress
ure
ratio
Fig.9 Time histories of pressure ratio at stall inception (Front 2-stage simulation, Point III)
Tornado-like Separation
Vortex
Shock-induced
Separation
Tip Leakage Vortex
- 1.0 [ ]nH −1.0
Fig.10 Instantaneous vortical flow structures in 2nd rotor at stallinception (Front 2-stage simulation, Point III)
Figure 8 shows the inlet flow angle distributions of the 2nd ro-tor and the 2nd stator. In the figure, the flow angle represents therelative flow angle for the rotor and the absolute flow angle for thestator. As seen in the figure, the flow angle is increased on the hubside with decreasing flow rate. As mentioned above, the hub cornerseparation arises in the 2nd stator at point II, and thereby it gen-erates a large blockage on the hub side. The increase of the flowangle on the hub side is caused by this blockage effect due to thehub corner separation. In addition, the influence of the blockage
JGPP Vol. 9, No. 1
21
Rotation
nH
-1.0
-1.0
Fig.11 Instantaneous vortical flow structures in 2nd rotor at stalling condition (Front 2-stage simulation, Point III)
effect extends to the upstream 2nd rotor, and the flow angle in the2nd rotor is increased on the hub side as well. The increase in theinlet flow angle provokes the leading-edge separation in the rotor,which eventually triggers the rotating stall. Actually, the rotatingstall appears in the 2nd rotor at Point III as mentioned below.
Figure 9 shows time histories of pressure ratio in each of the ro-tors and stators at stall inception of Point III. The pressure ratio rep-resents the total pressure ratio for the rotors and the static pressureratio for the stators, and it is normalized by its pre-stall value at thesame operating condition. The pressure ratio has rapidly decreasedin the 2nd rotor after passing around 26 revolutions; namely the stallhas started from the 2nd rotor. The pressure ratio stops decreasingonce, but it starts decreasing again and drastically drops within onerevolution after 31 revolutions. From the influence of this stall in the2nd rotor, the pressure ratio has decreased a little also in upstreamand downstream stators at the same time. Regarding the stall whichhas occurred in the 2nd rotor, flow phenomena at the stall inceptionare described below.
Figure 10 shows an instantaneous flow field in the 2nd rotor atthe stall inception. This is when the pressure ratio has just starteddecreasing in the 2nd rotor (Point A in Figure 9; 26.4 revolutions).In the figure, vortex cores and limiting streamlines on the blade suc-tion surface are shown for three rotor pitches. A characteristic eventcan be seen; there is a separation-type focal point on the limitingstreamlines for the center blade of the figure, from which a tornado-type separation vortex has been produced. As mentioned above,the hub corner separation has already happened in the downstream2nd stator at a little higher massflow rate (Point II) than the stallpoint (Point III). The blockage effect due to the hub corner separa-tion increases the flow angle of the upstream 2nd rotor on the hubside, as shown in Figure 8. As a result, the leading-edge separationhas been induced in the 2nd rotor on the hub side, after the cornerseparation has developed at Point III. As shown in the figure, thisleading-edge separation is sometimes released from the blade, gen-erating the tornado-type vortex. This tornado-type separation vortexgrows with time, and eventually develops into the rotating stall cellpropagating the rotor.
Figure11 shows an instantaneous flow field in 2nd rotor atstalling condition (Point B in Figure9; 31.8 revolutions). In thefigure, vortex cores, which are colored with the normalized helic-ity, and the limiting streamline on the blade suction surfaces arepresented. The leading-edge separation is occurring in all bladesnear the hub, producing complicated large-scale vortices. The hubleading-edge separation is extended to the tip side from the right-side blade to the left-side blade in the upper row, in which the bladeloading is lost; this region corresponds to the stall cell. The stallcell occupies about one-third of the annulus. This stall cell rotatesin the counter direction to the rotation, propagating in the rotor.
FRONT 7-STAGE SIMULATIONIn this section, the result of the front 7-stage simulation, which
includes the 5th and 6th stages suspected of stall initiation, is dis-
cussed.Figure 12 shows a comparison of wall static pressure ratio of
each stage at Point A. The pressure ratio is normalized by the designvalue. The DES is in quite good agreement with the experiment.The calculated pressure ratio is slightly higher in the front stages.Still, the discrepancy is within few points. The pressure ratio ishigher than the design value in the 1st and 2nd stages, and besides,the 5th and 6th stages. This trend has been successfully predictedby the DES. The trend that the pressure ratio is higher in the 5thand 6th stages also implies that the stall is more likely to happen inthose stages.
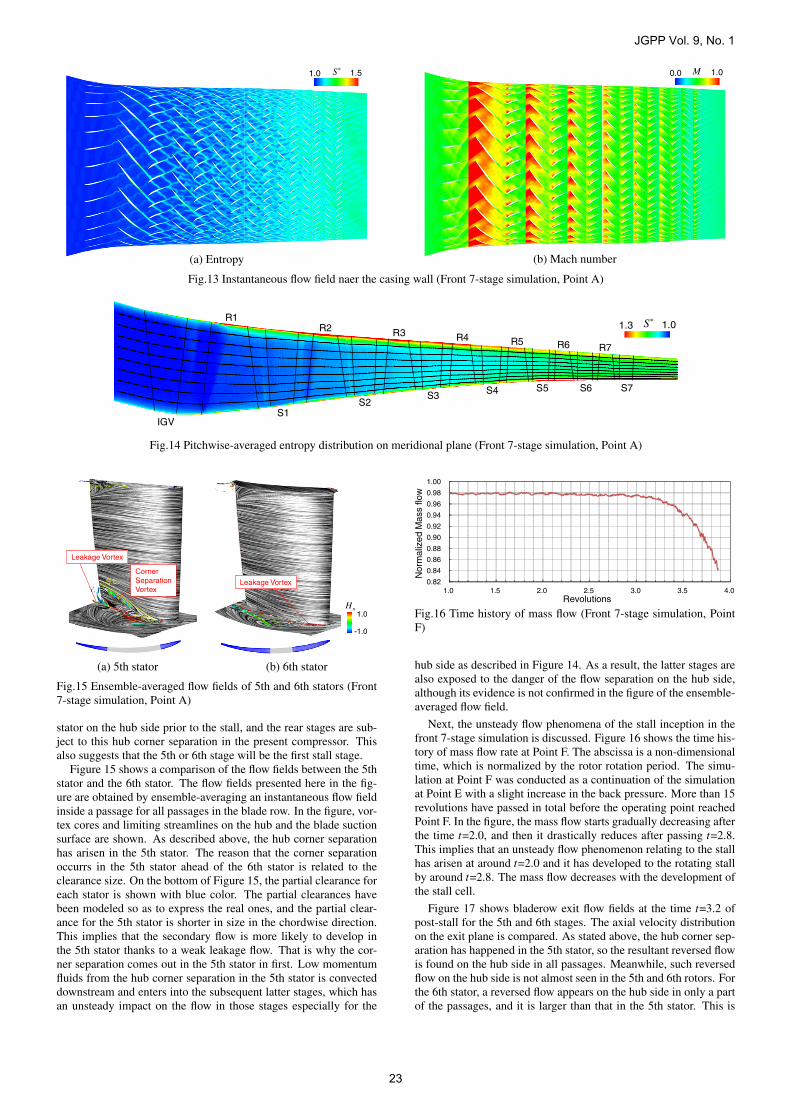
Figure 13 shows the entropy and Mach number distributions ataround 80% span for an instantaneous flow field at Point A. As re-gards the Mach number in the the rotor sections, it is presented bythe relative value. From the Mach number distribution, the shockwaves are found just upstream of the 1st rotor and the 2nd rotor.The shock wave of the 1st rotor has extended far upstream, interact-ing with IGV, and its reflecting wave has been propagating insideIGV. In addition, the 1st rotor shock wave has also interacted withthe wakes from IGV. Accordingly, the wakes from IGV have beendistorted by the interaction. The figure shows that the simulationhas succeeded in sharply capturing the shock wave and the wakes.
Figure 14 shows pitchwise-averaged entropy function distribu-tion on the meridional plane at Point A. In the figure, meridionalstreamlines are presented with black lines as well. The flow fieldin the figure has been obtained by pitchwise-averaging an instanta-neous flow field over full annulus. In the front stages, high entropyis seen near the casing wall owing to the occurrence of strong tipleakage flows and their interaction with the shock wave in the ro-tors. Especially, the entropy has become higher from the 2nd rotortip. As described in the previous section, the stall results from thehub corner stall in the 2nd stator for the front 2-stage simulation.However, such sign is not confirmed in the front 7-stage simulation.Instead, the tip-side flow appears to get into a critical state for thestall in the front stages. For the rear stages, the entropy is generatedin the 5th stator (S5 in the figure) on the hub side. This is attributedto the occurrence of hub corner separation, as stated below. In thisway, the unfavorable flow phenomenon is already found in the 5th
0.80
0.85
0.90
0.95
1.00
1.05
1.10
1.15
1.20
stage 1(except for IGV)
stage 2 stage 3 stage 4 stage 5 stage 6 stage 7
Sta
tic p
ress
ure
ratio
EXP
DES
Fig.12 Comparison of stage pressure ratio (Front 7-stage simula-tion, Point A)
JGPP Vol. 9, No. 1
22
1.51.0 S*
(a) Entropy
1.00.0 M
(b) Mach number
Fig.13 Instantaneous flow field naer the casing wall (Front 7-stage simulation, Point A)
IGV
R1R2 R3 R4 R5 R6 R7
S1S2
S3 S4 S5 S6 S7
1.01.3 S*
Fig.14 Pitchwise-averaged entropy distribution on meridional plane (Front 7-stage simulation, Point A)
Leakage Vortex
Leakage Vortex
Corner Separation Vortex
S.L.
nH
-1.0
-1.0
(a) 5th stator (b) 6th stator
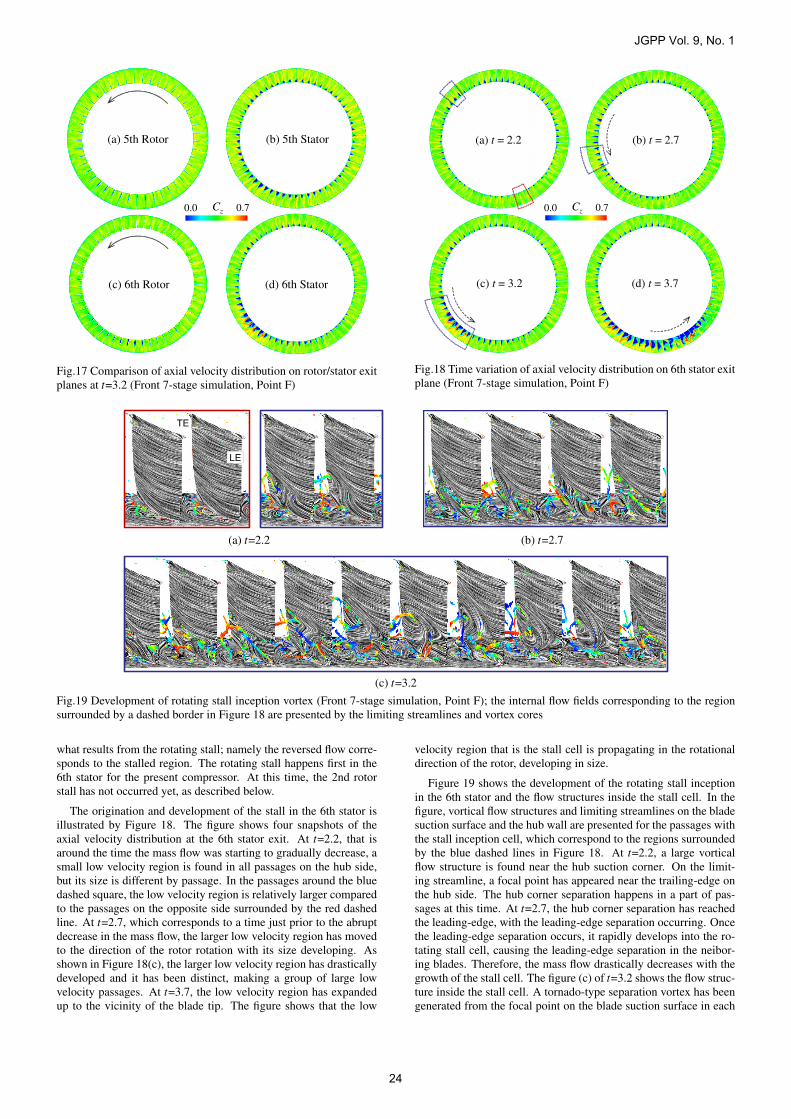
Fig.15 Ensemble-averaged flow fields of 5th and 6th stators (Front7-stage simulation, Point A)
stator on the hub side prior to the stall, and the rear stages are sub-ject to this hub corner separation in the present compressor. Thisalso suggests that the 5th or 6th stage will be the first stall stage.
Figure 15 shows a comparison of the flow fields between the 5thstator and the 6th stator. The flow fields presented here in the fig-ure are obtained by ensemble-averaging an instantaneous flow fieldinside a passage for all passages in the blade row. In the figure, vor-tex cores and limiting streamlines on the hub and the blade suctionsurface are shown. As described above, the hub corner separationhas arisen in the 5th stator. The reason that the corner separationoccurrs in the 5th stator ahead of the 6th stator is related to theclearance size. On the bottom of Figure 15, the partial clearance foreach stator is shown with blue color. The partial clearances havebeen modeled so as to express the real ones, and the partial clear-ance for the 5th stator is shorter in size in the chordwise direction.This implies that the secondary flow is more likely to develop inthe 5th stator thanks to a weak leakage flow. That is why the cor-ner separation comes out in the 5th stator in first. Low momentumfluids from the hub corner separation in the 5th stator is convecteddownstream and enters into the subsequent latter stages, which hasan unsteady impact on the flow in those stages especially for the
0.82
0.84
0.86
0.88
0.90
0.92
0.94
0.96
0.98
1.00
1.0 1.5 2.0 2.5 3.0 3.5 4.0
Nor
mal
ized
Mas
s flo
w
Revolutions
Fig.16 Time history of mass flow (Front 7-stage simulation, PointF)
hub side as described in Figure 14. As a result, the latter stages arealso exposed to the danger of the flow separation on the hub side,although its evidence is not confirmed in the figure of the ensemble-averaged flow field.
Next, the unsteady flow phenomena of the stall inception in thefront 7-stage simulation is discussed. Figure 16 shows the time his-tory of mass flow rate at Point F. The abscissa is a non-dimensionaltime, which is normalized by the rotor rotation period. The simu-lation at Point F was conducted as a continuation of the simulationat Point E with a slight increase in the back pressure. More than 15revolutions have passed in total before the operating point reachedPoint F. In the figure, the mass flow starts gradually decreasing afterthe time t=2.0, and then it drastically reduces after passing t=2.8.This implies that an unsteady flow phenomenon relating to the stallhas arisen at around t=2.0 and it has developed to the rotating stallby around t=2.8. The mass flow decreases with the development ofthe stall cell.
Figure 17 shows bladerow exit flow fields at the time t=3.2 ofpost-stall for the 5th and 6th stages. The axial velocity distributionon the exit plane is compared. As stated above, the hub corner sep-aration has happened in the 5th stator, so the resultant reversed flowis found on the hub side in all passages. Meanwhile, such reversedflow on the hub side is not almost seen in the 5th and 6th rotors. Forthe 6th stator, a reversed flow appears on the hub side in only a partof the passages, and it is larger than that in the 5th stator. This is
JGPP Vol. 9, No. 1
23
(a) 5th Rotor (b) 5th Stator
(c) 6th Rotor (d) 6th Stator
0.0 Cz 0.7
Fig.17 Comparison of axial velocity distribution on rotor/stator exitplanes at t=3.2 (Front 7-stage simulation, Point F)
(a) t = 2.2 (b) t = 2.7
(c) t = 3.2 (d) t = 3.7
0.0 Cz 0.7
Fig.18 Time variation of axial velocity distribution on 6th stator exitplane (Front 7-stage simulation, Point F)
LE
TE
(a) t=2.2 (b) t=2.7
(c) t=3.2Fig.19 Development of rotating stall inception vortex (Front 7-stage simulation, Point F); the internal flow fields corresponding to the regionsurrounded by a dashed border in Figure 18 are presented by the limiting streamlines and vortex cores
what results from the rotating stall; namely the reversed flow corre-sponds to the stalled region. The rotating stall happens first in the6th stator for the present compressor. At this time, the 2nd rotorstall has not occurred yet, as described below.
The origination and development of the stall in the 6th stator isillustrated by Figure 18. The figure shows four snapshots of theaxial velocity distribution at the 6th stator exit. At t=2.2, that isaround the time the mass flow was starting to gradually decrease, asmall low velocity region is found in all passages on the hub side,but its size is different by passage. In the passages around the bluedashed square, the low velocity region is relatively larger comparedto the passages on the opposite side surrounded by the red dashedline. At t=2.7, which corresponds to a time just prior to the abruptdecrease in the mass flow, the larger low velocity region has movedto the direction of the rotor rotation with its size developing. Asshown in Figure 18(c), the larger low velocity region has drasticallydeveloped and it has been distinct, making a group of large lowvelocity passages. At t=3.7, the low velocity region has expandedup to the vicinity of the blade tip. The figure shows that the low
velocity region that is the stall cell is propagating in the rotationaldirection of the rotor, developing in size.
Figure 19 shows the development of the rotating stall inceptionin the 6th stator and the flow structures inside the stall cell. In thefigure, vortical flow structures and limiting streamlines on the bladesuction surface and the hub wall are presented for the passages withthe stall inception cell, which correspond to the regions surroundedby the blue dashed lines in Figure 18. At t=2.2, a large vorticalflow structure is found near the hub suction corner. On the limit-ing streamline, a focal point has appeared near the trailing-edge onthe hub side. The hub corner separation happens in a part of pas-sages at this time. At t=2.7, the hub corner separation has reachedthe leading-edge, with the leading-edge separation occurring. Oncethe leading-edge separation occurs, it rapidly develops into the ro-tating stall cell, causing the leading-edge separation in the neibor-ing blades. Therefore, the mass flow drastically decreases with thegrowth of the stall cell. The figure (c) of t=3.2 shows the flow struc-ture inside the stall cell. A tornado-type separation vortex has beengenerated from the focal point on the blade suction surface in each
JGPP Vol. 9, No. 1
24

-1.0
1.0Hn
Tip Leakage Vortex
Shock Induced Separation
LE TE
LETE
(a) Rotor (b) Stator
Fig.20 Ensemble-averaged flow fields of 2nd stage (Front 7-stagesimulation, Point E)
passage inside the stall cell. The stall cell consists of these tornado-type separation vortex. The stall cell has expanded not only in thepitch-wise direction but in the span-wise direction. In addition, alarge blockage effect due to the stall cell induces the rotating stallin the upstream and downstream bladerows one after another, andfinally one large stall cell rotates, spreading over the compressor(figure not shown).
Finally, the flow field in the 2nd stage at Point E of near-stallpoint is described. Figure 20 shows vortical flow structures andlimiting streamlines in the ensemble-averaged flow field. As shownin the figure, there is no sign of the rotating stall for both rotor andstator; no noticeable flow separation on both tip side and hub sideof the blade suction surfaces. In the front 7-stage simulation, theoperating point of the 2nd stage is almost unchanged up to PointE in contrast to the rear stages. Therefore, the flow field in the 2ndstage remains in a normal state even at Point E, and the stall happensfirst in the 6th stator prior to the 2nd rotor stall in the front 7-stagesimulation.
Although both simulations of the front 2-stage and 7-stage showdifferent stall inception and different final form of the rotating stall,they share a common feature of the stall inception in the sense thatthe stall originates from the hub corner separation. Even in the 2ndrotor of the front stage, the hub corner separation has triggered thestall. The present simulations suggests that the stall can evolve fromthe separation on the hub side, instead of the leading-edge separa-tion at the tip in the spike stall, as in the present compressor. Also,two types of the stall pattern that originates from the hub cornerseparation are presented. The result indicates a risk of monitoringonly the tip-side flow on the casing wall as stall detection.
CONCLUSIONSIn order to clarify unsteady flow fields at near-stall condition in
a multi-stage axial compressor for an actual industrial gas turbine,large-scale full annulus simulations of the compressor have beenconducted using the K computer. In the present study, two kindsof simulations that are front 2-stage simulation and front 7-stagesimulation have been conducted. The results are summarized asfollows.
(1) In the front 2-stage simulation, the hub corner separation oc-curs in the 2nd stator at near-stall. The hub corner separationdevelops with decreasing flow rate, and its blockage effect in-duces the leading-edge separation in the upstream 2nd rotor,eventually leading to the rotating stall. The rotating stall cellpropagates in the rotor, with the hub leading-edge separationexpanding towards the tip, and it occupies about one-third offull annulus.
(2) In the front 7-stage simulation, the hub corner separation ap-pears in the 5th stator already at near-design point because ofthe small partial clearance. This affects the flow on the hub side
in the subsequent 6th stator, and induces the hub corner sepa-ration at the stall point and eventually leads to the leading-edgeseparation on the hub side. The leading-edge separation on thehub side develops into the rotating stall, causing the leading-edge separation in the neiboring blades. Finally, the rotatingstall spreads to the upstream and downstream bladerows due toits large blockage effect.
(3) In contrast to the spike stall, the stall starts from the separationon the hub side instead of the leading-edge separation near thetip in the present compressor.
ACKNOWLEDGMENTThe authors would like to thank Mr. Yoshihiro Hayashi for his
assistance with data analysis. This research used computational re-sources of the K computer provided by the RIKEN Advanced Insti-tute for Computational Science through the HPCI System Researchproject (Project ID:hp140154).
References[1] Day, I. J., 1993, “Stall Inception in Axial Flow Compressors”,
ASME J. Turbomach., Vol. 115, pp. 1-9.
[2] Garnier, V. H., Epstein, A. H., and Greitzer, E. M., 1991, “Ro-tating Waves as a Stall Inception Indication in Axial Compres-sors”, ASME J. Turbomach., Vol. 113, pp. 290-301.
[3] McDougall, N. M., Cumpsty, N. A., and Hynes, T. P., 1990,“Stall Inception in Axial Compressors”, ASME J. Turbomach.,Vol. 112, pp. 116-125.
[4] Hoying, D. A., Tan, C. S., Vo, H. D., and Greitzer, E. M., 1999,“Role of Blade Passage Flow Structures in Axial CompressorRotating Stall Inception”, ASME J. Turbomach., Vol. 121, pp.735-742.
[5] Vo, H. D., Tan, C. S., and Greitzer, E. M., 2008, “Criteria forSpike Initiated Rotating Stall”, ASME J. Turbomach., Vol. 130,pp. 011023.1-9.
[6] Camp, T. R., and Day, I. J., 1998, “A Study of Spike and ModalStall Phenomena in a Low-Speed Axial Compressors”, ASMEJ. Turbomach., Vol. 120, pp. 393-401.
[7] Inoue, M., Kuroumaru, M., Tanino, T., Yoshida, S., and Fu-rukawa, M., 2001, “Comparative Studies on Short and LongLength-Scale Stall Cell Propagating in an Axial CompressorRotor”, ASME J. Turbomach., Vol. 123, pp. 24-32.
[8] Inoue, M., Kuroumaru, M., Yoshida, S., and Furukawa, M.,2002, “Short and Long Length-Scale Disturbances Leading toRotating Stall in an Axial Compressor Stage with DifferentStator-Rotor Gaps”, ASME J. Turbomach., Vol. 124, pp. 376-384.
[9] Young, A., Day, I., and Pullan, G., 2013, “Stall Warning byBlade Pressure Signature Analysis”, ASME J. Turbomach.,Vol. 135, pp. 011033-1-10.
[10] Weichert, S., and Day, I. J., 2013, “Detailed Measurementsof Spike Formation in an Axial Compressor”, ASME J. Turbo-mach., Vol. 136, pp. 051006-9.
[11] Pullan, G., Young, A. M., Day, I. J., Greitzer, E., andSpakovszky, Z., 2015, “Origins and Structure of Spike-TypeRotating Stall”, ASME J. Turbomach., Vol. 137, pp. 051007.
[12] Yamada, K., Kikuta, H., Iwakiri, K., Furukawa, M., and Gun-jishima, S., 2013, “An Explanation for Flow Features of Spike-Type Stall Inception in an Axial Compressor Rotor”, ASME J.Turbomach., Vol. 135, pp. 021023-1-11.
[13] Ikeguchi, T., Matsuoka, A., Sakai, Y., Sakano, Y., andYoshiura, K., 2012, “Design and Development of a 14-StageAxial Compressor for Industrial Gas Turbine”, Proceedings,ASME Turbo Expo 2012, GT2012-68524.
JGPP Vol. 9, No. 1
25

[14] Yamada, K., Furukawa, M., Nakano, T., Inoue, M., and Fu-nazaki, K., 2004, “Unsteady Three-Dimensional Flow Phenom-ena Due to Breakdown of Tip Leakage Vortex in a TransonicAxial Compressor Rotor”, Proceedings, ASME Turbo Expo2004, Paper No. GT2004-53745.
[15] Yamada, K., Funazaki, K., and Furukawa, M., 2007, “The Be-havior of Tip Clearance Flow at Near-Stall Condition in a Tran-sonic Axial Compressor Rotor”, Proceedings, ASME TurboExpo 2004, Paper No. GT2007-27725.
[16] Shima, E., and Jounouchi, T., 1997, “Role of CFD in Aero-nautical Engineering (No.14) -AUSM Type Upwind Schemes-”, Proceedings, the 14th NAL Symposium on Aircraft Compu-tational Aerodynamics, National Aerospace Lab., NAL SP-34,pp. 7-12.
[17] Anderson, W. K., Thomas, J. L., and van Leer, B., 1986,“Comparison of Finite Volume Flux Vector Splittings for theEuler Equations”, AIAA Journal, Vol. 24, pp. 1453-1460.
[18] Shima, E., 1997, “A Simple Implicit Scheme for Struc-tured/Unstructured CFD (in Japanese)”, Proceedings, 29thFluid Dynamic Conference, pp. 325-328.
[19] Wilcox, D. C., 1994, “Simulation of Transition with a Two-Equation Turbulence Model”, AIAA Journal, Vol. 32, pp. 247-255.
[20] Strelets, M., 2001, “Detached Eddy Simulation of MassivelySeparated Flows”, Proceedings, AIAA, Paper 2001-0879.
[21] Bruna, D., and Turner, M. G., 2013, “A Rothalpy Analysisfor the Isothermal Boundary Condition at Casing Applied tothe Rotor 37 Transonic Axial Flow Compressor”, Proceedings,ASME Turbo Expo 2013, GT2013-94595.
JGPP Vol. 9, No. 1
26


![Modular solar energy€¦ · Module efciency [%] ≥ 13.3 ≥ 13.8 ≥ 14.4 ≥ 14.9 ≥ 15.4 ... of light soaking (20 hours at 1000 W/m² and MPP) followed by a cool down to 25 °C](https://img.pdfslide.us/doc/110x75/5fccda39cb6c8e60c606b4dd/modular-solar-module-efciency-a-133-a-138-a-144-a-149-a-154-.jpg)