Embed Size (px)
Citation preview

ISSN: 2249-7196
IJMRR/Nov. 2015/ Volume 5/Issue 11/Article No-2/1045-1065
Varsha Agarwal / International Journal of Management Research & Review
*Corresponding Author www.ijmrr.com 1045
A STUDY ON THE USE OF PERSONALIZED FEATURES IN ONLINE TRAVEL
SHOPPING WEBSITES
Varsha Agarwal*1
1Research Scholar, Christ University, Institute of Management, Bangalore, India.
ABSTRACT
Personalization in online travel shopping is the process of providing the products and services
on websites according to the travelers’ preferences. Personalization plays an important role in
increasing attractiveness of consumers for online shopping of travel related products and
services. This study is conducted to examine how consumers’ perception toward
personalization features of online travel shopping websites influence consumer intentions to
purchase online tickets by identifying the important factors behind consumer intention to
make bookings online. The result of this study shows the effect of personalization factors on
consumers’ perception and purchase intentions for online travel shopping websites and their
implications for marketers in the travel industry. The variables tested in the empirical study
are gender, age, occupation, income and education and personalization features of online
ticket booking websites. In order to find out the perception and purchase intentions of online
shoppers a closed ended structured questionnaire was designed for primary data collection.
Data was analyzed using the following statistical tools namely Descriptive Statistics, Factor
Analysis and Linear Regression Analysis. This study is the first study which examines the
effect of personalization features on the perception of consumers and their purchase intention
with regard to the online travel shopping. Online marketers need to focus on adoption of
attractive personalized features and strategies to attract potential consumers.
Keywords: Online travel shopping, Online shopper, Perception, Purchase Intentions
INTRODUCTION
In e-commerce travel is the leading competitive sector and it is improving with a faster rate.
The increased use of internet is encouraging independent travel, and travelers search
information and deals online. Social media is playing important role in travel industry and it
is focusing not only on short term sales but on increasing customer loyalty also for longer
term and development of brand reputation. Smart phones and tablets are huge success and it
is making mobile applications an important channel of booking travel services. Travelers’
geo-localization also allowing real time sales for products that are location based. The
revolution in travel industry is giving central role to the consumers. And with this companies
are also getting benefits. Because of these developments in the market, travel companies are
thinking about their old models of business and focusing on acquiring the knowledge about
the expectations of customers. They are starting fruitful communications with consumers. In
the advanced economy online transactions are becoming the integral part of sales in travel
Varsha Agarwal / International Journal of Management Research & Review
Copyright © 2012 Published by IJMRR. All rights reserved 1046
industry. And this is continuing to show stronger growth rates in comparison with traditional
channels in the travel sector.
According to Sahney et, al. (2014) for many Indians, booking of tickets via internet for travel
in train was their first introduction with the online shopping. The government portal
irctc.co.in for booking of railway tickets and travel firm Makemytrip.com, which is also
listed in NASDAQ, created revolution in the travel industry. It changed the scenario where
buying train tickets meant waiting in long queues at railway booking counters. Technology
has an important role in online travel industry and providing exponential growth. Earlier this
industry was having high opaqueness. Due to the penetration of internet scenario has been
changed. At global level lot of advanced information with communication technology has
been incorporated in online travel industry. These technologies are used for the development
of travel product, marketing, distribution and employee training in the travel sector. They are
indispensable for knowing and satisfying the changing demands of the consumers. In the
environment of ecommerce, personalization is playing important role in improving the
service levels as well as improving customer loyalty according to Shaw (2003). Many online
marketers are now offering highly personalized products as well as services in a wider range
of categories. This is transforming the practice of retailing into consumer oriented from
retailer oriented. This process of retailing involves customization of products and services for
individual customer needs. Etailers are allowing the consumers in choosing their own
services according to their preferences by adoption of the new technologies in
personalization.
Online travel industry created revolution in India for planning and buying the travel product
and service. Travel websites have introduced the ease and convenience of the operators and
expanding the choices for consumers. Now travelers can simply search on internet for
destinations of their choice. They can evaluate the available options and can take decisions.
These travel portals are emerging as one stop shop for all travel related needs in place of
mere ticket agents. The future of the online travel industry has been marked by consolidation
and new players are crating ventures into this sector. These collaborations will certainly lead
to success of the online travel industry. It has been revealed that when a customer shops
online from companies those offer personalized products and services than companies can get
the information about consumers very easily and at cheaper cost. It helps companies to gather
more information about users. And it helps them in predicting users’ preferences and online
choice pattern. This personalized information can help company to formulate further business
strategies and designing of interface and communication with the potential customers. Numes
et, al. (2001) described the process of personalization as a way of artificial intelligence use. It
helps in the analysis of demographic profile of consumers. Companies can give further
recommendations about the preference patterns of consumers.
REVIEW OF LITERATURE
The review of literature gives a fair idea about the work done in the subject area, the views
and observations made by different researchers and the gaps which need to be filled. The
literature review covers the basic concepts of personalization features in e-tailing, and
perception and intentions starting with a general review of ecommerce and e-tailing.

Varsha Agarwal / International Journal of Management Research & Review
Copyright © 2012 Published by IJMRR. All rights reserved 1047
Studies regarding personalization in ecommerce
Pauline de Pechpeyrou (2009) conducted a study to know the value given by consumers to
the online personalization. The objective of the study was comparing the behaviour and
attitudes of consumers with respect to personalized selling and random selling. It was found
out that personalized items got more clicks than random ones. Additionally, a flavour of
personalization was added up to the positive attitude towards the website.
This study examined the attributes of service available on the websites of women apparel and
difference from attributes available on the websites of men’s apparel with regard to the nine
dimensions of e-service quality. The websites differ in providing online services in a manner
that women’s apparel websites offered more services that better the e-service quality than that
of men’s websites.
Studies regarding consumers’ perception and purchase intentions in an e-commerce
context
Sorce et, al (2005) conducted a study to investigate the buying behaviour of younger as well
as older and effect of their attitude on online shopping. The conclusion of the study made it
clear that older online buyers found lesser products in comparison with younger consumers.
There existed variance in the behaviour of shoppers on the basis of their attitudes.
Thamizhvanan et, al. (2013) conducted a study to determine the purchase intentions of Indian
consumers for online shopping.Along with previous online buying familiarity and online
belief, product positioning, impulse buying alignment and superiority positioning were found
to be significant buying orientation aspects for buyer online buying intention, as per the
detailed literature analysis. The research concluded that prior online purchase experience,
impulse purchase orientation and online trust have noteworthy influence on the customer
purchase intention.
Studies regarding e-commerce in travel industry
Sahney et, al. (2014) conducted a study to know the motivation of buyers towards online
shopping in the context of Indian railway. This study was theoretical and it conceptualizes the
motivation as an example with respect to the online shopping and tested it empirically. The
main aim of the study was to find out the important factors of motivation those are affecting
the decisions of people for online shopping and to make an integrated model.
Leica et, al. (2012) conducted a study for generalization of user behaviour for online travel
shopping websites and developed a model for website acceptance. The study focused on
analysis of tourist behaviour for travel websites. It clarified the users’ intentions for these
websites use on the basis of their determinants. As a result of concentration on blog the
relationship between reasoning as well as behavioural variables was found out and it was
concluded that it can differ according to particular website. A study was done by Law et, al.
(2008) to find the difference between perceptions of browsers who had browsed a websites
and buyers who had completed online shopping. Empirical results suggested that quality
factors were considered significant by website users and they were usually contented with
travel websites. Purchase intention in the users of these websites had a positive view.
Research conclusions suggested that customer satisfaction was positively related with travel

Varsha Agarwal / International Journal of Management Research & Review
Copyright © 2012 Published by IJMRR. All rights reserved 1048
website quality, and that it was related to purchase intention. Woodside et, al. (2011)
conducted a study to find dominance of the tourism destination and the usefulness of the
marketing websites. The dominance of the tourism destination could be defined as number of
tourists visiting each year to residential population of the destination. A multi item metric
was created for the checking of the usefulness of the website of destination marketing. 40
destination marketing websites were judged based upon the tools, as a part of the study. The
conclusions of the study also indicated a noteworthy relationship between marketing website
usefulness and tourism destination dominance.
PURPOSE OF THE STUDY
This study is conducted to examine how consumers’ perception toward personalization
features of online travel shopping websites influence consumer intentions to purchase online
tickets by identifying the important factors behind consumer intention to make bookings
online. Thus, the focus of the study is measuring consumer perception and matching to
intentions to purchase online using personalization features by determining whether
consumer perceptions of personalized services in an online travel shopping website is a key
determinant predicting consumers’ intentions to purchase.
RESEARCH OBJECTIVES
Objectives of the study are as follows:
1) To identify the personalization features of selected online shopping websites;
2) To find the demographic profiles of online shopping consumers;
3) To analyze the perceptions of consumers towards online shopping websites;
4) To analyze the impact of factors of personalization features of the online travel shopping
websites on the purchase intentions of consumers;
RESEARCH HYPOTHESES
This research proposes the following hypothesis to be tested empirically based on the
literature review.
H11:There exist significant differences in the perception of consumers of different
demographics towards personalized features of selected online travel shopping websites.
H12:Personalization factors have a significant impact on consumers purchase intentions
towards online travel shopping websites.
RESEARCH METHODOLOGY
In order to find out the perception and purchase intentions of online shoppers a closed ended
structured questionnaire was designed for primary data collection with sample size of 650.
The location chosen for survey was Bangalore. Statistical tools such as descriptive analysis,
factor analysis and regression analysis were used to analyze the data and meeting the
objectives. This section provides a description of the methods, tools and techniques used to
conduct the research.
Data Collection: Data has been collected from primary sources for the purpose of this study,
from respondents who book tickets online. The data was obtained by using the survey method

Varsha Agarwal / International Journal of Management Research & Review
Copyright © 2012 Published by IJMRR. All rights reserved 1049
through the administration of structured questionnaires to the respondents. Non probabilistic
convenience sampling was used for the primary data collection.
Statistical technique: Data was analyzed using the following statistical tools namely
Descriptive Statistics, Factor Analysis and Linear Regression Analysis. Descriptive statistics
was used to capture the demography of consumers. Cross tabulation was used to compare and
analyze the perceptions of consumers towards personalization features of selected online
shopping websites. Factor analysis was performed to identify important personalization factor
of online travel shopping websites. Regression Analysis was used to analyze the impact of
personalization factors of the online shopping websites on the purchase intentions of
consumers.
ANALYSIS AND INTERPRETATION
Demographics of the Respondents
This section provides an understanding about the demographic characteristics of the sample.
Table 1 gives information about gender, marital status, education, income, occupation and
age. Results in table 1 shows that majority 56.3 respondents are male who use online
shopping for booking travel related services. 58.3 percent of the respondents are married and
41.7 percent of them are single. 26.6 percent has cleared their HSC, 29.6 percent are
undergraduates and rest is 23.6 percent post graduates and 20.1 above post graduates.
Majority of respondents 45.7 percent have family income of Rs 30,000 to 50,000 per month
followed by 38.2 percent, who earn above 50,000. Majority 32.7 percent of respondents are
salaried people followed by 26.6 percent students. 16.1 percent of respondents are
housewives who shop online. It can be inferred from the table that the majority of the
respondents fall under the age group of 21-30 with 37.7 percent. After that 26.1 percent of
respondents belong to 31-40 age groups.
Table 1: Demographic Characteristics of respondents
Frequency Percent
Male 336 56.3
Female 261 43.7
Total 597 100.0
Frequency Percent
Single 249 41.7
Married 348 58.3
Total 597 100.0
Frequency Percent
HSC 159 26.6
UG 177 29.6
PG 141 23.6
Above PG 120 20.1
Total 597 100.0
Frequency Percent
Below 30,000 96 16.1
30,000-50,000 273 45.7
Above 50,000 228 38.2
Total 597 100.0
Frequency Percent
Student 159 26.6
Salaried People 195 32.7
Self Employed 147 24.6
House Wife 96 16.1
Total 597 100.0
Frequency Percent
Less than 20 135 22.6
20-30 225 37.7
30-40 156 26.1
Above 40 81 13.6
Total 597 100.0
Occupation
Age
Education
Income
Gender
Marital Status

Varsha Agarwal / International Journal of Management Research & Review
Copyright © 2012 Published by IJMRR. All rights reserved 1050
Use of internet and online shopping websites usage
To get an understanding of perception of consumers towards online shopping websites, the
responses from online shoppers were analyzed with the help of descriptive statistics. The
analyzed data has been presented in a graphical form followed by an interpretation. The
demography of consumers for online shopping websites can be understood by analyzing the
comfort level of respondents with internet, no. of times they purchased products online in last
one year, no. of shopping websites used in last one year and most frequently used online
shopping travel websites.
Comfort level with internet use
This table 2 represents respondents comfort level with the internet use.
Table 2: Comfort level with internet use
Frequency Percent
Very Uncomfortable 18 3.0
Somewhat uncomfortable 25 4.2
Neutral 29 4.9
Somewhat Comfortable 284 47.6
Very Comfortable 241 40.4
Total 597 100.0
It can be understood from table 2that majority of the respondents 47.6 feel somewhat
comfortable with the use of internet, followed by 40.4 percent who feel very comfortable in
using internet.
No. of times products purchased online in last 1 year
Table 3 represents no. of times products purchase online in last one year by respondents.
Table 3: No. of times products purchased online in last 1 year
Frequency Percent
0-5 72 12.1
6-10 268 44.9
More than 10 257 43.0
Total 597 100.0
From Table 3 it can be understood that majority of the respondents 44.9 percent shop online
frequently and bought 6 to 10 products online in past one year followed by 43 percent
respondents who shop above 10 products over internet in last one year. It shows the
consumers perception towards online shopping.
No. of online shopping websites used in last 1 year
This table 4 represents no. of online shopping websites used in last 1 year by respondents.
Table 4: No. of online shopping websites used in last 1 year
Frequency Percent
Less than 3 71 11.9
3-5 275 46.1
More than 5 251 42.0
Total 597 100.0
From Table 4 it can be understood that majority of the respondents 46.1 percent has used 3 to
5 online shopping websites for online shopping of products and services, followed but 42
percent who used more than 5 websites in last one year for shopping over internet. It clearly
shows the perception of consumers towards online retailers.

Varsha Agarwal / International Journal of Management Research & Review
Copyright © 2012 Published by IJMRR. All rights reserved 1051
Most frequently used online shopping website for travel bookings
This table 5 represents most frequently used travel websites for travel booking by
respondents.
Table 5: Most frequently used online shopping website for travel bookings
Frequency Percent
Yatra.com 102 17.1
Makemytrip.com 249 41.7
Irctc.co.in 246 41.2
Total 597 100.0
From table 5 it can be understood that majority of the respondents 41.7 percent use
Makemytrip.com website for booking their travel related services online. Similarly 41.2
percent of respondents use Irctc.co.in website for their ticket booking needs. Only 17.1
percent respondents use Yatra.com website for their travel related needs. This shows the
perception of consumers towards each online travel shopping website.
Personalization Factors behind Consumers’ Purchase Intentions
Factor analysis was performed to reduce the 18 independent variables into 7 important
personalization factors. To know the important personalization factors that influence
purchase intentions of consumers for online travel shopping websites factor analysis was
performed. The variables were formed as questions on a five point scale and respondents
were asked to answer them. These eighteen statements are the independent variables which
then get reduced to seven factors. Factor analysis was used to reduce dimensions of the
eighteen independent variables into seven factors using Principal Component Analysis.
Table 6: KMO and Barlett’s Test
.579
Approx. Chi-Square 4703.624
df 153
Sig. 0.000
Kaiser-Meyer-Olkin Measure of Sampling Adequacy.
Bartlett's Test of Sphericity
Significant value 0.000 indicates that this is not an identity matrix. Hence factor analysis can
be performed. Based on the above output, the KMO = 0.579. This shows that this model is
adequate for performing factor analysis.
Table 7: Total Variance Explained
Total % of
Variance
Cumulati
ve %
Total % of
Variance
Cumulati
ve %
Total % of
Variance
Cumulati
ve %
1 4.032 22.400 22.400 4.032 22.400 22.400 3.119 17.330 17.330
2 2.623 14.573 36.973 2.623 14.573 36.973 2.385 13.250 30.580
3 1.805 10.030 47.003 1.805 10.030 47.003 1.867 10.373 40.953
4 1.510 8.388 55.391 1.510 8.388 55.391 1.831 10.172 51.126
5 1.299 7.216 62.607 1.299 7.216 62.607 1.652 9.178 60.303
6 1.241 6.896 69.503 1.241 6.896 69.503 1.421 7.894 68.197
7 1.092 6.068 75.571 1.092 6.068 75.571 1.327 7.375 75.571
8 .779 4.330 79.901
9 .705 3.915 83.815
10 .617 3.429 87.245
11 .471 2.617 89.861
12 .420 2.332 92.194
13 .363 2.018 94.212
14 .345 1.915 96.127
15 .222 1.234 97.361
16 .202 1.123 98.483
17 .165 .915 99.399
18 .108 .601 100.000
Rotation Sums of Squared Component Initial Eigenvalues Extraction Sums of Squared

Varsha Agarwal / International Journal of Management Research & Review
Copyright © 2012 Published by IJMRR. All rights reserved 1052
Table 8: Rotated Component Matrix
1 2 3 4 5 6 7
I prefer price filter option availability on websites. 0.85
Online shopping websites helps in comparing products of different
brands to a large extent.
0.82
I compare features of services when I shop online. 0.81
1This website offers me ability of personalizing a service by my
preference set.
0.70
Ratings provided by different consumers help me in choosing a
service.
0.88
Online marketers maintain robust content management and update it
on regular basis.
0.82
I can check status of my bookings online easily. 0.77
Travel websites is the one stop to shop all travel related services
like hotels, taxy , flights etc.
0.83
When I login to the websites, they offer me other supported
services also like hotels
0.75
Shopping selection aids such as recommendations, FAQs, or
expert's comments plays important role in purchase decisions.
-0.57
Online shopping of travel services provides competitive price deals. 0.90
Some e-tailors offer occasional and seasonal deals for travel related
services.
0.84
Online shopping also provides good return policy and guaranteed
cash back if I cancel my bookings or do not want to use the
services.
0.72
I like options to save my personal information. 0.63
This website offers good customer services such as a phone
number, e-mail, or chatting.
0.82
Etailers offer good and responsive enquiry services. 0.73
1 like options to save my financial information such as credit card
number.
0.80
Online travel retailers offer more reward programs such as bonus
points or miles.
0.54 -0.60
Component
The Rotated Component Matrix indicates, based on factor loadings that these eighteen
components were reduced into seven factors. Details of the factors are given in below table
9.

Varsha Agarwal / International Journal of Management Research & Review
Copyright © 2012 Published by IJMRR. All rights reserved 1053
Table 9: List of Factors
S.N. Factor Name Variable Factor Reliability
I prefer price filter option availability on websites. 0.85
Online shopping websites helps in comparing products of
different brands to a large extent.
0.82
I compare features of services when I shop online. 0.81
1This website offers me ability of personalizing a service by
my preference set.
0.70
Ratings provided by different consumers help me in
choosing a service.
0.88
Online marketers maintain robust content management and
update it on regular basis.
0.82
I can check status of my bookings online easily. 0.77Travel websites is the one stop to shop all travel related
services like hotels, taxy , flights etc.
0.83
When I login to the websites, they offer me other
supported services also like hotels
0.75
Shopping selection aids such as recommendations, FAQs,
or expert's comments plays important role in purchase
decisions.
-0.57
4 Competitive
Deals
Online shopping of travel services provides competitive
price deals.
0.90
3Some e-tailors offer occasional and seasonal deals for
travel related services.
0.84
5 Guaranteed
Cash Back
Online shopping also provides good return policy and
guaranteed cash back if I cancel my bookings or do not
want to use the services.
0.72
I like options to save my personal information. 0.63
6 Customer
Responsivenes
This website offers good customer services such as a
phone number, e-mail, or chatting.
0.82
Etailers offer good and responsive enquiry services. 0.73
7 Loyalty
Programmes
1 like options to save my financial information such as
credit card number.
0.80
Online travel retailers offer more reward programs such as
bonus points or miles.
-0.60
3 One stop shop
0.84
0.80
0.38
0.51
0.30
0.81
0.24
1 Product
Comparison
Convenience
2 Website
Content
1. Product Comparison Convenience
This is the most important factor and captures 22.4 percent information in total. Consumers
prefer to compare the products always before making purchase. So availability of option of
comparing products online causes a great level of convenience for consumers and hence this
factor is very important to discuss. When consumers busy and have lesser time for shopping,
in that time availability of comparison of products sitting at home is proving very
comfortable, useful and helpful to them. It saves both time and energy. These days are large
number of websites which offer products from different brands in one online store. Hence
consumers are getting attracted towards such features of online shopping websites. Hence
marketers should focus in this dimension to attract large number of consumers.
2. Website Content
This factor alone contributes to 14.573 percent in total information. Content of website and
its timely management is very important and necessary to stay competitive. These days online

Varsha Agarwal / International Journal of Management Research & Review
Copyright © 2012 Published by IJMRR. All rights reserved 1054
e-tailers are focusing on regular content management of websites to provide updated and
timely information to consumers. It increases the reliability of online seller and buyer gets
desired information about the product and service.
3. One Stop Shop
This factor captures 10.03 percent in the total information. These days travel websites are
offering travel products along with other supported services like hotel booking, taxi and many
more. Hence they are evolving as one stop shop for all consumer needs. Marketers can make
their strategies for future enhancement in the websites.
4. Competitive Deals
Factor competitive deals captures 8.388 percent of information in total. Travel websites offer
attractive and competitive deals for consumers for special occasions and seasons. Hence
consumers go for booking their tickets online in comparison with traditional medium of ticket
booking.
5. Guaranteed Cash Back
This factor contributes to 7.216 percent in the total information. Online travel websites
provide guaranteed cash back if the booking is cancelled by consumer or by Travel
Company. Hence it produces trust among the shoppers and they go for booking their tickets
online. It is an easy process of cancellation and getting the cash back.
6. Customer Responsiveness
Customer responsiveness factor contributes to 6.896 percent information in total. Online
travel websites provide responsive enquiry services and act to customer feedbacks. Hence it
makes easier for customers to solve their queries and gives them satisfaction.
7. Loyalty Programmes
Loyalty programmes has captured 6.068 percent information in total. Online travel shopping
websites various kind of loyalty programmes to consumers such as bonus points, extra miles,
coupons and many more. Hence they try to retain their customers and offer them attractive
deals to increase their loyalty. On the basis of reliability only four factors were taken for
further analysis out of 7 factors. One stop shop, guaranteed cash back and loyalty
programmes were showing less reliability. Hence these factors were not included in further
analysis.
Consumers’ Perception towards personalization factors of online shopping travel
websites
Consumers’ perception plays very important role behind their purchase intentions towards
online travel shopping. Hence perception of consumers has been measured here with
performing ANOVA between demographic variables and personalization factors of online
shopping websites. It shows whether there is any significance difference exists or not in the
perception of consumers for personalization factors of online travel shopping websites with
regard to their demographic profile and most used travel shopping website.

Varsha Agarwal / International Journal of Management Research & Review
Copyright © 2012 Published by IJMRR. All rights reserved 1055
Analysis of Variance between Gender and Personalization Factors
Gender wise association of Personalization factors is tested to find whether there is any
significant difference between different levels educated online shoppers in association with
Personalization factors. The test is conducted at the 5 percent significance level.
Table 10: ANOVA for difference is Personalization Factors across the Gender of the
shoppers.
Sum of
Squares
df Mean
Square
F Sig.
Between Groups 0.08 1.00 0.08 0.17 0.68
Within Groups 289.80 595.00 0.49
Total 289.88 596.00
Between Groups 0.35 1.00 0.35 1.21 0.27
Within Groups 171.56 595.00 0.29
Total 171.91 596.00
Between Groups 0.36 1.00 0.36 0.35 0.55
Within Groups 605.80 595.00 1.02
Total 606.16 596.00
Between Groups 0.56 1.00 0.56 1.14 0.29
Within Groups 293.69 595.00 0.49
Total 294.26 596.00
Product Comparison
Convinience
Website Content
Competitive Deals
Customer
Responsiveness
The above shown ANOVA table10 is the test result of whether there is any significant
difference between the two genders in perceiving personalization factors. Form the ANOVA
table it is clear that the P value is greater than 0.05 that there is no significant difference
between the perception of male and female shoppers towards the personalization factors. The
test is conducted at 5% significance level. Hence male and female shoppers have similar
perception towards online travel shopping websites.
Analysis of Variance between Marital status and Personalization Factors
Marital Status wise association of Personalization factors is tested to find whether there is any
significant difference between different levels educated online shoppers in association with
Personalization factors. The test is conducted at the 5 percent significance level.
Table 11: ANOVA for difference in Personalization Factors across the Marital Status of
the shoppers
Sum of
Squares
df Mean
Square
F Sig.
Between Groups 0.23 1.00 0.23 0.48 0.49
Within Groups 289.65 595.00 0.49
Total 289.88 596.00
Between Groups 0.12 1.00 0.12 0.41 0.52
Within Groups 171.80 595.00 0.29
Total 171.91 596.00
Between Groups 0.94 1.00 0.94 0.93 0.34
Within Groups 605.22 595.00 1.02
Total 606.16 596.00
Between Groups 2.08 1.00 2.08 4.24 0.04
Within Groups 292.17 595.00 0.49
Total 294.26 596.00
Product
Comparison
Convinience
Website Content
Competitive Deals
Customer
Responsiveness
The above shown ANOVA table11 is the test result of whether there is any significant
difference (0.05) between the two marital statuses in interpreting personalization factors.
Form the ANOVA table11 it is clear that there is no significant difference between the

Varsha Agarwal / International Journal of Management Research & Review
Copyright © 2012 Published by IJMRR. All rights reserved 1056
perceptions single and married shoppers towards 4 personalization factors. Hence married
and single status online shoppers have similar perception towards online travel shopping
websites.
Analysis of Variance between Education and Personalization Factors
Education wise association of Personalization factors is tested to find whether there is any
significant difference between different levels educated online shoppers in association with
Personalization factors. The test is conducted at the 5 percent significance level.
Table 12: ANOVA for difference in Personalization Factors across the Education level
of the shoppers
Sum of
Squares
df Mean
Square
F Sig.
Between Groups 7.34 3.00 2.45 5.14 0.00
Within Groups 282.54 593.00 0.48
Total 289.88 596.00
Between Groups 0.22 3.00 0.07 0.25 0.86
Within Groups 171.70 593.00 0.29
Total 171.91 596.00
Between Groups 9.19 3.00 3.06 3.04 0.03
Within Groups 596.96 593.00 1.01
Total 606.16 596.00
Between Groups 2.34 3.00 0.78 1.58 0.19
Within Groups 291.92 593.00 0.49
Total 294.26 596.00
Product
Comparison
Convenience
Website Content
Competitive
Deals
Customer
Responsiveness
ANOVA table 12 shows that there is a significant difference in product comparison
convenience factor with the different education level groups. So it can be concluded that
there is significant difference in the perception of different education groups with regard to
product comparison convenience.
Post Hoc Test
The post hoc test helps to explore all the possible pair wise comparison of means and show
the significant variables in the group wise. It will test the least significant difference of the
variables under the factor. In the product comparison convenience factor the first group HSC
has significance difference only in group PG. the group UG shows significance in only PG
group. The third group shows significance in all the other three groups.
Table 13: Multiple comparisons for education groups and Product comparison
convenience
UG -0.07 0.08 0.35
PG -.27910* 0.08 0.00
Above PG 0.00 0.08 0.99
HSC 0.07 0.08 0.35
PG -.20907* 0.08 0.01
Above PG 0.07 0.08 0.40
HSC .27910* 0.08 0.00
UG .20907* 0.08 0.01
Above PG .27793* 0.09 0.00
HSC 0.00 0.08 0.99
UG -0.07 0.08 0.40
PG -.27793* 0.09 0.00
Product
Comparison
Convenience
HSC
UG
PG
Above PG
Dependent
Variable
(I) Education (J) Education Mean
Difference (I-J)
Std. Error Sig.
Varsha Agarwal / International Journal of Management Research & Review
Copyright © 2012 Published by IJMRR. All rights reserved 1057
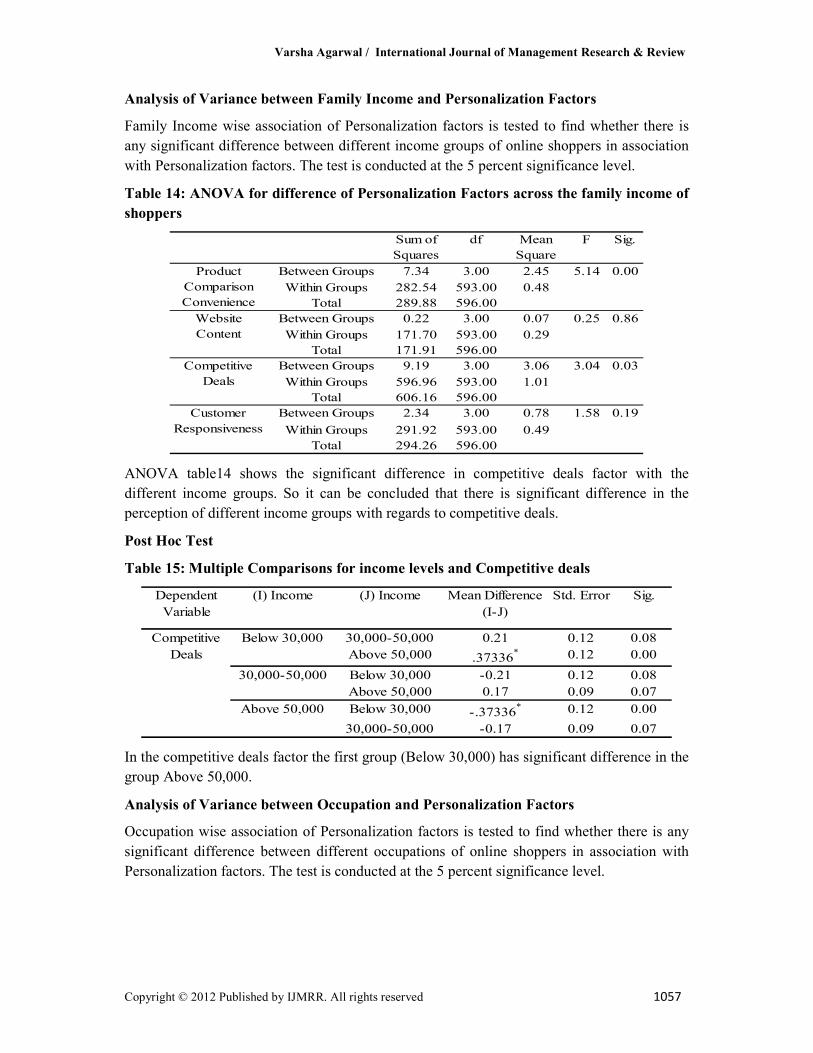
Analysis of Variance between Family Income and Personalization Factors
Family Income wise association of Personalization factors is tested to find whether there is
any significant difference between different income groups of online shoppers in association
with Personalization factors. The test is conducted at the 5 percent significance level.
Table 14: ANOVA for difference of Personalization Factors across the family income of
shoppers
Sum of
Squares
df Mean
Square
F Sig.
Between Groups 7.34 3.00 2.45 5.14 0.00
Within Groups 282.54 593.00 0.48
Total 289.88 596.00
Between Groups 0.22 3.00 0.07 0.25 0.86
Within Groups 171.70 593.00 0.29
Total 171.91 596.00
Between Groups 9.19 3.00 3.06 3.04 0.03
Within Groups 596.96 593.00 1.01
Total 606.16 596.00
Between Groups 2.34 3.00 0.78 1.58 0.19
Within Groups 291.92 593.00 0.49
Total 294.26 596.00
Product
Comparison
Convenience
Website
Content
Competitive
Deals
Customer
Responsiveness
ANOVA table14 shows the significant difference in competitive deals factor with the
different income groups. So it can be concluded that there is significant difference in the
perception of different income groups with regards to competitive deals.
Post Hoc Test
Table 15: Multiple Comparisons for income levels and Competitive deals
30,000-50,000 0.21 0.12 0.08
Above 50,000 .37336* 0.12 0.00
Below 30,000 -0.21 0.12 0.08
Above 50,000 0.17 0.09 0.07
Below 30,000 -.37336* 0.12 0.00
30,000-50,000 -0.17 0.09 0.07
Dependent
Variable
(I) Income (J) Income
Competitive
Deals
Below 30,000
30,000-50,000
Above 50,000
Mean Difference
(I-J)
Std. Error Sig.
In the competitive deals factor the first group (Below 30,000) has significant difference in the
group Above 50,000.
Analysis of Variance between Occupation and Personalization Factors
Occupation wise association of Personalization factors is tested to find whether there is any
significant difference between different occupations of online shoppers in association with
Personalization factors. The test is conducted at the 5 percent significance level.

Varsha Agarwal / International Journal of Management Research & Review
Copyright © 2012 Published by IJMRR. All rights reserved 1058
Table 16: ANOVA for difference of personalization factors across the Occupation of
shoppers
Sum of
Squares
df Mean
Square
F Sig.
Between Groups 7.95 3.00 2.65 5.57 0.00
Within Groups 281.93 593.00 0.48
Total 289.88 596.00
Between Groups 1.40 3.00 0.47 1.62 0.18
Within Groups 170.51 593.00 0.29
Total 171.91 596.00
Between Groups 8.90 3.00 2.97 2.95 0.03
Within Groups 597.26 593.00 1.01
Total 606.16 596.00
Between Groups 2.32 3.00 0.77 1.57 0.20
Within Groups 291.94 593.00 0.49
Total 294.26 596.00
Product
Comparison
Convenience
Website Content
Competitive
Deals
Customer
Responsiveness
ANOVA table 16 shows the significant difference in product comparison convenience factor
with the different occupation groups. So it can be concluded that there is significant
difference in the perception of different occupation groups with regards to product
comparison convenience.
Post Hoc Test
Table 17: Multiple comparisons for Occupations and Product comparison convenience
Salaried People -0.06 0.07 0.43
Self Employed -0.05 0.08 0.52
House Wife -.34493* 0.09 0.00
Student 0.06 0.07 0.43
Self Employed 0.01 0.08 0.93
House Wife -.28702* 0.09 0.00
Student 0.05 0.08 0.52
Salaried People -0.01 0.08 0.93
House Wife -.29401* 0.09 0.00
Student .34493* 0.09 0.00
Salaried People .28702* 0.09 0.00
Self Employed .29401* 0.09 0.00
Product
Comparison
Convenience
Student
Salaried
People
Self Employed
House Wife
Dependent
Variable
(I) Occupation (J) Occupation Mean Difference
(I-J)
Std. Error Sig.
In the product comparison convenience factor group house wife has significant difference
between all three occupation groups student, salaried people and self-employed.
Analysis of Variance between age and Personalization Factors
Age wise association of Personalization factors is tested to find whether there is any
significant difference between different age groups of online shoppers in association with
Personalization factors. The test is conducted at the 5 percent of significance level.

Varsha Agarwal / International Journal of Management Research & Review
Copyright © 2012 Published by IJMRR. All rights reserved 1059
Table 18: ANOVA for difference of personalization factors across the Age of shoppers
Sum of Squares df Mean Square F Sig.
Between Groups 7.57 3.00 2.52 5.30 0.00
Within Groups 282.31 593.00 0.48
Total 289.88 596.00
Between Groups 1.01 3.00 0.34 1.17 0.32
Within Groups 170.91 593.00 0.29
Total 171.91 596.00
Between Groups 6.16 3.00 2.05 2.03 0.11
Within Groups 599.99 593.00 1.01
Total 606.16 596.00
Between Groups 5.08 3.00 1.69 3.47 0.02
Within Groups 289.18 593.00 0.49
Total 294.26 596.00
Product
Comparison
Convenience
Website
Content
Competitive
Deals
Customer
Responsiveness
ANOAV table18 shows the significant differences in product comparison convenience factor
with the different age groups. So it can be concluded that there is significant difference in the
perception of different age groups with regards to product comparison convenience.
Post Hoc Test
Table 19: Multiple Comparisons for age and product comparison convenience
20-30 -.29444* 0.08 0.00
30-40 -0.14 0.08 0.08
Above 40 -.20370* 0.10 0.04
Less than 20 .29444* 0.08 0.00
30-40 .15128* 0.07 0.04
Above 40 0.09 0.09 0.31
Less than 20 0.14 0.08 0.08
20-30 -.15128* 0.07 0.04
Above 40 -0.06 0.09 0.52
Less than 20 .20370* 0.10 0.04
20-30 -0.09 0.09 0.31
30-40 0.06 0.09 0.52
Product
Comparison
Convenience
Less than 20
20-30
30-40
Above 40
Dependent
Variable
(I) Age (J) Age Mean Difference
(I-J)
Std. Error Sig.
In the product comparison convenience factor group less than 20 shows significant difference
only in the group 20-30.
Analysis of Variance between most used travel websites and personalization factors
Website used wise association of Personalization factors is tested to find whether there is any
significant difference between particular travel websites online shoppers in association with
Personalization factors. The test is conducted at the 5 percent significance level.

Varsha Agarwal / International Journal of Management Research & Review
Copyright © 2012 Published by IJMRR. All rights reserved 1060
Table 20: ANOVA for difference of Personalization factors across the most used travel
websites by shoppers
Sum of Squares df Mean Square F Sig.
Between Groups 0.93 2.00 0.47 0.96 0.38
Within Groups 288.95 594.00 0.49
Total 289.88 596.00
Between Groups 0.13 2.00 0.07 0.22 0.80
Within Groups 171.78 594.00 0.29
Total 171.91 596.00
Between Groups 1.30 2.00 0.65 0.64 0.53
Within Groups 604.86 594.00 1.02
Total 606.16 596.00
Between Groups 8.30 2.00 4.15 8.62 0.00
Within Groups 285.95 594.00 0.48
Total 294.26 596.00
Product
Comparison
Convenience
Website Content
Competitive
Deals
Customer
Responsiveness
ANOVA table20 shows the significant difference in Customer Responsiveness with the
different website groups. So it can be concluded that there is significant difference in the
perception of different website groups with regard to Customer Responsiveness.
Post Hoc Test
Table 21 Multiple Comparisons for most used travel websites and customer
responsiveness
Makemytrip.com .26347* 0.08 0.00
Irctc.co.in .33752* 0.08 0.00
Yatra.com -.26347* 0.08 0.00
Irctc.co.in 0.07 0.06 0.24
Yatra.com -.33752* 0.08 0.00
Makemytrip.com -0.07 0.06 0.24
Customer
Responsiveness
Yatra.com
Makemytrip.com
Irctc.co.in
Dependent
Variable
(I) Most used
Travel Websites
(J) Most used
Travel Websites
Mean Difference
(I-J)
Std. Error Sig.
In the customer responsiveness factor website group Yatra.com has significance difference
between the website group Makemytrip.com and itctc.com.
Personalization Factors and impact on Consumers’ purchase intentions
Correlation and Regression analysis is performed to analyze the impact of personalization
factors of selected online travel shopping websites on consumers’ purchase intentions. Here
relationship between purchase intentions and personalization factors is also found out.
Regression analysis performed to know the level of impact on consumers’ purchase
intentions due to personalization factors.
Relationship between Consumers’ purchase intentions and Personalization Factors
Correlation analysis is conducted to find out the relationship between the dependent variable
purchase intentions and all the four personalization factors. This analysis will interpret the
relevance of study by analyzing the relation between variable. Correlation is conducted
among all the independent variables (personalization factors) to know the inter correlation.

Varsha Agarwal / International Journal of Management Research & Review
Copyright © 2012 Published by IJMRR. All rights reserved 1061
Table 22: Correlation Analysis
Purchase
Intentions
Product
Comparison
Convinience
Website
Content
Competitive
Deals
Customer
Responsiveness
Pearson
Correlation
1
Sig. (2-tailed)
N 597
Pearson
Correlation.571
** 1
Sig. (2-tailed) .000
N 597 597
Pearson
Correlation-.445
**-.227
** 1
Sig. (2-tailed) .000 .000
N 597 597 597
Pearson
Correlation.333
**.380
** -.075 1
Sig. (2-tailed) .000 .000 .067
N 597 597 597 597
Pearson
Correlation.425
**.115
**-.323
** .010 1
Sig. (2-tailed) .000 .005 .000 .811
N 597 597 597 597 597
Website Content
Competitive Deals
Customer
Responsiveness
Purchase
Intentions
Product
Comparison
Convinience
The correlation table22 indicates that correlation analysis is significant at 5 percent
significance level. There is a positive correlation between the dependent variable purchase
intentions and three independent personalization factors. The only personalization factor
website content has negative correlation with the dependent variable. It is found that purchase
intentions are positively correlated to product comparison convenience (r=0.571),
competitive deals (r=0.333), customer responsiveness (r=0.425) and. Product comparison
convenience shows the high level of correlation with r=0.571. The correlation table 22 also
shows that there is an inter correlation among the independent variables and most them are
positively correlated to each other. It is found that product comparison is positively correlated
with competitive deals (r=0.380), customer responsiveness (r=0.115). Website content has
negative correlation with three independent variables.
Impact of Personalization Factors on Consumers’ purchase intentions
Regression analysis is conducted to find out the impact of personalization factors on
consumer purchase intentions. In the regression analysis consumer purchase intention is the
dependent variable and independent variables are product comparison convenience, website
content, competitive deals, and customer responsiveness. The four personalization factors
which are considered as independent variables are used to test if personalization factors
significantly influenced consumers’ purchase intentions.
Table 23: Analysis of Variance for “Purchase Intentions” of Consumers
Sum of
Squares
df Mean
Square
F Sig.
Regression 519.50 4.00 129.87 164.15 .000b
Residual 468.39 592.00 0.79
Total 987.89 596.00
Model
1

Varsha Agarwal / International Journal of Management Research & Review
Copyright © 2012 Published by IJMRR. All rights reserved 1062
In the ANOVA table 23 P=.000 indicates that overall the model applied is significantly good
enough to predict consumer purchase intention. It indicates that the study is relevant and it
has got a significant importance.
Table 24: Model Summary for “Purchase Intentions” of Consumers
R R Square Adjusted
R Square
Std. Error of
the Estimate
1 .725a 0.53 0.52 0.89
Model
The model summary table 24 of the regression indicates that the 4 predictors of consumer
purchase intention (the independent variable product comparison convenience, website
content, competitive deals, customer responsiveness) represent 53 percent of the variance. It
means that 53 percent of the purchase intention of the consumers is affected by
personalization factors, while the rest may be due to other variables.
Table 25: Coefficients of Regression for “Purchase Intentions” of Consumers
Standardized
Coefficients
B Std. Error Beta
(Constant) 0.23 0.50 0.46 0.64
Product
Comparison
Convenience
0.78 0.06 0.42 13.53 0.00
Website
Content
-0.58 0.07 -0.24 -7.90 0.00
Competitive
Deals
0.19 0.04 0.15 4.93 0.00
Customer
Responsiveness
0.54 0.05 0.30 9.89 0.00
Model Unstandardized
Coefficients
t Sig.
1
From the coefficient table25 it is clear that there is significant relations (at 5 percent
significance level) of consumer purchase intentions with all personalization factors
(independent variables). Hence it is concluded that all the four personalization factors product
comparison convenience, website content, competitive deals, and customer responsiveness
influenced consumers’ purchase intentions. All the personalization factors significantly
impacts consumers’ purchase intentions.
The regression equation:
y = a + b1 x1+ b2 x2 + b3 x3 ………………+ bn xn + standard error
‘y’ = dependent variable (consumer purchase intentions)
x1 = Product Comparison Convenience
x2 = Website Content
x3 = Competitive Deals
x4 = Customer Responsiveness
a = 0.23 (constant)
b1 = .78
b2= -.58

Varsha Agarwal / International Journal of Management Research & Review
Copyright © 2012 Published by IJMRR. All rights reserved 1063
b3= .19
b4= .54
In the above table25 product comparison convenience has got the high coefficient value of
.78, so product comparison convenience has got more impact on consumer purchase
intentions.
The regression equation is given by:
IMPLICATIONS OF RESEARCH
The finding of this study proves that personalization is a part of online shopping and it cannot
be separated. It has more positive effect on consumers in comparison with products and
services alone. This study is the first study which examines the effect of personalization
features on the perception of consumers and their purchase intention with regard to the online
travel shopping. This study also indicates that proper implementation of personalization
features can bring more positive and powerful results and can increase the consumers’
purchase intentions. Web portals have to include the new and preferred personalization
features in their websites to become competitive in travel industry. This will be helpful in
increasing the competitiveness. The results of this study have some important implications.
The findings of this study suggest that use of personalization features in the online travel
websites can definitely encourage the positive perception of consumers and can make higher
the intentions of consumers. Implementation of personalization features in the online travel
shopping websites and personalization factors will influence the purchase intentions of
consumers. It can be implicated from this study that online travel companies and their users
are focusing on the adoption of the personalization features and their implementation in the
online travel shopping websites. Both government and public sector service providers are
incorporating the innovative personalization features in online travel industry for attracting
potential consumers.
SUGGESTIONS AND RECOMMENDATIONS
This study is conducted to investigate the perception of consumers and their purchase
intentions with respect to personalization features in the travel websites. Product comparison
convenience is the most important personalization factor behind the purchase intentions of
consumers. Hence all the three website designers Yatra.com, Makemytrip.com and Irctc.co.in
should focus on other personalization factors like competitive deals and customer
responsiveness. These website marketers should focus on providing more competitive deals
to consumers according to their preferences. For example these online travel shopping
websites can offer special discounts for students in their summer holidays. It will encourage
consumers to plan their trip in that season and companies can get benefit from it as well as
consumers will also feel to get advantages. Also they can offer some special packages for
senior citizens to travel to their holy destinations. Yatra.com website should provide more

Varsha Agarwal / International Journal of Management Research & Review
Copyright © 2012 Published by IJMRR. All rights reserved 1064
customer responsive approach and it can improve on it by giving dedicated customer care no.
and online support. Makemytrip.com should focus on website content management and
should try to make it more informative for customers. Personalization factor of Irctc.co.in has
highest impact on consumers purchase intentions. Hence other online shopping websites can
refer to it and can improve on accordingly. In this study it has been revealed that
demographic profile of consumers also plays major role on perception of consumers.
SCOPE FOR FURTHER RESEARCH
There is a scope for conducting further research study for solving the managerial level
problems for helping the managers. So that can use the personalization in a better way and
can adopt it. It will help them in formulating new marketing strategies. In the same field
further studies can be conducted with use of random sampling with scientific selection for
compensating the shortcomings of this study. Research in this subject can also include the
combination of personalized services in online travel industry and personalized features
provided by other industries in the industry of online shopping.
LIMITATIONS OF THE STUDY
The major limitations of this study are with respect to the number of websites chosen for
survey. Only three websites Yatra.com, Makemytrip.com and Irctc.co.in were chosen to
conduct the study. Another major limitation is location chosen. Only Bangalore has been
chosen for study. Hence this study may not reflect the perception and purchase intentions of
all the online travel shoppers.
CONCLUSION
Analysis shows that online shoppers prefer personalized services in online travel websites.
Although, consumers have started using online shopping websites for booking of tickets, but
it needs to go long way to find considerable market share for companies in the field of online
marketing. To get them out of this traditional way of booking tickets and other travel related
services, can be a challenge. Online marketers need to focus on adoption of attractive
personalized features and strategies to attract potential consumers.
REFERENCES
[1] Jr SF, Gelb JW. Consumer Privacy Regulation, Enforcement, and Litigation in the United
States. Business Lawyer 2003; 58(3): 1181-1192.
[2] Kambil A, Nunes PF. Personalization? No thanks. Harvard Business Review 2001; 79(4):
32-36.
[3] Law R, Bai B. How do the preferences of online buyers and browsers differ on the design
and content of travel websites? International Journal of Contemporary Hospitality
Management 2008; 20(4): 388-400.
[4] Munoz-Leiva F, Hernandez-Mendez J, Sanchez-Fernandez J. Generalising user behaviour
in online travel sites through the Travel 2.0 website acceptance model. Online Information
Review 2012; 36(6): 879 – 902.

Varsha Agarwal / International Journal of Management Research & Review
Copyright © 2012 Published by IJMRR. All rights reserved 1065
[5] Pechpeyrou PD. How consumers value online personalization: a longitudinal
experiment. Direct Marketing: An International Journal 2009; 3(1): 35-51.
[6] Sahney S, Ghosh K, Shrivastava A. Buyer's motivation for online buying: an empirical
case of railway e-ticketing in Indian context. Journal of Asia Business Studies 2014; 8(1): 43-
64.
[7] Sorce P, Perotti V, Widrick S. Attitude and age differences in online buying. International
Journal of Retail & Distribution Management 2005; 33(2): 122-132.
[8] Thamizhvanan A, Xavier MJ. Determinants of customers' online purchase intention: an
empirical study in India. Journal of Indian Business Research 2013; 5(1): 17-32.
[9] Woodside AG, Vicente RM, Duque M. Tourism's destination dominance and marketing
website usefulness. International Journal of Contemporary Hospitality Management
2011; 23(4): 552-564.