Embed Size (px)
Citation preview

Scholars' Mine Scholars' Mine
Masters Theses Student Theses and Dissertations
1972
A study on the lateral placement of automobiles due to A study on the lateral placement of automobiles due to
restrictions on two-lane rural highways restrictions on two-lane rural highways
Warren Chip Woods
Follow this and additional works at: https://scholarsmine.mst.edu/masters_theses
Part of the Civil Engineering Commons
Department: Department:
Recommended Citation Recommended Citation Woods, Warren Chip, "A study on the lateral placement of automobiles due to restrictions on two-lane rural highways" (1972). Masters Theses. 5060. https://scholarsmine.mst.edu/masters_theses/5060
This thesis is brought to you by Scholars' Mine, a service of the Missouri S&T Library and Learning Resources. This work is protected by U. S. Copyright Law. Unauthorized use including reproduction for redistribution requires the permission of the copyright holder. For more information, please contact [email protected].
A STUDY ON THE LATERAL PLACEMENT OF AUTOMOBILES
DUE TO RESTRICTIONS ON TWO-LANE RURAL HIGHWAYS
BY
WARREN CHIP WOODS, 1948-
A THESIS
Presented to the Faculty of the Graduate School of the
UNIVERSITY OF MISSOURI-ROLLA
ln. Partial Fulfillment of the Requirements for the Degree
MASTER OF SCIENCE IN CIVIL ENGINEERING
1972
Approved by
T2719 54 pages c. I

ABSTRACT
The driver of an isolated vehicle on a given section
of highway, whether it is urban or rural, will choose a
path on the pavement that offers the least resistance to
driver effort and which to him seems safest. Lateral
obstructions, such as retaining walls, trees, bridge
abutments, ect., which may cause him to deviate from the
desired path represent some degree of hazard to the
driver and should be removed, if practicle.
ii
The purpose of this investigation was to determine
any change in the lateral placement of automobiles due to
side restrictions on rural two-way, two-lane highways.
Phase one of the study concerned two bridges on u.s. Highway 63 near Rolla, Missouri, that differed only in the
amount of lateral clearance between the edge of the
traffic lane and its corresponding bridge abutment. Phase
two of the investigation concerned a bridge near Newburg,
Missouri, and the change caused by reflectorizing the
bridge abutments for better night visibility.
The results of phase one showed that by increasing
the amount of offset between the traffic lane edge and the
bridge abutment, drivers positioned their vehicle more
correctly within their lane. For the purpose of this in
vestigation, a vehicle is considered correctly positioned
within its lane when the vehicle is centered in the lane;
that is, there is an equal distance from the pavement

iii
center line to the left edge of the left tire and from the
right edge of the right tire to the right edge of the
traffic lane. In phase two of the investigation, it was
determined that the reflectorization of the bridge abut
ments was benefitial in that drivers positioned their
vehicle more correctly within its lane.

iv
ACKNOWLEDGEMENTS
The author wishes to thank Dr. James Larry Josey for
his guidance and assistance during the author's graduate
study and while acting as thesis director. Grateful
acknowledgement is also given to Dr. Frank A. Gerig, Jr.
for his guidance, and to Dr. John D. Rockaway for his
assistance in the statistical aspect of the thesis.

TABLE OF CONTENTS
.A.BS !rRA. CT • • • • • • • • • • • • • • • • • • • • • • • • • • • • • • • • • • • • • • • • • • • •
.A.CK:NOILE.OO EMENTS ••••••••••••••••••••••••••••••••••••
LIST OF FIGURES•••••••••••••••••••••••••••••••••••••
LIST OF 'l!ABLES ••••••••••••••••••••••••••••••••••••••
I. IN~RODUOTION ••••••••••••••••••••••••••••••
Background ••••••••••••••••••••••••••••••
Purpose of This Investigation •••••••••••
II • REVIEW OF PREVIOUS RESEARCH •••••••••••••••
Effect of Shoulders •••••••••••••••••••••
Roadway Characteristics ••••••••••.••••••
Bridge Studies ••••••••••••••••••••••••••
v
PAGE
ii
iv
Y1
vii
1
1
2
3
5
7
9
Other Studies........................... 12
III.
IY.
v. VI.
Summar.r. of Review of Previous Research •• ·' ME!HODOLOGY •••••••••••••••••••••••••••••••
!l!ea t Lo ca.t.ions • • • • • • • • .• • • • • • • • • • • •. • • ••••
Field Procedure •••••••••••••••••••••••••
RESULTS •••••••••••••••••••••••••••••••••• •
Results of Phase One ••••••••••••••••••••
Resulta of Phase Two ••••••••••••••••••••
DISCUSSION OF THE RESULTS •••••••••••••••••
CONCLUSIONS AND RECOMMENDATIONS •••••••••••
Conclusions •••••••••••••••••••••••••••••
Recommendations •••••••••••••••••••••••••
LITERA!URE CITED ••••••••••••••••••••••••••••••••••••
VI!A •••• • ••••••••••••••••••••••••••• •. •. • • • • • • • • • • • •
12
14
14
22
27
21
33
40
42
42
43
45
47

vi
LIST OF FIGURES
FIGURE PAGE
1A Map of the Study Area •••••••••••••••••••••• 15
1 Bridge Number One, Located Five Miles North of Rolla, Missouri, on U. s. Highway 63, Looking North •••••••••••••••••• 17
2 Bridge Number !wo, Located Eleven Miles South of Rolla, Missouri, on u. s. Highway 63, Looking West ••••••••••••••••••• 17
3 Plan View of Bridge Number One ••••••••••••• 18
4 One-Half Section A-A of Bridge Number One •• 19
5 Plan View of Bridge Number Two ••••••••••••• 20
6 One-Half Section A-A of Bridge Number Two •• 21
7 Bridge Number !hree, Located 1 • 7 •iles From the Junction of Phelps County Routes P and T, on Route P, LOoking South ••••••••• 23
8 Illustrative Example of the Way Measure-mente Were Made for Both Phases of the study •••••••••••••••••••••••••••••••••••••• 23
9 Section View of Bridge Number !hree •••••••• 24
10 Histograph of the Data Collected at Bridge Number One ••••••••••••••••••••••••••••••••• 29
11 Histograph of the Data Collected at Bridge llllillter ~o ••••••••••••••••••••••••••••••••• 31
12 Histograph of the Data Collected at Bridge Number Three Before Retlectorization ••••••• 35
13 His to graph of the Data Collected at Bridge Number !hree After Reflectorization •••••••• 37

TABLE
1
2
3
4
6
LIST OF TABLES
~,ield .i.>a ta for Bridge Number One •••••••••••
Field Data for Bridge Number Two •••••••••••
One-Way Analysis of Variance Table for Phase One . .........•.•.....................
Field Data for Bridge Number Three Before Reflectorization ••••••••••••••••••••
Field Data for Bridge Number Three
vii
PAGE
28
30
32
34
After Reflectorization..................... 36
One-Way Analysis of Variance Table for Phase Two • ••••••••••••••.•••••••••••••••••• 39

CHAPTER I
INTRODUCTION
Backgrormd
1
The tendency of the driver of an isolated vehicle on
a given section of roadway is to choose a path on the
pavement which requires the minimum amount of driver
effort and which to him seems safest. It is normal
driver behavior to swerve or steer away from objects on
or adjacent to the highway, such as sign posts, retaining
walls, parked automobiles, and bridge abutments. This
path that the vehicle travels can be observed, measured,
and recorded by several methods. One of the most common,
and possibly the easiest method for describing such data
is in terms of transverse or lateral placement of the
vehicle on the highway. Testing proceedures vary, but,
in general, measurements of this lateral placement are
taken from a reference point on the highway pavement to
some arbitrarily designated point on the motor vehicle.
The number of studies conducted in the field of
lateral placement are numerous, with each separate study
being concerned with one or more driver or road character
istic. Lateral placement studies are just as relevent
today as they were in the early 1940's when a number of
State and Federal agencies were conducting such research.
It is a problem that must be constantly considered with

2
the changing technology in the automotive industry as the
trend in automotive design is for automobiles with wider
tread widths, and in the field of highway design since
the highway designer strives for an optimum design from
the aspects of safety and economy.
Purpose of This Investigation
The purpose of the research conducted during this
investigation was to determine any effect on the lateral
placement of vehicles due to restrictions imposed by
bridge abutments on rural two-way, two-lane highways.
Research was done using a two phase investigation process.
The first phase considered the effect of increasing the
distance between the edge of the traffic lane and the
bridge abutment, and the second phase was concerned with
the change in lateral placement of vehicles caused by
reflectorizing the bridge abutment.
CHAPTER II
REVIEW OF PREVIOUS RESEARCH
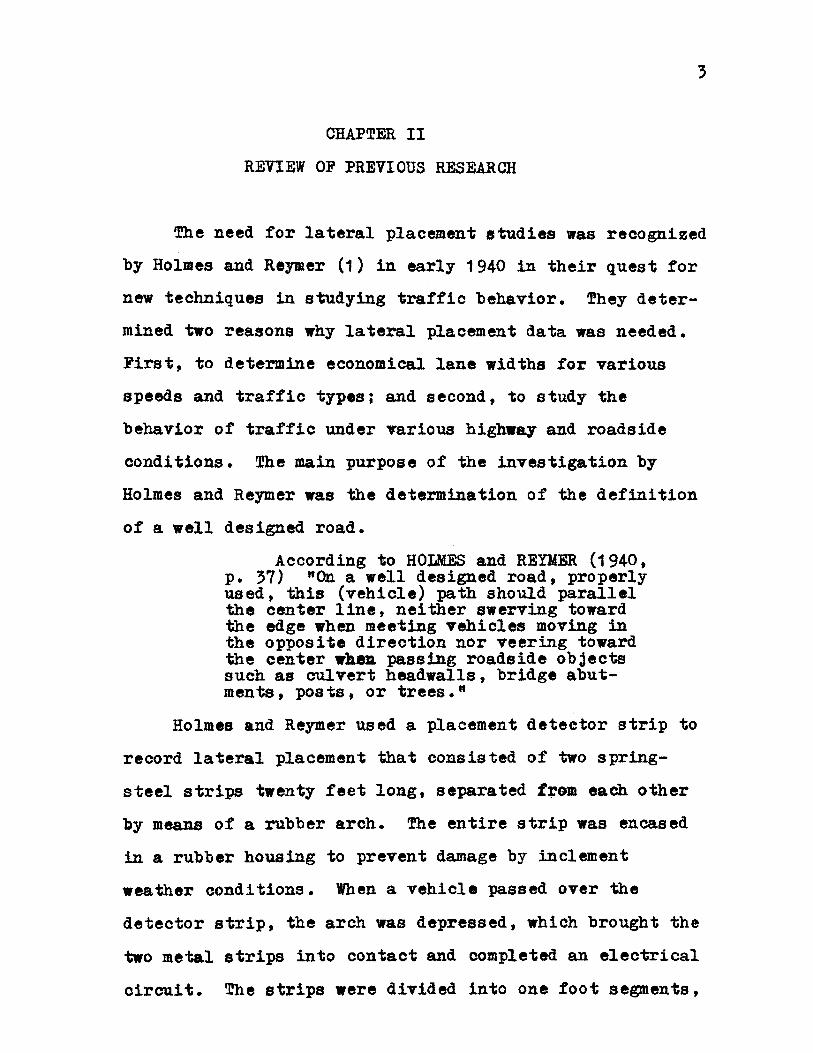
!l!he need :for lateral placement studies was recognized
by Holmes and Reymer (1) in early 1940 in their quest for
new techniques in studying traffic behavior. They deter
mined two reasons why lateral placement data was needed.
l'irs t, to determine economical lane widths :for various
speeds and traffic types: and second, to study the
behavior o:f traffic under Yarious highway and roadside
oondi tiona. !he main purpose of the investigation by
Holmes and Reymer was the determination of the definition
of a well designed road.
According to HOLMES and REIMER (1940, p. 37) "On a well designed road, properly used, this (vehicle) path should parallel the center line, neither swerving toward the edge when meeting vehicles moving in the opposite direction nor veering toward the center wJum passing roadside objects such as culvert headwalls, bridge abutments , posts , or trees • "
Holmes and R~er used a placement detector strip to
record lateral placement that consisted of two spring
steel strips twenty feet lol'lg, separated f~ each other
by means of a rubber arch. !he entire strip was encased
in a rubber housing to prevent damage by inclement
weather conditions. When a vehicle passed over the
detector strip, the arch was depressed, which brought the
two metal strips into contact and completed an electrical
circuit. The strips were divided into one foot segments,

4
with each of these consisting of seven and one-half inches
of "live" section and four and one-half inches of "dead 11
section, so recordings could be made to the nearest foot.
From the results obtained from the investigation, Holmes
and Reymer stated that the required pavement width for
passenger cars would be the sum of the following three
variables:
1. The tread widths of two vehicles when meeting.
2. The amount of clearance between two vehicles
when meeting.
3. An adequate edge clearance for both vehicles.
In 1946, Green (2) devised a new method for recording
lateral placement that utilized an electrically-operated
motion-picture camera. The camera could be mounted out
of sight on highway signs or bridge abutments, and thus
not affect the drivers of the observed vehicles. Green
found that this method had several advantages compared to
the placement detector strip used by Holmes and Reymer.
Some of these advantages are:
1. accuracy
2. ease of changing location
3. absence of visual equipment to distort normal
driver behavior.
4. applicable to both day and night investigations
This method had one weakness, in that readings could
only be made to the nearest six inches at distant stations
and to the nearest three inches at the nearer stations.

These two methods, or modifications thereof, are
still the primary means of collecting lateral placement
data.
Effec~ of Shoulders
One of the primary areas of concern to the highway
design engineer is that of shoUlders. .A.sriel Taragin, a
highway engineer with the Division of Highway Transporta
tion Research of the Public Roads Administration, was one
of the pioneers in studying the overall effects that
shoulders had on the speed and lateral placement of motor
vehicles.
Taragin conducted three investigations between 1953
and 1957 that considered the effect that shoulders had on
the lateral placement of vehicles. In the first of the
investigations, in 1953, Taragin and Eckhardt ( 3) deriTed
the following conclusions, based on the lateral placement
phase of the investigation:
1. The lateral position of free moving vehicles and
the clearance between meeting vehicles bears no
significant relation to shoulder widths above four
f~et.
5
2. Well-maintained grass shoulders have the same
af:f'ect on lateral placement as well-maintained gravel
shoulders.
In his 1955 investigation, Taragin (4) considered
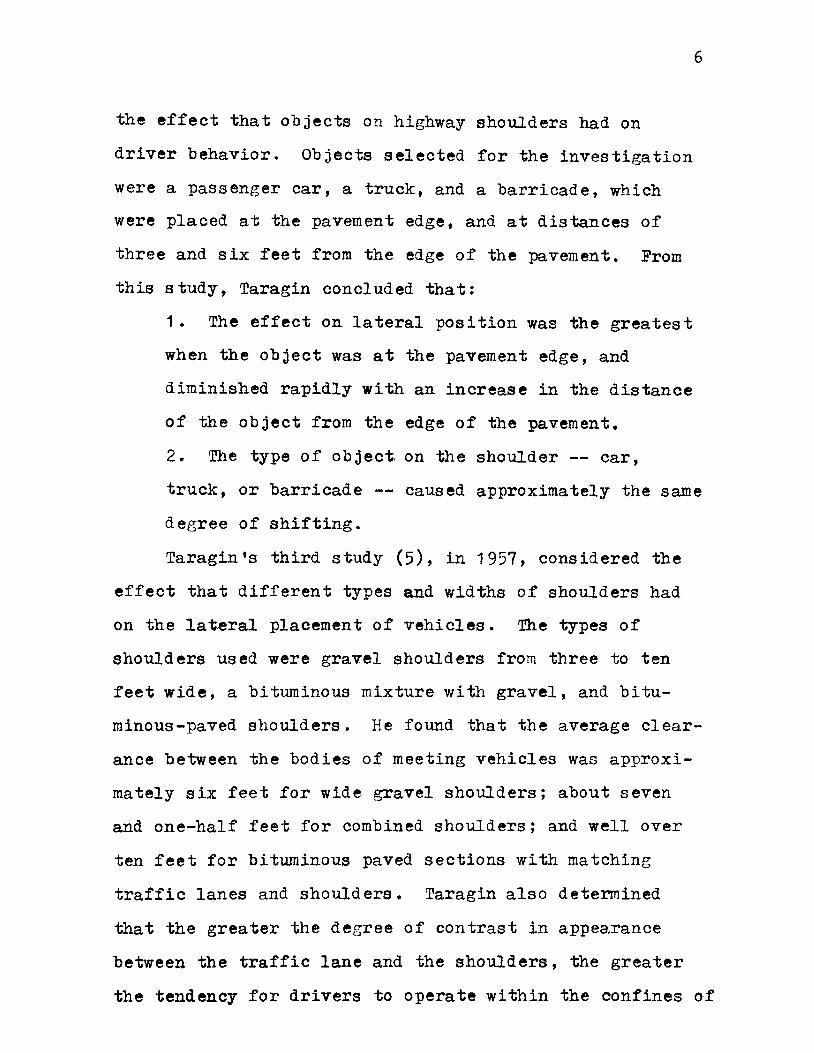
the effect that objects on highway shoulders had on
driver behavior. Objects selected for the investigation
were a passenger car, a truck, and a barricade, which
were placed at the pavement edge, and at distances of
three and six feet from the edge of the pavement. From
this study, Taragin concluded that:
1. The effect on lateral position was the greatest
when the object was at the pavement edge, and
diminished rapidly with an increase in the distance
of the object from the edge of the pavement.
6
2. The type of object on the shoulder -- car,
truck, or barricade -- caused approximately the same
degree of shifting.
Taragin's third study (5), in 1957, considered the
effect that different types and widths of shoulders had
on the lateral placement of vehicles. The types of
shoulders used were gravel shoulders from three to ten
feet wide, a bituminous mixture with gravel, and bitu
minous-paved shoulders. He found that the average clear
ance between the bodies of meeting vehicles was approxi
mately six feet for wide gravel shoulders; about seven
and one-half feet for combined shoulders; and well over
ten feet for bituminous paved sections with matching
traffic lanes and shoulders. Taragin also determined
that the greater the degree of contrast in appearance
between the traffic lane and the shoulders, the greater
the tendency for drivers to operate within the confines of

the traffic lane.
The shoulder investigation conducted by case, et.
al. (6) in 1953 concerned the affect on lateral placement
of different types of roadside structures. The group
used a black hinged plywood structure ~at had expandible
widths of three and one-half, five, and eight feet, with
readings taken when the structure was at distances of
one-half, three, and seven feet from the highway edge.
It was found that even at minimum size and distance con
ditions, the average amount of deviation from the normal
vehicle path was five inches, and the drivers reaction to
the distance the object was placed from the pavement edge
was of a higher order of magnitude than th'e size of the
object. The investigation also determined that, as the
ob3ect was placed clos.er.:to the pavement edge, the dis
tance along the roadway before the driver reaChed the
object, and where the maximum reaction occurs, increased.
Roadway Characteristics
7
Another field of interest to the highway designer is
the effect that roadway characteristics have on the
lateral placement of vehicles. In this field, Asriel
Taragin again conducted three research investigations from
1943 to 1947.
In his 1943 study (7), Taragin was concerned with the
effect that the cross section design of the roadway had an

the lateral placement of vehicles. From the information
collected during this investigation, Taragin devised the
~ollowing relationships:
1 • For traffic of predominantly passenger cars, a
20 foot pavement width was adequate.
2. For mixed traffic of passenger cars and some
truck traffic, 22 feet was needed.
3. For areas of high truck traffic, a 24 foot pave
ment was required.
In his second study on roadway characteristics (8),
Taragin was interested in the effect of roadway width on
vehicle operation. Analyzing his data, Taragin found
that, for pavements of 18, 20, 22, and 24 feet in width,
with an increase in traffic volume, the distance that the
vehicle shifted away from the center line increased; and
that shoulder widths in excess of four feet do not affect
the transverse position of vehicles when there is no
obstruction immediately adjacent to the outside of the
shoulder.
8
In his 1947 investigation of roadside characteristics,
(9), Taragin shifted his attention to the effect that
pavement center lines have on the lateral placement of
vehicles. He used four widths of two-lane roads in this
investigation; 18, 20, 22, and 24 feet. He found that,
for each of the pavement widths studied, the typical
vehicle path is further to the right on pavements with a
center line marking than it is on a similar pavement

9
without center line markings. Upon further examination,
'l!aragin found that vehicles were driven closer to their
proper position on the roadway and encroached on the left
lane less frequently when they have a center line marking
as a guide. For ~aragin's investigation, and for the
remainder of this thesis, a vehicle is considered to be
properly positioned within its lane when the vehicle is
centered in the lane; that is, there is an equal amount of
distance from the pavement center line to the left edge of
the left tire and from the right edge of the right tire to
the right edge of the traffic lane.
A more recent area of concern to the highway depart
ments is the matter of edge striping and its effect on
traffic operations. In the 1960 investigation by Thomas
and Taylor (10), they found that, on 24 foot wide pave
ments, the trend of the free-moving vehicle is to travel
nearer to the pavement center line after the painting of
an edge stripe. The 1969 investigation on edge striping
by the Missouri State Highway Department (11) produced
similar results when applied to two-lane, two-way rural
roadways of 24 feet in width.
Bridge Studies
There have been several lateral placement investiga
tions that dealt with bridges. Green {2) conducted part
of hie test at a bridge location. In 1941, Walker {12)

10
used a lateral placement study to determine a value for
an adequate bridge width. He observed over 20,000
vehicles on eleven bridges in a survey in the states of
Ohio, Illinois, Iowa, and Oregon. After he analyzed the
data, Walker derived an equation for required bridge
width that included the following variables:
1. The distance freely moving vehicles preferred to
allow between their right wheels and the curb or
parapet of the bridge.
2. The tread width of the average car.
3. The distance of the left wheel to the right of
the center line for vehicles meeting on the tangent
section, which is equivalent to one-half the clear
ance between the left wheels of vehicles when
meeting.
When Walker applied these values to a 22 foot wide
roadway section, he found that a bridge width of 30.6
feet was required.
Quimby (13) conducted a series of tests at a narrow
bridge on U. s. Highway 52, one mile east of Templeton,
Indiana, in 1947, to determine the effect of various
types of prevailing delineation deviceson the speed and
lateral placement patterns of passenger cars. Four types
of signing installations were considered, including
reflector button warning signs and striped panel boards
at the bridge; standard size reflectorized background
warning signs with enlarged red button clusters at the

1 1
bridge; and reflectorized background signs with the panels
at the bridge, and with the panels and a painted re
flectorized center line through the bridge and extending
into the approach. Quimby found that the warning signs
tended to cause the driver to encroach upon the center
line, an undesirable condition. Presence of the re
flector! zed center line, on the other hand, was a
desirable control that channelized the traffic and led
drivers through the final approach within the correct
lane.
In 1958, Shelby and Tutt (14) conducted a vehicle
speed and placement survey, one phase of which studied
two-lane bridges. When they applied Walker's formula
for required bridge width (12), Shelby and Tutt found
that variable number one, the distance freely moviJla
vehicles preferred to allow between their right wheels
and the bridge parapet or curb , varied according to the
bridge width. It was felt by Shelby and !utt that the
adequate bridge width would be the width that would
encourage a vehicle to remain in the same lateral
position on the bridge that it occupied on the roadway
prior to entering the bridge. It was concluded that the
average driver needs a bridge width of 40 feet in order
to cross the bridge with 11 ttle or no deviation in the
lateral pea! tion .from that assumed on the approach
roadway.

12
Other Studies
It is normal driver behavior to swerve away from any
object that the driver considers a hazard. In 1963,
Michaels and Lozar (15) conducted an investigation to
determine what perceptual and field factors cause lateral
displacement. !hey concluded that lateral placement is a
special case in the field of velocity perception.
Michaels and Lozar found 'that, relative to the observer,
the displacing ob3ect moves laterally across the retina
with a definable angular velocity. Drivers react to this
apparant velocity by determining when and how much they
should displace on the basis of the time and distance at
which that velocity increases sharply.
One phase of Hormann's study on driver character
istics {16) was concerned with lateral placement. He
found that when there are no oncoming vehicles, high speed
drivers tend to travel closer to the pavement center line
than low speed drivers; and when there were oncoming
vehicles, high speed drivers were farther from the pave
ment center l~e than low speed drivers.
Summaty of Review of Previous ResearCh
From the preceding review of previous research,
several important roadway conditions can be considered as
being critical for the proper positioning of a vehicle

13
within its lane. Some of the more important roadway
characteristics are: a twelve foot lane width for mixed
traffic with a large percentage of trucks; edge striping;
center line marking; and several shoulder conditions.
These articles prove the value of lateral placement
studies.

CHAPTER III
METHODOLOGY
Test Locations
1 4
The two test locations for phase one of the study
were two bridges on U. S. Highway 63 near Rolla, Missouri.
One of the two bridges was located five miles north of
Rolla, and the second bridge was located eleven miles
south of Rolla. The average daily traffic (A. D. T.) for
these two locations was approximately the same, with
values of 2,950 vehicles per day at location number one
and 3,380 vehicles per day at location number two.
Figures for the A. D. T. at these two test locations were
obtained from the Missouri State Highway Department.
Figure 1 A is a map showing the test locations :iin respect
to the Rolla area.
These two bridges are similar in several aspects.
Both locations have approach lane widths and bridge lane
widths of twelve feet. Both locations have alternating
black and white dashed center lines, and both locations
have a constant edge stripe of four inches in width to
mark the outer edge of the twelve foot lanes. According
to Taragin's articles (7, 8, 9) and the two articles on
edge striping (10, 11), these features are the optimum
design characteristics to consider for proper vehicle
placement within its own lane. The two bridges used in

I 44
FIGURE I A
MAP OF THE STUDY AREA
BRIDGE NUMBER TWO
BRIDGE NUMBER
ONE
SCALE : I"= 2 MILES
1 5

this phase of the study are reflectorized for night
visibility.
Figure 1 is a photograph of bridge number one,
located north of Rolla. This bridge has an asphaltic
concrete surface, and an offset of one and one-half feet
from the center of the white edge stripe to the left
edge of the bridge abutment. This is shown in detail in
Figure 3, a plan view of the bridge. There are no
guardrails at this location. Adjacent to the approach
lane is ~ five foot wide gravel shoulder. Figure 4 is a
one-half section view of bridge number one.
Figure 2 is a photograph of bridge number two.
This bridge has a portland cement concrete surface, with
an offset of tour and one-half feet from the center of
the white edge stripe to the left edge of the bridge
abutment curb. This is shown in detail in Figure 5, a
plan view of the bridge. This location has an eight
foot wide paved shoulder adjacent to the approach lane.
This paved shoulder is tapered from a point one hundred
feet from 'the bridge entrance up to the abutment. !he
outer edge of this paved shoulder is marked by a metal
guardrail thirty inches tall • Figure 6 is a one-half
section view of this bridge.
16
The test location for phase two of the investigation
is located on Phelps County Route P, southwest of Newburg,
Missouri. Figure 7 is a photograph of this bridge,
located 1. 7 •ilea from the ;Junction of Phelps County

Figure 1 Bridge Number One, Located Five Miles North of Rolla, Missouri, on U. s. Highway 63, Looking North.
Figure 2 Bridge Number Two, Located Eleven Miles South of Rolla, on u. s. Highway 63, Looking West.
17

~
b 2'- o• 100'- o• A- 2'- o"H
J
I
FIGURE 3
~ r
-. r
A
I t4" f- 4" EDGE STRIP I j:t-s•
_j [ I
I
12'-o"
PAVEMENT CENTER LINE
..J r
I +-
12'- 0"
4" EDGE STRIP I "t""~'-s• TI.-4"
I " SCALE:-: 1'- 0" 8
PLAN VIEW OF BRIDGE NUMBER ONE.
_,. (X)

1 ~
: CD I -~
0 I II
w
z 0 a:: w
m
:l! :::> z w
(!) 0 a:: m
LL 0 <
( I <(
z 0 .... (.) w
U
)
LL. ...J <
( I I
w
z 0
19

J~. o" 1- 36o'- o" A --=-----:-l~s·;-o~· "l =Fs" -
4" PIPE RAILING'\_ 6" OURB'\
4" PIPE RAILING
A.-
4" EDGE STRI~
.
PAVEMENT CENTER LINE I
4" EDGE STRIP II
6" CURB
SCALE:..!.: 1'-0 8
FIGURE 5 PLAN VIEW OF BRIDGE NUMBER TWO.
I 611 4-
1 12.'- o"
12'- 011
j_ 4'- 611
-=lr;s"
N 0

21
0 b
~
I t-
--0:::
.. U
J =,.,lCD
CD :E
1&.1
::::> ..J
z c u (I)
UJ
C)
0 0::: CD
LL. 0 l
=
z CD
0 I
t-~
(.) -
UJ
en LL. ...J <
( ::r: I U
J z 0 w
w
a:
11.1
~~-------------_.__.....___
a:: CD

22
Routes P and T. This teat location is shown in Figure
1A and is noted as bridge number three. ~ere are no
edge stripes or center line markings on either the bridge
or the approach lane at this location. The approach lane
is ten feet wide, and is not centered on the 26 foot wide
bridge. Figure 9 is a full section view of bridge number
three that shows the approaCh conditions in detail.
Adjacent to the approach lane is a four foot wide gravel
and grass shoulder whose outer edge is marked by a 27
inch high metal guardrail. The average daily traffic at
this location is approximately 130 vehicles per day.
This A. D. T. value was obtained from the Missouri State
Highway Department.
Field Procedure
Measurement of lateral placemen~ for phase one of
the study was made through the use of a narrow strip of
gray slow-drying enamel paint perpendicular to the
pavement center line at the entrance to the bridge. The
test strip was oae-hal! incn wide and covered eight feet
of the lane of interest and extended two feet into the
opposing lane of traffic to record readings made when a
vehicle entered to the left of the bridge center line.
After each vehicle passed over the test strip, the amount
of lateral placement was measured and recorded, and the
used portion of the test strip was re-painted. Figure B

Fi&ve l Bridge l(mrfber ~ree, Lo oa ted 1 • 7 Miles From the Junction of Phelps County Routes P and ~' on Route P, Looking South.
Illua1;rative Example of the V/ay Both fll.ases of

-j•or-
T 3'-2"
APPROACH LANE POSITION 9"f//j:j l_ v zz z z z z z z z z z z , z z z•
~ 1 '- 4"+- 2'- o" ..1· 20'- o'" 1. ~- o" f 1'-4'j .,. _______________ 28'- 8" -..
SCALE; .l. • 1'- 0" 8
FIGURE 9 SECTION VIEW OF BRIDGE NUMBER THREE.
N ~

is a photograph depicting the manner in which data was
collected for the investigation.
25
The bridge center line was used as a reference point
for each reading for phase one of the investigation, and
the amount of lateral displacement was the distance
between this reference point and the leftmost edge of the
left tire track located on the test strip. This distance
was measured through the use of a metal yardstick, with
readings made to the nearest inch.
The observed vehicles consisted of automobiles and
small open-bodied trucks. No Volkswagens or similar
vehicles with small tread widths were recorded. Due to
the test proceedure, observations were limited to situ
ations when a single vehicle passed over the test strip.
A queue of vehicles would leave several tracks on the
strip, making accurate readings difficult as only the
tread track nearest ~o the center line could be measured.
If this practice were followed, with just the nearest of
several tracks being recorded, an element of bias would
enter into the study. There were no recordings used when
a vehicle in the opposing lane of traffic was within one
quarter of a mile of the observed vehicle as this might
influence how a driver positions his vehicle within his
lane. Recordings were taken at the same time of day on
the same day of the week one weelc apart at both locations
to eliminate any bias that might enter due to these
conditions. Fifty recordings were made at each of the
26
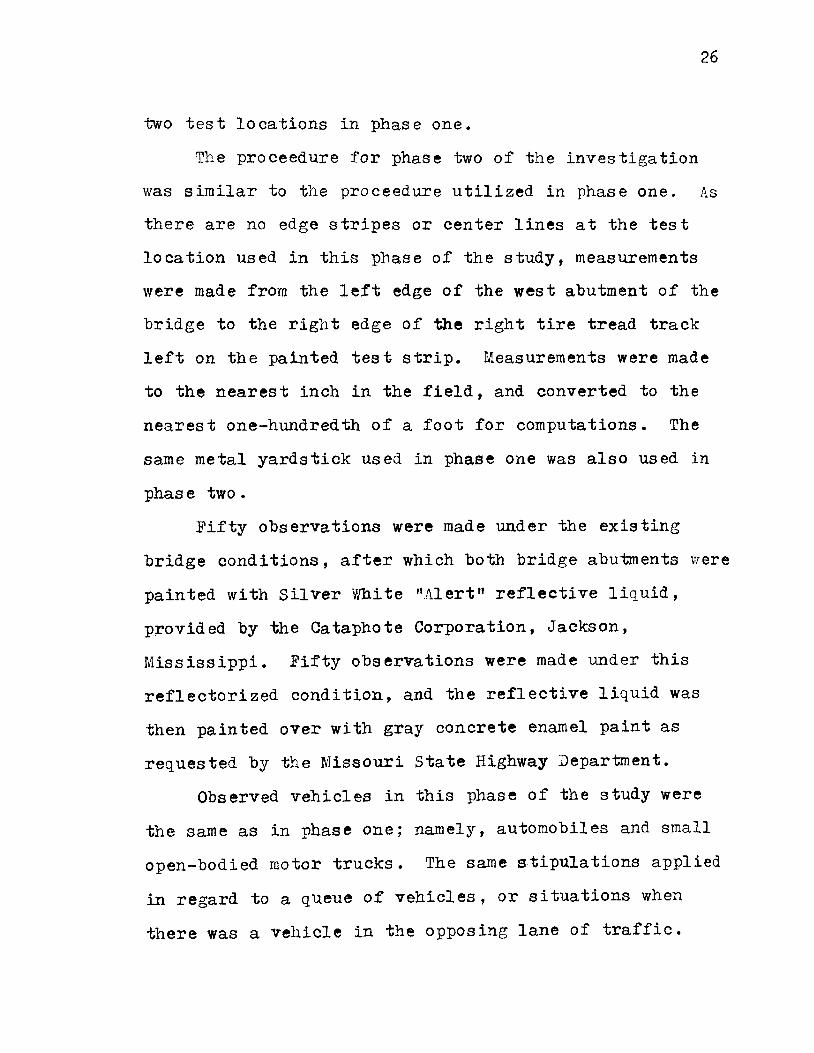
two test locations in phase one.
The proceedure for phase two of the investigation
was similar to tlle proceedure utilized in phase one. As
there are no edge stripes or center lines at the test
location used in this phase of the study, measurements
were made from the left edge of the west abutment of the
bridge to the right edge of the right tire tread track
left on the painted test strip. Measurements were made
to the nearest inch in the field, and converted to the
nearest one-hundredth of a foot for computations. The
same metal yardstick used in phase one was also used in
phase two.
Fifty observations were made under the existing
bridge conditions, after which both bridge abutments were
painted with Silver White "-Alert" reflective liquid,
provided by the Cataphote Corporation, Jackson,
Mississippi. Fifty observations were made under this
reflectorized condition, and the reflective liquid was
then painted over with gray concrete enamel paint as
requested by the Missouri State Highway Department.
Observed vehicles in this phase of the study were
the same as in phase one; namely, automobiles and small
open-bodied motor trucks. The same stipulations applied
in regard to a queue of vehicles, or situations when
there was a vehicle in the opposing lane of traffic.

CHAPTER IV
RESULTS
Results of Phase One
27
Tables 1 and 2 show the recorded values of the
lateral displacement at test locations one and two,
respectively. The two negative numbers in Table 1 indi
cate that two readings were recorded when the left edge
of the left tire was to the left of the bridge center
line, or, in other words, the vehicle was partially in
the opposing lane of traffic, an undesirable condition.
Two statistical tests were applied to the collected
data (17). A statistical "t" test was used to compare
the means of the two sets of data. It was found that at
the 99 percent Confidence Interval there was a signifi
cant difference between the means of the two sets of
data. The 99 percent Confidence Interval means that
there is a one percent chance of a Type I error occuring;
that is, rejecting a hypothesis when it should be
accepted.
The other statistical test used was an "F" test
utilizing a one-way analysis of variance that includes
the simultaneous comparison of means and variances.
Table 3 is the analysis of variance table for phase one.
From this table, it can be determined that there is a
significant difference between the one and one-half foot

28
TABLE 1
FIELD DATA FOR BRIDGE NUMBER 1
Located five miles north of Rolla, Missouri, on
u. s. Highway 63.
Read ins Dis;elacement Reading Dis;elacement (inches) (inches)
1 • ) 24 26.) 19 2.) 21 27.) 23 3.) 25 28.) 0
4.) 10 29.) 8 5.) 2 30.) 36 6.) 13 31.) 15 7.) 12 32.) 12
a.> 31 33.) 28
9.) 0 34.) 26
10.) 42 35.) 2 11 • ) 30 36.) 12
1 2.) 38 37 .) 20
13.) 11 38.) 19
14.) 27 39.) 28
15.) 40 40.) 4
16.) 34 41.) 30
17.) 13 42.) 19
18.) -3 43.) 31
19.) 1 44.) 5
20.) 9 45.) 34
21.) 24 46.) 22
22.) -2 47.) 23
23.) 12 48.) 34
24.) 15 49.) 5
25.) 22 50.) 23

12
I I
10
9
8
Cl)
1&1 7 _, 2 ::1: 1&1 > 6
..... 0
5
3
2
-X = 18.6
0 ~~~~~~~-A~~~~~~~~~--+----5 0 !5 10 15 20 25 30 35 40 45 50
DISTANCE IN t NC HES FR ON LEFT EDGE 0 F LEFT
TIRE TO MIDPOINT OF BRIDGE GENTER LINE
FIGURE 10 HISTOGRAPH OF THE DATA
COLLECTED AT BRIDGE NUMBER ONE.
29

30
TABLE 2
FIELD DATA FOR BRIDGE NUMBER 2
Located eleven miles south of Rolla, Missouri, on
u. s. Highway 63.
Readint:!i Dis;Elacement Reading Dis;Elacement (inches) (inches)
1 • ) 19 26.) 44 2.) 25 27.) 38 3.) 44 28.) 21 4.) 26 29.) 40 5.) 43 30.) 38 6.) 28 31 • ) 44 7 .) 28 32.) 26
8.) 29 33.) 34 9.) 32 34.) 16
10.) 36 35.) 30
11 • ) 24 36.) 44
1 2.) 1 2 37.) 35
13 .. ) 37 38.) 31
14.) 43 39.) 8
1 5.) 28 40.) 34
16.) 38 41 • ) 31
17.) 61 42.) 20
18.) 40 43.) 42
19.) 68 44.) 46
20.) 40 45.) 34
21 • ) 24 46.) 33
22.) 56 47.) 37
23.) 16 48.) 47
24.) 43 49.) 44
25.) 25 50.) 48

U)
LLI ..J 0 -::t: ..... >
"" 0
a:: ..... ED 2 ':;)
z
31
12
I I
9
8
7
6
5
4
3
2
o~~~~~~~~~~~~~~~+---~~_.~~
5 10 15 20 25 30 35 40 45 50 55 60 65 70
DISTANCE IN INCHES FROM L£FT EDGE OF LEFT
TIRE TO MIDPOINT OF BRIDGE CENTER LINE
FIGURE II HISTOGR APH OF THE DATA
COLLECTED AT BRIDGE NUMBER TWO.
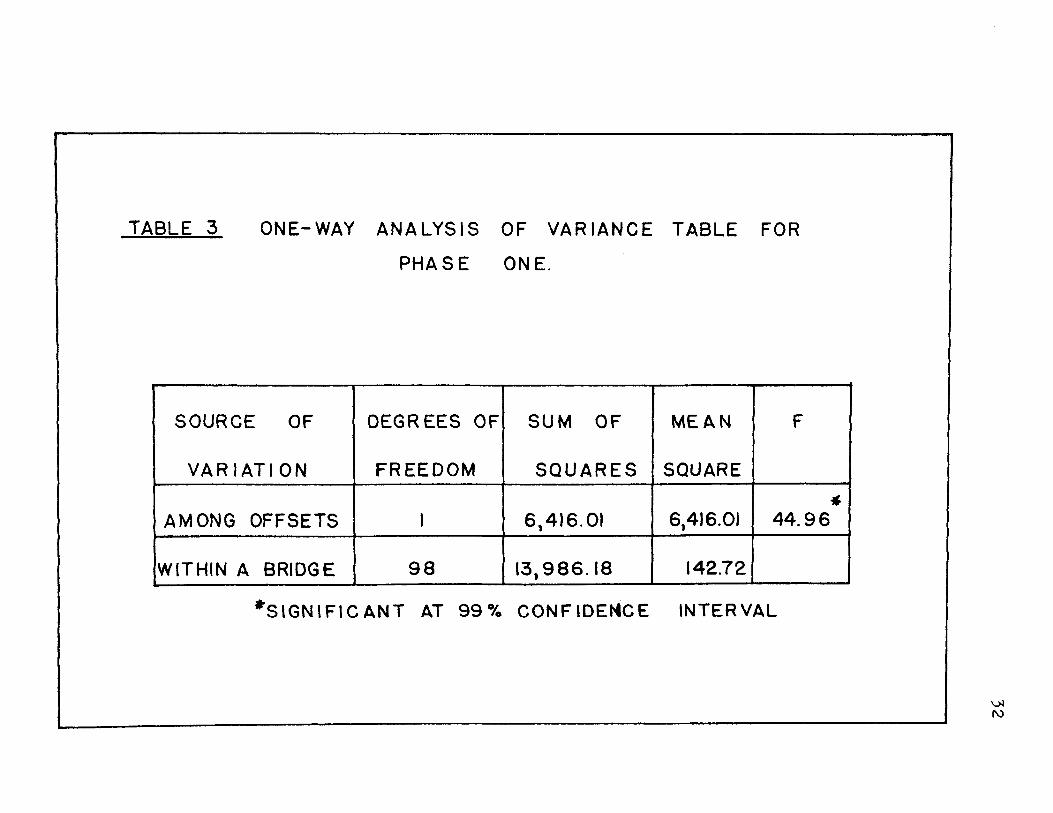
TABLE 3 ONE-WAY ANALYSIS OF VARIANCE TABLE FOR
PHASE ONE.
SOURCE OF DEGREES OF SUM OF MEAN F
VARIATION FREEDOM SQUARES SQUARE
AMONG OFFSETS I 6,416.01 6,416.01 44.96
WITHIN A BRIDGE 98 13,986.18 142.72
"SIGNIFICANT AT 99°/o CONFlDE~CE INTERVAL
I ..
~ 1\J

offset at bridge number one and the four and one-half
foot offset at bridge number two.
33
The results of the "t" test confirms that the means
of readings recorded at the two test locations were not
equal. The results of the "F" test confirms that there
is a significant difference between the offsets at the
two test locations.
A one-way analysis of variance was used for phase
one of the study due to the similarity between the two
test sites. Both the approach lane widths and the bridge
lane widths were a constant twelve feet at both loca
tions, and both test sites had edge striping and center
lines. Readings were taken at approximately the same
time of day and on the same day of the week at both
locations. The type of bridge structure was the same at
both sites. The only difference in the two test lo
cations was in the amount of lateral clearance or offset
between the edge of the traffic lane and the edge of the
bridge abutment or curb; with values of one and one-half
feet at bridge number one and four and one-half feet at
bridge number two.
Results of Phase Two
Tables 4 and 5 show the recorded values of the
lateral displacement at bridge number three before and
after the bridge abutments were painted with the re-

34
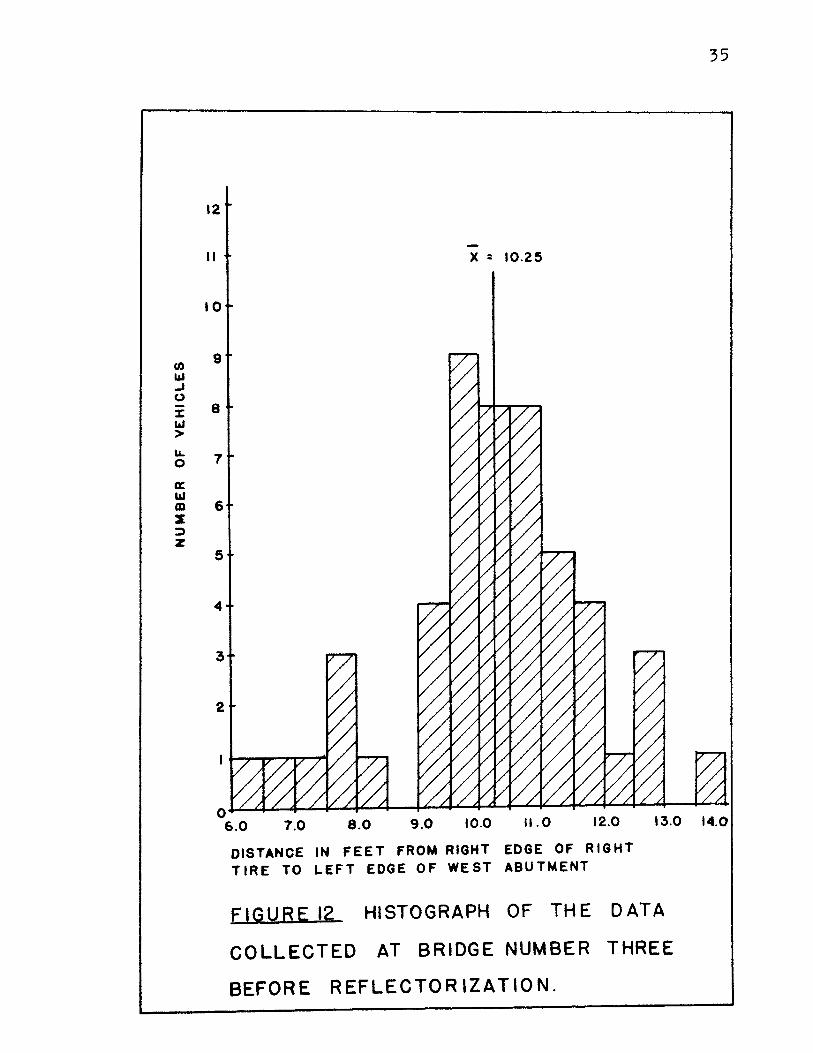
TABLE 4
FIELD DATA FOR BRIDGE NUMBER 3 ,BEFORE REFLECTORIZATION
Located 1.7 miles to the west of the junction of
Phelps County Routes P and T, on County Route P, near Newburg, Missouri.
Readini Dis]2lacement Reading Dis]2lacement
(feet) (feet)
1 • ) 9.92 26.) 9.67
2 •. ) 12.50 27.) 8.25
3.) 10.42 28.) 11 • 50
4.) 10 .. 25 29.) 12.92
5 .) 9.83 30.) 7.67
6 •. ) 9 .. 42 31 • ) 10.50
7 .) 13.83 32.) 12.83
8 •. ) 1.1 .. 17 33.) 9.08
9.) 10 .. 33 34.) 12 .. 42
10.) 6 .. 75 35.) 10.58
. 11 .) 11.33 ;6.) 7.17
1 2.) 9 .. 08 37 .. ) 11.75
1;.) 9.58 ;s.) 9.58
14.) 10.50 ;g.) 7.92
1 5.) 9.42 40.) 11.00
16.) 10.75 41.) 11.50
17.) 10.08 42.) 9.83
18.) 11 .. 50 43.) 9.67
19.) 10.75 44.) 10.58
20.) 10.00 45.) 10.75
21.) 10.42 46.) 10.58
22.) 6.00 47 .) 7.92
23.) 11 .17 48.) 9.67
24.) 11.75 49.) 9.83
25.) 10.33 50.) 10.33
rn t.al .J (.) -l: 1&.1 > ~ 0
c t.al CD s ::)
z
35
12
II X = 10.25
10
9
8
7
6
5
2
0~~~~~~~~~~~~~~~~44~~~~~1 9.0 10.0 II. 0 12.0 13.0 14.0 6.0 7.0 8.0
DISTANCE IN FEET FROM RIGHT EDGE OF RIGHT TIRE TO LEFT EDGE OF WEST ABUTMENT
FIGURE 12 HISTOGRAPH OF THE DATA
COLLECTED AT BRIDGE NUMBER THREE
BEFORE REFLECTOR IZATION.

36
TABLE 5
FIELD DATA FOR BRIDGE NUMBER 3, AFTER REFLECTORIZATION
Located 1.7 miles to the west of the junction of Phelps County Routes P and T, on County Route P, near Newburg, Missouri.
Read in~ DisElacemen t. Read in~ DisElacement (feet) (feet)
1 • ) 6 .. 83 26.) 9.58
2.) 11 .17 27.) 10.33
3.) 6 .. 08 28.) 8.67
4 .. ) 8.67 29.) 11 .25
5.) 10.25 30.) 6.67
6.) 11 •. 17 31 • ) 7.42
7.) 12.50 32.) 8.33
8.) 6.17 33.) 6 .. 23
9.) 6 .. 42 34.) 9.17
10.) 10.67 35.) 10.83
11 • ) 9 .. 75 36.) 8.42
1 2.) 7.42 37.) 6 .. 92
1 3.) 7.08 38.) 6.58
14.) 10.17 39.) 7.42
1 5.) 10.33 40.) 6.33
16.) 8.67 41 • ) 8.58
17.) 9.92 42.) 6.17
18.) 9.75 43.) 9.00
1 9.) 10.25 44.) 7.92
20.) 6.33 45.) 8 .. 75
21 • ) 6.42 46.) 6.83
22.) 7.42 47.) 8.33
23.) 8.08 48.) 9.25
24.) 10.67 49.) 10.17
25.) 6 •. 17 50.) 8.08

12
II
10
0 .., ..I ()
% 8 w >
Cl: w m 2 6 ;:::)
z
4
3
-X = 8.5
0~~~~+4~~~~~~~~~~~~~~--
11.0 12.0 13.0 6.0 7.0 8.0 9.0 10.0
DISTANCE IN FEET FROM RIGHT EDGE OF RIGHT TIRE TO LEFT EDGE OF WEST ABUTMENT
FIGURE 13 HISTOGRAPH OF THE DATA
COLLECTED AT BRIDGE NUMBER THREE
AFTER REFLECTORI ZATION.
37

flectiv~ ttqutQ, respectively. ~bis data was analyzed
using t4~ ~ame two statistical t~sta utilized in phase
one; tha,~ .:ts, the "t" test and the "P" test. The "t"
test wa~ v~ed to test the population means of the before
and aft~f ~etl~ctorization conditions. Using a 99
percent ~~~f~d~nce Inter~al, it was determined that the
means o~ ~4e ~o conditions were not equal.
Ta~}~ 6 }~ ~e analysis of ~ariance table for phase
two of 1;~~ iA"est:i.gation. Res'Ul ts o.t the "F" test
confirm ~~~t iib.el.'e :ts a significq,nt difference in the
positio:fi~~~ af th.e vehicles witb.in their lane due to the
reflect~fy~t~on of the brid~e abutments.
A ~p~,w~j an~lysis of ~ari~ce was used for phase
two of cAl 1~"estigation sin~e all o.t the bridge and
roadway ~~~d~1iion8 remained the same for both parts of
this ph~~~ o~ the st~dy, with tb.e e~ception of the
reflect~~t~~}on o! the brid~e abutments.
38

TABLE 6 ONE- WAY ANALYSIS OF VARIANCE TABLE FOR
PHASE TWO.
SOURCE OF DEGREES OF SUM OF MEAN F
VARIATION FREEDOM SQUARES SQUARE
* AMONG CONDITIONS I 71.35 71.35 2. 7.55
WITHIN THE BRIDGE 98 254.12 2.59
*SIGNIFICANT AT 99% CONFIDENCE INTERVAL
i
J
~ 1.0

CHAPTER V
DISCUSSION OF THE RESULTS
The results of phase one of this investigation
verified that there was a significant difference in the
results obtained at location number one, that had an
offset of one and one-half feet, when compared to the
r·esul ts obtained at location number two, with a four and
one-half foot offset. The average change was 16 inches,
which means that the drivers of the vehicles at location
number two were more centered in their lane.
40
Upon further study of the data, when applying an
average vehicle tread width of six feet as suggested by
Taragin (7), it was found that 22 of the 50 readings at
location number two were closer to the pavement edge than
to the bridge center line by amounts of from one inch to
as much as thirty-two inches. By comparison, at test
location number one, only three of the 50 vehicles were
closer to the pavement edge than to the bridge center
line, with a variance of from two to six inches. It is
hypothesized that 44 percent of the drivers at location
number two, with the four and one-half foot offset, were
little affected by the proximity of the bridge abutment.
Results of phase two verify that there was a sig
nificant difference in the positioning of a vehicle within
its lane after reflectorization of the bridge abutments.
The average difference was a change of 1.75 feet, or 21

inches, which indicates that the drivers drove closer to
the bridge abutment after it was reflectorized, and
therefore were closer to being centered within their
lane.
41
It was interesting to note that before the bridge
abutments were painted with the reflectorizing liquid,
only six of the 50 vehicles, or 12 percent, were intirely
within their lane; that is, their left tire was to the
right of the true pavement center line. Of this 12
percent, one half were encroaching within four inches of
this true pavement center line. After reflectorization
of the bridge abutments, however, 22 of the 50 vehicles,
or 44 percent, were entirely within their lane, a
significant improvement. Out of this 44 percent, only
three vehicles were within siz inches of the true pave
ment center line. It would seem, therefore, that the
reflectorizing of the bridge abutments greatly influenced
the positioning of a vehicle in its entrance to the
bridge.

CHAPTER VI
CONCLUSIONS AND RECOMMENDATION3
Conclusions
42
The following conclusions are drawn from the results
of phase one of this investigation:
1. By increasing the amount of lateral clearance
between the edge of the traffic lane to the
nearest point on a bridee abutment or curb from
one and one-half feet to four and one-half feet,
drivers of passenger vehicles encroach on the
center line less, and thereby position the
center of the vehicle closer to the center of
traffic lane.
2. With a lateral clearance of four and one-half
feet from the right edge of the traffic lane to
the nearest point on the bridge abutment or
curb, over 40 percent of the drivers of passen
ger vehicles drive closer to the pavement edge
than to the bridge center line.
3. With a lateral clearance of one and one-half
feet from the ri&ht edge of the traffic lane to
the nearest point on the bridge abutment or
curb, over 90 percent of the drivers of passen
~er vehicles drive closer to the bridge center 0
line than to the pavement edge.

43
The following conclusions are drawn from the results
of phase two of this investigation:
1. With the absence of any form of bridge
reflectorization or warning for night approaches
over 90 percent of the drivers of passenger
vehicles are either partially within the
opposing lane of traffic or are encroaching
within four inches of the bridge center line.
2. With the presence of a reflective liquid
painted on bridge abutments, over 40 percent of
the drivers of passenger vehicles keep their
vehicle entirely within its lane; that is, the
left tire of the vehicle does not cross the
bridge center line and into the opposing lane
of traffic.
Recommendations
The following recommendations are suggested as a
result of this investigation:
1. In a follow-up study of phase one, observations
could be taken at a point 200 feet before the
bridge entrance. These values could be compared
to the observations recorded for the same
vehicle as it entered the bridge to determine if
there was a shift in the vehicle path during the
approach to the bridge. Such a shift may or may

not be more obvious at a bridge with a narrow
offset.
44
2. In a study similar to phase two, a reflectori
zed center line could be painted to include the
approach to the bridge as well as the bridge
itself. A reflectorized center line may or may
not be better than reflectorizing the bridge
abutments.

( 1 )
(2)
(3)
(4)
(5)
(6)
(7)
(8)
(9)
(1 0)
( 11 )
45
LITERATURE CITED
f;Iolmes, E. H.; and Reymer, S. E. "New rl'echniq ues .J.n Traffic Behavior Studies.n P!lblic Roads, April 1940, U. S. Bureau of Public Roads.
Green, H. F. "Method of Recording Lateral Position of Vehicles." Proceedings, Yol. 26, 1946, Highway Research Board.
Taragin, A.; and Eckhardt, H. G. "Effect of Shoulders_on Speed and Lateral Position of Motor Vehicles. 11 Proceedings, Vol. 32, 1953, Highway Research Board.
Taragin, Asriel "Driver Behavior as Affected by Objects on Highway Shoulders." Public Roads, Yol. 28, No. 8, 1955. U. S. Bureau of Public ·Roads.
T"aragin, Asriel "Driver Behavior Related to Types and Widths of Shoulders on Two-Lane Roads." Public Roads, Yol.29, No. 9, 1957, u. s. Bureau of Public Roads.
Case, H. W.; Hulbert, S. F.; Mount, G. E.; and Brenner, R. "Effect of Roadside Structures on Lateral Placement of Motor Vehicles." Proceedings, Vol. 32, 1953, Highway Research Board.
Taragin, Asriel "Transverse Placement of Vehicles as Related to Cross Section Design. 11 Proc_~_edings, Vol. 23, 1943, Highway Research Board.
Taragin, Asriel ttEffect of Roadway Width on Vehicle Operations. n Public_ Roads, Vol. 24, No. 6, 1945. U. S. Bureau of Public_ Roaus.
Taragin, Asriel "The Effects on Driver 3ehavior of Center Lines on Two-Lane Roads." Proceedings, ·val. 27, 194 7, Highway Research Board. -
Thomas. I. L.; and Taylor, W. T. "Effect of Edge striping on Traffic Operations." Bulletin, No. 244, 1960, Highway Research Board.
Missouri State Highway Department "Some Effects of Pavement Edge Lines on Driver Behavior." Missouri Cooperative Research Program, Report 69-10, 1969.

( 1 2)
( 1 3)
(14)
(15)
(16)
(17)
Walker, W. :P. "Influence of Bridge Widths on T"ransverse :Position of Vehicles." Proceedings, Vol. 21, 1941, Highway Research Board.
Quimby, W. s. "Traffic Pat·t.erns at a Narrow Bridge" Proceedings, Vol. 27, 1947, Highway Research Board. -
46
Shelby, M.D.; and Tutt, P.R. "Vehicle Speed and Placement Survey." Bulletin, No. 170, 1958, Highway Research Boara.
Michaels, R. M.;and Lazar, L. W. "Perceptual and Field Factors Causing Lateral Displacement." Record, No. 25, 1963, Highway Research Board.
Normann, o. K. "Influence of Driver Characteristics on Passenger Car Operation. 11 :Proceedings, Vol. 24, 1944, Highway Research Board.
Griffiths, J. c. "Scientific Methods in Analysis of Sediments." McGraw-Hill Book Co., 1967, Chapters 16 and 18.

47
VITA
Warren Chip Woods was born on April 26, 1948, in
Kansas City, Missouri. He received his primary and
secondary education in Kansas City. He has received his
college education at the University of Missouri-Rolla,
receiving a Bachelor of Science degree in Civil
Engineering from the University of Missouri-Rolla in
December 1970. He has been enrolled in the Graduate
School of the University of Missouri-Rolla since January
1971 •