Embed Size (px)
Citation preview
A STUDY ON THE GROWTH OF FINANCIAL DERIVATIVES IN
INDIA
Dr.N. MOSES 1 PROF. B. PHANISWARA RAJU
2
1 Teaching Assistant, Department of Commerce, Rayalaseema University, Kurnool-518002, AP
2 HOD, Department of Commerce, Sri Krishnadevaraya University, Anantapuramu, AP
ABSTRACT
Integration of economies world over has brought in multiple growth in the volume of
international trade and business. This in turn has led to increase in the demand for international money
and need for innovative financial instruments both at national and global level. Changes in the interest
rates, exchange rates and equity prices in different financial markets led to increase in the volatility
and manifold increase in the financial risk to the individual as well as institutional investors. Adverse
changes in these variables have even threatened the very survival of the business world. To manage
these risks, new financial instruments have been developed in the financial market, which are
popularly known as Financial Derivatives. In this paper more emphasis is given the growth and
development of financial derivatives in India in terms of turnover and number of contracts traded in
derivatives segment of two premier stock exchanges in India namely NSE and BSE
Keywords: Financial Derivative, Index Future, Index Options, Stock Options, Stock Futures
INTRODUCTION
As the name indicates, derivatives are the imitative financial products, which derive their value from
some other assets called ‗underlying‘. These are believed to be the effective tools of risk-
management. The basic purpose of Financial Derivatives is to provide commitments to prices for
future dates for giving protection against adverse movements in the future prices of underlying assets
thereby reduce/manage/control the extent of financial risk. Derivatives allow investors to establish, at
low cost, return distributions that matchup with their levels of risk aversion. Derivative instruments
are different from Insurance, in that they cover general risks whereas the latter covers specific risks.
Financial Derivatives also provide an opportunity to earn profit for those persons who have higher
risk appetite. These instruments indeed facilitate to transfer the risk from those who wish to avoid it to
those who are willing to accept the same. In the stock market, derivative instruments have emerged as
the most important speculative vehicles and as risk management tools. These products are also used
by risk-taking investors for availing arbitrage and speculative opportunities. Such uses of derivative
products are believed to be helpful in building of a strong relationship between the cash and derivative
market segments leading to more efficient price-discovery in both the markets. It is also believed that
introduction of derivative products increase liquidity in the market. Derivative market segment is
dominated by informed institutional investors and therefore, this market segment is expected to be
more efficient in price discovery. Many researchers have proposed the hypothesis that derivative
markets lead the price movements in cash segment. Financial derivatives have become increasingly
popular and most commonly used in the world of finance. The rate of growth of derivatives is so
phenomenal all over the world that now it is called as the derivatives revolution.
The Security and Exchange Board of India (SEBI) permitted the trading on index futures on May 25,
2000. The trading of BSE Sensex futures commenced at Bombay Stock Exchange (BSE) on June 9,
2000 and on June 12, 2000 trading of Nifty-futures commenced at National Stock Exchange (NSE). In
the June 2001 index options and in July 2001 stock options were introduced. Futures on individual
INTERCONTINENTAL JOURNAL OF FINANCE RESEARCH REVIEWISSN:2321-0354 - ONLINE ISSN:2347-1654 - PRINT - IMPACT FACTOR:1.552VOLUME 4, ISSUE 2, FEBRUARY 2016
www.icmrr.org 54 [email protected]
stocks were introduced in November 2001. In fact, stock-futures were introduced in India well before
their introduction in the USA and many other developed markets. The volume of trading in derivative
segment, particularly in stock-futures, took momentum quit rapidly. At NSE trading volume of
derivatives has exceeded the volume of cash segment. According to an estimate recorded in the NSE
Fact Book, the present annual trading turnover of derivative market has reached . 55,606,453 Cr for
the year 2014-15.
Concept of Derivatives
The term ‗derivatives, refers to a broad class of financial instruments which mainly include options
and futures. These instruments derive their value from the price and other related variables of the
underlying asset. They do not have worth of their own and derive their value from the claim they give
to their owners to own some other financial assets or security. A simple example of derivative is
butter, which is derivative of milk. The price of butter depends upon price of milk, which in turn
depends upon the demand and supply of milk. The general definition of derivatives means to derive
something from something else. Some other meanings of word derivatives are:
A. derived function: the result of mathematical differentiation; the instantaneous change of one
quantity relative to another; df(x)/dx,
B. derivative instrument: a financial instrument whose value is based on another security,
(linguistics) a word that is derived from another word; "`electricity' is a derivative of
‗electric‘.
The asset underlying a derivative may be commodity or a financial asset. Derivatives are those
financial instruments that derive their value from the other assets. For example, the price of gold to be
delivered after two months will depend, among so many things, on the present and expected price of
this commodity.
Definition of Financial Derivatives
Section 2(ac) of Securities Contract Regulation Act (SCRA) 1956 defines Derivative as:
A. ―a security derived from a debt instrument, share, loan whether secured or unsecured, risk
instrument or contract for differences or any other form of security;
B. ―a contract which derives its value from the prices, or index of prices, of underlying
securities‖.
Review of Literature
Gulen and Mayhew1 (2000) examine stock market volatility before and after the introduction of
index futures trading in twenty-five countries, using various GARCH models They found that futures
trading is related to an increase in conditional volatility in the U.S. and Japan, but in nearly every
other country, no significant effect could be found. Joel Hasbrouck2 (2001) studied on intraday price
formation in US equity index markets. This study empirically investigated in the price discovery of
US equity index market in the new environment where the mirror of index with exchange traded
funds, electronically traded markets, small denomination futures contracts and a family of sector ETF
that break the index into nine components. Isakov and Morard3
(2001) in their paper have
investigated the performance of option strategies especially covered call strategy on Swiss exchange
during 1989-1996. They concluded that the use of option strategies consistently increase the
performance of stock portfolios even in the presence of transaction cost.
Gong-meng Chen, Michael Firth and Oliver Rui4 (2001) have examined the dynamic relationship
between returns, volume, and volatility for major nine national stock indexes for the period from 1973
INTERCONTINENTAL JOURNAL OF FINANCE RESEARCH REVIEWISSN:2321-0354 - ONLINE ISSN:2347-1654 - PRINT - IMPACT FACTOR:1.552VOLUME 4, ISSUE 2, FEBRUARY 2016
www.icmrr.org 55 [email protected]

to 2000. Their results show a positive correlation between trading volume and absolute value of stock
price change. The results of the study were found robust across all nine major stock markets, implying
that there are similar returns, trading volume, and volatility patterns across all markets under study.
Bhanupant5 (2001) investigated the dynamic relationship between stock index returns and trading
volume using the Augmented Dickey-Fuller (ADF), Linear and Non-Linear Granger Causality
hypothesis test on the National Stock Exchange (NSE) data. The period, when rolling settlement was
introduced, there found no evidence of linear causality in either direction. The shift in linear causal
relationship indicates that efficiency at NSE has improved with introduction of rolling settlement
mechanism.
Pilar and Rafael6 (2002), examined the effect of introduction of derivatives on the volatility and
trading volume of underlying Ibex-35 index by using GJR model and result that trading volume
increased significantly but conditional volatility decreased after introduction of derivatives. Varma7
(2002) examined the mispricing of volatility in the Indian index options market using closing Nifty
futures and options prices from June 2001 to February 2002. The result suggests that the Indian
market stands almost exactly half way between a naive market where the pricing completely ignores
the downside protection provided by options and a mature market where the pricing reflects a
reasonable theoretical model of the value of the downside protection. Nath Golaka C8 (2003), his
paper on ―Behaviour of Stock Market Volatility after Derivatives‖, examined the behaviour of
volatility in equity market in pre and post derivatives period in India using static and conditional
variance. It observed that for most of the stocks, the volatility had come down in the post derivative
period while for only few stocks in the sample, the volatility in the post derivatives has either stayed
more or less same or has increased marginally.
Mukherjee and Mishra’s9 (2006) study empirically investigated the usefulness and impact of two
non-price variables-open interest and trading volume from option market preceding the Nifty index in
underlying cash market in India. The empirical findings confirm that the open interest based
predictors are significant in predicting the spot price index in underlying cash market in both the
periods, just after the initiation of the index option in the market and in the later sub period. Gahlot
Ruchika, Datta Saroj and K. Kapil Sheeba10
(2010), have examined the impact of derivative
trading on stock market volatility by taking closing prices of S&P CNX Nifty as well as closing prices
of five derivative stocks and five non derivative stocks. The results showed mixed effect in case of 10
individual stocks.
Need for the study
From the review of literature, it can be observed that, researchers both in India and abroad
have carried out research studies covering various aspects of Financial Derivatives. However, the
present study is different from the above research studies in terms of both period and the sample
chosen. This study emphasis on the growth of financial derivatives in India, the NSE and the BSE are
selected as these exchanges are premier stock exchanges in India. The study is based mainly on
secondary data, which have been collected from websites of NSE, BSE and SEBI.
Methodology:-
To carry the study of the growth in Financial Derivatives in India the Cumulative Average Growth
Rate (CAGR) method has applied for the four products traded in both stock exchanges in India for
entire study period and also year to year growth rate also calculated. Financial Derivative market of
NSE is also compared with Cash market of NSE to know the detailed growth of NSE Financial
INTERCONTINENTAL JOURNAL OF FINANCE RESEARCH REVIEWISSN:2321-0354 - ONLINE ISSN:2347-1654 - PRINT - IMPACT FACTOR:1.552VOLUME 4, ISSUE 2, FEBRUARY 2016
www.icmrr.org 56 [email protected]

Derivative market. Instruments wise growth also carried out i.e. Index Futures, Index Options, Stock
Futures and Stock Options.
DATA ANALYSIS
Table 1 depicts the total number of derivative contracts traded and Table 2 depicts the turnover both
in NSE and BSE from 2000-01 to 2014-15. It could be observed that the total number of contracts
have registered 97.7 per cent growth during 2000-01 to 2014-15. From 1,67,315 contracts in 2000-01,
the number increased to 2,342,520,000 in 2014-15. As expected the growth rate in number of
contracts traded is more in NSE (103.07 per cent) compared to BSE (87.40 per cent). In terms of
absolute number of derivative contracts traded, BSE stands no-where near the NSE. While the number
in contracts traded BSE in 2000-01 was 76,735 representing a value of .1,653cr, which rose to
50,54,78,869 with a value of .20,362,741.25 cr only in 2014-15, that of the number in NSE rose from
90,850 representing a value of .2,265 cr in 2000-01 to 1,837,041,131 with a value of .55,606,453.39
cr in 2014-15. The number of derivatives contracts in these exchanges reached a milestone of
2,342,520,000 in 2015 since the inception of derivatives. These results are presented in Graph 1 and
Graph 2
Growth of Financial Derivatives in terms of No. of Contracts in NSE and BSE
Year NSE BSE Total
2000–01 90,580 (54.14) 76,735 (45.86) 1,67,315 (100)
2001-02 41,96,873 (97.55) 1,05,607 (2.45) 43,02,480 (100)
2002-03 1,67,68,909 (99.18) 1,38,037 (0.82) 1,69,06,946 (100)
2003-04 5,68,86,776 (99.33) 3,82,258 (0.67) 5,72,69,034 (100)
2004-05 7,70,17,185 (99.31) 5,31,719 (0.69) 7,75,48,904 (100)
2005-06 15,76,19,271 (99.9999) 203 (0.0001) 15,76,19,474 (100)
2006-07 21,68,83,573 (99.19) 17,81,670 (0.81) 21,86,65,243 (100)
2007-08 42,50,13,200 (98.28) 74,53,371 (1.72) 43,24,66,571 (100)
2008-09 65,73,90,497 (99.92) 4,96,502 (0.08) 65,78,86,999 (100)
2009-10 67,92,93,922 (99.999) 9028 (0.001) 679302950 (100)
2010-11 1,03,42,12,062 (99.999) 5,623(0.001) 1,03,42,17,685 (100)
2011-12 1,20,50,45,464 (97.40) 3,22,22,825 (2.60) 1,23,72,68,289 (100)
2012-13 1,13,14,67,418 (81.17) 26,24,59,311 (18.83) 1,39,39,26,729 (100)
2013-14 1,284,424,321 (80.97) 301,942,441 (19.03) 1,586,366,762 (100)
2014-15 1,837,041,131 (78.42) 505,478,869 (21.58) 2,342,520,000 (100)
CAGR 103.07 87.40 97.77
INTERCONTINENTAL JOURNAL OF FINANCE RESEARCH REVIEWISSN:2321-0354 - ONLINE ISSN:2347-1654 - PRINT - IMPACT FACTOR:1.552VOLUME 4, ISSUE 2, FEBRUARY 2016
www.icmrr.org 57 [email protected]
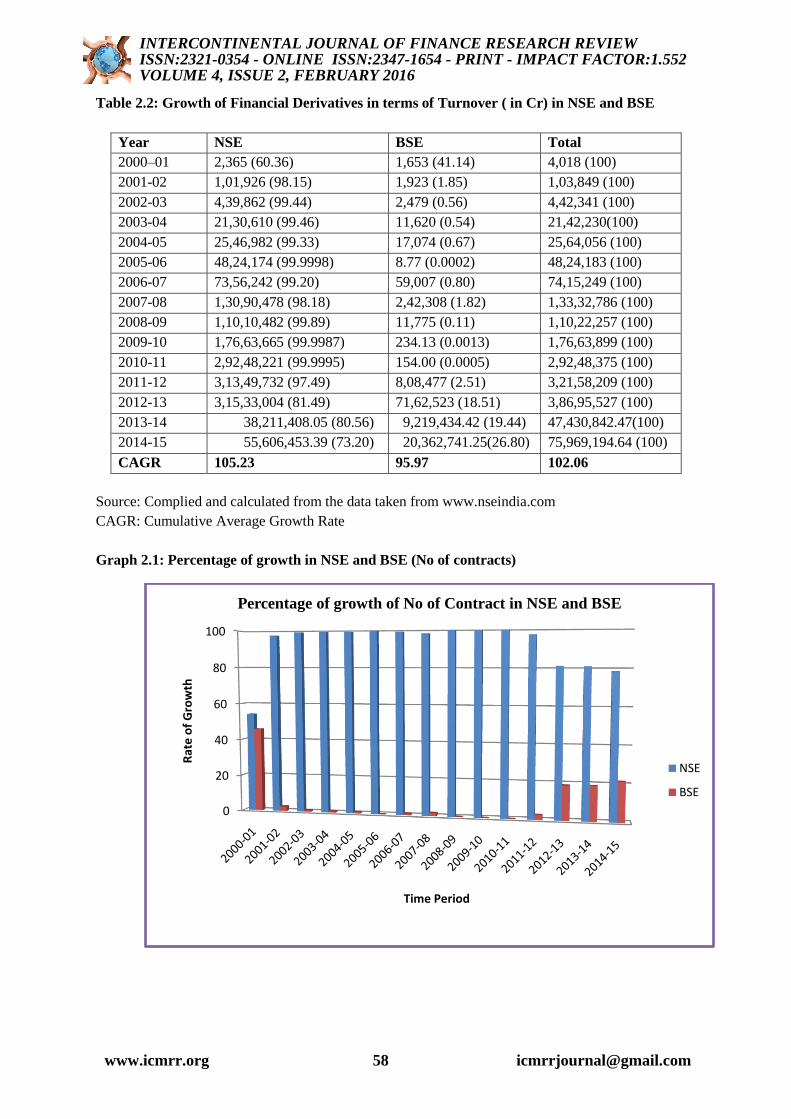
Table 2.2: Growth of Financial Derivatives in terms of Turnover ( in Cr) in NSE and BSE
Year NSE BSE Total
2000–01 2,365 (60.36) 1,653 (41.14) 4,018 (100)
2001-02 1,01,926 (98.15) 1,923 (1.85) 1,03,849 (100)
2002-03 4,39,862 (99.44) 2,479 (0.56) 4,42,341 (100)
2003-04 21,30,610 (99.46) 11,620 (0.54) 21,42,230(100)
2004-05 25,46,982 (99.33) 17,074 (0.67) 25,64,056 (100)
2005-06 48,24,174 (99.9998) 8.77 (0.0002) 48,24,183 (100)
2006-07 73,56,242 (99.20) 59,007 (0.80) 74,15,249 (100)
2007-08 1,30,90,478 (98.18) 2,42,308 (1.82) 1,33,32,786 (100)
2008-09 1,10,10,482 (99.89) 11,775 (0.11) 1,10,22,257 (100)
2009-10 1,76,63,665 (99.9987) 234.13 (0.0013) 1,76,63,899 (100)
2010-11 2,92,48,221 (99.9995) 154.00 (0.0005) 2,92,48,375 (100)
2011-12 3,13,49,732 (97.49) 8,08,477 (2.51) 3,21,58,209 (100)
2012-13 3,15,33,004 (81.49) 71,62,523 (18.51) 3,86,95,527 (100)
2013-14 38,211,408.05 (80.56) 9,219,434.42 (19.44) 47,430,842.47(100)
2014-15 55,606,453.39 (73.20) 20,362,741.25(26.80) 75,969,194.64 (100)
CAGR 105.23 95.97 102.06
Source: Complied and calculated from the data taken from www.nseindia.com
CAGR: Cumulative Average Growth Rate
Graph 2.1: Percentage of growth in NSE and BSE (No of contracts)
0
20
40
60
80
100
Rat
e o
f G
row
th
Time Period
Percentage of growth of No of Contract in NSE and BSE
NSE
BSE
INTERCONTINENTAL JOURNAL OF FINANCE RESEARCH REVIEWISSN:2321-0354 - ONLINE ISSN:2347-1654 - PRINT - IMPACT FACTOR:1.552VOLUME 4, ISSUE 2, FEBRUARY 2016
www.icmrr.org 58 [email protected]
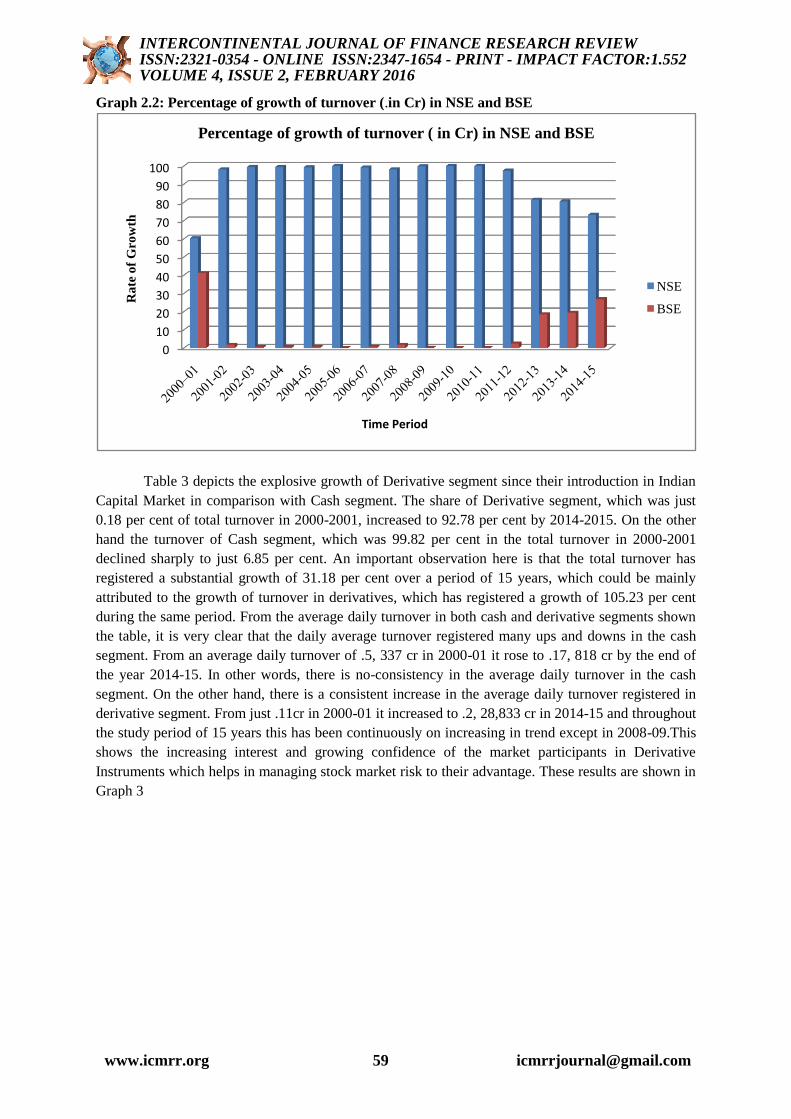
Graph 2.2: Percentage of growth of turnover (.in Cr) in NSE and BSE
Table 3 depicts the explosive growth of Derivative segment since their introduction in Indian
Capital Market in comparison with Cash segment. The share of Derivative segment, which was just
0.18 per cent of total turnover in 2000-2001, increased to 92.78 per cent by 2014-2015. On the other
hand the turnover of Cash segment, which was 99.82 per cent in the total turnover in 2000-2001
declined sharply to just 6.85 per cent. An important observation here is that the total turnover has
registered a substantial growth of 31.18 per cent over a period of 15 years, which could be mainly
attributed to the growth of turnover in derivatives, which has registered a growth of 105.23 per cent
during the same period. From the average daily turnover in both cash and derivative segments shown
the table, it is very clear that the daily average turnover registered many ups and downs in the cash
segment. From an average daily turnover of .5, 337 cr in 2000-01 it rose to .17, 818 cr by the end of
the year 2014-15. In other words, there is no-consistency in the average daily turnover in the cash
segment. On the other hand, there is a consistent increase in the average daily turnover registered in
derivative segment. From just .11cr in 2000-01 it increased to .2, 28,833 cr in 2014-15 and throughout
the study period of 15 years this has been continuously on increasing in trend except in 2008-09.This
shows the increasing interest and growing confidence of the market participants in Derivative
Instruments which helps in managing stock market risk to their advantage. These results are shown in
Graph 3
0
10
20
30
40
50
60
70
80
90
100
Ra
te o
f G
row
th
Time Period
Percentage of growth of turnover ( in Cr) in NSE and BSE
NSE
BSE
INTERCONTINENTAL JOURNAL OF FINANCE RESEARCH REVIEWISSN:2321-0354 - ONLINE ISSN:2347-1654 - PRINT - IMPACT FACTOR:1.552VOLUME 4, ISSUE 2, FEBRUARY 2016
www.icmrr.org 59 [email protected]
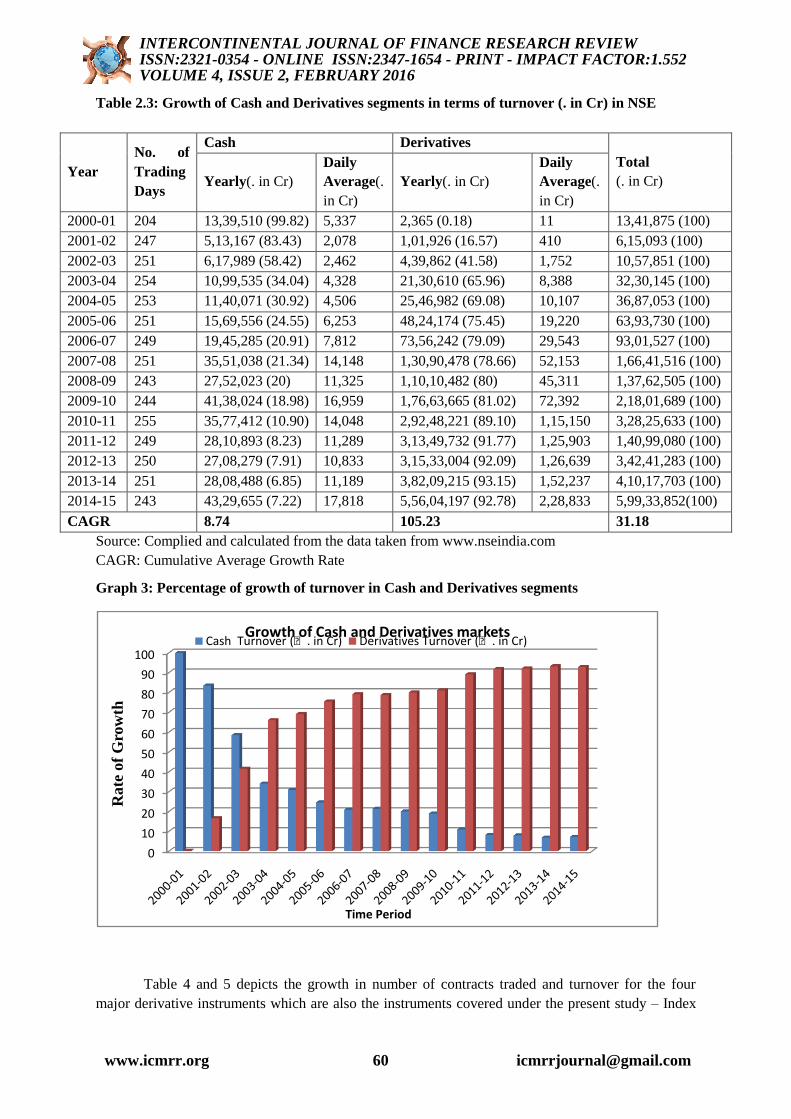
Table 2.3: Growth of Cash and Derivatives segments in terms of turnover (. in Cr) in NSE
Year
No. of
Trading
Days
Cash Derivatives
Total
(. in Cr) Yearly(. in Cr)
Daily
Average(.
in Cr)
Yearly(. in Cr)
Daily
Average(.
in Cr)
2000-01 204 13,39,510 (99.82) 5,337 2,365 (0.18) 11 13,41,875 (100)
2001-02 247 5,13,167 (83.43) 2,078 1,01,926 (16.57) 410 6,15,093 (100)
2002-03 251 6,17,989 (58.42) 2,462 4,39,862 (41.58) 1,752 10,57,851 (100)
2003-04 254 10,99,535 (34.04) 4,328 21,30,610 (65.96) 8,388 32,30,145 (100)
2004-05 253 11,40,071 (30.92) 4,506 25,46,982 (69.08) 10,107 36,87,053 (100)
2005-06 251 15,69,556 (24.55) 6,253 48,24,174 (75.45) 19,220 63,93,730 (100)
2006-07 249 19,45,285 (20.91) 7,812 73,56,242 (79.09) 29,543 93,01,527 (100)
2007-08 251 35,51,038 (21.34) 14,148 1,30,90,478 (78.66) 52,153 1,66,41,516 (100)
2008-09 243 27,52,023 (20) 11,325 1,10,10,482 (80) 45,311 1,37,62,505 (100)
2009-10 244 41,38,024 (18.98) 16,959 1,76,63,665 (81.02) 72,392 2,18,01,689 (100)
2010-11 255 35,77,412 (10.90) 14,048 2,92,48,221 (89.10) 1,15,150 3,28,25,633 (100)
2011-12 249 28,10,893 (8.23) 11,289 3,13,49,732 (91.77) 1,25,903 1,40,99,080 (100)
2012-13 250 27,08,279 (7.91) 10,833 3,15,33,004 (92.09) 1,26,639 3,42,41,283 (100)
2013-14 251 28,08,488 (6.85) 11,189 3,82,09,215 (93.15) 1,52,237 4,10,17,703 (100)
2014-15 243 43,29,655 (7.22) 17,818 5,56,04,197 (92.78) 2,28,833 5,99,33,852(100)
CAGR 8.74 105.23 31.18
Source: Complied and calculated from the data taken from www.nseindia.com
CAGR: Cumulative Average Growth Rate
Graph 3: Percentage of growth of turnover in Cash and Derivatives segments
Table 4 and 5 depicts the growth in number of contracts traded and turnover for the four
major derivative instruments which are also the instruments covered under the present study – Index
0
10
20
30
40
50
60
70
80
90
100
Rate
of
Gro
wth
Time Period
Growth of Cash and Derivatives marketsCash Turnover (₹. in Cr) Derivatives Turnover (₹. in Cr)
INTERCONTINENTAL JOURNAL OF FINANCE RESEARCH REVIEWISSN:2321-0354 - ONLINE ISSN:2347-1654 - PRINT - IMPACT FACTOR:1.552VOLUME 4, ISSUE 2, FEBRUARY 2016
www.icmrr.org 60 [email protected]
Futures, Stock Futures, Index Options and Stock Options. Instrument-wise, it is observed that Index
options and Stock Futures have registered the highest year-over-year growth rate in 2014-15, in terms
of number of contracts and turnover. The growth rate in this instrument was 48.47 per cent and 67.53
per cent respectively. The lowest growth rate was registered in Stock Options and Index Futures. In
fact, the growth rate in this instrument started registering negative trend in terms of number of
contracts traded from 2009-10 in which year the growth rate was -15.26 per cent and by the end of the
study period it has been registering positive growth rate 22.84 per cent. In terms of turnover, the same
phenomenon has repeated as in the case of this Financial Derivative instrument. Futures being binding
contracts and especially Index futures, which involve huge investments such a decline and the
negative growth rate, are quite understandable.
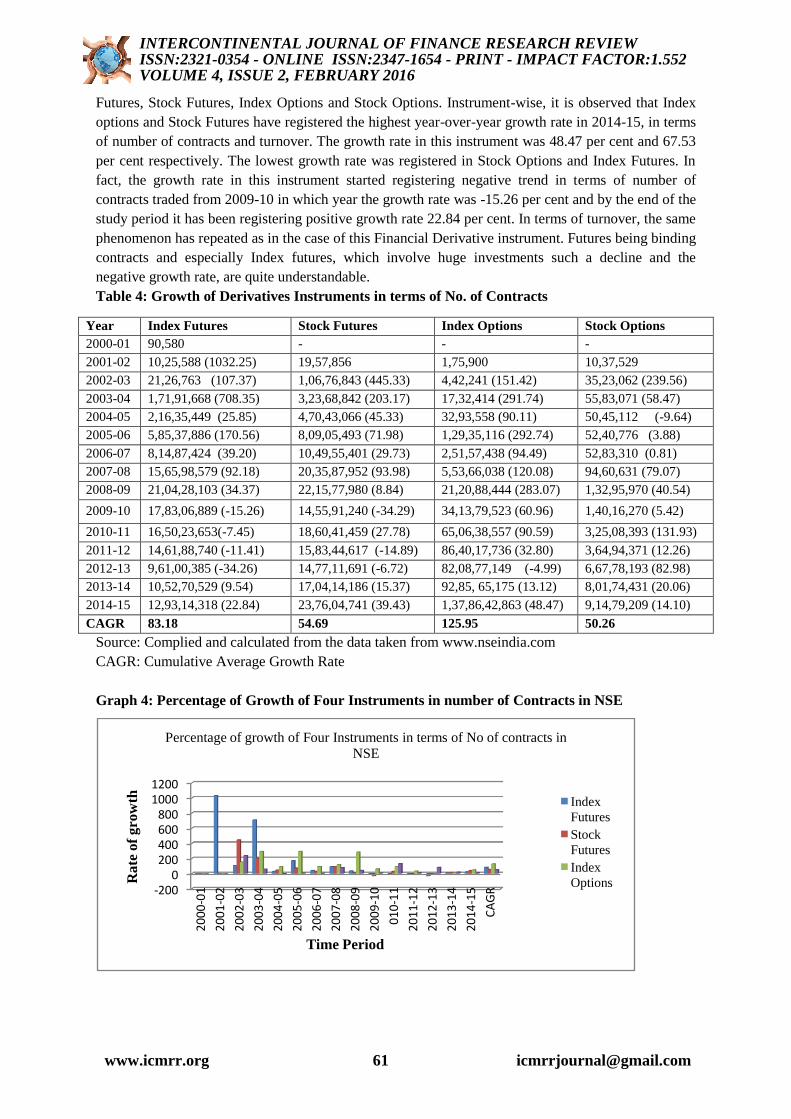
Table 4: Growth of Derivatives Instruments in terms of No. of Contracts
Year Index Futures Stock Futures Index Options Stock Options
2000-01 90,580 - - -
2001-02 10,25,588 (1032.25) 19,57,856 1,75,900 10,37,529
2002-03 21,26,763 (107.37) 1,06,76,843 (445.33) 4,42,241 (151.42) 35,23,062 (239.56)
2003-04 1,71,91,668 (708.35) 3,23,68,842 (203.17) 17,32,414 (291.74) 55,83,071 (58.47)
2004-05 2,16,35,449 (25.85) 4,70,43,066 (45.33) 32,93,558 (90.11) 50,45,112 (-9.64)
2005-06 5,85,37,886 (170.56) 8,09,05,493 (71.98) 1,29,35,116 (292.74) 52,40,776 (3.88)
2006-07 8,14,87,424 (39.20) 10,49,55,401 (29.73) 2,51,57,438 (94.49) 52,83,310 (0.81)
2007-08 15,65,98,579 (92.18) 20,35,87,952 (93.98) 5,53,66,038 (120.08) 94,60,631 (79.07)
2008-09 21,04,28,103 (34.37) 22,15,77,980 (8.84) 21,20,88,444 (283.07) 1,32,95,970 (40.54)
2009-10 17,83,06,889 (-15.26) 14,55,91,240 (-34.29) 34,13,79,523 (60.96) 1,40,16,270 (5.42)
2010-11 16,50,23,653(-7.45) 18,60,41,459 (27.78) 65,06,38,557 (90.59) 3,25,08,393 (131.93)
2011-12 14,61,88,740 (-11.41) 15,83,44,617 (-14.89) 86,40,17,736 (32.80) 3,64,94,371 (12.26)
2012-13 9,61,00,385 (-34.26) 14,77,11,691 (-6.72) 82,08,77,149 (-4.99) 6,67,78,193 (82.98)
2013-14 10,52,70,529 (9.54) 17,04,14,186 (15.37) 92,85, 65,175 (13.12) 8,01,74,431 (20.06)
2014-15 12,93,14,318 (22.84) 23,76,04,741 (39.43) 1,37,86,42,863 (48.47) 9,14,79,209 (14.10)
CAGR 83.18 54.69 125.95 50.26
Source: Complied and calculated from the data taken from www.nseindia.com
CAGR: Cumulative Average Growth Rate
Graph 4: Percentage of Growth of Four Instruments in number of Contracts in NSE
-2000
200400600800
10001200
20
00
-01
20
01
-02
20
02
-03
20
03
-04
20
04
-05
20
05
-06
20
06
-07
20
07
-08
20
08
-09
20
09
-10
01
0-1
1
20
11
-12
20
12
-13
20
13
-14
20
14
-15
CA
GR
Ra
te o
f g
row
th
Time Period
Percentage of growth of Four Instruments in terms of No of contracts in
NSE
Index
Futures
Stock
Futures
Index
Options
INTERCONTINENTAL JOURNAL OF FINANCE RESEARCH REVIEWISSN:2321-0354 - ONLINE ISSN:2347-1654 - PRINT - IMPACT FACTOR:1.552VOLUME 4, ISSUE 2, FEBRUARY 2016
www.icmrr.org 61 [email protected]
Category-wise, the growth in Index Futures and Index options was higher than the growth in
Stock Futures and Stock Options. While the growth rate in Index Futures and Index Options was
83.18 and 125.95 and 86.21 and 132.25 in terms of number of contracts traded and turnover, the
growth rate in Stock Futures and Stock Options was 54.69 and 50.26 and 58.71 and 55.71 in terms of
number of contracts traded and turnover respectively. Thus, the trading activity and frequency was
found to be more in options than in futures.
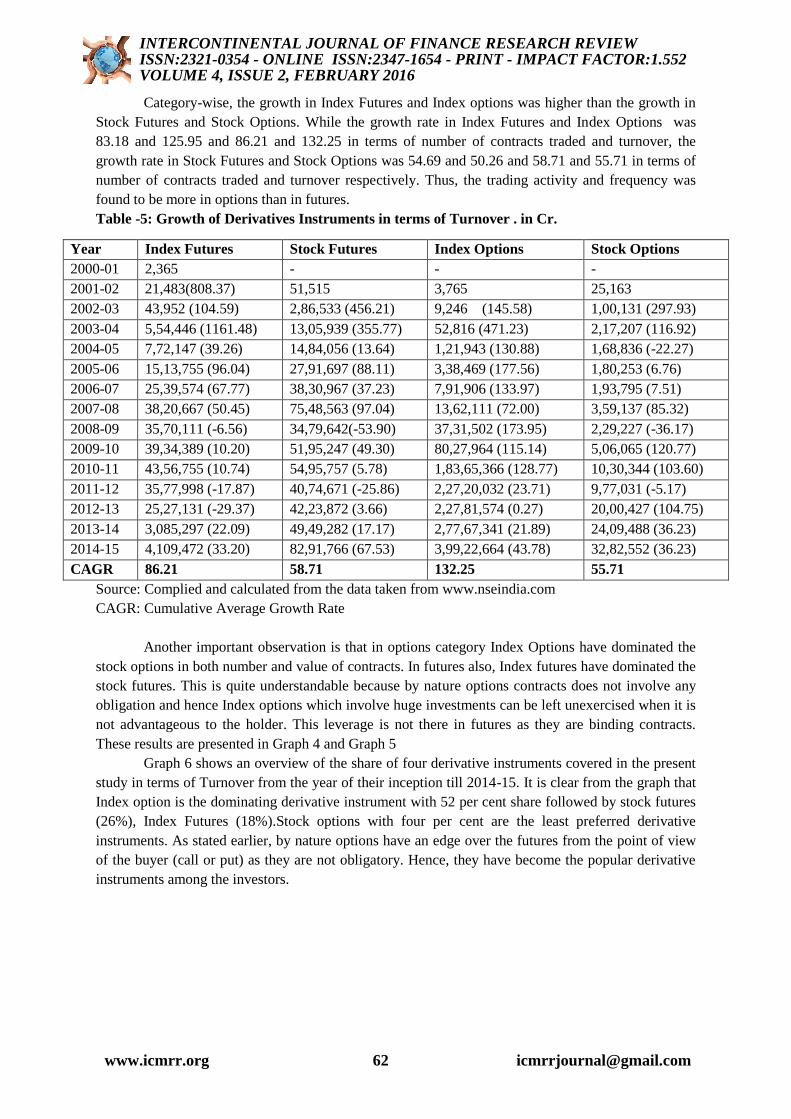
Table -5: Growth of Derivatives Instruments in terms of Turnover . in Cr.
Year Index Futures Stock Futures Index Options Stock Options
2000-01 2,365 - - -
2001-02 21,483(808.37) 51,515 3,765 25,163
2002-03 43,952 (104.59) 2,86,533 (456.21) 9,246 (145.58) 1,00,131 (297.93)
2003-04 5,54,446 (1161.48) 13,05,939 (355.77) 52,816 (471.23) 2,17,207 (116.92)
2004-05 7,72,147 (39.26) 14,84,056 (13.64) 1,21,943 (130.88) 1,68,836 (-22.27)
2005-06 15,13,755 (96.04) 27,91,697 (88.11) 3,38,469 (177.56) 1,80,253 (6.76)
2006-07 25,39,574 (67.77) 38,30,967 (37.23) 7,91,906 (133.97) 1,93,795 (7.51)
2007-08 38,20,667 (50.45) 75,48,563 (97.04) 13,62,111 (72.00) 3,59,137 (85.32)
2008-09 35,70,111 (-6.56) 34,79,642(-53.90) 37,31,502 (173.95) 2,29,227 (-36.17)
2009-10 39,34,389 (10.20) 51,95,247 (49.30) 80,27,964 (115.14) 5,06,065 (120.77)
2010-11 43,56,755 (10.74) 54,95,757 (5.78) 1,83,65,366 (128.77) 10,30,344 (103.60)
2011-12 35,77,998 (-17.87) 40,74,671 (-25.86) 2,27,20,032 (23.71) 9,77,031 (-5.17)
2012-13 25,27,131 (-29.37) 42,23,872 (3.66) 2,27,81,574 (0.27) 20,00,427 (104.75)
2013-14 3,085,297 (22.09) 49,49,282 (17.17) 2,77,67,341 (21.89) 24,09,488 (36.23)
2014-15 4,109,472 (33.20) 82,91,766 (67.53) 3,99,22,664 (43.78) 32,82,552 (36.23)
CAGR 86.21 58.71 132.25 55.71
Source: Complied and calculated from the data taken from www.nseindia.com
CAGR: Cumulative Average Growth Rate
Another important observation is that in options category Index Options have dominated the
stock options in both number and value of contracts. In futures also, Index futures have dominated the
stock futures. This is quite understandable because by nature options contracts does not involve any
obligation and hence Index options which involve huge investments can be left unexercised when it is
not advantageous to the holder. This leverage is not there in futures as they are binding contracts.
These results are presented in Graph 4 and Graph 5
Graph 6 shows an overview of the share of four derivative instruments covered in the present
study in terms of Turnover from the year of their inception till 2014-15. It is clear from the graph that
Index option is the dominating derivative instrument with 52 per cent share followed by stock futures
(26%), Index Futures (18%).Stock options with four per cent are the least preferred derivative
instruments. As stated earlier, by nature options have an edge over the futures from the point of view
of the buyer (call or put) as they are not obligatory. Hence, they have become the popular derivative
instruments among the investors.
INTERCONTINENTAL JOURNAL OF FINANCE RESEARCH REVIEWISSN:2321-0354 - ONLINE ISSN:2347-1654 - PRINT - IMPACT FACTOR:1.552VOLUME 4, ISSUE 2, FEBRUARY 2016
www.icmrr.org 62 [email protected]

Graph 5: Percentage of Growth of Four Instruments in terms of Turnover (. in Cr)
Graph 6: Share of Derivatives Instruments in Turnover (. in Cr.) over the years from 2000-01 to
2012-13
.
Source:compiledfrom the data taken from www.nseindia.com
THE MAJOR FINDINGS
It is observed that though the BSE and the NSE started derivative trading during the same
year i.e. 2000-01, NSE has over taken BSE in terms of number of contracts traded and the turnover.
-200
0
200
400
600
800
1000
12002
00
0-0
1
20
01
-02
20
02
-03
20
03
-04
20
04
-05
20
05
-06
20
06
-07
20
07
-08
20
08
-09
20
09
-10
01
0-1
1
20
11
-12
20
12
-13
20
13
-14
20
14
-15
CA
GR
Rat
e o
f gr
ow
th
Time Period
Percentage of growth of Four Instruments in terms of No of
contracts in NSE
Index Futures
Stock Futures
Index Options
Stock Options
Index Futures14%
Stock Futures22%
Index Options59%
Stock Options5%
Share of Derivatives Instruments in Turnover (₹ in Cr.) over the years
from 2000-01 to 2014-15
INTERCONTINENTAL JOURNAL OF FINANCE RESEARCH REVIEWISSN:2321-0354 - ONLINE ISSN:2347-1654 - PRINT - IMPACT FACTOR:1.552VOLUME 4, ISSUE 2, FEBRUARY 2016
www.icmrr.org 63 [email protected]
The number of contracts registered in BSE in 2000-01 was 76,735 with a value of .1,653 cr and in
NSE, it was 90,580 with a value of 2,365 cr respectively. In the initial year of introduction of
derivatives, BSE had 45.86 per cent and NSE had 54.14 per cent share. By the year 2014-15, NSE
captured more than 78 per cent share of total derivative market both in terms of absolute number of
derivative contracts traded and volume. BSE with a volume of 505,478,869 contracts stands no-where
near the NSE‘s volume of 1,837,041,131 contracts. The Derivative segment of NSE registered
explosive growth since their inception compared with the Cash market. The share of Derivative
segment, which was just 0.18 per cent in NSE‘s total turnover in 2000-01 increased to 92.78 per cent
by 2014-15. It is also observed that there is no consistency in the average daily turnover in cash
segment. But, there is a consistent increase in the average daily turnover registered in derivative
segment. This shows that there is an increasing interest and growing confidence of the market
participants in Derivative instruments, which helps in managing stock market risk to their advantage.
This study revealed that Index Options dominate the derivative markets in India with 132.25 per cent
of total turnover from 2000-01 to 2014-15 followed by Index Futures. The CAGR of Index Options
registered 125.95 per cent and 132.25 per cent in terms of number of contracts and turnover
respectively. An important observation is that in the Options category, Index Options have dominated
the Stock Options both in number and value of contracts. In Futures also, Index futures have
dominated the stock Futures. This is quite understandable because by nature option contracts does not
involve any obligation and hence Index Options, which involve huge investments can be left
unexercised when it is not advantageous to the holder.
CONCLUSION
On the basis of above discussion and data analysis, it is clear that the Financial Derivatives are rapidly
growing financial instruments. The comparison between the turnover, traded quantity of Financial
Derivatives market and Cash market also have also shown the tremendous growth in these
instruments. In other word, it is clearly evident that the Financial Derivative instruments have gained
the interests of public within short period as no instrument in financial world gained so far.
Reference:-
1. Gulen, H. and Mayhew, S. (2000): ―Stock Index Futures Trading and Volatility in International
Equity Markets,‖ The Journal of Futures Markets, Vol. 20, No. 7, 661-685.
2. Joel Hasbrouck (2001), Intraday price formation in US &equity index markets, Working Papers
Series, ssrn.com, pp.1-28.
3. Isakov, D. and Morard, B., (2001), Improving portfolio performance with option strategies:
Evidence from Switzerland, European Financial Management, Vol 7, no 1, March 2001, pp. 73-
91
4. Gong-Meng Chen et.al (2001), ―The Dynamic Relation between Stock Returns, Trading Volume
and Volatility‖, The Financial Review, 38 Pp: 153 - 1174.
5. Bhanupant (2001), "Testing Dynamic Relationship between Returns and Trading Volume on the
National Stock Exchange", http://www.nseindia.com/ content/research/res_paper_final226.pdf
6. Pilar Corredor and Santamaria Rafael (2002), ―Does derivatives trading destabilize the
underlying assets? Evidence from the Spanish stock market‖, Applied Economics Letters, 9, 107-
110
7. Varma, J.R. (2002), ―Mispricing of volatility in the Indian Index options market‖, Working paper
No.2002-04-01, IIM-A, Ahmedabad.
8. Golaka C Nath (2003), ―Behaviour of Stock Market Volatility after Derivatives‖, NSE Working
Paper, http://www.nse-india.com/content/press/ nov2003a.pdf
INTERCONTINENTAL JOURNAL OF FINANCE RESEARCH REVIEWISSN:2321-0354 - ONLINE ISSN:2347-1654 - PRINT - IMPACT FACTOR:1.552VOLUME 4, ISSUE 2, FEBRUARY 2016
www.icmrr.org 64 [email protected]
9. Mukherjee, K.N and Mishra, R.K. (2006), ―Lead-Lag Relationship between Equities and Stock
Index Futures Market and its Variation around Information Release: Empirical Evidence from
India‖. www.nseindia.com
10. Ruchika Gahlot, Saroj K. Datta and Sheeba Kapil (2010), Impact of Derivative Trading On Stock
Market Volatility in India: A Study of S&P CNX Nifty, Eurasian Journal of Business and
Economics 2010, 3 (6), 139-149.
INTERCONTINENTAL JOURNAL OF FINANCE RESEARCH REVIEWISSN:2321-0354 - ONLINE ISSN:2347-1654 - PRINT - IMPACT FACTOR:1.552VOLUME 4, ISSUE 2, FEBRUARY 2016
www.icmrr.org 65 [email protected]