Embed Size (px)
Citation preview
A STUDY ON FINANCIAL PERFORMANCE ANALYSIS AT UNITED
INDIA INSURANCE COMPANY LIMITED
Dr G.VENKATESAN 1 Dr R.RAMESH
2
1Professor & Head, Department of Management Studies, Jayalakshmi Institute of Technology
Thoppur, Dharmapuri (DT). 2Assistant Professor, Department of Management Studies, Jayalakshmi Institute of Technology
Thoppur, Dharmapuri (DT).
ABSTRACT
Every kind of business is exposed to various kinds of risks at all times. Some risks can be prevented
while other cannot be prevented. The loss that is suffered by the occurrence of such risks can be
reduced through insurance. Wherever there is uncertainty there is risk and when risk occurs, there is
loss of property which affects economic development of the country. Such risks must therefore be
shared by those who are exposed to them by starting an insurance fund. This is the basis of insurance.
Insurance is therefore, an agreement between insurer and insured in consideration of premium
received from the insured, subject to limit of a specified amount suffered by specified perils insured
against during the stated period.
Key words: Insurance, Finance, Ratio Analysis and Risk.
Introduction about World Insurance Scenario
In 2005, worldwide insurance premiums amounted to USD 3426 bn of this, USD1974 bn
accounted for life and USD 1452 bn to non life insurance. In real terms, total premium volume grew
by 2.5 per cent while life premiums increased by 3.9 per cent, nonlife premiums increased by 0.6 per
cent. Profitability in life insurance improved compared to 2004. Non life business remained profitable
despite huge hurricane losses in the U.S. High economic growth, moderate inflation, low interest rates
and favorable stock markets in Europe, Japan and in the emerging markets contributed to growth in
the insurance industry. Profitability of life business has continued to improve in many countries due to
lower costs. In the year 2004-05, non life business growth slowed down due to decline in premium
rates in commercial lines such as aviation and marine, which had experienced sharp increases in rates
between 2001 and 2004. Premiums in emerging markets like India continued to outgrow than in
mature insurance markets. Profitability in non life business remained sound with favorable
underwriting experience. Despite the huge catastrophe losses, capital in the industry continued to rise
in line with higher exposure.
This development was supported by new capital flowing into the markets. Role of Insurance
in International Economy Insurance Plays an Important role not only in national economy but also in
international economy. Marine cargo insurance, for example provides risks coverage for shippers and
importers and the banks which finance international trade. This role becomes all the more important
in the context of an active government policy to encourage exports. Indian insurers operate in more
than 30 countries through agencies, branches and subsidiary/associate companies. These operations
earn foreign exchange and represent invisible exports. The UK insurers for example earn more
premium overseas than from their domestic operations. The Indian insurers have also an international
presence through an active insurance exchange program within surfers in over 100 countries. Another
INTERCONTINENTAL JOURNAL OF FINANCE RESEARCH REVIEWISSN:2321-0354 - ONLINE ISSN:2347-1654 - PRINT - IMPACT FACTOR:0.720VOLUME 3, ISSUE 12, DECEMBER 2015
www.icmrr.org 49 [email protected]
WW
W.IC
MRR.ORG

dimension of international insurance found in regional cooperation is reinsurance. Asian Re-insurance
Corporation (of which India in a member) with headquarters in Bangkok Thailand is one example.
Large industrial an infrastructural projects setup in India through joint ventures or otherwise, with
overseas finance need tailor made specialized insurance covers.
Indian Insurance Industry
With a large population and untapped market, insurance happens to be a big opportunity in
India. The insurance business (measured in the context of first year premium) grew at 47.93 per cent
in 2005-06, surpassing the growth of 32.49 per cent achieved in 204-05. However insurance
penetration or premium volume as a share of country‟s GDP, for the year 2005 stood at 2.5 per cent
for life insurance and 0.62 percent for non life insurance. Saturation of markets in many developed
economies has made the Indian market even more attractive for global insurance majors. The
insurance market has witnessed dynamic changes which induces presence of a fair number of insurers
in both life and non-life segment. Consumer awareness has improved. Competition has brought more
products and better customer servicing. It has had a positive impact on the economy in terms of
income generation and employment growth.
Challenges facing insurance industry there are a number of threats that inhibit the growth and
development of insurance business in India. They affect the marketing action and cause deterioration
in growth and profitability. We shall look at some of these challenges summarily one bygone.
Managing customer grievances the insurers will have to face an acute problem of the redressed of the
consumer grievances for deficiency in products and services. Increasing awareness will bring a
number of legal cases filled by the consumers against insurers likely to increase substantially in future
(Satyanarayan, 2006).
Life Insurance
Life insurance is different from other insurance business in the sense that, here, the subject
matter of insurance is life of human being. The insurer will pay the fixed amount of insurance at the
time of death or at the expiry of certain period, whichever is earlier. At present, life insurance enjoys
maximum scope because life is the most important property of the society or an individual. Each and
every person requires the risk the insured the insurer insurance. This insurance provides protection to
the family at a premature death or gives adequate amount at the old edge when the earning capacity is
reduced. Life insurance is not only a protection but is a sort of investment because a certain sum is
returned to the insured at the expiry of a period or to his nominee at his death (Garg, 2004).
General Insurance
The general insurance includes property insurance, liability insurance and other forms of
insurance. Fire and marine insurance are strictly called property insurance. Motor, theft, fidelity, and
Machine insurance represent liability insurance to a certain extent (Garg, 2004). General insurance
therefore, includes marine insurance, providing protection against loss of marine risks, fire insurance
which covers risks of five and miscellaneous insurance.
Social Insurance
The social insurance is to provide protection to the weaker section of the society who is
unable to pay premium for adequate insurance. Pension plans, disability benefits, unemployment
benefits, sickness insurance and industrial insurance are the various forms of social insurance. With
INTERCONTINENTAL JOURNAL OF FINANCE RESEARCH REVIEWISSN:2321-0354 - ONLINE ISSN:2347-1654 - PRINT - IMPACT FACTOR:0.720VOLUME 3, ISSUE 12, DECEMBER 2015
www.icmrr.org 50 [email protected]
WW
W.IC
MRR.ORG

the insurance of the socialist ideas, the social insurance is an obligation duty of the nation. The
government of a country must provide social insurance to its masses (Garg, 2004).
List of General Insurance Companies in India
Public Sector
National Insurance Company Limited (Calcutta), New India Assurance Company Limited
(Bombay), Oriental Insurance Company Limited (Delhi), United India Insurance company Limited
(Madras), Export Credit Guarantee Corporation Limited, Agriculture Insurance Company of India
Limited.
Private sector
Bajaj Alliance General Insurance Company Limited, ICICI Lombard General Insurance
Company limited, Reliance General Insurance Company Limited, IFFCO-Tokio General Insurance
Company Limited, Royal Sundaram Alliance Insurance Company Limited, Tata AIG General
Insurance Company Limited, Cholamandalam General Insurance Company Limited, HDFC Chubb
General Insurance Company Limited, Star Health and Allied Insurance Company Limited, Apollo
DKV Insurance Company Limited, Future Generally India Insurance Company Limited, Universal
Sampo General Insurance Company Limited, Shriram General Insurance Company Limited,
BhartiAxa General Insurance Company Limited, Raheja QBE General Insurance Company Limited.
Financial Analysis
Analysis of financial statement means such a treatment of the information contained in the
two statements as to afford a full diagnosis of the profitability and financial position of the firm
concerned. Broadly, the term financial analysis is applied to almost any kind of detailed enquiry into
financial data.
Financial statement analysis is largely a study of relationship among the various financial
factors in a business as disclosed by a single set of statements, and a study of the trend of these factors
as shown in a series of statements. The financial statement provides a summary of the all financial
accounts of a business enterprise, showing the results of operations during a certain period.
Definitions
According to Solomon, financial management is concerned with the efficient use of an
important economic resource, namely, capital funds.
The term finance can be defined ''as the management of plans of money through an
organization, whether it can be a corporation, bank or government agency etc finance is concerned
itself vital the actual flow of money as well as any claims against money".
Finance Functions
The functions of raising funds, investing them in assets and distributing returns, earnings from
assets to Policyholders are respectively known as financing decision, investment decision and
dividend decision.
Thus finance function includes:- Long term asset mix or investment decision, Capital mix or
financing decision, Profit allocation or dividend decision, Short term asset mix or liquidity
decision.
INTERCONTINENTAL JOURNAL OF FINANCE RESEARCH REVIEWISSN:2321-0354 - ONLINE ISSN:2347-1654 - PRINT - IMPACT FACTOR:0.720VOLUME 3, ISSUE 12, DECEMBER 2015
www.icmrr.org 51 [email protected]
WW
W.IC
MRR.ORG

Objectives of the Study
To study and identify the existing financial position of the company
To ascertain the liquidity position of the company.
To assess the financial stability of the firm by analyzing the comparative financial statements.
To study the profitability position of the company by analyzing the various factors
influencing the profitability.
To study and assess the profitability and solvency position of the company using ratios.
Scope of the Study
The study will provide an insight into the different aspect of working of the organization
especially the financial performance. The scope of the study ranges the analysis and interpretation of
financial statement of the company from the year 2008 to 2014 UNITED INDIA INSURANCE
COMPANY LIMITED. The study is conducted mainly to review the financial strength of the
company for a period of five years as revealed from the financial data of the company‟s annual
reports.
Limitation of the Study
A single ratio usually does not convey much of a sense. To make a better interpretation a
number of ratios have to be calculated which is likely to confuse the analyst than help him in making
any meaningful conclusion.
Ratios are only means of financial analysis and not an end in itself, The study is based on the
past records of company. The study period is restricted to the financial year of 2008 to 2014 Due to
market fluctuations the degree of accuracy may differ.\This study follows only secondary data.
Review of Literature
Malhotra (1994) studied the working of insurance corporations in his committee. The
committee studied the structural adjustment of the insurance sector; it highlights the present structure
of insurance business in India and deals with the story of GIC‟s success especially up to the date when
the committee submitted its report. The committee made various recommendations, some of the
important recommendations was as follows; private sector should be granted to enter insurance
industry in a controlled manner. The minimum paid up capital of a new entrant should be Rs.100
crore. Concerning entry of foreign insurance companies, the committee made an elaborate
recommendation that they should be required to float Indian companies and should preferably enter
the market by way of joint venture with Indian partners. It recommended further that steps be initiated
to set up a strong and effective regulatory authority in the form of a statutory autonomous board in the
lines of SEBI. The four subsidiaries he recommended that should be fully declined from GIC by
acquisition of entire stock in each of them by the government.
Graven (1998) addressed the impact of the internet in the marketing and distribution of
insurance products in his paper titled „Electronic Commerce in the Insurance Industry: Business
Perspective.‟ The study found that in a very short period of time, the internet has emerged as a viable
commercial medium. Survey evidence demonstrates that Americans are showing increased acceptance
of Internet i.e. shopping online. When compare with other forms of direct marketing such as mail
order and telephone ordering, electronic commerce on the internet is still relatively small, especially
insurance industry‟s involvement with and commitment to electronic commerce lags far behind
INTERCONTINENTAL JOURNAL OF FINANCE RESEARCH REVIEWISSN:2321-0354 - ONLINE ISSN:2347-1654 - PRINT - IMPACT FACTOR:0.720VOLUME 3, ISSUE 12, DECEMBER 2015
www.icmrr.org 52 [email protected]
WW
W.IC
MRR.ORG

competitors in the banking and brokerage industries. Although it is revealed that some industry
players are concerned about unleashing price competition, the internet‟s effect on prices will be
extremely salutary for consumers.
Gopalakrishna (1999) studied the business benefits of e-commerce. He observed that in the
insurance industry, the insurers are beginning to embrace the internet, but as compared to other
industries such as retailing industry, insurance players have been slow to get into e-commerce in a big
way. Today, companies are actively pursuing new IT initiatives such as data warehousing, e-
commerce and componentization. The objective is to get clarity around products, channels and service
features. This in turn will help in designing the distribution blue print so that the right product reaches
the right customers through the right channels in the shortest possible time.
Garven (2000) carried out a study on the role of electronic commerce in financial services
integration, his major objectives were; to summarize internet trends and discuss various related public
policy issues, to address online insurance supply and demand and finally to discuss the economics of
disintermediation and explained how this applies to e-commerce in the insurance industry. He
observed that although other online financial services have already taken off quite vigorously, the
insurance industry‟s involvement with and commitment to electronic commerce lags far behind
competitors in the banking and brokerage industries. It is widely recognized that e-commerce will
enable insurers to significantly lower costs, realize business process efficiencies, improve customer
service and brand loyalty, and enable insurers to better position themselves competitively.
Sbarbaro (2000) studies the potential impact of introducing or expanding the availability of
private health insurance within low and middle income countries in his working paper. He observed
that while the introduction of private health insurance would draw additional money into health
services, unless carefully regulated, it would not support an organized public health approach. He
recommended that World Health Organization (WHO) should take the lead in initiating a process that
will assist countries in determining the potential of private health insurance models as financiers of
healthcare. The WHO should be encouraged also to develop an international consultation group that
can assist the governments of low and middle income countries in the regulation of private health
insurance companies including licensing requirements; adherence to benefit design, integration and
co-operation with basic public health and preventive services and establishment of customer appeal
processes.
Company Profile
About United India Insurance Company United India Insurance Company Limited was
incorporated as a Company on 18th February 1938. General Insurance Business in India was
nationalized in 1972. 12 Indian Insurance Companies, 4 Cooperative Insurance Societies and Indian
operations of 5 Foreign Insurers, besides General Insurance operations of southern region of Life
Insurance Corporation of India were merged with United India Insurance Company Limited. After
Nationalization United India has grown by leaps and bounds and has 18300 work forces spread across
1340 offices providing insurance cover to more than 1 Crore policy holders. The Company has variety
of insurance products to provide insurance cover from bullock carts to satellites.
United India has been in the forefront of designing and implementing complex covers to large
customers, as in cases of ONGC Ltd , GMR- Hyderabad International Airport Ltd, Mumbai
International Airport Ltd Tirumala-Tirupati Devasthanam etc. We have been also the pioneer in taking
Insurance to rural masses with large level implementation of Universal Health Insurance Programme
INTERCONTINENTAL JOURNAL OF FINANCE RESEARCH REVIEWISSN:2321-0354 - ONLINE ISSN:2347-1654 - PRINT - IMPACT FACTOR:0.720VOLUME 3, ISSUE 12, DECEMBER 2015
www.icmrr.org 53 [email protected]
WW
W.IC
MRR.ORG
of Government of India & Vijaya Raji Janani Kalyan Yojana ( covering 45 lakhs women in the state
of Madhya Pradesh) , Tsunami Jan Bima Yojana (in 4 states covering 4.59 lakhs of families) ,
National Livestock Insurance and many such schemes.
United India Insurance Company Limited (Wholly owned by Govt. of India) under
Department of Financial Services, Ministry of Finance (India), is a public sector General Insurance
Company of India and one of the top General Insurers in Asia. With the net worth of 5407 crores and
profit of 528 crores, the company has collected gross premium of 9709 crores as of in the financial
year 2013-14. The company has more than seven decades of experience in Non-life Insurance
business and was formed to its present form by the merger of 22 companies, consequent to the
nationalization of General Insurance companies in India. implementation of Universal Health
Insurance Programme of Government of India & Vijaya Raji Janani Kalyan Yojana ( covering 45
lakhs women in the state of Madhya Pradesh), Tsunami Jan Bima Yojana (in 4 states covering 4.59
lakhs of families), National Livestock Insurance and many such schemes.
United India Insurance Company headquartered at Chennai has more than 1600 offices
consisting of 26 Regional Offices, 8 Large Corporate Offices and several divisional, branch and micro
offices. The company has also been operating large number of Service and TP hubs for dedicated
service to motor policy claims and related assistance.
Profit and Performance
The United India Insurance reported a significant jump in its profit after tax at Rs 528 crore
for the financial year 2013-14. Gross premium collected for the year stood at 9609 crores, up by about
7% from the previous year. Net worth of the company also witnessed a steady increase to 5361 crores.
Research Design
The collected data were presented in tables and these tables were analyzed systematically.
Ratio analysis, the vital financial tool was used to study the financial performance of UNITED INDIA
INSURANCE COMPANY LIMITED chart and various diagrams are used to explain the analysis
clearly. Comparative financial statement is another tool used in order to compare and analyze the
financial position of the company. Common size financial statement is a tool to assess, in which
figures reported are converted into percentages to some common base.
Secondary Data
Data collection is from Profit and Loss accounts and Balance sheets published in the year
wise annual reports of the organization. Financial statements play a dominant role in setting the
framework of managerial decisions.
Research Tools
Ratio analysis, Comparative balance sheet, Common size balance sheet
Ratio Analysis
A tool used by individuals to conduct a quantitative analysis of information in a company‟s
financial statements. Ratios are calculated from current year numbers and are then compared to
previous years, other companies, the industry, or even the economy to judge the performance of the
company. Ratio analysis is predominantly used by proponents of fundamental analysis.
INTERCONTINENTAL JOURNAL OF FINANCE RESEARCH REVIEWISSN:2321-0354 - ONLINE ISSN:2347-1654 - PRINT - IMPACT FACTOR:0.720VOLUME 3, ISSUE 12, DECEMBER 2015
www.icmrr.org 54 [email protected]
WW
W.IC
MRR.ORG

Financial Performance
We have great pleasure in informing you that your Company‟s accounts has been certified by
the statutory auditors of the company without any qualification in their audit report for the year 2013-
14 consecutively for the sixth time confirming again the strength of the quality of accounts. The
financial results were finalized and placed before the Board on 23rd April 2014 well ahead of almost
all players in the industry and also the first amongst public sector insurance companies showing the
strength of the internal resources.
The Company‟s performance in adoption of accounts by the Board and the completion of
Annual General Meeting well in advance as given in the table below proves your Company‟s
consistent and qualitative submission of accounts.
Year Statutory Audit
comments CAG Comments
Date of Board
Meeting Date of AGM
2008-09 Nil Nil 30th April 2009 8th July 2009
2009-10 Nil Nil 30th April 2010 31st May 2010
2010-11 Nil Nil 28th April 2011 2nd June 2011
2011-12 Nil Nil 28th April 2012 31st May 2012
2012-13 Nil Nil 26th April 2013 24th May 2013
2013-14 Nil Nil 23rd April 2014 TO BE HELD
Financial Performance We are also pleased to report on business performance and operating results of
the Company. (in crores)
Particulars Current Year 2013-14 Previous Year 2012-13
Gross Premium Income 9708.93 9266.04
Net Premium 8291.39 7489.08
Net Earned Premium 7603.30 7250.94
Claims Incurred 6277.38 6134.92
Commission 438.83 308.08
Operating Expenses 2111.23 2001.62
Other Income/(Expenses) -109.98 -42.27
Investment Income (Gross) 1967.18 1853.80
Profit Before Tax 633.06 617.85
Provision for Taxation 105.46 90.52
Profit After Tax 527.60 527.33
Particulars 2013-14 2012-13
Paid Up Capital 150.00 150.00
Reserves and Surplus 5210.53 4802.63
Share Capital 200 150
Dividend 124 70.67
Solvency Margin 5004.95 1970.51
INTERCONTINENTAL JOURNAL OF FINANCE RESEARCH REVIEWISSN:2321-0354 - ONLINE ISSN:2347-1654 - PRINT - IMPACT FACTOR:0.720VOLUME 3, ISSUE 12, DECEMBER 2015
www.icmrr.org 55 [email protected]
WW
W.IC
MRR.ORG

Summary
Details 2013-14 2012-13
Operating Results in Policyholders‟ Account 80.86 75.12
Investment Income Apportioned, including Profit on
realization of Investments 557.93 532.09
Other Income & Outgo -5.73 10.65
Profit Before Tax 633.06 617.86
Provision for Tax 105.50 91.14
Add: Tax Adjustments -0.05 -0.62
Net Profit after Tax 527.60 527.33
Less: Amount transferred to/from General Reserve 403.60 177.69
Amount transferred to Contingency Reserve 0.00 225.65
Balance proposed for Dividend 106.00 106.00
Corporate Dividend Tax 18.00 18.00
Current ratio
Formula for current ratio is = CURRENT ASSETS / CURRENT LIABILITIES
In the sound business a current ratio of 6 is considered as an idle one. A high ratio indicates
sound solvency position and a low ratio indicates inadequate working capital.
Sl. No Year Current asset Current
Liabilities Ratio
1 2013-2014 169081798 23877301 7.08
2 2012-2013 1797416556 76686354 23.43
3 2011-2012 4455423462 2445106842 1.82
4 2010-2011 8697917773 5148542843 1.68
5 2009-2010 7749304291 5526753387 1.40
Source: Annual Report 2009-2014
Debt –Equity Ratio
The formula for Debt –Equity Ratio is = OUTSIDERS FUND/ SHARE HOLDERS FUND
An acceptable ratio is considered to be 6 a high ratio shows that the claims of creditors are
greater than those of owners. A very high ratio is unfavorable from the point of view of the firm.
S.No. Year Outsiders Fund Policy Holders
Fund Ratio
1 2013-2014 39560805 523268318 0.07
2 2012-2013 900552551 1733550444 0.51
3 2011-2012 6152370446 2897653572 2.12
4 2010-2011 6454219166 10496275667 0.61
5 2009-2010 16022644385 10481814902 1.52
Source: Annual Report 2009-2014
INTERCONTINENTAL JOURNAL OF FINANCE RESEARCH REVIEWISSN:2321-0354 - ONLINE ISSN:2347-1654 - PRINT - IMPACT FACTOR:0.720VOLUME 3, ISSUE 12, DECEMBER 2015
www.icmrr.org 56 [email protected]
WW
W.IC
MRR.ORG
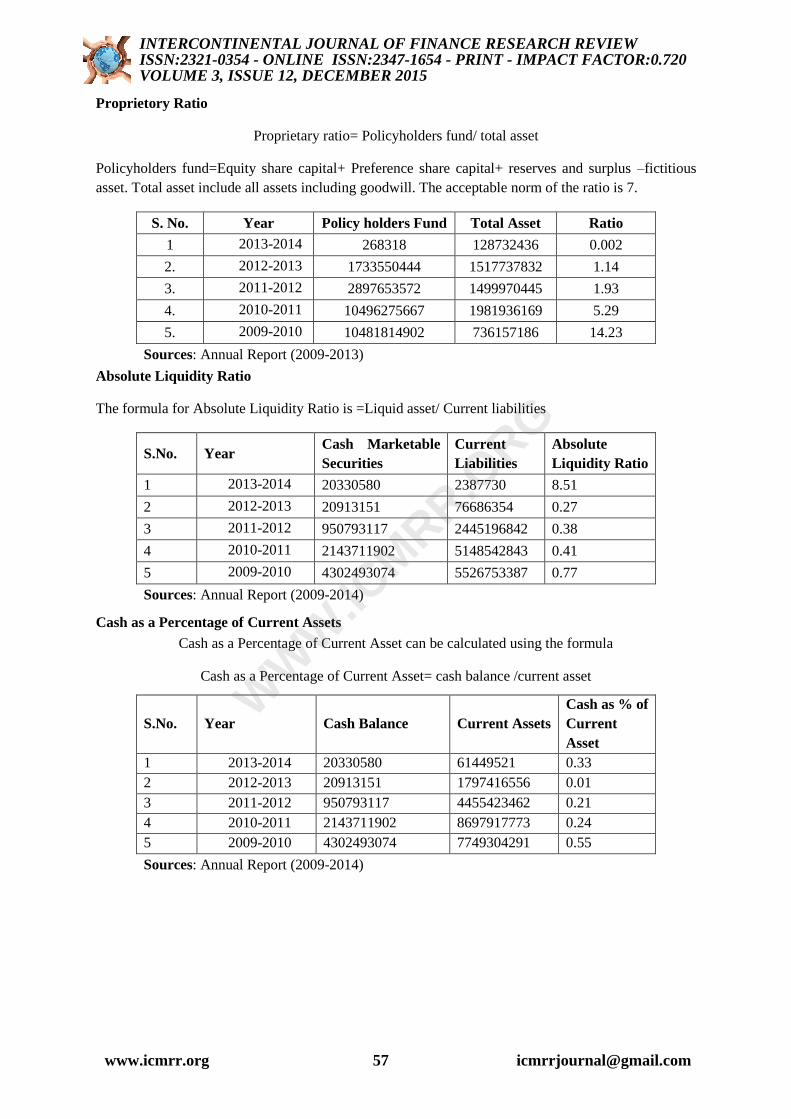
Proprietory Ratio
Proprietary ratio= Policyholders fund/ total asset
Policyholders fund=Equity share capital+ Preference share capital+ reserves and surplus –fictitious
asset. Total asset include all assets including goodwill. The acceptable norm of the ratio is 7.
S. No. Year Policy holders Fund Total Asset Ratio
1 2013-2014 268318 128732436 0.002
2. 2012-2013 1733550444 1517737832 1.14
3. 2011-2012 2897653572 1499970445 1.93
4. 2010-2011 10496275667 1981936169 5.29
5. 2009-2010 10481814902 736157186 14.23
Sources: Annual Report (2009-2013)
Absolute Liquidity Ratio
The formula for Absolute Liquidity Ratio is =Liquid asset/ Current liabilities
S.No. Year Cash Marketable
Securities
Current
Liabilities
Absolute
Liquidity Ratio
1 2013-2014 20330580 2387730 8.51
2 2012-2013 20913151 76686354 0.27
3 2011-2012 950793117 2445196842 0.38
4 2010-2011 2143711902 5148542843 0.41
5 2009-2010 4302493074 5526753387 0.77
Sources: Annual Report (2009-2014)
Cash as a Percentage of Current Assets
Cash as a Percentage of Current Asset can be calculated using the formula
Cash as a Percentage of Current Asset= cash balance /current asset
S.No. Year Cash Balance Current Assets
Cash as % of
Current
Asset
1 2013-2014 20330580 61449521 0.33
2 2012-2013 20913151 1797416556 0.01
3 2011-2012 950793117 4455423462 0.21
4 2010-2011 2143711902 8697917773 0.24
5 2009-2010 4302493074 7749304291 0.55
Sources: Annual Report (2009-2014)
INTERCONTINENTAL JOURNAL OF FINANCE RESEARCH REVIEWISSN:2321-0354 - ONLINE ISSN:2347-1654 - PRINT - IMPACT FACTOR:0.720VOLUME 3, ISSUE 12, DECEMBER 2015
www.icmrr.org 57 [email protected]
WW
W.IC
MRR.ORG
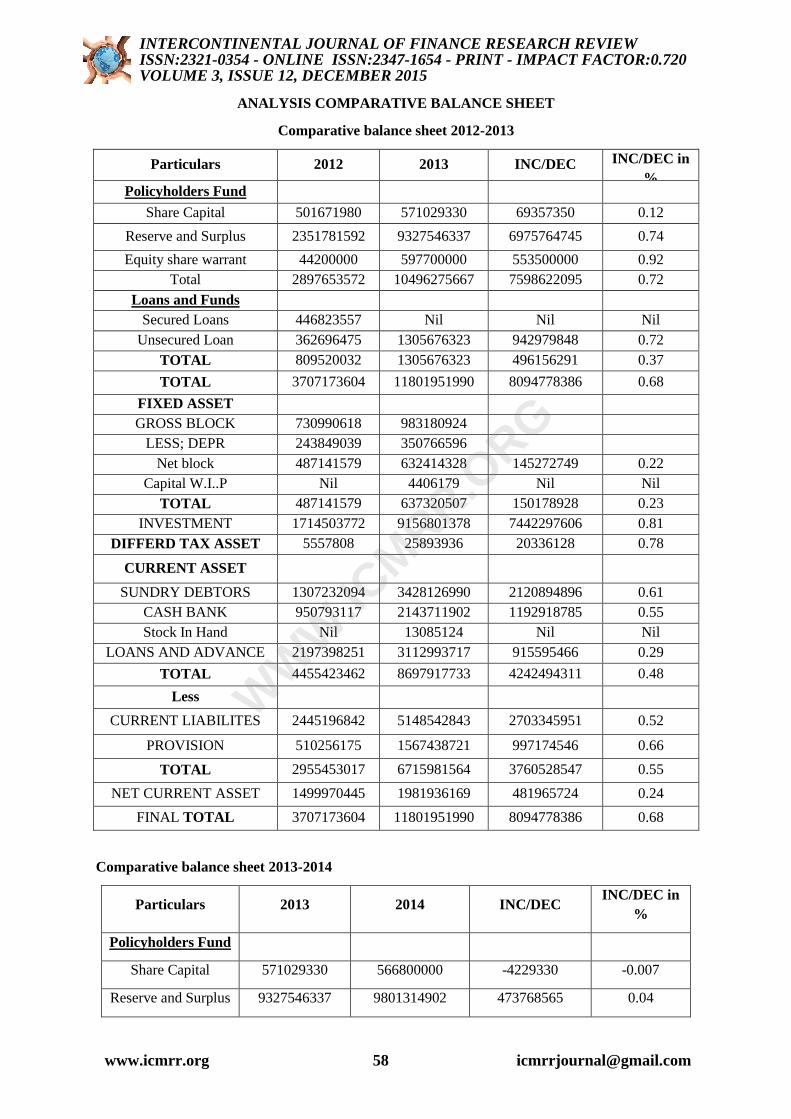
ANALYSIS COMPARATIVE BALANCE SHEET
Comparative balance sheet 2012-2013
Particulars 2012 2013 INC/DEC INC/DEC in
% Policyholders Fund
Share Capital 501671980 571029330 69357350 0.12
Reserve and Surplus 2351781592 9327546337 6975764745 0.74
Equity share warrant 44200000 597700000 553500000 0.92
Total 2897653572 10496275667 7598622095 0.72
Loans and Funds
Secured Loans 446823557 Nil Nil Nil
Unsecured Loan 362696475 1305676323 942979848 0.72
TOTAL 809520032 1305676323 496156291 0.37
TOTAL 3707173604 11801951990 8094778386 0.68
FIXED ASSET
GROSS BLOCK 730990618 983180924
LESS; DEPR 243849039 350766596
Net block 487141579 632414328 145272749 0.22
Capital W.I..P Nil 4406179 Nil Nil
TOTAL 487141579 637320507 150178928 0.23
INVESTMENT 1714503772 9156801378 7442297606 0.81
DIFFERD TAX ASSET 5557808 25893936 20336128 0.78
CURRENT ASSET
SUNDRY DEBTORS 1307232094 3428126990 2120894896 0.61
CASH BANK 950793117 2143711902 1192918785 0.55
Stock In Hand Nil 13085124 Nil Nil
LOANS AND ADVANCE 2197398251 3112993717 915595466 0.29
TOTAL 4455423462 8697917733 4242494311 0.48
Less
CURRENT LIABILITES 2445196842 5148542843 2703345951 0.52
PROVISION 510256175 1567438721 997174546 0.66
TOTAL 2955453017 6715981564 3760528547 0.55
NET CURRENT ASSET 1499970445 1981936169 481965724 0.24
FINAL TOTAL 3707173604 11801951990 8094778386 0.68
Comparative balance sheet 2013-2014
Particulars 2013 2014 INC/DEC INC/DEC in
%
Policyholders Fund
Share Capital 571029330 566800000 -4229330 -0.007
Reserve and Surplus 9327546337 9801314902 473768565 0.04
INTERCONTINENTAL JOURNAL OF FINANCE RESEARCH REVIEWISSN:2321-0354 - ONLINE ISSN:2347-1654 - PRINT - IMPACT FACTOR:0.720VOLUME 3, ISSUE 12, DECEMBER 2015
www.icmrr.org 58 [email protected]
WW
W.IC
MRR.ORG
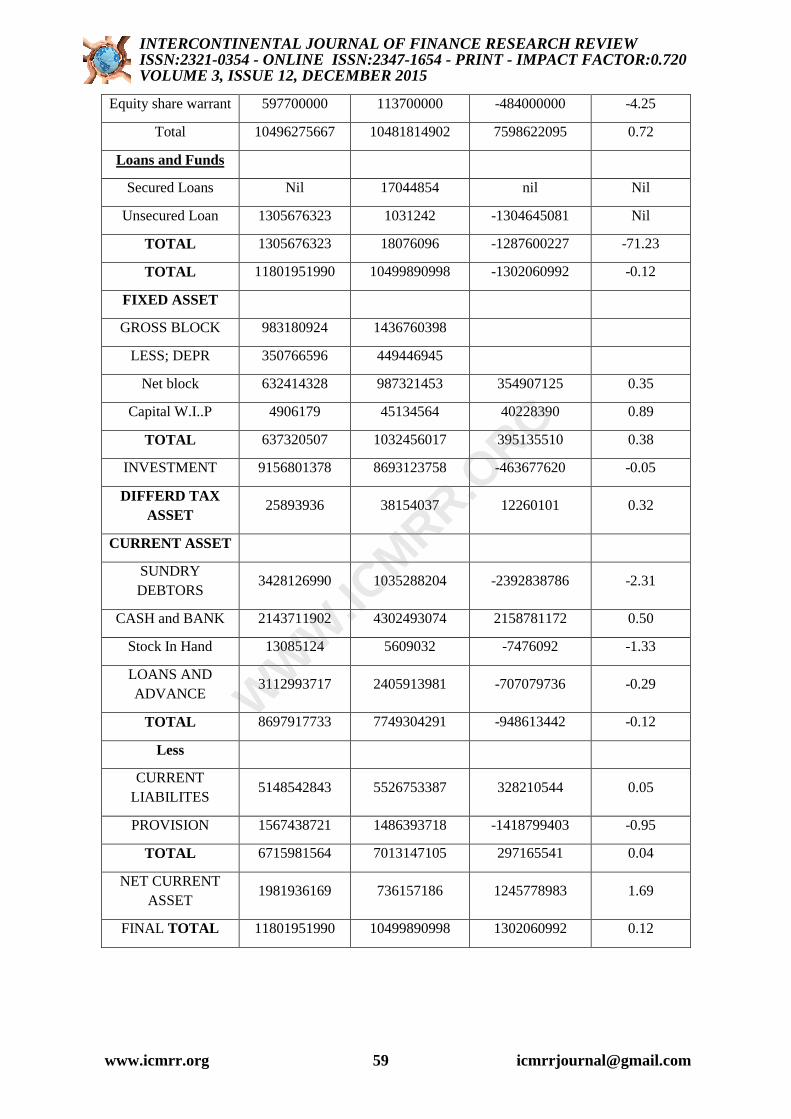
Equity share warrant 597700000 113700000 -484000000 -4.25
Total 10496275667 10481814902 7598622095 0.72
Loans and Funds
Secured Loans Nil 17044854 nil Nil
Unsecured Loan 1305676323 1031242 -1304645081 Nil
TOTAL 1305676323 18076096 -1287600227 -71.23
TOTAL 11801951990 10499890998 -1302060992 -0.12
FIXED ASSET
GROSS BLOCK 983180924 1436760398
LESS; DEPR 350766596 449446945
Net block 632414328 987321453 354907125 0.35
Capital W.I..P 4906179 45134564 40228390 0.89
TOTAL 637320507 1032456017 395135510 0.38
INVESTMENT 9156801378 8693123758 -463677620 -0.05
DIFFERD TAX
ASSET 25893936 38154037 12260101 0.32
CURRENT ASSET
SUNDRY
DEBTORS 3428126990 1035288204 -2392838786 -2.31
CASH and BANK 2143711902 4302493074 2158781172 0.50
Stock In Hand 13085124 5609032 -7476092 -1.33
LOANS AND
ADVANCE 3112993717 2405913981 -707079736 -0.29
TOTAL 8697917733 7749304291 -948613442 -0.12
Less
CURRENT
LIABILITES 5148542843 5526753387 328210544 0.05
PROVISION 1567438721 1486393718 -1418799403 -0.95
TOTAL 6715981564 7013147105 297165541 0.04
NET CURRENT
ASSET 1981936169 736157186 1245778983 1.69
FINAL TOTAL 11801951990 10499890998 1302060992 0.12
INTERCONTINENTAL JOURNAL OF FINANCE RESEARCH REVIEWISSN:2321-0354 - ONLINE ISSN:2347-1654 - PRINT - IMPACT FACTOR:0.720VOLUME 3, ISSUE 12, DECEMBER 2015
www.icmrr.org 59 [email protected]
WW
W.IC
MRR.ORG
Interpretation
2011-2012
The comparative balance sheet for the year 2011-2012 shows a decrease in the profit
percentage than the previous year that is from 0 .78% to 0.31%
2012-2013
The comparative balance sheet for the year 2012-2012 shows an increase in the profit
percentage than the previous year that is from 0.31% to 0.68%
2013-2014
The comparative balance sheet for the year 2013-2014 shows a decrease in the profit
percentage than the previous year that is from 0 .68% to 0.12% still the company is in a profitable
position.
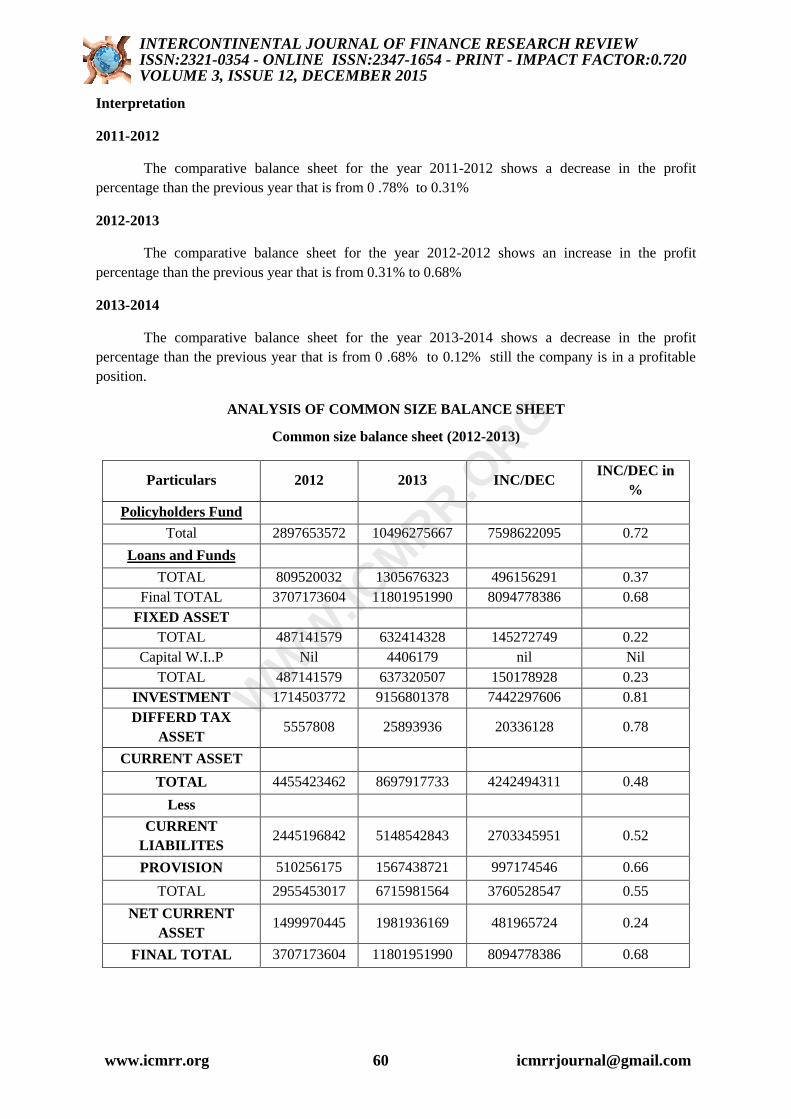
ANALYSIS OF COMMON SIZE BALANCE SHEET
Common size balance sheet (2012-2013)
Particulars 2012 2013 INC/DEC INC/DEC in
%
Policyholders Fund
Total 2897653572 10496275667 7598622095 0.72
Loans and Funds
TOTAL 809520032 1305676323 496156291 0.37
Final TOTAL 3707173604 11801951990 8094778386 0.68
FIXED ASSET
TOTAL 487141579 632414328 145272749 0.22
Capital W.I..P Nil 4406179 nil Nil
TOTAL 487141579 637320507 150178928 0.23
INVESTMENT 1714503772 9156801378 7442297606 0.81
DIFFERD TAX
ASSET 5557808 25893936 20336128 0.78
CURRENT ASSET
TOTAL 4455423462 8697917733 4242494311 0.48
Less
CURRENT
LIABILITES 2445196842 5148542843 2703345951 0.52
PROVISION 510256175 1567438721 997174546 0.66
TOTAL 2955453017 6715981564 3760528547 0.55
NET CURRENT
ASSET 1499970445 1981936169 481965724 0.24
FINAL TOTAL 3707173604 11801951990 8094778386 0.68
INTERCONTINENTAL JOURNAL OF FINANCE RESEARCH REVIEWISSN:2321-0354 - ONLINE ISSN:2347-1654 - PRINT - IMPACT FACTOR:0.720VOLUME 3, ISSUE 12, DECEMBER 2015
www.icmrr.org 60 [email protected]
WW
W.IC
MRR.ORG
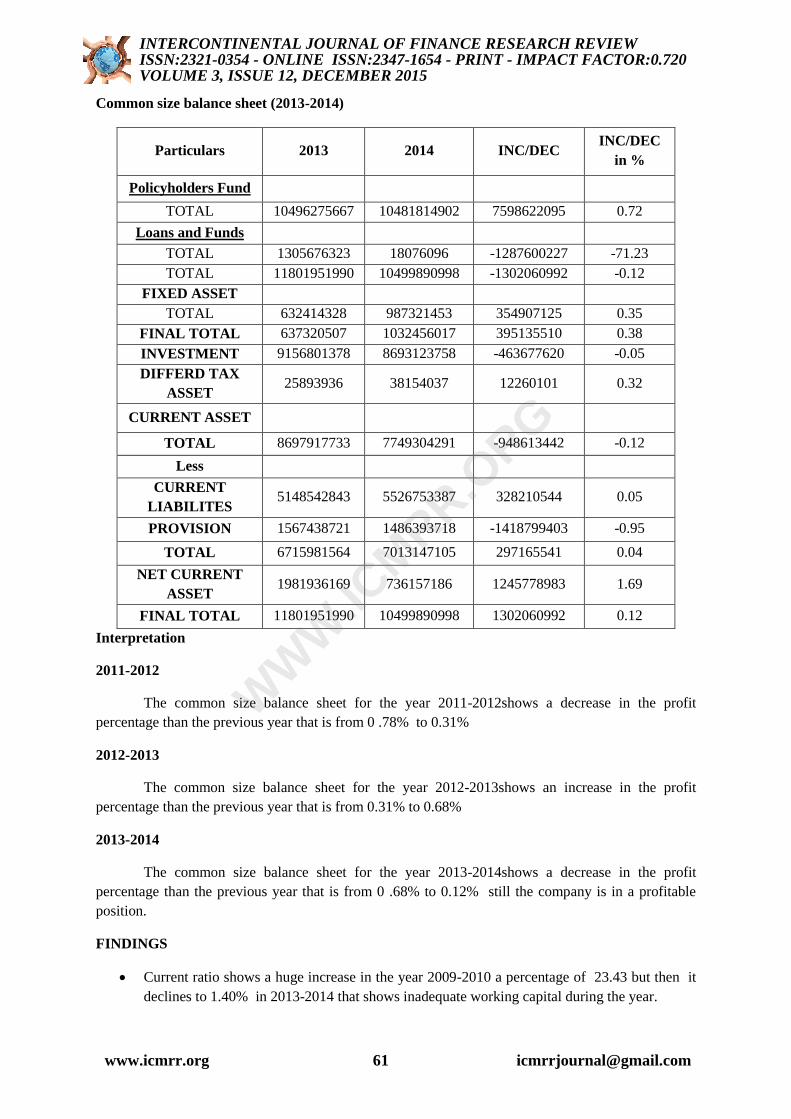
Common size balance sheet (2013-2014)
Particulars 2013 2014 INC/DEC INC/DEC
in %
Policyholders Fund
TOTAL 10496275667 10481814902 7598622095 0.72
Loans and Funds
TOTAL 1305676323 18076096 -1287600227 -71.23
TOTAL 11801951990 10499890998 -1302060992 -0.12
FIXED ASSET
TOTAL 632414328 987321453 354907125 0.35
FINAL TOTAL 637320507 1032456017 395135510 0.38
INVESTMENT 9156801378 8693123758 -463677620 -0.05
DIFFERD TAX
ASSET 25893936 38154037 12260101 0.32
CURRENT ASSET
TOTAL 8697917733 7749304291 -948613442 -0.12
Less
CURRENT
LIABILITES 5148542843 5526753387 328210544 0.05
PROVISION 1567438721 1486393718 -1418799403 -0.95
TOTAL 6715981564 7013147105 297165541 0.04
NET CURRENT
ASSET 1981936169 736157186 1245778983 1.69
FINAL TOTAL 11801951990 10499890998 1302060992 0.12
Interpretation
2011-2012
The common size balance sheet for the year 2011-2012shows a decrease in the profit
percentage than the previous year that is from 0 .78% to 0.31%
2012-2013
The common size balance sheet for the year 2012-2013shows an increase in the profit
percentage than the previous year that is from 0.31% to 0.68%
2013-2014
The common size balance sheet for the year 2013-2014shows a decrease in the profit
percentage than the previous year that is from 0 .68% to 0.12% still the company is in a profitable
position.
FINDINGS
Current ratio shows a huge increase in the year 2009-2010 a percentage of 23.43 but then it
declines to 1.40% in 2013-2014 that shows inadequate working capital during the year.
INTERCONTINENTAL JOURNAL OF FINANCE RESEARCH REVIEWISSN:2321-0354 - ONLINE ISSN:2347-1654 - PRINT - IMPACT FACTOR:0.720VOLUME 3, ISSUE 12, DECEMBER 2015
www.icmrr.org 61 [email protected]
WW
W.IC
MRR.ORG

Quick Ratio from the year 2009-2014 is above the acceptable ratio 1:1 so the financial
position of the company is satisfactory
Debt Equity shows a favorable ratio to the firm. In 2013-2014 the ratio is 1.52. A high ratio
is unfavourable from the point of view of the firm
The Proprietary ratio was high in period 2012-2013 & 2013-2014 5.29 to 14.23. Higher
Proprietary ratio indicates the secured position to creditors. The ratio was low in 2009-2010 &
2010-2011 and low ratio indicates greater risk to creditors. In 2006-2007 there is a normal
ratio.
Absolute Liquidity Ratio is High that is 8.51 during 2009-2010 is desirable norms and in the
rest of the years the ratio is below the norms.
There is only an average of 0.27% cash in current assets
There is only 0.79% of fixed assets. In 2010-2011 it shows a decreasing trend and in the rest
of the years it shows an increasing trend,
By analyzing the balance sheet 0.12% has increased in 2010 when compared to 2009
The comparative balance sheet for the year 2013-2014 shows a decrease in the profit
percentage than the previous year that is from 0 .68% to 0.12% still the company is in a
profitable position
RECOMMENDATIONS
Finance is the life blood of the company, so the company has to concentrate on the
maintenance of the financial resources.
The company should divert more funds to its Research and Development function for
reducing the laps policy expenses.
The management may take proper decisions to maintain their absolute liquid ratio, so that
they can maintain their liquidity position in the long run.
The liquidity position could be strengthened by reducing the current liabilities.
The cash balance level of the company when compared to current liabilities is minimum
and the management may improve the cash balance to an optimum level to meet the
contingencies.
From the evaluation of the current year balance, it is clear that the company is earning
more profit and that profit could be utilized for the further development of the company.
The company can utilize the fund for adapting to the new technology available.
CONCLUSION
Thus, the financial statements provide a summarized view of the financial position and
operations of a firm. Therefore, much can be learnt about a firm from a careful examination of its
financial statements as invaluable documents /performance reports. The analysis of financial
statements is, thus, an important aid to financial analysis.
The study on Financial Performance analysis in United India Insurance Company
limited, for a period of five years from 2009 to 2014, implies the existing financial performance as
satisfactory. The study also reveals that the liquid assets must be properly maintained in order to meet
the liabilities. Hence, the company should concentrate on those aspects. It could be concluded that the
company has been performing well throughout the period of study undertaken.
INTERCONTINENTAL JOURNAL OF FINANCE RESEARCH REVIEWISSN:2321-0354 - ONLINE ISSN:2347-1654 - PRINT - IMPACT FACTOR:0.720VOLUME 3, ISSUE 12, DECEMBER 2015
www.icmrr.org 62 [email protected]
WW
W.IC
MRR.ORG

References
1. D.C Sharma K.G .Gupta, Management Accounting.
2. I.M.Pandey, Financial Management, Vikas publishers 1995.
3. Prasanna Chandra, Financial Management, Tata Mc Graw Hill, New Delhi, (2001)
4. Gupta And Sharma, Management Accounting, Kalyani Publishers, New Delhi 1996).
5. www.unitedindiainsurance.com
INTERCONTINENTAL JOURNAL OF FINANCE RESEARCH REVIEWISSN:2321-0354 - ONLINE ISSN:2347-1654 - PRINT - IMPACT FACTOR:0.720VOLUME 3, ISSUE 12, DECEMBER 2015
www.icmrr.org 63 [email protected]
WW
W.IC
MRR.ORG