Embed Size (px)
Citation preview
A Study on the Determinants of Manufactured Products Export Performance in Ethiopia : Evidence from Firm Level Data
By
ZELEKE, Yohannes Teshome
THESIS
Submitted to
KDI School of Public Policy and Management
In Partial Fulfillment of the Requirements
For the Degree of
MASTER OF PUBLIC POLICY
2020
A Study on the Determinants of Manufactured Products Export Performance in Ethiopia : Evidence from Firm Level Data
By
ZELEKE, Yohannes Teshome
THESIS
Submitted to
KDI School of Public Policy and Management
In Partial Fulfillment of the Requirements
For the Degree of
MASTER OF PUBLIC POLICY
2020
Professor Kim, Dongseok

ABSTRACT
A STUDY ON THE DETERMINANTS OF MANUFACTURED PRODUCTS EXPORT
PERFORMANCE IN ETHIOPIA: EVIDENCE FROM FIRM LEVEL DATA
By
Yohannes Teshome Zeleke
This study attempted to examine the determinants of manufacturing industry export performance
at a firm level. The analysis applied fixed effect, tobit and probit models based on world bank
enterprise survey panel data. The finding indicated that the use of website, firm size, firm age, skill
intensity, technology, export experience and quality certification are the key determinants of
export performance. In contrast, the impact of firm location and foreign ownership are found to be
insignificant. The study suggests that firms should consider technology, standardization of process,
increasing economies of scale, quality improvement, and certification as key focus areas when
formulating export strategy. Firms should make use of internet-based modern communication tools
such as website and email to exchange information with clients easily and promote their products.

Copyright by
YOHANNES TESHOME ZELEKE
2020


i
ACKNOWLEDGEMENTS
First, thanks to God the Almight for all His blessing throughout my study and research work. I
would like to express my sincere gratitude to my research supervisor Professor Kim Dongseok for
his unreserved guidance and constructive comments on my drafts. I am also grateful to my
classmates and friends for the motivation and support they gave me throughout my study time.

ii
TABLE OF CONTENTS
ACKNOWLEDGEMENTS ........................................................................................................................ i
LIST OF TABLES ..................................................................................................................................... iii
LIST OF FIGURES ................................................................................................................................... iii
ABBREVIATIONS .................................................................................................................................... iv
CHAPTER ONE ......................................................................................................................................... 1
1. INTRODUCTION ............................................................................................................................... 1
1.1. Background ................................................................................................................................... 1
1.2. Statement of the Problem .............................................................................................................. 2
1.3. Research Objective ....................................................................................................................... 3
1.4. Research questions ........................................................................................................................ 3
1.5. Significance of the study ............................................................................................................... 3
1.6. Organization of the paper .............................................................................................................. 4
CHAPTER TWO ........................................................................................................................................ 5
2. LITERATURE REVIEW .................................................................................................................. 5
2.1. Theoretical foundation and conceptual model .............................................................................. 5
2.2. Export Performance Measurement ................................................................................................ 7
2.3. Empirical Review .......................................................................................................................... 8
2.4. Overview of manufacturing industry in Ethiopia ........................................................................ 14
CHAPTER THREE .................................................................................................................................. 16
3. RESEARCH DESIGN AND METHODOLOGY .......................................................................... 16
3.1. Research Method and Data ......................................................................................................... 16
3.2. Model specification and definition of variables .......................................................................... 17
3.3. Hypothesis ................................................................................................................................... 19
CHAPTER FOUR ..................................................................................................................................... 20
4. DATA ANALYSIS AND DISCUSSION ......................................................................................... 20
4.1. Descriptive Statistics ................................................................................................................... 20
4.2. Regression and discussion of findings ........................................................................................ 20
4.2.1. Export intensity ................................................................................................................... 21
4.2.2. Export propensity ................................................................................................................ 23
4.3. Challenges facing manufacturing firms ...................................................................................... 24
CHAPTER FIVE ...................................................................................................................................... 27

iii
5. CONCLUSION AND RECOMMENDATION .............................................................................. 27
5.1. Conclusion .................................................................................................................................. 27
5.2. Recommendation ........................................................................................................................ 27
BIBLIOGRAPHY ..................................................................................................................................... 29
APPENDIX ................................................................................................................................................ 35
LIST OF TABLES
Table 1: Description of variables .................................................................................................. 19
Table 2: Descriptive statistics ....................................................................................................... 20
Table 3: Regression result for FE and tobit model. ...................................................................... 21
Table 4:Regression result for probit model .................................................................................. 23
Table 5:Capacity utilization and share of imported raw material ................................................. 24
Table 6:Major reason for not working at full capacity ................................................................. 25
Table 7: Major operational problems ............................................................................................ 26
LIST OF FIGURES
Figure 1: Conceptual model ............................................................................................................ 7
Figure 2: MVA share of GDP and annual growth trend. .............................................................. 14
Figure 3: Share of manufactured export ....................................................................................... 15

iv
ABBREVIATIONS
CIP Competitive Industrial Performance
CSA Central Statistical Agency
FE Fixed Effect
GDP Gross Domestic Product
GTP Growth and Transformation Plan
LMMS Large and Medium Manufacturing Survey
MoFED Ministry of Finance and Economic Development
PASDEP A Plan for Accelerated and Sustained Development to End Poverty.
PDC Planning and Development Commission
R&D Research and Development
SDPRP Sustainable Development and Poverty Reduction Program
RE Random Effect
UNIDO United Nations Industrial Development Organization
USD United States Dollar
WB The World Bank

1
CHAPTER ONE
1. INTRODUCTION
1.1. Background
Export plays a key role in promoting economic growth. In particular, manufactured products
export have a higher positive spillover effect on job creation, value addition, competition, and
technology transfer (Buturac, Mikulić, & Palić, 2019; Marconi, Reis, & Araújo, 2016). The
government of Ethiopia made export as one of its policy priority. The industrial development
strategy which was formulated in 2003, in particular, underlines the importance of competitiveness
in the export market in achieving sustainable industrial development (Gebreyesus & Kebede,
2017). The mid-term development plans formulated since the have set ambitious export goals
(SDRP, 2002; PASDEP, 2005; GTP I, 2010; GTP II, 2016).
However, Ethiopia’s export is small in volume and characterized by a lower level of value addition.
The total export earnings stood at USD 2.7 billion in 2018 leading the country to USD 12.4 billion
trade deficit (PDC, 2019). The export is based predominantly on a primary agricultural commodity
which accounts for 79.4% of the total export, while the manufactured goods account only 18.9%
(PDC, 2019). Apart from its small share, the manufactured products export growth has remained
stagnant since 2014, registering a 4% average growth (PDC, 2019). The exporting intensity of
manufacturing industries stood at 3.5% in 2016, which implies firms generate a small share of
their revenue from exporting to international markets (CSA, 2017).
Moreover, Ethiopia ranked 149th in the first dimension of the competitive industrial performance
index (CIP) that indicates the capacity to produce and export manufactured goods (UNIDO, 2019).
2
Therefore, it is vital to examine the key factors that contributed to this poor export performance.
Specifically, it is worth to analyze the export behaviour of firms at a micro level to provide
evidence to managers, investors, and the public sector.
1.2. Statement of the Problem
Various actors that affect export firm level export performance have been identified in previous
empirical studies. Chen, Sousa, and He (2016), and Beleska-Spasova (2014) categorized these
factors into internal and external factors. Internal factors are related to firm characteristics such as
sizes, ages and ownership of organizations, whereas external factors include the legal, political
and economic environment in which the firms operate (Beleska-Spasova, 2014). Studies conducted
in China and Uganda contexts revealed that internal factors such as firm sizes and ownership
structures have a significant effect on firms’ export performance (Liu & Shu, 2003; Niringiye &
Tuyiragize, 2010). Furthermore, firms’ capital and skill intensity are deemed to be major
determinants of propensity to export in Uganda (Niringiye & Tuyiragize, 2010). Another study
conducted in Italy concluded that the firm level export performance could vary depending on the
level of innovation, in addition to other firm-specific factors (Sterlacchini, 2001). Zhao and Zou
(2002), on the other hand, indicated that external factors such as industry concentration and
location have a significant effect in determining firms’ propensity to export.
Studies in Ethiopia, on the other hand, concentrated on macroeconomic analytic approach in
examining determinants of export performance (Alemu, 2018; Anagaw & Demmissie, 2013; Menji,
2010). This approach utilizes aggregate data such as total export, gross domestic product (GDP),
national infrastructure level, effective exchange rate, and total foreign direct investment among
others. However, little research has been conducted based on microeconomic analysis using firm-
3
level data (Bekele & Kaur, 2018; Gete, 2019). Therefore, to bridge this gap, this study will examine
the determinants of manufactured products’ export performance at the firm level (microeconomic
analysis) using industry survey data.
1.3. Research Objective
The major objective of the study is to examine the determinants of firm level export performance
of manufacturing industry in Ethiopia.
1.4. Research questions
Is there a significant relationship between firms’ characteristics (firm size, firm age, firm
ownership structure, use website or internet, skill intensity) and export performance in
Ethiopia?
Is there a significant relationship between external factors (location and financial access)
and firms’ export performance?
What are the key challenges that exporting firms face?
1.5. Significance of the study
This study examines the determinants of manufactured products’ export performance at the firm
level using survey data. The study is expected to provide concrete evidence to public policymakers
and practitioners concerning firms’ export behaviour. First, it will provide insight to devise
effective export promotion policy and to align the support packages of government with the need
of the manufacturing firms. Second, it will help investors and managers to make informed business
decisions regarding export marketing strategy.
4
1.6. Organization of the paper
This study paper is organized in five separate chapters. The first chapter includes the introduction
section. The second chapter discusses the theoretical foundations, measurement issues and
empirical literature. The third chapter presents the research methodology, data description and
hypothesis. The fourth chapter presents data analysis and discussion on findings. Finally, the fifth
chapter will discuss the conclusions, recommendations, and limitations of the study.

5
CHAPTER TWO
2. LITERATURE REVIEW
This section summarizes and discusses theoretical foundations, measurement issues and review
of selected empirical works in the firm export performance literature.
2.1. Theoretical foundation and conceptual model
The literature of export performance suffers from a lack of a consistent and compressive theoretical
framework that explains systematic relationships (Beleska-Spasova, 2014; Chen et al., 2016). In
their comprehensive summary of firm export performance literature, Chen et al. (2016), identified
41 different theoretical paradigms applied in 109 articles reviewed. Various theoretical
frameworks have been applied in different studies. Some of this include resource-based view,
institutions-based view, contingency view which is based on the structure-conduct-performance
framework of industrial organization, organizational learning theory, new trade theories and the
perceived risk argument (Bonaccorsi, 1992; Cavusgil & Zou, 1994; Chen et al., 2016; Sharma &
Erramilli, 2004; Shoham, 1998; Wernerfelt, 1984; Yi, Wang, & Kafouros, 2013). The resource-
based view (RBV) and structure-conduct-performance (SCP) framework of industrial organization
or contingency view are the most widely used frameworks in the literature (Beleska-Spasova, 2014;
Styles, Patterson, & Ahmed, 2008).
In RBV, firm resources are defined as any tangible and intangible, tradable or non-tradable
resource that a firm has and can stay under the firm's control for a considerable time (Wernerfelt,
6
1984). Firm resources include brand names, technological capability, skilled manpower, business
network, organizational procedures, physical equipments and finance among others (Wernerfelt,
1984). These resources provide leverage for the firm to gain and maintain a competitive advantage
which implies that firms need to develop, obtain, review, and utilize various resources (Sharma &
Erramilli, 2004; Styles et al., 2008; Wernerfelt, 1984; Yi et al., 2013). The SCP paradigm focuses
on achieving a fit between internal and external forces (Cavusgil & Zou, 1994; Styles et al., 2008).
This theory argues that firms need to adequately respond to the external pressure from the
environment they operate in (Beleska-Spasova, 2014; Cavusgil & Zou, 1994).
Firm's export marketing strategy is shaped by either internal or external set of factors. It is defined
as a process through which firms react to the interaction of internal and external forces to achieve
a set of goals (Cavusgil & Zou, 1994). Internal factors that correspond to the RBV paradigm
include firm and product-specific characteristics that are under the direct control of a firm
(Beleska-Spasova, 2014). In addition to internal factors, Zhao and Zou (2002), claimed that
external factors that are out of the control of firms are crucial in determining the firms’ export
behaviour. The external factors, on the other hand, correspond to the contingency view or SCP
paradigm and include industry and export market features that are not under the direct control of
a firm (Beleska-Spasova, 2014; Cavusgil & Zou, 1994).
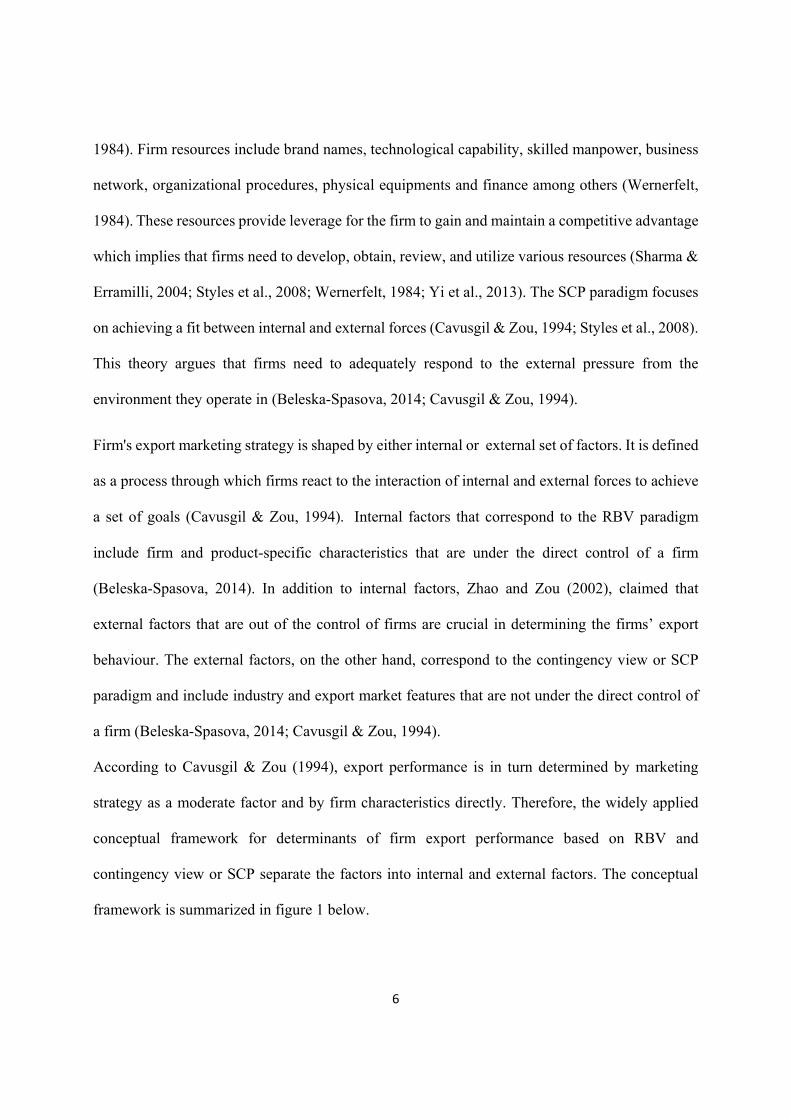
According to Cavusgil & Zou (1994), export performance is in turn determined by marketing
strategy as a moderate factor and by firm characteristics directly. Therefore, the widely applied
conceptual framework for determinants of firm export performance based on RBV and
contingency view or SCP separate the factors into internal and external factors. The conceptual
framework is summarized in figure 1 below.

7
Figure 1: Conceptual model
2.2. Export Performance Measurement
Export is defined as marketing decisions and behaviours of firms in the international market
(Cavusgil & Nevin, 1981). Shoham (1998), stresses that this definition is inclusive of all firms that
have a different level of international engagement and it captures the varying degree of
involvement over time. Thus export performance is defined as a composite result of a firm's
success in achieving its objective in the export venture (Shoham, 1998). The objective can be either
economic or strategic and the nature of objective dictates the type of indicator used to measure
performance (Cavusgil & Zou, 1994).
Beleska-Spasova (2014), categorize measure of export into economic and non-economic measures.
Shoham (1998), on the other hand, categorize export performance into three dimensions namely
sales, profit and strategy. Sales and profit related measures along with market share related
Export marketing Export performance
Internal factors
Firm characteristics
Product characteristics
External factors
Industry characteristics
Export market characteristics
Resource based view
Contingency view (SCP)
8
measures are economic measures. The strategy-based measures correspond to the non-economic
measures. There are three sales-related measures. These are export intensity measured by the ratio
of export sales revenue to total sales revenue, the absolute value of export sale which is total export
sales and export market share (Shoham, 1998). Bonaccorsi (1992), stated that export intensity and
export propensity which are both economic and sales-related indicators are widely used for
measuring firm's export behaviour in empirical researches. The export propensity is a dummy
variable of exporter and non-exporter which measures the probability to export or decision to
export (Bonaccorsi, 1992). Export intensity is a ratio of export sales to total sales (Bonaccorsi,
1992; Yi et al., 2013).
The choice of export performance indicator depends on data availability and accessibility, level of
assessment, and time frame (Beleska-Spasova, 2014). Most empirical researches use one measure
of export performance and some researches applied two measures usually export intensity and
propensity. However, some argue that different indicators measure different facets of performance
and stress the need to use a multitude of measures to capture the full picture of firm export
performance (Calof, 1994; Shoham, 1998).
2.3. Empirical Review
There are extensive research works undertaken at various level and context to examine the
determinants of export performance. Schlegelmilch and Crook (1988), categorized the determinants of
firm export into four broad categories. The first is management outlooks towards risk, foreigners,
importance of marketing (Schlegelmilch and Crook, 1988). Secondly, market access factors such as
location and transport cost. The third is distinctive advantages and resources of the firm such as
R&D activity, product differentiation, and manager’s personal skills (Schlegelmilch and Crook,
9
1988). The last one is firm demographic characteristics such as size, product life cycle, and
domestic sales growth (Schlegelmilch and Crook, 1988). The empirical findings regarding the effect
of size, age, type of ownership, skill intensity, location, innovation and technology and other
factors on firm export performance are discussed afterwards.
Size is an important demographic characteristic of a firm and often approximated by total
employment or total sales volume. Size is key to obtaining credibility and scale economics in the
international market. Large size indicates the existence of resources and specialized management
knowledge that imply a strong capability to enter and remain in the export market. On the other
hand, smaller size is associated with risk-averse attitude of management compared to that of large
firms (Bonaccorsi, 1992). Firm growth cycle has an effect as a firm tend to emphasize the domestic
market in the early phase of growth until it eventually gets larger and acquires the capacity to face
the international market (Bonaccorsi, 1992). Though this claim makes sense to a certain extent, it
does not consider firms that are established targeting the export market from the outset.
Various studies found that size generally has a positive effect on export performance (Bekele &
Kaur, 2018; Cieślik, Michałek, & Michałek, 2014; Edwards & Balchin, 2008; Liu & Shu, 2003;
Niringiye & Tuyiragize, 2010; Serra, Pointon, & Abdou, 2012). Calof (1994), found that firm size
is positively related to export performance and the result was consistent after considering various
dimensions of export performance. Behmiri (2019), also stated that size is a key factor for the
export performance of young firms in Portuguese wine-producing firms. Factors affecting export
performance are not the same for all size of firms (Sterlacchini, 2001). The study found that size
has a positive effect on export propensity and intensity in small firms subsample, however, the
relationship is U shaped for the large firms (Sterlacchini, 2001). Large firms that affiliate with
international firms have better performance and small firms more likely to be benefited from
10
innovation to enhance their export (Sterlacchini, 2001). Wagner (1995) and Schlegelmilch &
Crook (1988), found that firm size has a positive effect but after a certain level of size the effect
diminishes. Bonaccorsi (1992), found that export intensity is not positively related to firm size
based on the Italian firm’s data.
There are two opposing views towards the effect of age which is measured by the firm business
experience on its export performance. The first argues that firm age is associated with experience
advantage, market credibility, ability to adapt to the need of new markets. The second view,
however, claims that new firms show more interest in export, make an aggressive move, and use
recent technologies as the old firms may tend to be rigid to change their existing strategy. The
empirical results exhibit inconsistent result regarding the effect of firm age on export performance.
A study by Niaz, Rebelo, Gouveia, and Antonio (2019), found that age has a negative relationship
with propensity to export and the effect is higher in larger firms. However, the same study revealed
that firm age has a significant positive effect on the intensity of a firm (Niaz et al., 2019). This
implies that the likelihood of old and large firms to enter into the export market is lower compared
to that of younger and smaller firms. A study revealed that age showed a negative effect in Egypt,
Mauritius, Morocco, and South Africa, while it has positive but insignificant effect in Kenya,
Madagascar, Tanzania, and Zambia (Edwards & Balchin, 2008). Bekele and Kaur (2018), stated
that firm age has a positive and significant effect on export performance. Other studies found no
significant relationship between age and export performance (Cieślik et al., 2014; Din, Ghani, &
Mahmood, 2009).
The experience in the export business has a positive effect on export performance for the obvious
reason that the firm has an advantage acquired through the learning process (Hoang, 1998). Bekele
and Kaur (2018), found that prior experience in the export business has a positive and significant
11
effect on export performance. Similarly, a study conducted in Estonia found that firms that have
managers and well-paid workers who have experience of exporting to certain countries will
increase the likelihood of entering that area i.e. export propensity (Masso, Roigas, & Vahter, 2015).
However, the effect on the export intensity is not that significant (Masso et al., 2015). Hoang
(1998), found the export experience has no significant effect.
The ownership structure of firm such as foreign or domestic and private or public is an important
factor that could determine export performance. Foreign ownership of a firm is associated with
better managerial and technical expertise, experience, and international business linkage and
appears to have a positive relationship with firm export performance (Bekele & Kaur, 2018;
Cieślik et al., 2014; Edwards & Balchin, 2008; Niringiye & Tuyiragize, 2010). Din et al., (2009)
found that the export performance of foreign-owned firms is better compared to domestic owned
firms in Pakistan. Niringiye and Tuyiragize (2010), also found a positive relationship between
export propensity and foreign ownership in a study of Ugandan manufacturing industries. Cieślik
et al. (2014), also found that foreign ownership generally has a positive relationship. However,
this effect is not consistent across a different group of countries in the Eastern Europe region
(Cieślik et al., 2014). A study conducted using a sample of firms from various African countries
revealed a positive relationship between foreign ownership and export performance (Edwards &
Balchin, 2008).
Bhavani and Tendulkar (2001), claimed that export performance depends on the forms of
organization. The marginal effect of scale, technical efficiency and marketing expense, on export
performance differs as one move across different ownership (Bhavani & Tendulkar, 2001).
Human capital which is an indication of the quality of human resource in the firm is regarded as
one of the key factors that affect firm export performance. Skill intensity measured by the ratio of
12
white-collar workers to total number of workers does not exhibit significant effect and the sign is
also inconsistent across different African countries (Edwards & Balchin, 2008). Niringiye and
Tuyiragize (2010), also found a positive association between skill intensity and propensity to
export. On the other hand, the education level of managers has a positive effect on firms export
performance in Portugal (Serra et al., 2012).
Location of firms is another important determinant of export performance in the literature. Firms’
geographical advantage such as proximity to market, industry concentration, port and transport
infrastructure will reduce transportation cost substantially. Zhao and Zou (2002), comfirmed that
industry concentration has negative effect and location has a positive effect on export the latter
indicating that proximity to coastal areas has a positive effect in China. The authors constructed
an index variable for location instead of using the usual dummy variable instead of using the usual
binary variable design. Yi et al. (2013), also found a positive relationship between location in
coastal areas and export performance.
Innovation and technological capabilities of a firm had a positive relationship with firm
performance in most cases. Din et al. (2009) found investment in market-oriented technologies has
a positive effect. Wagner (1995) also found a positive effect of technology on firm export intensity.
According to Cieślik et al. (2014), the use of foreign technology licenses and R&D activities of a
firm is positively related to export propensity with some heterogeneity across a different group of
countries. Similarly, the use of information technology contributes to the effort of marketing as a
means of easy communication, information access and e-commerce. Edwards and Balchin (2008),
found that firms that owned website have a higher probability of exporting relative to the firms
without a website in Egypt, Kenya and South Africa.

13
Factors like quality certification, domestic market, institutional environment, and managerial
attitudes have got attention in the literature. Absence of adequate quality certification and process
standard is negatively related to the export performance of firms (Din et al., 2009). Regarding the
domestic market, Bramati, Gaggero, and Solomon (2015) found that domestic market competition
has a positive relationship with the level of export intensity of a firm. Similarly, Wagner (1995)’s
a study indicated domestic market share has positive effect on export performance of a firm.
Regarding business environment factors, supply limitation, macroeconomic and legal environment
have a significant effect in determining export propensity with variability across countries in
Africa (Edwards & Balchin, 2008). A study by Kimuyu (2007) focused on the implication of
corruption on firm’s performance in Kenya and particularly found that corruption has negatively
affected the propensity to export.
A study by Serra et al. (2012), indicated that the number of languages spoken by managers and
commitment to exporting is found to be key determinants. This study conducted on the sample of
textile firms from Portugal and the UK. A study conducted on Spanish and Italian SMEs found
the entrepreneurial orientation of managers is a key factor in fostering export performance when
there are organizational learning and innovation (Fernández-Mesa & Alegre, 2015).
There are few empirical studies focusing on the case of Ethiopia. Among these, Gete (2019), has
identified raw material supplies, logistics and transportation, skill intensity, financial access, use
of the internet, productivity and marketing activities as important factors that determine export
performance firms in Dire Dewa, Ethiopia. This study was based on primary data and employed a
qualitative method of analysis. Another study that focused on the survival of firms in the export
market by Gebreyesus and Gebregergis (2018), indicated firms that are export-orientated,
privately owned, firms that are located outside the capital and that have higher productivity are
14
likely to stay longer in the export market. Even though this study did not measure firm’s export
performance, it provides some clue about the key factors that affect the export behaviour of firms.
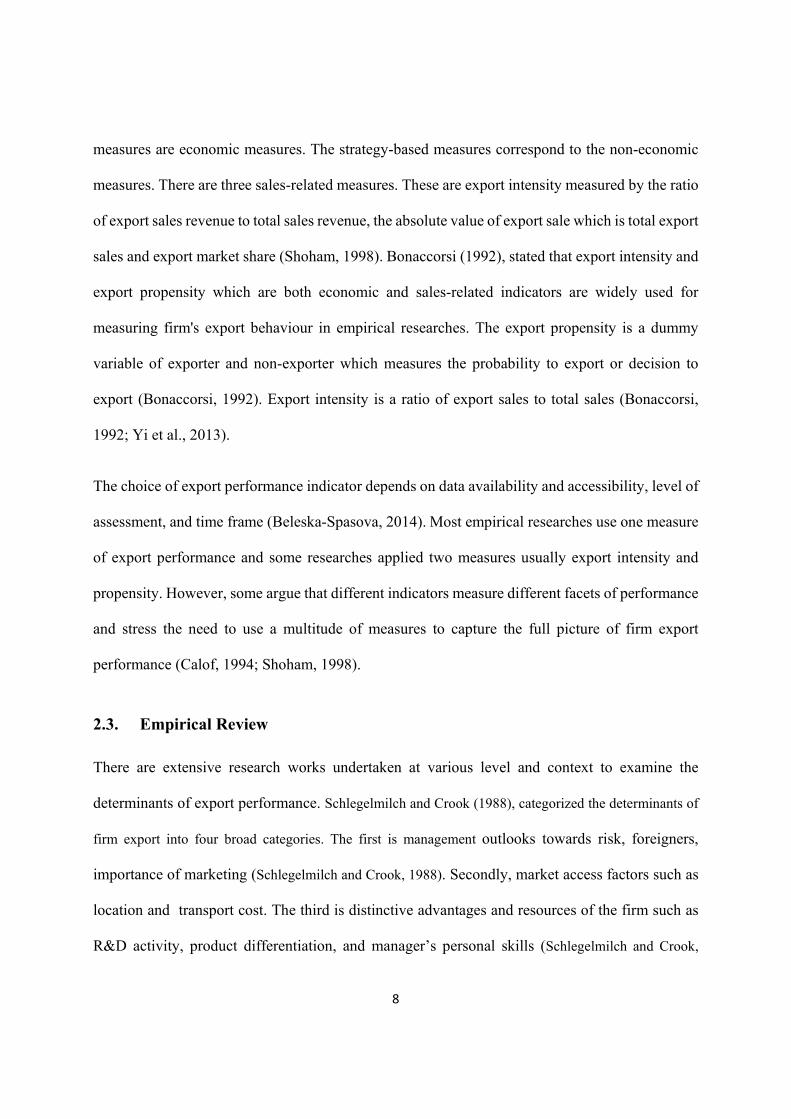
2.4. Overview of manufacturing industry in Ethiopia
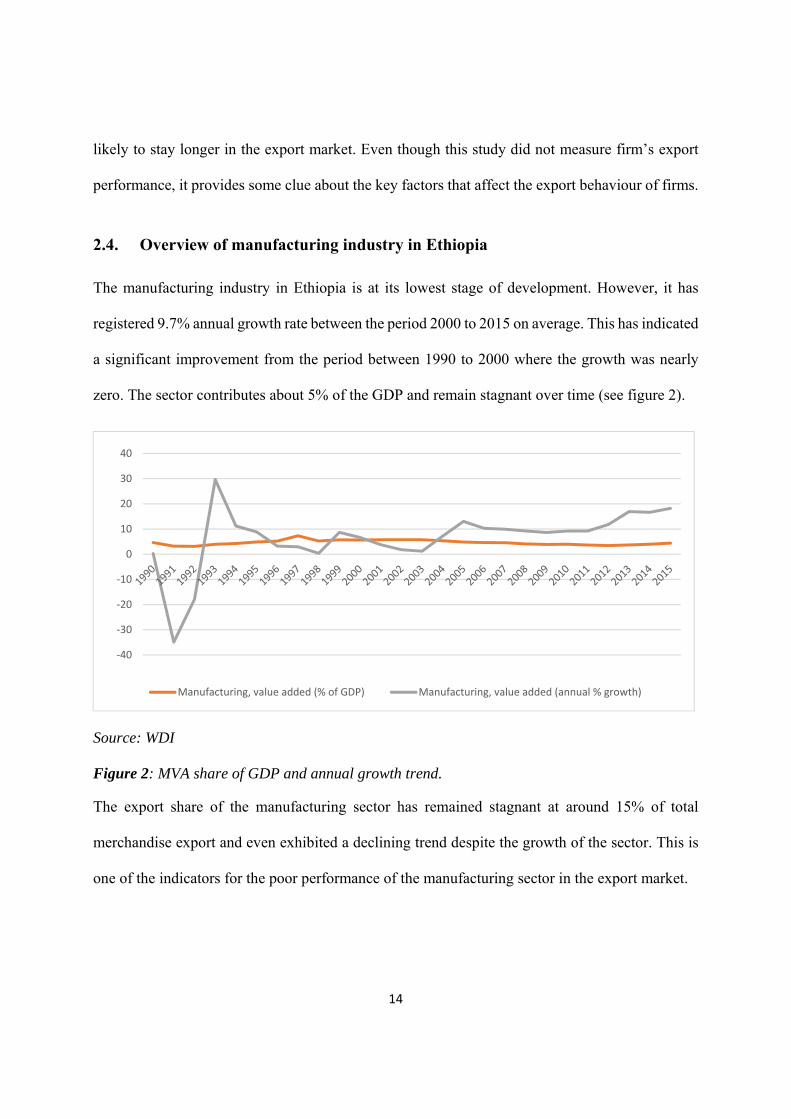
The manufacturing industry in Ethiopia is at its lowest stage of development. However, it has
registered 9.7% annual growth rate between the period 2000 to 2015 on average. This has indicated
a significant improvement from the period between 1990 to 2000 where the growth was nearly
zero. The sector contributes about 5% of the GDP and remain stagnant over time (see figure 2).
Source: WDI
Figure 2: MVA share of GDP and annual growth trend.
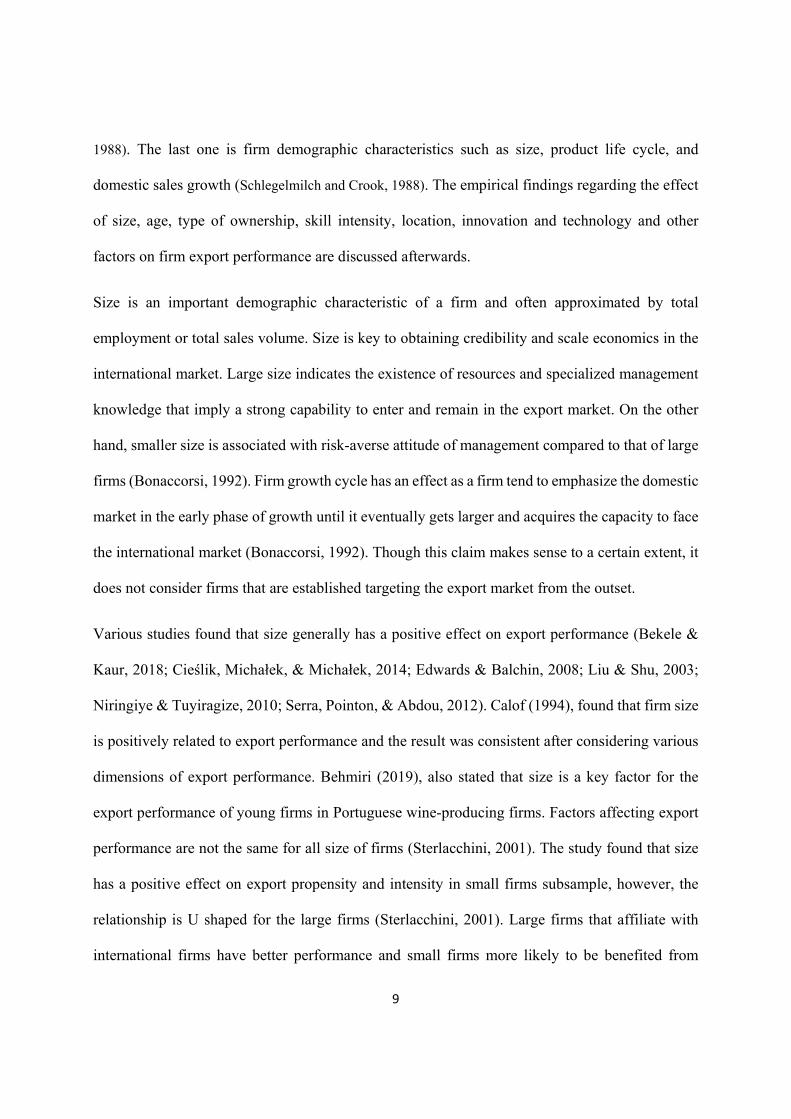
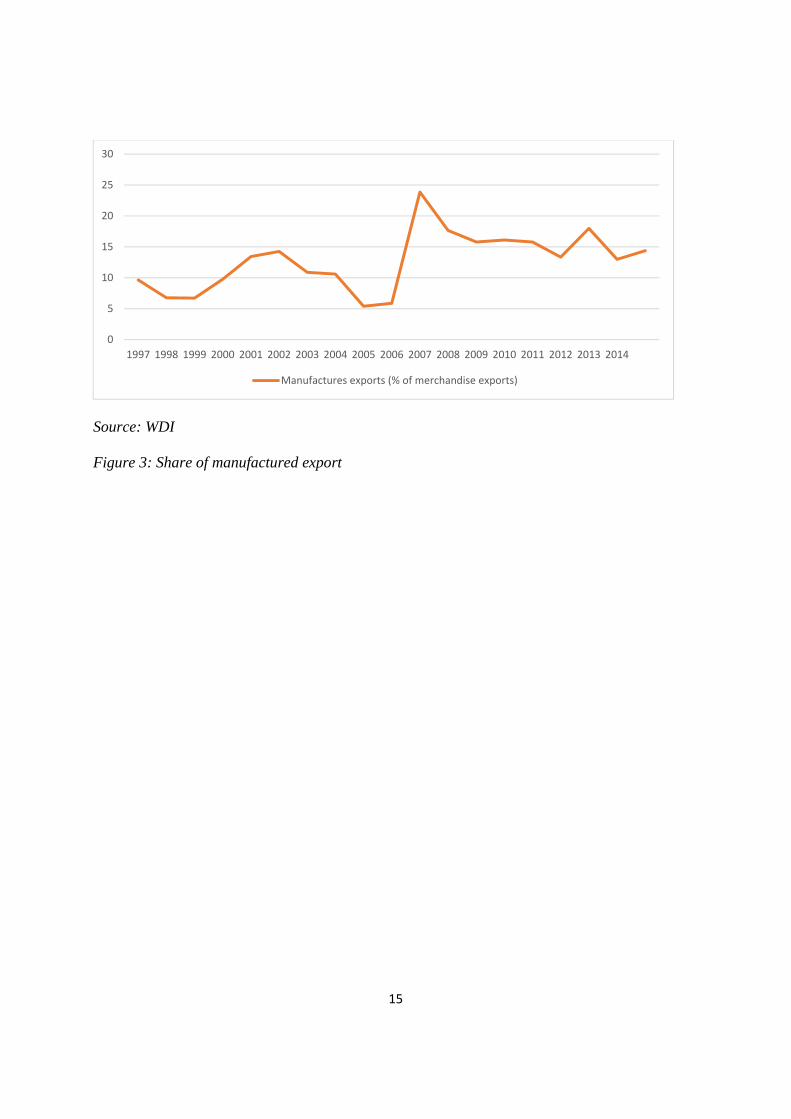
The export share of the manufacturing sector has remained stagnant at around 15% of total
merchandise export and even exhibited a declining trend despite the growth of the sector. This is
one of the indicators for the poor performance of the manufacturing sector in the export market.
‐40
‐30
‐20
‐10
0
10
20
30
40
Manufacturing, value added (% of GDP) Manufacturing, value added (annual % growth)
15
Source: WDI
Figure 3: Share of manufactured export
0
5
10
15
20
25
30
1997 1998 1999 2000 2001 2002 2003 2004 2005 2006 2007 2008 2009 2010 2011 2012 2013 2014
Manufactures exports (% of merchandise exports)
16
CHAPTER THREE
3. RESEARCH DESIGN AND METHODOLOGY
3.1. Research Method and Data
There are two major sources of firm-level data for Ethiopian manufacturing firms. The first is the
large and medium scale manufacturing survey of Ethiopia (LMSMS) which is conducted annually
by the Central Statistics Agency (CSA). This survey has wide coverage (geographical and number
of firms) and extensively used for national accounting purpose and micro-level analysis of firm
behaviour. Its major drawback is that it covers only basic variables related to firm hence, has a
limited option when it comes to variables. The second source of data is the World Bank (WB)
Enterprise survey which is conducted every five years. Sofar, WB has conducted three rounds of
the survey in 2006, 2011 and 2015. The 2011 and 2015 can be used to construct unbalanced panel
data because there are firms that have been covered on both surveys. The main advantage of this
data set is that it provides a wide range of variables regarding the firm. However, geographically
it only covers four regions and the sample size is smaller.
Therefore, the WB enterprise survey is used for the econometric analysis to take advantage of the
variable choice it provides. The number of observation is 404 and the number of firms is 335 after
some observations are dropped during data cleaning. Also, the analysis is supplemented by WB’s
world development indicator (WDI) data and CSA’s 2016/17 LMMI survey data.
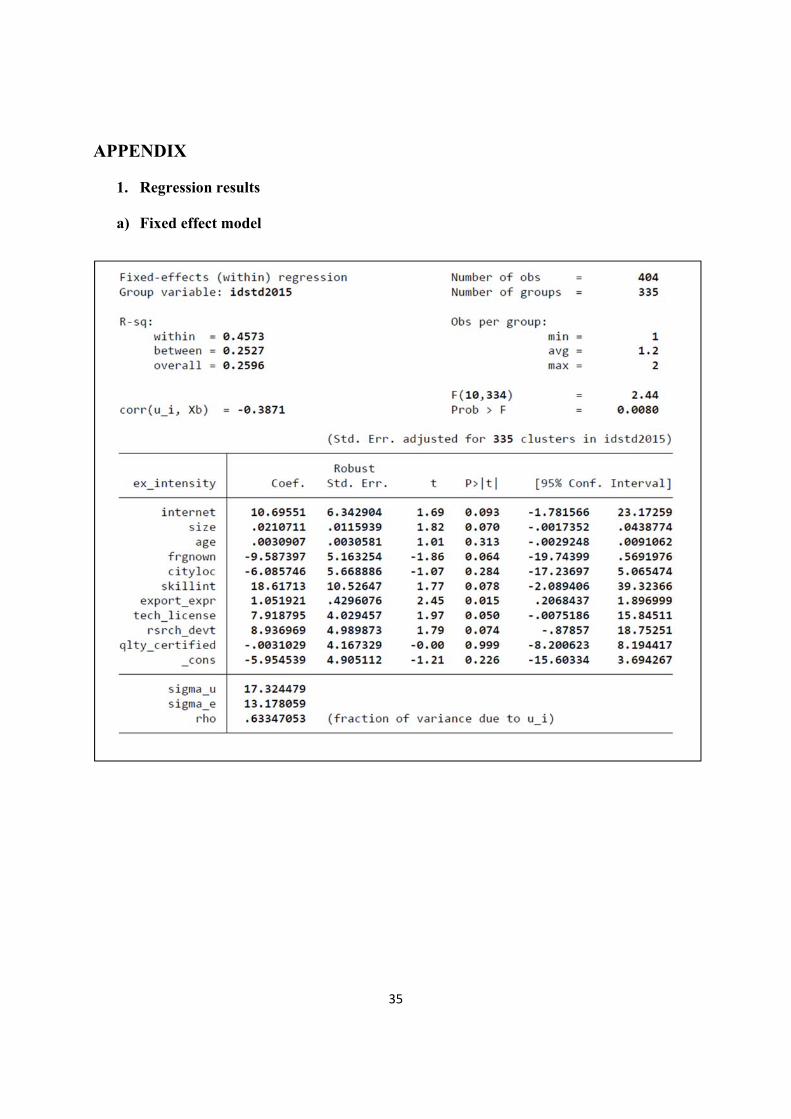
The study is based primarily on quantitative research method using a panel data set. There are two
options for panel data analysis namely Fixed Effect (FE) and Random Effect (RE).
17
In FE the unobserved effect ai will be eliminated during the first differencing as it is assumed to
be correlated with independent variables (Cov xitj, ai ≠ 0). In the case of RE, however, ai is assumed
to be uncorrelated with the independent variables in all periods (Cov xitj, ai = 0). In this case,
elimination of ai will result in inefficient estimator in the regression (Wooldridge, 2016). Usually,
the famous Hausman test is applied to decide the appropriate model for the case at hand among
the two. To this end, Fixed Effect (FE) model appeared to be appropriate for the analysis (see
appendix).
However, due to the characteristics of dependent variables data tobit and probit models of panel
data are used for the final hypothesis testing. The export intensity-dependent variable is a ratio and
it involves a significant number of observations with zero values. The appropriate model for such
kind of data distribution is the tobit model. On the other hand, the export propensity is a binary
dependent variable that holds only 0 or 1 values. The linear probability model specifically probit
model should be applied for this kind of dependent variable (Wooldridge, 2016).
3.2. Model specification and definition of variables
Two models of export performance are proposed based on the literature considering both internal
and external factors. The first model is the export intensity model.
𝑒𝑥 𝛽 𝛽 𝑤𝑒𝑏𝑠𝑖𝑡𝑒 𝛽 𝑠𝑖𝑧𝑒 𝛽 𝑎𝑔𝑒 𝛽 𝑓𝑟𝑔𝑛𝑜𝑤𝑛 𝛽 𝑐𝑖𝑡𝑦𝑙𝑜𝑐 𝛽 𝑠𝑘𝑖𝑙𝑙𝑖𝑛𝑡
𝛽 𝑒𝑥𝑝𝑜𝑟𝑡_𝑒𝑥𝑝𝑟 𝛽 𝑡𝑒𝑐ℎ_𝑙𝑖𝑐𝑒𝑛𝑠𝑒 𝛽 𝑟𝑠𝑟𝑐ℎ_𝑑𝑒𝑣𝑡 𝛽 𝑞𝑙𝑡𝑦_𝑐𝑒𝑟𝑡𝑖𝑓𝑖𝑒𝑑 𝜀 ……….(1)
The dependent variable ex_intensity denotes export performance, measured by a ratio of export
sales to total sales. It is the most commonly used measure of export performance.

18
The second model is the export propensity model. The dependent variable is a binary variable that
holds 1 for firms that export and 0 for those not exporting.
𝑒𝑥_𝑝𝑟𝑜𝑝𝑒𝑛𝑠𝑖𝑡 𝛽 𝛽 𝑤𝑒𝑏𝑠𝑖𝑡𝑒 𝛽 𝑠𝑖𝑧𝑒 𝛽 𝑎𝑔𝑒 𝛽 𝑓𝑟𝑔𝑛𝑜𝑤𝑛 𝛽 𝑐𝑖𝑡𝑦𝑙𝑜𝑐
𝛽 𝑠𝑘𝑖𝑙𝑙𝑖𝑛𝑡 𝛽 𝑡𝑒𝑐ℎ_𝑙𝑖𝑐𝑒𝑛𝑠𝑒 𝛽 𝑟𝑠𝑟𝑐ℎ_𝑑𝑒𝑣𝑡 𝛽 𝑞𝑙𝑡𝑦_𝑐𝑒𝑟𝑡𝑖𝑓𝑖𝑒𝑑 𝜀 ……………(2)
Whereas website denotes the use of the website, size denotes firm size proxied by employment,
age denotes the business experience of a firm, frgnown denotes foreing ownership of a firm,
cityloc denotes the geographical location of firms in the capital city and the surrounding region,
skillint denotes skill intensity as a measure of the human capital of a firm, export_expr denotes
firm’s experience in the export market, tech_license denotes the use of licenced technology,
𝑟𝑠𝑟𝑐ℎ_𝑑𝑒𝑣𝑡 denotes if a firm has invested in R&D activities and qlty_certified denotes quality
certification. The definition and measurement scale is summarized in the following table.
Variable Definition Type
Ex_intensity Ration of firm’s export to total sales. ratio
Ex_propensity 1 if a firm is exporter and 0 otherwise binary
website 1 if a firm has website and 0 otherwise binary
Size Firm’s number of full-time employees. continuous
Age Number of years since a firm is established/business
experience.
continuous
frgnown 1 if a foreigner has more than 10% share in the firm’s equity
and 0 otherwise.
binary
cityloc 1 if a firm is in the capital city and surrounding area and 0
otherwise
binary
skillint Ratio of non-production workers to total employees ratio
export_expr firm’s years of experience in the export market Continuous
tech_license 1 if a firm uses licensed technology and 0 otherwise. binary
rsrch_devt 1 if a firm invested in R&D and 0 otherwise. binary

19
qlty_certified 1 if a firm has standard quality certification and 0 otherwise binary
Table 1: Description of variables
3.3. Hypothesis
a) Export intensity
H0: Use of website, size, age, location, foreign ownership, skill intensity, technology, quality
certification on products, and export experience of firms do not affect firm export intensity.
H1: Use of website, size, age, location, foreign ownership, skill intensity, technology, quality
certification on products, and export experience of firms are positively related to firm export
intensity.
b) Export propensity
H0: Use of website, size, age, location, foreign ownership, skill intensity, technology, and quality
certification of firms do not affect firm export propensity.
H1: Use of website, size, age, location, foreign ownership, skill intensity, technology, and quality
certification of firms are positively related to firm export intensity.
20
CHAPTER FOUR
4. DATA ANALYSIS AND DISCUSSION
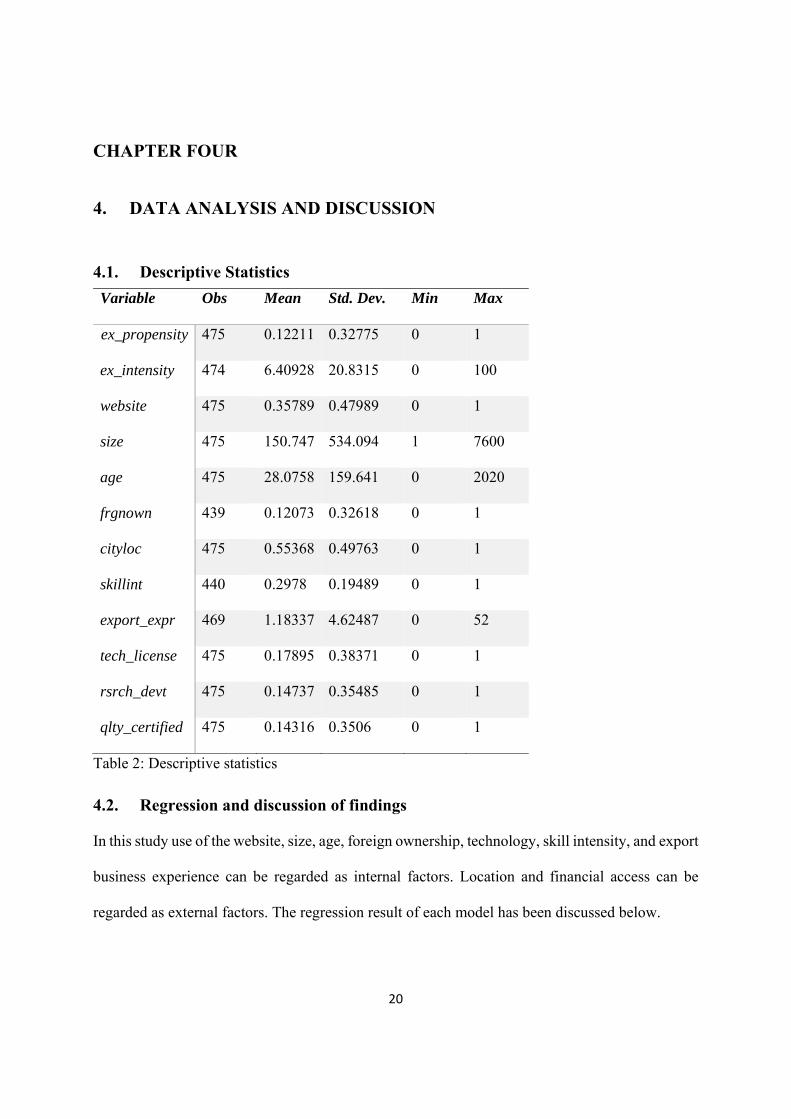
4.1. Descriptive Statistics
Variable Obs Mean Std. Dev. Min Max
ex_propensity 475 0.12211 0.32775 0 1
ex_intensity 474 6.40928 20.8315 0 100
website 475 0.35789 0.47989 0 1
size 475 150.747 534.094 1 7600
age 475 28.0758 159.641 0 2020
frgnown 439 0.12073 0.32618 0 1
cityloc 475 0.55368 0.49763 0 1
skillint 440 0.2978 0.19489 0 1
export_expr 469 1.18337 4.62487 0 52
tech_license 475 0.17895 0.38371 0 1
rsrch_devt 475 0.14737 0.35485 0 1
qlty_certified 475 0.14316 0.3506 0 1
Table 2: Descriptive statistics
4.2. Regression and discussion of findings
In this study use of the website, size, age, foreign ownership, technology, skill intensity, and export
business experience can be regarded as internal factors. Location and financial access can be
regarded as external factors. The regression result of each model has been discussed below.
21
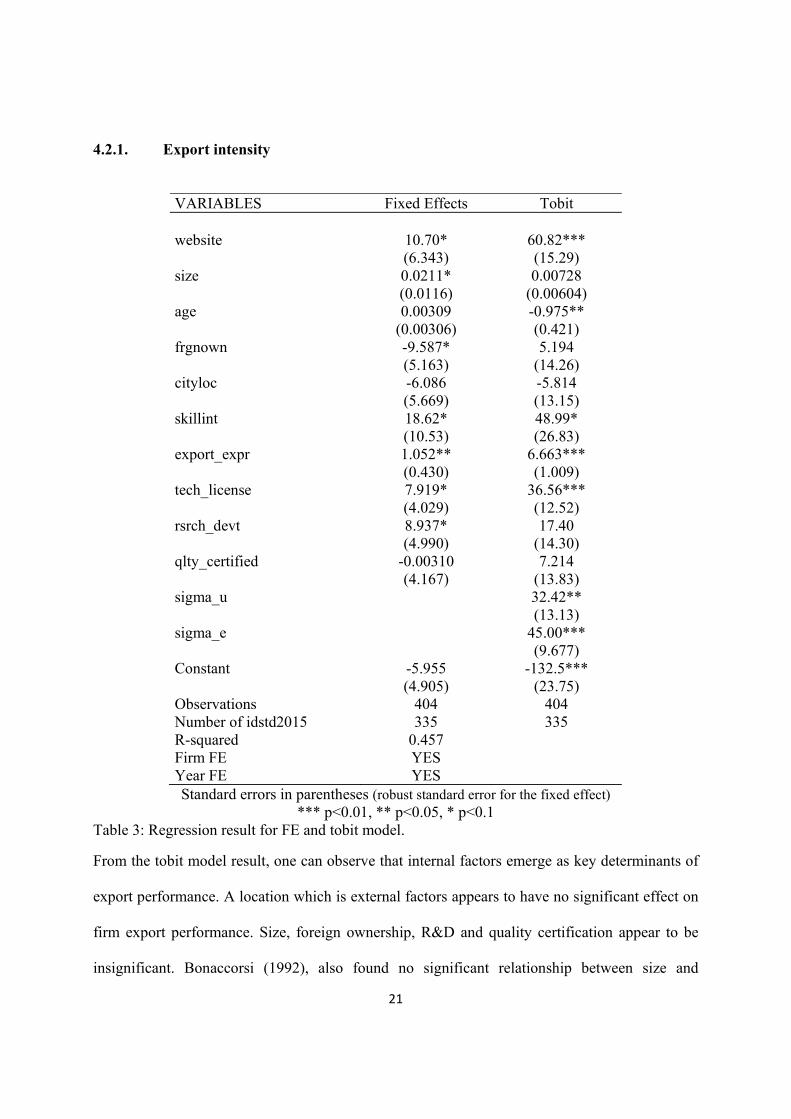
4.2.1. Export intensity
VARIABLES Fixed Effects Tobit website 10.70* 60.82*** (6.343) (15.29) size 0.0211* 0.00728 (0.0116) (0.00604) age 0.00309 -0.975** (0.00306) (0.421) frgnown -9.587* 5.194 (5.163) (14.26) cityloc -6.086 -5.814 (5.669) (13.15) skillint 18.62* 48.99* (10.53) (26.83) export_expr 1.052** 6.663*** (0.430) (1.009) tech_license 7.919* 36.56*** (4.029) (12.52) rsrch_devt 8.937* 17.40 (4.990) (14.30) qlty_certified -0.00310 7.214 (4.167) (13.83) sigma_u 32.42** (13.13) sigma_e 45.00*** (9.677) Constant -5.955 -132.5*** (4.905) (23.75) Observations 404 404 Number of idstd2015 335 335 R-squared 0.457 Firm FE YES Year FE YES Standard errors in parentheses (robust standard error for the fixed effect)
*** p<0.01, ** p<0.05, * p<0.1 Table 3: Regression result for FE and tobit model.
From the tobit model result, one can observe that internal factors emerge as key determinants of
export performance. A location which is external factors appears to have no significant effect on
firm export performance. Size, foreign ownership, R&D and quality certification appear to be
insignificant. Bonaccorsi (1992), also found no significant relationship between size and
22
manufacturing sector export performance. However, this result shows deviation from the large
body of literature that suggests a positive effect of firm size and foreign ownership (Bekele & Kaur,
2018; Cieślik, Michałek, & Michałek, 2014; Niringiye & Tuyiragize, 2010).
The use of the website has shown positive and significant association with export intensity. This
implies that firms that use website have 60.8% higher export intensity compared to firms without
a website while holding other things constant. Presence of information technology will help firms
to easily exchange information with their clients about their products and provide them access to
information about the market (Edwards & Balchin, 2008).
Age has a negative effect on export intensity which imply that the older the firm the lower the
export performance. The regression result shows that as the export intensity of a firm will decline
by 1 % as the age of the firm increases by a year. This finding seems to support the claims that
new firms tend to engage in export business, make an aggressive move, and use recent technologies
as the old firms may tend to be rigid to change their existing strategy (Edwards & Balchin, 2008;
Niaz et al., 2019). In the case of Ethiopia, most of exporting manufacturing firms are probably new
firms that have started business in the last decade.
Technology is also found to be significant and positive. Firms that use licensed technology have
36.5% higher export intensity compared to the firms that do not use any licensed technology.
Technology is vital for cost minimization, improved quality, and overall firm competitiveness, and
the result is consistent with the findings of previous empirical studies (Cieślik et al., 2014; Din et
al., 2009; Wagner, 1995).
Moreover, prior export business experience of a firm and the level of its skill intensity is positively
and significantly associated with export intensity. Export intensity increases by 49% as firm’s skill
23
intensity increases by 1 percentage. This result shows the importance of quality human capital for
better export performance. A study in Uganda also found a positive association of skill intensity
and export performance (Niringiye & Tuyiragize, 2010). The experience in the export business is
positively and significantly associated with export intensity at 1% level of significance. The export
intensity increases by 6.6% as export experience increases by a year.
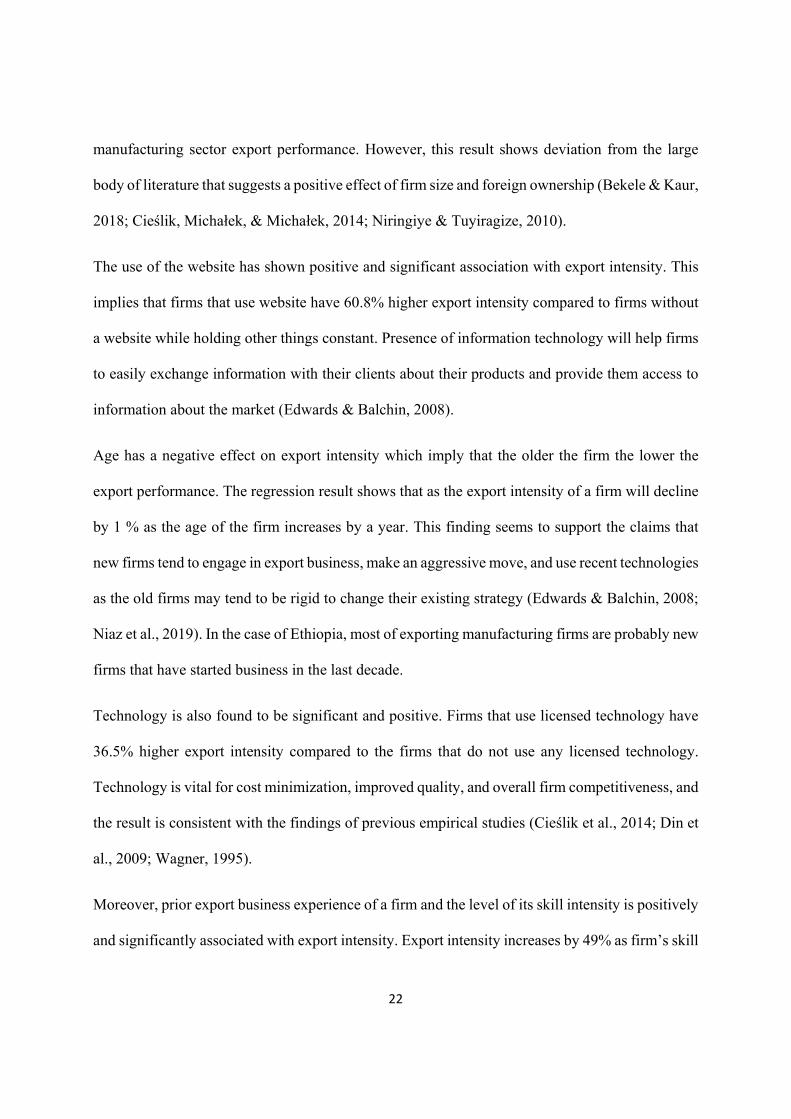
4.2.2. Export propensity
VARIABLES Probit website 4.169*** (1.035) size 0.00412** (0.00164) age -0.00231 (0.00913) frgnown 1.014 (1.057) cityloc 0.243 (0.987) skillint 2.657 (1.982) tech_license 0.520 (1.004) rsrch_devt 1.817* (0.933) qlty_certified 3.633*** (1.042) lnsig2u 3.105*** (0.230) Constant -11.34*** (1.268) Observations 407 Number of idstd2015 337
Standard errors in parentheses *** p<0.01, ** p<0.05, * p<0.1
Table 4:Regression result for probit model

24
The above result table shows that use of the website, size of firm, R&D investment, and quality
certification are key determinants of the export decision or propensity of export. The coefficients
of these variables are positive meaning firms that use the website, larger firms, and firms with
quality certification have a higher probability of engaging in export. Firms that have websites,
R&D investment, quality certification have 4.2%, 1.8%, and 3.6% higher probability of exporting,
respectively. Other things remain constant, the probability of exporting increases by 0.4% as firm
size increases by a unit.
These findings support the argument that different measures of export performance lead to
different result (Calof, 1994; Shoham, 1998). Some variables that are significant in the export
intensity model for example technology and skill intensity are not significant in the export
propensity model. Size is important for export decision while it is not significant for the export
intensity and vice versa for age. Use of the website is the only variable that is significant in both
models. The reason for the difference might be the difference in measurement and method.
4.3. Challenges facing manufacturing firms
The analysis above largely illuminates the factors that are specific to individual firms. However,
different obstacles could affect firm’s production capacity. This is evident from the low level of
production capacity utilization. The average capacity utilization level of the medium and large
manufacturing is 62.3% during 2010/11 and 2015/16.
Year 2010/11 2011/12 2012/13 2013/14 2014/15 2015/16 AverageCapacity utilization (%) 66.9 65.88 65.9 65.6 61 54 62.3Share of imported raw material input (%) 44.1 37.2 44.3 50.9 49.0 48.8 45.7
Source: Based on LMMIS 2010 to 2016
Table 5:Capacity utilization and share of imported raw material
25
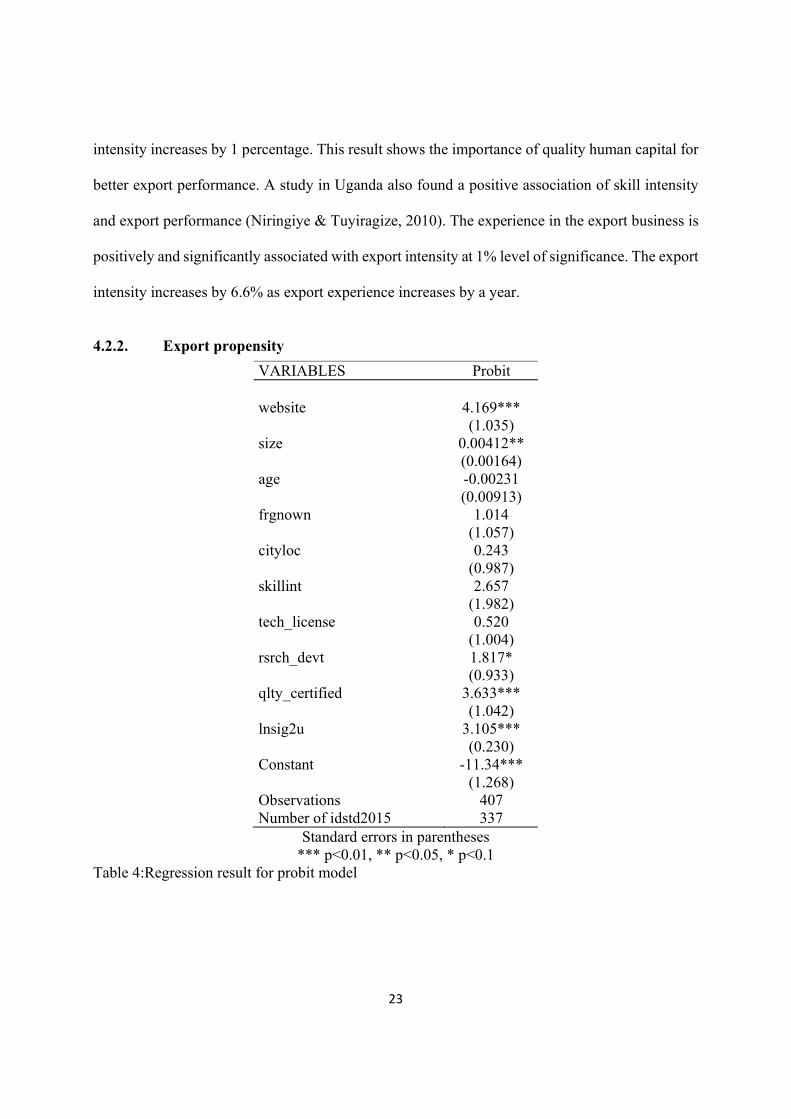
The imported share of raw material input is 45.7 % during the same period. This implies that there
is huge dependence on import for raw material and this added with the critical foreign exchange
shortage in the country and poor logistics system, it has affected the production capacity and
competitiveness of the firms in the export market. In table 6 below, shortage of raw materials
supply is stated as the first major reason for not working at full capacity by 34 % of the firms
covered in the survey in 2015/16.
Major Reason Percentage of firms stated as first reason for not working at full capacity 2010/11 2011/12 2012/13 2013/14 2014/15 2015/16
Shortage of supply of raw materials 40.15 40.61 36.01 36.29 33.08 33.85
Shortage of supply of spare parts 3.79 3.51 4.64 3.29 2.63 4.44
Absence of market demand 17.75 17.3 18.6 18.74 18.86 25.5
Absence of credit facility 7.70 5.72 5.88 6.63 6.49 4.55
Shortage of foreign exchange 5.97 5.67 6.98 5.91 4.33 4.33
Lack of adequate skills 1.84 2.31 2.3 1.57 1.35 1.93 others 2.41 2.64 1.63 2.19 1.97 2.11
Not stated 20.39 22.25 23.96 25.37 31.3 23.28 Total 100.00 100 100 100 100 100
Source: Based on LMMIS 2010 to 2016
Table 6:Major reason for not working at full capacity
Moreover, absence of market demand, absence of credit facility, and shortage of foreign exchange
were the second, the third, and the fourth popular reason for not working at full capacity. These
problems are also stated as major operational problems by the medium and large manufacturing
firms covered in the survey (see table 7).
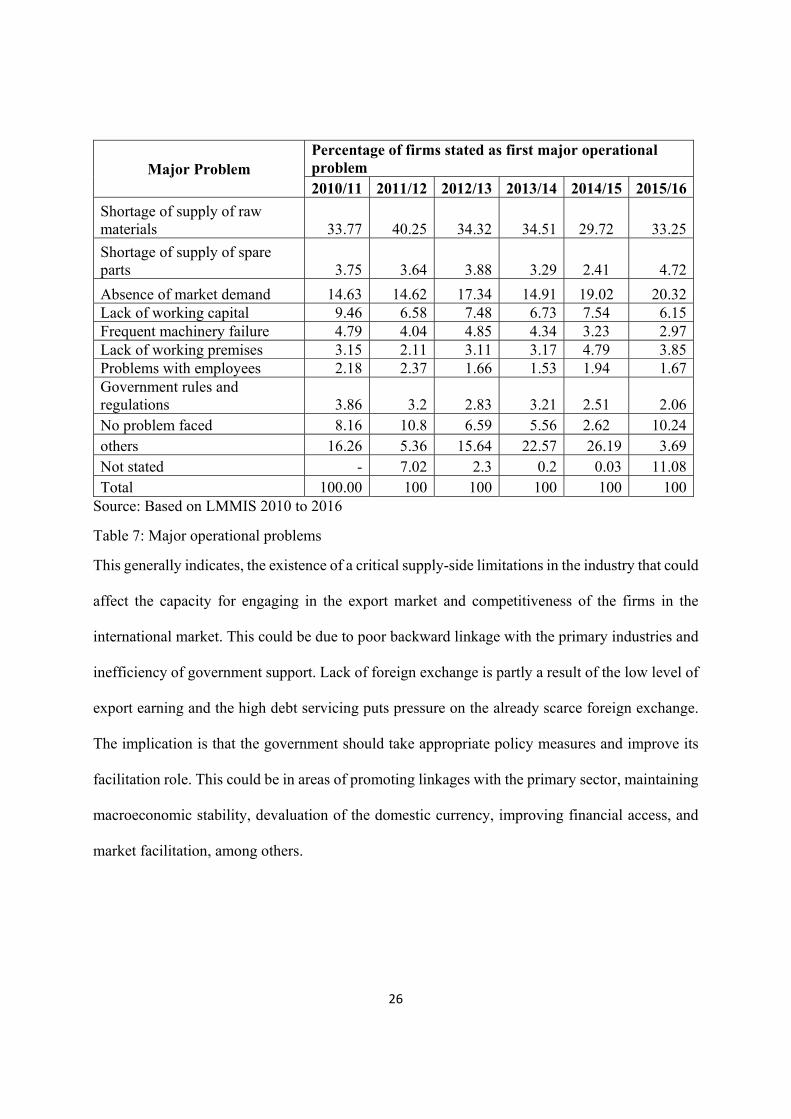
26
Major Problem Percentage of firms stated as first major operational problem 2010/11 2011/12 2012/13 2013/14 2014/15 2015/16
Shortage of supply of raw materials 33.77 40.25 34.32 34.51 29.72 33.25
Shortage of supply of spare parts 3.75 3.64 3.88 3.29 2.41 4.72
Absence of market demand 14.63 14.62 17.34 14.91 19.02 20.32Lack of working capital 9.46 6.58 7.48 6.73 7.54 6.15Frequent machinery failure 4.79 4.04 4.85 4.34 3.23 2.97Lack of working premises 3.15 2.11 3.11 3.17 4.79 3.85Problems with employees 2.18 2.37 1.66 1.53 1.94 1.67Government rules and regulations 3.86 3.2 2.83 3.21 2.51 2.06No problem faced 8.16 10.8 6.59 5.56 2.62 10.24others 16.26 5.36 15.64 22.57 26.19 3.69Not stated - 7.02 2.3 0.2 0.03 11.08Total 100.00 100 100 100 100 100
Source: Based on LMMIS 2010 to 2016
Table 7: Major operational problems
This generally indicates, the existence of a critical supply-side limitations in the industry that could
affect the capacity for engaging in the export market and competitiveness of the firms in the
international market. This could be due to poor backward linkage with the primary industries and
inefficiency of government support. Lack of foreign exchange is partly a result of the low level of
export earning and the high debt servicing puts pressure on the already scarce foreign exchange.
The implication is that the government should take appropriate policy measures and improve its
facilitation role. This could be in areas of promoting linkages with the primary sector, maintaining
macroeconomic stability, devaluation of the domestic currency, improving financial access, and
market facilitation, among others.

27
CHAPTER FIVE
5. CONCLUSION AND RECOMMENDATION
5.1. Conclusion
This study attempted to examine the determinants of export performance measured in export
intensity and export propensity. The analysis is made based on panel data from the world bank
survey. The finding shows that the use of website, firm size, firm age, skill intensity, technology,
export experience and quality certification are the key determinants of export performance. In
contrast, location, financial access, and foreign ownership are not significant in determining export
performance. In addition, firms face a shortage of raw material supply, low market demand,
shortage of foreign exchange, and low financial access which in turn are major reasons for
underutilization of production capacity.
5.2. Recommendation
The study suggests that the export performance of firms can be improved through the provision of
information technology. Firm managers should consider technology, standardization of process
and certification as key focus areas when formulating export strategy. Firms should make use of
internet-based modern communication tools such as website and email to exchange information
with clients easily and promote their products. The government should also provide adequate
support to firms in acquiring technology and quality certification. Moreover, it should promote
linkage with the primary sector, improve financial access and provide market facilitation assistance.
In this study, the sectoral difference within the manufacturing industry is not considered hence,
could not capture the industry-specific behaviours of each sub-industry. Moreover, recent data

28
may provide different result by capturing new developments such as the establishment of export
and product specialized industrial parks and the danger posed by the deterioration of the security
situation in recent years.

29
BIBLIOGRAPHY
Alemu, T. (2018). The determinants of Export performance in Ethiopia: A panel data analysis
(Addis Ababa University). Retrieved from
http://etd.aau.edu.et/bitstream/handle/123456789/13710/Tigist
Alemu.pdf?sequence=1&isAllowed=y
Anagaw, K. B. and, & Demmissie, W. M. (2013). Determinants of export performance in
Ethiopia : A Var model analysis. Abhinav, 2(5), 94–109. Retrieved from
https://bit.ly/2ukFW45
Behmiri, N. B. (2019). Firm characteristics and export performance in Portuguese wine fi rms.
(August). https://doi.org/10.1108/IJWBR-07-2018-0032
Bekele, D. S., & Kaur, N. (2018). Firm characteristics on export performance: Case of Ethiopian
exporting firms. International Journal of Management Studies, 5(1(2)), 28–36. Retrieved
from http://www.researchersworld.com/ijms/
Beleska-Spasova, E. (2014). Determinants and measures of export performance: Comprehensive
literature review. JCEBI, 1(1), 63–74. Retrieved from
http://www.eccf.ukim.edu.mk/ArticleContents/JCEBI/05 Elena Beleska-Spasova.pdf
Bhavani, T. A., & Tendulkar, S. D. (2001). Determinants of firm-level export performance: A
case study of Indian textile garments and apparel industry. Journal of International Trade
and Economic Development, 10(1), 65–92. https://doi.org/10.1080/0963819001001527
Bonaccorsi, A. (1992). On the relationship between firm size and export intensity. Journal of
International Business Studies, 23(4), 605–635.
Bramati, M. C., Gaggero, A. A., & Solomon, E. M. (2015). International Trade and Domestic
Competition: Evidence from Belgium. Review of Industrial Organization, 46(4), 383–399.
Buturac, G., Mikulić, D., & Palić, P. (2019). Sources of export growth and development of
manufacturing industry: Empirical evidence from Croatia. Economic Research-Ekonomska
Istraživanja, 32(1), 101–127. https://doi.org/10.1080/1331677X.2018.1550003
Calof, J. L. (1994). The Relationship between Firm Size and Export Behavior Revisited. Source:
30
Journal of International Business Studies, 25(2), 367–387.
Cavusgil, S. T., & Nevin, J. R. (1981). Internal determinants of export marketing behavior: An
empirical investigation. In Source: Journal of Marketing Research (Vol. 18). Retrieved
from http://www.jstor.com/stable/3151322
Cavusgil, S. T., & Zou, S. (1994). Marketing strategy-performance relationship: An investigation
of the empirical link in export market ventures. Ournal of Marketing, 58(1), 1–21.
Chen, J., Sousa, C. M. P., & He, X. (2016). The determinants of export performance: A review
of the literature 2006-2014. International Marketing Review, 33(5), 626–670.
https://doi.org/10.1108/IMR-10-2015-0212
Cieślik, A., Michałek, J., & Michałek, A. (2014). The influence of firm characteristics and export
performance in Central and Eastern Europe : Comparisons of Visegrad , Baltic and
Caucasus States. Entrepreneurial Business and Economics Review, 2(1), 7–18.
CSA. (2017). Large and medium scale manufacturing and electricity industries survey. Central
Statistical Agency.
Din, M. U., Ghani, E., & Mahmood, T. (2009). Determinants of Export Performance of Pakistan:
Evidence from the Firm-Level Data. The Pakistan Development Review, 48(3), 227–240.
Retrieved from https://about.jstor.org/terms
Edwards, L., & Balchin, N. (2008). Trade related business climate and manufacturing export
performance in Africa : A firm-level analysis. Munich Personal RePEc Archive, (32863).
Retrieved from https://mpra.ub.uni-muenchen.de/32863/
Fernández-Mesa, A., & Alegre, J. (2015). Entrepreneurial orientation and export intensity:
Examining the interplay of organizational learning and innovation. International Business
Review, 24(1), 148–156. https://doi.org/10.1016/j.ibusrev.2014.07.004
Gebreyesus, A., & Gebregergis, M. (2018). Export survival of manufacturing firms in Ethiopia :
Empirical evidence. MPRA Paper, (85348). Retrieved from https://mpra.ub.uni-
muenchen.de/85348/
Gebreyesus, M., & Kebede, A. (2017). Ethiopia ’ s export promotion and the misalignment of

31
the tariff and exchange rate regimes (No. 19). Addis Ababa.
Gete, G. (2019). Determinants of export performance of manufacturing industries in Dire Dawa.
European Journal of Business and Management, 11(7), 183–189.
https://doi.org/10.7176/EJBM
Hoang, B. P. (1998). A causal study of relationships between firm characteristics, international
marketing strategies, and export performance. Management International Review, 38(1),
73–93. Retrieved from http://www.jstor.com/stable/40228474
Kimuyu, P. (2007). Corruption, firm growth and export propensity in Kenya. International
Journal of Social Economics, 34(3), 197–217. https://doi.org/10.1108/03068290710726748
Liu, X., & Shu, C. (2003). Determinants of export performance: Evidence from Chinese
industries. Economics of Planning, 36(1), 45–67.
https://doi.org/10.1023/B:ECOP.0000005728.05260.5d
Marconi, N., Reis, C. F. de B., & Araújo, E. C. de. (2016). Manufacturing and economic
development: The actuality of Kaldor’s first and second laws. Structural Change and
Economic Dynamics, 37, 75–89. https://doi.org/10.1016/j.strueco.2015.12.002
Masso, J., Roigas, K., & Vahter, P. (2015). Foreign market experience, learning by hiring and
firm export performance Foreign market experience, learning by hiring a export
performance Jaan Masso1 • Kārt Roigas1 • Priit Vahter1. Weltwirtschaftliches Archiv,
151(4), 659–686. https://doi.org/10.1007/sl0290-015-0224-y
Menji, S. (2010). Export performance and determinants in Ethiopia. Retrieved from
https://mpra.ub.uni-muenchen.de/29427/1/MPRA_paper_29427.pdf
MoFED. (2002). (SDRP) Sustainable development and poverty reduction program.
https://doi.org/10.1007/978-3-319-69625-6_72-2
MoFED. (2005). (PASDEP) A Plan for accelerated and sustained development to end Poverty.
MOFED. (2010). (GTP I) Ethiopian Growth and Transformation Plan I.
National Planning Commission. (2016). (GTP II) Growth and Transformation Plan II. In
National Planning Commission. Retrieved from http://www.npc.gov.et/web/guest/gtp/-
32
/document_library_display/48Gh/view/58840
Niaz, B. B., Rebelo, J. F., Gouveia, S., & Antonio, P. (2019). Firm characteristics and export
performance in Portuguese wine firms. International Journal of Wine Business Research,
31(3), 419–440. https://doi.org/10.1108/IJWBR-07-2018-0032
Niringiye, A., & Tuyiragize, R. (2010). Determinants of a firm’s level of exports: Evidence from
manufacturing firms in Uganda (No. 196). Retrieved from https://aercafrica.org/wp-
content/uploads/2018/07/RP196.pdf
PDC. (2019). Quartely economic digest-Ethiopia (Vol. 1, pp. 1–8). Vol. 1, pp. 1–8. Addis
Ababa: Planning and Development Commission.
Schlegelmilch, B. B., & Crook, J. N. (1988). Firm‐level determinants of export intensity.
Managerial and Decision Economics, 9(4), 291–300.
https://doi.org/10.1002/mde.4090090408
Serra, F., Pointon, J., & Abdou, H. (2012). Factors influencing the propensity to export: A study
of UK and Portuguese textile firms. International Business Review, 21, 210–224.
https://doi.org/10.1016/j.ibusrev.2011.02.006
Sharma, V. M., & Erramilli, M. K. (2004). Resource-Based Explanation of Entry Mode Choice.
In Source: Journal of Marketing Theory and Practice (Vol. 12). Winter.
Shoham, A. (1998). Export Performance: A Conceptualization and Empirical Assessment.
Journal of International Marketing, 6(3), 59–81.
Sterlacchini, A. (2001). The determinants of export performance : A firm-level study of Italian
manufacturing. Weltwirtschaftliches Archiv, 137(3), 450–472. Retrieved from
https://www.jstor.org/stable/40440853
Styles, C., Patterson, P. G., & Ahmed, F. (2008). A relational model of export performance.
Journal of International Business Studies, 39(5), 880–900.
https://doi.org/10.1057/pa!grave.jibs.8400385
UNIDO. (2019). 2018 Competitive industrial performance report. Retrieved from
https://www.unido.org/sites/default/files/files/2019-05/CIP_Report_2019.pdf

33
Wagner, J. (1995). Exports, firm size, and firm dynamics. Small Business Economics, 7(1), 29–
39. https://doi.org/10.1007/BF01074314
Wernerfelt, B. (1984). A resource-based view of the firm. Strategic Management Journal, 5(2),
171–180. Retrieved from http://www.jstor.org/stable/2486175
Wooldridge, J. M. (2016). Introductory econometrics. In Introductory econometrics: A modern
approach (6th ed.). https://doi.org/10.1007/9783319659169
Yi, J., Wang, C., & Kafouros, M. (2013). The effects of innovative capabilities on exporting: Do
institutional forces matter? International Business Review, 22(2), 392–406.
https://doi.org/10.1016/j.ibusrev.2012.05.006
Zhao, H., & Zou, S. (2002). The impact of industry concentration and firm location on export
propensity and intensity: An empirical analysis of Chinese manufacturing firms. Journal of
International Marketing, 10(1), 52–71. Retrieved from
https://www.jstor.org/stable/25048878

34
APPENDIX
35
APPENDIX
1. Regression results
a) Fixed effect model
36
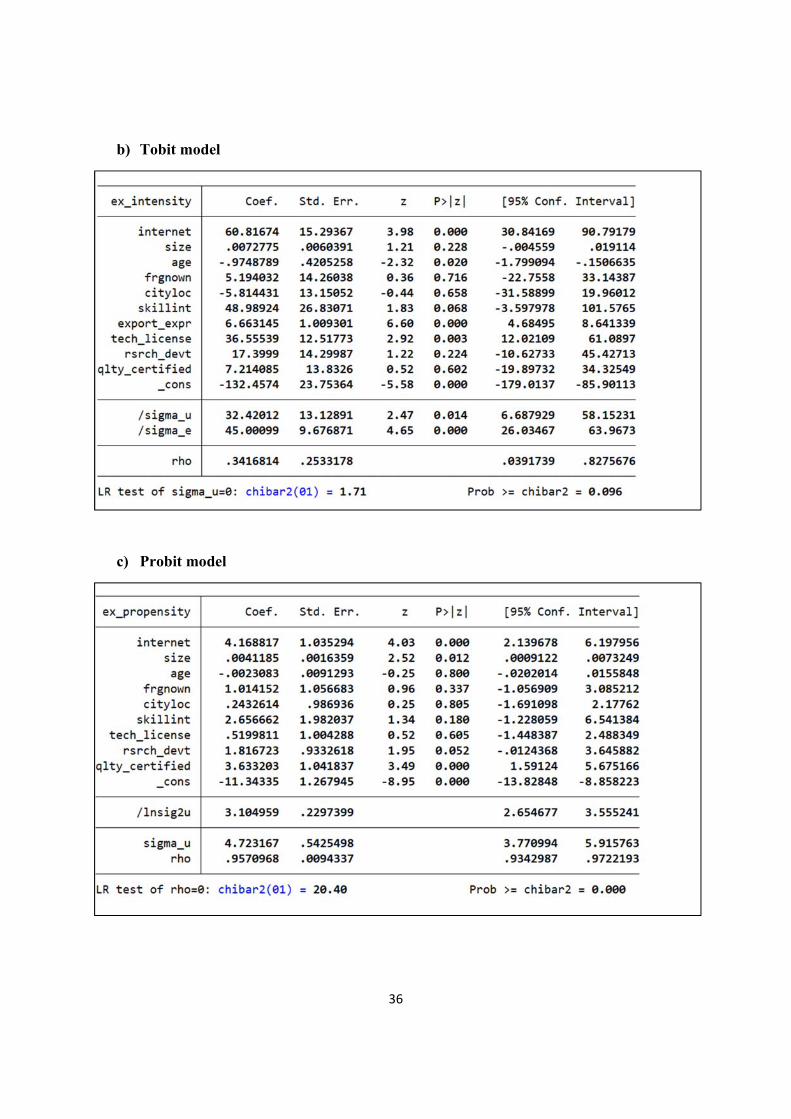
b) Tobit model
c) Probit model
37
2. Tests
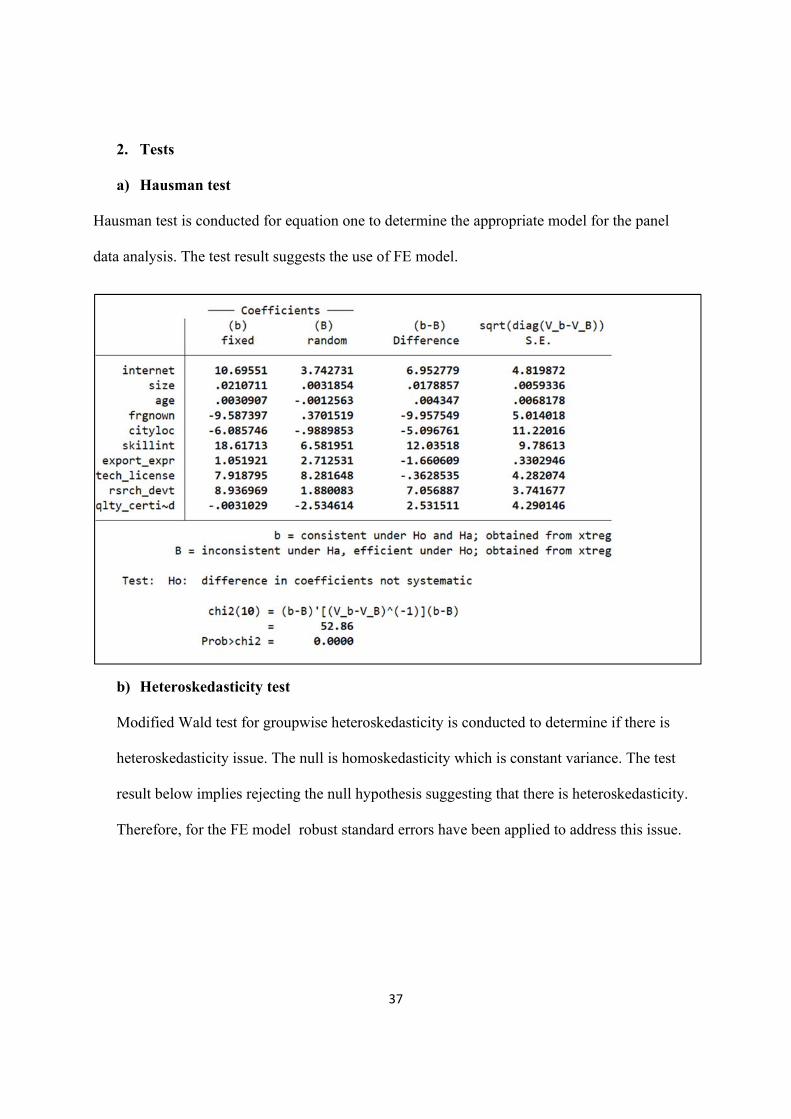
a) Hausman test
Hausman test is conducted for equation one to determine the appropriate model for the panel
data analysis. The test result suggests the use of FE model.
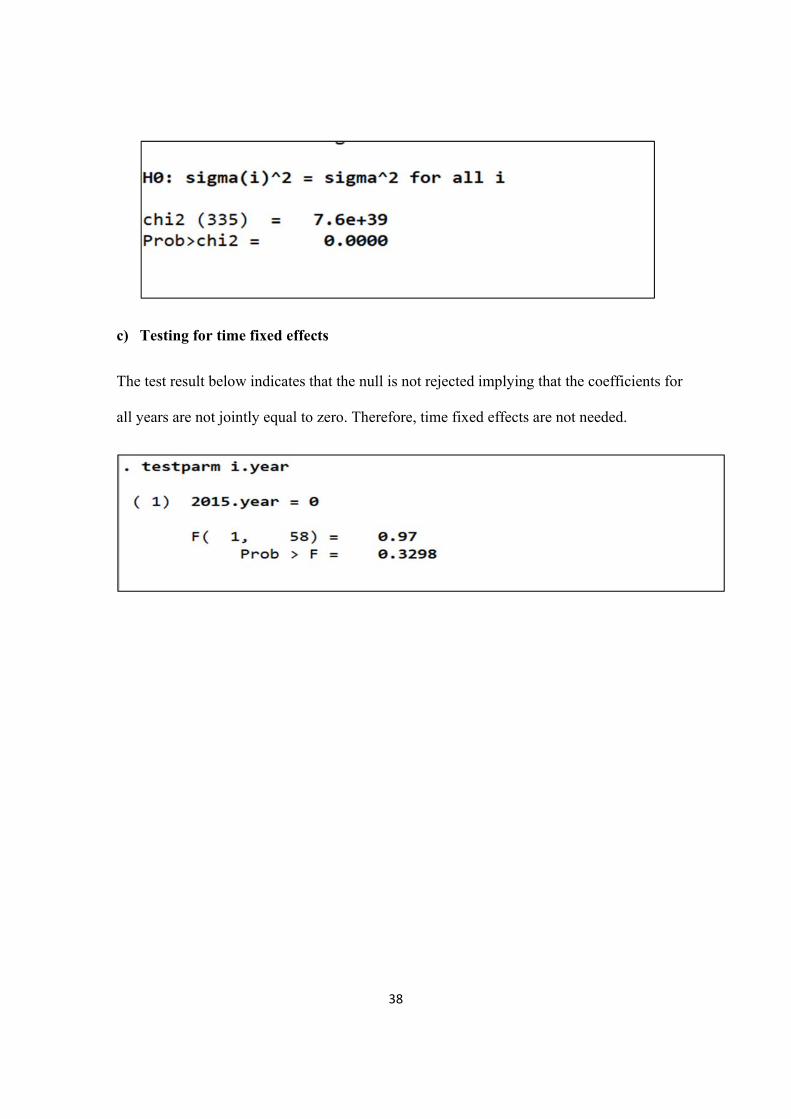
b) Heteroskedasticity test
Modified Wald test for groupwise heteroskedasticity is conducted to determine if there is
heteroskedasticity issue. The null is homoskedasticity which is constant variance. The test
result below implies rejecting the null hypothesis suggesting that there is heteroskedasticity.
Therefore, for the FE model robust standard errors have been applied to address this issue.
38
c) Testing for time fixed effects
The test result below indicates that the null is not rejected implying that the coefficients for
all years are not jointly equal to zero. Therefore, time fixed effects are not needed.