Embed Size (px)
Citation preview
the Technology Interface Journal/Fall 2009 Meckley, Edwards
Volume 10 No. 1 ISSN# 1523-9926 http://technologyinterface.nmsu.edu/Fall09/
A Study on the Design and Effectiveness of Conformal Cooling Channels in Rapid
Tooling Inserts ______________________________________________________________________________
by
Jonathan Meckley Robert Edwards Penn State Erie, The Behrend College Penn State Erie, The Behrend College [email protected] [email protected]
Abstract: Reduction in plastic injection molding cycle time and increase in part quality are two goals that are not usually thought of as being compatible. Conformal cooling channels are one of the technologies that will help achieve both goals. Cooling time is the only phase of the injection molding cycle that has significant time to reduce. Reduction in cooling time usually results in parts with hotter temperatures. This could result in increased part shrinkage and warpage. The key to cycle time reduction and better quality is to cool the parts uniformly and more quickly. This study will show that conformal cooling channels provide better cooling than standard conventional cooling lines. By designing cooling channels around the part’s geometry, more uniform cooling can be achieved compared to standard conventional cooling lines. Rapid tooling is the easiest and most inexpensive method to construct conformal cooling lines in mold inserts. It is important to balance mold strength with cooling concerns. Cooling lines in the inserts reduce the structural integrity of the inserts. Correct placement and design of the cooling channels is needed to reduce the effect of the cooling lines on the structural integrity of the inserts. Computer-Aided-Engineering tools are needed to optimize the mold inserts for cooling and strength. High Density Polyethylene and Polycarbonate were used in this study. The mold and melt temperature differences between the two materials will help to illustrate the difference between the mold materials and cooling line layouts.
I. Introduction In today’s competitive global market, working smarter and more quickly will give a company an edge. The amount of time in the injection and packing phases is low and cannot be reduced much further. However, because cooling time can be more than two-thirds of the molding cycle[1], it is the most common phase to remove time. But decreasing cooling time can result in excessive shrinkage and warpage in parts. By using new rapid tooling techniques, it is possible to reduce cycle time and increase part quality. If the part’s temperature can be reduced more

the Technology Interface Journal/Fall 2009 Meckley, Edwards
Volume 10 No. 1 ISSN# 1523-9926 http://technologyinterface.nmsu.edu/Fall09/
quickly and uniformly, it will shorten the cooling time. Near uniform temperatures can be had in mold inserts with conformal cooling. This study will show the differences between conventional and conformal cooling channels. The differences between a rapid tooling material (S4) and P-20 steel will also be examined. Designing conformal cooling channels in rapid tooling for plastics injection molding can pose challenges to the mold designer. The balance between optimum cooling and insert strength means there needs to be a compromise between both. Compared to P-20, rapid tooling materials are not as strong. Another objective of this study was to determine how effective mold filling and cooling analysis along with Finite Element Analysis (FEA) were to assist with designing conformal cooling channels. Two cooling times were used in this study. One cooling time was around the optimum cooling time and one was at the lowest cooling time. Temperatures were captured with an infrared camera. The simulation results were compared to actual mold and part temperatures. A semi-crystalline and an amorphous plastic material was used in this study to show the behavioral differences. The semi-crystalline material was High Density Polyethylene (HDPE). The amorphous material was Polycarbonate (PC).
II. Background and Theory Rapid prototyping processes can be broken down into two major categories, subtractive and additive. Subtractive prototypes start with a block of material that is bigger than the final part. The block has material removed until the final part is revealed. It is typically done on a mill or a lathe. This is a traditional machining process that has been practiced for many years. Numerically controlled machining centers and computers were combined in the 1970s, but needed to be programmed manually[2]. Complex surfaces were difficult to construct. With the marriage of Computer Numerical Control (CNC) machining centers and Computer-Aided-Design (CAD) software, complex geometry could easily be machined from the CAD solids model. Commercially available additive processes have only been in existence since 1986[3]. 3D Systems was the first manufacturer to create a commercially available machine. These processes create a part out of liquid, molten, or powdered polymer or metal. Parts are created by using lasers or ink-jet technology. In the CAD software, solids models are represented by their outside surfaces. In order for the CAD model to be used in an additive process, it has to be converted to a format that the rapid prototyping machine can understand. Figure 1 shows the conversion of a CAD model. The files that represent the outside surfaces are called STL files. In this format, triangles represent the surfaces. To import the STL file into the rapid prototyping machine, it has to be processed by converting the triangles, called slicing, into a set of 2D cross sections. This slicing of the STL triangles creates the paths that a laser will travel or that ink-jet type machines will use as a boundary for printing. The slicing thickness is determined by machine capability and accuracy requirements for the parts. In most machines this is done from the bottom of the

the Technology Interface Journal/Fall 2009 Meckley, Edwards
Volume 10 No. 1 ISSN# 1523-9926 http://technologyinterface.nmsu.edu/Fall09/
part to the top, because the equipment to manufacture the prototypes is mounted on the top of the machine. There are several manufacturers that make additive rapid prototyping machines. Stereolithography is the most used process for additive prototypes[4]. 3D System is the oldest of the manufacturers making Stereolithography machines. In this process an overhead laser traces the 2D cross section on a vat of photopolymer. It uses the lines generated from the slicing as a boundary. Once the boundary is traced on the liquid photopolymer, the laser traces a fill pattern to fill inside the boundary. The part indexes down into the vat of photopolymer by the slicing thickness and the next layer is traced. This process is repeated until the last layer is traced. The part is only 96% cured when it is finished in the machine[5]. It needs to have a post cure to fully cure the part. Other additive processes follow the same basic process, but the method to construct each layer is different. Some processes use the laser to sinter a polymer powder. Another will use ink-jet technology to bind together a plaster powder. There are more than a dozen different types of processes. In rapid tooling applications, the traditional processes that make polymer parts can be used to make cavity and core inserts. However, the polymer tooling is not hard enough to resist wear and the forces from the injection molding cycle. Depending on the geometry, only about 200 parts can be made[6]. These inserts are not used for production and are only good for prototyping. Since polymers have a much lower thermal conductivity compared to metals, the cooling time is very long and not economical for production. Rapid tooling can be broken down into direct and indirect tooling. Direct tooling inserts are made on subtractive or additive type prototyping machines. Today, when most companies advertise rapid tooling, they are using high speed machining of aluminum for their inserts, which is a subtractive process. For certain parts, this can be a quick way to get inserts. These inserts will most likely have conventional cooling lines. While these inserts can be machined more quickly than standard steel inserts, the aluminum inserts will wear more quickly and the forces from injection molding will likely damage the inserts over time. Additive processes can be used to create direct tooling. The rapid prototyping machines can directly take the CAD model and create a set of inserts. Because the rapid prototyping machines build the parts from scratch, any geometry can be created. Creating conformal cooling lines is easy to do with the additive processes. They are simply constructed as another set of boundaries as each layer is traced or printed. Since traditional prototyping machines that make polymer parts are only good for prototyping, prototyping machines that make metal parts are the only option for injection molding tooling. EOS’s Direct Metal Laser Sintering and 3D Systems’ Selective Laser Sintering use a laser to sinter a metal powder. Some newer processes deposit drops of molten metal on top of the already formed layers. All of these processes create parts that are near net shape. Because of shrinkages associated with the processes and the post processing of some processes, the inserts need to be oversized. The inserts will need to be squared and a finish machining operation needs to be done on the geometry and parting line. Indirect tooling are molds that are cast around a prototype part. Usually the prototype parts are constructed on rapid prototyping machines and are finished before the molds are cast. Silicone

the Technology Interface Journal/Fall 2009 Meckley, Edwards
Volume 10 No. 1 ISSN# 1523-9926 http://technologyinterface.nmsu.edu/Fall09/
molds are not used for injection molding applications, but are a common way to get prototype parts with some properties of injection molded plastic parts. The parts are cast from polyurethane or silicone rubber. There are different grades of polyurethane or silicone to simulate many common thermoplastic polymers. It is the simplest way to get prototype parts with some of the properties of injection molded parts. However, these parts do not always perform like injection molded parts, because there is no polymer orientation from the injection molding process. Another indirect tooling option that can be used in injection molding is aluminum-filled epoxy molds. Epoxy molds are cast around a prototype part. It is a similar process to the silicone molds. Because the molds are made of a polymer, the thermal conductivity is very low compared to typical mold steels. The cooling times are very long to allow the parts to cool. Typically there is a fan that blows air on the open mold to cool it before the next part is made. Only a few hundred, to a couple thousand parts can be made from a set of inserts depending on complexity of the part[7]. This is the least expensive option for true injection molded parts. The ProMetal process is an ink-jet based process to make additive direct tooling for injection molding inserts. This process was developed at MIT and commercialized in 1997[8]. The process uses a print head to drop a liquid binder onto a bed of stainless steel powder (Figure 2). Using the 2D layers generated by the slicing process as a boundary, the print head sprays droplets of binder to fill in between the boundaries. The droplets not only bind with the adjacent droplets, they bind to the layer below. There is a need for support of any downward facing surfaces, such as overhangs, unconnected layers, and undercuts[9]. This is accomplished in this process by the remaining powder that was not printed with binder. When the part is complete, it is pulled from the powder bed and cleaned off. The powder that is in any internal passages is evacuated by gravity or a spray of air[10]. Since the powder is spherical, it flows easily. When the parts are completed, a high energy lamp is used to dry the part. It is then taken to an oven to partially sinter the material. During this process, the binder is burned off. The part is only partially sintered to reduce the amount of shrinkage. It then needs to be infiltrated with bronze to reach full densification. This process is done under a vacuum which allows the bronze to wick into the partially sintered part. Because of the drying and sintering process, there is some non-uniform shrinkage of the part. It is customary to size the geometry so the final part is oversized by 1.5 mm to account for this shrinkage. This necessitates machining operations to take these near net shape parts and make them to size[11]. The inserts used in this study could have been constructed for $7,500 in approximately three weeks at a mold shop. A service bureau would have constructed the rapid tooling inserts and performed the finish machining for $4,000 in two weeks. Most service bureaus that specialize in rapid tooling have the capability to do machining. These prices do not reflect any mold design. There would be additional time and cost to construct conformal cooling lines in the solids modeling system. The insert material used in this study was ProMetal’s S4. It is a composite material composed of 60% stainless steel and 40% bronze. Some newer materials from ProMetal are fully sintered and provide better thermal and strength properties than S4; however, they experience excessive shrinkage from the sintering process. The excessive shrinkage puts stresses in the parts and

the Technology Interface Journal/Fall 2009 Meckley, Edwards
Volume 10 No. 1 ISSN# 1523-9926 http://technologyinterface.nmsu.edu/Fall09/
could lead to cracking. This limits the size of parts, because the larger parts will experience more shrinkage. The partial sintering leaves a part with voids throughout the part. It can be compared to a box of marbles. Even when packed into the box, there are open areas between the marbles where they do not touch. When the sintering starts, the stainless steel powder starts to melt where the powder particles touch each other. As this melting occurs, the part begins to shrink as the particles start to bind to each other. The voids between the particles become smaller as they melt more into each other. In full sintering, the particles bond all around each other and leave no voids. At full sintering, the part shrinks as the voids are filled. Partial sintering leaves some voids and therefore reduces the amount of shrinkage. The bronze is infiltrated into the voids. This creates a composite structure where there are distinct regions of stainless steel and bronze. The composite regions combined with the thermal conductivity of stainless steel help slow the transfer of heat. The addition of bronze makes the structure softer. P20 is a common pre-hardened mold insert material used in injection molding. It is a chrome-moly alloy with a carbon content of 0.30% to 0.40%[12]. It is used in mold plates as well as many mold components. The properties for S4, P20, and stainless steel (SS) can be seen in Figure 3. The thermal conductivity of S4 is 22.6 W/(m °K), P20 is 29.0 W/(m °K), and 420 stainless steel is 24.9 W/(m °K). Heat transfer through composite materials encounters resistance at the boundaries between the two materials. Even though the powder particles are bonded together and form a pathway for the heat to flow, the heat will flow in the path of least resistance, as well as through those pathways. Some of the part’s performance and dimensions are determined by how it cools in the mold. Mold temperature for each polymer material family is based on the processing needs of that material. The thickness of the flow channel through a part can be affected by the mold temperature. If the mold temperature is too low, the polymer that freezes against the mold walls may become too thick and choke off the flow between the mold walls. Once flow has stopped, it is the rate that the heat is removed that is important. When looking at the three materials, P20 should remove heat from the inserts better than the S4. Because the heat transfer is important, a mold designer may look to Ampcolay or beryllium copper for part or the entire insert. Better thermal conductivity is one approach to help reduce cooling time. These materials are typically used in the core insert because the core has to absorb the same amount of heat as the cavity, but the core has a much smaller volume to absorb that heat. The higher thermal conductivity materials can help to remove the heat more quickly out of the core. Cooling is affected by several material and geometry considerations and it is important to balance these to get the most performance out of the inserts[13]. As the coolant flows through the cooling lines, it picks up heat. In general, it is best to keep the temperature increase to less than 5.0°C. In long cooling channels, areas towards the end of the cooling channels will not have as much heat removed. The flow of the coolant is important because more heat can be removed if the flow is turbulent. Reynolds Number is a measure of laminar or turbulent flow. Reynolds Numbers below 2000 show laminar flow. Above 4600 it is turbulent flow. Between those two

the Technology Interface Journal/Fall 2009 Meckley, Edwards
Volume 10 No. 1 ISSN# 1523-9926 http://technologyinterface.nmsu.edu/Fall09/
numbers is a transition from laminar to turbulent flow. An optimum Reynolds Number is 10,000. Above this number, there is little gain in heat transfer[14]. Polymer materials have poor thermal conductivity compared to metals. Each polymer family has a unique thermal conductivity. This affects how quickly a part can give up its heat. Because of the different structure of each polymer family, the temperature to melt is distinctive to that family. The goal of cooling is to remove heat quickly and cooling lines should be economical to construct. At times these two attributes can conflict with each other. It is cheaper and quicker to machine straight drilled cooling lines. In complicated part geometries, these straight drilled lines may not always follow the part geometry evenly. This may create cool spots in the mold and change how the part shrinks. To achieve proper cooling, several levels of cooling lines should be used. The spacing between the cooling lines should be 2.5 to 3.5 times the diameter of the cooling line. Figure 4 shows a cross section of a cooling line layout. The thin green, yellow, purple, and red lines are isotherms representing the temperature distribution from the cooling lines to the mold wall. The lines should be spaced to keep the temperature as uniform as possible. The spacing from the mold wall should be 0.8 to 1.5 times the spacing between the cooling lines[15]. Designing of the cooling lines is usually done after most other mold details are finished. Placement of gates, venting, core pins, and ejection are considered first because their placement in the mold is essential to making a good part. In some cases, cooling is put in quickly without regard to how it will affect the part. However, because of its importance to part quality, cooling should be considered earlier in the design and concurrently with the other mold features. Mold cooling analysis should be run to optimize the cooling design. There are few of these analysis performed on new molds. Without this type of analyses, it is guesswork as to whether the cooling layout will be effective. Mold temperature is controlled by the use of a thermolator. The temperate setting on the thermolator is usually around 7°C below the temperature of the mold surface. The regulation of the temperature is important because it impacts the filling of the part and the surface finish. A colder mold will pull more heat out and increase the frozen layer thickness. This reduces the flow channel of the polymer during filling and packing. A warmer mold will allow the polymer to pick up more mold details and have a glossier finish. Conformal cooling lines follow the part geometry in the mold. Optimum placement will make for uniform mold temperatures. The use of mold cooling analysis and FEA is essential to designing these types of cooling lines. It would be easy to put in too many cooling lines to increase cooling. During the filling and packing phases there could be as much as 150 MPa pressure inside the mold cavity. The force from this pressure needs to get past the cooling lines without busting through. In the injection molding process the pressure is cyclical and it is generally recommended that the stresses in the mold are less than 10% of the tensile yield stress. As the part starts to cool, the pressure is reduced. This cyclical force will fatigue the insert if it is not designed correctly. In order to have the best cooling line placement that will have the best structural integrity, the use of both mold cooling analysis and FEA is essential.

the Technology Interface Journal/Fall 2009 Meckley, Edwards
Volume 10 No. 1 ISSN# 1523-9926 http://technologyinterface.nmsu.edu/Fall09/
Conformal cooling lines can be machined, but that will increase the build time and the cost. Figure 5 shows a two piece conformal cooling machined insert. The amount of machining to make the two pieces could be more than double of a conventional insert depending on the complexity of the geometry. Molds with conformal cooling could not be used with geometry that would require thin cores or some complex geometry. Today, global competition and the need for better quality parts more quickly drives how companies proceed through the design process. It was common in the past to make a mold, sample the parts, and make changes to the mold to increase part quality. This cannot be done as easily when competing with countries that have a lower cost of operation. It now means that engineers must do a better job of designing parts and molds that need minimum reworking. The use of CAE tools is essential to making this happen. Ten or more years ago, the computing power and software demanded expensive computing platforms and expert analysts to run CAE analyses. That has changed over the last few years. The software has become easier to use and computing power has drastically increased from ten years ago. Although the software is easy to use, the analysts need training to understand how to set up an analysis and interpret the results. This software allows the designer to experiment with different strategies on the computer to optimize the design before any “steel” is cut[16]. Although this creates more time in the design cycle, it reduces the time from when the first trials are run on a mold to when the actual production starts. The polymer material properties can be seen in Figure 6. HDPE is a semi-crystalline material. The polymer chains start folding on themselves, forming crystals, when the temperature drops to the melt temperature (Tm). This happens because the intermolecular forces begin to dominate the forces between the molecules[17]. When the polymer becomes solid, almost all crystal formation stops. Full crystallinity cannot be achieved because of polymer chain entanglement. The speed of cooling determines the amount of crystallinity. When the mold is colder, the polymer is solidified quickly and does not allow the maximum amount of crystal growth. With a warmer mold, the polymer has more time to form crystals. Because PC is an amorphous polymer material, there are no crystals formed when the polymer starts to cool. The polymer’s structure determines if it will be semi-crystalline or amorphous. Amorphous polymers have no distinct melt temperature. There is a general softening around the Glass Transition Temperature (Tg). Semi-crystalline polymers do have a Tg, but it is the point where the behavior changes from glassy and brittle to leathery.
III. Equipment and Method The basic dimensions on the parting line for the part used in this study are 57.15 mm long and 38.10 mm wide. It is 29.97 mm high on the top step and slopes down from the back to the front. It also slopes up from the left to the right. The wall thickness was set at 2.54 mm. The part can be seen in Figure 7. Using the orientation of the picture, several areas of the part will be defined. The top surfaces are defined as the surfaces at the top of the picture. There are two steps for those top surfaces. The top step on the top surfaces is seen in the upper left of the picture. The

the Technology Interface Journal/Fall 2009 Meckley, Edwards
Volume 10 No. 1 ISSN# 1523-9926 http://technologyinterface.nmsu.edu/Fall09/
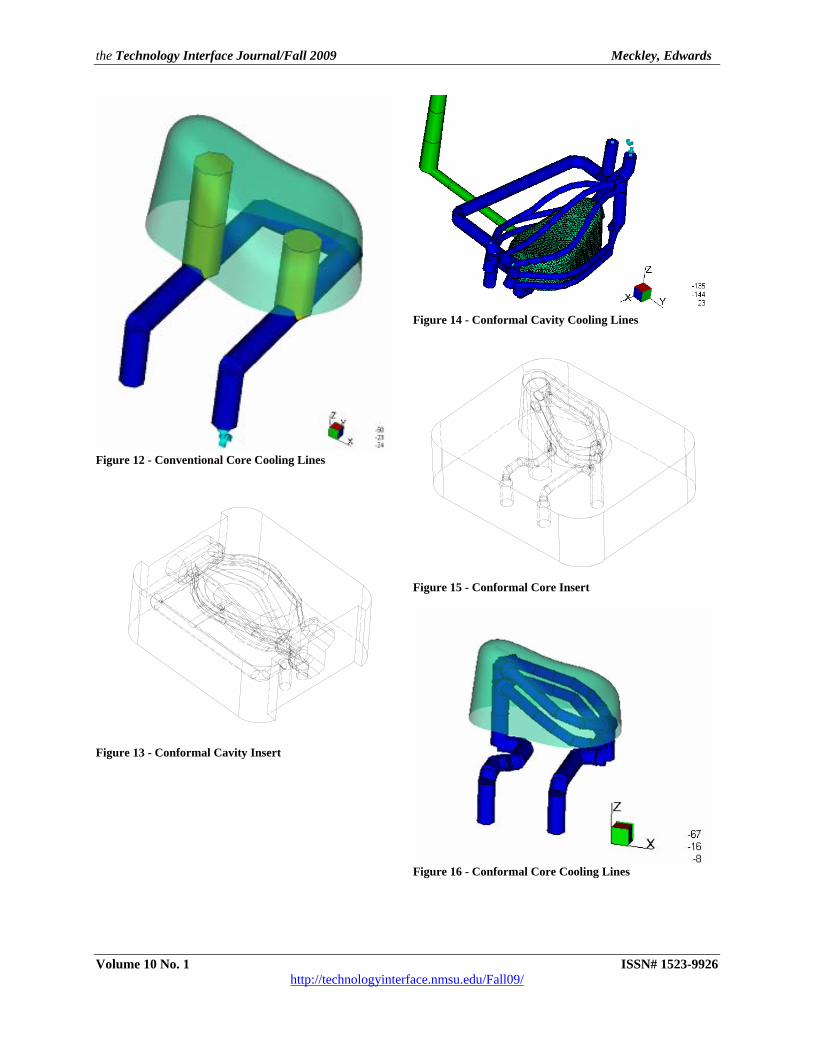
lower step is seen in the upper right of the picture. The bottom of the part is towards the bottom of the picture. The mold was designed to allow for a quick change of inserts. Each core and cavity insert slides into the main insert body (Figure 8). Two screws hold each insert into the main insert body. The cooling lines interface on the bottom of the pocket on the main insert body. O-rings around the holes for the cooling lines are used to seal the interface. There were three sets of inserts used in this study. A P-20 insert with conventional cooling lines was used as a base line to compare cooling efficiency with the S4 inserts (Figure 9, Figure 10, Figure 11, and Figure 12). One of the S4 inserts was constructed with the same cooling line layout as the P20. The other S4 insert was constructed with conformal cooling lines (Figure 13, Figure 14, Figure 15, and Figure 16). All three sets of inserts were treated to remove the shine from the surface to help eliminate the light reflecting off the inserts, which can change the temperatures recorded on the infrared camera. The molding was performed on a Husky Hylectric 90 injection molding machine. A thermolator was used to control the temperature of the mold inserts. The mold and part temperatures were recorded with a FLIR A20. The flow of water through each insert was measured with a Burger & Brown – Smartflow Tracer. The HDPE is LG Chemical’s Lutene ME9180. The PC is GE Plastics’ Lexan 124R. Moldflow Plastics Insight 6.1 Version 2 was used for the mold filling and cooling simulations. The part and cooling lines were modeled and imported from Pro/Engineer Wildfire 3.0. ANSYS 11.0 was used for the stress analysis. Before running the experiment, a hand-held pyrometer was placed on a mold surface to measure the temperature. The infrared camera was aimed at that same location to verify the temperatures. It was within 0.5°C. The flow of water through each insert was measured and recorded. The process was optimized on the P20 conventional inserts for both materials and can be seen in Figure 17. It was used as a baseline for the other inserts. The mold was run for fifteen minutes to bring it to temperature equilibrium at the 18 s cooling time. The infrared camera was set up to record the temperatures of the cavity insert. Three cycles were recorded and the infrared camera was changed to record the core insert. After three more cycles were recorded, the infrared camera was moved to record the part. Three parts were used to record the outside and three for the inside. Only one infrared camera angle was used for each insert. It was selected for each view to show the top surface and a side of the part geometry. The cycle was then set to the lowest achievable cooling time. The HDPE was set at 4 s and the PC was set at 10 s. The infrared pictures were taken again. The process parameters and coolant flow rates were entered into Moldflow and the analyses were run. The pressures from Moldflow were used in ANSYS to determine the maximum pressure in the mold cavity.

the Technology Interface Journal/Fall 2009 Meckley, Edwards
Volume 10 No. 1 ISSN# 1523-9926 http://technologyinterface.nmsu.edu/Fall09/
Presentation of Data
Plot Name Plot Uniform Moldflow
Number Low High Difference Temperature Trend Temperature Moldflow
Low High Difference Trend
°C °C °C Y/N °C °C Y/N °C Y/N
HDPE
P‐20 Cavity Insert Results 18
18 s Actual 32.0 33.0 1.0 N 0.5 Y
18 s Moldflow 35.0 38.0 3.0 N 3.0 5.0 Y
4 s Actual 33.0 36.5 3.5 N
4 s Moldflow 38.5 41.0 2.5 N 5.5 4.5 Y
S4 Conventional Cavity Insert Results 19
18 s Actual 31.0 34.0 3.0 N 0.5 Y
18 s Moldflow 37.5 39.0 1.5 N 6.5 5.0 Y
4 s Actual 33.0 37.0 4.0 N
4 s Moldflow 38.8 40.0 1.3 N 5.8 3.0 Y
S4 Conformal Cavity Insert Results 20
18 s Actual 31.0 31.0 0.0 Y 1.0 Close
18 s Moldflow 37.0 38.0 1.0 N 6.0 7.0 Y
4 s Actual 32.0 34.0 2.0 N
4 s Moldflow 35.0 39.0 4.0 N 3.0 5.0 Y
Top SurfacesTemperature Range Moldflow Temperature
Difference
Table 1 - HDPE Cavity Results
Plot Name Plot Uniform Moldflow
Number Low High Difference Temperature Trend Temperature Moldflow
Low High Difference Trend
°C °C °C Y/N °C °C Y/N °C Y/N
HDPE
P‐20 Core Insert Results 21
18 s Actual 31.5 34.0 2.5 N 1.0 Y
18 s Moldflow 40.0 45.0 5.0 N 8.5 11.0 Y
4 s Actual 34.0 39.0 5.0 N
4 s Moldflow 41.0 55.0 14.0 N 7.0 16.0 Y
S4 Conventional Core Insert Results 22
18 s Actual 32.0 38.0 6.0 N 4.0 Y
18 s Moldflow 40.0 51.0 11.0 N 8.0 13.0 Y
4 s Actual 34.0 45.0 11.0 N
4 s Moldflow 42.0 59.0 17.0 N 8.0 14.0 Y
S4 Conformal Core Insert Results 23
18 s Actual 30.0 32.0 2.0 N 0.5 Y
18 s Moldflow 34.0 36.0 2.0 N 4.0 4.0 Y
4 s Actual 31.5 37.0 5.5 N
4 s Moldflow 40.0 47.0 7.0 N 8.5 10.0 Y
Difference
Temperature Range Moldflow Temperature Top Surfaces
Table 2 - HDPE Core Results

the Technology Interface Journal/Fall 2009 Meckley, Edwards
Volume 10 No. 1 ISSN# 1523-9926 http://technologyinterface.nmsu.edu/Fall09/
Plot Name Plot Uniform Moldflow
Number Low High Difference Temperature Trend Temperature Moldflow
Low High Difference Trend
°C °C °C Y/N °C °C Y/N °C Y/N
HDPE
P‐20 Part Interior Results 24
18 s Actual 42.0 44.0 2.0 N 1.0 N
18 s Moldflow 42.0 42.0 0.0 Y 0.0 ‐2.0 Y
4 s Actual 49.0 71.0 22.0 N
4 s Moldflow 60.0 63.0 3.0 N 11.0 ‐8.0 Y
S4 Conventional Part Interior Results 25
18 s Actual 41.0 45.0 4.0 N 4.0 N
18 s Moldflow 44.0 45.0 1.0 N 3.0 0.0 Y
4 s Actual 49.0 75.0 26.0 N
4 s Moldflow 63.0 66.0 3.0 N 14.0 ‐9.0 Y
S4 Conformal Part Interior Results 26
18 s Actual 38.0 38.0 0.0 Y 0.0 Y
18 s Moldflow 40.0 40.0 0.0 Y 2.0 2.0 Y
4 s Actual 50.0 64.0 14.0 N
4 s Moldflow 56.0 57.0 1.0 N 6.0 ‐7.0 Y
Temperature Range Moldflow Temperature Top Surfaces
Difference
Table 3 - HDPE Part Interior Results
Plot Name Plot Uniform Moldflow
Number Low High Difference Temperature Trend Temperature Moldflow
Low High Difference Trend
°C °C °C Y/N °C °C Y/N °C Y/N
HDPE
P‐20 Part Exterior Results 27
18 s Actual 42.0 46.0 4.0 N 4.0 N
18 s Moldflow 41.0 48.0 7.0 N ‐1.0 2.0 Y
4 s Actual 54.0 69.0 15.0 N
4 s Moldflow 59.0 62.0 3.0 N 5.0 ‐7.0 Close
S4 Conventional Part Exterior Results 28
18 s Actual 42.0 45.0 3.0 N 3.0 N
18 s Moldflow 43.0 48.0 5.0 N 1.0 3.0 Y
4 s Actual 52.0 72.0 20.0 N
4 s Moldflow 62.0 66.0 4.0 N 10.0 ‐6.0 Y
S4 Conformal Part Exterior Results 29
18 s Actual 39.0 39.0 0.0 Y 0.0 Y
18 s Moldflow 44.0 45.0 1.0 N 5.0 6.0 Y
4 s Actual 50.0 69.0 19.0 N
4 s Moldflow 61.0 63.0 2.0 N 11.0 ‐6.0 N
Temperature Range Moldflow Temperature Top Surfaces
Difference
Table 4 - HDPE Part Exterior Results

the Technology Interface Journal/Fall 2009 Meckley, Edwards
Volume 10 No. 1 ISSN# 1523-9926 http://technologyinterface.nmsu.edu/Fall09/
Plot Name Plot Uniform Moldflow
Number Low High Difference Temperature Trend Temperature Moldflow
Low High Difference Trend
°C °C °C Y/N °C °C Y/N °C Y/N
PC
P‐20 Cavity Insert Results 30
18 s Actual 48.0 52.5 4.5 N 3.0 N
18 s Moldflow 60.0 62.0 2.0 N 12.0 9.5 Y
4 s Actual 49.0 55.0 6.0 N
4 s Moldflow 61.0 66.0 5.0 N 12.0 11.0 Y
S4 Conventional Cavity Insert Results 31
18 s Actual 50.0 53.0 3.0 N 3.0 N
18 s Moldflow 62.0 64.0 2.0 N 12.0 11.0 Y
4 s Actual 51.0 57.0 6.0 N
4 s Moldflow 62.0 66.0 4.0 N 11.0 9.0 Y
S4 Conformal Cavity Insert Results 32
18 s Actual 49.0 52.5 3.5 Y 2.0 Y
18 s Moldflow 55.0 60.0 5.0 N 6.0 7.5 Y
4 s Actual 48.0 52.5 4.5 N
4 s Moldflow 56.0 61.0 5.0 N 8.0 8.5 Y
Temperature Range Moldflow Temperature Top Surfaces
Difference
Table 5 - PC Cavity Results
Plot Name Plot Uniform Moldflow
Number Low High Difference Temperature Trend Temperature Moldflow
Low High Difference Trend
°C °C °C Y/N °C °C Y/N °C Y/N
PC
P‐20 Core Insert Results 33
18 s Actual 47.5 52.5 5.0 N 4.0 Y
18 s Moldflow 59.0 78.0 19.0 N 11.5 25.5 Y
4 s Actual 49.0 56.0 7.0 N
4 s Moldflow 66.0 84.0 18.0 N 17.0 28.0 Y
S4 Conventional Core Insert Results 34
18 s Actual 45.0 52.5 7.5 N 7.5 Y
18 s Moldflow 60.0 83.0 23.0 N 15.0 30.5 Y
4 s Actual 50.0 64.0 14.0 N
4 s Moldflow 63.0 91.0 28.0 N 13.0 27.0 Y
S4 Conformal Core Insert Results 35
18 s Actual 42.5 47.0 4.5 N 4.0 Y
18 s Moldflow 53.0 66.0 13.0 N 10.5 19.0 Y
4 s Actual 45.0 52.0 7.0 N
4 s Moldflow 55.0 73.0 18.0 N 10.0 21.0 Y
Temperature Range Moldflow Temperature Top Surfaces
Difference
Table 6 - PC Core Results
Plot Name Plot Uniform Moldflow
Number Low High Difference Temperature Trend Temperature Moldflow
Low High Difference Trend
°C °C °C Y/N °C °C Y/N °C Y/N
PC
P‐20 Part Exterior Results 36
18 s Actual 55.0 65.0 10.0 N 4.0 Y
18 s Moldflow 72.0 81.0 9.0 N 17.0 16.0 Y
4 s Actual 65.0 84.0 19.0 N
4 s Moldflow 90.0 90.0 0.0 Y 25.0 6.0 N
S4 Conformal Part Exterior Results 37
18 s Actual 54.0 58.0 4.0 N 2.0 Y
18 s Moldflow 68.0 80.0 12.0 N 14.0 22.0 Y
4 s Actual 58.0 74.0 16.0 N
4 s Moldflow 87.0 91.0 4.0 N 29.0 17.0 N
Temperature Range Moldflow Temperature Top Surfaces
Difference
Table 7 - PC Part Exterior Results

the Technology Interface Journal/Fall 2009 Meckley, Edwards
Volume 10 No. 1 ISSN# 1523-9926 http://technologyinterface.nmsu.edu/Fall09/
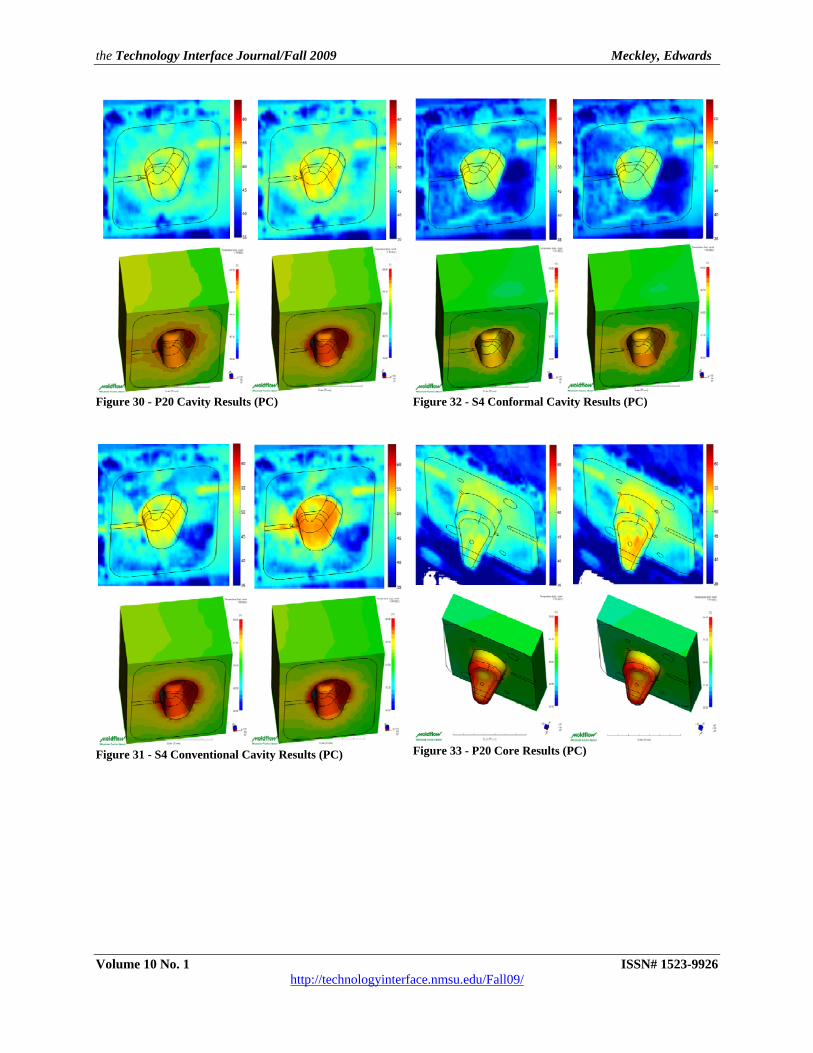
In each picture, the part and mold outline have been added for a reference. Because of distortion from the infrared camera and having the perspective added to the Moldflow models, the part mold insert boundaries are not exact. The part geometry was sized and placed to give an accurate representation of the part geometry in the mold. The results for the P20, S4 Conventional, and S4 Conformal cooling line inserts with HDPE and PC can be seen in Figure 18 through Figure 37. The results on the left are at 18 s and the results on the right are at 4 s (10 s for PC). The top results are from the infrared camera and were taken just after the mold opened to its final position. It was generally 1 s from the time the mold started to open until it was fully open. The bottom results are from Moldflow. The cavity, core, part interior and exterior results (Table 1, Table 2, Table 3, and Table 4) for HDPE show that the S4 Conformal has the lowest temperature. It consistently is lowest of the three inserts. The S4 Conventional has the highest temperature of the three inserts. The temperatures are generally higher on the side walls and slightly cooler on the top surfaces. It is hotter on the side walls closer to the back wall near the top step. The temperature is lower on the part geometry in the mold close to the parting line for the Conventional cavity inserts. In the Conformal cavity inserts, it is warmer towards the parting line. The core inserts have a warmer temperature on the top surface, except at the regions close to the top of the baffles. The temperature decreases towards the parting line of the insert. The interior and exterior part plots show that the temperature is hotter on the top surfaces. The temperature of the side walls decreases towards the parting line. The same trend can be seen in the Conformal parts at 4 s. The temperature is very uniform at 18 s. Moldflow does a good job of predicting the trends with the Insert Temperature (top) result. It over-predicts the mold temperatures for the core and cavity inserts. The cavity insert temperature prediction is higher than the core. For the part temperatures the Bulk Temperature plot is used. There is a mix of over- and under-predicting the part temperatures. In most cases, the prediction is above the actual minimum and below the actual maximum temperatures. The results for PC (Table 5, Table 6, and Table 7) show the same trends as HDPE, but with higher temperatures. The S4 Conformal has the lowest temperature of the three inserts. The S4 Conventional has the highest of the three inserts. For part temperature, only the exterior results are presented to reduce the number of plots. They also follow the same trend as the HDPE. Moldflow over-predictions of mold temperatures on the core and cavity inserts are a little higher than for HDPE. The part temperature predictions are also higher than for HDPE. The ANSYS results can be seen in Figure 38 and Figure 39. They show that the maximum stress in the cavity was 19.727 MPa. It was seen at the reservoirs at either end of the cavity insert. The
the Technology Interface Journal/Fall 2009 Meckley, Edwards
Volume 10 No. 1 ISSN# 1523-9926 http://technologyinterface.nmsu.edu/Fall09/
maximum stress in the core was 57.21 MPa. It was seen inside the core where the main manifold on the upper step intersects with the top side cooling lines. The Moldflow Temperature Difference results between the core and cavity insert temperatures can be seen in Figure 40, Figure 41, and Figure 42. These plots are useful to determine if the temperatures from core to cavity side are uniform. In general, it is recommended that the temperature difference is less than 10°C. A positive temperature means that the cavity side is hotter and a negative temperature means that the core is hotter. The P-20 has a maximum temperature difference of -10.96°C. The core is hotter in the upper step of the top surfaces. The S4 Conventional has the same trend, but has a maximum temperature difference of 18.86°C. The S4 Conformal has a maximum temperature difference of -5.5°C. There is a spot where the temperature is 5.76°C on the front wall, but it is an anomaly of how the cooling channels were modeled in Moldflow. It is hotter on the high point of the lower step.
IV. Discussion of Results HDPE Results The P20 cavity inserts saw a temperature difference of 1°C at a cooling time of 18 s throughout the part geometry in the insert. The cooling line layout, seen in Figure 10, is a two level circuit that surrounds the part geometry in the mold. On the lower step, a cooling circuit crosses over the lower step and lowers the temperature in that region. There is also a cooler region around the parting line. The proximity of the bottom cooling circuits to part geometry and parting line help to cool this region. At a cooling time of 4 s, the cooling circuits and the mold insert do not have enough time to remove the heat from the plastic part. This was common for all of the results, except for some S4 Conformal results. Moldflow predicted a higher temperature than what was actually seen. Moldflow’s cooling results are cycle averaged. This provides an insight as to what is happening during the entire cycle. Since the polymer enters the mold at its melt temperature and cools to its temperature at ejection, the cycle averaged-results will always be higher than the actual temperatures recorded when the mold opens. Moldflow did predict the temperature trends in the mold. The results for the S4 Conventional cavity inserts have the same trends as the P20 cavity inserts. Since the cooling line layout is exactly the same, the temperature patterns should be the same. The thermal conductivity of the S4 reduces the amount of heat that can be transferred out of the mold during a given cycle time. The S4 Conventional cavity inserts were hotter by 1°C. The S4 Conformal cavity inserts were 2°C lower than the P20 cavity inserts. The temperature distribution was more uniform than the P20. There was no temperature difference at 18 s. The placement of the cooling circuits was better than the conventional layout because they followed the shape of the geometry. Moldflow predicted the temperature trends correctly, but was higher than the actual temperatures. The P20 core had a 2.5°C difference. It was hotter on the edges of the top surfaces. It was cooler on the top surface above the baffles. Because of the turbulence of the coolant as it makes

the Technology Interface Journal/Fall 2009 Meckley, Edwards
Volume 10 No. 1 ISSN# 1523-9926 http://technologyinterface.nmsu.edu/Fall09/
the 180° turn at the top of the baffle, there is more heat transferred. The temperature decreased towards the parting line of the insert. The main body of the insert acted like a heat sink to cool the bottom of the part geometry in the mold. There are three hot spots on the top surface. Two of those spots are on the surface’s edge between the two baffles. The third hot spot is on the high spot of the lower step. They are hotter because they are further away from the baffle. Moldflow over-predicted the temperature more than with the cavity inserts. The core has to absorb almost the same amount of heat as the cavity, but with a much smaller volume. Moldflow’s results may have been affected by this calculation. The S4 Conventional core inserts showed the same trends as the P20 core inserts. They were hotter by 4°C. The S4 Conformal core inserts were 2°C lower than the P20 core inserts and showed a more uniform temperature distribution. There was a hot spot on the high spot of the lower step. The cooling line was slightly further away from the mold walls in this area. There is no cooling line that goes across the top surface. The center ejector pin location and the size of the part prevented any cooling lines from going across the top surface. The P20 part temperatures, interior and exterior, showed a nearly uniform temperature distribution. The interior was within 2°C and the exterior was within 4°C at 18 s. The ejector pin was recessed into the mold by 2 mm. This created a short solid boss in the part. Because there was a lot of surface area around the boss, it allowed more heat to be pulled out of the part. The opposite was seen on the exterior of the part. Where the boss intersects the main part body, there is a hot spot because there is a localized thicker region. It takes longer to cool this region and shows up on the surface opposite the boss. Moldflow showed a more uniform trend that was actually recorded. The S4 Conventional parts showed the same trend and were 1°C warmer at 18 s. The S4 Conformal parts were 6°C less on the interior and 7°C on the exterior than the P20 parts. The temperature was uniform in both the interior and exterior. The exterior was 1°C hotter than the interior. Moldflow showed the trend, except at 4 s. PC Results The PC was run with a higher melt and mold temperature. It showed in the results with higher temperature distributions. The P20 cavity and core inserts showed the same trends as the HDPE. Moldflow over-predicted at a higher value than HDPE. The S4 Conventional cavity and core temperatures were slightly hotter and followed the same trends as the P20 The S4 Conformal cavity insert temperatures were similar to the P20. With the higher coolant temperature, it is possible that the second it took for the mold to open gave the coolant time to cool both the P20 and S4 Conformal to the same temperature. The S4 Conformal core insert temperatures were 5.5°C lower than the P20 core insert. Moldflow showed the same trends, but at a higher temperature.

the Technology Interface Journal/Fall 2009 Meckley, Edwards
Volume 10 No. 1 ISSN# 1523-9926 http://technologyinterface.nmsu.edu/Fall09/
The exterior of the P20 parts had a hotter temperature on the upper step of the top surfaces. The cooling lines are a little further away at the back of the upper step. The ejector pin can be seen as a hotter section on the exterior. The S4 Conformal has a more uniform temperature than the P20 part. The S4 Conformal parts are 7°C cooler than the P20 parts. General Discussion The hotter mold and part temperatures are a result of the S4 material’s poorer thermal conductivity. The composite structure and stainless steel base material create more resistance to the flow of heat compared to P20. S4 would not be a reasonable choice for a machined mold insert. Moldflow showed the difference between the two materials. The advantage of conformal cooling lines overcomes the poorer thermal conductivity of S4. By cooling the parts faster, the cooling time could be reduced. If rapid tooling materials with better thermal conductivity exist, there would be more opportunity to reduce cooling time. This material would also allow for more uniform temperature of the parts which could increase part quality. Moldflow shows that the conformal cooling lines provide a much more uniform temperature than the conventional cooling line layout. During the injection phase of the molding cycle, high pressure is present in the mold inserts. The force from this pressure is transmitted to the mold inserts and must be successfully resisted by the mold inserts. The presence of cooling lines weakens the inserts. They must be placed and shaped to minimize the weakening of the inserts. Using FEA stress analysis software like ANSYS, the optimized placement and shape of the cooling lines can be made. The general rule is to keep the stress below 10% of the tensile yield stress. The maximum stress in the cavity was 19.727 MPa and is well below the recommended stress of 42 MPa. The maximum stress in the core was 57.21 MPa. It occurred at the intersection of a manifold and two cooling circuit intersections. The corners are sharp and a round could be placed there to reduce the stress. Even with the small part size, there was room to put conformal cooling lines into the mold inserts and have an impact on the part’s cooling. The differences in actual temperatures do not reduce the effectiveness of Moldflow to design cooling lines. The trends were very close and allow the designer to optimize the cooling lines. A possible source of error when using infrared photography to take pictures of metal parts is stray light may change the temperatures recorded by the camera. To reduce this possibility, a blanket was used to cover the mold during photography. The inserts were also treated with a bluing agent to take off the shine. Another potential source of error was the timing from when the molds were opened and the part temperatures were taken. The parts were collected by hand and placed in a fixture. There could have been a variance of a second from when the pictures were started. Several pictures were taken and the picture with the lowest start time was used.

the Technology Interface Journal/Fall 2009 Meckley, Edwards
Volume 10 No. 1 ISSN# 1523-9926 http://technologyinterface.nmsu.edu/Fall09/
V. Future Work Another set of inserts is being designed to study the effects of warpage between conformal and conventional cooling lines. The current part is too thick and too small to result in any change in warpage between the insert materials and cooling line layout. The new part has been modeled in Moldflow to make sure there is sufficient warpage between insert materials and cooling time. The use of pulse cooling is another study in the planning stages. Pulse cooling works by controlling the flow of coolant in the inserts. This keeps the inserts at a more uniform temperature during the injection molding cycle. It is suspected that the conformal cooling channels may do a better job at being more uniform compared to conventional cooling. Monitoring of the coolant temperature increase from inlet to outlet is also planned for the future. Although the conformal and conventional cooling lines remove approximately the same heat over the cycle, it is suspected that the conformal will remove this heat more quickly. Mold sections for blow molding may be investigated after the work has been completed on injection molding. Neck inserts and complicated geometry may benefit from conformal cooling lines.
VI. Conclusion Using the phrases “increased part quality” and “cooling time reduction” in the same sentence has been an elusive goal of many designers and molders. Many molders are already at the limits of what conventional cooling lines can provide. Improvement in cooling line design is needed to get further reductions in cooling time. Conformal cooling channels are the improvement needed to get an additional reduction in cooling time. Because these cooling lines are optimized to follow the part geometry in the mold, they provide near uniform cooling of the parts. This study has shown that conformal cooling lines can overcome the poorer thermal conductivity of the S4 material and provide better cooling than the standard P20 inserts. In HDPE the reduction in part temperature was 6°C to 7°C and 7°C temperature reduction for PC. By getting the cooling lines closer to the part, more heat can be removed from the parts. This reduction in part temperature has the potential for cooling time reduction. It would be impossible to get an optimized cooling line layout without the use of CAE tools such as Moldflow and ANSYS. Even though Moldflow’s temperature predictions of the mold were higher than actual, it did a good job of predicting the trends. It showed where potential hot spots occurred in the mold and allowed the designer to modify the layout until they could be minimized. FEA stress analysis was used to make sure the cooling lines did not reduce the structural integrity of the inserts.

the Technology Interface Journal/Fall 2009 Meckley, Edwards
Volume 10 No. 1 ISSN# 1523-9926 http://technologyinterface.nmsu.edu/Fall09/
VII. Acknowledgments Thanks go to John Arlotti and ExOne for providing the rapid tooling inserts. Many thanks go to my wife, Kim, Lucy Lenhardt and Shelley Readel for their constant revisions. Special thanks go to Rick Coon for machining the inserts and helping plug leaks in the inserts. Thanks also go to Glen Craig and Matt Baker for helping to plug leaks in one set of inserts.
VIII. References 1. Shoemaker, Jay, Moldflow Design Guide, 1st Ed, 2006, Hanser, p 153 2. Groover, Mikell, Automation, Productions Systems, and Computer-Integrated Manufacturing, Rev Ed,
Prentice–Hall, 1987, p 284 3. Gebhardt, Andreas, Rapid Prototyping, 1st Ed, 2003, Hanser, p 90 4. “Stereolithography," Castle Island’s Worldwide Guide to Rapid Prototyping”, Rev 4a, 1 September 2006, 10
August 2007, http://home.att.net/~castleisland/sla_int.htm 5. Gebhardt, Andreas, Rapid Prototyping, 1st Ed, 2003, Hanser, p 87 6. Gebhardt, Andreas, Rapid Prototyping, 1st Ed, 2003, Hanser, p 222 7. “INDIRECT Tooling and Manufacturing Processes - Mature and/or More Common Technologies," Castle
Island’s Worldwide Guide to Rapid Prototyping”, Rev 2, 27 April 2005, 15 August 2007, http://home.att.net/~castleisland/tl_tab1.htm
8. Gebhardt, Andreas, Rapid Prototyping, 1st Ed, 2003, Hanser, p 181 9. Sachs, Emanuel, Wylonis, Allen, Cima, Guo, Production of Injection Molding Tooling with conformal Cooling
channels using the Three Dimensional Printing Process, Polymer Engineering and Science, 40 5 (2000), p 1233 10. Sachs, Emanuel, Wylonis, Allen, Cima, Guo, Production of Injection Molding Tooling with conformal Cooling
channels using the Three Dimensional Printing Process, Polymer Engineering and Science, 40 5 (2000), p 1234 11. Gebhardt, Andreas, Rapid Prototyping, 1st Ed, Hanser, pp 181-183 12. Britton, Paul W. ,” What You Should Consider When Purchasing P20 Steel”, Moldmaking Technology, Nov.
2004, July 2007, http://www.moldmakingtechnology.com/articles/110401.html 13. Rees, Herbert, Mold Engineering, 1st Ed, Hanser, p 260 14. Shoemaker, Jay, Moldflow Design Guide, 1st Ed, Hanser, p 167 15. Rees, Herbert, Mold Engineering, 1st Ed, Hanser, p 273 16. Murrell, Fred, Lange, Tom, The Democratization of Engineering Analysis, ANSYS Advantage, 1 2 (2007), pp
28-30 17. Osswald, A, Baur, Brinkmann, Oberbach, Schmachtenberg, International Plastics Handbook, 4th Ed, Hanser, pp
35-36 Jonathan Meckley Mr. Jonathan Meckley holds associate and bachelor's degrees in Mechanical Engineering Technology and a B.S. in Plastics Engineering Technology from Penn State Erie in 1990. Jon has a master's degree in Plastics Engineering from the University of Massachusetts at Lowell. After graduation, Jonathan worked at Penn State Erie’s Plastic Technical Center doing solids modeling and running a Stereolithography machine. From 1992 to 1994, Jonathan was a design engineer and co-owner of Innovation Design Services, Inc., a computer-aided engineering consulting firm for the plastics industry. From 1994 to 1998 Jonathan has

the Technology Interface Journal/Fall 2009 Meckley, Edwards
Volume 10 No. 1 ISSN# 1523-9926 http://technologyinterface.nmsu.edu/Fall09/
worked for Penn State Erie’s Plastic Technology Deployment Center as a project engineer. Since 1999, Jonathan has taught at Penn State Erie in the Plastics Engineering Technology as an Associate Professor. He is the Past-Chair of the Blow Molding Division of SPE and President of the Northwest Pennsylvania SPE Section. Robert Edwards Mr. Robert Edwards is a lecturer in engineering at Penn State Erie, The Behrend College. He has been a faculty member in the Mechanical Engineering Technology program since 1991 when he was first hired as an adjunct. Mr. Edwards received his A.E. in Mechanical Technology from Broome Community College in 1970, his B.S.M.E. in Mechanical Engineering from the Rochester Institute of Technology in 1973, and the M.S. in Engineering from Gannon University in 1989. He came to Penn State Behrend with over 20 years of industrial experience. He was employed by General Electric, Smith Meter Systems, American Sterilizer Company, Lord Corporation and Finish Thompson. Mr. Edwards is a member of the American Society of Mechanical Engineers (ASME), the American Society of Electrical Engineers (ASEE), the Institute of Electrical and Electronics Engineers (IEEE), the American Society for Testing and Materials (ASTM), and its D09 Committee, and the International Microelectronics and Packaging Society (IMAPS)
Figure 1 - STL File

the Technology Interface Journal/Fall 2009 Meckley, Edwards
Volume 10 No. 1 ISSN# 1523-9926 http://technologyinterface.nmsu.edu/Fall09/
Figure 2 - ProMetal Process
Courtesy of ProMetal
Material P20 SSPowder SSInfiltrator BronzeUltimate Tensile Strength 682 971 655 MpaYield Strength 420 850 345 MpaModulus 147 205 200 GpaElongation 2.3 16 25 %Hardness 26 32 12 HRCThermal Conductivity 22.6 29 24.9 W/m °KMean CTE (at 300°C) 1.34E-05 1.28E-05 1.03E-05 1/°CSpecific Heat 478 460 460 J/Kg °K
Insert Material Properties
Figure 3 - Insert Material Properties
Figure 4 - Cooling Line Spacing
Material HDPE PC
Density 0.958 1.19 g/cm3
Tensile Strength 28.4 63 MpaFlex Modulus 98.7 2300 MpaThermal Conductivity 0.26 0.21 W/(m °K)
Tm 133 °C
Tg -125 150 °C
General Polymer Properties
Figure 6 - Polymer Properties
Figure 7 - Part Geometry
O-Ring Groove
Conformal Cooling Lines
Figure 5 - Machined Conformal Cooling Lines

the Technology Interface Journal/Fall 2009 Meckley, Edwards
Volume 10 No. 1 ISSN# 1523-9926 http://technologyinterface.nmsu.edu/Fall09/
Figure 8 - Mold Inserts
Figure 9 - Conventional Cavity Insert
Figure 10 - Conventional Cavity Cooling Lines
Figure 11 - Conventional Core Insert
the Technology Interface Journal/Fall 2009 Meckley, Edwards
Volume 10 No. 1 ISSN# 1523-9926 http://technologyinterface.nmsu.edu/Fall09/
Figure 12 - Conventional Core Cooling Lines
Figure 13 - Conformal Cavity Insert
Figure 14 - Conformal Cavity Cooling Lines
Figure 15 - Conformal Core Insert
Figure 16 - Conformal Core Cooling Lines

the Technology Interface Journal/Fall 2009 Meckley, Edwards
Volume 10 No. 1 ISSN# 1523-9926 http://technologyinterface.nmsu.edu/Fall09/
Material HDPE PCMelt Temperature 176.67 304.44 °CMold Temperature 32.22 54.44 °C
Processing Conditions
Figure 17 - Processing Conditions
Figure 18 - P20 Cavity Results (HDPE)
Figure 19 - S4 Conventional Cavity Results (HDPE)
Figure 20 - S4 Conformal Cavity Results (HDPE)
Figure 21 - P20 Core Results (HDPE)

the Technology Interface Journal/Fall 2009 Meckley, Edwards
Volume 10 No. 1 ISSN# 1523-9926 http://technologyinterface.nmsu.edu/Fall09/
Figure 22 - S4 Conventional Core Results (HDPE)
Figure 23 - S4 Conformal Core Results (HDPE)
Figure 24 - P20 Part Interior Results (HDPE)
Figure 25 - S4 Conventional Part Interior Results (HDPE)

the Technology Interface Journal/Fall 2009 Meckley, Edwards
Volume 10 No. 1 ISSN# 1523-9926 http://technologyinterface.nmsu.edu/Fall09/
Figure 26 - S4 Conformal Part Interior Results (HDPE)
Figure 27 - P20 Part Exterior Results (HDPE)
Figure 28 - S4 Conventional Part Exterior Results (HDPE)
Figure 29 - S4 Conformal Part Exterior Results (HDPE)
the Technology Interface Journal/Fall 2009 Meckley, Edwards
Volume 10 No. 1 ISSN# 1523-9926 http://technologyinterface.nmsu.edu/Fall09/
Figure 30 - P20 Cavity Results (PC)
Figure 31 - S4 Conventional Cavity Results (PC)
Figure 32 - S4 Conformal Cavity Results (PC)
Figure 33 - P20 Core Results (PC)

the Technology Interface Journal/Fall 2009 Meckley, Edwards
Volume 10 No. 1 ISSN# 1523-9926 http://technologyinterface.nmsu.edu/Fall09/
Figure 34 - S4 Conventional Core Results (PC)
Figure 35 - S4 Conformal Core Results (PC)
Figure 36 - P20 Part Exterior Results (PC)
Figure 37 - S4 Conformal Exterior Results (PC)

the Technology Interface Journal/Fall 2009 Meckley, Edwards
Volume 10 No. 1 ISSN# 1523-9926 http://technologyinterface.nmsu.edu/Fall09/
Figure 38 - Cavity ANSYS Results
Figure 39 - Core ANSYS Results
Figure 40 - P20 Temperature Difference Results
Figure 41 - S4 Conventional Temperature Difference Results

the Technology Interface Journal/Fall 2009 Meckley, Edwards
Volume 10 No. 1 ISSN# 1523-9926 http://technologyinterface.nmsu.edu/Fall09/
Figure 42 - S4 Conformal Temperature Difference Results


![AVR Architecture [Lect-03 Fall09]](https://img.pdfslide.us/doc/110x75/577dab4c1a28ab223f8c3b24/avr-architecture-lect-03-fall09.jpg)