Embed Size (px)
Citation preview

INTERNATIONNAL JOURNAL OF APPLIED BIOMEDICAL ENGINEERING VOL.4, NO.1 2011 19
A STUDY OF ULTRASOUNDMEASUREMENT UTILIZED FOR THE
LIVER TESTING
Adisorn Leelasantitham ∗ and Supaporn Kiattisin∗ ,
ABSTRACT
Presently, there are many elders obtained fromliver diseases in the case of an unknown before bythemselves. If they do not diagnose such liver diseasesbefore, they may die. There are many methods fordiagnosing the liver e.g. a puncture of blood, ultra-sound, computed tomography (CT) scan, X-ray andmagnetic resonance imaging (MRI). These methodscan be selected to verify the liver diseases dependingon situations, chances and environments for humanliving. Therefore, we need to know these methodsbefore, and how to choose suitable methods for di-agnosis of our liver. This paper presents a study ofultrasound measurement utilized for the liver test-ing. In this study, we use ultrasonic to produce ul-trasound waves at frequency 3.5 MHz for testing theliver which we use a pig liver instead of human liver.The pig liver is put in a small acyclic box with thesoaked water. There are three conditions for testingultrasound waves i.e. water, normal liver and abnor-mal liver (burn or disease). The ultrasound wavesare sent to the small acyclic box containing the pigliver and dispatched to a probe of oscilloscope formeasurement. These waves are shown by the oscil-loscope and they are differently between the normaland abnormal livers. In this experiment, we test 10times for both the normal and the abnormal livers.The results show that the average velocities of the ul-trasound waves in water, normal liver and abnormalliver are at approximately 1,500 m/s, 1,590 m/s and2,000 m/s, respectively.
1. INTRODUCTION
Nowadays, many elders have been liver diseases(LDs) but they do not know such LDs before. Gen-erally, the LDs are obtained from many reasons suchas inflamed from Virus B, Virus C, alcohols or oth-ers etc. Such reasons can be the cause of cancers. Ifwe diagnose it before, we will cure it earlier throughthe use of a new liver substituted for the old liverfor stopping the distribution of cancers to inner andouter arteries of the liver. Therefore, it is necessary
Manuscript received on April 5, 2011.,∗The authors are with the Technology of Information Sys-
tem Management Program, Faculty of Engineering, MahidolUniversity, Thailand, E-mail: [email protected] andtom [email protected]
to know the diagnosis methods for checking the liverfirstly. Finally, there are normally five methods of di-agnosis for the LDs [1] such as 1) a puncture of blood,2) ultrasound, 3) computed tomography (CT) scan,4) X-ray and 5) magnetic resonance imaging (MRI).From the summary of five methods [1] (i.e. punctureof blood, ultrasound, CT scan, X-ray and MRI), wecan conclude that the ultrasound is suitable methodto use for diagnosis of our liver because it is easyand not harmful to test the liver. Another reason ofadvantage for the ultrasound may be a low cost com-pared to those methods. Recently, there have beenresearch papers reporting the use of the ultrasoundutilized for the change of tissue caused by diseases(e.g. cancer). For example, the paper [2] has pro-posed a measured 3D distribution of parameters ontissue elasticity and viscosity using the ultrasound.The paper [3] has presented the use of ultrasoundtransducers for a measurement of directivity pattern.It means that the beam pattern of ultrasound wavesis emitted from the transducers of varying resonancefrequencies depending on the frequency of the trans-ducers. In this paper, the study of ultrasound mea-surement is presented through the liver testing to findthe velocities of the ultrasound waves in water andliver. We use ultrasonic to produce ultrasound wavesat frequency 3.5 MHz for testing the liver which weuse a pig liver instead of human liver. The pig liveris put in a small acyclic box with the soaked wa-ter. There are three conditions for testing ultrasoundwaves i.e. water, normal liver and abnormal liver(burn or disease).
2. METHODOLOGY
Figure 1 shows methodology for the ultrasoundmeasurement of the liver testing. It can be seen fromFig. 1 that the ultrasound generator will produceultrasound waves of the frequency at 3.5 MHz. Thisfrequency is sent to the liver and then it is dispatchedto such the liver. Finally, this dispatched frequencyis measured by the oscilloscope to show the outputwaveform.
2.1 EQUIPMENTS AND TESTING CON-DITIONS
2.1...1 Speed calculation of ultrasound in the water
This section will describe an example of speed cal-

20 A. Leelasantitham and S. Kiattisin: A Study of Ultrasound Measurement Utilized For The Liver Testing(19-23)
Fig.1: Methodology for the ultrasound measurementof the liver testing.
culation of ultrasound in the water. A basic conceptof speed calculation is that we need to know distanceand time usage time before. The speed equation canbe defined as
V = S/T (1)
where V is the wave speed, S is the distance obtainedby moving wave from the start point to the end point.T is the usage time derived by spending the time ofdistance of wave traveling. For example of speed cal-culation, Figure 2 shows distances and time divisionsof measuring the ultrasound wave in the water. It canbe seen from Figs. 2 (a) and (b) that the distances oftraveling ultrasound in the water (between the shoot-ing head and edge of box) are 4.5 cm, and the timedivisions are 6 blocks. The times of one division are10 s; therefore, the total times of traveling ultrasoundin the water are 60 s i.e. 10×6 = 60 µs. The speed ofultrasound in the water (go and back) using equation(1) is 1,500 m/s i.e. (4.5cm/60 µs)x2 = 1,500 m/s.
2.1...2 Equipments
Figure 3 shows equipments prepared for the ultra-sound measurement of the liver testing. It can beseen from Fig. 3 that the main equipments consist of5 parts as follows. The 1st part is ultrasound genera-tor, as shown in Fig. 3(a). The 2nd part is a shootinghead of the ultrasound generator, as shown in Fig.3(b) and the 3rd part is a big acyclic box coveredblack color of four sides, as shown in Fig. 3(c). The2nd part is taken into the 3rd part as shown in Fig.3(d). The 4th part is oscilloscope to measure the out-put signal, as shown in Fig. 3(e). Finally, the 5th partis a computer including program of collecting the sig-nal into digital data, as shown in Fig. 3(f). Figure 4
(a)
(b)
Fig.2: (a) Distances and (b) time divisions of mea-suring the ultrasound waves in the water.
shows all of connected equipments for preparing theliver testing.
2.1...3 Testing conditions
For the testing conditions, we use a pig liver in-stead of human liver for testing output results in dif-ferent between normal and abnormal liver (burn ordisease). Figure 5 shows a big acyclic box coveredblack colors (or the 2nd part) and a small acrylic boxof transparence. These two boxes will contain thewater together. It can be seen from Fig. 5 that thesmall acrylic box is contained into the big acyclic boxwhilst the pig liver also is contained into the smallbox. The 1st range is distance between the shootinghead and the edge of small box, as well as the 2nd
range is distance of the gap in the small box. Thereare three conditions of the liver testing as follows.The 1st, 2nd and 3rd conditions are small acrylic boxof transparence with the water, the pig liver and theburned pig liver.
3. EXPERIMENTAL RESULTS AND FUTHERSTUDY
In this study, the ultrasound is selected at fre-quency 3.5 MHz. This study is to test 10 times for the
INTERNATIONNAL JOURNAL OF APPLIED BIOMEDICAL ENGINEERING VOL.4, NO.1 2011 21
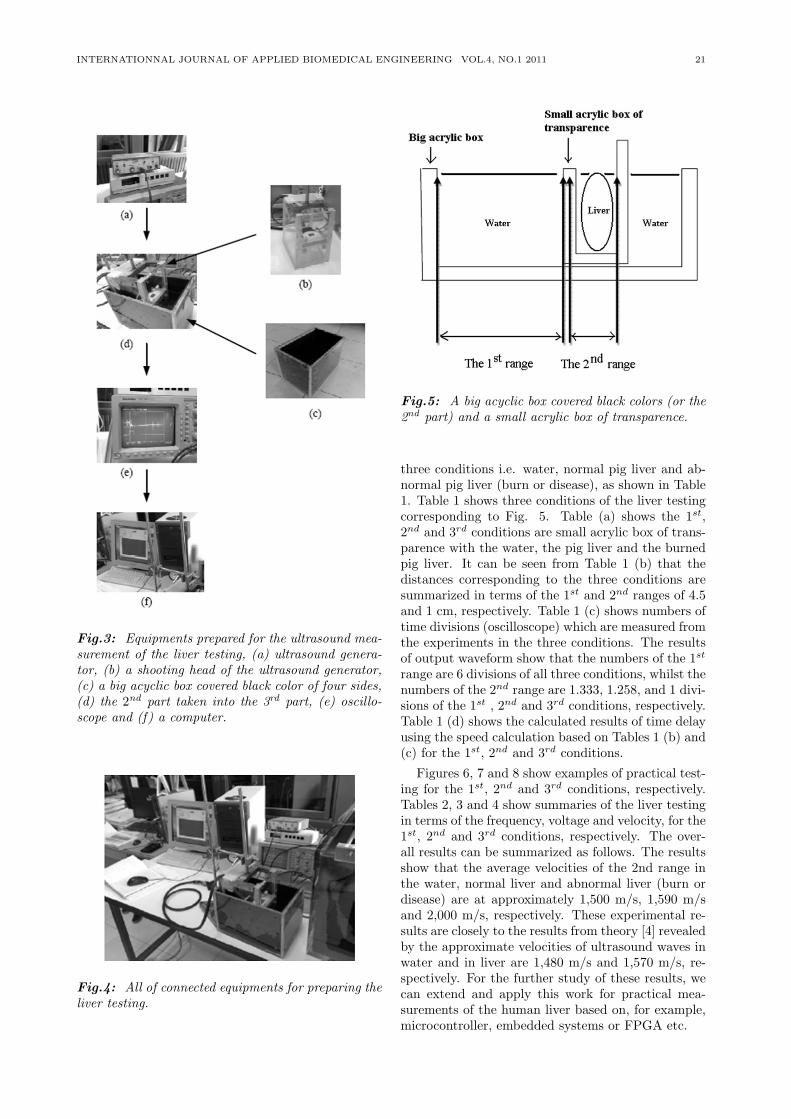
Fig.3: Equipments prepared for the ultrasound mea-surement of the liver testing, (a) ultrasound genera-tor, (b) a shooting head of the ultrasound generator,(c) a big acyclic box covered black color of four sides,(d) the 2nd part taken into the 3rd part, (e) oscillo-scope and (f) a computer.
Fig.4: All of connected equipments for preparing theliver testing.
Fig.5: A big acyclic box covered black colors (or the2nd part) and a small acrylic box of transparence.
three conditions i.e. water, normal pig liver and ab-normal pig liver (burn or disease), as shown in Table1. Table 1 shows three conditions of the liver testingcorresponding to Fig. 5. Table (a) shows the 1st,2nd and 3rd conditions are small acrylic box of trans-parence with the water, the pig liver and the burnedpig liver. It can be seen from Table 1 (b) that thedistances corresponding to the three conditions aresummarized in terms of the 1st and 2nd ranges of 4.5and 1 cm, respectively. Table 1 (c) shows numbers oftime divisions (oscilloscope) which are measured fromthe experiments in the three conditions. The resultsof output waveform show that the numbers of the 1st
range are 6 divisions of all three conditions, whilst thenumbers of the 2nd range are 1.333, 1.258, and 1 divi-sions of the 1st , 2nd and 3rd conditions, respectively.Table 1 (d) shows the calculated results of time delayusing the speed calculation based on Tables 1 (b) and(c) for the 1st, 2nd and 3rd conditions.
Figures 6, 7 and 8 show examples of practical test-ing for the 1st, 2nd and 3rd conditions, respectively.Tables 2, 3 and 4 show summaries of the liver testingin terms of the frequency, voltage and velocity, for the1st, 2nd and 3rd conditions, respectively. The over-all results can be summarized as follows. The resultsshow that the average velocities of the 2nd range inthe water, normal liver and abnormal liver (burn ordisease) are at approximately 1,500 m/s, 1,590 m/sand 2,000 m/s, respectively. These experimental re-sults are closely to the results from theory [4] revealedby the approximate velocities of ultrasound waves inwater and in liver are 1,480 m/s and 1,570 m/s, re-spectively. For the further study of these results, wecan extend and apply this work for practical mea-surements of the human liver based on, for example,microcontroller, embedded systems or FPGA etc.

22 A. Leelasantitham and S. Kiattisin: A Study of Ultrasound Measurement Utilized For The Liver Testing(19-23)
Table 1: Three conditions of the liver testing corre-sponding to Fig. 7.
Fig.6: Examples of practical testing for the 1st
condition, (a) the connected equipments, (b) outputwaveform of oscilloscope and (c) caption of outputwaveform.
Table 2: Summaries of the liver testing in terms ofthe frequency and velocities for the 1st condition.
Numbers Frequency Velocities (m/s)of testing (MHz) 1st range 2nd range
1 3.5 1,500 1,5002 3.5 1,500 1,5003 3.5 1,500 1,5004 3.5 1,500 1,5005 3.5 1,500 1,5006 3.5 1,500 1,5007 3.5 1,500 1,5008 3.5 1,500 1,5009 3.5 1,500 1,50010 3.5 1,500 1,500
Fig.7: Examples of practical testing for the 2nd
condition, (a) the connected equipments, (b) outputwaveform of oscilloscope and (c) caption of outputwaveform.
Table 3: Summaries of the liver testing in terms ofthe frequency and velocities for the 2nd condition.
Numbers Frequency Velocities (m/s)of testing (MHz) 1st range 2nd range
1 3.5 1,500 1,5902 3.5 1,500 1,5903 3.5 1,500 1,5904 3.5 1,500 1,5905 3.5 1,500 1,5906 3.5 1,500 1,5907 3.5 1,500 1,5908 3.5 1,500 1,5909 3.5 1,500 1,59010 3.5 1,500 1,590
Table 4: Summaries of the liver testing in terms ofthe frequency and velocities for the 3rd condition.
Numbers Frequency Velocities (m/s)of testing (MHz) 1st range 2nd range
1 3.5 1,500 2,0002 3.5 1,500 2,0003 3.5 1,500 2,0004 3.5 1,500 2,0005 3.5 1,500 2,0006 3.5 1,500 2,0007 3.5 1,500 2,0008 3.5 1,500 2,0009 3.5 1,500 2,00010 3.5 1,500 2,000

INTERNATIONNAL JOURNAL OF APPLIED BIOMEDICAL ENGINEERING VOL.4, NO.1 2011 23
Fig.8: Examples of practical testing for the 3rd
condition, (a) the connected equipments, (b) outputwaveform of oscilloscope and (c) caption of outputwaveform.
4. CONCLUSION
This paper has presented the study of ultrasoundmeasurement utilized for the liver testing. In thisstudy, we use ultrasonic to produce ultrasound wavesat frequency 3.5 MHz for testing the liver which weuse the pig liver instead of human liver. The pigliver is put in a small acyclic box with the soaked wa-ter. There are three conditions for testing ultrasoundwaves i.e. the water, normal liver and abnormal liver(burn or disease). The ultrasound waves are sent tothe small acyclic box containing the pig liver and dis-patched to the probe of oscilloscope for measurement.Shapes of these waves are shown by the oscilloscopeand they are differently between the normal and ab-normal livers. In this experiment, we test 10 timesfor both the normal and the abnormal livers. Theresults show that the average velocities of the ultra-sound waves in the water, normal liver and abnormalliver are at approximately 1,500 m/s, 1,590 m/s and2,000 m/s, respectively. These experimental resultsare closely to the results from theory [4].
5. ACKNOWLEDGEMENT
The authors are grateful to Mr. Apirat Tachom-poo, Mr. Tinankorn Chamnansutha, Mr. Kampa-nart Chomchuy for their useful help in this work andto thank Mr. Arthorn Sanpanich for his support offacilities in Research Laboratory, Department of Elec-tronic Engineering, KMITL.
References
[1] Adisorn Leelasantitham, “A Study of variousmethods for Diagnosis Human Liver,” The 3rd
Biomedical Engineering International Conference(BMEiCON2010), Kyoto, Japan, 26-August 26-27, 2010.
[2] Tsuyoshi Shiina, “In Vitro 3-D Measurement ofTissue Viscoelasticity by Ultrasound,” Interna-tional Journal of Applied Biomedical Engineering(IJABME), Vol. 1, No. 1, July-December 2008,pp. 1-6.
[3] Sumet Umchid, “Directivity Pattern Measure-ment of Ultrasound Transducers,” Interna-tional Journal of Applied Biomedical Engineering(IJABME), Vol. 2, No. 1, January-June 2009, pp.39-43.
[4] William R. Hendee, E. Russell Ritenour, Medi-cal Imaging Physics, 4th Edition, Wiley Publisher,May 2002.
Adisorn Leelasantitham received theB.Eng. degree in Electronics andTelecommunications and the M.Eng.degree in Electrical Engineering fromKing Mongkut’s University of Technol-ogy Thonburi (KMUTT), Thailand, in1997 and 1999, respectively. He receivedhis Ph.D. degree in Electrical Engineer-ing from Sirindhorn International Insti-tute of Technology (SIIT), ThammasatUniversity, Thailand, in 2005. He is cur-
rently the Assistant Professor in Technology of InformationSystem Management Program, Faculty of Engineering, Mahi-dol University, Thailand. His research interests include analogcircuits, image processing, medical images, computer graph-ics, AI, neural networks, microcontrollers, embedded systems,robotics and applications of chaos systems.
Supaporn Kiattisin received B.Eng.in Computer Engineering from Chiang-mai University in 1995, M.Eng. inElectrical Engineering and Ph.D. inElectrical and Computer Engineeringfrom King Mongkuts University of Tech-nology Thonburi (KMUTT), Bangkok,Thailand. She currently works at Tech-nology of Information System Manage-ment Program, Faculty of Engineering,Mahidol University, Thailand. Her re-
search interests include medical imaging, computer vision andmodeling. She is member of TESA, ThaiBME, IEICE andIEEE.
![Ultrasound versus liver function tests for diagnosis of ... · [Diagnostic Test Accuracy Review] Ultrasound versus liver function tests for diagnosis of common bile duct stones Kurinchi](https://img.pdfslide.us/doc/110x75/601bcce3144189465e124f14/ultrasound-versus-liver-function-tests-for-diagnosis-of-diagnostic-test-accuracy.jpg)

![Endoscopic ultrasound-guided biopsy in chronic liver ...scopic ultrasound-guided liver biopsy (EUS-LB) is another method of acquiring liver tissue [8,9]. The feasibility of EUS-LB](https://img.pdfslide.us/doc/110x75/600c40491939a52c585d9ae9/endoscopic-ultrasound-guided-biopsy-in-chronic-liver-scopic-ultrasound-guided.jpg)