Embed Size (px)
Citation preview
A Study of the Effects of Post-Combustion AmmoniaInjection on Fly Ash Quality: Characterization of
Ammonia Release from Concrete and Mortars Containing Fly Ash as a Pozzolanic Admixture
Final Report
Principal Authors:Robert F. Rathbone and Thomas L. Robl
University of Kentucky Center for Applied Energy Research2540 Research Park Drive
Lexington, Kentucky 40511-8410
on behalf of:University of Kentucky Research Foundation
201 Kinkead HallLexington, KY 40506
U.S. DoE Cooperative Agreement Number: DE-FC26-00NT40908

Disclaimer
This report was prepared as an account of work sponsored by an agency of the UnitedStates Government. Neither the United States Government nor any agency thereof,nor any of their employees, makes any warranty, express or implied, or assumes anylegal liability or responsibility for the accuracy, completeness, or usefulness of anyinformation, apparatus, product, or process disclosed, or represents that its use wouldnot infringe privately owned rights. Reference herein to any specific commercialproduct, process, or service by trade name, trademark, manufacturer, or otherwisedoes not necessarily constitute or imply its endorsement, recommendation, or favoringby the United States Government or any agency thereof. The views and opinions of theauthors expressed herein do not necessarily state or reflect those of the United StatesGovernment or any agency thereof.
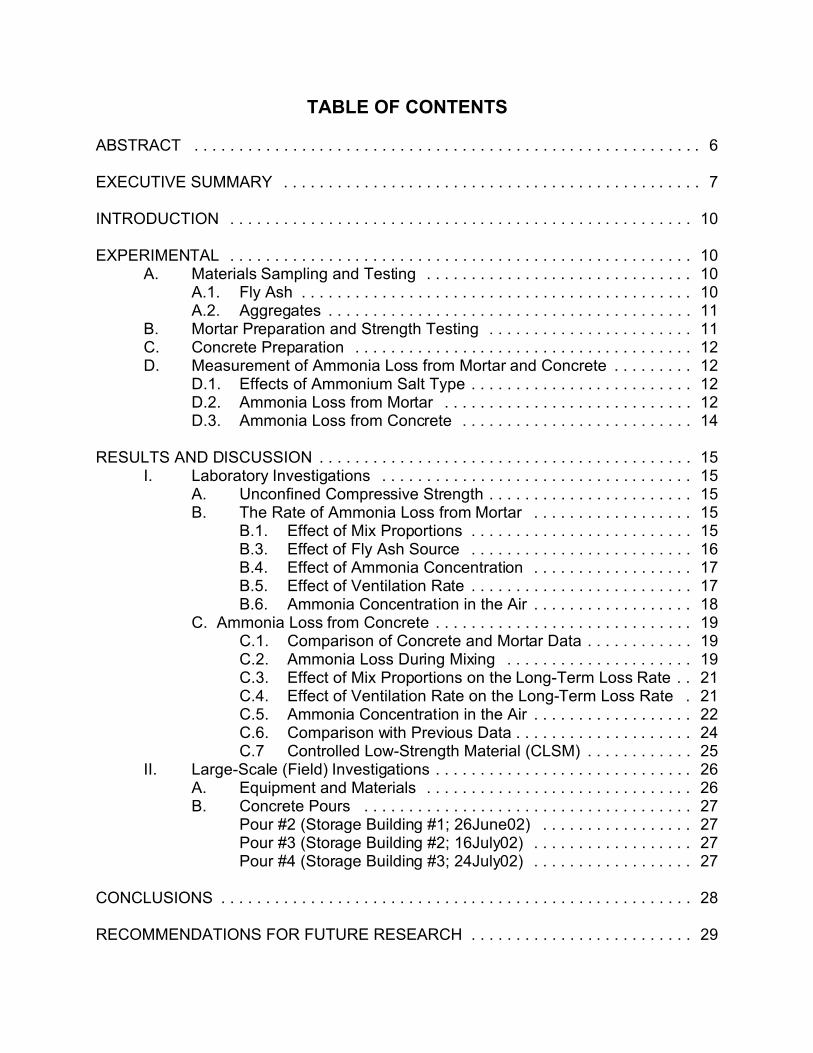
TABLE OF CONTENTS
ABSTRACT . . . . . . . . . . . . . . . . . . . . . . . . . . . . . . . . . . . . . . . . . . . . . . . . . . . . . . . . . 6
EXECUTIVE SUMMARY . . . . . . . . . . . . . . . . . . . . . . . . . . . . . . . . . . . . . . . . . . . . . . . 7
INTRODUCTION . . . . . . . . . . . . . . . . . . . . . . . . . . . . . . . . . . . . . . . . . . . . . . . . . . . . 10
EXPERIMENTAL . . . . . . . . . . . . . . . . . . . . . . . . . . . . . . . . . . . . . . . . . . . . . . . . . . . . 10A. Materials Sampling and Testing . . . . . . . . . . . . . . . . . . . . . . . . . . . . . . 10
A.1. Fly Ash . . . . . . . . . . . . . . . . . . . . . . . . . . . . . . . . . . . . . . . . . . . . 10A.2. Aggregates . . . . . . . . . . . . . . . . . . . . . . . . . . . . . . . . . . . . . . . . . 11
B. Mortar Preparation and Strength Testing . . . . . . . . . . . . . . . . . . . . . . . 11C. Concrete Preparation . . . . . . . . . . . . . . . . . . . . . . . . . . . . . . . . . . . . . . 12D. Measurement of Ammonia Loss from Mortar and Concrete . . . . . . . . . 12
D.1. Effects of Ammonium Salt Type . . . . . . . . . . . . . . . . . . . . . . . . . 12D.2. Ammonia Loss from Mortar . . . . . . . . . . . . . . . . . . . . . . . . . . . . 12D.3. Ammonia Loss from Concrete . . . . . . . . . . . . . . . . . . . . . . . . . . 14
RESULTS AND DISCUSSION . . . . . . . . . . . . . . . . . . . . . . . . . . . . . . . . . . . . . . . . . . 15I. Laboratory Investigations . . . . . . . . . . . . . . . . . . . . . . . . . . . . . . . . . . . 15
A. Unconfined Compressive Strength . . . . . . . . . . . . . . . . . . . . . . . 15B. The Rate of Ammonia Loss from Mortar . . . . . . . . . . . . . . . . . . 15
B.1. Effect of Mix Proportions . . . . . . . . . . . . . . . . . . . . . . . . . 15B.3. Effect of Fly Ash Source . . . . . . . . . . . . . . . . . . . . . . . . . 16B.4. Effect of Ammonia Concentration . . . . . . . . . . . . . . . . . . 17B.5. Effect of Ventilation Rate . . . . . . . . . . . . . . . . . . . . . . . . . 17B.6. Ammonia Concentration in the Air . . . . . . . . . . . . . . . . . . 18
C. Ammonia Loss from Concrete . . . . . . . . . . . . . . . . . . . . . . . . . . . . . 19C.1. Comparison of Concrete and Mortar Data . . . . . . . . . . . . 19C.2. Ammonia Loss During Mixing . . . . . . . . . . . . . . . . . . . . . 19C.3. Effect of Mix Proportions on the Long-Term Loss Rate . . 21C.4. Effect of Ventilation Rate on the Long-Term Loss Rate . 21C.5. Ammonia Concentration in the Air . . . . . . . . . . . . . . . . . . 22C.6. Comparison with Previous Data . . . . . . . . . . . . . . . . . . . . 24C.7 Controlled Low-Strength Material (CLSM) . . . . . . . . . . . . 25
II. Large-Scale (Field) Investigations . . . . . . . . . . . . . . . . . . . . . . . . . . . . . 26A. Equipment and Materials . . . . . . . . . . . . . . . . . . . . . . . . . . . . . . 26B. Concrete Pours . . . . . . . . . . . . . . . . . . . . . . . . . . . . . . . . . . . . . 27
Pour #2 (Storage Building #1; 26June02) . . . . . . . . . . . . . . . . . 27Pour #3 (Storage Building #2; 16July02) . . . . . . . . . . . . . . . . . . 27Pour #4 (Storage Building #3; 24July02) . . . . . . . . . . . . . . . . . . 27
CONCLUSIONS . . . . . . . . . . . . . . . . . . . . . . . . . . . . . . . . . . . . . . . . . . . . . . . . . . . . . 28
RECOMMENDATIONS FOR FUTURE RESEARCH . . . . . . . . . . . . . . . . . . . . . . . . . 29
REFERENCES . . . . . . . . . . . . . . . . . . . . . . . . . . . . . . . . . . . . . . . . . . . . . . . . . . . . . . 30
APPENDIX . . . . . . . . . . . . . . . . . . . . . . . . . . . . . . . . . . . . . . . . . . . . . . . . . . . . . . . . . 60
LIST OF TABLES
Table 1. Source and General Information for Fly Ash Samples . . . . . . . . . . . . . . . . 33Table 2. ASTM C 618 Data for Fly Ash Samples . . . . . . . . . . . . . . . . . . . . . . . . . . . 33Table 3. Chemical Composition of Fly Ash Samples . . . . . . . . . . . . . . . . . . . . . . . . . 34Table 4. Aggregate Testing Data . . . . . . . . . . . . . . . . . . . . . . . . . . . . . . . . . . . . . . . . 34Table 5. Mortar Mix Proportions . . . . . . . . . . . . . . . . . . . . . . . . . . . . . . . . . . . . . . . . 35Table 6. Proportions of Concrete Mixes Used in this Study . . . . . . . . . . . . . . . . . . . 35Table 7. Unconfined Compressive Strength (UCS) of Mortar . . . . . . . . . . . . . . . . . . 36Table 8. UCS of Mortar with Added Ammonia . . . . . . . . . . . . . . . . . . . . . . . . . . . . . . 36Table 9. Porosity of Low and High W:CM Mortars . . . . . . . . . . . . . . . . . . . . . . . . . . . 36Table 10. Ammonia in Air Above Fresh Mortar . . . . . . . . . . . . . . . . . . . . . . . . . . . . . 37Table 11. Maximum Ammonia Level in Air Above Fresh Mortar . . . . . . . . . . . . . . . . 37Table 12. Ammonia Loss During Concrete Mixing . . . . . . . . . . . . . . . . . . . . . . . . . . 37Table 13. Estimated Maximum Quantities of NH3 in Fly Ash . . . . . . . . . . . . . . . . . . . 38Table 14. Proportions of Concrete Used for Large-Scale Experiments . . . . . . . . . . . 38
LIST OF FIGURES
Figure 1. Experimental apparatus used to measure ammonia loss from mortar . 39Figure 2. Apparatus designed to measure ammonia in the air above mortar . . . . 40Figure 3. Concrete mixer . . . . . . . . . . . . . . . . . . . . . . . . . . . . . . . . . . . . . . . . . . . 41Figure 4. Apparatus for measuring the ammonia in fresh concrete . . . . . . . . . . . 41Figure 5. Apparatus used to measure the ammonia loss rate from concrete . . . . 42Figure 6. Ammonia loss from mortar . . . . . . . . . . . . . . . . . . . . . . . . . . . . . . . . . . 43Figure 7. Ammonia loss from mortars . . . . . . . . . . . . . . . . . . . . . . . . . . . . . . . . . 44Figure 8. Ammonia loss from mortar . . . . . . . . . . . . . . . . . . . . . . . . . . . . . . . . . . 45Figure 9. The loss of ammonia from mortar as a function of ventilation rate . . . . 46Figure 10. Extrapolation of selected ammonia loss data shown in Figure 9 . . . . . 46Figure 11. The concentration of ammonia in the air above mortar . . . . . . . . . . . . . 47Figure 12. Comparison of ammonia loss rate from mortar and concrete . . . . . . . . 47Figure 13. Loss of ammonia from concrete during mixing of different batch sizes . 48Figure 14. The loss of ammonia during mixing of different concretes . . . . . . . . . . 48Figure 15. The effect of temperature on ammonia loss during concrete mixing . . . 49Figure 16. Long-term ammonia loss from different concrete mixes . . . . . . . . . . . . 49Figure 17. “Corrected” long-term ammonia loss data . . . . . . . . . . . . . . . . . . . . . . . 50Figure 18. Long-term ammonia loss data that have been mathematically fitted . . 50Figure 19. Long-term ammonia loss from concrete . . . . . . . . . . . . . . . . . . . . . . . . 51
Figure 20. Ammonia concentration in the air above concrete without ventilation . . 51Figure 21. NH3 concentration in the air above concrete, with 8.3 L/min ventilation 52Figure 22. Maximum NH3 concentration in the air above fresh concrete . . . . . . . . 52Figure 23. Maximum NH3 concentration in the air above fresh concrete . . . . . . . . 53Figure 24. Comparison of Koch and Prenzel and van der Brugghen data . . . . . . . 53Figure 25. Ready Mix concrete truck used for the large-scale experiments . . . . . . 54Figure 26. Finishing of test slab (Batch #1) . . . . . . . . . . . . . . . . . . . . . . . . . . . . . . 54Figure 27. Storage buildings for large-scale ammonia monitoring experiments . . . 55Figure 28. Construction of vinyl building within concrete forms . . . . . . . . . . . . . . . 55Figure 29. Discharge of concrete into a building . . . . . . . . . . . . . . . . . . . . . . . . . . 56Figure 30. Monitor and pump used to detect ammonia within the buildings . . . . . . 56Figure 31. Ammonia loss from concrete during mixing within the Ready Mix truck 57Figure 32. The concentration of ammonia within Building #2 . . . . . . . . . . . . . . . . . 57Figure 33. The loss rate of ammonia during concrete mixing . . . . . . . . . . . . . . . . . 58Figure 34. The concentration of ammonia within Building #3 . . . . . . . . . . . . . . . . . 58Figure 35. Comparison of laboratory and field (i.e. storage building slab) data . . . 59
6
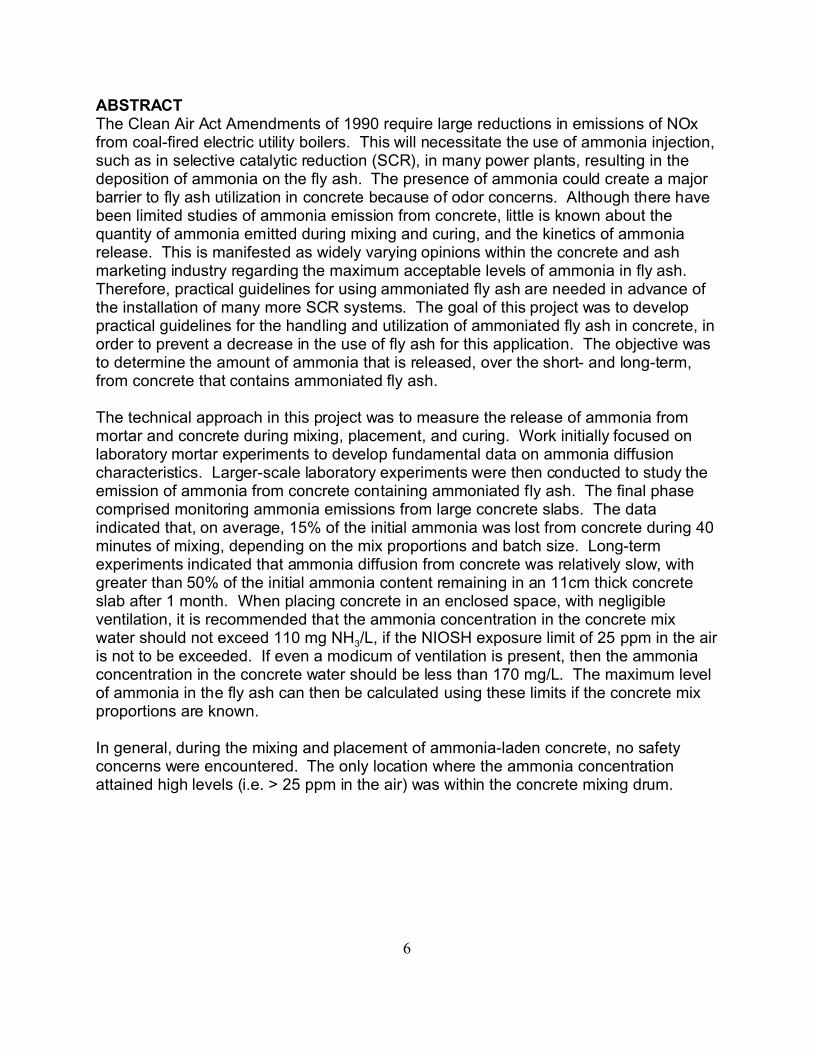
ABSTRACTThe Clean Air Act Amendments of 1990 require large reductions in emissions of NOxfrom coal-fired electric utility boilers. This will necessitate the use of ammonia injection,such as in selective catalytic reduction (SCR), in many power plants, resulting in thedeposition of ammonia on the fly ash. The presence of ammonia could create a majorbarrier to fly ash utilization in concrete because of odor concerns. Although there havebeen limited studies of ammonia emission from concrete, little is known about thequantity of ammonia emitted during mixing and curing, and the kinetics of ammoniarelease. This is manifested as widely varying opinions within the concrete and ashmarketing industry regarding the maximum acceptable levels of ammonia in fly ash. Therefore, practical guidelines for using ammoniated fly ash are needed in advance ofthe installation of many more SCR systems. The goal of this project was to developpractical guidelines for the handling and utilization of ammoniated fly ash in concrete, inorder to prevent a decrease in the use of fly ash for this application. The objective wasto determine the amount of ammonia that is released, over the short- and long-term,from concrete that contains ammoniated fly ash.
The technical approach in this project was to measure the release of ammonia frommortar and concrete during mixing, placement, and curing. Work initially focused onlaboratory mortar experiments to develop fundamental data on ammonia diffusioncharacteristics. Larger-scale laboratory experiments were then conducted to study theemission of ammonia from concrete containing ammoniated fly ash. The final phasecomprised monitoring ammonia emissions from large concrete slabs. The dataindicated that, on average, 15% of the initial ammonia was lost from concrete during 40minutes of mixing, depending on the mix proportions and batch size. Long-termexperiments indicated that ammonia diffusion from concrete was relatively slow, withgreater than 50% of the initial ammonia content remaining in an 11cm thick concreteslab after 1 month. When placing concrete in an enclosed space, with negligibleventilation, it is recommended that the ammonia concentration in the concrete mixwater should not exceed 110 mg NH3/L, if the NIOSH exposure limit of 25 ppm in the airis not to be exceeded. If even a modicum of ventilation is present, then the ammoniaconcentration in the concrete water should be less than 170 mg/L. The maximum levelof ammonia in the fly ash can then be calculated using these limits if the concrete mixproportions are known.
In general, during the mixing and placement of ammonia-laden concrete, no safetyconcerns were encountered. The only location where the ammonia concentrationattained high levels (i.e. > 25 ppm in the air) was within the concrete mixing drum.
7
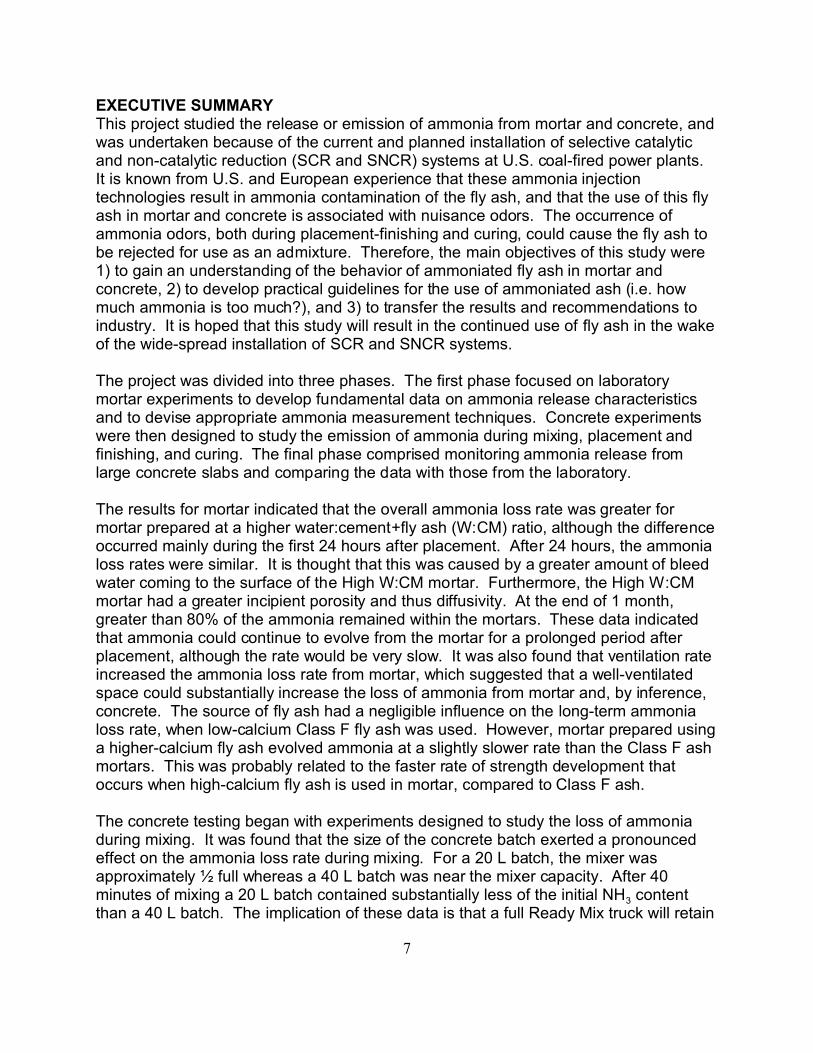
EXECUTIVE SUMMARYThis project studied the release or emission of ammonia from mortar and concrete, andwas undertaken because of the current and planned installation of selective catalyticand non-catalytic reduction (SCR and SNCR) systems at U.S. coal-fired power plants. It is known from U.S. and European experience that these ammonia injectiontechnologies result in ammonia contamination of the fly ash, and that the use of this flyash in mortar and concrete is associated with nuisance odors. The occurrence ofammonia odors, both during placement-finishing and curing, could cause the fly ash tobe rejected for use as an admixture. Therefore, the main objectives of this study were1) to gain an understanding of the behavior of ammoniated fly ash in mortar andconcrete, 2) to develop practical guidelines for the use of ammoniated ash (i.e. howmuch ammonia is too much?), and 3) to transfer the results and recommendations toindustry. It is hoped that this study will result in the continued use of fly ash in the wakeof the wide-spread installation of SCR and SNCR systems.
The project was divided into three phases. The first phase focused on laboratorymortar experiments to develop fundamental data on ammonia release characteristicsand to devise appropriate ammonia measurement techniques. Concrete experimentswere then designed to study the emission of ammonia during mixing, placement andfinishing, and curing. The final phase comprised monitoring ammonia release fromlarge concrete slabs and comparing the data with those from the laboratory.
The results for mortar indicated that the overall ammonia loss rate was greater formortar prepared at a higher water:cement+fly ash (W:CM) ratio, although the differenceoccurred mainly during the first 24 hours after placement. After 24 hours, the ammonialoss rates were similar. It is thought that this was caused by a greater amount of bleedwater coming to the surface of the High W:CM mortar. Furthermore, the High W:CMmortar had a greater incipient porosity and thus diffusivity. At the end of 1 month,greater than 80% of the ammonia remained within the mortars. These data indicatedthat ammonia could continue to evolve from the mortar for a prolonged period afterplacement, although the rate would be very slow. It was also found that ventilation rateincreased the ammonia loss rate from mortar, which suggested that a well-ventilatedspace could substantially increase the loss of ammonia from mortar and, by inference,concrete. The source of fly ash had a negligible influence on the long-term ammonialoss rate, when low-calcium Class F fly ash was used. However, mortar prepared usinga higher-calcium fly ash evolved ammonia at a slightly slower rate than the Class F ashmortars. This was probably related to the faster rate of strength development thatoccurs when high-calcium fly ash is used in mortar, compared to Class F ash.
The concrete testing began with experiments designed to study the loss of ammoniaduring mixing. It was found that the size of the concrete batch exerted a pronouncedeffect on the ammonia loss rate during mixing. For a 20 L batch, the mixer wasapproximately ½ full whereas a 40 L batch was near the mixer capacity. After 40minutes of mixing a 20 L batch contained substantially less of the initial NH3 contentthan a 40 L batch. The implication of these data is that a full Ready Mix truck will retain
8
a larger proportion of ammonia than if the truck is not filled to capacity. In addition tobatch size, the concrete mix proportions also affected the ammonia loss rate. In thiscase, a lower W:CM concrete lost less of its ammonia during mixing than a higherW:CM concrete. On average, it was found that approximately 85% of the initialammonia content remained within the concrete after 40 minutes mixing.
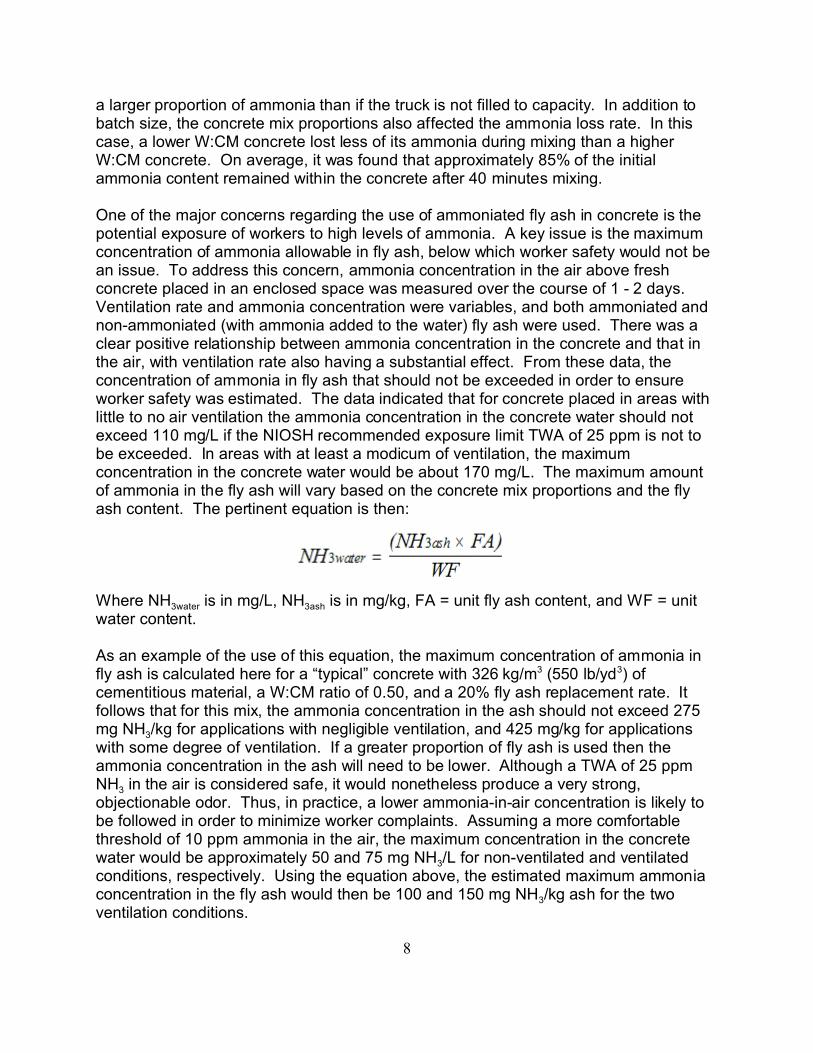
One of the major concerns regarding the use of ammoniated fly ash in concrete is thepotential exposure of workers to high levels of ammonia. A key issue is the maximumconcentration of ammonia allowable in fly ash, below which worker safety would not bean issue. To address this concern, ammonia concentration in the air above freshconcrete placed in an enclosed space was measured over the course of 1 - 2 days. Ventilation rate and ammonia concentration were variables, and both ammoniated andnon-ammoniated (with ammonia added to the water) fly ash were used. There was aclear positive relationship between ammonia concentration in the concrete and that inthe air, with ventilation rate also having a substantial effect. From these data, theconcentration of ammonia in fly ash that should not be exceeded in order to ensureworker safety was estimated. The data indicated that for concrete placed in areas withlittle to no air ventilation the ammonia concentration in the concrete water should notexceed 110 mg/L if the NIOSH recommended exposure limit TWA of 25 ppm is not tobe exceeded. In areas with at least a modicum of ventilation, the maximumconcentration in the concrete water would be about 170 mg/L. The maximum amountof ammonia in the fly ash will vary based on the concrete mix proportions and the flyash content. The pertinent equation is then:
Where NH3water is in mg/L, NH3ash is in mg/kg, FA = unit fly ash content, and WF = unitwater content.
As an example of the use of this equation, the maximum concentration of ammonia infly ash is calculated here for a “typical” concrete with 326 kg/m3 (550 lb/yd3) ofcementitious material, a W:CM ratio of 0.50, and a 20% fly ash replacement rate. Itfollows that for this mix, the ammonia concentration in the ash should not exceed 275mg NH3/kg for applications with negligible ventilation, and 425 mg/kg for applicationswith some degree of ventilation. If a greater proportion of fly ash is used then theammonia concentration in the ash will need to be lower. Although a TWA of 25 ppmNH3 in the air is considered safe, it would nonetheless produce a very strong,objectionable odor. Thus, in practice, a lower ammonia-in-air concentration is likely tobe followed in order to minimize worker complaints. Assuming a more comfortablethreshold of 10 ppm ammonia in the air, the maximum concentration in the concretewater would be approximately 50 and 75 mg NH3/L for non-ventilated and ventilatedconditions, respectively. Using the equation above, the estimated maximum ammoniaconcentration in the fly ash would then be 100 and 150 mg NH3/kg ash for the twoventilation conditions.

9
The long-term loss of ammonia from concrete was studied over 1 month, with severalvariables tested. Unlike mortar, the concrete mix proportioning had no significant effecton the long-term rate of ammonia loss from concrete, nor did the ventilation conditions. The source of ammoniated fly ash also did not exhibit a noticeable effect on the long-term loss rate, when the data are expressed as a fraction of the initial ammonia contentin the concrete. The data indicated that in an enclosed space the rate of ammonia lossfrom concrete is limited by diffusion through the concrete and not by the gas phaseconcentration of ammonia above the concrete. Therefore, it is inferred that exposure ofthe concrete outdoors, with a high degree of ventilation, prior to enclosure within astructure would not necessarily result in an increased loss of the ammonia within theconcrete compared to a slab placed indoors with a lower degree of ventilation.
In general, the ammonia loss data indicate that after 1 month the loss rate had slowedsignificantly, although a substantial proportion of ammonia remained in an 11cm (4.3 in)slab of concrete. Moreover, a greater percentage of ammonia would remain in a thickerslab. Combining the mixing loss and long-term ammonia loss data, approximately 50%of the initial ammonia content remained in the concrete after 1 month time, and continued to diffuse from the concrete over the course of many months. However, atthis point the rate was extremely slow, thus making long-term odors negligible. In ourexperiments, the ammonia concentration in the air decreased to less than 1-2 ppmwithin several days, even when using fly ash with a high concentration of ammonia. The residual ammonia in concrete would therefore be unlikely to cause any noticeablelong-term odor problems, particularly for properly ventilated spaces.
The final phase of the project focused on the behavior of ammonia in Ready Mixconcrete, during mixing, placement and finishing, and curing. Three 10 ft. X 15 ft. slabs(10-13 cm thick) were placed inside of vinyl buildings, and the ammonia concentrationin the air monitored. Overall, the “field” data corresponded to the laboratory data. Themaximum concentration of ammonia in the air within the buildings during placementand finishing agreed well with laboratory data, as did the amounts of ammonia lossduring mixing. Similar to the lab experiments, the ammonia levels in the buildingsdecreased to less than 2 ppm within several days. Thereafter, no odors could bedetected. In general, during the mixing and placement of ammonia-laden concrete, nosafety concerns were encountered even when a fly ash containing 280 mg NH3/kg wasused. The only location where the ammonia concentration attained high levels (i.e. >25 ppm in the air) was within the concrete mixing drum.
10
INTRODUCTIONThe Clean Air Act Amendments of 1990 require large reductions in emissions of NOxfrom coal-fired electric utility boilers. This will necessitate the use of ammonia injection,such as in selective catalytic and non-catalytic reduction (SCR and SNCR) systems atmany U.S. coal-fired power plants. In these systems some of the process ammoniainevitably “slips” through un-reacted, which results in the deposition of ammonia on thefly ash. It is well known from U.S. and European experience that these ammoniainjection technologies result in ammonia contamination of the fly ash, and that the useof this fly ash in mortar and concrete is associated with nuisance odors. Theoccurrence of an ammonia odors, both during placement-finishing and curing, couldcause the fly ash to be rejected for use as an admixture. Although there have beenlimited studies of ammonia emission from concrete, little is known about the quantity ofammonia emitted during mixing and curing, and the kinetics of ammonia release. Thisis manifested as widely varying opinions within the concrete and ash marketing industryregarding the maximum acceptable levels of ammonia in fly ash. Therefore, practicalguidelines for using ammoniated fly ash are needed in advance of the installation ofmany more SCR systems.
The study presented herein was designed to address the concerns associated with theuse of ammoniated fly ash in mortar and concrete. The main objectives of this studywere 1) to gain an understanding of the behavior of ammoniated fly ash in mortar andconcrete, 2) to develop practical guidelines for the use of ammoniated ash (i.e. howmuch ammonia is too much?), and 3) to transfer the results and recommendations toindustry. It is hoped that this study will result in the continued use of fly ash in the wakeof the wide-spread installation of SCR and SNCR systems.
The project was divided into three phases. The first phase focused on laboratorymortar experiments to develop fundamental data on ammonia release characteristicsand to devise appropriate ammonia measurement techniques. Larger-scale concreteexperiments were then designed to study the emission of ammonia during mixing,placement and finishing, and curing. The final phase comprised monitoring ammoniarelease from large concrete slabs and comparing the data with those from thelaboratory.
EXPERIMENTALA. Materials Sampling and TestingA.1. Fly AshSamples of fly ash were acquired from six different power plants. Three of thesesamples were collected by CAER staff, whilst the remaining three were collected byplant staff and shipped to the CAER. Approximately three 208 L (55 gal.) drums ofeach ash were obtained, and were tightly sealed and stored in an enclosed facility. Thefly ash sources were selected based on ash quality (e.g. fineness, carbon content) andammonia content. The sources and general properties of the fly ashes are provided inTable 1, ASTM C 618 required data in Table 2, and chemical composition is provided in
11
Table 3. The data indicate that seven of the fly ashes were marketable for use inconcrete as a pozzolanic admixture, whereas the “Y” ash contains an excessive amountof carbon and thus does not pass ASTM C 618 requirements (max. 6% LOI). However,the relatively high ammonia content of this ash was desirable for studying ammonia lossfrom mortar and concrete. The chemical composition of each ash is reflective of thefeed coal: power plant “R” burns primarily subbituminous coal, thus the ash contains arelatively high content of alkali and alkaline-earth elements. In contrast, the “MC” and“C” fly ashes contain comparatively large amounts of iron, indicative of a high-sulfur (i.e.pyrite) northern Appalachian feed coal that is burned at these power plants.
The ammonia content of the ammoniated fly ash samples was measured by mixing 50g of fly ash with 150 ml distilled water in a polyethylene bottle. The mixtures wereshaken periodically for approximately 24 hours, whereupon the solution was filtered. The pH of the filtrate was adjusted to greater than 11.5, and the ammonia contentmeasured using an Orion 95-12 NH3 electrode. The quantity of water soluble ammoniapresent on the ash was then calculated.
A.2. AggregatesASTM graded standard sand was utilized in the mortar experiments, and thus was notcharacterized at the CAER. In contrast, the coarse and fine aggregates that were usedin the concrete experiments were characterized in accordance with ASTM C 29, C 70,C 127, C128, C 136, C 566, and D 75. A summary of these data are presented inTable 4. Approximately 5 tons of the coarse aggregate (ASTM designation "57") and 3tons of the fine aggregate were obtained and stored in an enclosed facility.
B. Mortar Preparation and Strength TestingMortar samples were mixed in accordance with ASTM C 305, using a Hobart mixer. Two mixes were designed to represent a fairly wide range of water:cement+fly ash(W:CM) ratio. A "Low W:CM Mix" was proportioned to meet ASTM C 109 specificationsfor a standard mortar, whereas the "High W:CM Mix" comprised a similar cement + flyash:sand ratio, but a higher proportion of water (Table 5). All mortars in this study wereprepared using ordinary Portland cement (OPC), fly ash, distilled water, and ASTMstandard sand. A third mix ("UCS Mix"; Table 5) was designed and utilized for thecompressive strength testing of mortar.
Ammonia was added to mortars prepared with non-ammoniated fly ash by completelydissolving ammonium sulfate ((NH4)2SO4) in the mix water, at a specified concentration,before the water was mixed with the OPC and sand. Although it is generally believedthat ammonia is present in fly ash as NH4HSO4 (bisulfate), analysis of fly ash and deposits found on flue gas equipment (e.g. air heaters) have found ammonium sulfate,bisulfate, and sulfite (e.g. Jordan and Casper, 1995; van der Brugghen et al., 1995). No additional ammonia was added to mortars containing ammoniated fly ash.
During mixing of the mortars the space between the mixing bowl top and the mixerhead was enclosed using a flexible plastic bag that was sealed to the bowl and mixer
12
using a rubber band. This set-up was utilized to minimize ammonia loss during mixing.
After mixing, mortar samples were prepared for UCS testing by casting into cube molds(5.1 cm X 5.1 cm X 5.1 cm) in accordance with ASTM C 109. The only significantdeviation from ASTM specifications was the use of plastic molds instead of metal. Themortar cubes were cured for 24 hrs in high humidity. After this initial set, the sampleswere transferred to a humidity- and temperature-controlled curing room. UCS datawere acquired after 7 days and 28 days curing.
C. Concrete PreparationConcrete studied in this project was prepared using Quickcrete brand OPC, gradedsand, limestone aggregate, fly ash, and tap water. Slump was adjusted to 15 cm (6 in.)using a mid-range water reducer, and air was entrained by addition of an air entrainingadmixture. Concrete batch volumes of 0.02 m3 were formulated following ACI 211.1-91guidelines (ACI, 2000). Three W:CM ratio mixes were designed and prepared in trialbatches, and are presented in Table 6. Ammonia was introduced into the concrete in amanner similar to that described for the mortar testing. The components were mixedfor approximately 3 minutes in a 99 L (3.5 ft3) capacity mixer, the opening of which wascovered with a tight-fitting lid to prevent the escape of ammonia from the rotating drumduring mixing.
D. Measurement of Ammonia Loss from Mortar and ConcreteD.1. Effects of Ammonium Salt TypeThe effect of salt type on ammonia loss from mortar was evaluated using the LowW:CM ratio mortar, prepared in 2 L batches as described above. Ammonia was addedby dissolving ammonium chloride (NH4Cl), ammonium sulfate ((NH4)2SO4), orammonium bisulfate (NH4HSO4) in the mix water at a concentration of 122 mg NH3/L. Immediately after mixing, the mortar was placed into a 15.2 cm (6 in.) diameter by 30.5cm (12 in.) long plastic cylinder that contained 2.5 L of damp Ottawa sand at the base. The wet mortar was rodded 30 times, the surface smoothed with a rubber spatula, andthe cylinder sealed using a plastic "snap" lid fitted with a corked two-hole rubberstopper. At specified intervals, the ammonia concentration in the 1 L head-space wasmeasured using a Sensidyne ammonia detection tube. After each measurement, theplastic lid was removed to permit ammonia to be lost to the atmosphere. Prior to thenext reading, the plastic lid was snapped back into place and the next ammoniameasurement acquired ten minutes after the cylinder was sealed. This procedure wasrepeated over the course of approximately 20 hrs. Although the methodology did notproduce a quantitative measure of the total ammonia lost from the mortars, it didprovide a useful comparison between the different ammonium salts.
D.2. Ammonia Loss from MortarBased on ammonia measurement technique testing described above, a modifiedexperimental set-up was devised for the measurement of ammonia loss from mortar. For this procedure, two holes were pre-drilled into the sides of a cylinder, near the top
13
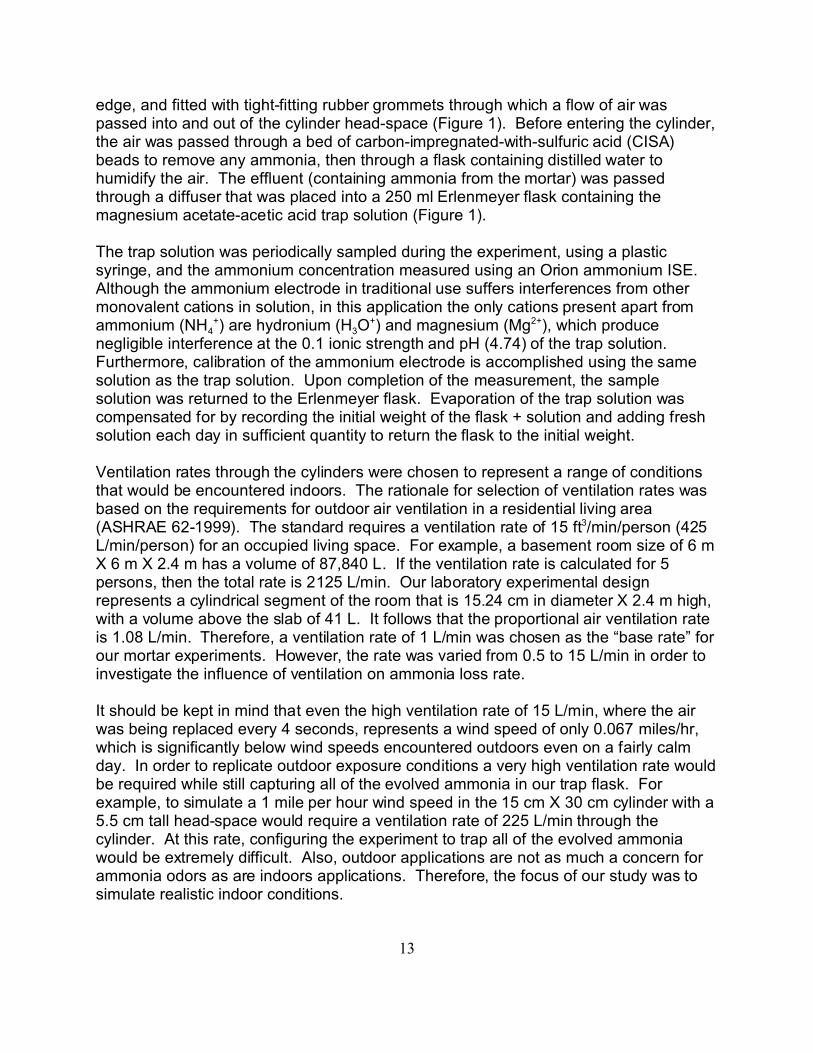
edge, and fitted with tight-fitting rubber grommets through which a flow of air waspassed into and out of the cylinder head-space (Figure 1). Before entering the cylinder,the air was passed through a bed of carbon-impregnated-with-sulfuric acid (CISA)beads to remove any ammonia, then through a flask containing distilled water tohumidify the air. The effluent (containing ammonia from the mortar) was passedthrough a diffuser that was placed into a 250 ml Erlenmeyer flask containing themagnesium acetate-acetic acid trap solution (Figure 1).
The trap solution was periodically sampled during the experiment, using a plasticsyringe, and the ammonium concentration measured using an Orion ammonium ISE. Although the ammonium electrode in traditional use suffers interferences from othermonovalent cations in solution, in this application the only cations present apart fromammonium (NH4
+) are hydronium (H3O+) and magnesium (Mg2+), which produce
negligible interference at the 0.1 ionic strength and pH (4.74) of the trap solution.Furthermore, calibration of the ammonium electrode is accomplished using the samesolution as the trap solution. Upon completion of the measurement, the samplesolution was returned to the Erlenmeyer flask. Evaporation of the trap solution wascompensated for by recording the initial weight of the flask + solution and adding freshsolution each day in sufficient quantity to return the flask to the initial weight.
Ventilation rates through the cylinders were chosen to represent a range of conditionsthat would be encountered indoors. The rationale for selection of ventilation rates wasbased on the requirements for outdoor air ventilation in a residential living area(ASHRAE 62-1999). The standard requires a ventilation rate of 15 ft3/min/person (425L/min/person) for an occupied living space. For example, a basement room size of 6 mX 6 m X 2.4 m has a volume of 87,840 L. If the ventilation rate is calculated for 5persons, then the total rate is 2125 L/min. Our laboratory experimental designrepresents a cylindrical segment of the room that is 15.24 cm in diameter X 2.4 m high,with a volume above the slab of 41 L. It follows that the proportional air ventilation rateis 1.08 L/min. Therefore, a ventilation rate of 1 L/min was chosen as the “base rate” forour mortar experiments. However, the rate was varied from 0.5 to 15 L/min in order toinvestigate the influence of ventilation on ammonia loss rate.
It should be kept in mind that even the high ventilation rate of 15 L/min, where the airwas being replaced every 4 seconds, represents a wind speed of only 0.067 miles/hr,which is significantly below wind speeds encountered outdoors even on a fairly calmday. In order to replicate outdoor exposure conditions a very high ventilation rate wouldbe required while still capturing all of the evolved ammonia in our trap flask. Forexample, to simulate a 1 mile per hour wind speed in the 15 cm X 30 cm cylinder with a5.5 cm tall head-space would require a ventilation rate of 225 L/min through thecylinder. At this rate, configuring the experiment to trap all of the evolved ammoniawould be extremely difficult. Also, outdoor applications are not as much a concern forammonia odors as are indoors applications. Therefore, the focus of our study was tosimulate realistic indoor conditions.
14
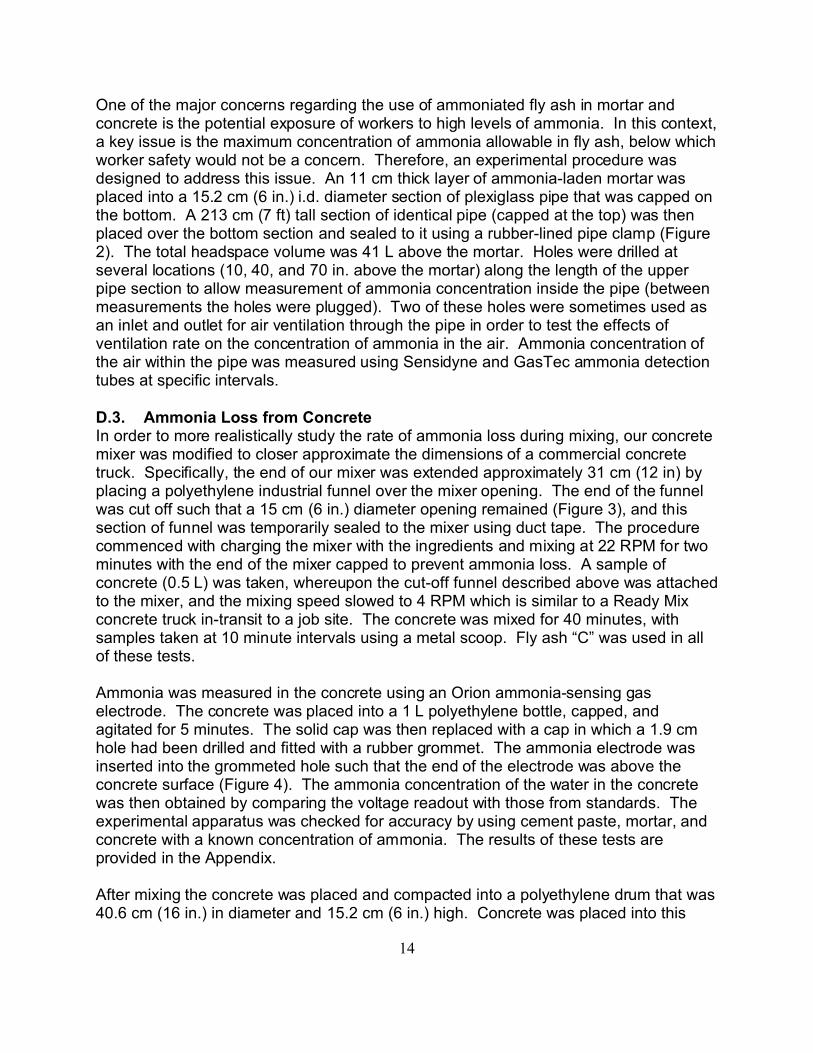
One of the major concerns regarding the use of ammoniated fly ash in mortar andconcrete is the potential exposure of workers to high levels of ammonia. In this context,a key issue is the maximum concentration of ammonia allowable in fly ash, below whichworker safety would not be a concern. Therefore, an experimental procedure wasdesigned to address this issue. An 11 cm thick layer of ammonia-laden mortar wasplaced into a 15.2 cm (6 in.) i.d. diameter section of plexiglass pipe that was capped onthe bottom. A 213 cm (7 ft) tall section of identical pipe (capped at the top) was thenplaced over the bottom section and sealed to it using a rubber-lined pipe clamp (Figure2). The total headspace volume was 41 L above the mortar. Holes were drilled atseveral locations (10, 40, and 70 in. above the mortar) along the length of the upperpipe section to allow measurement of ammonia concentration inside the pipe (betweenmeasurements the holes were plugged). Two of these holes were sometimes used asan inlet and outlet for air ventilation through the pipe in order to test the effects ofventilation rate on the concentration of ammonia in the air. Ammonia concentration ofthe air within the pipe was measured using Sensidyne and GasTec ammonia detectiontubes at specific intervals.
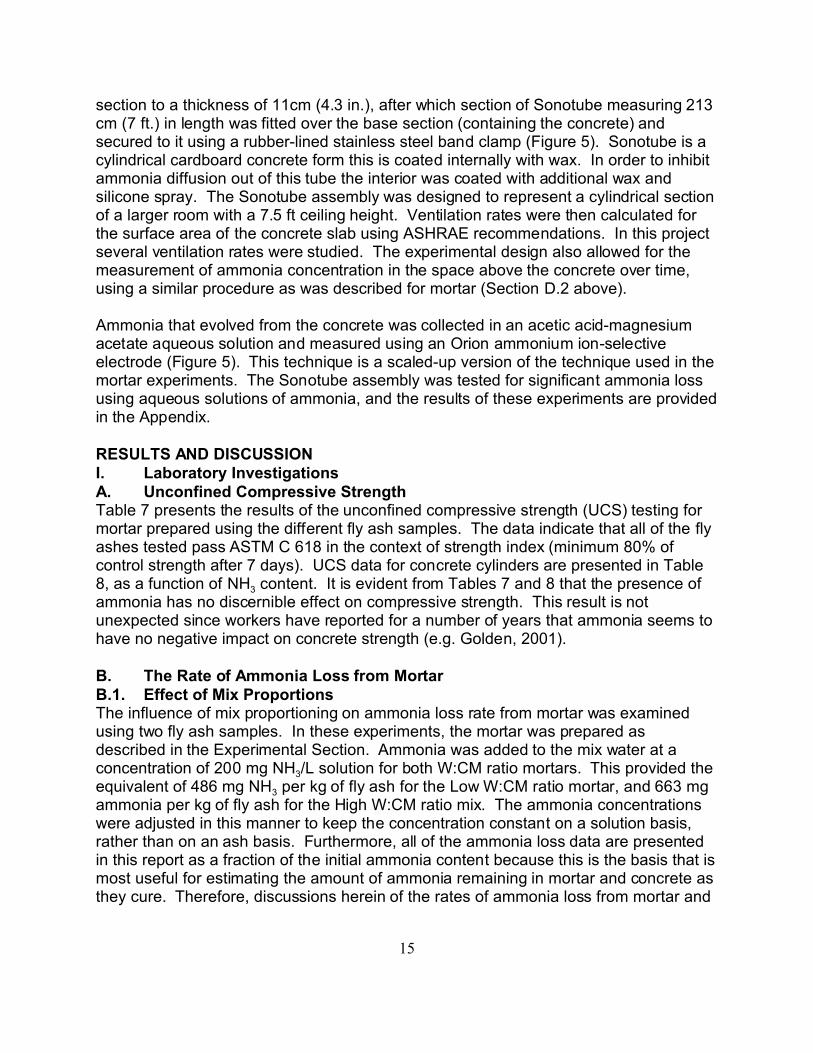
D.3. Ammonia Loss from ConcreteIn order to more realistically study the rate of ammonia loss during mixing, our concretemixer was modified to closer approximate the dimensions of a commercial concretetruck. Specifically, the end of our mixer was extended approximately 31 cm (12 in) byplacing a polyethylene industrial funnel over the mixer opening. The end of the funnelwas cut off such that a 15 cm (6 in.) diameter opening remained (Figure 3), and thissection of funnel was temporarily sealed to the mixer using duct tape. The procedurecommenced with charging the mixer with the ingredients and mixing at 22 RPM for twominutes with the end of the mixer capped to prevent ammonia loss. A sample ofconcrete (0.5 L) was taken, whereupon the cut-off funnel described above was attachedto the mixer, and the mixing speed slowed to 4 RPM which is similar to a Ready Mixconcrete truck in-transit to a job site. The concrete was mixed for 40 minutes, withsamples taken at 10 minute intervals using a metal scoop. Fly ash “C” was used in allof these tests.
Ammonia was measured in the concrete using an Orion ammonia-sensing gaselectrode. The concrete was placed into a 1 L polyethylene bottle, capped, andagitated for 5 minutes. The solid cap was then replaced with a cap in which a 1.9 cmhole had been drilled and fitted with a rubber grommet. The ammonia electrode wasinserted into the grommeted hole such that the end of the electrode was above theconcrete surface (Figure 4). The ammonia concentration of the water in the concretewas then obtained by comparing the voltage readout with those from standards. Theexperimental apparatus was checked for accuracy by using cement paste, mortar, andconcrete with a known concentration of ammonia. The results of these tests areprovided in the Appendix.
After mixing the concrete was placed and compacted into a polyethylene drum that was40.6 cm (16 in.) in diameter and 15.2 cm (6 in.) high. Concrete was placed into this
15
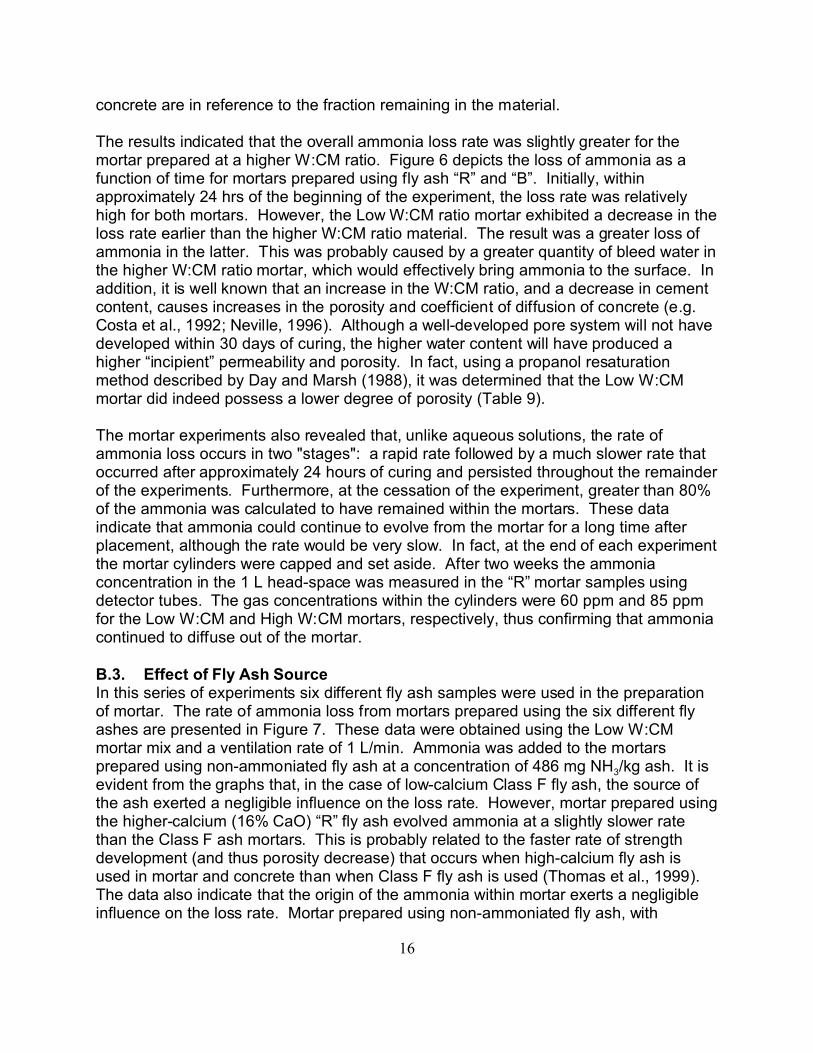
section to a thickness of 11cm (4.3 in.), after which section of Sonotube measuring 213cm (7 ft.) in length was fitted over the base section (containing the concrete) andsecured to it using a rubber-lined stainless steel band clamp (Figure 5). Sonotube is acylindrical cardboard concrete form this is coated internally with wax. In order to inhibitammonia diffusion out of this tube the interior was coated with additional wax andsilicone spray. The Sonotube assembly was designed to represent a cylindrical sectionof a larger room with a 7.5 ft ceiling height. Ventilation rates were then calculated forthe surface area of the concrete slab using ASHRAE recommendations. In this projectseveral ventilation rates were studied. The experimental design also allowed for themeasurement of ammonia concentration in the space above the concrete over time,using a similar procedure as was described for mortar (Section D.2 above).
Ammonia that evolved from the concrete was collected in an acetic acid-magnesiumacetate aqueous solution and measured using an Orion ammonium ion-selectiveelectrode (Figure 5). This technique is a scaled-up version of the technique used in themortar experiments. The Sonotube assembly was tested for significant ammonia lossusing aqueous solutions of ammonia, and the results of these experiments are providedin the Appendix.
RESULTS AND DISCUSSIONI. Laboratory InvestigationsA. Unconfined Compressive StrengthTable 7 presents the results of the unconfined compressive strength (UCS) testing formortar prepared using the different fly ash samples. The data indicate that all of the flyashes tested pass ASTM C 618 in the context of strength index (minimum 80% ofcontrol strength after 7 days). UCS data for concrete cylinders are presented in Table8, as a function of NH3 content. It is evident from Tables 7 and 8 that the presence ofammonia has no discernible effect on compressive strength. This result is notunexpected since workers have reported for a number of years that ammonia seems tohave no negative impact on concrete strength (e.g. Golden, 2001).
B. The Rate of Ammonia Loss from MortarB.1. Effect of Mix ProportionsThe influence of mix proportioning on ammonia loss rate from mortar was examinedusing two fly ash samples. In these experiments, the mortar was prepared asdescribed in the Experimental Section. Ammonia was added to the mix water at aconcentration of 200 mg NH3/L solution for both W:CM ratio mortars. This provided theequivalent of 486 mg NH3 per kg of fly ash for the Low W:CM ratio mortar, and 663 mgammonia per kg of fly ash for the High W:CM ratio mix. The ammonia concentrationswere adjusted in this manner to keep the concentration constant on a solution basis,rather than on an ash basis. Furthermore, all of the ammonia loss data are presentedin this report as a fraction of the initial ammonia content because this is the basis that ismost useful for estimating the amount of ammonia remaining in mortar and concrete asthey cure. Therefore, discussions herein of the rates of ammonia loss from mortar and
16
concrete are in reference to the fraction remaining in the material.
The results indicated that the overall ammonia loss rate was slightly greater for themortar prepared at a higher W:CM ratio. Figure 6 depicts the loss of ammonia as afunction of time for mortars prepared using fly ash “R” and “B”. Initially, withinapproximately 24 hrs of the beginning of the experiment, the loss rate was relativelyhigh for both mortars. However, the Low W:CM ratio mortar exhibited a decrease in theloss rate earlier than the higher W:CM ratio material. The result was a greater loss ofammonia in the latter. This was probably caused by a greater quantity of bleed water inthe higher W:CM ratio mortar, which would effectively bring ammonia to the surface. Inaddition, it is well known that an increase in the W:CM ratio, and a decrease in cementcontent, causes increases in the porosity and coefficient of diffusion of concrete (e.g.Costa et al., 1992; Neville, 1996). Although a well-developed pore system will not havedeveloped within 30 days of curing, the higher water content will have produced ahigher “incipient” permeability and porosity. In fact, using a propanol resaturationmethod described by Day and Marsh (1988), it was determined that the Low W:CMmortar did indeed possess a lower degree of porosity (Table 9).
The mortar experiments also revealed that, unlike aqueous solutions, the rate ofammonia loss occurs in two "stages": a rapid rate followed by a much slower rate thatoccurred after approximately 24 hours of curing and persisted throughout the remainderof the experiments. Furthermore, at the cessation of the experiment, greater than 80%of the ammonia was calculated to have remained within the mortars. These dataindicate that ammonia could continue to evolve from the mortar for a long time afterplacement, although the rate would be very slow. In fact, at the end of each experimentthe mortar cylinders were capped and set aside. After two weeks the ammoniaconcentration in the 1 L head-space was measured in the “R” mortar samples usingdetector tubes. The gas concentrations within the cylinders were 60 ppm and 85 ppmfor the Low W:CM and High W:CM mortars, respectively, thus confirming that ammoniacontinued to diffuse out of the mortar.
B.3. Effect of Fly Ash SourceIn this series of experiments six different fly ash samples were used in the preparationof mortar. The rate of ammonia loss from mortars prepared using the six different flyashes are presented in Figure 7. These data were obtained using the Low W:CMmortar mix and a ventilation rate of 1 L/min. Ammonia was added to the mortarsprepared using non-ammoniated fly ash at a concentration of 486 mg NH3/kg ash. It isevident from the graphs that, in the case of low-calcium Class F fly ash, the source ofthe ash exerted a negligible influence on the loss rate. However, mortar prepared usingthe higher-calcium (16% CaO) “R” fly ash evolved ammonia at a slightly slower ratethan the Class F ash mortars. This is probably related to the faster rate of strengthdevelopment (and thus porosity decrease) that occurs when high-calcium fly ash isused in mortar and concrete than when Class F fly ash is used (Thomas et al., 1999).The data also indicate that the origin of the ammonia within mortar exerts a negligibleinfluence on the loss rate. Mortar prepared using non-ammoniated fly ash, with
17
ammonia added to the water as (NH4)2SO4, behaves similarly to mortar prepared usingammoniated fly ash (Figure 7).
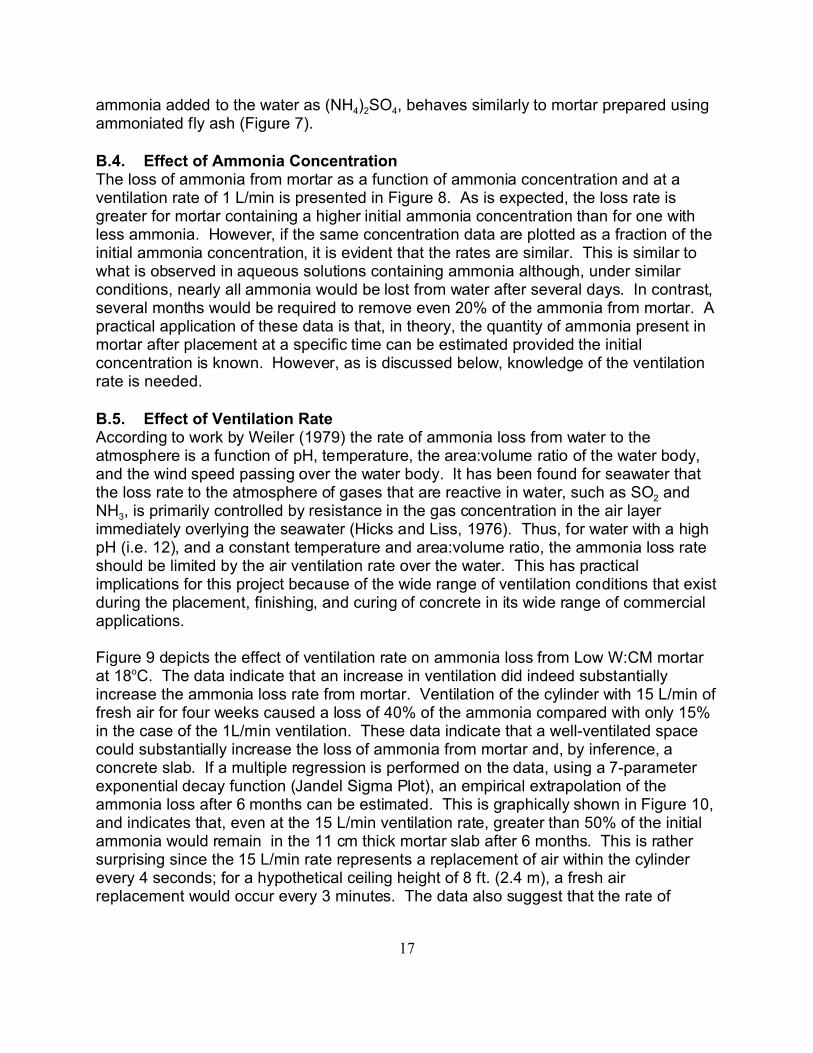
B.4. Effect of Ammonia ConcentrationThe loss of ammonia from mortar as a function of ammonia concentration and at aventilation rate of 1 L/min is presented in Figure 8. As is expected, the loss rate isgreater for mortar containing a higher initial ammonia concentration than for one withless ammonia. However, if the same concentration data are plotted as a fraction of theinitial ammonia concentration, it is evident that the rates are similar. This is similar towhat is observed in aqueous solutions containing ammonia although, under similarconditions, nearly all ammonia would be lost from water after several days. In contrast,several months would be required to remove even 20% of the ammonia from mortar. Apractical application of these data is that, in theory, the quantity of ammonia present inmortar after placement at a specific time can be estimated provided the initialconcentration is known. However, as is discussed below, knowledge of the ventilationrate is needed.
B.5. Effect of Ventilation RateAccording to work by Weiler (1979) the rate of ammonia loss from water to theatmosphere is a function of pH, temperature, the area:volume ratio of the water body,and the wind speed passing over the water body. It has been found for seawater thatthe loss rate to the atmosphere of gases that are reactive in water, such as SO2 andNH3, is primarily controlled by resistance in the gas concentration in the air layerimmediately overlying the seawater (Hicks and Liss, 1976). Thus, for water with a highpH (i.e. 12), and a constant temperature and area:volume ratio, the ammonia loss rateshould be limited by the air ventilation rate over the water. This has practicalimplications for this project because of the wide range of ventilation conditions that existduring the placement, finishing, and curing of concrete in its wide range of commercialapplications.
Figure 9 depicts the effect of ventilation rate on ammonia loss from Low W:CM mortarat 18oC. The data indicate that an increase in ventilation did indeed substantiallyincrease the ammonia loss rate from mortar. Ventilation of the cylinder with 15 L/min offresh air for four weeks caused a loss of 40% of the ammonia compared with only 15%in the case of the 1L/min ventilation. These data indicate that a well-ventilated spacecould substantially increase the loss of ammonia from mortar and, by inference, aconcrete slab. If a multiple regression is performed on the data, using a 7-parameterexponential decay function (Jandel Sigma Plot), an empirical extrapolation of theammonia loss after 6 months can be estimated. This is graphically shown in Figure 10,and indicates that, even at the 15 L/min ventilation rate, greater than 50% of the initialammonia would remain in the 11 cm thick mortar slab after 6 months. This is rathersurprising since the 15 L/min rate represents a replacement of air within the cylinderevery 4 seconds; for a hypothetical ceiling height of 8 ft. (2.4 m), a fresh airreplacement would occur every 3 minutes. The data also suggest that the rate of
18
ammonia diffusion from mortar is limited by the gas phase ammonia concentrationimmediately above the mortar surface and not by diffusion through the mortar.
All of the data and interpretations provided thus far are for 11 cm (4.33 in) thick mortarslabs. It is logical to assume that a thicker slab will retain a greater proportion ofammonia than a thinner slab, due to diffusional limitations through the slab. Therefore,an experiment was conducted to test the effect of mortar thickness on the ammonialoss rate. In this experiment, the loss of ammonia from a 3.5 cm thick mortar slab wascompared with that from the “standard” 11 cm thick slab containing the same amount ofNH3 added per kg of fly ash. It was found that, on a fractional basis, the thinner slablost a significantly higher proportion of ammonia than the thicker (11 cm) mortar slab. However, the total amount of ammonia that diffused from the thicker slab was greaterthan the thinner slab. This suggests that, although most ammonia is lost from theupper portions of a slab, ammonia from deeper areas also was able to leave the mortarbut with greater diffusional limitations. Another interesting aspect of the data is that theammonia loss from the 3.5 cm mortar slab nearly ceased within 2 months, althoughthere remained greater than 60% of the initial ammonia concentration within the mortar. One explanation for this is that a large quantity of ammonia escaped the mortar duringpreparation or placement, which is unlikely since the method was tested early in theproject (see Appendix). Another is that a large amount of ammonia diffused into theunderlying damp sand. Indeed, an ammonia odor was detected in the sand at thecessation of the experiments after the mortar slab was removed from the cylinder. It ismore likely that nearly 60% of the initial ammonia remained trapped within the mortar,and would diffuse from the material at a very slow rate over many months.
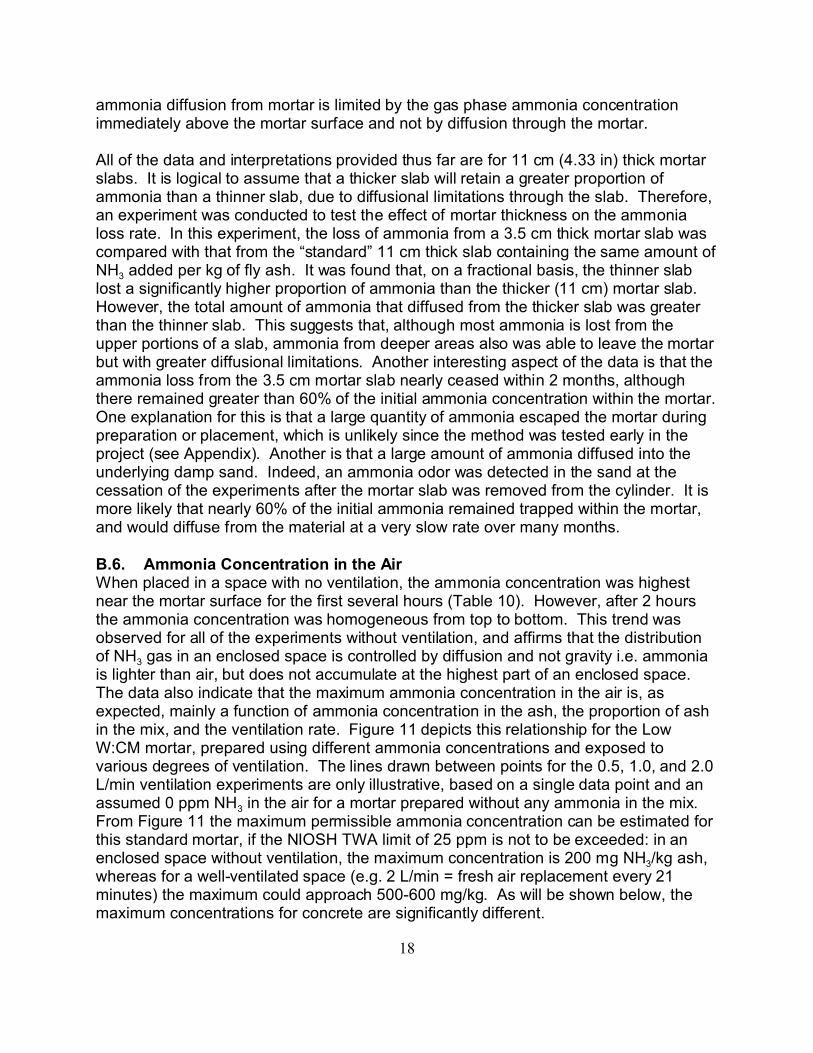
B.6. Ammonia Concentration in the AirWhen placed in a space with no ventilation, the ammonia concentration was highestnear the mortar surface for the first several hours (Table 10). However, after 2 hoursthe ammonia concentration was homogeneous from top to bottom. This trend wasobserved for all of the experiments without ventilation, and affirms that the distributionof NH3 gas in an enclosed space is controlled by diffusion and not gravity i.e. ammoniais lighter than air, but does not accumulate at the highest part of an enclosed space. The data also indicate that the maximum ammonia concentration in the air is, asexpected, mainly a function of ammonia concentration in the ash, the proportion of ashin the mix, and the ventilation rate. Figure 11 depicts this relationship for the LowW:CM mortar, prepared using different ammonia concentrations and exposed tovarious degrees of ventilation. The lines drawn between points for the 0.5, 1.0, and 2.0L/min ventilation experiments are only illustrative, based on a single data point and anassumed 0 ppm NH3 in the air for a mortar prepared without any ammonia in the mix. From Figure 11 the maximum permissible ammonia concentration can be estimated forthis standard mortar, if the NIOSH TWA limit of 25 ppm is not to be exceeded: in anenclosed space without ventilation, the maximum concentration is 200 mg NH3/kg ash,whereas for a well-ventilated space (e.g. 2 L/min = fresh air replacement every 21minutes) the maximum could approach 500-600 mg/kg. As will be shown below, themaximum concentrations for concrete are significantly different.
19
The effect of mix proportioning on ammonia-in-air concentration is shown in Table 11. For the first mortar, prepared using fly ash “B” and ammonia added at a concentrationof 122 mg/kg ash, the W:CM ratio was increased to 0.66 (the water content wasincreased as well). In the second test, ammoniated fly ash “Y” (298 mg NH3/kg) wasused in the preparation of the mortars, and one of the mixes contained a mid-rangewater reducer at a rate of 667 ml per 100 kg of cement + fly ash (10 oz/100 lbs cwt). From the data in Table 11 it is evident that increasing the slump of the mortar mix canincrease ammonia evolution from the fresh mortar into the air, even though the HighW:CM mortars contained a lower ammonia concentration in the water than the LowW:CM counterparts (from dilution). This effect seemed to be associated with anincrease in the quantity of bleed water that occurred at the surface of the mortars,which carried ammonia with it. Furthermore, excessive bleed can introduce channels inthe mortar which would provide a conduit for ammonia release. Thus, preparation of amortar with a high W:CM ratio and water content could actually result in a higherammonia concentration in the air. This is in contrast to what was found for concrete,which is discussed in the following sections.
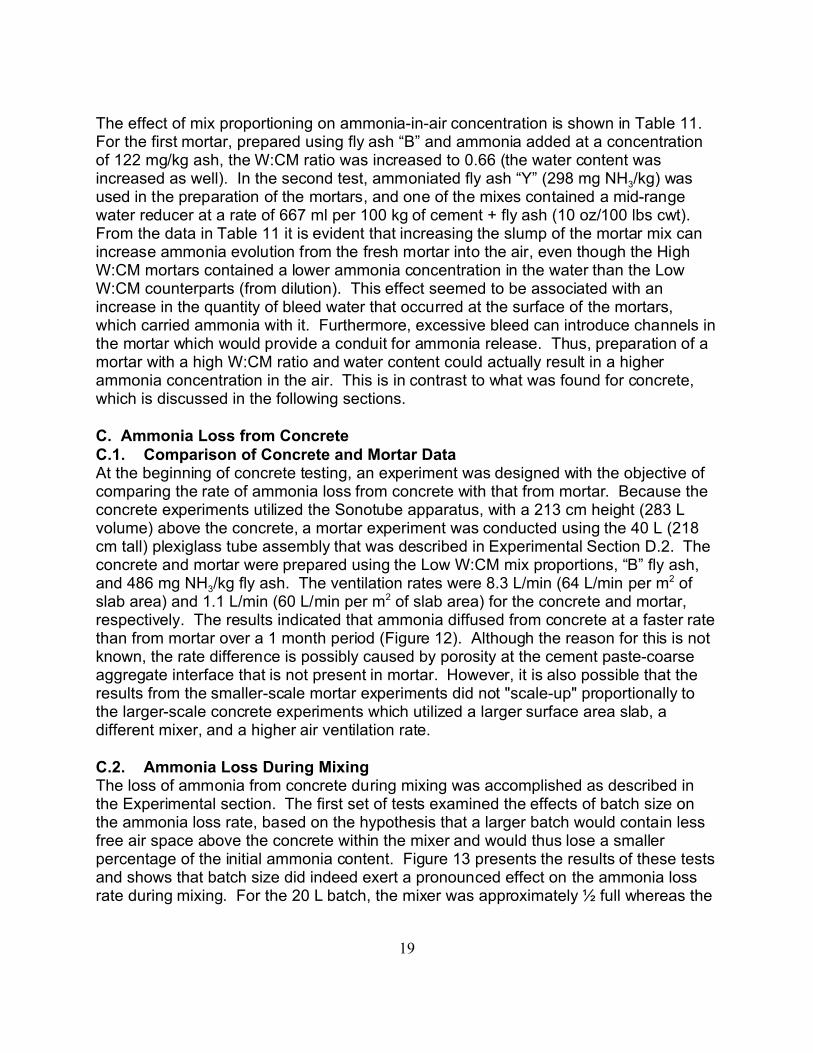
C. Ammonia Loss from ConcreteC.1. Comparison of Concrete and Mortar DataAt the beginning of concrete testing, an experiment was designed with the objective ofcomparing the rate of ammonia loss from concrete with that from mortar. Because theconcrete experiments utilized the Sonotube apparatus, with a 213 cm height (283 Lvolume) above the concrete, a mortar experiment was conducted using the 40 L (218cm tall) plexiglass tube assembly that was described in Experimental Section D.2. Theconcrete and mortar were prepared using the Low W:CM mix proportions, “B” fly ash,and 486 mg NH3/kg fly ash. The ventilation rates were 8.3 L/min (64 L/min per m2 ofslab area) and 1.1 L/min (60 L/min per m2 of slab area) for the concrete and mortar,respectively. The results indicated that ammonia diffused from concrete at a faster ratethan from mortar over a 1 month period (Figure 12). Although the reason for this is notknown, the rate difference is possibly caused by porosity at the cement paste-coarseaggregate interface that is not present in mortar. However, it is also possible that theresults from the smaller-scale mortar experiments did not "scale-up" proportionally tothe larger-scale concrete experiments which utilized a larger surface area slab, adifferent mixer, and a higher air ventilation rate.
C.2. Ammonia Loss During MixingThe loss of ammonia from concrete during mixing was accomplished as described inthe Experimental section. The first set of tests examined the effects of batch size onthe ammonia loss rate, based on the hypothesis that a larger batch would contain lessfree air space above the concrete within the mixer and would thus lose a smallerpercentage of the initial ammonia content. Figure 13 presents the results of these testsand shows that batch size did indeed exert a pronounced effect on the ammonia lossrate during mixing. For the 20 L batch, the mixer was approximately ½ full whereas the
20
40 L batch was near the mixer capacity. As is seen in Figure 13, after 40 minutes ofmixing the 20 L batch contained about 65% of the initial NH3 content, whereas the 40 Lbatch retained almost 90% of the initial amount. The implication of these data is that afull Ready Mix concrete truck will retain a larger proportion of ammonia than if the truckis not filled to capacity.
Figure 14 presents the results of tests designed to investigate the effects of mixproportioning. For our three concrete mix designs, the Low W:CM concrete lostproportionately less ammonia during mixing than the High W:CM concrete, with theMedium W:CM mix intermediate between the other two. Because the total cementitiouscontent (CF), and thus fly ash content, decreased with an increase in the W:CM ratio, aseparate experiment was performed using the Low W:CM mix. For this test a concretemix was designed with a W:CM = 0.44, but with a lower cementitious content (Table 12)and similar slump. It was found that the lower CF mix lost ammonia at a higher rateduring mixing than the higher CF mix, suggesting that the loss rate is dependent on thecementitious content and not only the W:CM ratio (Table 12).
It was observed during the mixing tests that the mixing temperature seemed to have aneffect on the results. Specifically, the ammonia loss rate apparently increased with anincrease in temperature, particularly after 20-30 minutes mixing. Consequently, datacollected at 22oC was compared with those collected at 28oC (Figure 15), which showedthat the percentage of ammonia remaining in the concrete at the higher temperaturewas less than at the lower temperature. However, during the first 20 minutes the datawere essentially the same at the two temperatures and did not diverge until the 30 and40 minute readings. We believe that the observed difference at the two temperatureswas largely caused by limitations of the experimental method. Over the course of theexperiments it was observed that the data became more inconsistent as the concreteslump decreased, the degree of which is more pronounced at higher temperatures(Klieger, 1958). The stiffer material (i.e. < 3 in. slump) was not as amenable to mixingwithin the polyethylene bottle and thus we felt that an equilibrium concentration ofammonia in the bottle head space was ever achieved during the analysis. Based onthese and other experiments it was concluded that temperature did not exert asignificant influence on the rate of ammonia loss from concrete during mixing, but dideffect the experimental methodology.
During mixing of concrete that contained ammonia, several interesting observationswere made. One unexpected observation was that it was often difficult to smellammonia coming from the concrete even when standing near the mixer. Typically, onewould need to be at the mixer opening in order to detect even a slight ammonia odor. However, the odors inside the drum were often very strong. In two experiments theconcentration of ammonia within the mixing drum was measured for concretecontaining 50 and 73 mg NH3 per liter of mix water. In these tests, the ammoniaconcentration within the drum reached 22 ppm and 35 ppm, respectively for the twomixes, within 5 minutes of the start of mixing. As will be discussed in Section C.5below, this is substantially less than the concentration measured in the air during and
21
immediately after placement of the concrete. Similar observations were also recordedduring the field tests.
C.3. Effect of Mix Proportions on the Long-Term Loss RateFour separate concrete mixes were prepared to test the effects of mix proportioning onthe rate of ammonia loss during 1 month curing. In addition to the three mixes listed inTable 6, an additional mix was prepared. It is common for water to be added to ReadyMix concrete when it arrives on a job site, in order to increase the slump and make theconcrete easier to work, although the strength and durability are lowered. Therefore,the additional mix was prepared by adding AEA, no mid-range water reducer, andenough water to the Low W:CM mix to achieve a W:CM = 0.50. The slump of this mixwas approximately 203 mm (8 in). Figure 16 shows the ammonia loss rate from thefour different concrete mixes, expressed as a fraction of the initial NH3 concentration inthe concrete. The data indicate that the different mix proportions had no significanteffect on the fraction of NH3 remaining in the concrete after 1 month, which wasapproximately 65-70% of the initial amount. These data are inconsistent with themortar data which indicated that the High W:CM ratio mortar lost ammonia at a greaterrate than the Low W:CM mortar. However, as was discussed above the difference wasprobably related to the greater quantity of bleed water that was observed for the HighW:CM mortar. In comparison, even the High W:CM (0.68) concrete mix did not exhibitnearly the degree of bleed observed for the High W:CM mortar.
The data presented in Figure 16 were calculated based on the initial ammonia presentin the concrete at the onset of mixing. It was shown in Section C.2 that the loss ofammonia during mixing depends on the mix proportions, with the High W:CM mix losinga greater fraction of ammonia than the Low W:CM mix. The data in Figure 16 do notaccount for the difference in ammonia concentration in the concrete, after mixing for 2minutes, at the start of the month-long experiments. Therefore, the data were“corrected” to account for the mixing losses, and the new ammonia loss curvespresented in Figure 17. It is evident that, although the 0.68 and 0.55 W:CM concretelost ammonia at a higher rate than the 0.50 and 0.44 W:CM mixes, the differences areslight.
Using a technique similar to the mortar data, the ammonia loss rate data for concretewas extrapolated to four months time (Figure 18). These calculated data suggest thatafter approximately 2 months the loss rate had slowed dramatically, whereupon greaterthan 60% of the initial ammonia remained in the concrete. Accounting for losses duringmixing and some escaped ammonia from the apparatus, as a general rule, greater than50% of the initial ammonia is expected to remain in a 4 - 5 inch thick indoor concreteslab after several months of curing. After that, the remaining ammonia will probablytake many months to diffuse from the concrete slab. For thicker slabs, a higherpercentage of the ammonia will likely remain.
C.4. Effect of Ventilation Rate on the Long-Term Loss RateIn a separate set of experiments, another departure from the mortar data was
22
observed: ventilation rate apparently exerts a negligible influence on long-termammonia loss rate from concrete. Two experiments were conducted using the MediumW:CM mix prepared using fly ash “C”, with ventilation rates of 8.3 L/min and 15.2 L/minthrough the Sonotube apparatus. As can be seen in Figure 19 these ventilation ratesproduced similar ammonia loss rates over the course of 1 month. It should be notedthat ventilation rates of 8.3 and 15.2 L/min represent an exchange of the air within theSonotube every 33 and 19 minutes, respectively. It appears that, under theseventilation conditions, the diffusion of ammonia from concrete is limited by the rate ofmass transfer through the concrete and not by dissipation of the gas phase ammoniaabove the concrete, as is the case for water. Therefore, according to our data theplacement of concrete outdoors, with a high degree of ventilation, prior to enclosurewithin a structure would not necessarily result in an increased loss of the ammoniawithin the concrete compared with a slab placed indoors with a lower degree ofventilation.
C.5. Ammonia Concentration in the AirThe concentration of ammonia in the air above fresh concrete was first measured forthe conservative case of no ventilation through the Sonotube apparatus. It wasobserved in each of these experiments that after placing the concrete, the ammonia inthe air increased steadily to a maximum concentration within 2-3 hours, followed by agradual decrease (Figure 20). Although there was no ventilation within the Sonotube,and thus the ammonia should not have decreased, it was not completely air-tight. Thus, some ammonia was able to slowly escape during the experiment (this was notdeemed to be a problem for the long-term experiments because air was being pulledthrough the Sonotube and therefore should keep any significant amount of ammoniafrom leaking out of the apparatus). In the experiments where Sonotubes were ventedwith 8.3 and 15.2 L/min fresh air, a significantly different profile was observed forammonia buildup in the air. In these cases, the ammonia concentration in the airincreased rapidly to its maximum within approximately 0.5 hrs, whereupon it decreasedrapidly (Figure 21). The increased fresh air ventilation not only lowered the ammoniaconcentration in the air (described below) but also shortened the time required for theammonia to be evenly distributed in the headspace.
The experiments described above were conducted using the three different W:CM ratioconcrete mixes, using both ammoniated and non-ammoniated fly ash, and with differentammonia concentrations. In addition, several experiments were conducted usingammoniated fly ash at a cement replacement of 30% instead of 20%. This had theeffect of increasing the NH3 concentration in a different manner than adding moreammonia to the water or decreasing the W:CM ratio. The maximum ammoniaconcentration in the air was then recorded for each experiment (generally after 3 hrs forthe non-ventilated experiments, and 0.5 hours for the ventilated ones) and comparedwith the ammonia concentration of the fly ash (Figure 22) (for non-ammoniated flyashes, where ammonia was added to the water, the concentration is also expressed onan ash basis). The graph in Figure 22 reveals an obvious relationship between the
23
ammonia concentration in the fly ash and the maximum concentration of ammonia inthe air. There is, however, a significant degree of scatter in the data, particularly at highammonia concentrations. Furthermore, there is very little difference between theventilated and non-ventilated experiments. Although a part of the scatter can beattributed to experimental error, some of it is caused by reporting the ammoniaconcentrations on an ash basis. This occurs because expressing the ammoniaconcentrations in this way does not account for the different water contents, W:CMratio, and fly ash replacement rates that will change the quantity and concentration ofammonia in a concrete mix.
It is more relevant to express the ammonia concentration on a water basis, that is, inmg NH3/L mix water because it is the ammonia concentration in the water that controlsthe equilibrium concentration in the air. Plotting the data in this manner (Figure 23)provides a clearer relationship between the variables. Also, the ventilated conditions produce a clearer lower maximum ammonia concentration in the air than thenon-ventilated conditions. Interestingly, increasing the ventilation rate to 15.2 L/min(equivalent to a fresh air replacement every 19 minutes) had only a small effect on themaximum ammonia concentration in the air (Figure 23).
An important aspect of the data in Figure 23 is that they provide the information neededto estimate the concentration of ammonia in fly ash that should not be exceeded inorder to minimize worker complaints when placing and finishing concrete. The dataindicate that for concrete placed in areas with negligible air ventilation the ammoniaconcentration in the concrete should not exceed 110 mg/L if the recommendedexposure limit TWA of 25 ppm is not to be exceeded. However, in the majority ofapplications there will be some ventilation present. In these cases, the level ofammonia in the concrete should be less than about 170 mg NH3/L. The maximumpermissible concentration of ammonia in the fly ash will therefore depend on theconcrete mix proportions. The pertinent equation is then:
Where NH3water is in mg/L, NH3ash is in mg/kg, FA = unit fly ash content, and WF = unitwater content.
As an example of the use of this equation, the maximum concentration of ammonia infly ash is calculated here for a “typical” concrete with 326 kg/m3 (550 lb/yd3) ofcementitious material, a water:cementitious (W:CM) ratio of 0.50, and a 20% fly ashreplacement rate. It follows that for this mix, the ammonia concentration in the ashshould not exceed 275 mg NH3/kg for the relatively rare applications where concrete isplaced in a space with negligible ventilation, and 425 mg/kg for the more common casewith some degree of ventilation. Obviously, the recommended maximum ammonia inthe fly ash would decrease if a greater proportion of fly ash and/or a lower W:CM ratiois used.

24
Although a TWA of 25 ppm NH3 in the air is considered safe, it would nonethelessproduce a very strong, objectionable odor. Thus, in practice, a lower ammonia-in-airconcentration is likely to be followed in order to minimize worker complaints. Assuminga more comfortable threshold of 10 ppm ammonia in the air, the maximumconcentration in the concrete water would be approximately 50 and 75 mg NH3/L fornon-ventilated and ventilated conditions, respectively. Using the example and equationabove, the maximum ammonia concentration in the fly ash would then need to be 125and 188 mg NH3/kg ash for the two ventilation conditions. Results of samplecalculations for our Low and High W:CM concrete mixes, with a 20% replacement of flyash for cement, are presented in Table 13.
C.6. Comparison with Previous DataUntil this project, probably the most thorough studies had been completed in Europe byKoch and Prenzel (1989) and van der Brugghen et al. (1995). The focus of both ofthese studies was on the concentration of ammonia in the air during and soon after theplacement and finishing of concrete screed and mortar. Comparison of the data fromthese studies is somewhat problematic for several reasons. The authors studiedmaterials prepared without coarse aggregates (or at least with smaller top size than inour study), although neither study provides information on the aggregate properties. Inour study, differences were observed in the ammonia release characteristics fromconcrete versus mortar. In addition, no information was provided in the Europeanstudies on ventilation conditions or the dimensions of the rooms in which the screedsand mortars were placed.
Koch and Prenzel studied concrete screed prepared using both non-ammoniated andammoniated fly ash. When using ammoniated fly ash and ash that was “spiked” withammonium bisulfate, the concentration of ammonia in the rooms remained below 7mg/m3 and odors were barely noticeable, even when the ammonia concentration was314 mg/kg of fly ash. Furthermore, there was no clear relationship between ammoniaconcentration in the concrete screed and that in the air. However, when ammoniumchloride was added to the mix water, the ammonia concentration in the air exceeded 95mg/m3 in the case where the ammonia concentration in the screed was the equivalentof 300 mg NH3/kg of fly ash. The reason for this discrepancy is not known. These dataare in contrast to our results (Figure 24) where there was a consistent positiverelationship between ammonia concentration in the concrete and that in the air.
The van der Brugghen et al. (vdB) study examined ammonia in the air during mixingand placement of concrete mortar as well as the emission of ammonia during themanufacture of synthetic aggregate. In the case of concrete mortars, vdB studiedammonia accumulation in a room open to natural ventilation and two rooms that wereclosed. When placing concrete mortar (with an ammonia content in the ash of 300mg/kg) in the open room, the odor of ammonia was only noticed near the floor and wasgenerally between 5 to 10 mg/m3. When placing the concrete mortar in the closedrooms there was a positive relationship between ammonia concentration in the concreteand that in the air, similar to our results (Figure 24). However, when compared directly,
25
our results indicated a lower maximum concentration of ammonia in the air for anequivalent concentration of ammonia in the concrete. The differences could be causedby differences in the composition of the concretes (i.e. top size of the aggregates,aggregate proportions) and/or by the ammonia measurement techniques. The vdBstudy used a spectrometer to measure ammonia in the air, whereas we used anelectrochemical ammonia monitor (that gave erroneously high results) and GasTecammonia sensing tubes, which were more accurate. Furthermore, van der Brugghen etal. reported concentrations at times as mg/m3 and other times as ppm; these are notequivalent units. Despite some of the differences, a key similarity between the vdBstudy and our study is that the ammonia concentration in the air decreased to belowolfactory detection within 1-2 days, making the potential for long term odors unlikely. Inaddition, both studies observed that the highest ammonia-in-air concentrationsoccurred within the concrete and mortar mixers.
C.7 Controlled Low-Strength Material (CLSM)CLSM is a self-compacting cementitious material used primarily as a backfill, whichtypically has a compressive strength of less than 300 PSI (ACI, 2000). A keycomponent of CLSM is fly ash, which is often utilized in proportions exceeding 178kg/m3 (300 lb/yd3). In fact, some CLSM proportioning specifies only fly ash and water. It is the high proportion of fly ash in this material that causes concern regarding theutilization of ammoniated fly ash. Although the vast majority of CLSM applications areoutdoors, there are instances where the material could be used in a more enclosedspace. Furthermore, during the operation of backfilling a trench there might beoccasions where workers need to be in the trench for a brief time, for example if aproblem occurs during the backfilling. For this reason several experiments wereconducted using CLSM, wherein the concentration of ammonia in the air above thematerial was monitored immediately after placement. The mix proportions were takenfrom Mix 8 in Crouch et al. (2001), and comprised 36 kg/m3 cement, 220 kg/m3 fly ash,1506 kg/m3 sand, and 297 kg/m3 water.
As a “worst case scenario”, one experiment was conducted within the Sonotube withoutany ventilation, using fly ash “B” and an equivalent of 122 mg NH3 per kg of fly ashadded as ammonium sulfate. This produced a concentration in the mix water of 90 mgNH3/L. Within several hours of the beginning of the test, the ammonia concentrationwithin the Sonotube reached 35 ppm. Compared with the results using concrete(Figure 23), the ammonia concentration in the air above the CLSM was considerablyhigher at an equivalent ammonia concentration in the mix water. This is similar to whatwas observed with mortar, and is probably caused by the large quantity of water thatbled to the surface of the CLSM. The bleed water effectively transferred a largequantity of ammonia to the surface, which resulted in less diffusional resistance thanoccurred within concrete. Thus, the combination of a large proportion of fly ash in themix and a large quantity of bleed water indicated that, in an enclosed space, it isdesirable to have less ammonia in the fly ash for CLSM than would be acceptable whenthe fly ash is used in concrete. However, in several experiments where the top of theSonotube was removed, in order to simulate an open trench backfill, the ammonia
26
concentration in the air never exceeded 5 ppm within the Sonotube even when fly ash“C” (280 mg/kg) was used. Therefore it was concluded that for the majority of CLSMapplications the presence of reasonable concentrations of ammonia in the fly ash (suchas were recommended for concrete) should not present undue safety concerns,although there likely will be noticeable ammonia odors at the job site.
II. Large-Scale (Field) InvestigationsA. Equipment and MaterialsThe concrete used in the field testing was purchased from a local Ready Mix concreteplant. Four batches of concrete were obtained and their proportions are provided inTable 14. An AEA and mid-range water reducing admixture were used. In addition, aset retarder was added because of the high ambient temperatures experienced duringconcrete placement. Concrete for Pours #1 and #2 contained fly ash supplied by theReady Mix plant, and ammonia was added as ammonium sulfate to the mix water. Concrete used in Pours #3 and #4 contained “C” and “BC” fly ash, respectively, both ofwhich were added to the truck mixing drum prior to charging the other materials.
The concrete truck used was purchased by the CAER and had an 6.5 m3 (8.5 yd3)capacity (Figure 25). The first batch of concrete (Pour #1) was obtained with thepurpose of “conditioning” the mixing drum (after years of being unused) and practicingour ammonia measurement techniques with large quantities of concrete. This batchwas placed as a 10 cm (4 in) thick slab on CAER property (Figure 26). The remainingthree batches were placed as slabs inside of vinyl storage buildings, that were 3 m X4.6 m (10 ft. X 15 ft.) in floor area (Figure 27). Each building was constructed upon 10cm (4 in.) blocks in order to elevate the base off the ground, and was built inside a 10cm high steel concrete form perimeter (Figure 28). This allowed for the concretebuilding slab to be poured in an enclosed environment for ammonia monitoring.
Ammonia loss during mixing was monitored using the same techniques as that used forthe laboratory experiments. After the ingredients were charged into the truck mixingdrum, the concrete was mixed at high speed for 3 minutes. At this point a sample ofthe concrete was taken and placed into a 4 L polyethylene bottle for measurement ofammonia concentration. After this initial sample, the concrete batch was mixed at lowspeed and transported to the CAER site, and additional samples were taken atapproximately 10-15 minute intervals both before and during discharge.
The concrete was placed and finished inside the buildings using standard techniques. During this part of the operation, plastic curtains were attached over the door opening torestrict air circulation (Figure 29).
During and after placement and finishing of the concrete, the ammonia concentrationwithin the buildings was monitored using several techniques. GasTec tubes (describedabove) were used for “spot checks” of the ammonia levels in the air, whilst an ammoniadetector/datalogger was used to continuously monitor the concentration over time. Themonitor selected was a Draeger Pac III monitor with an ammonia detector module,
27
combined with a small external battery-powered pump (MiDan Corp.) to pull air acrossthe monitor (Figure 30). Although the monitor specifications do not indicate it, themonitor was very sensitive to humidity and temperature changes and was thus difficultto calibrate for the conditions encountered during actual use. Therefore, the Draegermonitor data presented herein are useful only to show the trend of ammoniaconcentration in the air with time; absolute concentrations had to be corrected basedon the GasTec tube data.
Specific information on each of the field experiments are presented below.
B. Concrete PoursPour #2 (Storage Building #1; 26June02)The concrete for this test was prepared using non-ammoniated fly ash, with ammoniumsulfate added to the mix water to achieve a concentration of 83 mg NH3/L water. Theloss of ammonia from the Ready Mix truck was not monitored for this pour because ofproblems that occurred during mixing. During placement of the concrete, the maximumconcentration of ammonia in the storage building reached 13 ppm; this maximumconcentration was achieved within ½ to 1 hour. Within 24 hours, the concentration inthe air was below 1 ppm. During this experiment, there were no safety concernsencountered regarding exposure to ammonia. The only location where high levels ofammonia were encountered were at the discharge point of the concrete mixing drum. During mixing, the ammonia concentration in the air at the discharge opening waschecked using the GasTec tubes, and exceeded 30 ppm in one measurement. It canbe inferred from these data that the ammonia in the concrete mix could reachequilibrium with that in the air within the drum, which in this case would approach 80ppm. However, this should not cause undue concern since it is unlikely that anyonecould (or would want to) get inside the drum when it contains concrete.
Pour #3 (Storage Building #2; 16July02)In this test, fly ash “C” (280 mg NH3/kg ash) was used in the concrete. The loss ofammonia during mixing is shown in Figure 31, and was consistent with laboratory data. The ammonia concentration within the storage building increased to a maximum ofapproximately 20 ppm within an hour after beginning the placement of the concreteslab. Thereafter, the ammonia level decreased steadily to less than 5 ppm after 1 day,was less than 1 ppm after 3 days, and less than ½ ppm after 7 days (Figure 32). Thehigh concentration of ammonia in this ash undoubtedly caused the prolonged higherconcentrations in the air compared with Building #1. Similar to Pour #2, theconcentration of ammonia at the discharge end of the mixing drum exceeded 30 ppm inone measurement and was the only location where high ammonia levels wereencountered in the air.
Pour #4 (Storage Building #3; 24July02)In this experiment, fly ash “BC” (90 mg NH3/kg ash) was used in the concrete. Theammonia loss during mixing is shown in Figure 31 along with data from Building #2.
28
These data suggest that the mixing losses were similar for Pour #3 & #4, and were inagreement with laboratory data (Figure 33). The ammonia concentration within Building#3 reached a maximum of 6 ppm within the first ½ hour of placement and finishing(Figure 34). The following morning the ammonia level was 2-3 ppm in the building, anddecreased to less than 1 ppm by the next day (Figure 34). The highest concentration ofammonia in the air was again measured at the discharge opening of the mixing drum,and was as high as 17 ppm in one instance.
In general, the maximum ammonia levels recorded in each of the buildings typicallyoccurred within ½ to 1 hour after the start of the test and were in good agreement withthe laboratory data discussed above. Comparison of the two sets of data is provided inFigure 35. The degree of ventilation in each building varied during placement due tooccasional wind gusts, but was generally low because of the plastic curtains coveringmost of the door opening. However, the ventilation was certainly greater than thelaboratory experiments conducted wherein the Sonotube apparatus was completelysealed. Thus it was expected that the field test data would plot close to the laboratorydata obtained with 8.3 L/min or 15 L/min ventilation through the Sonotube. From Figure35 it is evident that the prediction was fairly accurate. More importantly, the large-scaletesting data support the interpretations based on the laboratory data; specifically, thatfor most applications the estimated maximum concentration of ammonia in the concreteis 170 mg/L, if an ammonia concentration of 25 ppm is not to be exceeded in anenclosed workspace. For those areas with negligible ventilation, 110 mg/L shouldprobably not be exceeded in the concrete. From this and the knowledge of theconcrete mix proportions, the maximum permissible ammonia in fly ash can becalculated.
CONCLUSIONSThe objective of this study was to develop rule of thumb guidelines for the utilization ofammoniated fly ash in mortar and concrete, by gaining a more thorough understandingof the behavior of ammoniated ash in these materials. Foremost amongst the concernswith using ammoniated fly ash is the maximum amount of ammonia in fly ash, belowwhich worker safety would not be compromised. NIOSH recommends a TWAconcentration in the workplace of 25 ppm in the air, and a STEL of 35 ppm.
Results of this study indicate that the maximum concentration of ammonia in fly ashprimarily will depend on concrete mix proportions and the degree of ventilation presentwhere the concrete is being placed. For the concrete prepared in this study, with aW:CM range of 0.44 to 0.68, the maximum “acceptable” ammonia concentration in thefly ash was surprisingly high, even when there was essentially no ventilation. Underthese conditions, and with a 20 % replacement of fly ash for cement, it is estimated thatthe ammonia in ash could be as high as about 240 to 375 mg NH3/kg of ash for the Lowand High W:CM mixes, respectively. In commercial applications, placing concrete in anenclosed space with no ventilation is probably a relatively uncommon occurrencecompared with applications where there is some ventilation present. For these morecommon concrete uses, the maximum acceptable ammonia concentration would be
29
between 375 and 575 mg NH3/kg of ash, for our Low and High W:CM concrete mixes. When using a greater percentage of fly ash in the mix, the acceptable concentration willdecrease. In actual practice, however, an ammonia concentration in the air below theNIOSH TWA is likely to be targeted because 25 ppm ammonia does produce a verynoticeable odor. From experience gained in this study, a concentration of 10 ppm inthe air is more comfortable to work with. If 10 ppm is used as a “marketable exposurelimit”, then the permissible ammonia concentration in the fly ash will be less than if theNIOSH air limits are followed. The ammonia concentration in fly ash that will result in10 ppm or less ammonia in the air can then be calculated from the equation provided inthis report if the concrete mix proportions are known.
As a general rule, it was determined that about 15% of the initial ammonia content inconcrete was lost after 40 minutes of mixing, although the percentage lost depended onthe mix proportions and the batch volume i.e. a full mixer lost less than a partially fullmixer. When placing the concrete in an enclosed space it was found that the ammonialoss rate from the concrete decreased substantially after 1 month, although greater than50% of the initial ammonia was calculated to have remained in the 11 cm thick concrete(a greater percentage would remain in a thicker slab). The remaining ammonia woulddiffuse from the concrete at a very slow rate over the course of many months. However, this is not likely to result in any long-term ammonia odors in enclosed spaces(e.g. residential basements) because our data showed that the ammonia concentrationin the air was below 1-2 ppm after several days curing, even when the fly ash containedhigh levels of ammonia. Thus it is likely that the major concern with using ammoniatedfly ash in mortar and concrete will be odors present during placement and finishing, thatis, within the first three to four hours.
The long term loss rate of ammonia from concrete was not affected by mix proportionsor ventilation rate, which suggests that the ammonia diffusion rate was limited by masstransfer through the concrete and not by dissipation of the gas phase above theconcrete. This was not the case for mortar, where a higher W:CM ratio, water content,and ventilation rate caused an increase in the ammonia loss rate. Interestingly, after 1month curing a substantially greater percentage of ammonia remained in the mortarcompared with concrete when equivalent ventilation rates were used.
The final phase of the project involved commercial scale utilization of ammoniated flyash in concrete. The maximum concentration of ammonia in the air within the buildingsduring placement and finishing agreed well with laboratory data, as did the quantity ofammonia lost during mixing. In general, during the mixing and placement of ammonia-laden concrete, no safety concerns were encountered even when a fly ash containing280 mg NH3 per kg of fly ash was used. The only location where the ammoniaconcentration attained high levels (i.e. > 25 ppm in the air) was within the concretemixing drum.
RECOMMENDATIONS FOR FUTURE RESEARCHOverall, this project succeeded in providing a better understanding of the behavior of
30
ammoniated fly ash in mortar and concrete, and in developing some guidelines for use. However like many research projects, many questions remain unanswered, and theexperimental results produced new questions. One fundamental question that remainsinvolves the effect of temperature on the loss rate of ammonia from mortar and, inparticular, concrete during mixing and curing. One of the problems encountered withthe temperature control of concrete involved the scale of the work. In order to preciselycontrol the temperature during these experiments the apparatus devised must be largeenough to encompass a concrete mixer, several fairly large (e.g. 16 in diameter)concrete slabs, and the 7-8 ft head-space above the slabs. However, experiments ofthis nature would be important to understanding the diffusion behavior of ammoniathrough concrete and mortar.
Another practical problem is the effect of humidity on the ammonia loss rate. Studies ofoxygen and carbon dioxide diffusion through concrete and mortar indicate that humiditycan lower the diffusivity rate because water in the pores inhibits transfer of the insolublegases through the material (e.g. Houst and Whitman, 1994). However, the highsolubility of ammonia gas may result in humidity having less of an influence. A potentialeffect would be a case where the humidity is low in a residential space whilst theconcrete is in contact with moist soil or aggregate. In this situation it is possible for a“wicking effect” to occur, which would bring ammonia through the concrete. Although afundamental examination of ammonia diffusion, at first glance, would not appear toprovide practical information regarding the release of ammonia from mortar andconcrete, such a study would provide valuable information on the environmentalvariables that affect the ammonia diffusion rate through the materials. If a study ofdiffusion did establish that humidity and temperature affect the diffusivity rate, it wouldstill need to be ascertained if the effects are significant and thus observable in practice.
Another useful study would involve testing the conclusions and recommendationsoffered herein by conducting additional large-scale experiments such as wereconducted at the end of this project. To accomplish this it would be necessary to teamwith a Ready Mix plant and contractors that are willing to work with ammoniated ash. The ammonia concentration in the workplace during concrete placement and finishingcould be monitored and the data compared with the results of this study. This workwould need to be completed in the near future in advance of the installation of manymore SCR and SNCR systems.
Finally, it would be of use to the ash marketing industry for a technical and economicassessment to be made of the various existing ammonia removal (from fly ash)processes. Similarly, a high priority should be given to the development of inexpensiveammonia removal or “passivation” processes that are compatible with current ashhandling systems and processes, either at the power plant or the Ready Mix operation.
REFERENCESAmerican Concrete Institute (ACI), Manual of Concrete Practice 2000, Part 1 Materialsand General Properties of Concrete, ACI International, 2000.
31
American Society of Heating, Refrigerating, and Air-Conditioning Engineers (ASHRAE),Ventilation for Acceptable Indoor Air Quality, ANSI/ASHRAE 62-1999 - Publishedstandard. (Supersedes ASHRAE Standard 62-1989).
Costa, U., Facoetti, M. and Massazza, F., Ninth International Congress on theChemistry of Cement, Vol. 5, pp. 107-114, 1992.
Crouch, L.K., Sauter, H.J., Copeland, A., Walker, T., Dotson, J. and Badoe, D.,Proceedings, 2001 International Ash Utilization Symposium, Lexington, KY, 2001.
Day, R.L. and Marsh, B.K., Cement and Concrete Research, Vol. 18, pp. 63-73, 1988.
Golden, D.M., Proceedings: 14th International Symposium on Management and Use ofCoal Combustion Products (CCPs), Vol. 1, pp. 4-1 to 4-19, EPRI, Palo Alto, CA: 2001.1001158, 2001.
Hicks, B.B. and Liss, P.S., Tellus, Vol. 28, pp. 348-354, 1976.
Houst, Y.F. and Whitman, F.H., Cement and Concrete Research, Vol. 24, pp. 1165-1176, 1994.
Jordan, T.D. and Casper, M.A., 1995 Joint Power Generation Conference, Vol. 4,ASME 1995, PWR-Vol. 29, pp. 147-151.
Klieger, P., Effect of Mixing and Curing Temperature on Concrete Strength, ResearchBulletin 103, Portland Cement Association, 1958.
Koch, H-J. and Prenzel, H., Concrete Precasting Plant and Technology, Vol. 55, pp.72-75, 1989.
Majors, R.K. and Rathbone, R.F., Proceedings: 14th International Symposium onManagement and Use of Coal Combustion Products (CCPs), Vol. 1, pp. 8-1 to 8-8,EPRI, Palo Alto, CA: 2001.1001158, 2001.
National Institute for Occupational Safety and Health (NIOSH), Ammonia: Method 6015Issue 2, 1994.
National Institute for Occupational Safety and Health (NIOSH), Ammonia by IC, Method6016 Issue 1, 1996.
Neville, A.M., Properties of Concrete, 4th Edition, 844 pp., Wiley and Sons, New York,1996.
Occupational Safety and Health Administration (OSHA) Technical Center, Ammonia in
32
Workplace Atmospheres - Solid Sorbent (by R.G. Adler), OSHA-SLTC Method No. ID-188, Revised 1991.
Occupational Safety and Health Administration (OSHA) Technical Center, OSHAAnalytical Methods Manual, OSHA-SLCAL Method No. ID-164, American Conferenceof Governmental Industrial Hygenists, Cincinnati, OH, 1985.
Thomas, M.D.A., Shehata, M.H. and Shashiprakash, S.G., Cement, Concrete, andAggregates, CCAGDP, Vol. 21, No. 2, pp. 105-110, 1999.
van der Brugghen, F.W., Gast, C.H., van der Berg, J.W., Kuiper, W.H. and Viser, R.,EPRI/EPA 1995 Joint Symposium on Stationary Combustion NOx Control, May 16-19,1995, Kansas City, Missouri.
Weiler, R.R., J. Fish. Res. Board Canada, Vol. 36, pp. 685-689, 1979.
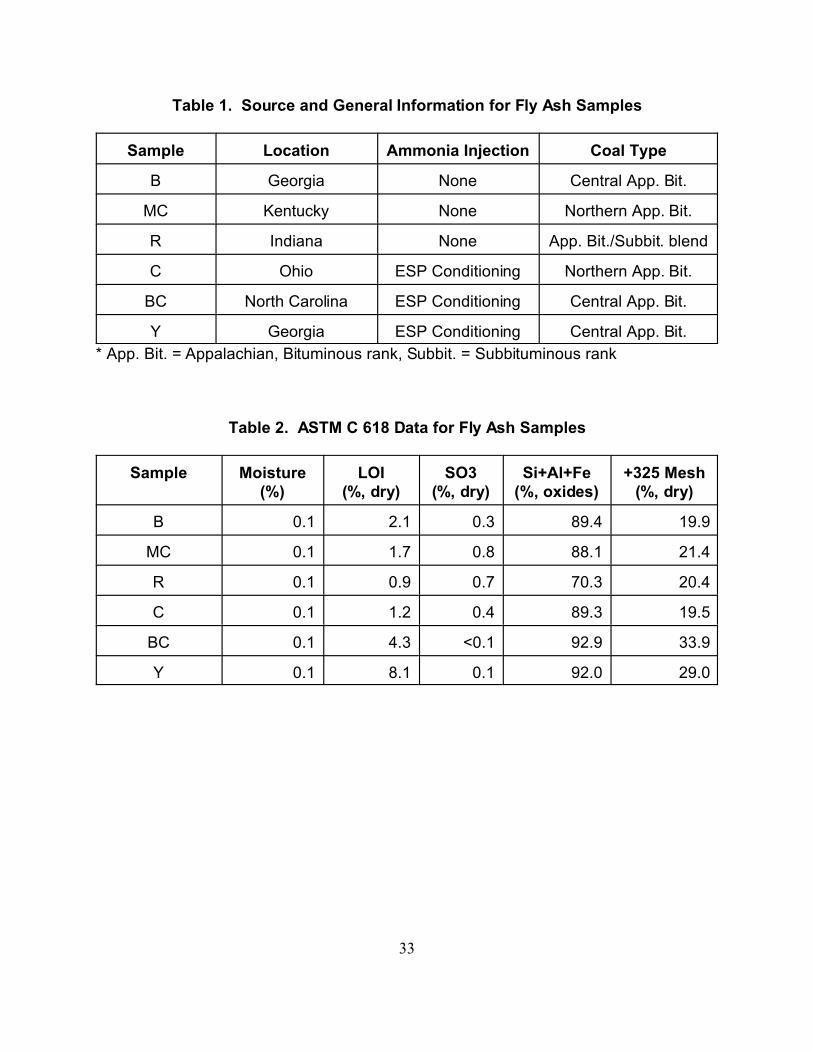
33
Table 1. Source and General Information for Fly Ash Samples
Sample Location Ammonia Injection Coal Type
B Georgia None Central App. Bit.
MC Kentucky None Northern App. Bit.
R Indiana None App. Bit./Subbit. blend
C Ohio ESP Conditioning Northern App. Bit.
BC North Carolina ESP Conditioning Central App. Bit.
Y Georgia ESP Conditioning Central App. Bit.
* App. Bit. = Appalachian, Bituminous rank, Subbit. = Subbituminous rank
Table 2. ASTM C 618 Data for Fly Ash Samples
Sample Moisture(%)
LOI(%, dry)
SO3(%, dry)
Si+Al+Fe(%, oxides)
+325 Mesh(%, dry)
B 0.1 2.1 0.3 89.4 19.9
MC 0.1 1.7 0.8 88.1 21.4
R 0.1 0.9 0.7 70.3 20.4
C 0.1 1.2 0.4 89.3 19.5
BC 0.1 4.3 <0.1 92.9 33.9
Y 0.1 8.1 0.1 92.0 29.0
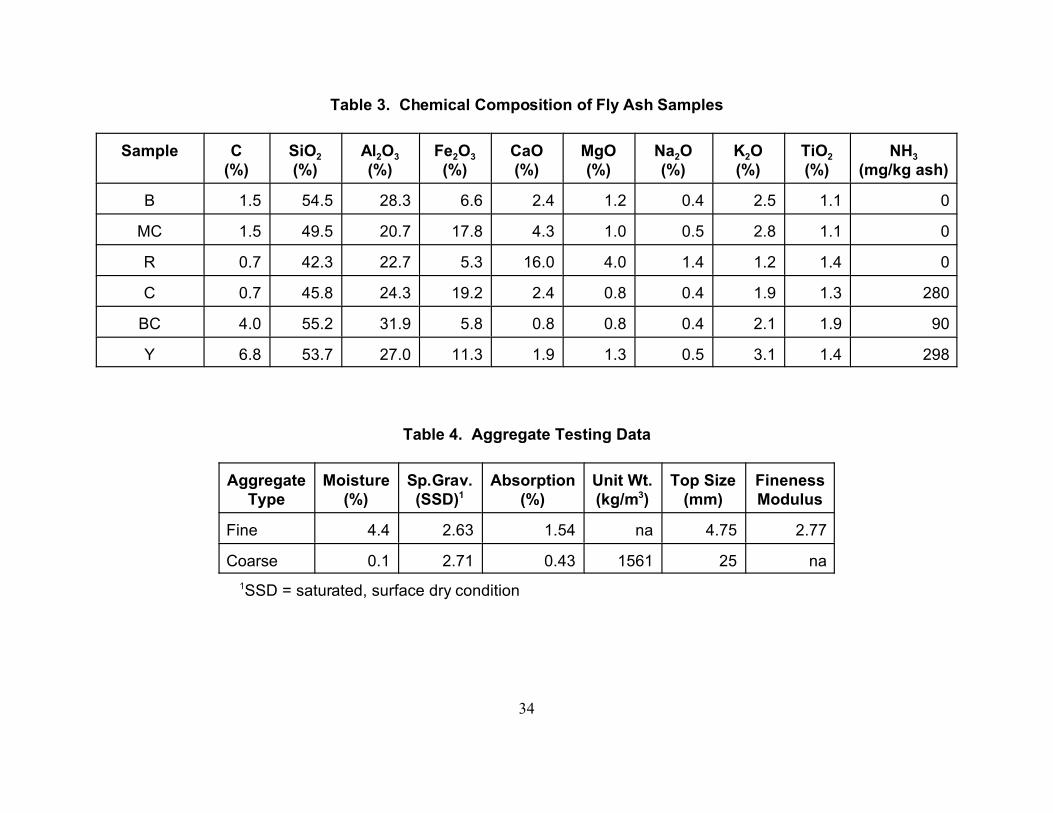
34
Table 3. Chemical Composition of Fly Ash Samples
Sample C(%)
SiO2
(%)Al2O3
(%)Fe2O3
(%)CaO(%)
MgO(%)
Na2O(%)
K2O(%)
TiO2
(%)NH3
(mg/kg ash)
B 1.5 54.5 28.3 6.6 2.4 1.2 0.4 2.5 1.1 0
MC 1.5 49.5 20.7 17.8 4.3 1.0 0.5 2.8 1.1 0
R 0.7 42.3 22.7 5.3 16.0 4.0 1.4 1.2 1.4 0
C 0.7 45.8 24.3 19.2 2.4 0.8 0.4 1.9 1.3 280
BC 4.0 55.2 31.9 5.8 0.8 0.8 0.4 2.1 1.9 90
Y 6.8 53.7 27.0 11.3 1.9 1.3 0.5 3.1 1.4 298
Table 4. Aggregate Testing Data
AggregateType
Moisture(%)
Sp.Grav.(SSD)1
Absorption(%)
Unit Wt.(kg/m3)
Top Size(mm)
FinenessModulus
Fine 4.4 2.63 1.54 na 4.75 2.77
Coarse 0.1 2.71 0.43 1561 25 na
1SSD = saturated, surface dry condition
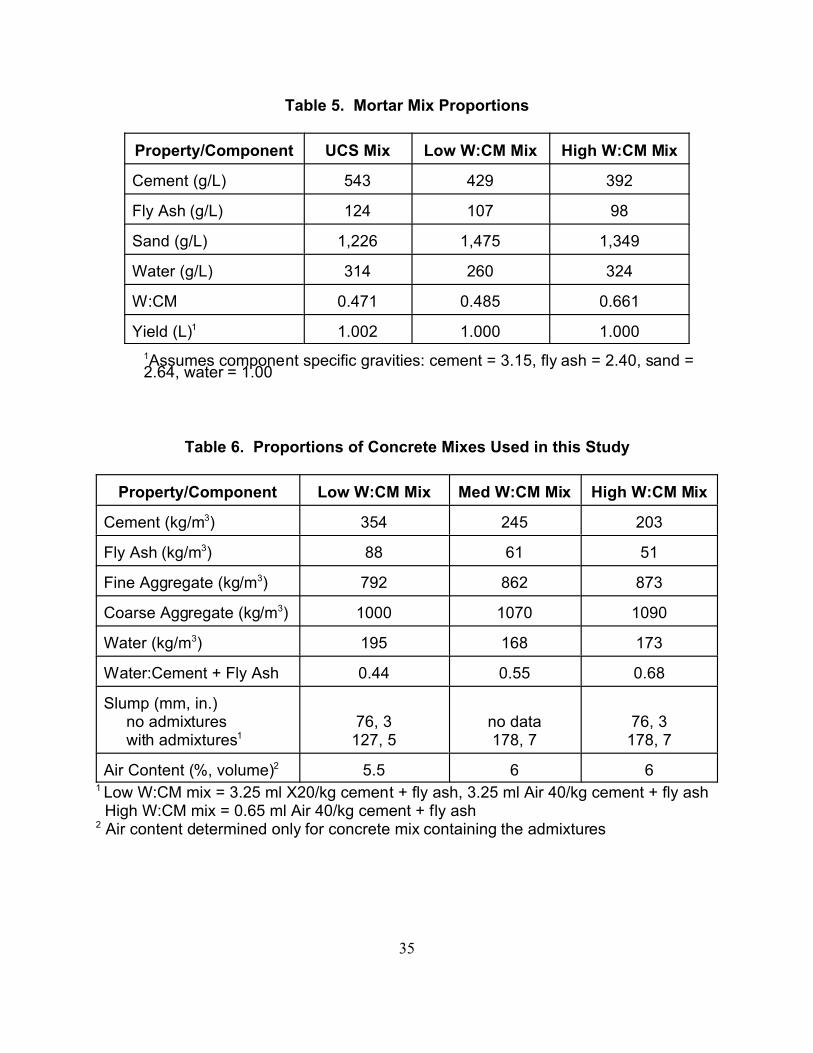
35
Table 5. Mortar Mix Proportions
Property/Component UCS Mix Low W:CM Mix High W:CM Mix
Cement (g/L) 543 429 392
Fly Ash (g/L) 124 107 98
Sand (g/L) 1,226 1,475 1,349
Water (g/L) 314 260 324
W:CM 0.471 0.485 0.661
Yield (L)1 1.002 1.000 1.000
1Assumes component specific gravities: cement = 3.15, fly ash = 2.40, sand =2.64, water = 1.00
Table 6. Proportions of Concrete Mixes Used in this Study
Property/Component Low W:CM Mix Med W:CM Mix High W:CM Mix
Cement (kg/m3) 354 245 203
Fly Ash (kg/m3) 88 61 51
Fine Aggregate (kg/m3) 792 862 873
Coarse Aggregate (kg/m3) 1000 1070 1090
Water (kg/m3) 195 168 173
Water:Cement + Fly Ash 0.44 0.55 0.68
Slump (mm, in.) no admixtures with admixtures1
76, 3127, 5
no data178, 7
76, 3178, 7
Air Content (%, volume)2 5.5 6 61 Low W:CM mix = 3.25 ml X20/kg cement + fly ash, 3.25 ml Air 40/kg cement + fly ash High W:CM mix = 0.65 ml Air 40/kg cement + fly ash2 Air content determined only for concrete mix containing the admixtures
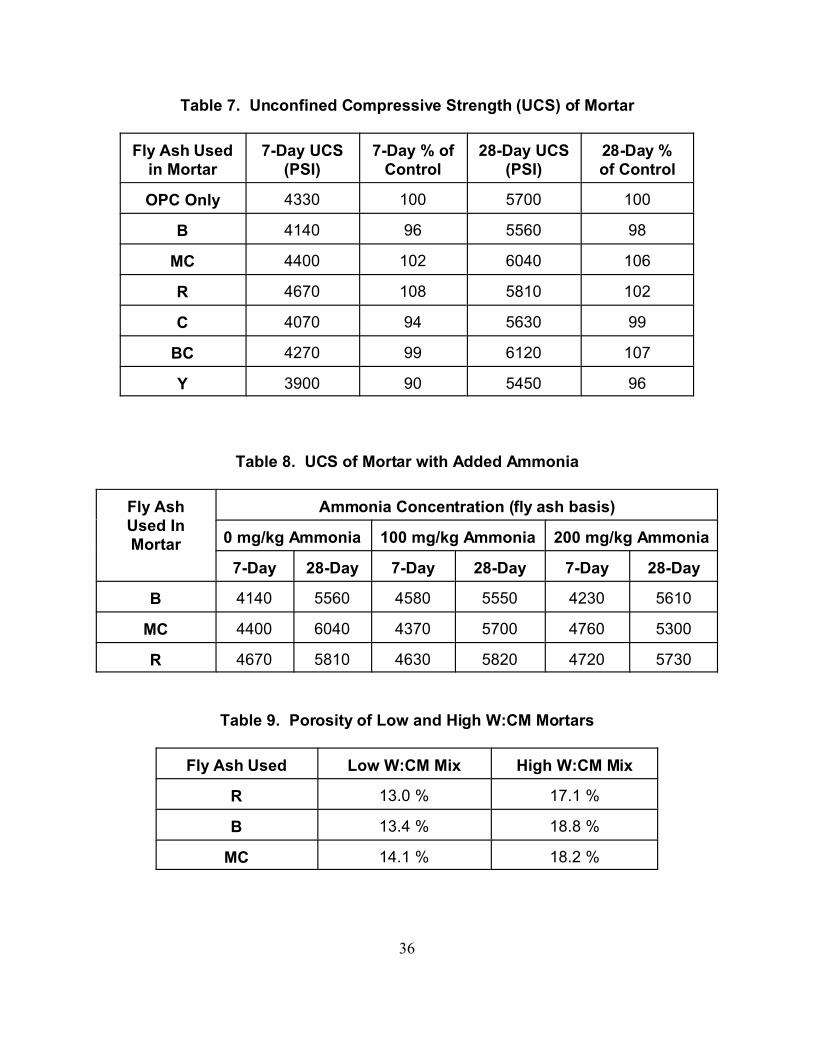
36
Table 7. Unconfined Compressive Strength (UCS) of Mortar
Fly Ash Usedin Mortar
7-Day UCS(PSI)
7-Day % ofControl
28-Day UCS(PSI)
28-Day %of Control
OPC Only 4330 100 5700 100
B 4140 96 5560 98
MC 4400 102 6040 106
R 4670 108 5810 102
C 4070 94 5630 99
BC 4270 99 6120 107
Y 3900 90 5450 96
Table 8. UCS of Mortar with Added Ammonia
Fly AshUsed InMortar
Ammonia Concentration (fly ash basis)
0 mg/kg Ammonia 100 mg/kg Ammonia 200 mg/kg Ammonia
7-Day 28-Day 7-Day 28-Day 7-Day 28-Day
B 4140 5560 4580 5550 4230 5610
MC 4400 6040 4370 5700 4760 5300
R 4670 5810 4630 5820 4720 5730
Table 9. Porosity of Low and High W:CM Mortars
Fly Ash Used Low W:CM Mix High W:CM Mix
R 13.0 % 17.1 %
B 13.4 % 18.8 %
MC 14.1 % 18.2 %
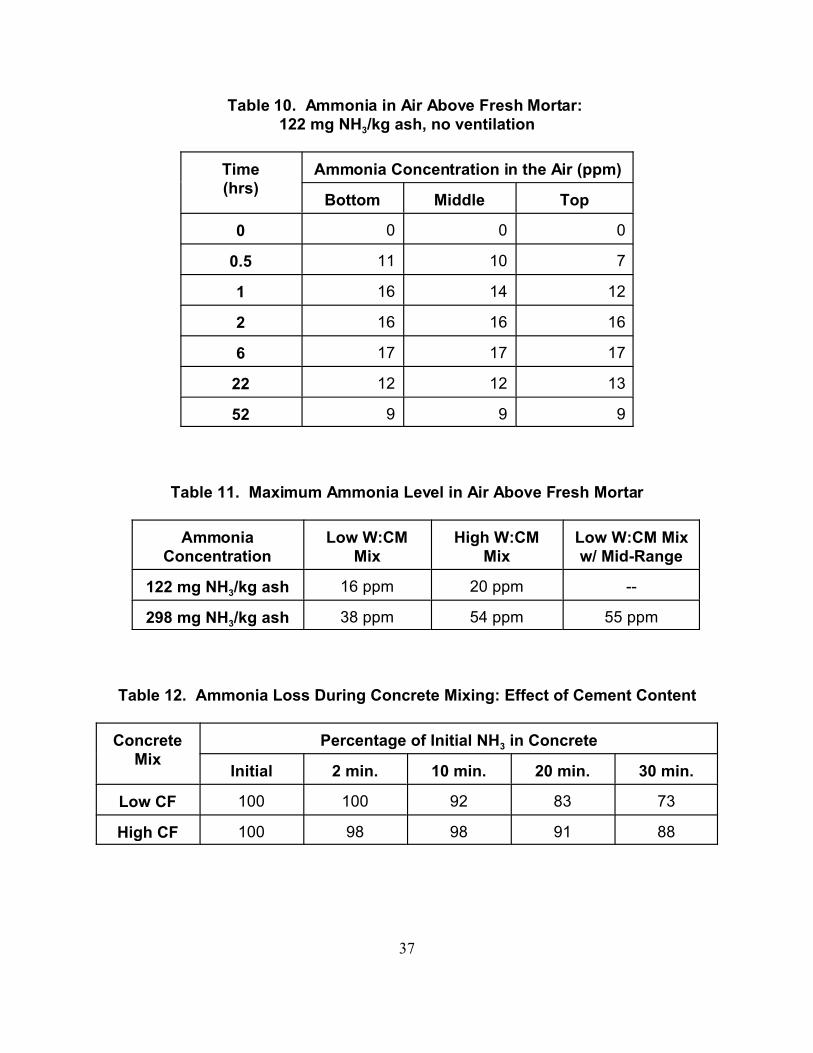
37
Table 10. Ammonia in Air Above Fresh Mortar: 122 mg NH3/kg ash, no ventilation
Time(hrs)
Ammonia Concentration in the Air (ppm)
Bottom Middle Top
0 0 0 0
0.5 11 10 7
1 16 14 12
2 16 16 16
6 17 17 17
22 12 12 13
52 9 9 9
Table 11. Maximum Ammonia Level in Air Above Fresh Mortar
AmmoniaConcentration
Low W:CMMix
High W:CMMix
Low W:CM Mixw/ Mid-Range
122 mg NH3/kg ash 16 ppm 20 ppm --
298 mg NH3/kg ash 38 ppm 54 ppm 55 ppm
Table 12. Ammonia Loss During Concrete Mixing: Effect of Cement Content
ConcreteMix
Percentage of Initial NH3 in Concrete
Initial 2 min. 10 min. 20 min. 30 min.
Low CF 100 100 92 83 73
High CF 100 98 98 91 88
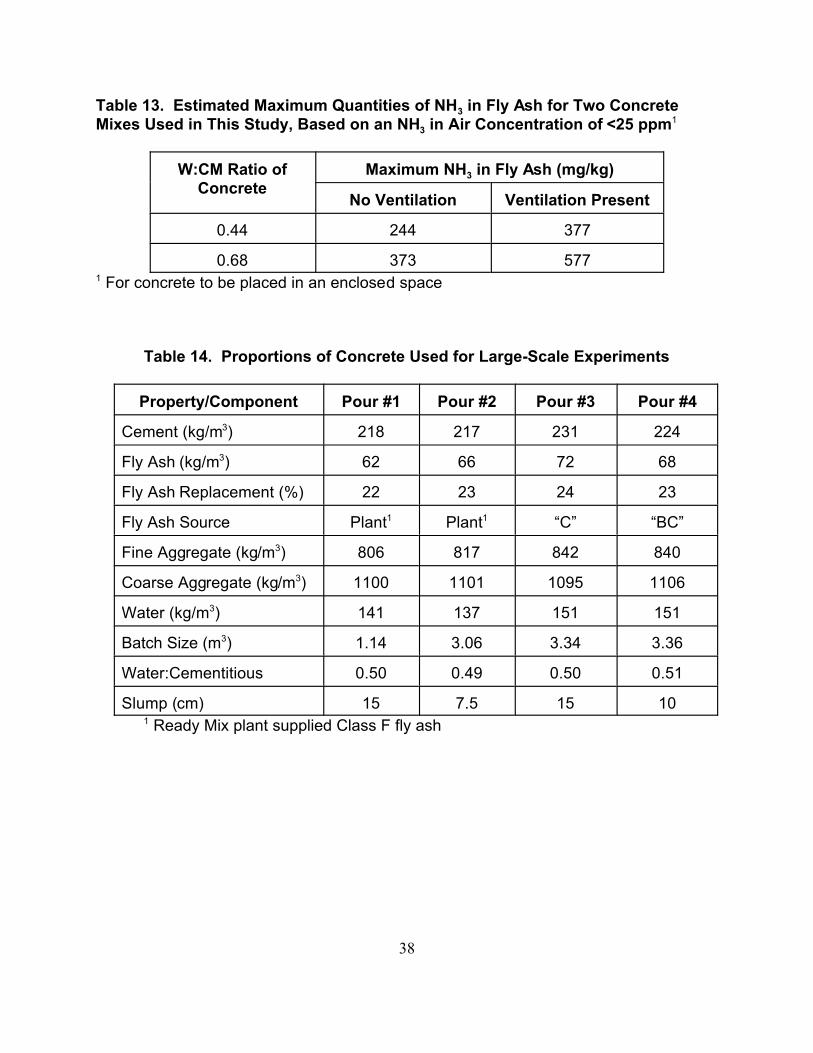
38
Table 13. Estimated Maximum Quantities of NH3 in Fly Ash for Two ConcreteMixes Used in This Study, Based on an NH3 in Air Concentration of <25 ppm1
W:CM Ratio ofConcrete
Maximum NH3 in Fly Ash (mg/kg)
No Ventilation Ventilation Present
0.44 244 377
0.68 373 5771 For concrete to be placed in an enclosed space
Table 14. Proportions of Concrete Used for Large-Scale Experiments
Property/Component Pour #1 Pour #2 Pour #3 Pour #4
Cement (kg/m3) 218 217 231 224
Fly Ash (kg/m3) 62 66 72 68
Fly Ash Replacement (%) 22 23 24 23
Fly Ash Source Plant1 Plant1 “C” “BC”
Fine Aggregate (kg/m3) 806 817 842 840
Coarse Aggregate (kg/m3) 1100 1101 1095 1106
Water (kg/m3) 141 137 151 151
Batch Size (m3) 1.14 3.06 3.34 3.36
Water:Cementitious 0.50 0.49 0.50 0.51
Slump (cm) 15 7.5 15 101 Ready Mix plant supplied Class F fly ash
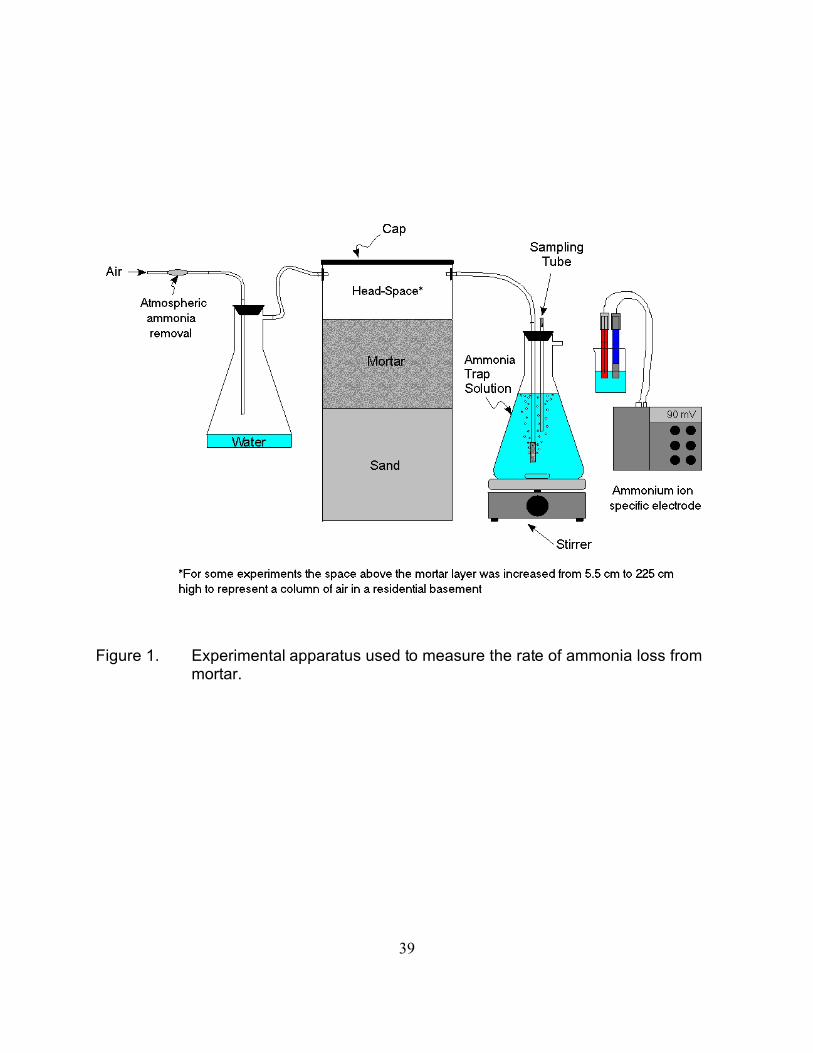
39
Figure 1. Experimental apparatus used to measure the rate of ammonia loss frommortar.
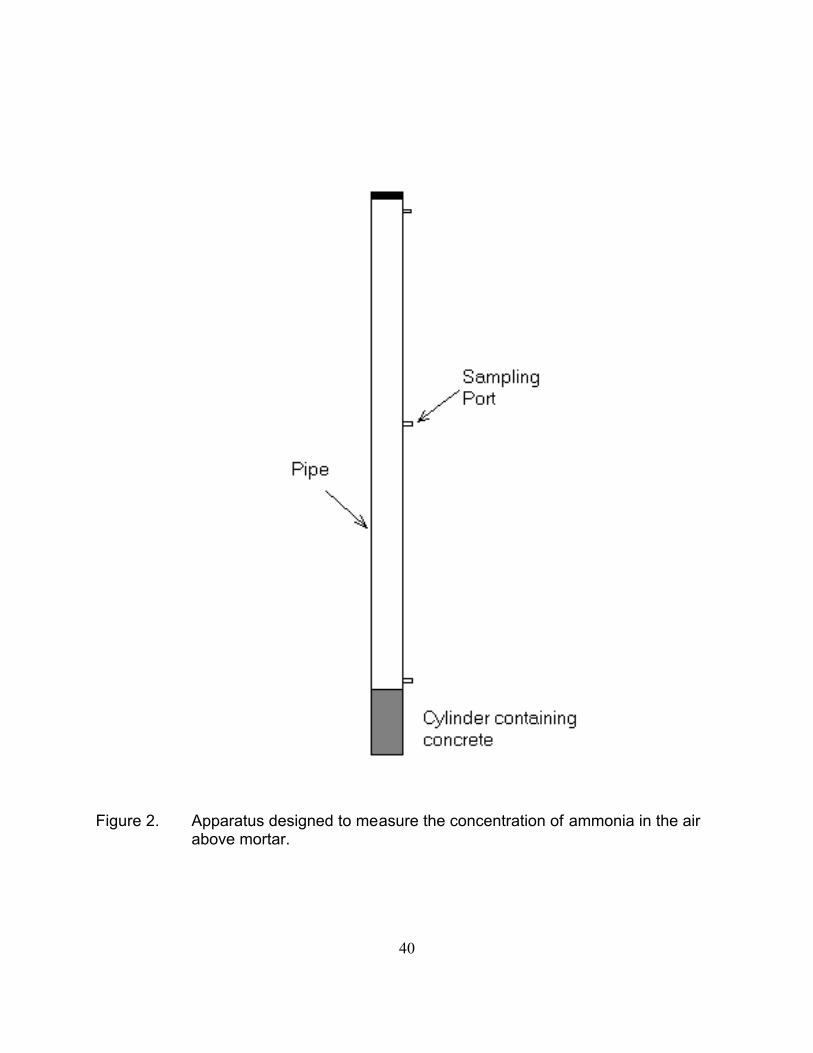
40
Figure 2. Apparatus designed to measure the concentration of ammonia in the airabove mortar.
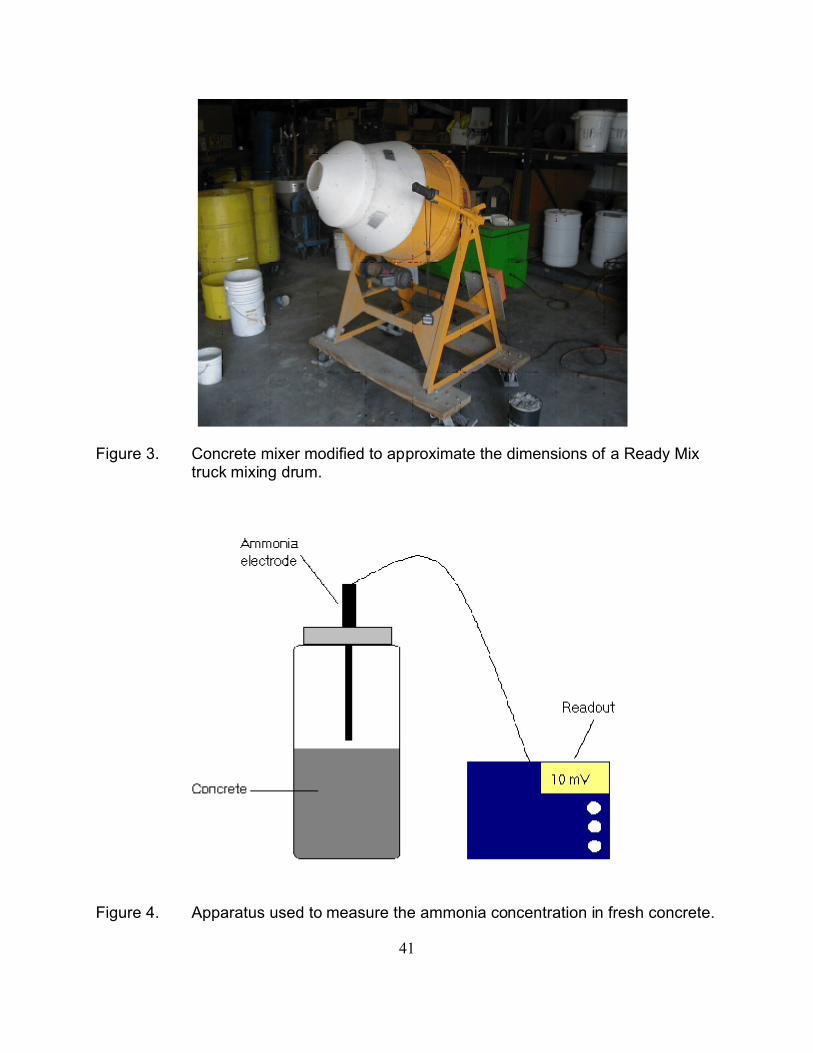
41
Figure 3. Concrete mixer modified to approximate the dimensions of a Ready Mixtruck mixing drum.
Figure 4. Apparatus used to measure the ammonia concentration in fresh concrete.
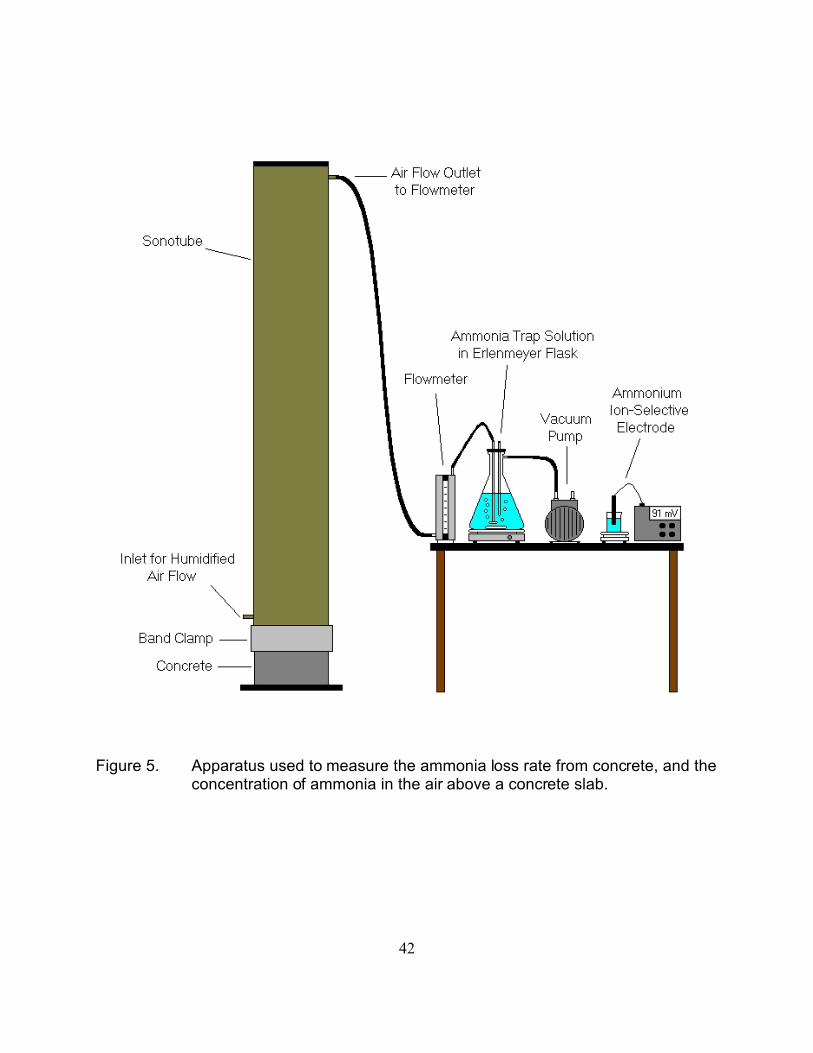
42
Figure 5. Apparatus used to measure the ammonia loss rate from concrete, and theconcentration of ammonia in the air above a concrete slab.
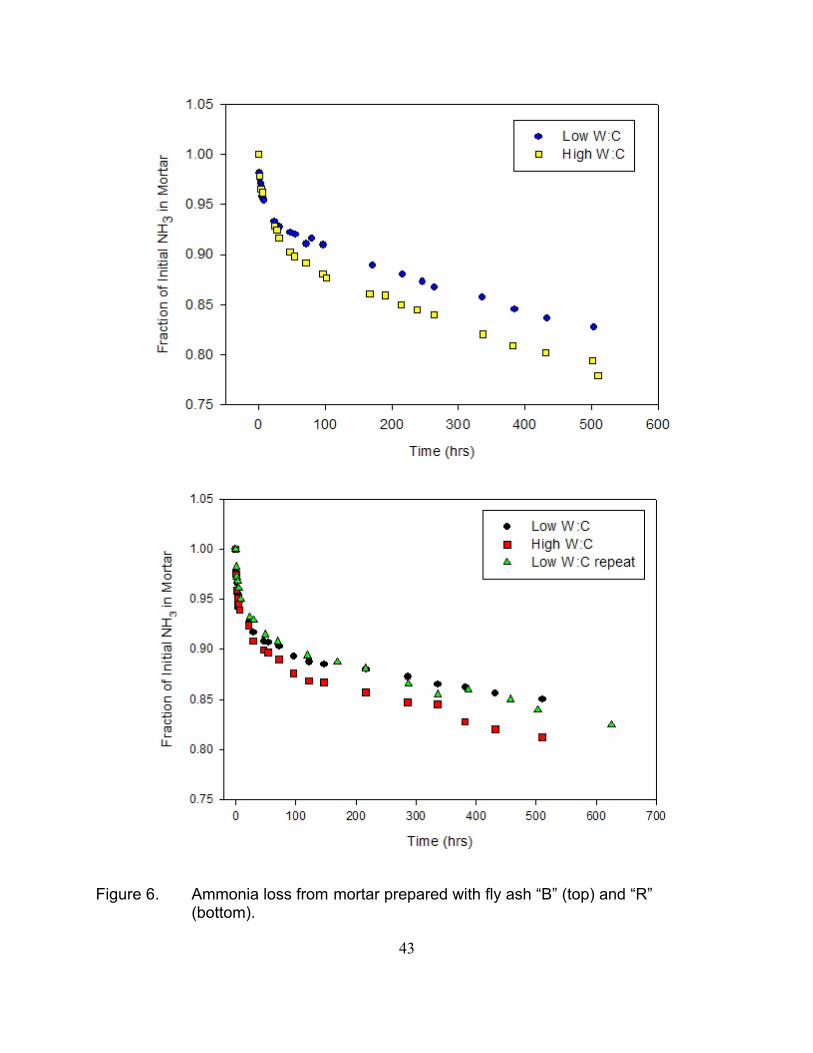
43
Figure 6. Ammonia loss from mortar prepared with fly ash “B” (top) and “R”(bottom).
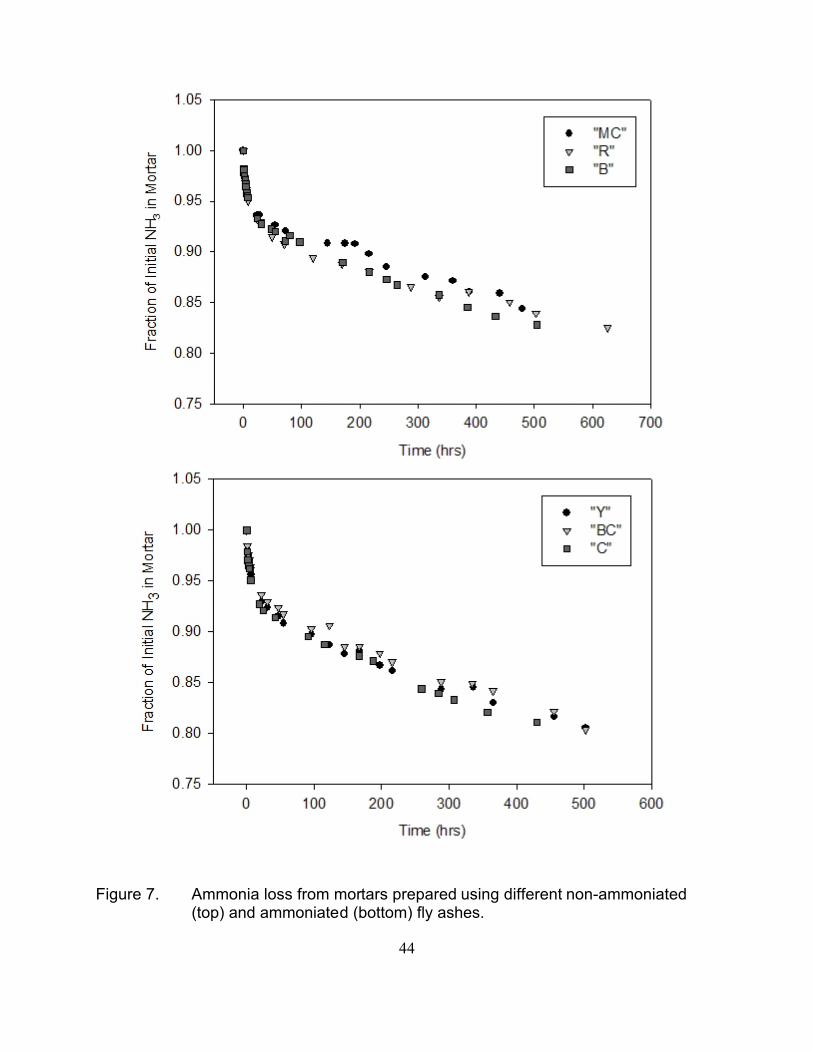
44
Figure 7. Ammonia loss from mortars prepared using different non-ammoniated(top) and ammoniated (bottom) fly ashes.
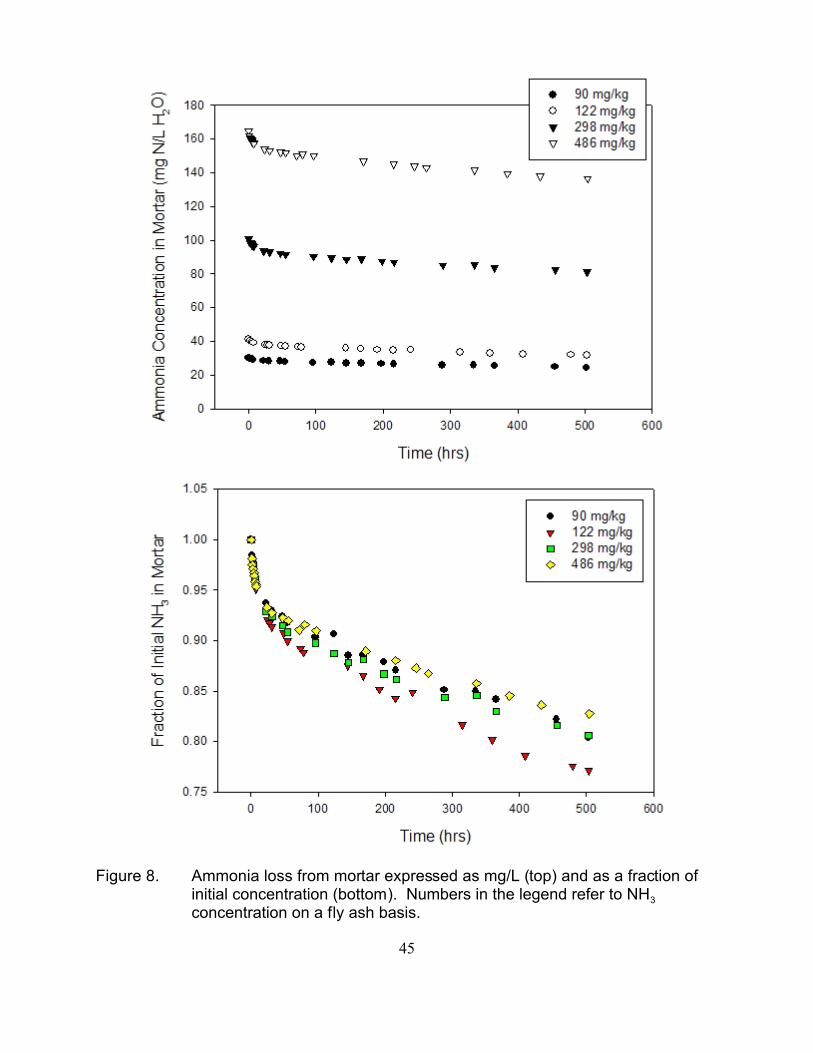
45
Figure 8. Ammonia loss from mortar expressed as mg/L (top) and as a fraction ofinitial concentration (bottom). Numbers in the legend refer to NH3
concentration on a fly ash basis.
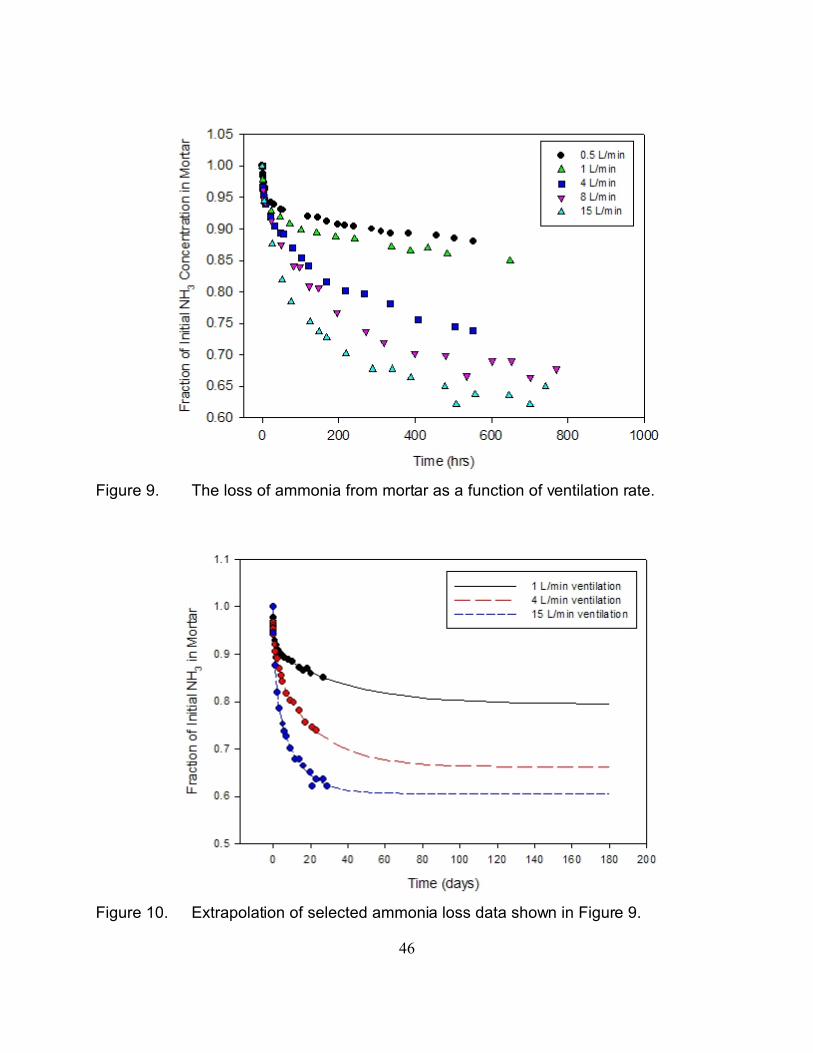
46
Figure 9. The loss of ammonia from mortar as a function of ventilation rate.
Figure 10. Extrapolation of selected ammonia loss data shown in Figure 9.
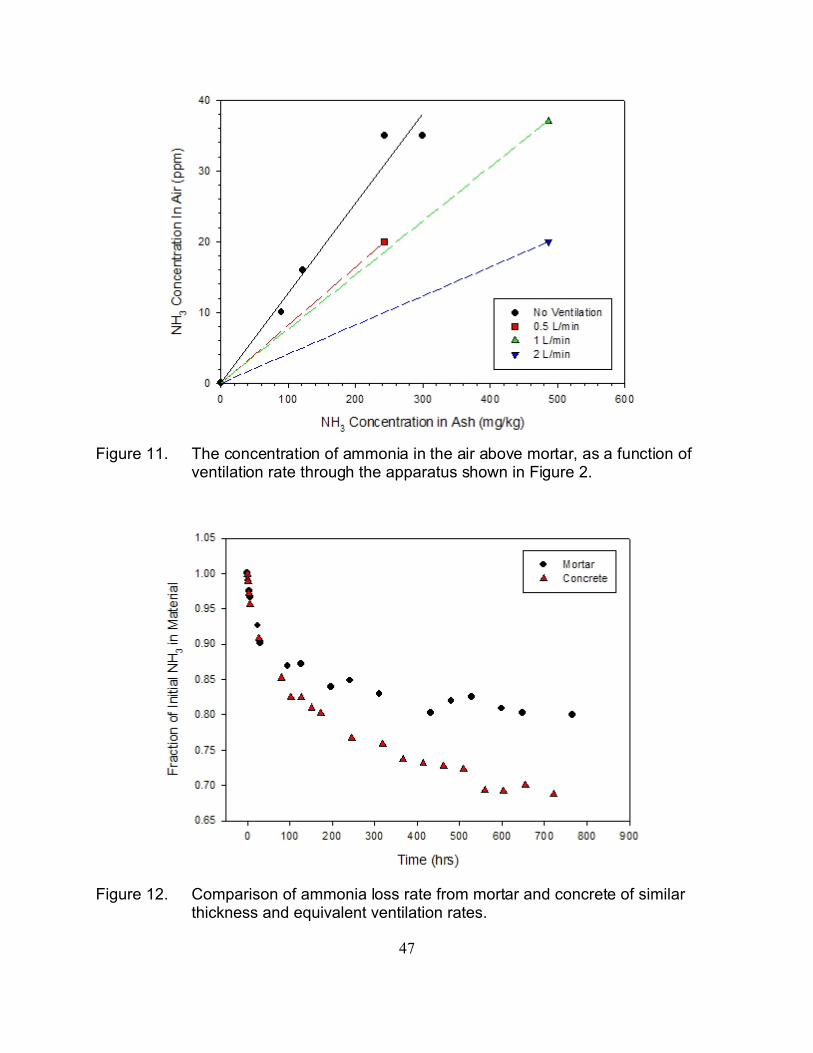
47
Figure 11. The concentration of ammonia in the air above mortar, as a function of ventilation rate through the apparatus shown in Figure 2.
Figure 12. Comparison of ammonia loss rate from mortar and concrete of similarthickness and equivalent ventilation rates.
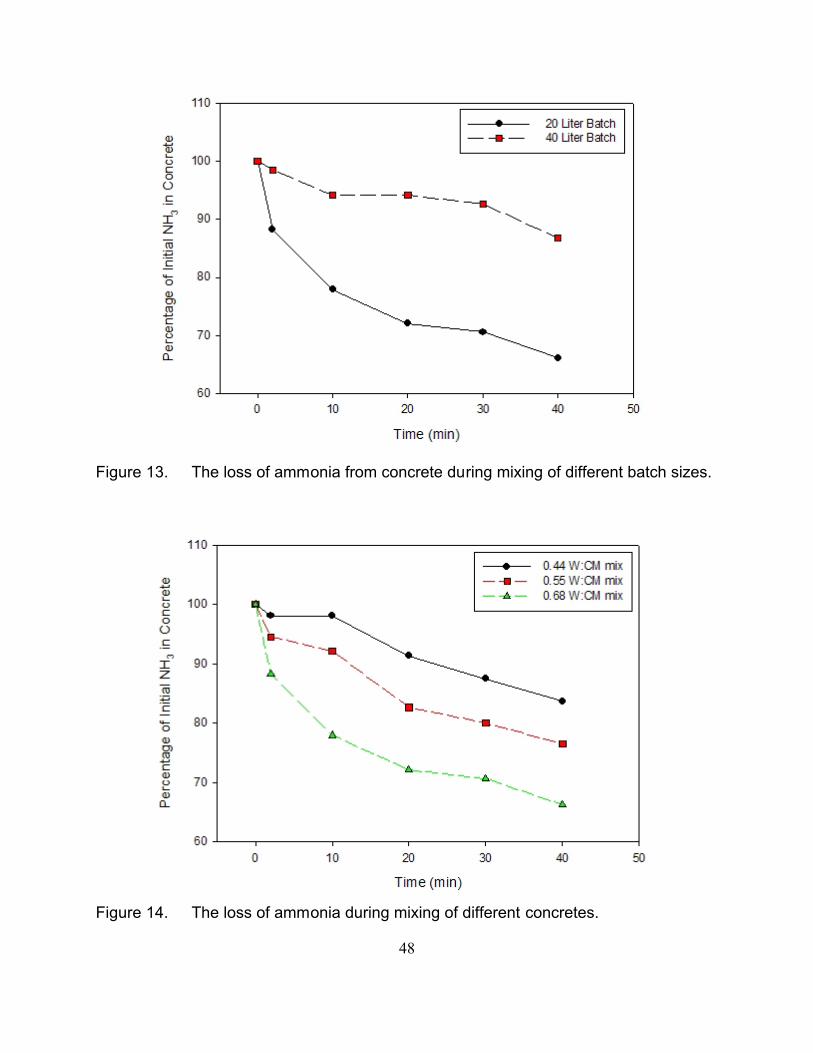
48
Figure 13. The loss of ammonia from concrete during mixing of different batch sizes.
Figure 14. The loss of ammonia during mixing of different concretes.
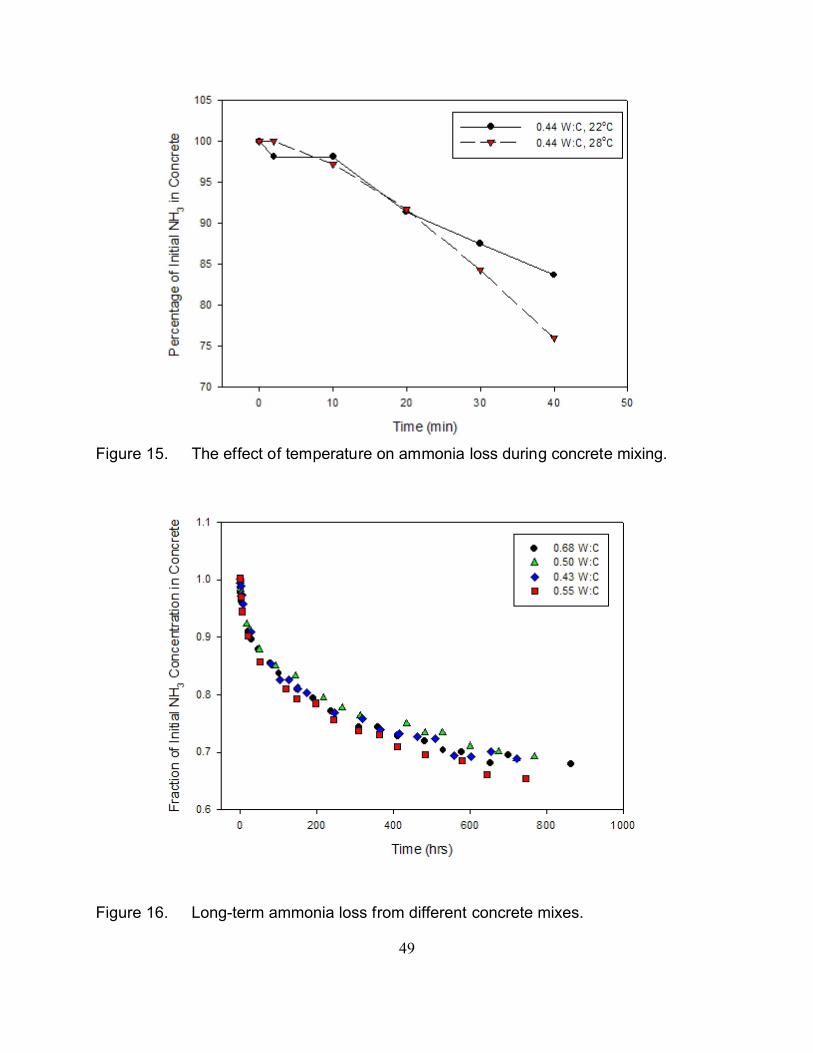
49
Figure 15. The effect of temperature on ammonia loss during concrete mixing.
Figure 16. Long-term ammonia loss from different concrete mixes.
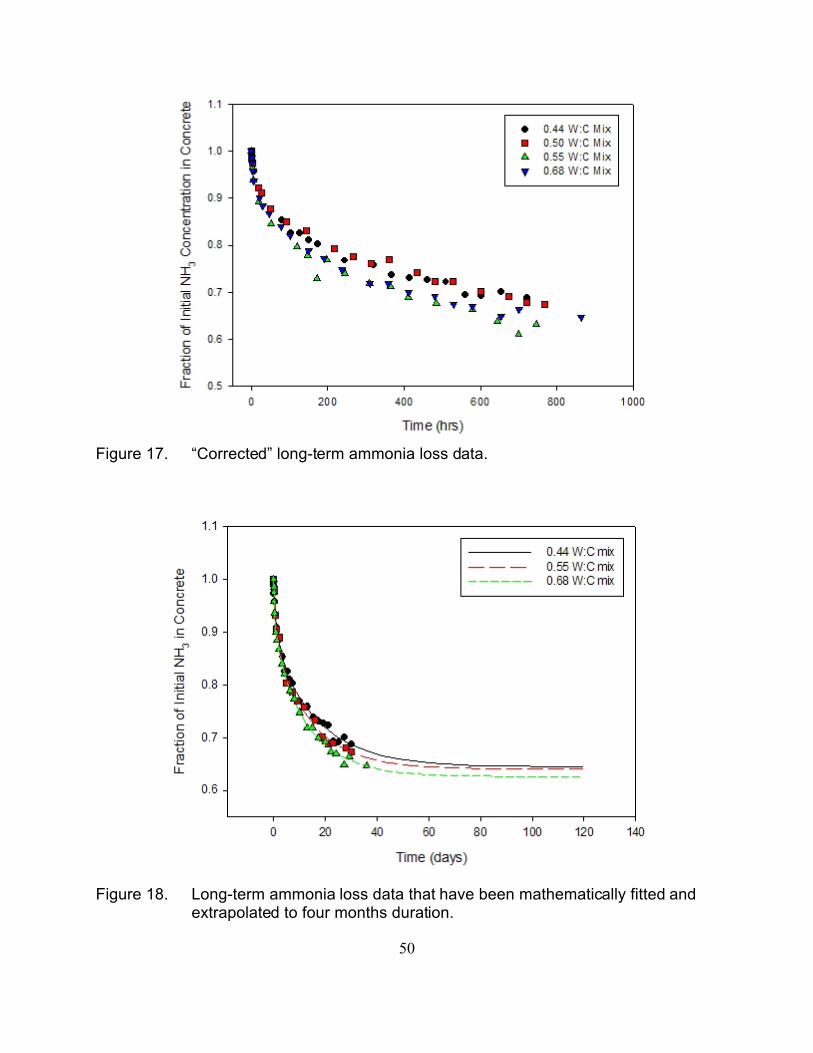
50
Figure 17. “Corrected” long-term ammonia loss data.
Figure 18. Long-term ammonia loss data that have been mathematically fitted andextrapolated to four months duration.
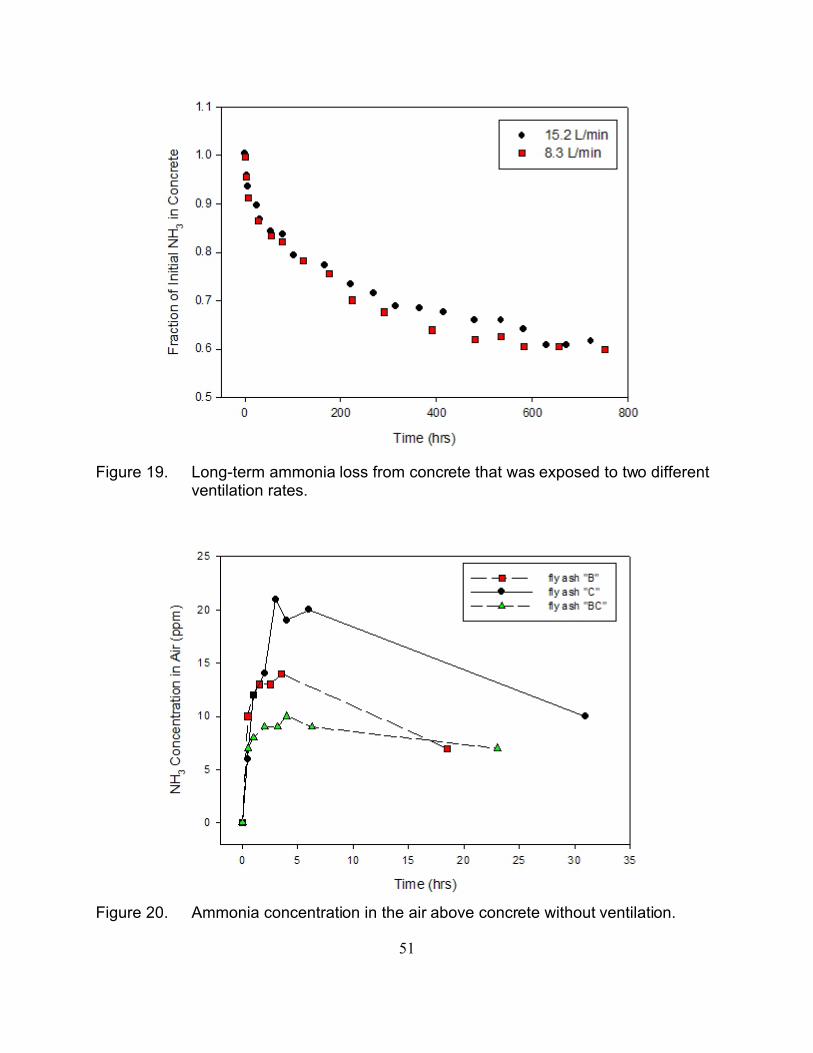
51
Figure 19. Long-term ammonia loss from concrete that was exposed to two differentventilation rates.
Figure 20. Ammonia concentration in the air above concrete without ventilation.
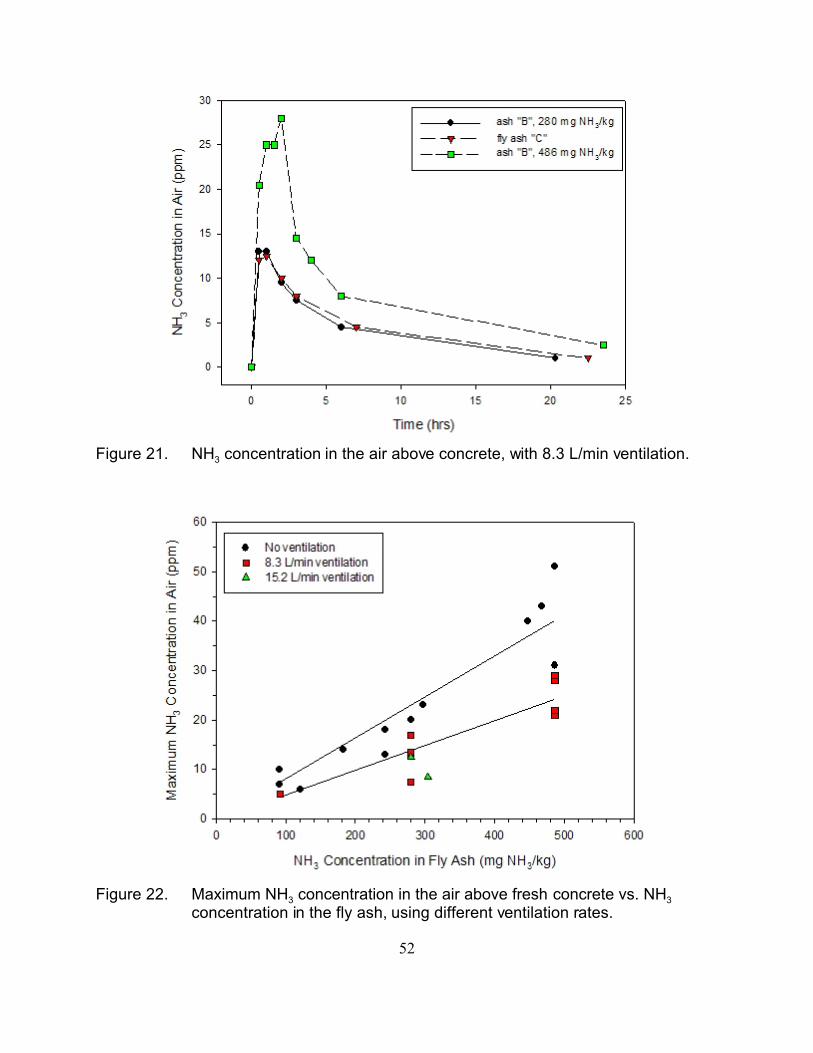
52
Figure 21. NH3 concentration in the air above concrete, with 8.3 L/min ventilation.
Figure 22. Maximum NH3 concentration in the air above fresh concrete vs. NH3
concentration in the fly ash, using different ventilation rates.
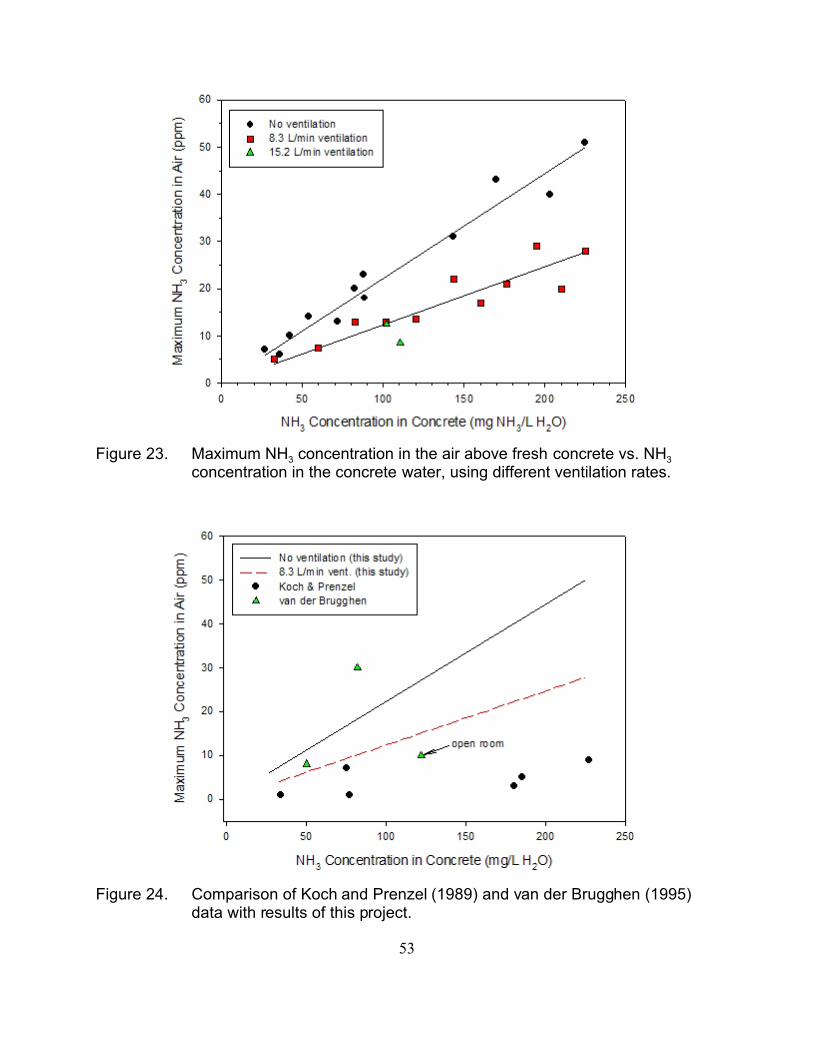
53
Figure 23. Maximum NH3 concentration in the air above fresh concrete vs. NH3
concentration in the concrete water, using different ventilation rates.
Figure 24. Comparison of Koch and Prenzel (1989) and van der Brugghen (1995)data with results of this project.
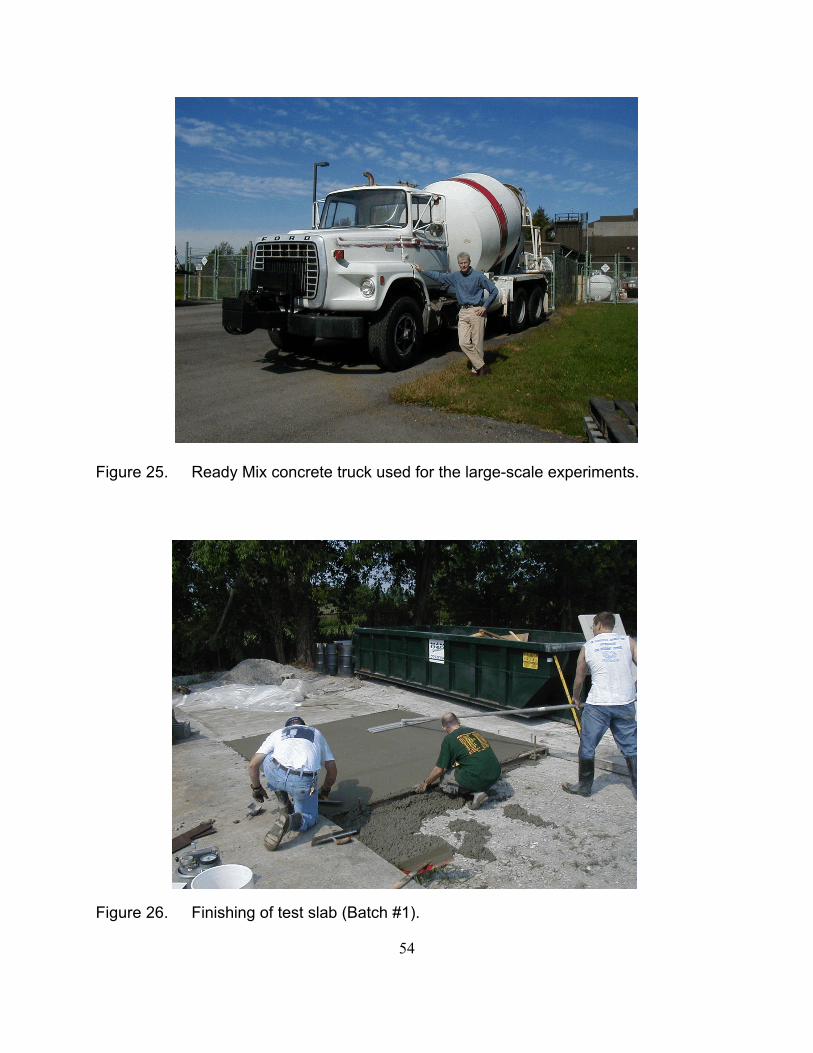
54
Figure 25. Ready Mix concrete truck used for the large-scale experiments.
Figure 26. Finishing of test slab (Batch #1).
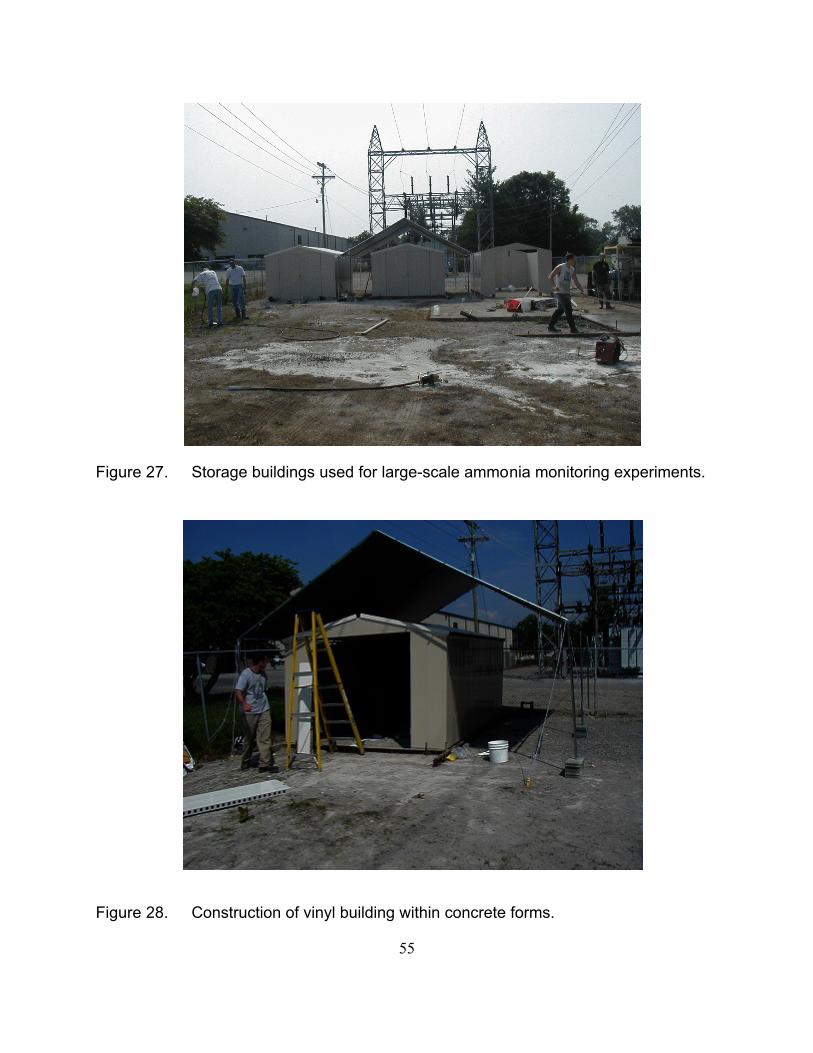
55
Figure 27. Storage buildings used for large-scale ammonia monitoring experiments.
Figure 28. Construction of vinyl building within concrete forms.
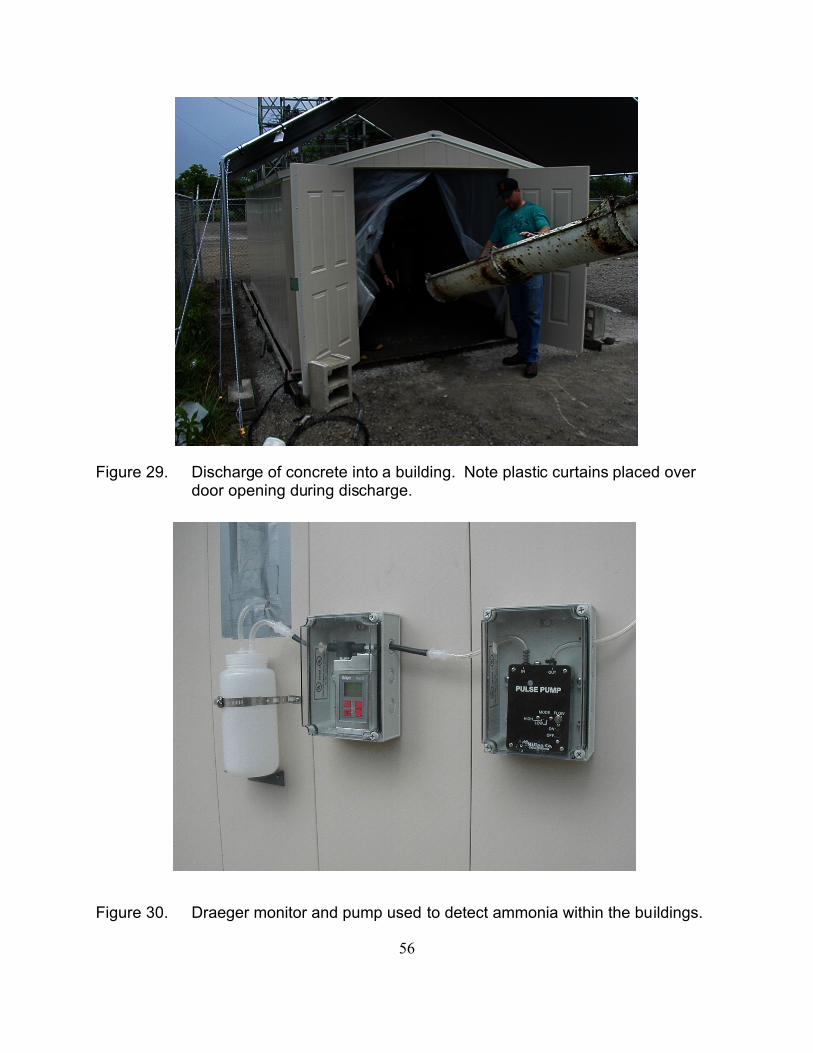
56
Figure 29. Discharge of concrete into a building. Note plastic curtains placed overdoor opening during discharge.
Figure 30. Draeger monitor and pump used to detect ammonia within the buildings.
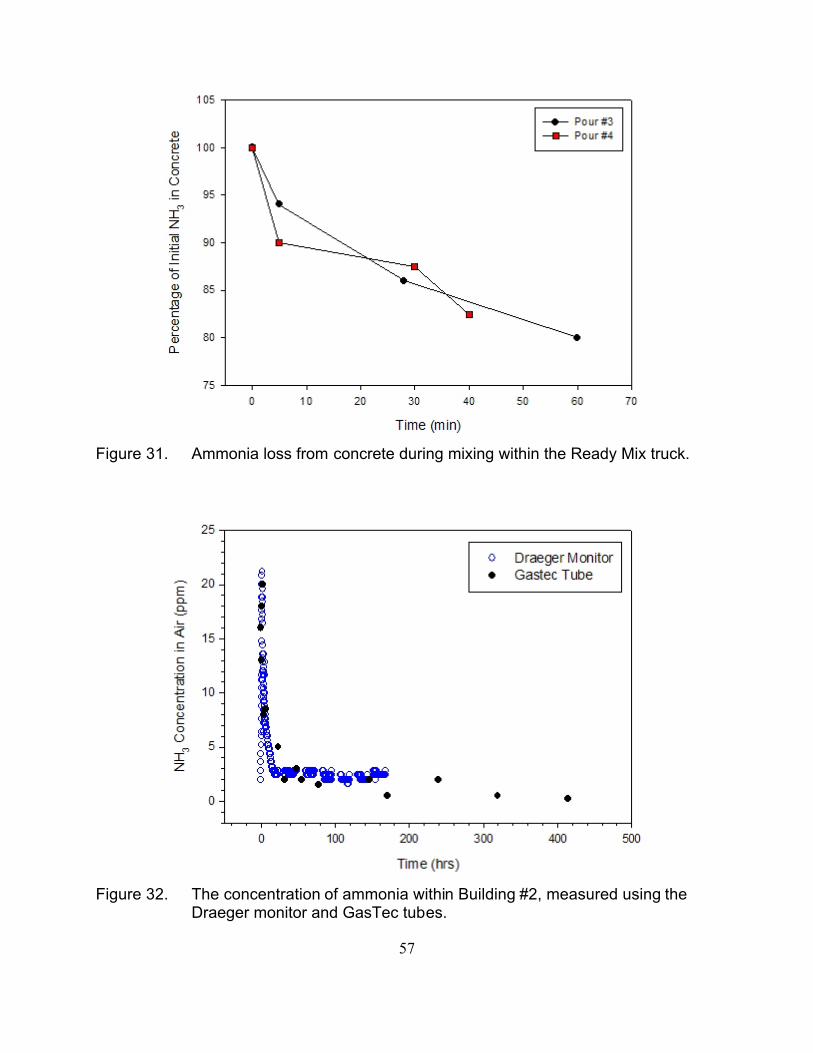
57
Figure 31. Ammonia loss from concrete during mixing within the Ready Mix truck.
Figure 32. The concentration of ammonia within Building #2, measured using theDraeger monitor and GasTec tubes.
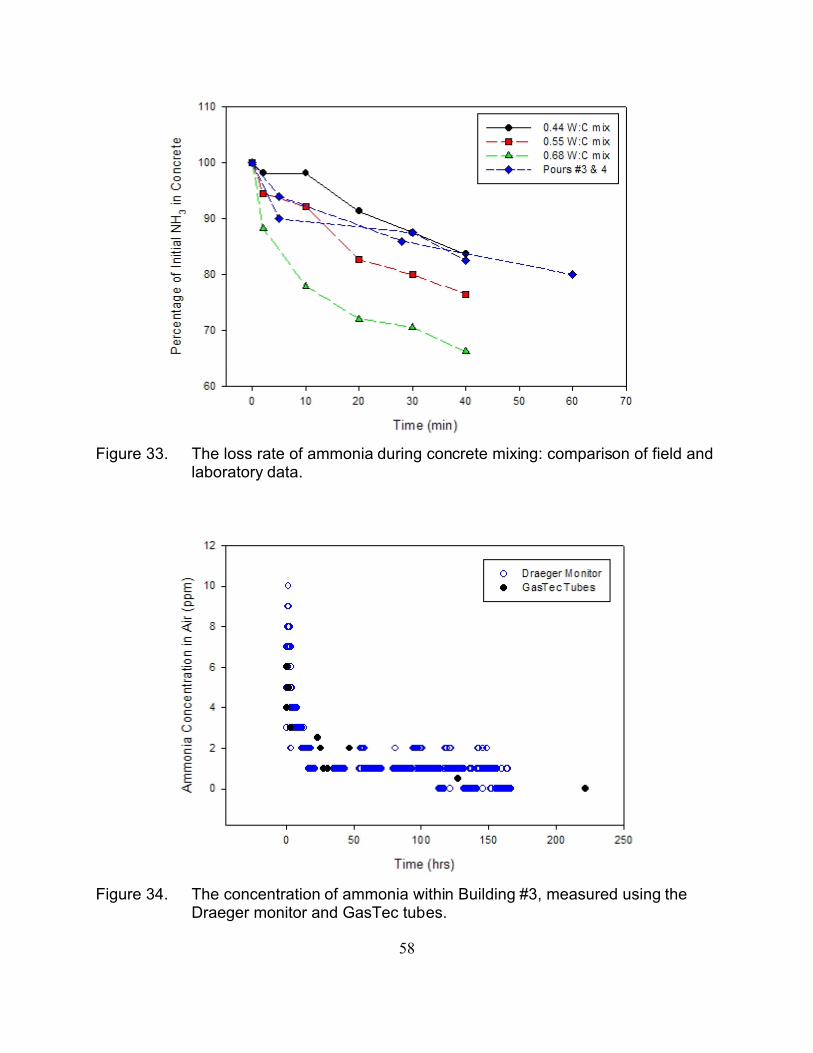
58
Figure 33. The loss rate of ammonia during concrete mixing: comparison of field andlaboratory data.
Figure 34. The concentration of ammonia within Building #3, measured using theDraeger monitor and GasTec tubes.
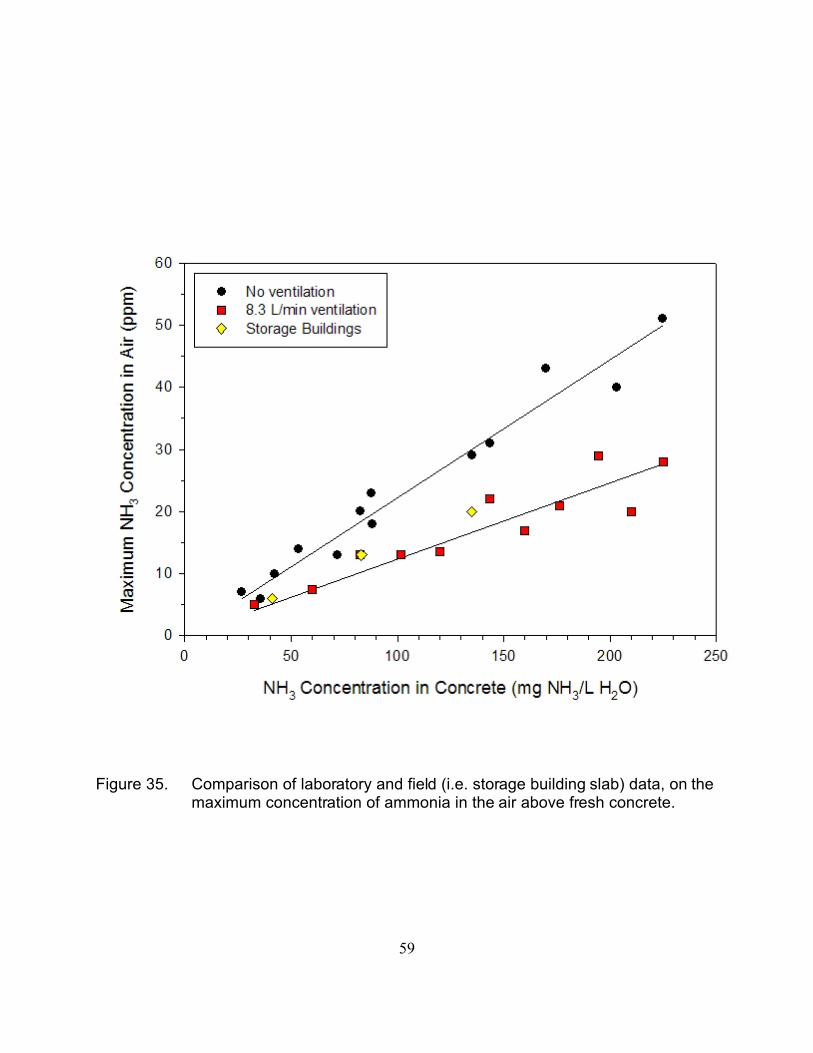
59
Figure 35. Comparison of laboratory and field (i.e. storage building slab) data, on themaximum concentration of ammonia in the air above fresh concrete.
60
APPENDIX
Evaluation of Ammonia Measurement Techniques and Validation of ExperimentalMethods Used in This Study
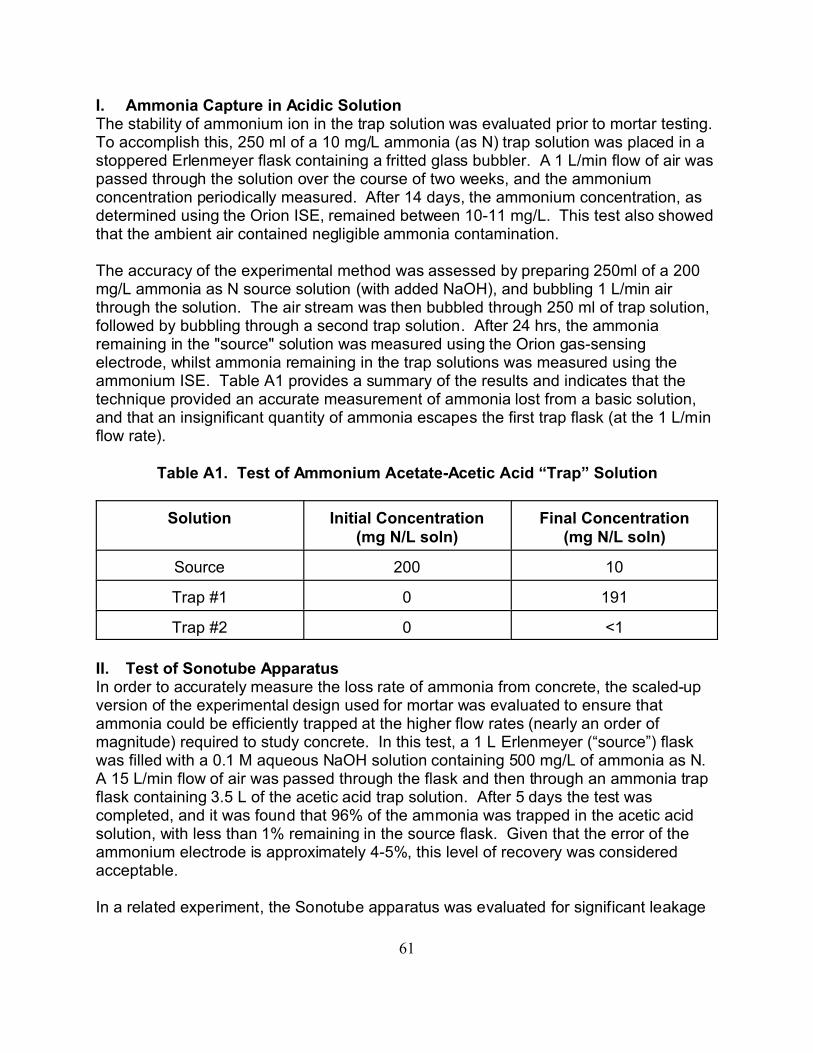
61
I. Ammonia Capture in Acidic SolutionThe stability of ammonium ion in the trap solution was evaluated prior to mortar testing. To accomplish this, 250 ml of a 10 mg/L ammonia (as N) trap solution was placed in astoppered Erlenmeyer flask containing a fritted glass bubbler. A 1 L/min flow of air waspassed through the solution over the course of two weeks, and the ammoniumconcentration periodically measured. After 14 days, the ammonium concentration, asdetermined using the Orion ISE, remained between 10-11 mg/L. This test also showedthat the ambient air contained negligible ammonia contamination.
The accuracy of the experimental method was assessed by preparing 250ml of a 200mg/L ammonia as N source solution (with added NaOH), and bubbling 1 L/min airthrough the solution. The air stream was then bubbled through 250 ml of trap solution,followed by bubbling through a second trap solution. After 24 hrs, the ammoniaremaining in the "source" solution was measured using the Orion gas-sensingelectrode, whilst ammonia remaining in the trap solutions was measured using theammonium ISE. Table A1 provides a summary of the results and indicates that thetechnique provided an accurate measurement of ammonia lost from a basic solution,and that an insignificant quantity of ammonia escapes the first trap flask (at the 1 L/minflow rate).
Table A1. Test of Ammonium Acetate-Acetic Acid “Trap” Solution
Solution Initial Concentration(mg N/L soln)
Final Concentration(mg N/L soln)
Source 200 10
Trap #1 0 191
Trap #2 0 <1
II. Test of Sonotube ApparatusIn order to accurately measure the loss rate of ammonia from concrete, the scaled-upversion of the experimental design used for mortar was evaluated to ensure thatammonia could be efficiently trapped at the higher flow rates (nearly an order ofmagnitude) required to study concrete. In this test, a 1 L Erlenmeyer (“source”) flaskwas filled with a 0.1 M aqueous NaOH solution containing 500 mg/L of ammonia as N. A 15 L/min flow of air was passed through the flask and then through an ammonia trapflask containing 3.5 L of the acetic acid trap solution. After 5 days the test wascompleted, and it was found that 96% of the ammonia was trapped in the acetic acidsolution, with less than 1% remaining in the source flask. Given that the error of theammonium electrode is approximately 4-5%, this level of recovery was consideredacceptable.
In a related experiment, the Sonotube apparatus was evaluated for significant leakage
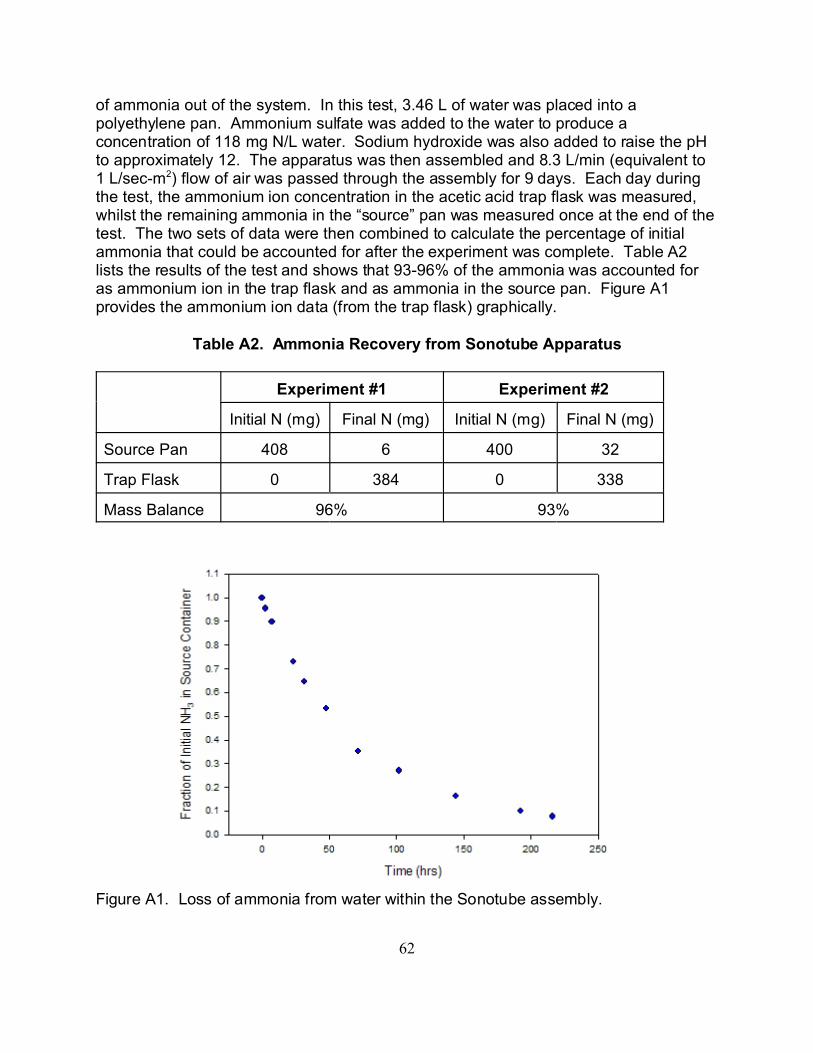
62
of ammonia out of the system. In this test, 3.46 L of water was placed into apolyethylene pan. Ammonium sulfate was added to the water to produce aconcentration of 118 mg N/L water. Sodium hydroxide was also added to raise the pHto approximately 12. The apparatus was then assembled and 8.3 L/min (equivalent to1 L/sec-m2) flow of air was passed through the assembly for 9 days. Each day duringthe test, the ammonium ion concentration in the acetic acid trap flask was measured,whilst the remaining ammonia in the “source” pan was measured once at the end of thetest. The two sets of data were then combined to calculate the percentage of initialammonia that could be accounted for after the experiment was complete. Table A2lists the results of the test and shows that 93-96% of the ammonia was accounted foras ammonium ion in the trap flask and as ammonia in the source pan. Figure A1provides the ammonium ion data (from the trap flask) graphically.
Table A2. Ammonia Recovery from Sonotube Apparatus
Experiment #1 Experiment #2
Initial N (mg) Final N (mg) Initial N (mg) Final N (mg)
Source Pan 408 6 400 32
Trap Flask 0 384 0 338
Mass Balance 96% 93%
Figure A1. Loss of ammonia from water within the Sonotube assembly.
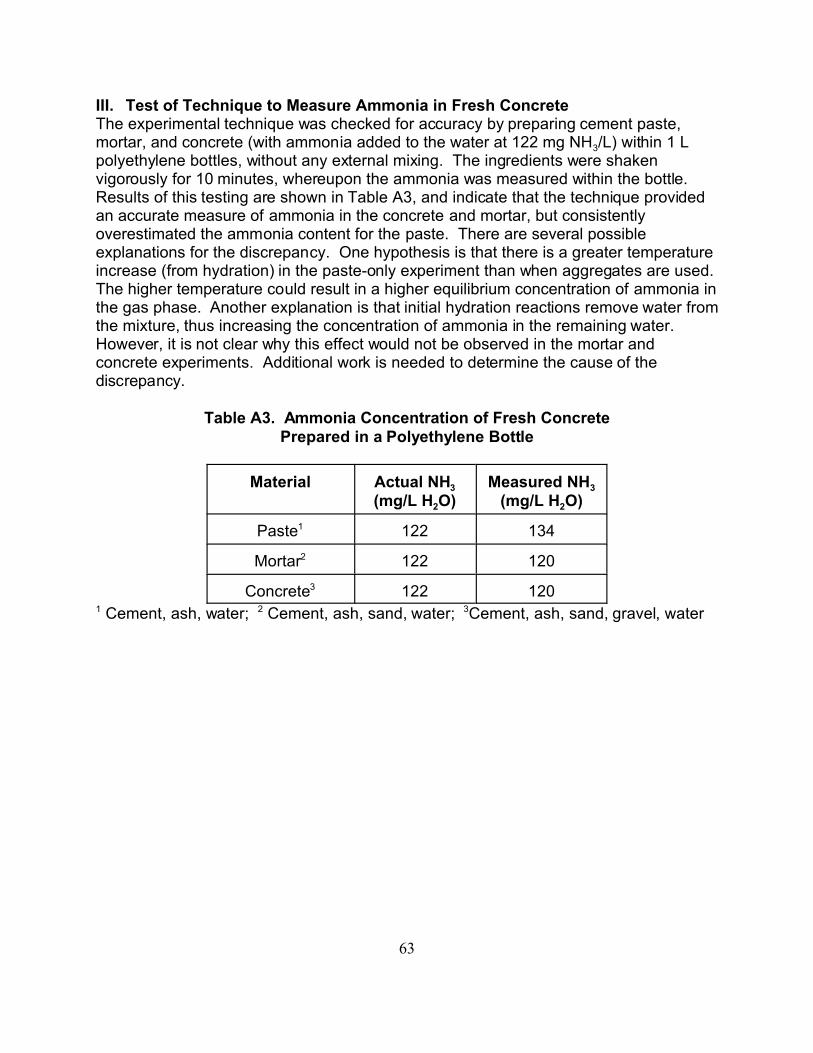
63
III. Test of Technique to Measure Ammonia in Fresh ConcreteThe experimental technique was checked for accuracy by preparing cement paste,mortar, and concrete (with ammonia added to the water at 122 mg NH3/L) within 1 Lpolyethylene bottles, without any external mixing. The ingredients were shakenvigorously for 10 minutes, whereupon the ammonia was measured within the bottle. Results of this testing are shown in Table A3, and indicate that the technique providedan accurate measure of ammonia in the concrete and mortar, but consistentlyoverestimated the ammonia content for the paste. There are several possibleexplanations for the discrepancy. One hypothesis is that there is a greater temperatureincrease (from hydration) in the paste-only experiment than when aggregates are used. The higher temperature could result in a higher equilibrium concentration of ammonia inthe gas phase. Another explanation is that initial hydration reactions remove water fromthe mixture, thus increasing the concentration of ammonia in the remaining water. However, it is not clear why this effect would not be observed in the mortar andconcrete experiments. Additional work is needed to determine the cause of thediscrepancy.
Table A3. Ammonia Concentration of Fresh ConcretePrepared in a Polyethylene Bottle
Material Actual NH3
(mg/L H2O)Measured NH3
(mg/L H2O)
Paste1 122 134
Mortar2 122 120
Concrete3 122 1201 Cement, ash, water; 2 Cement, ash, sand, water; 3Cement, ash, sand, gravel, water