Embed Size (px)
Citation preview

A study of the effects of diet on human gut microbial community structure and mercury
metabolism
A thesis submitted to the
Faculty of Graduate and Postdoctoral studies
In the partial fulfillment of the Requirements
For the Degree of Masters
In the Environmental sustainability Graduate Program
Institute of Environment/Faculty of Biology
University of Ottawa
Ottawa, Canada
By
RIA SAHA
Supervisors: Dr. Alexandre Poulain & Prof. Laurie Chan
© Ria Saha, Ottawa, Canada, 2017
II
Table of Contents:
Abstract…………………………………………………………………………………….…. IV
List of Figures……………………………………………………………………………….…VI
List of Tables………………………………………………………………………………....VIII
List of Abbreviations…………………………………………………………………………..IX
Acknowledgements…………………………………………………………………………….XI
Introduction…………………………………………………………………………………….11
Literature review
Microbial ecology of human gastrointestinal tract……………………………………….13
Gut environment……………………………………………………………………………17
Human gut flora and diet…………………………………………………………………..17
Specific foods………………………………………………………………………………..20
Dietary pattern……………………………………………………………………………...21
Food constituents…………………………………………………………………………...23
Mercury and its compounds………………………………………………………………..27
Methylmercury toxicity……………………………………………………………………..29
Developmental neurotoxicity…………………………………………..…………………...29
Mechanisms of transport and metabolism of MeHg………………………..…………….31
Methylmercury and gut microbiota…………………………………………………...…...33
Genetic basis for mercury methylation………………………………………….……...….36
Biochemical mechanisms of bacterial resistance to methylmercury……………………..39
Effects of different diets on Hg metabolism…………………………………………….....40
Materials and Methods
Experimental design………………………………...………………………………………41
Sample collection-Microbiota source………………………………………………………42
In vitro lower gastrointestinal fermentation………………………………………………42
Substrate used for fermentation: Source and preparation……………………………….43
16s rRNA gene sequencing and processing………………………………………………..45

III
Bioinformatics and statistics………………………………………………………………46
Determination of total mercury and MeHg in human fecal samples……………………....47
Reagents………………………………………………………………………………..........47
Extraction of methylmercury……………………………………………………..…….....47
Analysis…………………………………………………………………………..………….48
Acid extraction of methylmercury……………………………………………..………….48
Results and discussion
Richness and diversity in the active fecal microbiota across the samples……………….49
Taxonomy based comparison of fecal microbiota at the phylum and species level
across the samples…………………………………………………………………………...51
Association between gut microbiota and Hg transformation…………………………….55
Discussion……………………………………………………………………………………….59
Significance of research………………………………………………………………………..60
List of References………………………………………………………………………………62
Appendix A……………………………………………………………………………………..77

IV
Abstract:
Background: Recent research showing how dietary interventions substantially influence the
potential presence of widespread and stable bacterial core phyla in the human colon has garnered
a considerable amount of attention. Because the human gut can play a major role in host health,
there is currently some interest in observing how diet influences human gut microbial
composition and how changes in diet affect the potential for gut microbiota to transform
mercury.
This study aims to discover how different kinds of diet affect the nature and magnitude of
microbial Hg transformations in the human gut environment.
Methods: Fecal samples have been collected from 5 human male individuals at University of
Ottawa and stored at -80ºC for further investigation. Using high throughput DNA amplicon
sequencing targeting the 16s rRNA V4 region, we investigated the microbial community
structure of the gut in 5 healthy male. Mercury biotransformations in the pooled fecal sample
have been carried out using stable isotopes of mercury (198HgCl2 and Me199HgCl) and analysis
was conducted by using inductively coupled plasma mass spectrometry (ICP-MS).
Results and conclusions: We were not able to detect any significant Hg methylation or MeHg
demethylation. We suspect this is due to Enterobacteria dominating the microbial community
structure after 96h; Although Enterobacteria are part of the typical microbiota of a healthy
individual, they do not possess genes required for Hg methylation. As such, our microbial data
support our chemical analyses. We were not able to identify whether a change in diet affected Hg
transformations in the human gut environment.
Keywords: Mercury (Hg), gut microbiota, transformation

V
Résumé:
Contexte: Des recherches récentes montrant comment les interventions alimentaires influent de
manière substantielle sur la présence potentielle de phylum de base bactérienne répandue et
stable dans le côlon humain ont attiré beaucoup d'attention. Parce que l'intestin humain peut
jouer un rôle majeur dans la santé de l'homme, il existe actuellement un certain intérêt à observer
comment le régime influence la composition microbienne de l'intestin humain et la façon dont
les changements dans le régime affectent le potentiel du microbiote intestinal de transformer le
mercure.
Cette étude vise à découvrir comment les différents types de régime affectent la nature et
l'ampleur des transformations microbiennes de Hg dans l'environnement intestinal humain.
Méthodes: Des échantillons de matières fécales ont été recueillis auprès de 5 individus humains
humains à l'Université d'Ottawa et stockés à -80 ° C pour une enquête plus. En utilisant un
séquençage d'amplicon d'ADN à haut débit ciblant la région V4 de l'ARNr de 16s, nous avons
étudié la structure de la communauté microbienne de l'intestin chez 5 individus masculins en
bonne santé à l'Université d'Ottawa. Les biotransformations de mercure dans l'intestin humain
ont été réalisées à l'aide d'isotopes stables de mercure (198HgCl2 et Me199HgCl) et l'analyse a
été réalisée en utilisant ICP-MS.
Résultats et conclusions : Cependant, nous n'avons pas été en mesure de détecter une
méthylation d’Hg significative ou une déméthylation de MeHg. Nous soupçonnons que cela est
dû aux entérobactéries dominant la structure de la communauté microbienne après 96h; bien que
les entérobactéries appartiennent au microbiota typique d'un individu sain, elles ne possèdent pas
des gènes requis pour la méthylation de l’Hg. En tant que telles, nos données microbiennes
supportent nos analyses chimiques. Nous n'avons pas été en mesure d'identifier si une
modification du régime a affecté les transformations d’Hg dans l'environnement intestinal
humain.
Mots clés : Mercure (Hg), microbiote intestinal, transformation

VI
List of Figures
Figure 1: Genus abundance variation box plot for the 30 most abundant genera of the human gut
microbiota as determined by metagenomics sequencing of human fecal
samples………………………………………………………………………………………15
Figure 2: Human health is influenced by interactions among the gut microbiota, the host and the
environment………………………………………………………………………………..16
Figure 3: Schematic diagram of the gut microbial ecosystem…………………………………..20
Figure 4: Factors which influence the composition of the gut microbiota, with special focus on
diet…………………………………………………………………………………………22
Figure 5: Biogeochemical cycle of mercury…………………………………………………….28
Figure 6: The mercury geochemical cycle………………………………………………………37
Figure 7: Phylogenetic tree using amino acids sequences from all microorganisms with available
genome sequences containing HgcAB orthologues……………………...………………..38
Figure 8: The mer system……………………………………………………………………….40
Figure 9: Set of anaerobic batch culture………………………………………………………...45
Figure 10: Schematic description of the thiosulfate extraction of methylmercury and
analysis…………………………………………………………………………………….49
Figure 11: Shannon microbial diversity index………………………………………………….50
Figure 12: Rarefaction curve for species richness………………………………………………51
Figure 13: Relative abundance of bacterial communities……………………………………….52
Figure 14: Weighted UniFrac analysis………………………………………………………….54
Figure 15: Unweighted Unifrac Analysis……………………………………………………….55
Figure 16: Rate of methylation………………………………………………………………….57

VII
Figure 17: Rate of demethylation……………………………………………………………….58
Figure S1: The relative abundance of major (top 10) taxonomic groups at family levels across
all treatments ……………………………………………………………………………….81

VIII
List of Tables
Table 1: Methylmercury synthesis by intestinal bacteria………………………………………34
Table 2: Effect of age and diet on Me-Hg demethylation by mouse caecal and human fecal
suspensions………………………………………………………………………………….35
Table 3: Major dietary components of three diets……………………………………….……...41
Table 4: Anaerobic batch culture feed-Nutrient solution……………………………………….44
Table 5: Primer sequences for 16s rRNA gene amplification and sequencing…………………46
Table S1: Comparison of microbial diversity estimation of the 16s rRNA gene libraries at 3%
dissimilarity from Illumina sequencing analysis ……………………………….…………80
IX
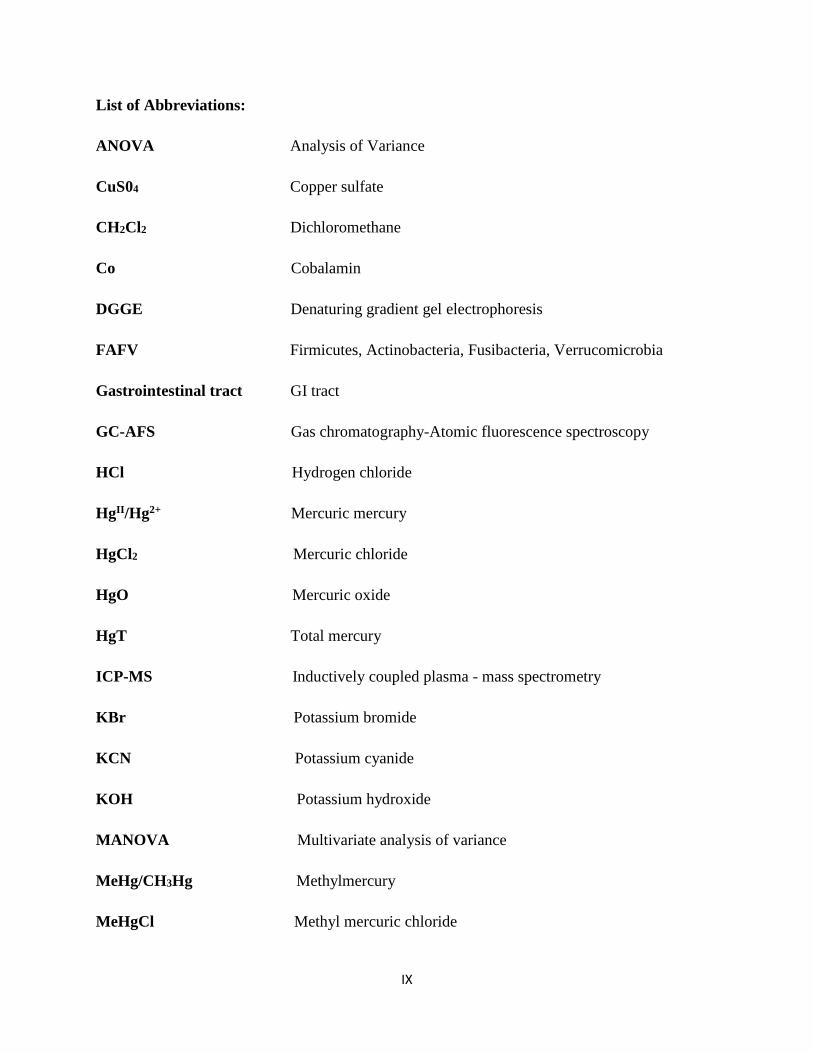
List of Abbreviations:
ANOVA Analysis of Variance
CuS04 Copper sulfate
CH2Cl2 Dichloromethane
Co Cobalamin
DGGE Denaturing gradient gel electrophoresis
FAFV Firmicutes, Actinobacteria, Fusibacteria, Verrucomicrobia
Gastrointestinal tract GI tract
GC-AFS Gas chromatography-Atomic fluorescence spectroscopy
HCl Hydrogen chloride
HgII/Hg2+ Mercuric mercury
HgCl2 Mercuric chloride
HgO Mercuric oxide
HgT Total mercury
ICP-MS Inductively coupled plasma - mass spectrometry
KBr Potassium bromide
KCN Potassium cyanide
KOH Potassium hydroxide
MANOVA Multivariate analysis of variance
MeHg/CH3Hg Methylmercury
MeHgCl Methyl mercuric chloride

X
Na2S2O3 Sodium thiosulfate
NaBEt4 Sodium tetraethylborate
ND Non-digestible
NPSHS Non-protein sulfhydryl compounds
PBS Phosphate buffered saline
PCA/PCoA Principal coordinate analysis
PC Principal coordinate
PCR Polymerase chain reaction
QIIME Quantitative insights into microbial ecology
RS Resistant starch
SCFA Short chain fatty acid
SH Sulfhydryl
SHIME Simulated Human Intestinal Microbial Ecosystem
Vit Vitamin

XI
Acknowledgements:
I would like to gratefully acknowledge various people who have been journeying with me in
recent years as I have worked on this thesis.
I would like to thank my supervisors, Dr. Alexandre Poulain and Prof. Laurie Chan, for taking
me on as a student. They were extremely helpful throughout the year of my research. Their
advice on scientific research and writing has helped me advance both my knowledge and my
confidence in the field.
The students and staff at the Institute of Environment/Faculty of Biology have provided me with
ongoing support, and technical assistance throughout my degree program. Thank you for always
scheduling around my lab work.
I would like to thank Mr. Galen Guo, Mr. Matti Ruuskanen, Dr. Dipak Rana and Dr. Emmanuel
Yumvihoze - four incredibly intelligent persons who guided me through the process of my
project. They taught me how to conduct experiments, provided me with resources, and answered
countless questions.
Finally, my thesis would not have been completed without the long distance support of my
family. Without their love and support over the years, none of this would have been possible.
They have always been there for me and I am thankful for everything they have helped me to
achieve.
Thank you!

1
Introduction:
Increasing evidence shows that varied nutrient loads and nutritional ingredients influence the
microbial community structure and production of metabolites by gut microbiota, which has also
been shown to be involved in mercury toxicity (Landry et al., 1979). The exact mechanism(s)
are, thus far, unclear. Microbes modulate the toxicity of mercury (Hg) through methylation of
mercuric mercury (HgII) and demethylation (i.e. detoxification) of methylmercury (MeHg).
(Barkay et al., 2003; Glimour et al., 2013; Parks et al., 2013; Smith et al., 2015). MeHg is
completely absorbed from the mammalian gut rapidly and this is one of the unusual
characteristics of toxic heavy metals (Miettinen et al., 1971; Walsh et al., 1988). The distal gut
harbors greater than 1011-1012 organisms per ml of luminal content, making it one of the most
densely populated ecosystems and an important reservoir for Hg cycling and MeHg metabolism
(Rotherburg et al., 2015). Several in vivo and in vitro studies have confirmed gut microbiota and
different diet modulate enterohepatic cycling of MeHg and its absorption into tissues. Animals
treated with antibiotics have shown a reduced decomposition of MeHg in the large intestine
compared to controls (Seko et al., 1981), and an increase in the half-time of MeHg elimination
(Rowland et al., 1984), thus implicating gut microbes in MeHg metabolism. Several public
health studies highlighted the role of diet in influencing Hg absorption and/or toxicity. Studies by
Passos et al. (2007) and Rowland et al. (1983, 1986) identified that co-consumption of high fibre
foods, including wheat and fruit, were associated with lower absorption of MeHg into tissues.
Microbial MeHg detoxification involves two primary microbial genes which are, MerA, the
mercuric reductase, and MerB, the organomercurial lyase (Barkay et al., 2003). Genes encoding
these proteins have been successfully recovered from human and non-human primate feces,
further verifying potential decomposition of Hg species by gut microbiota (Liebert et al., 1997).
Gut microbes are potential microrganisms responsible for methylation of Hg. Until now, one
commensal methanogen (Methanomassiliicoccus luminyensis) has been isolated from human
feces (Dridi et al., 2012) containing the gene cluster (HgcA and HgcB) responsible for Hg
methylation (Parks et al., 2013). However, intestinal bacterial methylation was observed by some
researchers (Rowland et al., 1975), but not others (Zhao, 2013). Despite the recognition that diet
and nutrition can influence a population’s susceptibility to the effects of MeHg (NRC, 2000),
dietary information has not been systematically collected and studied in most epidemiological
studies examining the effects of MeHg exposure (Chapman and Chan, 2000). Although a number

2
of controlled experiments estimated the effects of specific nutrients on Hg absorption and/or
toxicity (Calabrese, 1978; Levander and Cheng, 1980; Imura and Naganuma, 1985; Whanger,
1992; Peraza et al., 1998; Lapina et al., 2000; Rao et al., 2001; Rao and Sharma, 2001; Usuki et
al., 2001; Afonne et al., 2002), in vitro studies determining the role of diet affecting Hg
metabolism in free living populations are rare.
Due to these microbiota-host and diet interactions, strategies using dietary interventions
can be used to tackle, prevent or even treat worldwide epidemics related to mercury toxicity. To
this end, more information is required on how dietary compounds differently and rapidly affect
the composition and activity of the gut microbiota affecting Hg metabolism.
Studies performed in humans are the ideal way to assess these effects. However, studies
involving human subjects are limited due to ethical concerns, difficulties in sampling and are
usually very expensive (Aguirre et al., 2015). An alternative is to perform in vitro studies, which
in addition, offer certain advantages like reproducibility assessment studies where the potential
lethality restricts in vivo testing including toxicity of metals (e.g. mercury, arsenic, cadmium,
chromium, lead, etc.), and biotransformation of drugs or toxic compounds (e.g., polycyclic
aromatic hydrocarbons (PAHs), polynuclear aromatic hydrocarbons (PNAs), etc.) on the gut
microbiota.
This pilot study involves the collection of freshly voided fecal samples from five healthy
human individuals because human feces are considered as the largest reservoir of human gut
microbiota. The batch fermentation system is developed by the Chan and Poulain Laboratories,
and represents a powerful, reproducible and validated tool for monitoring fermentation of dietary
compounds using human feces as inoculums. It is accompanied by assessment of modulation of
mercury toxicity by gut microbiota. The overarching hypothesis of this project is that diet affects
the nature and magnitude of microbial Hg transformations in the human gut environment.
Using in vitro studies, we made the following predictions:

3
1. The microbial community of human gut microbiota in batch culture will undergo
changes upon dietary interventions within 4 days
2. A high carbohydrate diet will increase the relative abundance of targeted microbial
communities like Bifidobacteria, Firmicutes, Actinobacteria, Bacteroidetes, and
Methanoarchea (carbohydrate fermenters)?
3. Cultures provided with high protein on low fat/plant polysaccharides will exhibit
high proportions of Bacteroides spp.
4. Diets supplemented with a high amount of fat will exhibit high amounts of
Proteobacteria, and Fusobacteria
5. Diets low in polysaccharide (mainly enriched with sulfated mucins, and glycans) will
increase the Bacteroides spp. encoding sulfatases that are accompanied by
significantly higher proportional levels of Desulfovibrio spp., this species is
commonly known sulfate reducing bacteria (SRB) that colonizes the human gut
6. Methylmercury transformations will be modulated by changes in diet due to
changes to the microbial community of the gut
LITERATURE REVIEW:
Microbial ecology of human gastro-intestinal tract:
Gut microbiota are a part of the human gastrointestinal tract, a complex ecological community
that carries a diverse and abundant group of microorganisms. Human gut microbiota is a key
component in maintaining gastrointestinal tract (GI tract) homeostasis (Tap et al., 2009).
Microbes can have a widespread impact on diverse aspects of a host’s physiology from the
effects on the host’s digestive tract and its metabolism and host’s immune status and function
(Sommer and Bäckhed, 2013). Microbiota harbor complex consortia of micro-organisms, which
colonize the length of the gut (Steer et al., 2000). The human gut functions as a chemostat, a
continuous culture system for microorganisms (mostly bacteria) in which fresh nutrients enter
the system and cultured microorganism leave at a constant rate (Sonnenburg et al., 2004). The
human intestinal microbiota is composed of 1013 to 1014 microorganisms whose collective
genome (“microbiome”) outnumbers the genes of the human genome by a factor of 100 times
(Gill et al., 2006). Host digestive physiology, including the pH of the gut and the presence of bile

4
acids, and components of the innate immune response, such as defensins and immunoglobulin A,
are what control the colonization of microbiota. This is done by imposing a selective pressure –
from early life that is which strains can colonize the gut (Hooper et al., 2012). At birth, the GI
tract essentially remains germ free, with initial colonisation occurring during birth or shortly
afterwards (Steer et al., 2000). The composition of the microbiota undergoes substantial changes
at three stages in life: from birth to weaning; from weaning to attaining a normal diet; and at old
age, a relatively stable climax community is established (Flint et al., 2012). Facultative
anaerobes initially colonize the gut during birth (Eggesbø et al., 2011). Colonization of these
anaerobes creates an anaerobic condition that promotes the growth of obligate anaerobes
(initially Bifidobacterium and Bacteroides spp.) within about two weeks (Flint et al., 2012).
Naturally born infants become inoculated (Koenig et al. 2011; Marathe et al. 2012) by the
mother’s vaginal or fecal microbiota during delivery (Karlsson et al., 2011), and those born by
caesarian section are initially colonized by bacteria from the environment and skin (Dominguez-
Bello et al., 2010). Sequence based characterization of 16S ribosomal RNA gene of the distal gut
and fecal microbiota published to date indicates that gut microbiota is highly selective in nature
(Gill et al., 2006). Around 90% of all taxa belong to two predominant phyla: Bacteroidetes and
Firmicutes. Other phyla in the human distal gut constitute Proteobacteria, Actinobacteria,
Fusobacteria, and Verrucomicrobia (Fig. 1) (Guarner, 2015). Improvements in different 16S
rRNA gene based enumerations and technologies like proteomics and metabolomics has
identified significant differences in diversity and function between healthy adults (Eckburg et al.,
2005; Ley et al., 2005). These differences may contribute to variations in normal physiology
between individuals or may predispose them to particular diseases (Gill et al., 2006). Microbial
abundance gradually increases from the stomach (<103 bacteria/g) towards the colon (1011
bacteria/g). The microbial communities that colonize different regions of the human gut
influence several aspects of health over a lifetime (Flint et al., 2012). In a healthy individual, a
vast majority of these microbes (10 to 100 trillion) reside in the GI tract, with the greatest
number inhabiting the distal gut (Gill et al., 2006). These microbes potentially contribute
nutrients and energy to the host via the fermentation of non-digestible dietary components in the
large intestine. This establishes a balance between the host’s metabolism and immune system
(Flint et al., 2012) (Fig. 2). In the small intestine, bacterial abundance and diversity are limited
due to fast transit time and digestive secretions such as bile acids (Steer et al., 2000). The

5
movement of gut content slows down in the lower part of the gut where sizeable microbial
populations are observed (about 106 CFU/ml) (Steer et al., 2000). Microbial populations can
attain a maximum level of 1012 CFU/g lumen contents (Conway, 1995; Gibson et al. 2000).
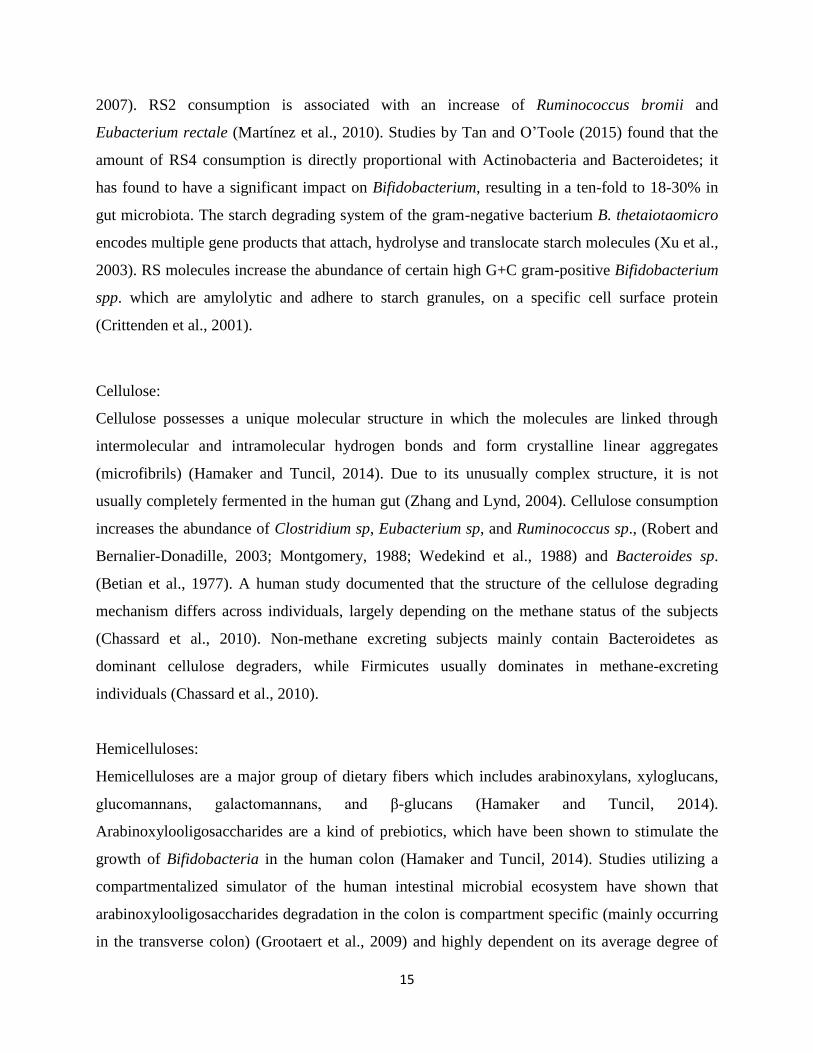
Figure 1: A genus abundance variation box plot for the 30 most abundant genera of the human
gut microbiota as determined by metagenomic sequencing of human fecal samples. Genera are
colored by their respective phylum (see inset for color key). The inset shows the phylum
abundance box plot. Genus and phylum level abundances were measured using reference-
genome-based-mapping. Source: Arumugum et al., 2011.
Although human microbiota varies significantly between individuals, family members
share more similar microbiota than non-related individuals (Marathe et al., 2012). The human GI

6
tract microbiota appeared to be dominated predominantly by very few selected phyla when
compared with other complex ecosystems such as soils and oceans (Cole et al., 2005).
Nonetheless, these are highly diverse and complex at the level of ‘phylotype’ (Tap et al., 2009).
The stability of the gut microbiota establishes ‘colonization resistance’ by limiting the capacity
of invading micro-organisms, including pathogens, to colonize the gut (Hentges, 1992). In a
healthy individual, the intestinal immune system exists in a state of homoeostasis with the
microbiota, thus reflecting the beneficial role of the gut microbiota and the evolution of
‘indigenous’ micro-organisms alongside their human host (Conway, 1995).
Figure 2: Human health is influenced by interactions among the gut microbiota, the host and the
environment. Source: Zhao, 2013.
Gut environment:
The gut environment varies markedly across different anatomical regions of the human host in
terms of physiology, digest a flow rates, substrate availability, host secretions, pH and oxygen

7
tension (Flint et al., 2012). The large intestine, which is characterized by slow flow rates and
neutral to mildly acidic pH, harbours by far the largest microbial community (dominated by
obligate anaerobes). Significant differences in gut environment occur between the proximal and
distal regions and, even more locally, between the gut lumen and surfaces (Flint et al., 2012).
The small intestine provides a challenging environment for microbial colonizers due to its fairly
short transit times (3-5 h) and high bile concentrations (Boojink et al., 2010; Zoetendal et al.,
2012). Colon pH varies from mildly acidic conditions in the proximal colon to more neutral pH
distally (Flint et al., 2012). pH values <6.0 at short chain fatty acids concentrations typical of the
colon limits the growth of Bacteroides spp. (50-100 mM) (Duncan et al., 2002). Firmicutes are
more tolerant of acidic pH, which provides them with a competitive advantage to colonize at low
pH, which results from active substrate fermentation (Flint et al., 2012). A substantial shift in
species composition and metabolic outputs of human intestinal microbiota has been observed
between a pH of 5.5-6.5 in an in vitro system (Walker et al., 2011).
Oxygen concentrations influence the spatial distribution of the microbiota in the human
gut (Swidsinki et al., 2008). Colonization of facultative anaerobes makes the colonic lumen
highly anaerobic (Eh of ~250 mV). This results because these anaerobes by consuming the
available oxygen (Flint et al., 2012). Most of the colonic bacteria are strictly anaerobes (like
Bacteroidetes, Proteobacteria, Firmicutes, etc.) that fail to grow in >5 × 10⁻³ atm oxygen (Flint et
al., 2012). Although most of the colonic microbiota are strict anaerobes, the growth of some
facultative anaerobes like Bacillus fragilis, and Faecalibacterium prausnitzii get stimulated by
very low concentrations of oxygen (Flint et al., 2007; Khan et al., 2012).
Human gut flora and diet:
Diet plays a crucial role in shaping the human gut microbiota. Different phenotypic analysis
(metabolomics) and compositional (metagenomics) assessments indicated that diet is a
fundamental driver of gut microbial diversity and stability. This arises between 2 and 4 years of
age (Lozupone and Knight, 2005). In recent times, interest in ‘optimizing’ the intestinal
microbiota composition by dietary modulation is gaining a considerable amount of attention
8
(Graf et al., 2015). Recent research showing how dietary interventions substantially influence the
potential presence of widespread and stable bacterial core phylogroups in the human colon has
made substantial progress in understanding and identifying the pivotal role of diet on shaping the
human gut. Dietary effects on gut microbiota and health are potentially confounded by a
variation in host genotypes and various environmental factors and exposures (Xu and Knight,
2014). Nevertheless, recent studies suggest that of all the exogenous factors affecting the gut
microbiome, a long term diet appears to have the largest impact to date (Xu and Knight, 2014).
For example, two co-evolution studies of mammals and their gut microbiota has found that both
gut microbiota composition and functions are adapted to their type of diet (herbivorous,
carnivorous and omnivorous) (Ley et al., 2008; Muegge et al., 2011). Microbial activities in the
large intestine are considered to play an important role in the maintenance of gut health and in
the etiology of gut disease in humans (Flint et al., 2007). Comparative analyses suggest that diet
is a major environmental factor contributing to gut microbial variation across mammalian species
(Muegge et al., 2011). Diet also shapes the gut microbiota within a species as evidenced by
longitudinal studies of the black howler monkey gut microbiota (Amato et al., 2013, 2015) and
dietary perturbation experiments in wild-caught mice and fish (Bolnick et al., 2014; Wang et al.,
2011). Zhao (2013) reported that 57% of variation in the composition of gut microbiota was
driven by dietary change, while only 12% was due to genetic differences (Zhang et al., 2010).
The impact of dietary changes upon microbial metabolism occurs through several inter-related
mechanisms (Fig. 3) (Louis et al., 2007). Metabolism is tightly regulated within each individual
species of gut bacterium (Flint et al., 2012). At a macroscopic level, however, the microbiota
support a common set of metabolic pathways assembled in a trophic chain common to all healthy
individuals (Macfarlane and Gibson, 1994). This typically follows a common metabolic pathway
across all individuals, involving fermentation of dietary compounds and endogenous substrates,
followed by host absorption and excretion of short chain fatty acids (SCFAs) (like acetate,
propionate, and butyrate) and gas (Tap et al., 2009). Alterations in dietary composition result in
both quantitative and qualitative changes in the supply of substrates to the large intestinal
microbiota (Louis et al., 2007). Alternative substrates can lead to the production of different
metabolic products as a result of fermentation via different metabolic pathways, while the same
substrates can be processed via different routes depending on their rate of supply, or the
physiological environment of the bacterial cell (Macfarlane and Macfarlane 2011; Scott et al.,

9
2006). Dietary components that do not undergo digestion by endogenous enzymes in the upper
gastrointestinal tract become available as substrates in the large intestine. Some of these dietary
components are ‘non-digestible’ (ND) dietary carbohydrate substrates which include resistant
starch, plant cell wall material and oligosaccharides (Cummings and Macfarlane, 1991). Many
secondary plant metabolites ingested with the diet, such as polyphenolic substances, may also
reach the large intestine and undergo bacterial transformations (Flint et al., 2012). The microbial
processes occurring in the gastrointestinal tract are heavily influenced by dietary ingredients,
such as, prebiotics (Grootaert et al., 2011) and probiotics, (Goldin, 2011), or by drugs, such as
antibiotics (Jernberg et al., 2010). Evidence from in vivo studies (monitored by fecal sampling)
with prebiotics (mainly oligofructose) suggest that sustained changes in the supply of ND dietary
carbohydrate can lead to shifts in the species composition of the colonic bacterial community
(Gibson et al., 2000). The need to control for dietary variation when evaluating microbial shifts
in composition is a priority in future research. However, there are several challenges and
limitations regarding this effort as human studies normally provide fecal samples which reflect
the microbiota of the distal colon, but do not allow access to the microbiota of the actual site of
food fermentation (caecum and proximal colon) (Graf et al., 2015). Further, human studies in
this field usually have low numbers of participants primarily due to ethical concerns and
participants differ significantly in their dietary behavior and life-styles (Graf et al., 2015). Pig
model systems that have similar gastrointestinal tracts and diets to humans and humanized germ
free mice provide comparative approaches for examining microbiota interactions with specific
diets (Tremaroli and Bäckhed, 2012). Though results from animal experiments cannot be
extrapolated directly to humans, they provide proof of concept and pave the way for further
research focusing on human dietary interventions. However, deeper mechanistic understanding
of diet’s role in host microbial function imminently depends on integrating in vitro and in vivo
models into a systems level framework for understanding the functional interactions between diet
composition, gut microbiota and host metabolism (Borenstein, 2012; Dimitrov, 2011).

10
Figure 3: Schematic diagram of the gut microbial ecosystem. Metabolic flows are shown with
solid arrows and other influences are shown with dashed arrows. Source: Louis et al., 2007.
In summary, the effects of dietary differences on gut microbial communities are discussed
below-
Specific foods-
Whole grain products:
Whole grain products are characterized by the presence of a high amount of dietary fibre (Graf et
al., 2015). Carvalho-Wells et al. (2010) reported increased levels of Bifidobacteria, and
Lactobacillus/Enterococcus group in the feces of volunteers who consumed maize-based whole
grain products, whole grain rich cereals and placebo cereals, respectively.

11
Vegetables and Legumes:
A growing body of scientific evidence indicates that dietary modulation, by ingestion of
prebiotics, such as soygerm powder which contains isoflavones (dietary anti-carcinogen), might
shift the microbial ecosystem toward higher concentrations of lactic acid–producing bacteria,
which may be beneficial for the host (Fooks et al., 1999; Fuller and Gibson 1997; Roberfroid,
1998). A study by Gibson et al. (2000) found that dietary modulation promotes colonic health by
lowering the gut pH of metabolic products.
Fruits and nuts:
Vendrame et al. (2011) reported an increased amount of Bifidobacterium spp. and Lactobacillus
acidophilus in feces of volunteers after a daily consumption of blueberry drink and placebo
treatment, respectively. Another study observed an increase in abundance of Bifidobacterium
genus after consumption of red berries (Queipo-Ortuño et al., 2012). The Mediterranean diet,
including relatively large intakes of vegetables, fruits, olive oil and nuts may increase the
proportions of Bifidobacterium, Enterococcus, Bacteroides and Prevotella and may decrease the
abundance of pathogens like Clostridium perfringens (Lopez-Legarrea et al., 2014). Tan and
O’Toole (2015) found that 30% of the gut microbial species underwent significant changes after
the administration of peanut based therapeutic food composed of health promoting beneficial
bacteria like Bifidobacterium, Lactobacillus, and Faecalibacterium prausnitzii.
Dietary pattern-
Western diet:
In Western countries people usually rely on diet which contains low fiber, high fat and refined
carbohydrates compared to a traditional rural diet which is generally high in fiber (Graf et al.,
2015) (Fig. 4). A study by Watanabe & Koessel (1993) indicates that consumers of a western
type diet have higher proportions of Clostridium perfringens and other bacteria strains with 7-a-
dehydroxylase activity. African children have increased amounts of Prevotella sp. compared to
European children and African Americans (De Filippo et al., 2010). Researchers (De Filippo et

12
al. 2010; Ou et al., 2013; Schnorr et al., 2014) reported that several African populations have
microbiota enriched with Succinivibrio and Treponema. European children who are fed a typical
western diet (De Flippo et al., 2010) are relying on a such a diet which harbors a significant over-
abundance of Firmicutes like Acetitomaculum and Feacalibacterium, as well as
Enterobacteriaceae (Shigella and Escherchia) (De Filippo et al., 2010).
Figure 4: Factors which influence the composition of the gut microbiota, with special focus on
diet. Source: Graf et al., 2015.
Vegetarian diet:
Vegetarian diet decreases the concentration and diversity of Clostridium cluster IV, which are
beneficial butyrate-producing bacteria (Listz et al., 2009). Matijašić et al. (2014) found increased
proportions of Bacteroides/Prevotella group, Bacteroides thetaiotaomicron, Clostridium
clostridioforme, and Faecalibacterium prausnitzii among vegetarians. Polymerase chain reaction
(PCR) with denaturing gradient gel electrophoresis (DGGE) finger printing analysis conducted
by Listz et al. (2009) revealed that vegetarians carry higher levels of Bacteroides and a lower

13
abundance of Clostridium cluster IV, especially Faecalibacterium sp. and Ruminococcus sp. as
compared to omnivores.
Food constituents-
Carbohydrates/Plant polysaccharides:
Both Bifidobacterium longum (Schell et al., 2002) and Bacteroides thetaiotaomicron (Xu et al.,
2003) dedicate at least 8% of their genomes to carbohydrate transport and metabolism functions.
Dietary fiber:
Plant derived foods carry high amounts of dietary fiber, such as resistant starch (RS), pectin,
oligosaccharides and inulin, most of which are utilized by intestinal bacteria (Eswaran et al.,
2013). Complex carbohydrates like dietary fiber are metabolized by the colonic microbiota to
simpler forms of oligosaccharides and monosaccharides. Oligosaccharides are then further
fermented to SCFA, which function both as an energy source and as a signalling molecule
(Bazzocco et al., 2008). Insoluble plant cell wall material consists of high amounts of cellulose,
arabinogalactan, xyloglucan, β-glucan, mannan, pectins and lignin (Louis et al., 2007). These
complex polymers are intimately associated in the plant cell wall, and are degraded by a cascade
of microbial hydrolases, esterases and lyases present in the human colon (Louis et al., 2007).
Diversity of the microbiota and their metabolic interactions are directly correlated with the
content and type of dietary fiber intake (Tremaroli et al., 2012). For instance, De Flippo et al.
(2010) found an increase in abundance of phylum Bacteroidetes, mainly Prevotella and
Xylanibacter in rural African children consuming diets with high amounts of fiber, starch, plant
polysaccharides with very low fat and animal protein. Rumen gut anaerobes like Ruminococcus
flavefaciens are responsible for plant cell wall degradation (Flint et al., 2007), but until now few
have been isolated from human fecal samples (Robert and Bernalier-Donadille, 2003).
Hemicelluloses and pectins which are present in the cell wall matrices are partially released in
the soluble form by the cell wall degrading gut bacteria (Flint et al., 2007). Flint et al., (2007)
showed that certain species of bacteria namely, Bacteroides ovatus, Prevotella bryantii, and
Roseburia intestinalis in the human colon can utilize complex substrates like xylans,
heterogeneous polymers of β-1, 4-linked xylose residues substituted with acetyl, arabinosyl and
14
glucuronic acid residues. Lactulose, a synthetic disaccharide, has been observed to stimulate the
bifidogenic activity in the human gut (Modler, 1994; Tuohy 2000; Tuohy et al., 2001; Ziemer
and Gibson, 1998). Populations in the Hadza community who are solely dependent on high fiber
foods for their diet have been found to have extensive amounts of Prevotella, Treponema and
unclassified Bacteroidetes, as well as a specific set of Clostridiales (Schnorr et al., 2014).
Pectin:
Pectin is composed of linear long chains of alpha- 1, 4 –linked galacturonic acid residues which
are known as smooth pectin or could be branched forming rhamnogalacturonans known as hairy
pectin (Flint et al., 2007). Since the structure of pectin varies across different sources of food, a
simple comparison of the impact of pectin-rich diets on microbiota composition usually yields
different results (Sajilata et al., 2006). For example, a 3 week study conducted by Dongowski et
al. (2002) noticed an increase in Bacteroides spp. in the colon of rats fed a diet containing 6.5%
citrus pectin, while a 4 week study with rats given a 7% apple pectin rich diet showed a higher
abundance of Anaeroplasma, Anaerostipes, and Roseburia, with a decrease in the number of
Alistipes and Bacteroides spp (Licht et al., 2010). Pectin from apple intake was observed to
increase the proportions of Bifidobacterium, Lactobacilli and Streptococcus while reducing
Enterobacteriaceae, Pseudomonas and some lecithinase-positive Clostridia sp. (Shinohara et al.,
2010).
Resistant starch:
Starch is made out of two distinctive glucose polymers, amylose and amylopectin, and a part of
these can pass undigested into the internal organ making a dietary fiber called resistant starch
(RS) (Hamaker and Tuncil, 2014). RS has four subgroups: (1) RS1, physically inaccessible
starch present in whole grains or partially milled grains and legumes; (2) RS2, tightly packed and
relatively dehydrated granular starch; (3) RS3 is a cooked and re-associated, or retrograded form
of starch (principally amylose) where host enzymes have limited access; and (4) RS4 is a
chemically or enzymatically modified starch (Sajilata et al., 2006). Due to their structural and
accessibility differences, different RS types within type favor different resident bacteria in the
human gut (Sajilata et al., 2006). The fraction of RS starch which does not get digested by the
host amylases, and reaches the colon to get metabolized by the colonic bacteria (Flint et al.,
15
2007). RS2 consumption is associated with an increase of Ruminococcus bromii and
Eubacterium rectale (Martínez et al., 2010). Studies by Tan and O’Toole (2015) found that the
amount of RS4 consumption is directly proportional with Actinobacteria and Bacteroidetes; it
has found to have a significant impact on Bifidobacterium, resulting in a ten-fold to 18-30% in
gut microbiota. The starch degrading system of the gram-negative bacterium B. thetaiotaomicro
encodes multiple gene products that attach, hydrolyse and translocate starch molecules (Xu et al.,
2003). RS molecules increase the abundance of certain high G+C gram-positive Bifidobacterium
spp. which are amylolytic and adhere to starch granules, on a specific cell surface protein
(Crittenden et al., 2001).
Cellulose:
Cellulose possesses a unique molecular structure in which the molecules are linked through
intermolecular and intramolecular hydrogen bonds and form crystalline linear aggregates
(microfibrils) (Hamaker and Tuncil, 2014). Due to its unusually complex structure, it is not
usually completely fermented in the human gut (Zhang and Lynd, 2004). Cellulose consumption
increases the abundance of Clostridium sp, Eubacterium sp, and Ruminococcus sp., (Robert and
Bernalier-Donadille, 2003; Montgomery, 1988; Wedekind et al., 1988) and Bacteroides sp.
(Betian et al., 1977). A human study documented that the structure of the cellulose degrading
mechanism differs across individuals, largely depending on the methane status of the subjects
(Chassard et al., 2010). Non-methane excreting subjects mainly contain Bacteroidetes as
dominant cellulose degraders, while Firmicutes usually dominates in methane-excreting
individuals (Chassard et al., 2010).
Hemicelluloses:
Hemicelluloses are a major group of dietary fibers which includes arabinoxylans, xyloglucans,
glucomannans, galactomannans, and β-glucans (Hamaker and Tuncil, 2014).
Arabinoxylooligosaccharides are a kind of prebiotics, which have been shown to stimulate the
growth of Bifidobacteria in the human colon (Hamaker and Tuncil, 2014). Studies utilizing a
compartmentalized simulator of the human intestinal microbial ecosystem have shown that
arabinoxylooligosaccharides degradation in the colon is compartment specific (mainly occurring
in the transverse colon) (Grootaert et al., 2009) and highly dependent on its average degree of
16
polymerization (Hamaker and Tuncil, 2014). Arabinoxylooligosaccharides with an average
degree of polymerization of 29 have been shown to increase the abundance of Bifidobacteria in
the ascending colon, lactobacilli in both ascending and transverse colons, and groups of
Clostridium coccoides–E. rectale in the descending colon (Sanchez et al., 2009). Studies with
humanized mice indicate that Arabinoxylan hydrolyzates with a degree of polymerization of 60
or higher, decreased the cecal abundance of Clostridium clusters I/XI/XV and Verrucomicrobia,
while significantly increasing cecal Actinobacteria (Van den Abbeele et al., 2011). The
molecular size of β-glucan is a significant predictor of colonization of bacterial groups in the
human gut. For example, an in vitro study inoculated with β-glucan hydrolyzates of molecular
masses 137, 150, and 172 kDa showed an increased abundance of the Bacteriodes– Prevotella
group at 24 h, but no significant increases were observed when provided with larger-size
hydrolyzates (230 and 243 kDa) (Hughes et al., 2008).
Inulin:
Inulin consumption results in increased abundance of butyrate producing bacteria like E. rectale,
Roseburia intestinalis, and Anaerostipes cacca (Barcenilla et al., 2000; Schwiertz et al., 2002;
Duncan et al., 2002), while decreasing the abundance of Akkermansia muciniphila in the cecum
of humanized rats (Van den Abbeele et al., 2011). Costabile et al. (2010) reported a significant
increase of Bifidobacterium, lactobacilli/enterococci among healthy volunteers upon inulin
consumption. Furthermore, this was also observed to increase the abundance of the Atopobium
group with a significant reduction of the Bacteroides/Prevotella group (Costabile et al., 2010).
Fat:
Human mediation information advances the idea that dietary fat, by implication, balances
intestinal microbiota arrangements. The dietary fat does this by means of its effect on bile acid
secretion and also on bile acid composition (Graf et al., 2015). Wu et al. (2011) reported that the
Bacteroides enterotype is positively correlated with the intake of saturated fats, while the
Prevotella enterotype is inversely associated with the total intake of dietary fat. A high fat diet in
a mouse model was observed to trigger the genes involved in signal transduction, cell motility,
17
membrane transport, replication and repair within the phyla of Proteobacteria, Bacteroidetes and
Firmicutes (Hildebrandt et al., 2009).
Proteins:
Russell et al. (2011) reported an increase in branched-chain fatty acids, a decrease in butyrate,
and a decrease in Roseburia/Eubacterium numbers after a 4-week period of protein diet given to
obese men. Doré and Blottière (2015) documented that a diet rich in animal proteins and fat,
which is typical of food intake in western societies, will favor the Bacteroides enterotype.
Foods associated commensal microbes- Prebiotics:
A prebiotic is a nonviable food segment that presents a medical advantage to the host by altering
the microbiota (AGNS, 2007). It acts as a modulator of the diversity of autochthonous
microbiota (Doré and Blottière, 2015). ND food ingredients like plant cell wall polysaccharides
(cellulose, xylan and pectin) have prebiotic properties that stimulate specific microbes to
improve metabolic regulation in the host body and are now increasingly being introduced into
the western diet (Murphy et al., 2013). Prebiotics, such as galactosaccharides, together with
inulin and their fructo-oligosaccharides derivatives, have shown to modify species composition
of the colonic microbiota (Macfarlane and Macfarlane, 2011). Buddington et al. (1996) reported
that consumption of fructo-oligosaccharide (FOS) (4 g/d), a prebiotic, produced an increase in
Bifidobacteria and Faecalibacterium prausnitzii (Ramirez-Farias et al., 2009) in human subjects
and this correlated with reduced adiposity. However, current prebiotic approaches are limited by
the steady supplementation with relatively low-complexity molecular structures, which have
been shown to promote only a limited set of specialist organisms (Doré and Blottière, 2015).
Mercury and its compounds:
Mercury (Hg) is a toxic metal, which is widely recognized as a global environmental pollutant
directly impacting human populations (Erickson and Lin, 2015). Hg is easily distributed in the
atmosphere in contrast with other ecological reservoirs, thereby empowering the dispersal and
movement of Hg globally (Driscoll et al., 2013). Hg which is released into the atmosphere by

18
human activities eventually gets deposited into aquatic bodies and terrestrial compartments
(Erickson and Lin, 2015) (Fig. 5). After getting deposited, inorganic Hg is transformed with
varying efficiencies to methylmercury (MeHg), which may subsequently be taken up by
organisms living in close contact with soils and sediments (Erickson and Lin, 2015). Sulfate and
iron reducing bacteria are the primary methylators of Hg, and to a lesser extent methanogens,
found in the anoxic zone of soils and sediments (Selin, 2009). MeHg is rapidly bioaccumulated
and biomagnified in aquatic systems. The utilization of fresh and saltwater fish represents the
essential means of MeHg exposure for humans (Driscoll et al., 2013).
Figure 5: Biogeochemical cycle of mercury. Source: Erickson and Lin, 2015.

19
Methylmercury toxicity:
MeHg is a potent neurotoxin known to cause severe reproductive and immunological damage to
a variety of vertebrates (Boening, 2000). In fish and marine mammals, all the Hg is present
mainly in the form of MeHg (Mason et al. 2005). Although humans can get exposed to MeHg in
multiple ways (e.g. inhalation, absorption through skin), the main exposition route to MeHg for
humans occurs by consumption of fish and marine mammals (Clarkson and Magos, 2006). The
estimation of mercury in head hair serves as an indicator of the weight of MeHg in the body and
is specifically identified with normal long term fish intake in various populations (Airey, 1983).
The intake of MeHg from fish depends on a variety of factors including the average consumption
of fish, species of fish and the age of the fish (Clarkson, 1997). Levels of MeHg in edible fish
tissue range over at least two orders of magnitude with the highest levels found in predatory fish
which are present at the top of the food chain (Clarkson, 1997). The concentration of MeHg
(CH3Hg) has been found of maximum levels in shellfish, particularly piscivorous fish such as
tuna (Driscoll et al., 2013). Dietary consumption of marine fish and other seafood is a
noteworthy means for introduction of CH3Hg among human populations, with numerous
populations reliant on fish for nourishment, protein, and supplements (Driscoll et al., 2013). The
contribution of fish to worldwide diets is expanding (17 kg cap−1 yr−1 in 2008) (FAO, 2010). In
2007, fish represented 15.7% of the worldwide intake of animal protein which is 6.1% of all
protein expended (Driscoll et al., 2013). Worldwide, fish furnishes >1.5 billion individuals with
∼20% of their normal per capita intake of animal protein, and 3.0 billion with no less than 15%
(Driscoll et al., 2013). China had the most elevated aggregate food fish supply (38.4 million tons;
32.4% of the worldwide supply) and Japan had the most elevated per capita utilization (56.7 kg
cap−1 yr−1 in 2007) (FAS, 2011). The far reaching sullying of fish by CH3Hg, hence, is a risk to
human wellbeing on a worldwide scale (Driscoll et al., 2013).
Developmental neurotoxicity:
The brain and developing central nervous system are the essential focuses for methyl-mercury
bringing about marked distal sensory aggravations, choking of visual fields, ataxia, dysarthria,
auditory disturbances, and tremors (Harada, 1978; Clarkson and Magos, 2006). This selectivity
for the target organs is surprising given the high versatility and reactivity of methyl-mercury in

20
the body (Clarkson, 1997). MeHg is found in tissues bound to both large (proteins) and small
(cysteine and glutathione) sub-atomic weight thiol-containing particles (Clarkson, 1997). The
binding of MeHg to glutathione sulhydryl (GSH), because of its high affinity for SH-bunches,
diminishes the accessibility of this anti-oxidant factor, rendering the cells vulnerable to free-
radical interceded damage (Shanker and Aschner, 2001). MeHg is available as water-soluble
complexes and does not distribute in lipid tissues (Clarkson, 1997). It accumulates in the
mitochondria (Yoshino et al., 1966) where it diminishes the rate of oxygen utilization, modifies
the electron transport chain by impeding complex III (Sone et al., 1977; Yee and Choi, 1996) and
instigates loss of the mitochondrial film potential (Bondy and McKee, 1991; InSug et al., 1997;
Shenker and Aschner, 2001; Castoldi et al., 2008). The degree of MeHg-instigated cell damage
appears to rely upon the intracellular level of antioxidants (Sarafian et al., 1996; Shanker and
Aschner, 2001). The binding of MeHg to tubulin and the ensuing aggravations of microtubule
assembly/disassembly have been proposed as conceivable components in charge of cytoskeletal
adjustments (Graff et al., 1997, Miura and Imura, 1989). MeHg-induced hindrance of the Na+/K+
pump and protein synthesis has additionally been observed (Atchison and Hare, 1994). Analyses
of human IMR-32 neuroblastoma cells exposed to methylmercury reveal distinguishable
modifications in the expression of 7 genes required in signal transduction, transcription
(interpretation) and tumor progression (Hwang, 2006). Harada (1978) revealed that at around 6
months of age, 13 of the 220 infants prenatally exposed to MeHg amid the Minamata Bay
occurrence suggested the possibility of mercury poisoning as described by instability of the neck,
convolutions, and serious neurological and mental disability. Choi et al. (1978) announced
anomalous cyto-engineering of the brain in infants prenatally exposed to MeHg.
MeHg enters the placental boundary, achieving more elevated levels in fetal line blood
than in maternal blood (Vahter et al., 2000). Studies report that due to active MeHg transport
across placental barrier, there is a presence of approximately two fold higher MeHg
concentration in fetal blood than maternal (Ha et al., 2017). Despite the fact that it is perceived
that the danger of MeHg exposure is more prominent in utero than through breastfeeding, still,
maternal milk contains Hg - partly in the Me-Hg form - and therefore may be a source of
postnatal infant exposure (Grandjean et al., 1994; Björnberg et al., 2005). MeHg is effectively

21
exchanged to the fetus over the placenta by means of neutral amino acid transporters during
gestation (Kajiwara et al., 1996). Although maternal and cord blood Hg fixation is profoundly
associated, cord blood MeHg is reliably higher than the comparing maternal concentration, with
a normal proportion of around 1.7 (Mergler et al., 2007; Sakamoto et al., 2004; Stern and Smith,
2003).
Recent research has advanced the understanding of the dose-response relationship
between exposure to MeHg and its toxic effects (Driscoll et al., 2013). There are two different
ways by which exposure or dose of MeHg can be examined. First, external dose can be assessed
by measuring MeHg concentrations in foods, air or in water and multiplying the concentrations
by the frequency of exposure (rate of consumption or volume being inhaled over a certain time
period). Second, it can be analysed by directly measuring the body burden through measuring the
concentrations in tissues such as hair, blood, nails, cord tissues or blood, urine and placenta (Ha
et al., 2017). Pregnant women in Minamata had exposure levels 27 times higher than reference
areas (Sakamoto et al., 2010), equivalent to 40 μg g−1 in hair. In Minamata, fetuses exposed to
MeHg through the placenta displayed severe cerebral palsy-like symptoms, while their mothers
had mild or no manifestations of poisoning (Driscoll et al., 2013). MeHg were found to cause
long-term psychiatric symptoms in adults including impairment of intelligence and mood, and
behavioral dysfunction (Yorifuji et al., 2011).
Mechanisms of transport and metabolism of MeHg:
The majority (94-95%) of methylmercury (MeHg) in fish ingested by volunteers was consumed
from the gastrointestinal tract (Aberg et al., 1969; Miettinen et al., 1971). Intestinal retention of
methylmercury complexed with non-protein sulfhydryl mixes (NPSHs) as happens in bile, was
considered to be the methodology for direct infusion of mercury compounds into ligated
intestinal segments of rats (Urano et al., 1988). Recent studies document that some specific
ingredients of the ingested food substances significantly influence the ability of mercuric ions
uptake by enterocytes (Bridges and Zalups, 2017). After retention from the gastrointestinal tract,
methylmercury is promptly retained in the blood and is consistently circulated to all tissues,
including the erythrocytes, brain and fetus (EPA, 2001). MeHg is actively absorbed by human

22
erythrocytes through multiple transport mechanisms. However, the most studies report that
organic anion transporter is the primary transport system behind the absorption of MeHg by
erythrocytes. Additionally, studies also demonstrate the role of Na+,K+-ATPase in binding seven
molecules of MeHg and Mg+Ca+2-ATPase in binding one molecule of MeHg (Bridges and
Zalups, 2017). MeHg gets distributed to different portions in the brain but the actual mechanism
is not yet fully characterized. But studies suggest that it is possible that neutral amino acid carrier
systems present in the luminal membrane of capillary brain endothelial cells are used as
transporters for the transport of methylmercury–cysteine complexes. In vivo studies in rats and in
vitro studies in bovine cerebral capillary endothelial cells document that co-administration of
Cys followed by MeHg, significantly increase the uptake of MeHg into capillary endothelial
cells of blood-brain barrier by forming a MeHg-Cys conjugate. Structural similarities of MeHg-
Cys complex and methionine facilitates the transport of MeHg across the blood barrier possibly
by an amino acid carrier system called system L (Bridges and Zalups, 2017). Findings on the
transportation of MeHg in the placenta are limited but studies suggest that the mechanisms of
transportation of MeHg to the placenta tissue are somewhat similar to the transportation to the
brain. In vivo studies on rats suggest that MeHg is transported to the placenta trophoblasts in the
form of transposable species MeHg-Cys conjugates by neutral amino acid carrier called system L
in a time and dose-dependent fashion (Bridges and Zalups, 2017).
Contemplates performed with differential centrifugation have demonstrated that
methylmercury does not show a particular sub-cellular distribution, since it is available in all
fractions (nuclear-, mitochondrial-, lysosomal-, and solvent fraction) (Clarkson, 1972). MeHg in
the body is generally steady and is just gradually de-methylated to form mercuric mercury in rats
(Norseth and Clarkson, 1970). The demethylation seems to happen in tissue macrophages (Suda
and Takahashi, 1986), intestinal microbiota (Nakamura et al., 1977; Rowland et al., 1983) and
fetal liver (Suzuki et al., 1984). In vitro demethylation has been accounted for to include
hydroxyl radicals produced by cytochrome P-450 reductase or hypochlorous corrosive
scroungers (Suda and Hirayama, 1992). During the inert period (both amid and after the
suspension of introduction), the patient feels no untoward impacts (EPA, 2001). It is conceivable
that various biochemical changes may happen in parallel during this period, and some may not

23
be causatively related with the clinical result (EPA, 2001). Ganther (1978) estimated that the
carbon-mercury bond in MeHg experiences homolytic cleavage to discharge methyl free radicals
(Me•). The free radicals are relied upon to start a chain of events including peroxidation of lipid
constituents of the neuronal cells (EPA, 2001). Studies in mice seem to show that toxicity from
exposure to dimethyl-mercury (Me2Hg) comes about because of the biotransformation of Me2Hg
to MeHg (Ostland, 1969). After intense exposure to MeHg, the majority of the mercury in the
brain is in the natural form. In any case, with chronic exposures, a more significant amount is in
the inorganic form, indicating that the rate of demethylation increases incrementally with long
term exposure (Aschner and Aschner, 1990). Recent critical review by Ha et al. (2017) reported
findings of MeHg elimination rates among eight individuals in United States after consumption
of 3 fish meals in a two 75 days trials differentiated by a four month wash out period and
observed the half-life ranges from 42.5-128.3 days. The study also suggested the variation of
ratio of MeHg and inorganic Hg in feces of individuals, providing the evidence that rapid rate of
MeHg is associated with a higher percentage of inorganic mercury in feces, an indication of
complete de-methylation. Himeno et al. (1989) showed significant enhancement of in vitro
demethylation activity of MeHg in liver and kidney tissues of seals and rats with long-term
feeding of Me-Hg through several generations. Suzuki et al. (1984) and Yamamoto et al. (1986)
also reported an enhancement of inorganic mercury formation in normal human fetuses and rats
after having been given MeHg for three successive generations. Rice (1989) demonstrated that
the tissue half-life of MeHg (75 days) in the brain may be significantly longer than the blood
half-life (44 days).
Methylmercury and gut microbiota:
Once ingested, MeHg can undergo biotransformation and be promptly absorbed through the
digestive tract. A growing body of scientific proof shows that ingested mercury might be
methylated, in vivo, in the rat digestive tract (Abdulla et al., 1973) and, in vitro, by human
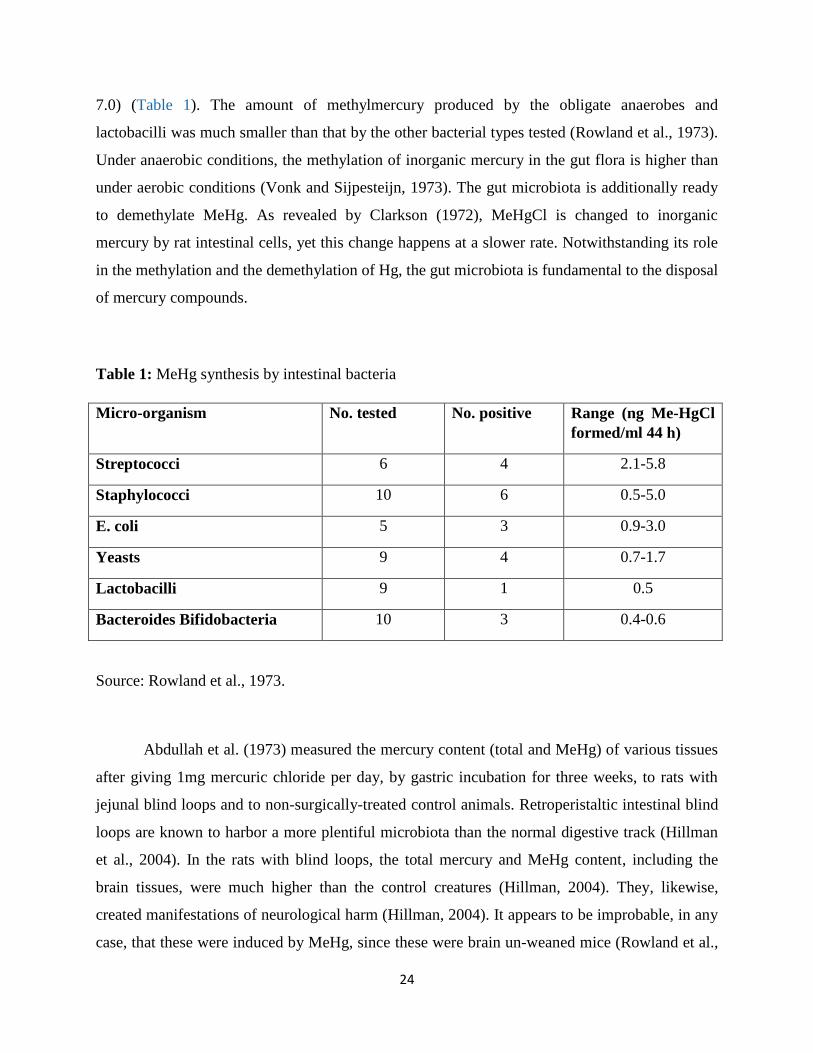
defecation (Edwards and McBride, 1975). Studies of Rowland et al. (1973) reported that a major
proportion of strains of staphylococci, streptococci, yeasts and E. coli, but by only a small
percentage of obligate anaerobic bacteria (Bacteroides and Bifidobacteria) and Lactobacillus
(isolated from human feces) produced methyl-mercury when grown in pure culture (44 h, pH
24
7.0) (Table 1). The amount of methylmercury produced by the obligate anaerobes and
lactobacilli was much smaller than that by the other bacterial types tested (Rowland et al., 1973).
Under anaerobic conditions, the methylation of inorganic mercury in the gut flora is higher than
under aerobic conditions (Vonk and Sijpesteijn, 1973). The gut microbiota is additionally ready
to demethylate MeHg. As revealed by Clarkson (1972), MeHgCl is changed to inorganic
mercury by rat intestinal cells, yet this change happens at a slower rate. Notwithstanding its role
in the methylation and the demethylation of Hg, the gut microbiota is fundamental to the disposal
of mercury compounds.
Table 1: MeHg synthesis by intestinal bacteria
Micro-organism No. tested No. positive Range (ng Me-HgCl
formed/ml 44 h)
Streptococci 6 4 2.1-5.8
Staphylococci 10 6 0.5-5.0
E. coli 5 3 0.9-3.0
Yeasts 9 4 0.7-1.7
Lactobacilli 9 1 0.5
Bacteroides Bifidobacteria 10 3 0.4-0.6
Source: Rowland et al., 1973.
Abdullah et al. (1973) measured the mercury content (total and MeHg) of various tissues
after giving 1mg mercuric chloride per day, by gastric incubation for three weeks, to rats with
jejunal blind loops and to non-surgically-treated control animals. Retroperistaltic intestinal blind
loops are known to harbor a more plentiful microbiota than the normal digestive track (Hillman
et al., 2004). In the rats with blind loops, the total mercury and MeHg content, including the
brain tissues, were much higher than the control creatures (Hillman, 2004). They, likewise,
created manifestations of neurological harm (Hillman, 2004). It appears to be improbable, in any
case, that these were induced by MeHg, since these were brain un-weaned mice (Rowland et al.,

25
1983). These metabolic changes observed during the weaning time frame in mice, harmonize
with lactobacilli in a noteworthy modification to the bacterial composition of gut microbiota,
thereby diminishing the obligate anaerobes, increasing the Bacteroides (Schaedler, 1973).
Comparing formative changes in demethylating capacity that occur in human gut
microbiota, weaned and un-weaned offspring of comparative ages show particularly unique fecal
demethylation capacities (Table 2) (Hillman, 2004). The faecal suspensions were incubated with
MeHg for 24 h at 37ºC, and % MeHg remaining determined by benzene extraction (Rowland et
al., 1983).
Table 2: Effect of age and diet on MeHg demethylation by mouse caecal and human faecal
suspensions.
Species Age Diet %MeHg de-methylated
Mouse 10 days
20 days
3 months
Milk
Stock
Stock
94
50
46
Man 2 days
4.5 months
10 months
8 months
4.5 years
Milk
Milk
Milk
Solid mixed diet
Solid mixed diet
97
90
88
29
18
Source: Hillman, 2004.

26
Genetic basis for mercury methylation:
Studies have demonstrated that Hg is methylated under anoxic conditions (Jensen and Jernelöv,
1969) by sulfate and iron reducing microbes (Compeau and Bartha, 1985; Kerin et al., 2006).
Methylation proceeds after cellular uptake of HgII, methylation of HgII in the cytosol, and export
of CH3Hg+ from the cell (Schaefer et al., 2014). Hg methylation is an enzyme catalyzed process
proposed to be related with the reductive acetyl–Coenzyme A (CoA) pathway and possibly
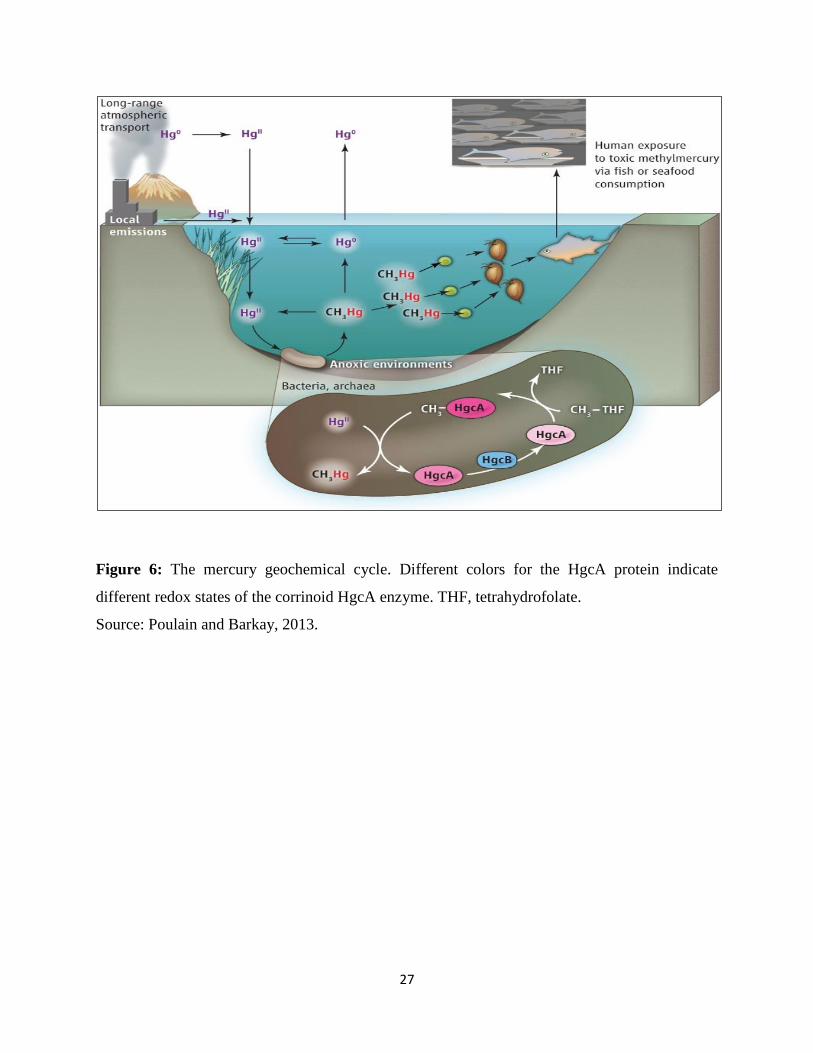
connected to corrinoid proteins required in this pathway (Choi et al., 1994). Parks et al. (2013)
recognized two genes in particular HgcA (encoding a putative corrinoid protein) and HgcB
(encoding a 2[4Fe-4S] ferredoxin), required for mercury methylation (Parks et al., 2013). In view
of these discoveries, authors propose a mechanical model where a methyl group is exchanged
from the methylated HgcA protein to HgII and the HgcB protein is required for HgcA turnover
(Fig. 6) (Poulain and Barkay, 2013). The gene cluster required for methylation is sporadically
distributed across two phyla of Bacteria (Proteobacteria and Firmicutes) and one phylum of
Archaea (Euryarchaeota) (Parks et al., 2013, Gilmour et al., 2011).
27
Figure 6: The mercury geochemical cycle. Different colors for the HgcA protein indicate
different redox states of the corrinoid HgcA enzyme. THF, tetrahydrofolate.
Source: Poulain and Barkay, 2013.

28
Figure 7: Phylogenetic tree using amino acid sequences from all microorganisms with available
genome sequences containing HgcAB orthologues. White dots signify species formerly
established as Hg-methylators, black dots show species newly established as Hg-methylators in
the study investigated by Gilmour et al., 2013. Source: Gilmour et al., 2013.

29
Biochemical mechanisms of bacterial resistance to MeHg:
Some microorganisms have evolved a mercury resistance system focused on a gene complex
called the mer-operon (Clarkson, 1997). An overview of every microbial genome performed in
2010 extended the comprehension of the differences of microorganisms that have the mer-operon
detoxification machinery and recognized its presence among the early developing genealogies of
thermophilic microscopic organisms and Archaea (Lin et al., 2012). This implies that Hg
resistance, in all likelihood, originated in a hydrothermal environment, where geochemically
determined Hg is at a naturally elevated concentration. The mer operon encodes for a
homodimeric flavin disulfide oxidoreductase mercuric reductase (MerA), an organomercury
lyase (MerB), a periplasmic HgII scavenging protein (MerP), at least one internal layer of
spanning proteins (MerC, MerE, MerF, MerG, MerT) that transport HgII to the cytoplasm where
it is reduced by MerA; some regulatory proteins (MerD, MerR) can also be found in the operon
(Fig. 8) (Lin et al., 2012). These genes control the expression of an enzymatic complex involved
in Hg scavenging, uptake and transformation (Walsh et al., 1988). The end product of this
operon activity is the production of Hg0, a volatile Hg species that readily leaves the cell via
passive diffusion.

30
Figure 8: The mer system. Source: Lin et al., 2012.
Effect of different diets on Hg metabolism:
Previous studies suggest that dietary components may influence absorption and excretion of Hg
compounds. Landry et al. (1979) has shown different diets like chemically defined liquid diet,
pelleted rodent diet, and milk diet differentially affected whole body elimination of Hg after
MeHg administration. Fecal excretion accounts for greater than 84% of the fecal and urinary Hg
excretion of each group during the two-week period (Landry et al., 1979). A milk diet has been
reported to enhance gut absorption of certain compounds including lead (Kello and Kostial,
1973) and inorganic Hg (Jugo et al., 1975) by binding of heavy metal compounds to fatty acids
from milk triglycerides (Jugo, 1977). The relative content of lipid in the diet (Table 3) is related
with the rate of Hg elimination and the relative carbohydrate (Table 3) consumption (Landry et
al., 1979). Early studies (Rowland et al., 1975; Greenwood et al., 1977; Landry et al., 1979;

31
Rowland et al., 1984) demonstrated the ability of the intestinal microflora to demethylate MeHg
and its capacity to alter its metabolic activity in response to dietary modifications. This suggested
that the diet induced changes in demethylating activity of the gut microbiota. However, a defined
diet which could affect Hg metabolism (methylation/demethylation) at the cellular and molecular
level has not been established. This work focused on the possible role of different diets in Hg
metabolism will further expand our understanding of such processes to control diet-induced
mercury toxicity.
Table 3: Major dietary components of three diets.
Diets
Protein
Conc
Protein
Ingest
Carbohydrate
Conc
Carbohydrate
Ingest
Lipid
Conc
Lipid
Ingest
Chemically
defined liquid diet
7.2 0.55 31.8 2.43 0.25 0.02
Pellet diet 22.3 0.82 51.5 1.89 5.3 0.19
Evaporated milk
diet
6.8 0.56 10.0 0.83 7.56 0.62
Concentrations (conc.) are expressed as g per 100 g of diet (Landry et al., 1979). Average
ingestion (ingest) is expressed as g ingested per mouse per day based on measured consumed
volumes of the liquid diets (Landry et al., 1979). Source: Landry et al., 1979.
Materials and methods:
Experimental design:
Batch experiment was conducted utilizing small batch fermenters containing collected human
feces (serving as source of gut microbiota), spiked mercury isotopes (198HgCl2 and Me199HgCl)
to examine the potential of human gut microbial species to bio-transform added mercury species
over 96 hours’ of incubation time period.

32
Sample collection-Microbiota source:
Freshly voided feces were collected from five healthy controls (all male consuming western
diet). Subjects collected samples by placing disposable commode specimen containers (Claflin
Medical Equipment, Warwick, RI) under their toilet seats before bowel movements. The five
unrelated healthy subjects were free of gastrointestinal disorders and did not use antibiotics prior
to 6 months or during the course of the experiment. Fresh fecal samples (n=5 samples/individual)
were immediately pooled together and diluted 4:50 in sterile PBS, centrifuged at 5000 rpm for 10
mins and stored at -20ºC before use. Before being introduced into the system, the inoculum was
thawed by 1 h immersion in a 37ºC water bath. Because each individual harbors a unique
microbial community consisting of complex interactions bacteria, pooling does pose a risk of
creating interactions between bacteria that would not occur under physiological conditions (Rose
et al., 2009). Nevertheless, pooling has been recommended (McBurney and Thompson, 1989)
and utilized by a number of researchers (Fässler et al., 2006; Lebet et al., 1998; Stewart and
Slavin, 2006, Hughes et al., 2007) to create a general microbiota that is free of anomalous results
that may arise from the microbiota from a single individual (Christl et al., 1997).
In vitro lower gastrointestinal fermentation:
This study utilizes a batch fecal fermentation to estimate the effect of dietary interventions on gut
microbial community structure and subsequently its impact on Hg transformations. Although this
is a model of what actually occurs in the large bowel (Macfarlane and Macfarlane, 2007), it
provides useful data from which to form hypotheses for in vivo studies (McBurney and
Thompson, 1987). The batch assay consists of serum bottles containing a diet solution (described
below in the next section and reference to Table 4), a small intestine solution (described below in
the next section) and a microbial solution (using 1 X PBS) extracted from fecal samples for a
total of 100 ml in triplicate (Fig. 9). To examine the microbial community Hg transformation
potential, Hg and MeHg isotopes were spiked to a duplicate set. 243 µl of MeHg is administered
in the form of Me199HgCl from the stock solution containing 4.3 µg/ml to reach a final
concentration of 10ng/ml in each vial and 100 µl of inorganic mercury was added in the form
198HgCl2 from the stock solution containing 1 µg/ml to attain a final concentration of 100 ng/ml
in each vial. All bottling was done under anaerobic conditions using an anaerobic chamber.

33
Samples are taken out at specific intervals (time 0 and 96 h) for 16s rRNA gene sequencing to
characterize the temporal patterns of microbial community structure upon dietary interventions
and at intervals of 0, 6, 12, 24, and 48 h to track Hg transformations by inductively coupled
plasma - mass spectrometry (ICP-MS).
Substrate used for fermentation: Source and preparation
During the incubation period (96 h), all the batch cultures were fed with simulated human
intestinal microbial ecosystem (SHIME) based nutrient solution (57 ml) (Table 4) as described
by Laird et al. (2009). The experimental diets used here, high carbohydrate, high protein, and
high fat, are modifications of the balanced diet and differed in the carbohydrate, protein and fat
content as described in Table 4. The batch cultures were fed with all four different kinds of diets,
each representing a nutrient characteristic of western diet (high fat/protein) or traditional diet
(high carbohydrate/dietary fiber) acidified to pH 2-3 via the addition of 12 M HCl. Nutrient
solution was pumped into the small intestine and immediately mixed with small intestinal
solution (30 ml) containing 12.5 g L-1 NaHCO3, 6.0 g L-1 Oxgall, 0.9 g L-1 pancreatin (Laird et
al., 2009).

34
Table 4: Anaerobic batch culture feed- Nutrient solution.
Ingredients Balanced diet High
carbohydrate
High protein High fat
KHCO3 5.01 5.01 5.01 5.01
NaCl 2.92 2.92 2.92 2.92
Arabinogalactan 0.5 Twice the
amount
0.5 0.5
Pectin 1.0 Twice the
amount
1.0 1.0
Xylan 0.5 Twice the
amount
0.5 0.5
Potato starch 2.1 Twice the
amount
2.1 2.1
Glucose 0.2 Twice the
amount
0.2 0.2
Yeast extract 1.5 1.5 Twice the
amount
1.5
Peptone 0.5 0.5 Twice the
amount
0.5
Mucin 2.0 2.0 2.0 2.0
L-cysteine 0.25 0.25 Twice the
amount
0.25
Sodium
butyrate
16 16 16 Twice the
amount
All concentrations are in gram per litre of Milli-QTM water.

35
Figure 9: Set of anaerobic batch culture.
16s rRNA gene amplicon sequencing and processing:
To characterize temporal patterns of microbial community structure, 16s rRNA gene amplicon
sequencing was performed on samples collected at certain incubation periods. Samples were kept
at -80ºC until DNA was extracted. DNA extractions used a MoBio Power Soil kit (Mo Bio
Laboratories, Carlsbad, CA) following the manufacturer’s instructions. The V4 region of the 16S
rRNA gene was PCR amplified in triplicate using custom barcoded forward primers and the
resulting amplicons were checked on a 2% agarose gel to determine the success of amplification
and the relative intensity of bands. The amplicons from each sample were equally combined,
purified and subjected for quantification and sequencing on the Illumina HiSeq Platform
according to the manufacturer’s protocols (Mr DNA lab, Shallowater, TX).
The reads were joined after bases with quality scores <25 were trimmed from the ends
and reoriented to 5'-3' direction by the sequencing facility (Table 5). All of the further sequence
handling was completed with QIIME 1.9.1 (Caporaso et al., 2010) on the HPCVL cluster at
Queens University, Canada, unless stated otherwise. For the pipeline used, please refer to the

36
supplementary data (SD1). Sequences under 300 bp and over 600 bp were removed, the joined
reads were demultiplexed, and both forward and reverse primers were removed. Chimeras were
removed with vsearch (https://github.com/torognes/vsearch) by matching reads against
(unaligned) SILVA123 QIIME release core alignment sequences (Quast et al., 2013). Open
reference OTUs (Rideout et al., 2014) were picked with uclust (Edgar, 2010) against the
SILVA123 QIIME release 97% clustered sequences in QIIME with prefiltering at 60%, and
otherwise using default settings. Singleton, mitochondrial and chloroplast OTUs were removed
from the OTU table and a phylogenetic tree was constructed from the sequences with Fast Tree
(Price et al., 2010) after aligning them against the SILVA123 QIIME release core alignment
using pyNAST 1.2.2 (Caporaso et al., 2010). The OTU table and tree were then exported to R for
further processing.
Table 5: Primer sequences for 16srRNA gene amplification and sequencing: (From MR DNA).
Gene Forward primer sequence (5’-3’) Reverse primer sequence (5’-3’)
16s rRNA 515F GTGCCAGCMGCCGCGGTAA 806R GGACTACHVGGGTWTCTAAT
Bioinformatics and Statistics:
The OTUs that reached at a 97% similarity were used for alpha diversity (Shannon, 1948;
Simpson, 1949), and rarefaction curve analysis using a vegan package (Oksanen et al., 2016) in
R. Phylogenetic beta diversity measures such as weighted and unweighted UniFrac distance
metrics analysis (Lozupone and Knight, 2005) were performed using OTUs for each sample
using the QIIME program (Caporaso et al., 2010) and PCoA was conducted using phyloseq
package (McMurdie and Holmes, 2013) in R software (R Core Team, 2015). Statistical analyses
were performed using R with diversity indices, 2-tailed t-test, one-way analysis of variance
(ANOVA) and multivariate analysis of variance (MANOVA) in R (R Core Team, 2015) and
visualized using GraphPad Prism (Version 7.0). All tests for significance were either one or two-
sided, and p values < 0.05 were considered statistically significant.

37
Determination of total mercury and methylmercury in human fecal samples:
Methylmercury (MeHg) fixations are dictated by capillary gas chromatography combined with
nuclear fluorescence spectrometry (GC-AFS) as depicted by Cai et al. (1997). Initial
concentrates of fresh fecal specimens are subjected to sodium thiosulfate (Na2S2O3) clean up and
the organomercury species are isolated as their bromide derivatives by acidic potassium bromide
(KBr) and copper sulfate (CuSO4) and consequent extraction into a small volume of
dichloromethane (CH2Cl2). Total mercury (HgT) was determined by using thermal decomposition,
gold amalgamation, and atomic absorption in accordance to EPA 7473. The average concentration
(n=3, run in triplicates) of HgT as Hg and MeHg in fecal composites (n=5, weighed and pooled
together) is 3.460 µg/kg (w/w) and 0.024 µg/kg (w/w), respectively.
Reagents:
Stock solutions of 4.3 µg/ml Me199HgCl and 1 µg/ml 198HgCl2 were used. Hg free deionized water
was produced by filtering tap water through a Culligan system consisting of activated charcoal and
two mixed bed ion exchange cartridges. The filtered water was piped to a mercury-free clean room,
where it was passed through a Barnstead Mega-ohm B Pure system (Cai et al., 1997). KBr,
potassium cyanide (KCN), potassium hydroxide (KOH), CuSO4, sulphuric acid (H2SO4),
Na2S2O3, dicholoromethane (CH2Cl2), hydrogen chloride (HCl), sodium sulphate (Na2SO4) were
all obtained from Fisher Scientific.
Extraction of methylmercury:
Spiked samples were taken out from the incubator at various periods as specified above and
prepared for sample extraction. 0.5 ml of KOH is added to each specimen and after that each
sample is spiked with 100 µl of Me201HgCl as an internal standard for the isotope weakening
measurement. Tests are set for homogenization for 30-45 mins at room temperature in the dark
followed by 1 h of vigorous blending with a shaker (330 rpm). In the wake of altering pH for all
samples at 3.0 with 6 N HCl, 1ml of blend of KBr and CuSO4 (5:1) and 2 ml of CH2Cl2 were
included quantitatively. All specimens were left for overnight shaking at 330 rpm. Tests were
centrifuged at 5,000 rpm for 15 mins to break the emulsion that may have formed. Exact known
amount (by weight) of the concentrate was exchanged to clean 7-ml glass vials and 2 ml of
38
0.0001 M Na2S2O3 was added to each sample for refinement. Tests were shaken for 45 mins at
330 rpm, vortexed for 30 s, and afterward centrifuged for 5 mins at 3,000 rpm. Now, two stages
could be seen in the vials. Exact known volume from the top aqueous stage (Na2S2O3) was then
moved into an extraction vial (smaller scale rotator tube), and put away at 4ºC until ethylation
and detection.
Analysis:
An appropriate aliquot (0.5-1 ml) of the extract was taken for derivatization by aqueous phase
ethylation with sodium tetraethylborate (NaBEt4), and volatile organomercury compounds (e.g.
MeHg) were purged and trapped on a Tenax absorber, thermodesorbed onto the GC column,
isothermally separated at 105ºC and quantified by ICP-MS as mercury (Hintelmann et al., 1995;
Hintelmann and Evans 1997; Hintelmann and Ogrinc, 2003). Chromatographic peak areas of the
isotopes (generated by ICP-MS) were used to calculate methylmercury concentrations using a
programmed spreadsheet that accounts for procedural blanks and isotope abundance (Hintelmann
and Ogrinc, 2003).
Acid extraction of methylmercury:
Samples were prepared (H2SO4-KBr-CuSO4 leaching/CH2Cl2 extraction) and analyzed (GC-
AFS) according to Cai et al. (1997). The procedure generated total methylmercury values of the
samples since the MeHg after extraction and Na2S2O3 purification underwent solvent extraction
(CH2Cl2) GC-AFS detection (Avramescu et al., 2010) (Fig. 10).
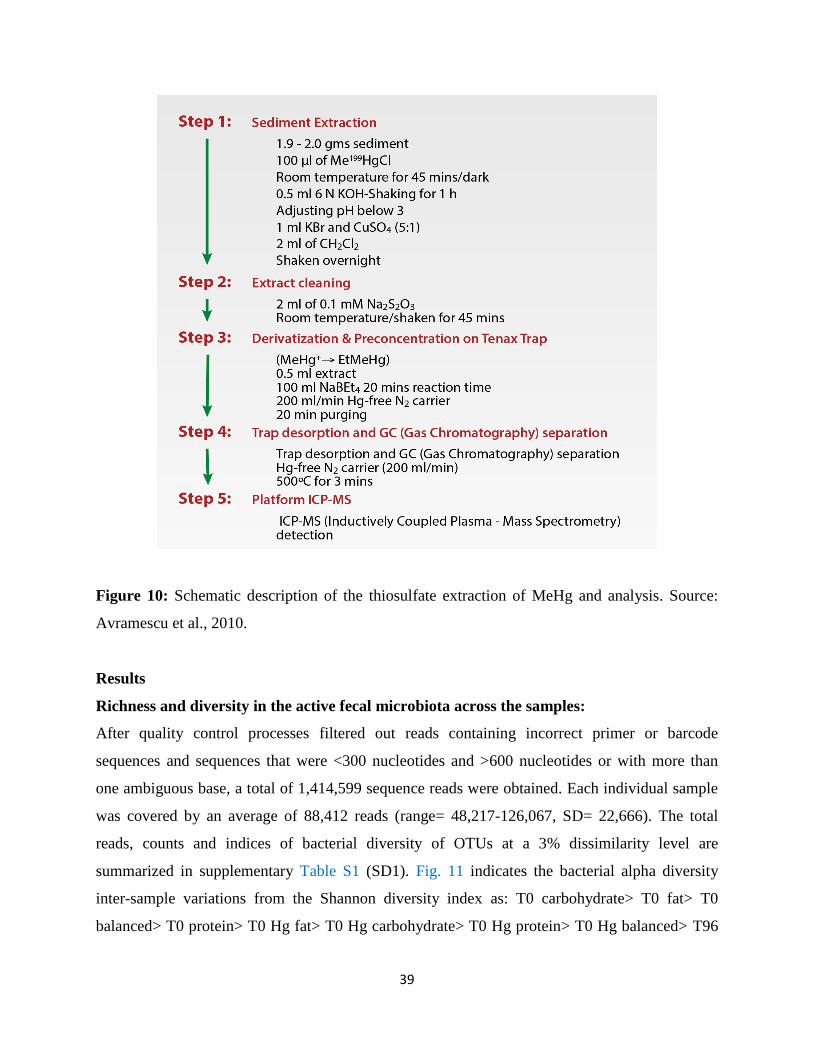
39
Figure 10: Schematic description of the thiosulfate extraction of MeHg and analysis. Source:
Avramescu et al., 2010.
Results
Richness and diversity in the active fecal microbiota across the samples:
After quality control processes filtered out reads containing incorrect primer or barcode
sequences and sequences that were <300 nucleotides and >600 nucleotides or with more than
one ambiguous base, a total of 1,414,599 sequence reads were obtained. Each individual sample
was covered by an average of 88,412 reads (range= 48,217-126,067, SD= 22,666). The total
reads, counts and indices of bacterial diversity of OTUs at a 3% dissimilarity level are
summarized in supplementary Table S1 (SD1). Fig. 11 indicates the bacterial alpha diversity
inter-sample variations from the Shannon diversity index as: T0 carbohydrate> T0 fat> T0
balanced> T0 protein> T0 Hg fat> T0 Hg carbohydrate> T0 Hg protein> T0 Hg balanced> T96

40
Hg protein> T96 carbohydrate> T96 Hg balanced> T96 fat> T96 protein> T96 balanced> T96
Hg fat> T96 Hg carbohydrate. From Fig. 11, it is clear that there was significant change in the
microbial diversity which occurred at time points 0 h and 96 h (p<0.001), as calculated by
ANOVA (complying with our first hypothesis which was: the microbial community of human
gut/batch culture will undergo changes upon dietary interventions within 4 days). From the
Shannon diversity index being conducted (Fig. 11), it is evident that there were no significant
changes occurred with diet (p=0.91; NS>0.05), thus rejecting our predictions (2-5). Furthermore,
addition of Hg also did not show any significant effect on microbial diversity (p=0.06; NS>0.05).
Figure 11: The Shannon index was used to measure the diversity (i.e. a combined assessment of
the number of 3% dissimilar bacterial taxa and abundance) across 16 samples. Differences
shown as mean with ANOVA. P values are indicated as follows; *P<0.001. T0 and T96 h
indicate time points 0 and 96 h, respectively. Bal- balanced diet, carb- carbohydrate diet, fat- fat
diet, prot- protein diet, and Hg stands for mercury
The richness of total bacterial communities in samples was analysed by rarefaction
analysis over a range of values from minimum 0 to maximum 126,067 reads per sample in the

41
data. The trend of the rarefaction curves also confirmed the significant differences in richness (as
indicated by rarefaction OTU estimates) among samples (Fig. 12) as mentioned above; however,
the steep unsaturated shape of the rarefaction curves of T0 bal, carb and fat indicated that the
bacterial richness of those samples were not yet sufficiently sampled. OTUs for the rest of the
samples (T96) levelled off as the sample sequencing reads increased (Fig. 12), suggesting that
sufficient number of sequencing sample reads were accounted to reach a levelled off curve.
Figure 12: Rarefaction curves were calculated to estimate richness (in this case the number of
species at a 3% dissimilarity level) among samples. Repeated samples of OTU subsets were used
to evaluate whether further sampling would likely yield additional taxa, as indicated by whether
the curve has reached a plateau value. The vertical axis shows the number of OTUs (represented
as species here) that would be expected to be found after sampling the number of tags or
sequences shown on the horizontal axis. T0 and T96 h indicate two time points 0 and 96 h,
respectively. Bal- balanced diet, carb- carbohydrate diet, prot- protein diet, and Hg stands for
mercury.

42
Taxonomy-based comparison of fecal microbiota at the phylum and species levels across
the samples:
Gut microbial composition changes over time:
The observed dominant phyla groups were Firmicutes (time = 0 h) and Proteobacteria (time = 96
h). Relative abundance (>1%) of major phyla was measured by statistical analysis incorporating
paired t-test among major phylum groups and shown in Fig. 13 and the dominant groups at the
family levels are shown in Supplementary Fig. S1. These phyla based OTUs were significantly
affected by incubation time and not by short term dietary perturbations (Fig. 13). The abundance
of Firmicutes and Proteobacteria phyla accounted for 70% and 85% of all sequences in the
samples at time 0 and 96 h, respectively (Fig. 13). While Firmicutes significantly decreased in all
diet types over 96 h (p<0.001), the relative abundance of Proteobacteria significantly increased
(p<0.001). T-test based comparisons of phylum level OTUs between Hg treated and non-treated
samples indicated no significant differences, although subtle changes in microbial community
structure were observed upon Hg spiking (Fig. 13). Addition of Hg to the samples led to
negligible reductions in Bacteroidetes in all T0 Hg and T96 Hg fat and T96 protein samples
(NS>0.05).
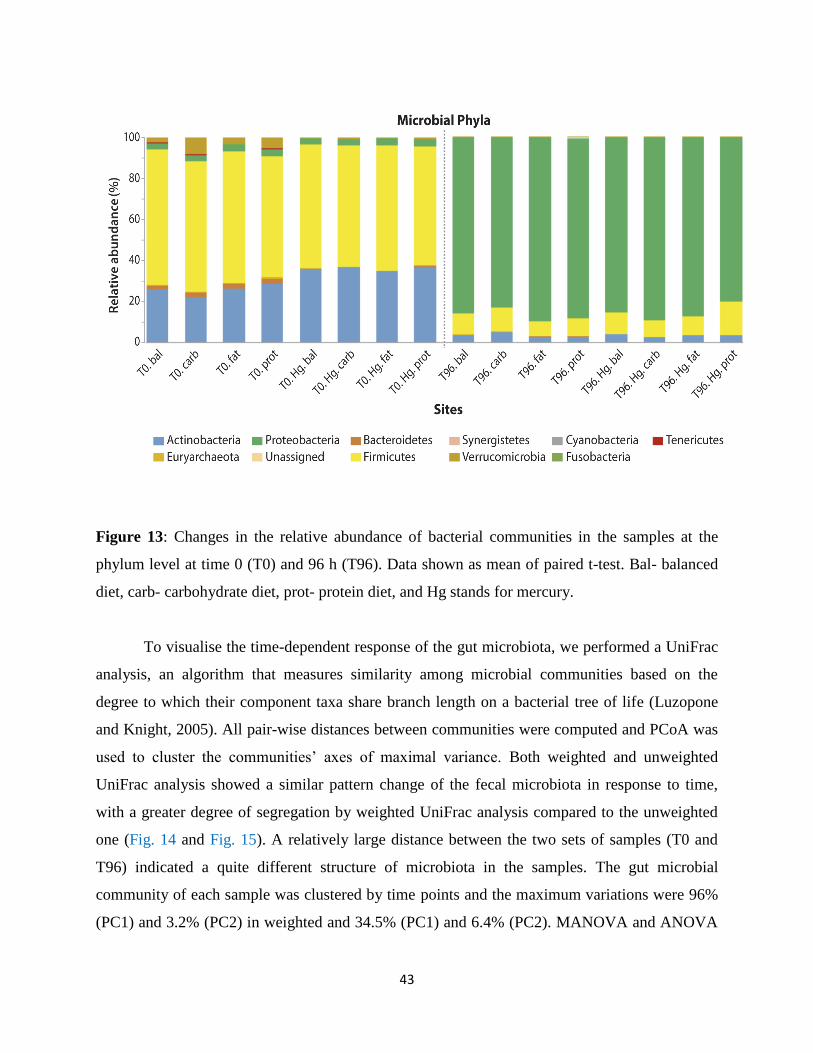
43
Figure 13: Changes in the relative abundance of bacterial communities in the samples at the
phylum level at time 0 (T0) and 96 h (T96). Data shown as mean of paired t-test. Bal- balanced
diet, carb- carbohydrate diet, prot- protein diet, and Hg stands for mercury.
To visualise the time-dependent response of the gut microbiota, we performed a UniFrac
analysis, an algorithm that measures similarity among microbial communities based on the
degree to which their component taxa share branch length on a bacterial tree of life (Luzopone
and Knight, 2005). All pair-wise distances between communities were computed and PCoA was
used to cluster the communities’ axes of maximal variance. Both weighted and unweighted
UniFrac analysis showed a similar pattern change of the fecal microbiota in response to time,
with a greater degree of segregation by weighted UniFrac analysis compared to the unweighted
one (Fig. 14 and Fig. 15). A relatively large distance between the two sets of samples (T0 and
T96) indicated a quite different structure of microbiota in the samples. The gut microbial
community of each sample was clustered by time points and the maximum variations were 96%
(PC1) and 3.2% (PC2) in weighted and 34.5% (PC1) and 6.4% (PC2). MANOVA and ANOVA

44
(followed by Tukey’s post-hoc test) based on the weighted UniFrac (Fig. 14) and unweighted
UniFrac (Fig. 15) also explains significant clustering of the samples by time (p<0.001),
indicating distinct community composition and structure. After 96 h, the microbial community
structure was overwhelmingly dominated by Enterobacteria (e.g., E. coli). Although E. coli are
expected to be present as part of the microbiota of a healthy individual, the abundance
encountered here is unusual. This may reflect an issue with the incubation protocol or some
uncontrolled characteristic of the inoculum.

45
Figure 14: PCoA score plot based on weighted UniFrac metric. Clustering of the group means
based on the Mahalanobis distance calculated by using MANOVA and ANOVA (followed by
Tukey’s post hoc test) on weighted UniFrac PCoA. P value indicated as p<0.001 along PC 1 and
NS>0.05 (p=0.98) along PC 2. T0 and T96 h indicate two time points 0 and 96 h, respectively
and Hg stands for mercury.

46
Figure 15: PCoA score plot based on unweighted UniFrac metric. Clustering of the group
means based on the Mahalanobis distance calculated by using MANOVA and ANOVA
(followed by Tukey’s post hoc test) on unweighted UniFrac PCoA. P value indicated as p<0.001
along PC 1 and NS>0.05 (p=0.975) along PC 2. T0 and T96 h indicate two time points 0 and 96
h, respectively and Hg stands for mercury.
Association between gut microbiota and Hg transformation:
Having defined the compositional and temporal variations in the active gut microbiota, we
sought to determine the response of this distinctive subset to mercury biotransformation. Figs. 16
and 17 demonstrate the production of MeHg over time at different initial concentrations of

47
spiked Me199HgCl and Hg198Cl2. The production of Me199Hg increased significantly (P<0.001)
while there was no increase in demethylation (p=0.97; NS>0.05). The production of MeHg was
small in all treatments and no significant differences were found. The lack of significant MeHg
production was likely due to the overwhelming presence of Enterobacteria which known to be
poor methylators. The simultaneous determination of Me199HgCl and Hg198Cl2 using stable
isotopes allowed demonstration of considerable differences in the production of these two
mercury species. Over the incubation time, the amounts of Me199HgCl formed was significantly
(P<0.001) higher than those of inorganic mercury; maximum levels of Me199HgCl formation
were produced during 30-48 h (consistent with the results of Edwards and McBride, 1975) in all
dietary groups (Fig. 16), where the growth of δ-Proteobacteria was maximal, thereby coinciding
with results of Edwards and McBride (1975), and Gilmour et al. (2013), respectively. This
phenomenon could be due to anaerobic fermentation which created a neutral pH (6.5-7.2) in the
medium favouring growth of fermentative Firmicutes, a potent SRB of the genus Delsulfovibrio
in the class δ-Proteobacteria, known to methylate mercury. However in this study, the
proportional abundance of the genus Desulfovibrio during first few hours of incubation was too
low to be detected (0.009%) and eventually dying out at T96. Hence, we hypothesize that the
small number of D. desulfuricans together with unclassified members of δ-Proteobacteria during
log phase growth, contribute to the formation of very small amounts of methylmercury in the
samples. D. desulfuricans isolated from the human gut are known to carry genes (HgcAB)
essential for mercury methylation.

48
Figure 16: Rate of methylation - Amounts of Me199Hg significantly increased (P<0.001) in all
dietary groups through time in batch culture.
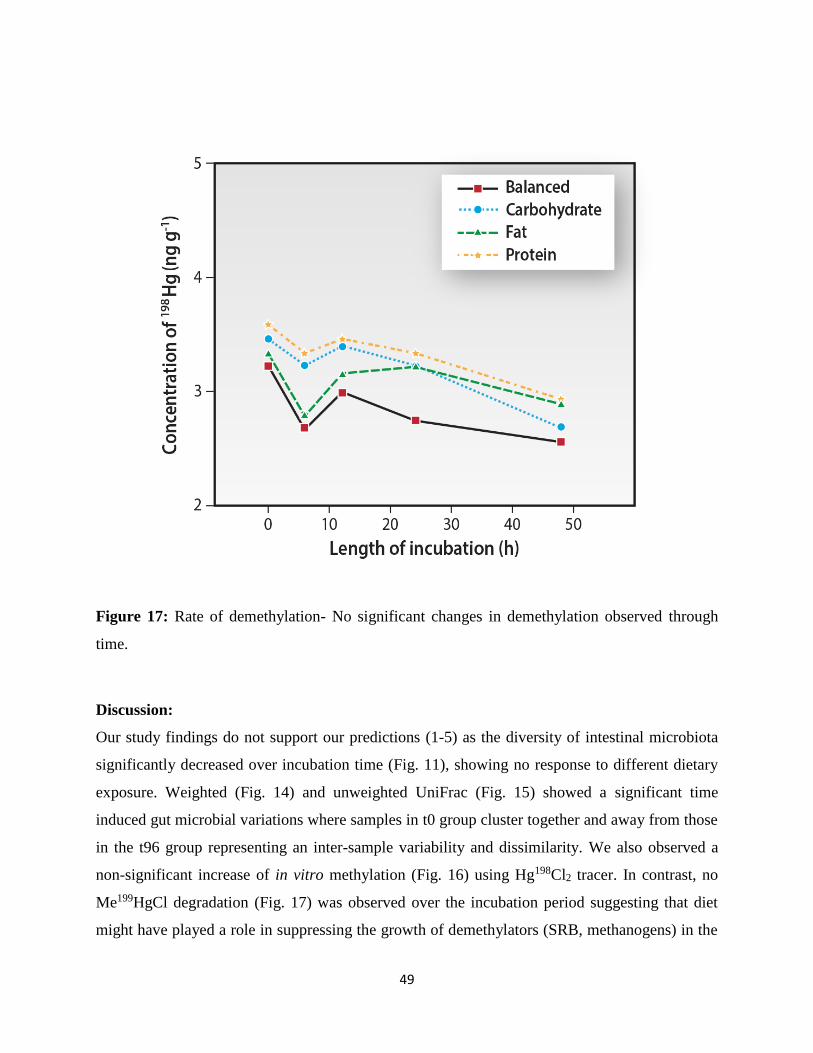
49
Figure 17: Rate of demethylation- No significant changes in demethylation observed through
time.
Discussion:
Our study findings do not support our predictions (1-5) as the diversity of intestinal microbiota
significantly decreased over incubation time (Fig. 11), showing no response to different dietary
exposure. Weighted (Fig. 14) and unweighted UniFrac (Fig. 15) showed a significant time
induced gut microbial variations where samples in t0 group cluster together and away from those
in the t96 group representing an inter-sample variability and dissimilarity. We also observed a
non-significant increase of in vitro methylation (Fig. 16) using Hg198Cl2 tracer. In contrast, no
Me199HgCl degradation (Fig. 17) was observed over the incubation period suggesting that diet
might have played a role in suppressing the growth of demethylators (SRB, methanogens) in the

50
samples. The decreased in microbial diversity over time (T96) was found to be overly dominated
by one OTU associated with E.coli under the phyla Proteobacteria, the most abundant species in
this study. This high prevalence of E.coli in human gut microbiota is unusual as Proteobacteria
only constitutes only 9% of the human gut (Arumugum et al., 2011). E.coli strain K12 was found
to be most abundant species in this study which is usually a rare phyla colonizing human gut
microbiota. Addition of Hg in the fecal pooled cultures seemed to have no effect on microbial
diversity over time, thus no modulation in mercury biotransformation was observed over
incubation time (thus rejection our prediction 6). Occurrence of insignificant methylation over
incubation time is associated low amounts of SRB population (0.009%) in the incubated culture
samples. The absence of demethylation over incubation period could be associated with low
number of demethylators carrying merB gene (organomercuric lyase) responsible for mercury
detoxification. The over-dominance of E.coli strain in the incubation culture samples might have
suppressed the growth of other potential microorganisms (carrying merB gene) responsible for
mercury detoxification in the human gut.
Our findings are not in agreement with the recent study conducted by Aguiree et al.
(2015) where they showed different modulations of gut microbiota by carbohydrate and protein
diets after 24 h of incubation, though the differences became more accentuated over time (72 h).
In the present study, the level of microbial diversity in different dietary samples was not
distinguishable and is considerably lower than that reported in previous studies. For example,
Aguiree et al. (2015) reported high levels of FAFV (Firmicutes, Actinobacteria, Fusobacteria and
Verrucomicrobia) phyla in a carbohydrate rich diet. Aguirre et al. (2015), Maier et al. (1974) and
Zimmer et al. (2012) reported high abundance of certain Bacteroidetes phylum, including
Bacteroides ovatus and Bacteroides fragilis in a high protein diet. Human gut microbiota
exhibits plasticity, but in our present study the plasticity of the gut microbiota in response to
dietary changes was not adaptive enough to bring a change in gut microbial diversity.
Considering the remarkable resilience of the gut community to short term perturbation, it is
likely that microbiota adaptation is largely reversible on short time scales (Dethlefsen and
Relman, 2010; Lee et al., 2013; David et al., 2014; Aguirre et al., 2015). However, here the
ability of the microbiota to accommodate short-term dietary change may be very slow or could
be deleterious to its own maintenance. It is possible that the microbiota has not been able to keep

51
pace with the profound changes brought on by dietary constituents in such a small scale to
produce marked inter-diet differences in the microbiota. The smaller incubation vessels, dietary
constituents used in our study compared to theirs (Lee et al., 2013; Aguirre et al., 2015) might
have influenced the fact that we were not able to observe any significant differences over a
longer time scale of 96 h. Vitamins like nicotinamide (Vit B3) and biotin (Vit B7) which are
essential for bacterial growth/survival (as Nicotinamide is an important coenzyme in electron
transport chain and biotin serves as a cofactor in central cellular metabolism pathways) were not
administered in the dietary system; that might have affected the diet-dependent response of
microbial diversity. Moreover, the GI in vitro model used in the present study was static mono-
compartmental, with a limited number of simulated parameters (realistic transit time, pH and
enzymatic conditions) available. None of the static models provide an accurate estimation of the
in vivo condition; reproduce dynamic processes occurring during human digestion such as gastric
emptying or continuous changes in pH and secretion flow rates (Guerra et al., 2012). We
speculate this might have also affected the changes in the diversity and abundance of intestinal
microbiota. This study provides some insights into the structure of the human microbial
ecosystem but still some significant questions remain unanswered regarding: 1) the potential of
certain dietary compounds to promote a specific microbial composition, and 2) the role of certain
bacteria in Hg transformations. Detectable differences following a diet change in humans have
not been fully explored, and it is unclear how fast and how reproducibly the microbiota can
respond to these changes (Muegge et al., 2011; David et al., 2014). One of the few studies in this
area was performed by David et al. (2014), who clearly demonstrated that consumption of a diet
mainly composed of either plant or animal products modifies the composition and activity of the
gut microbiota of healthy subjects in only five days. The authors found that, already one day
after initiating the study, there was an increase in β-diversity in microbiota from feces of
individuals consuming the animal diet and that their original structure was recovered two days
after finishing the study (Aguirre et al., 2015). Our results explain a short-term time dependent
response of the gut microbiota after being exposed to different diets, providing the basis for
follow up studies which will not only provide novel insight to host-microbial interactions, but
may also provide a rich understanding of the unexplained diet-dependent gut microbial changes.
Since no variations in methylation and demethylation were observed among dietary groups, our
results are not necessarily applicable to populations for toxicological risk assessment. An in-

52
depth evaluation should be made of the influence of diet on MeHg transformations in the human
gut. This kind of study would provide reliable data that could serve as a basis for risk evaluations
elucidating the effects of dietary contents on MeHg metabolism.
Significance of Research:
Gastric and small intestinal (GSI) models are increasingly used as an alternative to in vivo assays
to answer many questions raised by industry and researchers (Guerra et al., 2012). A broad range
of in vitro systems is available, from static mono-compartmental to dynamic multi-
compartmental models. However, these models require a compromise between technological
complexity and biological significance (Guerra et al., 2012). In our laboratory, a batch
fermentation system was developed to simulate the microbial ecosystem of the small and large
intestine. With regard to the results observed and results that have been predicted, the batch
reactors we used can be considered as a preliminary tool for studying the microbial composition
and activities in the human intestinal tract (Molly et al., 1993). Due to the absence of absorption
of metabolites and fluid, the value of the simulator is limited to the study of the principal
interactions in the microbial community. Yet, because a variety of additives can easily be
administered (e.g. bile salts, bile-salt-hydrolysing enzymes, probiotics, drugs, prodrugs) the
batch reactors can be used to evaluate the principal influences of the latter on the ecology of
human gut bacteria (Molly et al., 1993). Scientific and technological efforts need to be pursued
to improve artificial digestive systems further, extend their potential and approach the in vivo
human situation still more closely (Guerra et al., 2012).

53
References:
Abdulla M, Arnesjö B, & Ihse I. (1973). Methylation of inorganic mercury in experimental
jejunal blind-loop. Scandinavian Journal of Gastroenterology 8(6): 565–567.
Aberg B, Ekman L, Falk R, Greitz U, Persson G, & Snihs J. (1969). Metabolism of methyl
mercury (Hg) compounds in man: Excretion and distribution. Achieves of Environmental
Health 19(4): 478–484.
Afonne OJ, Orisakwe OE, Obi E, Dioka CE, & Ndubuka GI. (2002). Nephrotoxic actions of
low-dose mercury in mice: Protection by zinc. Archives of Environmental Health 57(2):
98–102.
AGNS (2007): Food Quality and Standards Service (AGNS). Technical report on prebiotics.
FAO; 15–16 September 2007; Rome, Italy.
Doi: http://www.fao.org/ag/agn/agns/index_en.stm.
Aguirre M, Eck A, Koenen ME, Savelkoul PH, Budding AE, & Venema K. (2015). Diet drives
quick changes in the metabolic activity and composition of human gut microbiota in a
validated in vitro gut model. Research in Microbiology 167(2): 114–125.
Amato KR, Yeoman CJ, Kent A, Righini N, Carbonero F, Estrada A, Gaskins HR, Stumpf RM,
Yildirim S, Torralba M, Gillis M, Wilson BA, Nelson KE, White BA, & Leigh SR.
(2013). Habitat degradation impacts black howler monkey (Alouatta pigra)
gastrointestinal microbiomes. ISME Journal 7(7): 1344–1353.
Amato KR, Yeoman CJ, Cerda G, Schmitt CA, Cramer JD, Miller ME, Gomez A, Turner TR,
Wilson BA, Stumpf RM, Nelson KE, White BA, Knight R, & Leigh SR. (2015). Variable
responses of human and non-human primate gut microbiomes to a Western diet.
Microbiome 3: 53 (9 pp).
Arumugam M, Raes J, Pelletier E, Le Paslier D, Yamada T, Mende DR, … & Bork P. (2011).
Enterotypes of the human gut microbiome. Nature 473(7346): 174–180.
Aschner M, & Aschner JL. (1990). Mercury neurotoxicity: Mechanisms of blood-brain barrier
transport. Neuroscience & Biobehavioral Reviews 14(2): 169–176.
Atchison WD, & Hare MF. (1994). Mechanisms of methylmercury-induced neurotoxicity.
FASEB Journal 8(9): 622–629.
Avramescu ML, Zhu J, Yumvihoze E, Hintelmann H, Fortin D, & Lean DR. (2010). Simplified
sample preparation procedure for measuring isotope‐enriched methylmercury by gas
chromatography and inductively coupled plasma mass spectrometry. Environmental
Toxicology and Chemistry 29(6): 1256–1262.
Barcenilla A, Pryde SE, Martin JC, Duncan SH, Stewart CS, Henderson C, & Flint HJ. (2000).
Phylogenetic relationships of butyrate-producing bacteria from the human gut. Applied
and Environmental Microbiology 66(4): 1654–1661.
Barkay T, Miller SM, & Summers AO. (2003). Bacterial mercury resistance from atoms to
ecosystems. FEMS Microbiology Reviews 27(2-3): 355–384.
Bazzocco S, Mattila I, Guyot S, Renard CM, & Aura AM. (2008). Factors affecting the
conversion of apple polyphenols to phenolic acids and fruit matrix to short-chain fatty
acids by human faecal microbiota in vitro. European Journal of Nutrition 47(8): 442–
452.
Betian HG, Linehan BA, Bryant MP, & Holdeman LV. (1977). Isolation of a cellulolytic
Bacteroides sp. from human feces. Applied and Environmental Microbiology 33(4):
1009–1010.
54
Björnberg KA, Vahter M, Berglund B, Niklasson B, Blennow M, & Sandborgh-Englund G.
(2005). Transport of methylmercury and inorganic mercury to the fetus and breast-fed
infant. Environmental Health Perspectives 113(10): 1381–1385.
Björnberg KA, Vahter M, Grawé KP, & Berglund M. (2005). Methyl mercury exposure in
Swedish women with high fish consumption. Science of the Total Environment 341(1-3):
45–52.
Boening DW. (2000). Ecological effects, transport, and fate of mercury: A general
review. Chemosphere 40(12): 1335–1351.
Bolnick DI, Snowberg LK, Hirsch PE, Lauber CL, Org E, Parks B, Lusis AJ, Knight R,
Caporaso JG, & Svanbäck R. (2014). Individual diet has sex-dependent effects on
vertebrate gut microbiota. Nature Communications 5: 4500 (13 pp).
Bondy SC, & McKee M. (1991). Disruption of the potential across the synaptosoma plasma
membrane and mitochondria by neurotoxic agents. Toxicology Letters 58(1): 13–21.
Booijink CC, Boekhorst J, Zoetendal EG, Smidt H, Kleerebezem M, & de Vos WM. (2010).
Metatransccriptome analysis of the human fecal microbiota reveals subject-specific
expression profiles, with genes encoding proteins involved in carbohydrate metabolism
being dominantly expressed. Applied and Environmental Microbiology 76(16): 5533–
5540.
Booijink CC, El-Aidy S, Rajilić-Stojanović M, Heilig HG, Troost FJ, Smidt H, Kleerebezem M,
De Vos WM, & Zoetendal EG. (2010). High temporal and inter-individual variation
detected in the human ileal microbiota. Environmental Microbiology 12(12): 3213–3227.
Borenstein E. (2012). Computational systems biology and in silico modeling of the human
microbiome. Briefings in Bioinformatics 13(6): 769–780.
Bridges CC, & Zalups RK. (2017). Mechanisms involved in the transport of mercuric ions in
target tissues. Archives of Toxicology 91(1): 63–81.
Buddington RK, Williams CH, Chen SC, & Witherly SA. (1996). Dietary supplement of
neosugar alters the fecal flora and decreases activities of some reductive enzymes in
human subjects. American Journal of Clinical Nutrition 63(5): 709–716.
Cai Y, Tang G, Jaffé R, & Jones R. (1997). Evaluation of some isolation methods for
organomercury determination in soil and fish samples by capillary gas chromatography–
atomic fluorescence spectrometry. International Journal of Environmental Analytical
Chemistry 68(3): 331–345.
Calabrese EJ. (1978). Nutrition and Environmental Health. Wiley, New York, NY.
Caporaso JG, Kuczynski J, Stombaugh J, Bittinger K, Bushman FD, Costello EK, Fierer N, Pena
AG, Goodrich JK, Gordon JI, …. & Knight R. (2010). QIIME allows analysis of high-
throughput community sequencing data. Nature Methods 7(5): 335–336.
Caporaso JG, Lauber CL, Walters WA, Berg-Lyons D, Lozupone CA, Turnbaugh PJ, Fierer N,
& Knight R. (2011). Global patterns of 16S rRNA diversity at a depth of millions of
sequences per sample. Proceedings of the National Academy of Science USA 108(Suppl
1): 4516–4522.
Caporaso JG, Lauber CL, Walters WA, Berg-Lyons D, Huntley J, Fierer N, Owens SM, Betley J,
Fraser L, Bauer M, … & Knight R. (2012). Ultra-high-throughput microbial community
analysis on the Illumina HiSeq and MiSeq platforms. ISME Journal 6(8): 1621–1624.
Carvalho-Wells AL, Helmolz K, Nodet C, Molzer C, Leonard C, McKevith B, … & Tuohy KM.
(2010). Determination of the in vivo prebiotic potential of a maize-based whole grain
breakfast cereal: A human feeding study. British Journal of Nutrition 104(9): 1353–1356.
55
Castoldi, AF, Johansson C, Onishchenko N, Coccini T, Roda E, Vahter M, ... & Manzo L.
(2008). Human developmental neurotoxicity of methylmercury: Impact of variables and
risk modifiers. Regulatory Toxicology and Pharmacology 51(2): 201–214.
Chapman L, & Chan HM. (2000). The influence of nutrition on methyl mercury intoxication.
Environmental Health Perspectives 108(Suppl 1): 29–56.
Chassard C, Delmas E, Robert C, & Bernalier-Donadille A. (2010). The cellulose-degrading
microbial community of the human gut varies according to the presence or absence of
methanogens. FEMS Microbiology Ecology 74(1): 205–213.
Choi CM, Lapham LW, Amin-Zake L, & Saleem T. (1978). Abnormal neuronal migration,
deranged cerebral cortical organization and diffuse white matter astrocytosis of human
fetal brain: A major effect of methylmercury poisoning in utero. Journal of
Neuropathology and Experimental Neurology 37(6): 719–732.
Choi SC, Chase Jr. T, & Bartha R. (1994). Enzymatic catalysis of mercury methylation by
Desulfovibrio desulfuricans LS. Applied and Environmental Microbiology 60(4): 1342–
1346.
Christl SU, Bartram HP, Paul A, Kelber E, Scheppach W & Kasper H. (1997). Bile acid
metabolism by colonic bacteria in continuous culture: Effects of starch and pH. Annals of
Nutrition and Metabolism 41(1): 45–51.
Clarkson TW. (1972). The pharmacology of mercury compounds. Annual Review of
Pharmacology 12(1): 375–406.
Clarkson TW. (1997). The toxicology of mercury. Critical Reviews in Clinical Laboratory
Sciences 34(4): 369–403.
Clarkson TW, & Magos L. (2006). The toxicology of mercury and its chemical compounds.
Critical Reviews in Toxicology 36(8): 609–662.
Cole JR, Chai B, Farris RJ, Wang Q, Kulam SA, McGarrell DM, Garrity GM, & Tiedje JM.
(2005). The Ribosomal Database Project (RDP-II): Sequences and tools for high-
throughput rRNA analysis. Nucleic Acids Research 33: D294–D296.
Compeau GC, & Bartha R. (1985). Sulfate-reducing bacteria: Principal methylators of mercury
in anoxic estuarine sediment. Applied and Environmental Microbiology 50(2): 498–502.
Conway PL. (1995). Microbial ecology of the human large intestine. In: GR Gibson and GT
Macfarlanc (eds.). Human Colonic Bacteria: Role in Nutrition, Physiology and
Pathology, pp. 1–18. CRC Press, Boca Raton, FL.
Costabile A, Kolida S, Klinder A, Gietl E, Bäuerlein M, Frohberg C, Landschütze V, & Gibson
GR. (2010). A double-blind, placebo-controlled, crossover study to establish the
bifidogenic effect of a very-long chain inulin extracted from globe artichoke (Cynara
scolymus) in healthy human subjects. British Journal of Nutrition 104(7): 1007–1017.
Crittenden R, Laitila A, Forssell P, Mättö J, Saarela M, Mattila-Sandholm T, & Myllärinen, P.
(2001). Adhesion of Bifidobacteria to granular starch and its implication in probiotic
technologies. Applied and Environmental Microbiology 67(8): 3469–3475.
Cummings JH, & Macfarlane GT. (1991). The control and consequences of bacterial
fermentation in the human colon. Journal of Applied Bacteriology 70(6): 443–459.
David LA, Maurice CF, Carmody RN, Gootenberg DB, Button JE, Wolfe BE, Ling AV, Devlin
AS, Varma Y, Fischbach MA, …. & Turnbaugh PJ. (2014). Diet rapidly and
reproducibly alters the human gut microbiome. Nature 505(7484): 559–563.

56
De Filippo C, Cavalieri D, Di Paola M, Ramazzotti M, Poullet JB, Massart S, Collini S,
Pieraccini G, & Lionetti P. (2010). Impact of diet in shaping gut microbiota revealed by a
comparative study in children from Europe and rural Africa. Proceedings of the National
Academy of Science USA 107(33): 14691–14696.
Dethlefsen L, & Relman DA. (2010). Incomplete recovery and individualized responses of the
human distal gut microbiota to repeated antibiotic perturbation. Proceedings of the
National Academy of Science USA 108 (Suppl. 1): 4554–4561.
Dimitrov DV. (2011). The human gutome: Nutrigenomics of the host-microbiome interactions.
OMICS 15: 419–430.
Dominguez-Bello, MG, Costello EK, Contreras M, Magris M, Hidalgo G, Fierer N, & Knight R.
(2010). Delivery mode shapes the acquisition and structure of the initial microbiota
across multiple body habitats in newborns. Proceedings of the National Academy of
Science USA 107(26): 11971–11975.
Dongowski G, Lorenz A, & Proll J. (2002). The degree of methylation influences the
degradation of pectin in the intestinal tract of rats and in vitro. The Journal of
Nutrition 132(7): 1935–1944.
Doré J, & Blottière H. (2015). The influence of diet on the gut microbiota and its consequences
for health. Current Opinion in Biotechnology 32: 195–199.
Dridi B, Fardeau M-L, Ollivier B, Raoult D, & Drancourt M. (2012). Methanomassiliicoccus
luminyensis gen. nov., sp. nov., a methanogenic archaeon isolated from human faeces.
International Journal of Systematic and Evolutionary Microbiology 62(8): 1902–1907.
Driscoll CT, Mason RP, Chan HM, Jacob DJ, & Pirrone N. (2013). Mercury as a global
pollutant: Sources, pathways, and effects. Environmental Science & Technology 47(10):
4967–4983.
Duncan SH, Hold GL, Barcenilla A, Stewart CS, & Flint HJ. (2002). Roseburia intestinalis sp.
nov., a novel saccharolytic, butyrate-producing bacterium from human
faeces. International Journal of Systematic and Evolutionary Microbiology 52(5): 1615–
1620.
Eckburg PB, Bik EM, Bernstein CN, Purdom E, Dethlefsen L, Sargent M, ... & Relman DA.
(2005). Diversity of the human intestinal microbial flora. Science 308(5728): 1635–1638.
Edgar RC. (2010). Search and clustering orders of magnitude faster than BLAST.
Bioinformatics 26(19): 2460–2461.
Edwards T, & McBride GC. (1975). Biosynthesis and degradation of methylmercury in human
faeces. Nature 253(5491):462–464.
Eggesbø, M. Moen B, Peddada S, Baird D, Rugtveit J, Midtvedt T, Bushel PR, Sekelja M, &
Rudi K. (2011). Development of gut microbiota in infants not exposed to medical
interventions. APMIS 119(1): 17–35.
EPA (2001). Water quality Criterion for the protection of human health: Methyl-mercury.
Environmental Protection Agency (EPA). January 2001. EPA 823-R-10-001, Office of
the Science and Technology, Office of Water, Washington, DC.
Erickson PR, & Lin VS. (2015). Research highlights: elucidation of biogeochemical factors
influencing methylmercury production. Environmental Science: Processes &
Impacts 17(10): 1708–1711.
Eswaran S, Muir J, & Chey WD. (2013). Fiber and functional gastrointestinal disorders. The
American Journal of Gastroenterology 108(5): 718–727.

57
FAO (2010). Food and Agriculture Organization (FAO) of the United Nations. The State of
World Fisheries and Aquaculture - 2010; FAO Statistics and Information Service of the
Fisheries and Aquaculture Department, Rome, Italy.
FAS (2011). Fishery and Aquaculture Statistics (FAS), 2011; p 415. Food and Agriculture
Organization of the United Nations, Rome, Italy.
Fässler C, Arrigoni E, Venema K, Brouns F, & Amadò E. (2006). In vitro fermentability of
differently digested resistant starch preparations. Molecular Nutrition & Food Research
50(12): 1220–1228.
Flint HJ, Duncan SH, Scott KP, & Louis P. (2007). Interactions and competition within the
microbial community of the human colon: Links between diet and health. Environmental
Microbiology 9(5): 1101–1111.
Flint HJ, Scott KP, Louis P, & Duncan SH. (2012). The role of the gut microbiota in nutrition
and health. Nature Reviews Gastroenterology and Hepatology 9(10): 577–589.
Fooks LJ, Fuller R, & Gibson GR. (1999). Prebiotics, probiotics and human gut microbiology.
International Dairy Journal 9(1): 53–61.
Fuller R, & Gibson GR. (1997). Modification of the intestinal microflora using probiotics and
prebiotics. Scandinavian Journal of Gastroenterology. Supplement 222: 28–31.
Ganther HE. (1978). Modification of methyl mercury toxicity and metabolism by selenium and
vitamin E: Possible mechanisms. Environmental Health Perspectives 25: 71–76.
Gibson GR, Ottaway PB, & Rastall RA. (2000). Prebiotics: New Developments in Functional
Foods. Chandos Publishing Ltd., Oxford, UK.
Gilmour CC, Elias DA, Kucken AM, Brown SD, Palumbo AV, Schadt CW, & Wall JD. (2011).
Sulfate-reducing bacterium Desulfovibrio desulfuricans ND132 as a model for
understanding bacterial mercury methylation. Applied and Environmental Microbiology
77(12): 3938–3951.
Gilmour CC, Podar M, Bullock AL, Graham AM, Brown SD, Somenahally AC, ... & Elias DA.
(2013). Mercury methylation by novel microorganisms from new
environments. Environmental Science & Technology 47(20): 11810–11820.
Gill SR, Pop M, DeBoy RT, Eckburg PB, Turnbaugh PJ, Samuel BS, Gordon JI, Relman DA,
Fraser-Liggett CM, & Nelson KE. (2006). Metagenomic analysis of the human distal gut
microbiome. Science 312(5778): 1355–1359.
Goldin BR. (2011). Probiotics and health: From history to future. In: W Kneifel and S Salminen
(eds.). Probiotics and Health Claims, pp. 1–16. Wiley-Blackwell, Chichester, UK.
Graf D, Di Cagno R, Fåk F, Flint HJ, Nyman M, Saarela M, & Watzl B. (2015). Contribution of
diet to the composition of the human gut microbiota. Microbial Ecology in Health and
Disease 26: 26164 (11 pp).
Graff RD, Falconer MM, Brown DL, & Reuhl KR. (1997). Altered sensitivity of post
translationally modified microtubules to methylmercury in differentiating embryonal
carcinoma-derived neurons. Toxicology and Applied Pharmacology 144(2): 215–224.
Greenwood RH, Morrill JL, Titgemeyer EC, & Kennedy GA. (1997). A new method of
measuring diet abrasion and its effect on the development of the forestomach. Journal of
Dairy Science 80(10): 2534–2541.
Grootaert C, Van den Abbeele P, Marzorati M, Broekaert WF, Courtin CM, Delcour JA, … &
Van de Wiele T. (2009). Comparison of prebiotic effects of arabinoxylan
oligosaccharides and inulin in a simulator of the human intestinal microbial
ecosystem. FEMS Microbiology Ecology 69(2): 231–242.

58
Grootaert C, Marzorati M, Van den Abbeele P, Van de Wiele T, & Possemiers S. (2011).
Prebiotics to manage the microbial control of energy homeostasis. Benef Microbes 2(4):
305–318.
Guarner F. (2015). The gut microbiome: What do we know?. Clinical Liver Disease 5(4): 86–90.
Guerra A, Etienne-Mesmin L, Livrelli V, Denis S, Blanquet-Diot S, & Alric M. (2012).
Relevance and challenges in modeling human gastric and small intestinal digestion.
Trends in Biotechnology 30(11): 591–600.
Ha E, Basu N, Bose-O’Reilly S, Dórea JG, McSorley E, Sakamoto M, & Chan HM. (2017).
Current progress on understanding the impact of mercury on human health.
Environmental Research 152: 419–433.
Hamaker BR, & Tuncil YE. (2014). A perspective on the complexity of dietary fiber structures
and their potential effect on the gut microbiota. Journal of Molecular Biology 426(23):
3838–3850.
Harada M. (1978). Congenital Minamata disease: intrauterine methylmercury poisoning.
Teratology 18(2): 285–288.
Hentges DJ. (1992) Gut flora and disease resistance. In R Fuller (ed.). Probiotics, The Scientific
Basis, pp. 87–110. Chapman and Hall, London, UK.
Hildebrandt MA, Hoffmann C, Sherrill–Mix SA, Keilbaugh SA, Hamady M, Chen YY, ... & Wu
GD. (2009). High-fat diet determines the composition of the murine gut microbiome
independently of obesity. Gastroenterology 137(5): 1716–1724.
Hillman B. (2004). Role of Gut Bacteria in Human Toxicology and Pharmacology. CRC Press,
Boca Raton, FL.
Hintelmann H, Evans RD, & Villeneuve JY. (1995). Measurement of mercury methylation in
sediments by using enriched stable mercury isotopes combined with methylmercury
determination by gas chromatography - inductively coupled plasma mass spectrometry.
Journal of Analytical Atomic Spectrometry 10(9): 619–624.
Hintelmann H, & Evans RD. (1997). Application of stable isotopes in environmental tracer
Studies - Measurement of monomethylmercury (CH3Hgþ) by isotope dilution ICP-MS
and detection of species transformation. Fresenius’ Journal of Analytical Chemistry
358(3): 378–385.
Hintelmann H, & Ogrinc N. (2003). Determination of stable mercury isotopes by ICP-MS and
their application in environmental studies. In: Y Cai and OC Braids (eds.).
Biogeochemistry of Environmentally Important Trace Elements. ACS Symposium Series
835: Ch 21, pp. 321–338. American Chemical Society, Washington, DC.
Himeno S, Watanabe C, Hongo T, Suzuki T, Naganuma A, & Imura N. (1989). Body size and
organ accumulation of mercury and selenium in young harbor seals (Phoca vitulina).
Bulletin of Environmental Contamination and Toxicology 42(4): 503–509.
Hooper LV, Littman DR, & Macpherson AJ. (2012). Interactions between the microbiota and the
immune system. Science 336(6086): 1268–1273.
Hughes SA, Shewry PR, Li L, Gibson GR, Sanz ML, & Rastall RA. (2007). In vitro
fermentation by human fecal microflora of wheat arabinoxylans. Journal of Agricultural
and Food Chemistry 55(11): 4589–4595.
Hughes SA, Shewry PR, Li L, Gibson GR, McCleary BV, & Rastall RA. (2008). In vitro
fermentation of oat and barley derived betaglucans by human faecal microbiota. FEMS
Microbiology Ecology 64(3): 482–493.

59
Hwang CY. (2006). Flectobacillus lacus sp. nov., isolated from a highly eutrophic pond in
Korea. International Journal of Systematic and Evolutionary Microbiology 56(6):1197–
1201.
Imura N, & Naganuma A. (1985). Mode of modifying action of selenite on toxicity and behavior
of mercury and other metals. Nutrition Research (Suppl. 1): 499–507.
InSug O, Datar S, Koch CJ, Shapiro IM, & Shenker BJ. (1997). Mercury compounds inhibit
human monocytes function by inducing apoptosis: Evidence for formation of reactive
oxygen species, development of mitochondrial membrane permeability transition and loss
of reductive reserve. Toxicology 124(3): 211–224.
Jensen S, & Jernelöv A. (1969). Biological methylation of mercury in aquatic organisms. Nature
223(5207): 753–754.
Jernberg C, Löfmark S, Edlund C, & Jansson JK. (2010). Long-term impacts of antibiotic
exposure on the human intestinal microbiota. Microbiology 156(11): 3216–3223.
Jugo S, Maljković T, & Kostial K. (1975). Influence of chelating agents on the gastrointestinal
absorption of lead. Toxicology and Applied Pharmacology 34(2): 259–263.
Jugo S. (1977). Metabolism of toxic heavy metals in growing organisms: A review.
Environmental Research 13(1): 36–46.
Kajiwara Y, Yasutake A, Adachi T, & Hirayama K. (1996). Methylmercury transport across the
placenta via neutral amino acid carrier. Archives in Toxicology 70(5): 310–314.
Karlsson CLJ, Molin G, Cilio CM, & Ahrné S. (2011). The pioneer gut microbiota in human
neonates vaginally born at term-A pilot study. Pediatric Research 70(3): 282–286.
Kello D, & Kostial K. (1973). The effect of milk diet on lead metabolism in rats. Environmental
Research 6(3): 355–360.
Kerrin EJ, Gilmour CC, Roden E, Suzuki MT, Coates JD, & Mason RP. (2006). Mercury
methylation by dissimilatory iron-reducing bacteria. Applied Environmental
Microbiology 72(12): 7919–7921.
Khan MT, Duncan SH, Stams AJ, van Dijl JM, Flint HJ, & Harmsen HJ. (2012). The gut
anaerobe Faecalibacterium prausnitzii uses an extracellular electron shuttle to grow at
oxic-anoxic interphases. ISME Journal 6(8): 1578–1585.
Koenig JE, Spor A, Scalfone N, Fricker AD, Stombaugh J, Knight R, Angenent LT, & Ley RE.
(2011). Succession of microbial consortia in the developing infant gut microbiome.
Proceedings of the National Academy of Science USA 108(Suppl 1): 4578–4585.
Laird BD, Shade C, Gantner N, Chan HM, & Siciliano SD. (2009). Bioaccessibility of mercury
from traditional northern country foods measured using an in vitro gastrointestinal model
is independent of mercury concentration. Science of the Total Environment 407(23):
6003–6008.
Landry TD, Doherty RA, & Gates AH. (1979). Effects of three diets on mercury excretion after
methylmercury administration. Bulletin of Environmental Contamination and
Toxicology 22(1): 151–158.
Lapina VA, Sheshko PM, & Dontsov AE. (2000). Phytosorbent prepared from sunflower seed
husks prevents mercuric chloride accumulation in kidney and muscle of adult rabbits.
Archives of Environmental Health 55(1): 48–50.
Lebet V, Arrigoni E, & Amado R. (1998). Measurement of fermentation products and substrate
disappearance during incubation of dietary fibre sources with human faecal flora.
Lebensmittel-Weissenschaft Und-Technologie-Food Science and Technology 31: 473–
479.

60
Lee SM, Donaldson GP, Mikulski Z, Boyajian S, Ley K, & Mazmanian SK. (2013). Bacterial
colonization factors control specificity and stability of the gut microbiota. Nature
501(7467): 426–429.
Levander OA, & Cheng L. (1980). Micronutrient interactions, vitamins, minerals, and hazardous
elements. New York Academy of Sciences 355: 1–372.
Ley RE, Bäckhed F, Turnbaugh P, Lozupone CA, Knight RD, & Gordon JI. (2005). Obesity
alters gut microbial ecology. Proceedings of the National Academy of Sciences USA
102(31): 11070–11075.
Ley RE, Hamady M, Lozupone C, Turnbaugh PJ, Ramey RR, Bircher JS, Schlegel ML, Tucker
TA, Schrenzel MD, Knight R, & Gordon JI. (2008). Evolution of mammals and their gut
microbes. Science 320(5883): 1647–1651.
Licht TR, Hansen M, Bergström A, Poulsen M, Krath BN, Markowski J, ... & Wilcks A. (2010).
Effects of apples and specific apple components on the cecal environment of
conventional rats: Role of apple pectin. BMC Microbiology 10(1): 13 (11 pp).
Liebert CA, Wireman J, Smith T, & Summers AO. (1997). Phylogeny of mercury resistance
(mer) operons of gram-negative bacteria isolated from the fecal flora of primates. Applied
and Environmental Microbiology 63(3): 1066–1076.
Lin C-C, Yee N, & Barkay T. (2012). Microbial transformations in the mercury cycle. In: C Liu,
C Yong and N O’driscoll (eds.). Environmental Chemistry and Toxicology of Mercury,
pp. 155–191. John Wiley & Sons, Inc., Hoboken, NJ.
Liszt K, Zwielehner J, Handschur M, Hippe B, Thaler R, & Haslberger AG. (2009).
Characterization of bacteria, clostridia and Bacteroides in faeces of vegetarians using
qPCR and PCR-DGGE fingerprinting. Annals of Nutrition and Metabolism 54(4): 253–
257.
Lopez-Legarrea P, Fuller NR, Zulet MA, Martinez JA, & Caterson ID. (2014). The influence of
Mediterranean, carbohydrate and high protein diets on gut microbiota composition in the
treatment of obesity and associated inflammatory state. Asia Pacific Journal of Clinical
Nutrition 23(3): 360–368.
Louis P, Scott KP, Duncan SH, & Flint HJ. (2007). Understanding the effects of diet on bacterial
metabolism in the large intestine. Journal of Applied Microbiology 102(5): 1197–1208.
Lozupone C, & Knight R. (2005). UniFrac: A new phylogenetic method for comparing microbial
communities. Applied and Environmental Microbiology 71(12): 8228–8235.
Macfarlane GT, & Gibson GR. (1994). Metabolic activities of normal colonic flora. In: SAW
Gibson (ed.). Human Health: The Contribution of Microorganisms, pp. 17–52. Springer
Verlag, London, UK.
Macfarlane S, & Macfarlane GT. (2004). Bacterial diversity in the human gut. Advances in
Applied Microbiology 54: 261–289.
Macfarlane GT, & Macfarlane S. (2007). Models for intestinal fermentation: Association
between food components, delivery systems, bioavailability and functional interactions in
the gut. Current Opinion in Biotechnology 18(2): 156–162.
Macfarlane GT, & Macfarlane S. (2011). Fermentation in the human large intestine: Its
physiologic consequences and the potential contribution of prebiotics. Journal of Clinical
Gastroenterology 45(S1): 120–127.
Maier BR, Flynn MA, Burton GC, Tsutakawa RK, & Hentges DJ. (1974). Effects of a high-beef
diet on bowel flora: A preliminary report. American Journal of Clinical Nutrition 27(12):
1470–1474.

61
Marathe N, Shetty S, Lanjekar V, Ranade D, & Shouche Y. (2012). Changes in human gut flora
with age: An Indian familial study. BMC Microbiology 12(1): 222 (10 pp).
Martínez I, Kim J, Duffy PR, Schlegel VL, & Walter J. (2010). Resistant starches types 2 and 4
have differential effects on the composition of the fecal microbiota in human
subjects. PLoS ONE 5(11): e15046 (11 pp).
Matijašić BB, Obermajer T, Lipoglavšek L, Grabnar I, Avguštin G, & Rogelj I. (2014).
Association of dietary type with fecal microbiota in vegetarians and omnivores in
Slovenia. European Journal of Nutrition 53(4): 1051–1064.
McBurney MI, & Thompson LU. (1987). Effect of human faecal inoculum on in vitro
fermentation variables. British Journal of Nutrition 58(2): 233–243.
McBurney MI, & Thompson LU. (1989). Effect of human fecal donor on in vitro fermentation
variables. Scandinavian Journal of Gastroenterology 24(3): 359–367.
McMurdie PJ, & Holmes S. (2013). Phyloseq: An R package for reproducible interactive
analysis and graphics of microbiome census data. PLoS ONE 8(4): e61217 (11 pp).
Mergler D, Anderson HA, Chan LHM, Mahaffey KR, Murray M, Sakamoto M, & Stern AH.
(2007). Methylmercury exposure and health effects in humans: A worldwide concern.
AMBIO: Journal of the Human Environment 36(1): 3–11.
Miettinen JK, Rahola T, Hattula T, Rissanen K, & Tillander M. (1971). Elimination of 203Hg-
methylmercury in man. Annals of Clinical Research 3(2): 116–122.
Miura K, & Imura N. (1989). Mechanism of cytotoxicity of methylmercury: With special
reference to microtubule disruption. Biological Trace Element Research 21(1): 313–316.
Modler HW. (1994). Bifidogenic factors - sources, metabolism and applications. International
Dairy Journal 4(5): 383–407.
Molly K, Vande Woestyne M, & Verstraete W. (1993). Development of a 5-step multi-chamber
reactor as a simulation of the human intestinal microbial ecosystem. Applied
Microbiology and Biotechnology 39(2): 254–258.
Molly K, Vande Woestyne M, De Smet I, & Verstraete W. (1994). Validation of the simulator of
the human intestinal microbial ecosystem (SHIME) reactor using microorganism-
associated activities. Microbial Ecology in Health and Disease 7(4): 191–200.
Montgomery L. (1988). Isolation of human colonic fibrolytic bacteria. Letters in Applied
Microbiology 6(3): 55–57.
Muegge BD, Kuczynski J, Knights D, Clemente JC, González A, Fontana L, Henrissat B, Knight
R, & Gordon JI. (2011). Diet drives convergence in gut microbiome functions across
mammalian phylogeny and within humans. Science 332(6032): 970–974.
Murphy EF, Cotter PD, Hogan A, O'Sullivan O, Joyce A, Fouhy F, Clarke SF, Marques TM,
O'Toole PW, Stanton C, Quigley EM, Daly C, Ross PR, O'Doherty RM, & Shanahan F.
(2013). Divergent metabolic outcomes arising from targeted manipulation of the gut
microbiota in diet-induced obesity. Gut 62(2): 220–226.
Nakamura I, Hosokawa K, Tamra H, & Miura T. (1977). Reduced mercury excretion with feces
in germfree mice after oral administration of methyl mercury chloride. Bulletin of
Environmental Contamination and Toxicology 17(5): 528–533.
Norseth T, & Clarkson TW. (1970). Biotransformation of methylmercury salts in the rat studied
by specific determination of inorganic mercury. Biochemical Pharmacology 19(10):
2775–2783.

62
NRC (2000): National Research Council (NRC). Toxicological Effects of Methylmercury.
National Academy Press, Washington, DC.
Doi: http://www.nap.edu/openbook.php?isbn=0309071402 (accessed February 15, 2017).
Oksanen J, Blanchet FG, Kindt R, Legendre P, Minchin PR, O'Hara RB, ... & Wagner H. (2016).
Vegan: Community Ecology Package. R package version 2.3–4.
Ostlund K. (1969). Studies on the metabolism of methylmercury in mice. Acta Pharmacologica
et Toxicologica 27(Suppl. 1): 1–132.
Ou J, Carbonero F, Zoetendal EG, DeLany JP, Wang M, Newton K, Gaskins HR, & O'Keefe SJ.
(2013). Diet, microbiota, and microbial metabolites in colon cancer risk in rural Africans
and African Americans. American Journal of Clinical Nutrition 98(1): 111–120.
Parks JM, Johs A, Podar M, Bridou R, Hurt RA, Smith SD, Tomanicek SJ, Qian Y, Brown SD,
Brandt CC, Palumbo AV, Smith JC, Wall JD, Elias DA, & Liang L. (2013). The genetic
basis for bacterial mercury methylation. Science 339(6125): 1332–1335.
Passos CJ, Mergler D, Fillion M, Lemire M, Mertens F, Guimaraes JRD, & Philibert A. (2007).
Epidemiologic confirmation that fruit consumption influences mercury exposure in
riparian communities in the Brazilian Amazon. Environmental Research 105(2): 183–
193.
Peraza MA, Ayala-Fierro F, Barber DS, Casares E, & Rael LT. (1998). Effects of micronutrients
on metal toxicity. Environmental Health Perspectives 106(Suppl. 1): 203–216.
Poulain AJ, & Barkay T. (2013). Cracking the mercury methylation code. Science 339(6125):
1280–1281.
Price MN, Dehal PS, & Arkin AP. (2010). Fast Tree 2 – approximately maximum-likelihood
trees for large alignments. PLoS ONE 5(3): e9490 (10 pp).
Quast C, Pruesse E, Yilmaz P, Gerken J, Schweer T, Yarza P, ... & Glöckner FO. (2013). The
SILVA ribosomal RNA gene database project: Improved data processing and web-based
tools. Nucleic Acids Research 41(D1): D590–D596.
Queipo-Ortuño MI, Boto-Ordóñez M, Murri M, Gomez-Zumaquero JM, Clemente-Postigo M,
Estruch R, ... & Tinahones FJ. (2012). Influence of red wine polyphenols and ethanol on
the gut microbiota ecology and biochemical biomarkers. American Journal of Clinical
Nutrition 95(6): 1323–1334.
Ramirez-Farias C, Slezak K, Fuller Z, Duncan A, Grietje H, & Petra L. (2009). Effect of inulin
on the human gut microbiota: stimulation of Bifidobacterium adolescentis and
Faecalibacterium prausnitzii. British Journal of Nutrition 101(4): 541–550.
Rao MV, Chinoy NJ, Suthar MB, & Rajvanshi MI. (2001). Role of ascorbic acid on mercuric
chroride-induced genotoxicity in human blood cultures. Toxicology In Vitro 15(6): 649–
654.
Rao MV, & Sharma PSN. (2001). Protective effect of vitamin E against mercuric chloride
reproductive toxicity in male mice. Reproductive Toxicology 15(6): 705–712.
R Core Team (2015). RA Language and Environment Statistical Computing. R Foundation for
Statistical Computing, Vienna, Austria. Doi: http://www.cran.r-project.org.
Rice DC. (1989). Delayed neurotoxicity in monkeys exposed developmentally to
methylmercury. Neurotoxicology 10(4): 645–650.
Rice DC. (1989). Brain and tissue levels of mercury after chronic methyl mercury exposure in
the monkey. Journal of Toxicology and Environmental Health 27(2): 189–198.

63
Rideout JR, He Y, Navas-Molina JA, Walters WA, Ursell LK, Gibbons SM, Chase J, McDonald
D, ... & Caporaso JG. (2014). Subsampled open-reference clustering creates consistent,
comprehensive OTU definitions and scales to billions of sequences. PeerJ 2: e545 (25
pp).
Roberfroid MB. (1998). Prebiotics and synbiotics: Concepts and nutritional properties. British
Journal of Nutrition 80(4): 197–202.
Robert C, & Bernalier-Donadille A. (2003). The cellulolytic microflora of the human colon:
evidence of microcrystalline cellulose-degrading bacteria in methane excreting subjects.
FEMS Microbial Ecology 46(1): 81–89.
Rose DJ, Keshavarzian A, Patterson JA, Venkatachalam M, Gillevet P, & Hamaker, BR. (2009).
Starch‐entrapped microspheres extend in vitro fecal fermentation, increase butyrate
production, and influence microbiota pattern. Molecular Nutrition & Food
Research 53(S1): S121–S130.
Rothenberg SE, Korrick SA, & Fayad R. (2015). The influence of obesity on blood mercury
levels for U.S. non-pregnant adults and children: NHANES 2007–2010. Environmental
Research 138: 173–180.
Rothenberg SE, Keiser S, Ajami NJ, Wong MC, Gesell J, Petrosino JF, & Johs A. (2016). The
role of gut microbiota in fetal methylmercury exposure: Insights from a pilot
study. Journal of Toxicology Letters 242: 60–67.
Rowland M, Benet LZ, & Graham GG. (1973). Clearance concepts in pharmacokinetics. Journal
of Pharmacokinetics and Biopharmaceutics 1(2): 123–136.
Rowland IR, Grasso P, & Davies MJ. (1975). The methylation of mercuric chloride by human
intestinal bacteria. Experientia 31(9): 1064–1065.
Rowland IR, Robinson RD, Doherty RA, & Landry TD. (1983). Are developmental changes in
methylmercury metabolism and excretion mediated by the intestinal microflora? In: TW
Clarkson, GF Nordberg and PR Sagar (eds.). Reproductive and Developmental Toxicity
of Metals. pp. 745–758. Springer, New York, NY.
Rowland IR, Robinson RD, & Doherty RA. (1984). Effects of diet on mercury metabolism and
excretion in mice given methylmercury: Role of gut flora. Archives of Environmental
Health 39(6): 401–408.
Rowland IR. (1986). Reduction by the gut microflora of animals and man. Biochemical
Pharmacology 35(1): 27–32.
Russell WR, Gratz SW, Duncan SH, Holtrop G, Ince J, Scobbie L, Duncan G, …& Flint HJ.
(2011). High-protein, reduced-carbohydrate weight loss diets promote metabolite profiles
likely to be detrimental to colonic health. American Journal of Clinical Nutrition 93(5):
1062–1072.
Sajilata MG, Singhal RS, & Kulkarni PR. (2006). Resistant starch – A review. Comprehensive
Reviews in Food Science and Food Safety 5(1): 1–17.
Sakamoto M, Kubota M, Liu XJ, Murata K, Nakai K, & Satoh H. (2004). Maternal and fetal
mercury and n-3 polyunsaturated fatty acids as a risk and benefit of fish consumption to
fetus. Environmental Science and Technology 38(14): 3860–3863.
Sakamoto M, Murata K, Tsuruta K, Miyamoto K, & Akagi H. (2010). Retrospective study on
temporal and regional variations of methylmercury concentrations in preserved umbilical
cords collected from inhabitants of the Minamata area, Japan. Ecotoxicology and
Environmental Safety 73(6): 1144–1149.

64
Sanchez JI, Marzorati M, Grootaert C, Baran M, Van Craeyveld V, Courtin CM, ... & Van de
Wiele T. (2009). Arabinoxylan‐oligosaccharides (AXOS) affect the protein/carbohydrate
fermentation balance and microbial population dynamics of the Simulator of Human
Intestinal Microbial Ecosystem. Microbial Biotechnology 2(1): 101–113.
Sarafian TA, Bredesen DE, & Verity MA. (1996). Cellular resistance to methylmercury.
Neurotoxicology 17(1): 27–36.
Schaedler RW. (1973). The relationship between the host and its intestinal microflora.
Proceedings of the Nutrition Society 32(2): 41–47.
Schaefer JK, Kronberg RM, Morel FMM, & Skyllberg U. (2014). Detection of a key Hg
methylation gene, hgcA, in wetland soils. Environmental Microbiology Reports 6(5):
441–447.
Schell MA, Karmirantzou M, Snel B, Vilanova D, Berger B, Pessi G, Zwahlen MC, Desiere F,
Bork P, Delley M, Pridmore RD, & Arigoni F. (2002). The genome sequence of
Bifidobacterium longum reflects its adaptation to the human gastrointestinal tract.
Proceedings of the National Academy of Science USA 99(22): 14422–14427.
Schnorr SL, Candela M, Rampelli S, Centanni M, Consolandi C, Basaglia G, Turroni S, Biagi E,
… & Crittenden AN. (2014). Gut microbiome of the Hadza hunter-gatherers. Nature
Communications 5: 3654 (12 pp).
Schwiertz A, Lehmann U, Jacobasch G, & Blaut M. (2002). Influence of resistant starch on the
SCFA production and cell counts of butyrate-producing Eubacterium spp. in the human
intestine. Journal of Applied Microbiology 93(1): 157–162.
Scott KP, Martin JC, Campbell G, Mayer C-D, & Flint HJ. (2006). Whole-genome transcription
profiling reveals genes up-regulated by growth on fucose in the human gut bacterium
‘Roseburia inulinivorans’. Journal of Bacteriology 188(12): 4340–4349.
Seko Y, Miura T, Takahashi T., & Koyama T. (1981). Methyl mercury decomposition in mice
treated with antibiotics. Acta Pharmacologica et Toxicologica 49(4): 259–265.
Selin NE. (2009). Global biogeochemical cycling of mercury: A review. Annual Review of
Environment and Resources 34(1): 1–457.
Shanker G, & Aschner M. (2001). Identification and characterization of uptake systems for
cystine and cysteine in cultured astrocytes and neurons: Evidence for methylmercury-
targeted disruption of astrocyte transport. Journal of Neuroscience Research 66(5): 998–
1002.
Shannon CE. (1948). A mathematical theory of communication. Bell System Technical Journal
27: 379–423, and 623–656.
Shinohara K, Ohashi Y, Kawasumi K, Terada A, & Fujisawa T. (2010). Effect of apple intake on
fecal microbiota and metabolites in humans. Anaerobe 16(5): 510–515.
Simpson EH. (1949). Measurement of diversity. Nature 163(4148): 688–688.
Smith SD, Bridou R, Johs A, Parks JM, Elias DA, Hurt Jr. RA, Brown SD, Podar M, & Wall JD.
(2015). Site-directed mutagenesis of HgcA and HgcB reveals amino acid residues
important for mercury methylation. Applied Environmental Microbiology 81(9): 3205–
3217.
Sommer F, & Bäckhed F. (2013). The gut microbiota - Masters of host development and
physiology. Nature Reviews Microbiology 11(4): 227–238.
Sone N, Larsstuvold MK, & Kagawa Y. (1977). Effect of methyl mercury on phosphorylation,
transport, and oxidation in mammalian mitochondria. Journal of Biochemistry (Tokyo)
82(3): 859–868.

65
Sonnenburg JL, Angenent LT, & Gordon JI. (2004). Getting a grip on things: how do
communities of bacterial symbionts become established in our intestine? Nature
Immunology 5(6): 569–573.
Steer T, Carpenter H, Tuohy K, & Gibson GR. (2000). Perspectives on the role of the human gut
microbiota and its modulation by pro- and prebiotics. Nutrition Research Reviews 13(2):
229–254.
Stern AH, & Smith AE. (2003). An assessment of the cord blood: maternal blood methylmercury
ratio: implications for risk assessment. Environmental Health Perspectives 111(12):
1465–1470.
Stewart ML, & Slavin JL. (2006). Molecular weight of guar gum affects short-chain fatty acid
profile in model intestinal fermentation. Molecular Nutrition and Food Research 50(10):
971–976.
Suda I, & Hirayama K. (1992). Degradation of methyl- and ethylmercury into inorganic mercury
by hydroxyl radical produced from rat liver microsomes. Archives of Toxicology 66(6):
398–402.
Suda I, & Takahashi H. (1986). Enhanced and inhibited biotransformation of methyl mercury in
the rat spleen. Toxicology and Applied Pharmacology 82(1): 45–52.
Suzuki T, Yonemoto J, Satoh H, Naganuma A, Imura N, & Kigama T. (1984). Normal organic
and norganic mercury levels in the human feto-placental system. Journal of Applied
Toxicology 4(5): 249–252.
Swidsinski A, Loening-Baucke V, Verstraelen H, Osowska S, & Doerffel Y. (2008).
Biostructure of fecal microbiota in healthy subjects and patients with chronic idiopathic
diarrhea. Gastroenterology 135(2): 568–579.
Tan H, & O’Toole PW. (2015). Impact of diet on the human intestinal microbiota. Current
Opinion in Food Science 2: 71–77.
Tap J, Mondot S, Levenez F, Pelletier E, Caron C, Furet JP, ... & Leclerc M. (2009). Towards
the human intestinal microbiota phylogenetic core. Environmental Microbiology 11(10):
2574–2584.
Tremaroli V, & Bäckhed F. (2012). Functional interactions between the gut microbiota and host
metabolism. Nature 489(7415): 242–249.
Tuohy K. (2000). Measurement of DNA transfer in the gut using in vitro and in vivo models.
PhD Thesis, University of Surrey, Guildford, UK.
Tuohy KM, Finlay RK, Wynne AG, & Gibson GR. (2001). A human volunteer study on the
prebiotic effects of HP-inulin—faecal bacteria enumerated using fluorescent in situ
hybridisation (FISH). Anaerobe 7(3): 113–118.
Tuohy KM, Kolida S, Lustenberger AM, & Gibson GR. (2001). The prebiotic effects of biscuits
containing partially hydrolysed guar gum and fructo-oligosaccharides - A human
volunteer study. British Journal of Nutrition 86(3): 341–348.
Urano T, Naganuma A, & Imura N. (1988). Species differences in biliary excretion of
methylmercury - Role of non-protein sulfhydryls in bile. Research Communications in
Chemical Pathology and Pharmacology 62(2): 339–351.
Usuki F, Yasutake A, Umehara F, Tokunaga H, Matsumoto M, Eto K, Ishiura S, & Higuchi I.
(2001). In vivo protection of a water soluble derivative of vitamin E, Trolox, against
methyl mercuryintoxication in the rat. Neuroscience Letters 304(3): 199–203.

66
Vahter M, Akesson A, Lind B, Bjors U, Schutz A, & Berglund M. (2000). Longitudinal study of
methylmercury and inorganic mercury in blood and urine of pregnant and lactating
women, as well as in umbilical cord blood. Environmental Research 84(2): 186–194.
Van den Abbeele P, Gérard P, Rabot S, Bruneau A, El Aidy S, Derrien M, ... & Van de Wiele T.
(2011). Arabinoxylans and inulin differentially modulate the mucosal and luminal gut
microbiota and mucin‐degradation in humanized rats. Environmental
Microbiology 13(10): 2667–2680.
Vendrame S, Guglielmetti S, Riso P, Arioli S, Klimis-Zacas D, & Porrini M. (2011). Six-week
consumption of a wild blueberry powder drink increases bifidobacteria in the human
gut. Journal of Agricultural and Food Chemistry 59(24): 12815–12820.
Vonk JW, & Sijpesteijn AK. (1973). Studies on the methylation of mercuric chloride by pure
cultures of bacteria and fungi. Antonie van Leeuwenhoek 39(1): 505–513.
Walker AW, Ince J, Duncan SH, Webster LM, Holtrop G, Ze X, Brown D, Stares MD, … &
Flint HJ. (2011). Dominant and diet-responsive groups of bacteria within the human
colonic microbiota. ISME Journal 5(2): 220–230.
Walsh CT, Distefano MD, Moore MJ, Shewchuk LM, & Verdine GL. (1988). Molecular basis of
bacterial resistance to organomercurial and inorganic salts. FASEB Journal 2(2): 124–
130.
Wang Y, Boyd E, Crane S, Lu-Irving P, Krabbenhoft D, King S, ... & Barkay T. (2011).
Environmental conditions constrain the distribution and diversity of archaeal merA in
Yellowstone National Park, Wyoming, USA. Microbial Ecology 62(4): 739–752.
Watanabe S, & Koessel S. (1993). Colon cancer: An approach from molecular epidemiology.
Journal of Epidemiology 3(2): 47–61.
Wedekind KJ, Mansfield HR, & Montgomery L. (1988). Enumeration and isolation of
cellulolytic and hemicellulolytic bacteria from human feces. Applied and Environmental
Microbiology 54(6): 1530–1535.
Whanger PD. (1992). Selenium in the treatment of heavy metal poisoning and chemical
carcinogenesis. Journal of Trace Elements and Electrolytes in Health and Disease 6(4):
209–221.
Wu GD, Chen J, Hoffmann C, Bittinger K, Chen YY, Keilbaugh SA, … & Lewis JD. (2011).
Linking long-term dietary patterns with gut microbial enterotypes. Science 334(6052):
105–108.
Xu J, Bjursell MK, Himrod J, Deng S, Carmichael LK, Chiang HC, Hooper LV, & Gordon JI.
(2003). A genomic view of the human-Bacteroides thetaiotaomicron symbiosis. Science
299(5615): 2074–2076.
Xu Z, & Knight R. (2014). Dietary effects on human gut microbiome diversity. British Journal
of Nutrition 133(Suppl 0): S1–S5.
Yamamoto R, Suzuki T, Satoh H, & Kawai K. (1986). Generation and dose as modifying factors
of inorganic mercury accumulation in brain, liver, and kidneys of rats fed methylmercury.
Environmental Research 41(1): 309–318.
Yee S, & Choi BH. (1996). Oxidative stress in neurotoxic effects of methylmercury poisoning.
Neurotoxicology 17(1): 17–26.
Yorifuji T, Tsuda T, Inoue S, Takao S, & Harada M. (2011). Long-term exposure to
methylmercury and psychiatric symptoms in residents of Minamata, Japan. Environment
International 37(5): 907–913.

67
Yoshino Y, Mozai T, & Nakao K. (1966). Biochemical changes in the brain in rats poisoned with
an alkymercury compound, with special reference to the inhibition of protein synthesis in
brain cortex slices. Journal of Neurochemistry 13(11): 1223–1230.
Zhang YHP, & Lynd LR. (2004). Toward an aggregated understanding of enzymatic hydrolysis
of cellulose: Noncomplexed cellulase systems. Biotechnology and Bioengineering 88(7):
797–824.
Zhang C, Zhang M, Wang S, Han R, Cao Y, Hua W, Mao Y, Zhang X, Pang X, Wei C, Zhao G,
Chen Y, & Zhao L. (2010). Interactions between gut microbiota, host genetics and diet
relevant to development of metabolic syndromes in mice. ISME Journal 4(2): 232–241.
Zhao L. (2013). The gut microbiota and obesity: From correlation to causality. Nature Reviews
Microbiology 11(9): 639–647.
Ziemer CJ, & Gibson GR. (1998). Overview of probiotics, prebiotics and synbiotics in the
functional food concept. International Dairy Journal 8(5-6): 473–479.
Zimmer J, Lange B, Frick JS, Sauer H, Zimmermann K, Schwiertz A, ... & Enck, P. (2012). A
vegan or vegetarian diet substantially alters the human colonic faecal
microbiota. European Journal of Clinical Nutrition 66(1): 53–60.
Zoetendal EG, Raes J, van den Bogert B, Arumugam M, Booijink CCGM, Troost FJ, Bork P,
Wels M, de Vos WM, & Kleerebezem M. (2012). The human small intestinal microbiota
is driven by rapid uptake and conversion of simple carbohydrates. ISME Journal 6(7):
1415–1426.

68
Appendix A
Supplementary data 1:
Qiime pipeline for 16s rRNA data processing
#!/bin/bash
#$ -N Ria_June_2016
#$ -l mem_free=200G
#$ -q abaqus.q
#$ -j y
#$ -S /bin/bash
#1 check the mapping file
validate_mapping_file.py -m ~/matti/Ria_June_2016/Ria_June_2016_map.txt -o
~/matti/Ria_June_2016/mapping_output
#2 split libraries according to the mapping file
split_libraries.py -m ~/matti/Ria_June_2016/mapping_output/Ria_June_2016_map_corrected.txt
-f ~/matti/Ria_June_2016/Ria_June_2016.fasta -q ~/matti/Ria_June_2016/Ria_June_2016.qual -
o ~/matti/Ria_June_2016/split_library_output -b 8 -l 300 -L 600
#3 vsearch chimera check against reference SILVA123 core alignment, output both non-chimeric
(forwarded into pipeline) and chimeric sequences
vsearch --uchime_ref ~/matti/Ria_June_2016/split_library_output/seqs.fna --db
~/matti/SILVA123_QIIME_release/core_alignment/core_alignment_SILVA123_gold.fasta --
nonchimeras ~/matti/Ria_June_2016/seqs_chimeras_filtered.fna --
chimeras ~/matti/Ria_June_2016/seqs_chimeric.fna
#4 open reference OTU picking using default QIIME settings, uclust at 97% identity and
SILVA123 97% clustered database, ran in parallel where possible
pick_open_reference_otus.py -i ~/matti/Ria_June_2016/seqs_chimeras_filtered.fna -r
~/matti/SILVA123_QIIME_release/rep_set/rep_set_16S_only/97/97_otus_16S.fasta -o
~/matti/Ria_June_2016/openref_picking_output/ --prefilter_percent_id 0.6 -a
#5 (optional) a quick summary of the OTU table for QC
biom summarize-table -i
~/matti/Ria_June_2016/openref_picking_output/otu_table_mc2_w_tax_no_pynast_failures.biom
-o ~/matti/Ria_June_2016/openref_picking_output/otu_table_summary.txt
#6 remove singleton OTUs
filter_otus_from_otu_table.py -i
~/matti/Ria_June_2016/openref_picking_output/otu_table_mc2_w_tax_no_pynast_failures.biom
-o ~/matti/Ria_June_2016/openref_picking_output/otu_table_no_singletons.biom -n 2

69
#7 remove OTUS that matched to chloroplasts and mitochondria from the OTU table (biom table
ready!)
filter_taxa_from_otu_table.py -i
~/matti/Ria_June_2016/openref_picking_output/otu_table_no_singletons.biom -o
~/matti/Ria_June_2016/openref_picking_output/otu_table_noclo.biom -n
D_2__Chloroplast,D_4__Mitochondria
#8 (for tree file creation) remove the sequences of these otus from the pynast aligned .fasta file
filter_fasta.py -f
~/matti/Ria_June_2016/openref_picking_output/pynast_aligned_seqs/rep_set_aligned_pfiltered.f
asta -b ~/matti/Ria_June_2016/openref_picking_output/otu_table_noclo.biom -o
~/matti/Ria_June_2016/openref_picking_output/pynast_aligned_seqs/rep_set_aligned_pfiltered_
noclo.fasta
#9 (for tree file creation) (this command originates from primer prospector 1.0.1) clean up the
pynast aligned .fasta file (remove the aligning)
clean_fasta.py -f
~/matti/Ria_June_2016/openref_picking_output/pynast_aligned_seqs/rep_set_aligned_pfiltered_
noclo.fasta -o ~/matti/Ria_June_2016/openref_picking_output/pynast_aligned_seqs
#10 (for tree file creation) realign the rep set .fasta file without singletons, the chloroplast and
mitochondria to the SILVA123 core alignment
align_seqs.py -i
~/matti/Ria_June_2016/openref_picking_output/pynast_aligned_seqs/rep_set_aligned_pfiltered_
noclo_filtered.fasta -o
~/matti/Ria_June_2016/openref_picking_output/pynast_aligned_seqs/realigned_root -t
~/matti/SILVA123_QIIME_release/core_alignment/core_alignment_SILVA123.fasta
#11 (for tree file creation) filter gap characters (necessary for generating an useful tree!)
filter_alignment.py -i
~/matti/Ria_June_2016/openref_picking_output/pynast_aligned_seqs/realigned_root/rep_set_ali
gned_pfiltered_noclo_filtered_aligned.fasta -o
~/matti/Ria_June_2016/openref_picking_output/pynast_aligned_seqs/realigned_root/ -e 0.10 -g
0.80
#12 (for tree file creation) make a tree of the phylogeny
make_phylogeny.py -i
~/matti/Ria_June_2016/openref_picking_output/pynast_aligned_seqs/realigned_root/rep_set_ali
gned_pfiltered_noclo_filtered_aligned_pfiltered.fasta -o
~/matti/Ria_June_2016/openref_picking_output/rep_phylo_root.tre
#13 add metadata to the OTU table (and move it to a new folder "PHYLOSEQ" for exporting)
cp ~/matti/Ria_June_2016/openref_picking_output/otu_table_noclo.biom
~/matti/PHYLOSEQ/Ria_June_2016.biom
#14 convert the OTU table to a format readable by phyloseq

70
biom convert -i ~/matti/PHYLOSEQ/Ria_June_2016.biom -o
~/matti/PHYLOSEQ/Ria_June_2016_json.biom --to-json
#15 copy the newly made tree to the "PHYLOSEQ" folder
cp ~/matti/Ria_June_2016/openref_picking_output/rep_phylo_root.tre
~/matti/PHYLOSEQ/Ria_June_2016_rep_phylo_root.tre
#16 (optional) a quick summary of the OTU table for QC
biom summarize-table -i ~/matti/PHYLOSEQ/Ria_June_2016.biom -o
~/matti/PHYLOSEQ/Ria_June_2016_summary.txt
#17 (optional) convert the OTU table to tab limited tsv
biom convert -i ~/matti/PHYLOSEQ/Ria_June_2016_json.biom -o
~/matti/PHYLOSEQ/Ria_June_2016_tsv.txt" --to-tsv --header-key taxonomy
---------------------------------------------------

71
Supplementary Table S1: Comparison of microbial diversity estimation of the 16s rRNA gene
libraries at 3% dissimilarity from Illumina sequencing analysis.
Group Reads OTUs Shannon Index Simpson Index
T0 balanced
T0 fat
T0 carbohydrate
T0 protein
48217
60419
57916
88422
2511
2925
2823
3348
4.853
4.893
4.863
4.805
0.974
0.975
0.975
0.972
T0 Hg balanced
T0 Hg fat
T0 Hg carbohydrate
T0 Hg protein
68761
84222
83524
81343
2904
3142
3230
3292
4.516
4.558
4.546
4.553
0.958
0.960
0.957
0.958
T96 balanced
T96 fat
T96 carbohydrate
T96 protein
119033
82739
105434
112110
1664
1282
1714
1617
1.881
1.675
2.039
1.782
0.439
0.383
0.475
0.411
T96 Hg balanced
T96 Hg fat
T96 Hg carbohydrate
T96 Hg protein
106377
83808
126067
106207
1699
1432
1594
1746
1.869
1.767
1.611
2.032
0.434
0.405
0.373
0.499
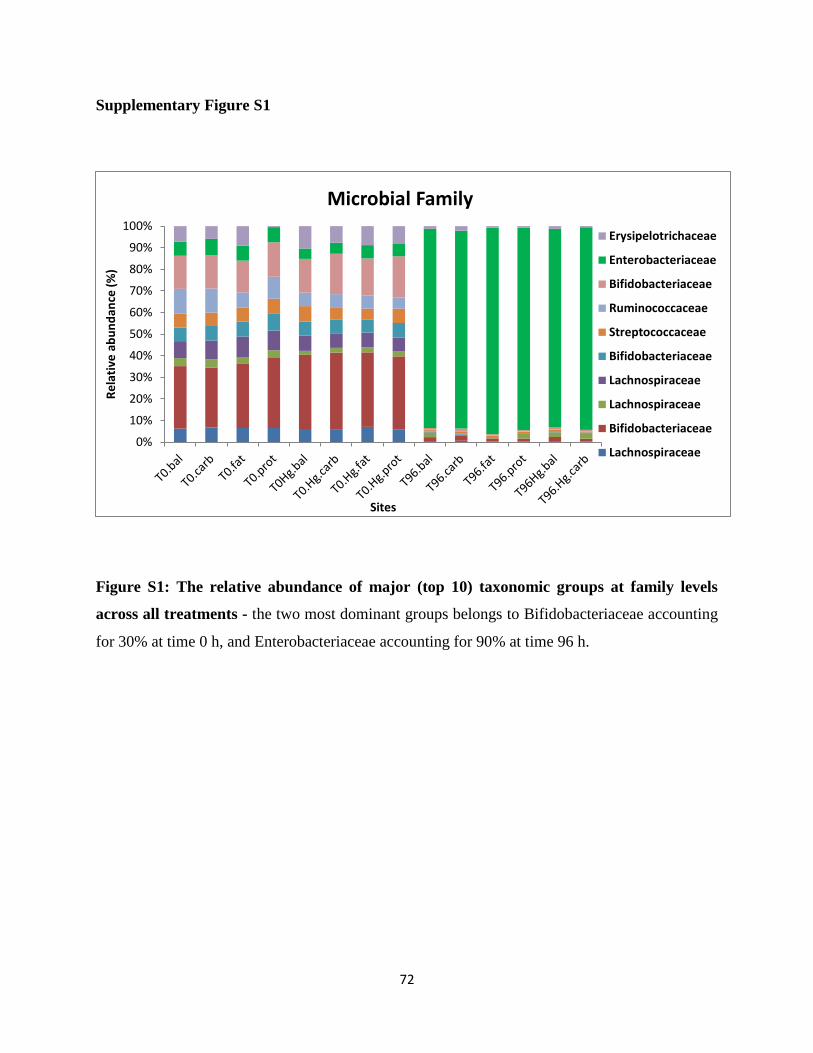
72
Supplementary Figure S1
Figure S1: The relative abundance of major (top 10) taxonomic groups at family levels
across all treatments - the two most dominant groups belongs to Bifidobacteriaceae accounting
for 30% at time 0 h, and Enterobacteriaceae accounting for 90% at time 96 h.
0%
10%
20%
30%
40%
50%
60%
70%
80%
90%
100%
Re
lati
ve a
bu
nd
ance
(%
)
Sites
Microbial Family
Erysipelotrichaceae
Enterobacteriaceae
Bifidobacteriaceae
Ruminococcaceae
Streptococcaceae
Bifidobacteriaceae
Lachnospiraceae
Lachnospiraceae
Bifidobacteriaceae
Lachnospiraceae