Embed Size (px)
Citation preview
A Study of the Earth's Crust in the IslandArea of Lofoten-Vesterålen,
Northern Norway
MARKVARD A. SELLEVOLL
Sellevoll, M. A. 1983: A study of the earth's crust in the island area of Lofoten-Vesterålen, Northern Norway. Norges geol. Unders. 380, 235-243.
The present study is based on a reinterpretation of seismic refraction data as well asgravity data collected by the Seismological Observatory, University of Bergen in theisland area of the Lofoten-Vesterålen, Northern Norway. The study shows a goodagreement between the seismic and gravity modelling of the Moho depths along theprofile line between the two shotpoints Hamnøy (Lofoten) and Stø (Vesterålen). Amaximum Moho-depth of 2b km is observed about 85 km from Stø, and it wouldseem that the rise of the Moho towards Sto is moderate. On the other hand there is adistinct shallowing of the Moho beneath the Lofoten area.
M. A. Sellevoll, Seismological Observatory, University of Bergen, Allégt. 41, N-5014Bergen-Univ., Noiway
Introduction
The crustal structure of the Lofoten-Vesterålen region of Northern Norwaywas the subject of a special study during the seismic program conducted inthe summer 1965 by the U.S. Geological Survey (Branch of Crustal Studies)and the Seismological Observatory, University of Bergen. The SeismologicalObservatory has since continued to carry out seismic and gravimetric measurements in this island area as well as on the adjacent continental margin. Thegravimetric field measurement on land was carried out in 1968 and thedeep seismic sounding was further carried out in 1969, 1970 and 1972. Thedata from the investigations on the Lofoten-Vesterålen islands have been thesubject of several M.Sc. theses (Kjenes 1970, Svela 1971, Hansen 1972,Enoksen 1973). Two papers based on the collected data have beenpublished (Thanvarachorn 1975, Sellevoll & Thanvarachorn 1977). Themain intention of the present paper is to present the results of a reinterpretation of the available seismic and gravimetric data.
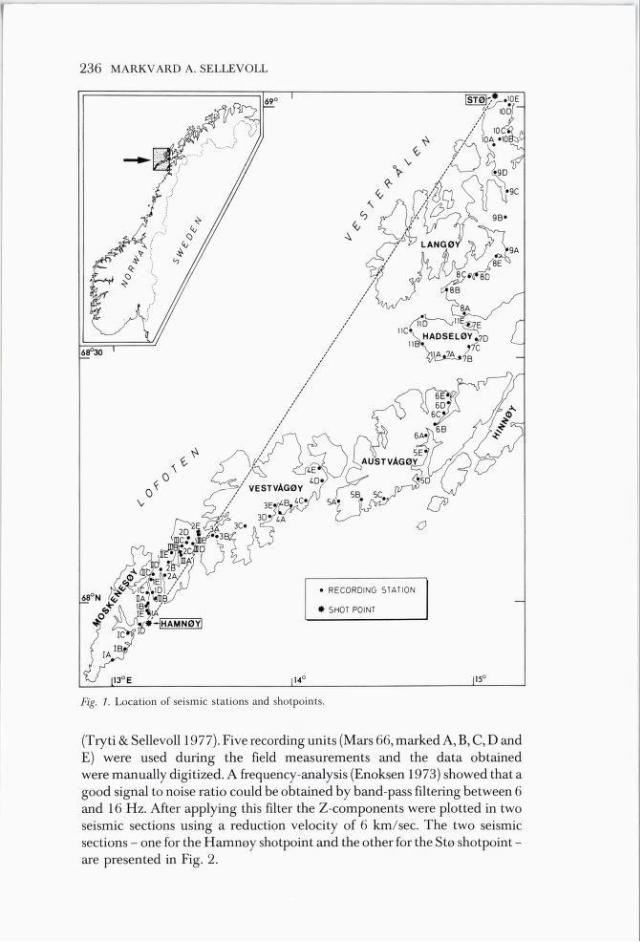
Data acquisition and analysisThe two shotpoints ('Stø' and 'Hamnøy') together with the recording sites areplotted in Fig. 1. The chargés were detonated on the sea floor at a dept of 47 m(Stø) and 45 m (Hamnøy). Tables la and lb give information about shotpoint location, shot numbers, date, explosion time and charge size. Seismicsignals were detected by a three component geophon system (HS-1/4,5 Hz)and recorded on analogue magnetic tape, together with radio time signals
236 MARKVARD A. SELLEVOLL
Fig. 7. Location of seismic stations and shotpoints.
(Tryti & Sellevoll 1977). Five recording units (Mars 66, marked A, B, C, D andE) were used during the field measurements and the data obtainedwere manually digitized. A frequency-analysis (Enoksen 1973) showed that agood signal to noise ratio could be obtained by band-pass filtering between 6and 16 Hz. After applying this filter the Z-components were plotted in twoseismic sections using a reduction velocity of 6 km/sec. The two seismicsections - one for the Hamnøy shotpoint and the other for the Stø shotpoint -are presented in Fig. 2.
A STUDY OF THE EARTH'S CRUST, LOFOTEN-VESTERÅLEN 237
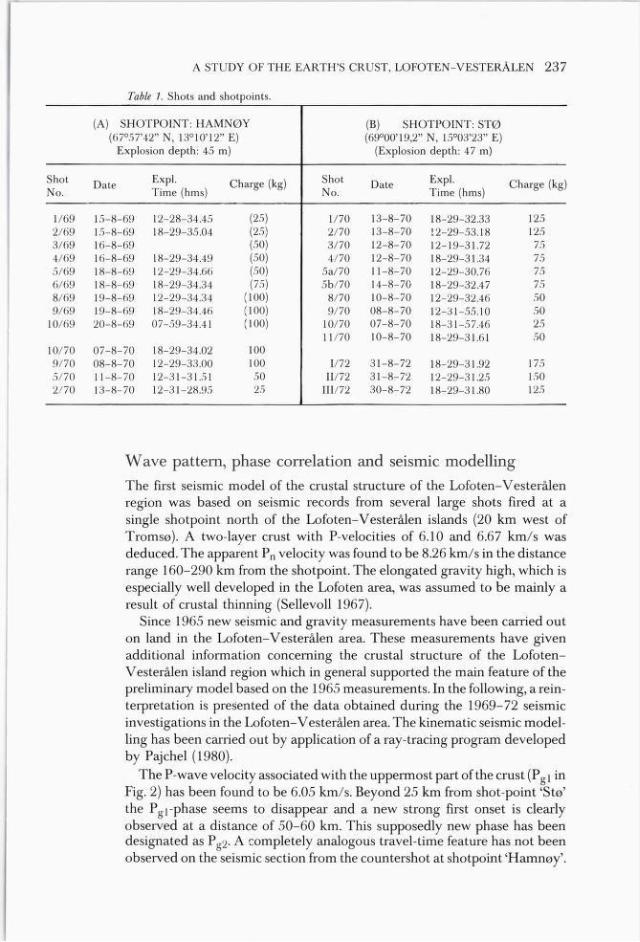
(B) SHOTPOINT: STØ(69°00'19,2" N, 15°03'23"E)
(Explosion depth: 47 m)
Wave pattern, phase correlation and seismic modellingThe first seismic model of the crustal structure of the Lofoten-Vesterålen
region was based on seismic records from several large shots fired at asingle shotpoint north of the Lofoten-Vesterålen islands (20 km west ofTromsø). A two-layer crust with P-velocities of 6.10 and 6.67 km/s wasdeduced. The apparent Pn velocity was found to be 8.26 km/s in the distancerange 160-290 km from the shotpoint. The elongated gravity high, which isespecially well developed in the Lofoten area, was assumed to be mainly aresult of crustal thinning (Sellevoll 1967).
Since 1965 new seismic and gravity measurements have been carried outon land in the Lofoten-Vesterålen area. These measurements have givenadditional information concerning the crustal structure of the Lofoten-Vesterålen island region which in general supported the main feature of thepreliminary model based on the 1965 measurements. In the following, a reinterpretation is presented of the data obtained during the 1969-72 seismicinvestigations in the Lofoten-Vesterålen area. The kinematic seismic modelling has been carried out by application of a ray-tracing program developedby Pajchel (1980).
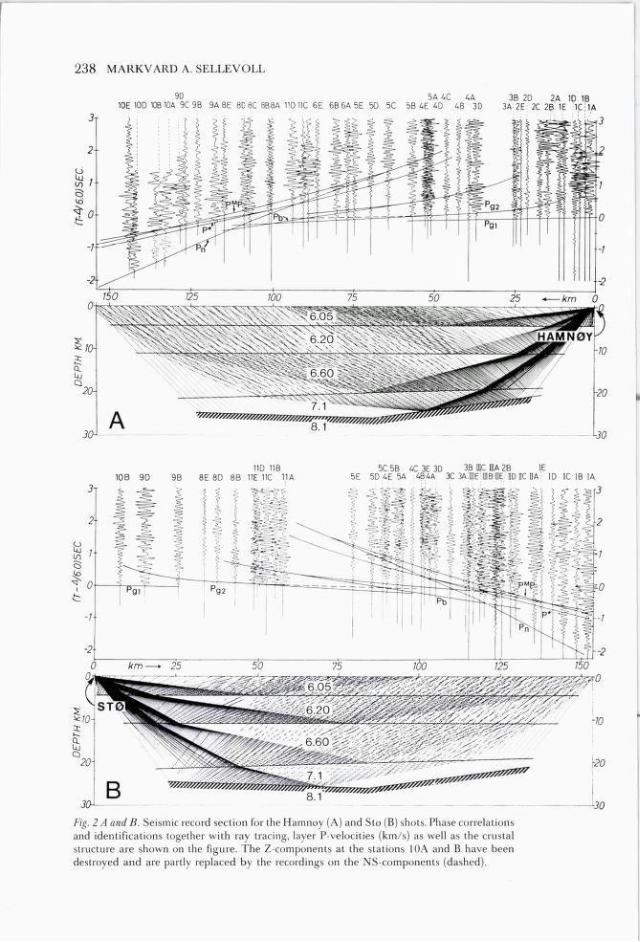
The P-wave velocity associated with the uppermost part of the crust (Pg i inFig. 2) has been found to be 6.05 km/s. Beyond 25 km from shot-point 'Stø'the Pgi-phase seems to disappear and a new strong first onset is clearlyobserved at a distance of 50-60 km. This supposedly new phase has beendesignated as P„2- A completely analogous travel-time feature has not beenobserved on the seismic section from the countershot at shotpoint 'Hamnøy'.
Shot Date Expl Charge (kg)JNo. lime (hms)
Table 7. Shots and shotpoints.
(A) SHOTPOINT: HAMNØY(67°57'42" N, 13°10'12" E)
Explosion depth: 45 m)
hot Date 1' . Charge (kg)J\lo. lime (nms)
1/69 15-8-69 12-28-34.45 (25)2/69 15-8-69 18-29-35.04 (25)3/69 16-8-69 (50)4/69 16-8-69 18-29-34.49 (50)5/69 18-8-69 12-29-34.66 (50)6/69 18-8-69 18-29-34.34 (75)8/69 19-8-69 12-29-34.34 (100)9/69 19-8-69 18-29-34.46 (100)
10/69 20-8-69 07-59-34.41 (100)
10/70 07-8-70 18-29-34.02 1009/70 08-8-70 12-29-33.00 1005/70 11-8-70 12-31-31.51 502/70 13-8-70 12-31-28.95 25
1/70 13-8-70 18-29-32.33 1252/70 13-8-70 12-29-53.18 1253/70 12-8-70 12-19-31.72 754/70 12-8-70 18-29-31.34 75
5a/70 11-8-70 12-29-30.76 755b/70 14-8-70 18-29-32.47 75
8/70 10-8-70 12-29-32.46 509/70 08-8-70 12-31-55.10 50
10/70 07-8-70 18-31-57.46 2511/70 10-8-70 18-29-31.(il 50
1/72 31-8-72 18-29-31.92 17511/72 31-8-72 12-29-31.25 150
111/72 30-8-72 18-29-31.80 125
238 MARKVARD A. SELLEVOLL
9D 5A AC AA 3B 2D 2A 1D 1B10E 10D 108 10A 9C 9B 9A 8E BDBC BBBA 11D 11C 6E 686A5E 5D 5C 5B AE AD AB 3D 3A2E 2C 28 1E : 1C;1A
11D 118108 9D 9B 8E 8D 8B 11E 11C 11A
5C 5B AC 3E 3D 3B fflC HA 2B IE5E 5D AE 5A ABAA 3C 3AIDE: ffIB : DE DD HC DA: ID IC IB IA
Fig. 2 A and B. Seismic record section for the Hamnoy (A) and Sto (B) shots. Phase correlationsand identifications together with ray tracing, layer P-velocities (km/s) as well as the crustalstructure are shown on the figure. The Z-components at the stations 10A and B have beendestroyed and are partly replaced by the recordings on the NS-components (dashed).
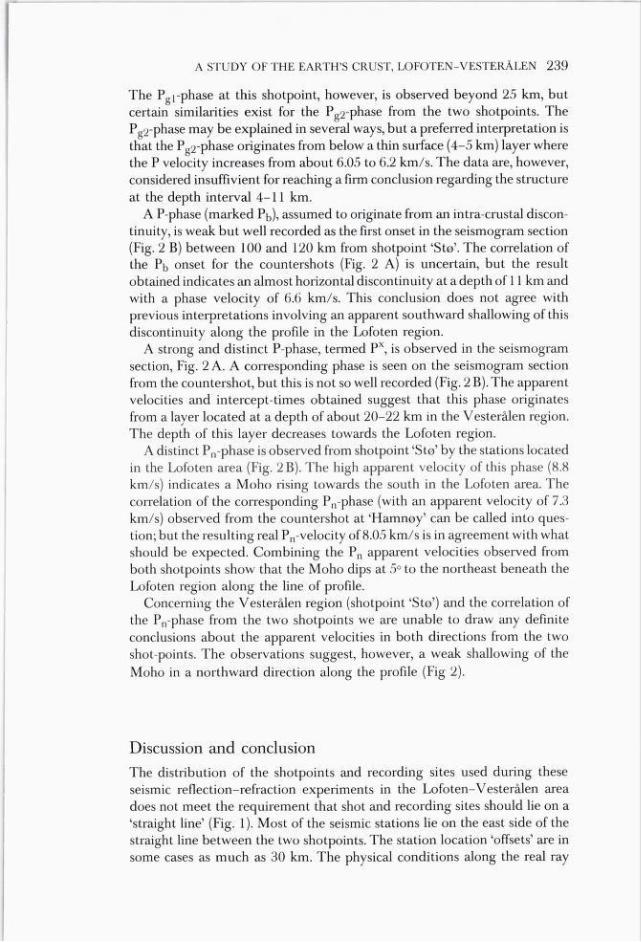
A STUDY OF THE EARTH'S CRUST, LOFOTEN-VESTERÅLEN 239
The Pgj-phase at this shotpoint, however, is observed beyond 25 km, butcertain similarities exist for the Pg2-phase from the two shotpoints. ThePS2-phase may be explained in several ways, but a preferred interpretation isthat the Pg2-phase originates from below a thin surface (4-5 km) layer wherethe P velocity increases from about 6.05 to 6.2 km/s. The data are, however,considered insuffivient for reaching a firm conclusion regarding the structureat the depth interval 4-11 km.
A P-phase (marked assumed to originate from an intra-crustal discontinuity, is weak but well recorded as the first onset in the seismogram section(Fig. 2 B) between 100 and 120 km from shotpoint 'Stø'. The correlation ofthe Pt, onset for the countershots (Fig. 2 A) is uncertain, but the resultobtained indicates an almost horizontal discontinuity at a depth of 11 km andwith a phase velocity of 6.6 km/s. This conclusion does not agree withprevious interpretations involving an apparent southward shallowing of thisdiscontinuity along the profile in the Lofoten region.
A strong and distinct P-phase, termed Px, is observed in the seismogramsection, Fig. 2 A. A corresponding phase is seen on the seismogram sectionfrom the countershot, but this is not so well recorded (Fig. 2 B). The apparentvelocities and intercept-times obtained suggest that this phase originatesfrom a layer located at a depth of about 20-22 km in the Vesterålen region.The depth of this layer decreases towards the Lofoten region.
A distinct P n-phase is observed from shotpoint 'Stø' by the stations locatedin the Lofoten area (Fig. 2B). The high apparent velocity of this phase (8.8km/s) indicates a Moho rising towards the south in the Lofoten area. Thecorrelation of the corresponding Pn-phase (with an apparent velocity of 7.3km/s) observed from the countershot at 'Hamnøy' can be called into question; but the resulting real Pn-velocity of 8.05 km/s is in agreement with whatshould be expected. Combining the Pn apparent velocities observed fromboth shotpoints show that the Moho dips at 5° to the northeast beneath theLofoten region along the line of profile.
Concerning the Vesterålen region (shotpoint 'Stø') and the correlation ofthe Pn-phase from the two shotpoints we are unable to draw any definiteconclusions about the apparent velocities in both directions from the twoshot-points. The observations suggest, however, a weak shallowing of theMoho in a northward direction along the profile (Fig 2).
Discussion and conclusion
The distribution of the shotpoints and recording sites used during theseseismic reflection-refraction experiments in the Lofoten-Vesterålen areadoes not meet the requirement that shot and recording sites should lie on a'straight line' (Fig. 1). Most of the seismic stations lie on the east side of thestraight line between the two shotpoints. The station location 'offsets' are insome cases as much as 30 km. The physical conditions along the real ray
!
240 MARKVARD A. SELLEVOLL
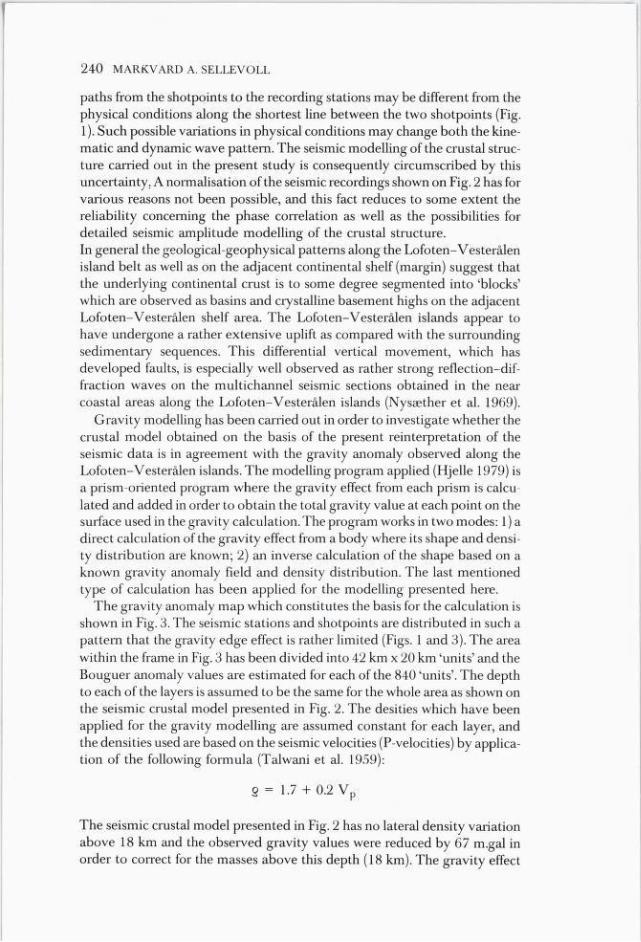
paths from the shotpoints to the recording stations may be different from thephysical conditions along the shortest line between the two shotpoints (Fig.1). Such possible variations in physical conditions may change both the kinematic and dynamic wave pattern. The seismic modelling of the crustal structure carried out in the present study is consequently circumscribed by thisuncertainty. A normalisation of the seismic recordings shown on Fig. 2 has forvarious reasons not been possible, and this fact reduces to some extent thereliability concerning the phase correlation as well as the possibilities fordetailed seismic amplitude modelling of the crustal structure.In general the geological-geophysical patterns along the Lofoten-Vesterålenisland belt as well as on the adjacent continental shelf (margin) suggest thatthe underlying continental crust is to some degree segmented into 'blocks'which are observed as basins and crystalline basement highs on the adjacentLofoten-Vesterålen shelf area. The Lofoten-Vesterålen islands appear tohave undergone a rather extensive uplift as compared with the surroundingsedimentary sequences. This differential vertical movement, which hasdeveloped faults, is especially well observed as rather strong reflection-diffraction waves on the multichannel seismic sections obtained in the near
coastal areas along the Lofoten-Vesterålen islands (Nysæther et al. 1969).Gravity modelling has been carried out in order to investigate whether the
crustal model obtained on the basis of the present reinterpretation of theseismic data is in agreement with the gravity anomaly observed along theLofoten-Vesterålen islands. The modelling program applied (Hjelle 1979) isa prism-oriented program where the gravity effect from each prism is calculated and added in order to obtain the total gravity value at each point on thesurface used in the gravity calculation. The program works in two modes: 1) adirect calculation of the gravity effect from a body where its shape and density distribution are known; 2) an inverse calculation of the shape based on aknown gravity anomaly field and density distribution. The last mentionedtype of calculation has been applied for the modelling presented here.
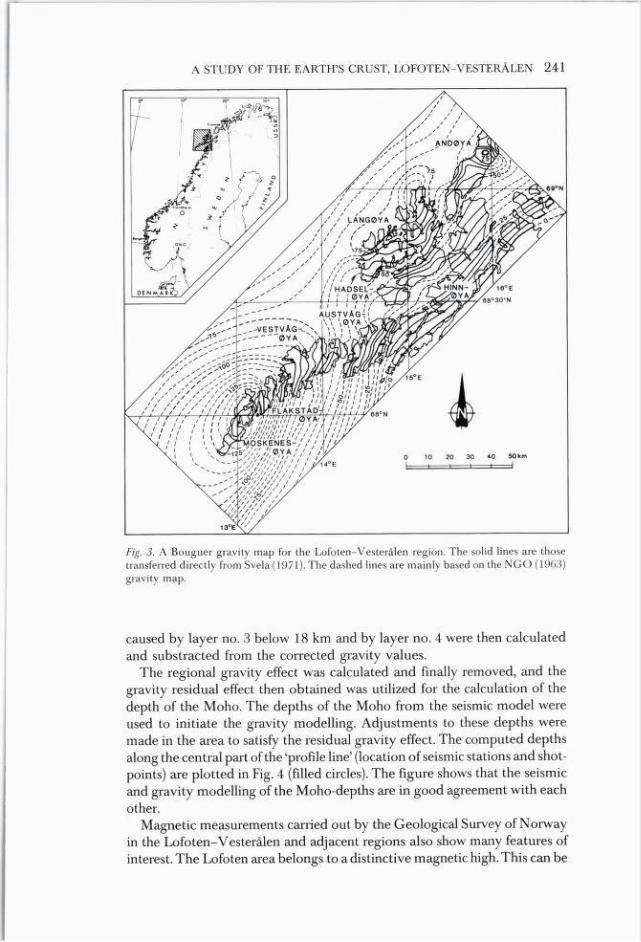
The gravity anomaly map which constitutes the basis for the calculation isshown in Fig. 3. The seismic stations and shotpoints are distributed in such apattern that the gravity edge effect is rather limited (Figs. 1 and 3). The areawithin the frame in Fig. 3 has been divided into 42 km x 20 km 'units' and theBouguer anomaly values are estimated for each of the 840 'units'. The depthto each of the layers is assumed to be the same for the whole area as shown onthe seismic crustal model presented in Fig. 2. The desities which have beenapplied for the gravity modelling are assumed constant for each layer, andthe densities used are based on the seismic velocities (P-velocities) by application of the following formula (Talwani et al. 1959):
The seismic crustal model presented in Fig. 2 has no lateral density variationabove 18 km and the observed gravity values were reduced by 67 m.gal inorder to correct for the masses above this depth (18 km). The gravity effect
§ = 1.7 + 0.2 Vp
A STUDY OF THE EARTH'S CRUST, LOFOTEN-VESTERÅLEN 241
Fig. 3. A Bouguer gravity map for the Lofoten-Vesterålen region. The solid lines are thosetransferred directly from Svela (1971). The dashed lines are mainly based on the NGO (19(53)gravity map.
caused by layer no. 3 below 18 km and by layer no. 4 were then calculatedand substracted from the corrected gravity values.
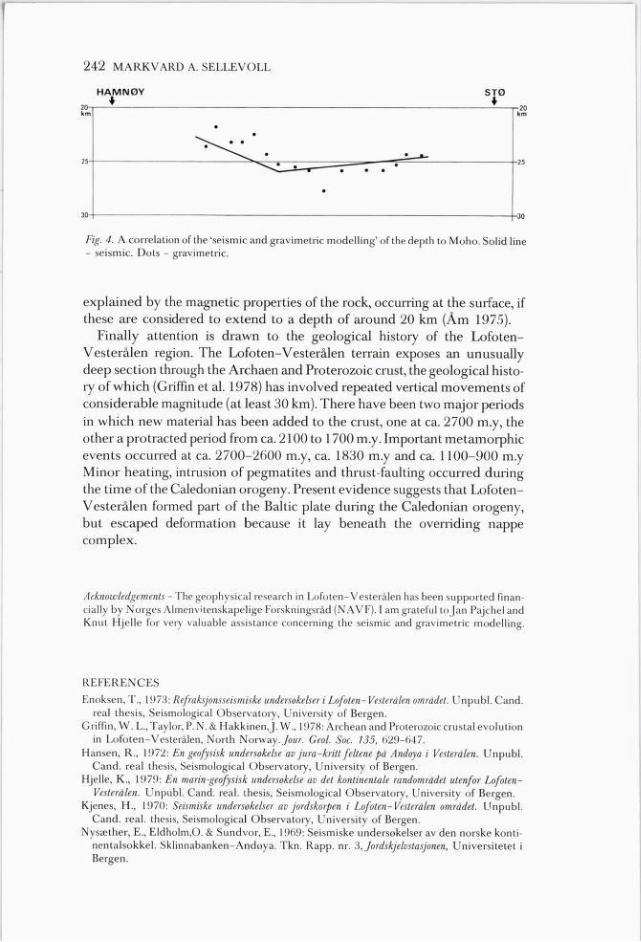
The regional gravity effect was calculated and fmally removed, and thegravity residual effect then obtained was utilized for the calculation of thedepth of the Moho. The depths of the Moho from the seismic model wereused to initiate the gravity modelling. Adjustments to these depths weremade in the area to satisfy the residual gravity effect. The computed depthsalong the central part of the 'profile line' (location of seismic stations and shotpoints) are plotted in Fig. 4 (filled circles). The figure shows that the seismicand gravity modelling of the Moho-depths are in good agreement with eachother.
Magnetic measurements carried out by the Geological Survey of Norwayin the Lofoten-Vesterålen and adjacent regions also show many features ofinterest. The Lofoten area belongs to a distinctive magnetic high. This can be
242 MARKVARD A. SELLEVOLL
Fig. 4. A correlation of the 'seismic and gravimetric modelling' of the depth to Moho. Solid line- seismic. Dots - gravimetric.
explained by the magnetic properties of the rock, occurring at the surface, ifthese are considered to extend to a depth of around 20 km (Åm 1975).
Finally attention is drawn to the geological history of the Lofoten-Vesterålen region. The Lofoten-Vesterålen terrain exposes an unusuallydeep section through the Archaen and Proterozoic crust, the geological history ofwhich (Griffin et al. 1978) has involved repeated vertical movements ofconsiderable magnitude (at least 30 km). There have been two major periodsin which new material has been added to the crust, one at ca. 2700 m.y, theother a protracted period from ca. 2100 to 1700 m.y. Important metamorphicevents occurred at ca. 2700-2600 m.y, ca. 1830 m.y and ca. 1100-900 m.yMinor heating, intrusion of pegmatites and thrust-faulting occurred duringthe time of the Caledonian orogeny. Present evidence suggests that Lofoten-Vesterålen formed part of the Baltic plate during the Caledonian orogeny,but escaped deformation because it lay beneath the overriding nappecomplex.
Acknowledgements - The geophysical research in Lofoten-Vesterålen has been supported financially by Norges Almenvitenskapelige Forskningsråd (NAVF). I am grateful to Jan Pajchel andKnut Hjelle for very valuable assistance concerning the seismic and gravimetric modelling.
REFERENCES
Fnoksen, T., 1973: Refraksjonsseismiske undersokelser i Lofoten-Vesterålen området. Unpnbl. Cand.real thesis, Seismological Observatory, University of Bergen.
Griffin, W. L., Taylor, P. N. & Hakkinen,J. W., 1978: Archean and Proterozoic crustal evolutionin Lofoten-Vesterålen, North Norway. Jour. Geol. Soc. 135, 629-647.
Hansen, R., 1972: En geofysisk undersokelse av jura-kritt feitene på Andoya i Vesterålen. Unpubl.Cand. real thesis, Seismological Observatory, University of Bergen.
Hjelle, K., 1979: En marin-geofysisk undersokelse av det kontinentale randområdet utenfor Lofoten-Vesterålen. Unpubl. Cand. real. thesis, Seismological Observatory, University of Bergen.
Kjenes, H., 1970: Seismiske undersokelser av jordskorpen i Lofoten-Vesterålen området. Unpubl.Cand. real. thesis, Seismological Observatory, University of Bergen.
Nysæther, E., Eldholm,o. & Sundvor, E., 1969: Seismiske undersokelser av den norske kontinentalsokkel. Sklinnabanken-Andoya. Tkn. Rapp. nr. 3, Jordskjelvstasjonen, Universitetet iBergen.
A STUDY OF THE EARTH'S CRUST, LOFOTEN-VESTERÅLEN 243
Pajchel,J., 1980: Kinematic modelling of reflected-refracted and diffracted waves in inhomogenous media with curve-linearboundaries. Internal report, Seismological Observatory, Universityof Bergen.
Sellevoll, M. A. & Thanvarachorn, P., 1977: A seismic reconnaissance study of the earth's crustin the Lofoten-Vesterålen area, Northern Norway. The Norwegian Geotraverse Project, K.S. Heier (ed.), 101-113.
Sellevoll, M. A., 1967: Seismic measurements in Norway 196.5, Lofoten- Vesterålen region.(Sørnes & Sellevoll: Final Scientific report, ARPA No. 612-1, available at SeismologicalObservatory, University of Bergen.)
Svela, P., 1971: Gravimetriske undersokelser av Lofoten-Vesterålen området. Unpubl. Cand. realthesis, Seismological Observatory, University of Bergen.
Talwani, M., Sutten, G. M. & Wovzel, J. L., 1959: A crustal section across the Puerto Ricotrench. Jour. Geophys. Res., 1545-55.
Thanvarachorn, P., 1975: A report of preliminary seismic and gravity study of the Lofoten-Vesterålen region, Norway. Seismological Observatory, University of Bergen.
Tryti,J. & Sellevoll, M., 1977: Seismic crustal study of the Oslo Rift. Pageoph. 115/4, 1061-85.Åm, K., 1975: Aeromagnetic basement complex mapping north of latitude 62 N, Norway.
Norges geol. Unders. 316,