Embed Size (px)
Citation preview
A STUDY OF PATIENT PATHWAYS IN ALCOHOL
AND OTHER DRUG TREATMENT
Patient Pathways National Project
Lubman, D., Manning, V., Best, D., Berends, L., Mugavin, J., Lloyd, B., Lam, T., Garfield, J., Buykx, P.,
Matthews, S., Larner, A., Gao, C., Allsop, S., Room, R.
Final report
June 2014
I
A STUDY OF PATIENT PATHWAYS IN ALCOHOL AND OTHER DRUG TREATMENT
Patient Pathways National Project
Lubman, D., Manning, V., Best, D., Berends, L., Mugavin, J., Lloyd, B., Lam, T., Garfield, J., Buykx, P., Matthews, S., Larner, A., Gao, C., Allsop, S., Room, R.
FINAL REPORT
June 2014
II
© 2014 Commonwealth of Australia Reproduced with permission of the Commonwealth of Australia. Unauthorised reproduction and other uses comprised in the copyright are prohibited without permission. Copyright enquiries can be made to the lead author, at Turning Point, 54-62 Gertrude Street, Fitzroy, Victoria 3065, Australia. Published by Turning Point, which is a part of Eastern Health. This project was funded by the Commonwealth of Australia. The responsibility for all statements made in this document lies with the authors. The views of the authors do not necessarily reflect the views and position of the Commonwealth of Australia.
The correct citation for this report is:
Lubman, D., Manning, V., Best, D., Berends, L., Mugavin, J., Lloyd, B., Lam, T., Garfield, J., Buykx, P., Matthews, S., Larner, A., Gao, C., Allsop, S., Room, R. (2014). A study of patient pathways in alcohol and other drug treatment. Turning Point, Fitzroy.

III
Acknowledgements
We thank the participants who were involved across the different phases of the project for the
substantial amount of time they have given to help us understand their treatment journeys and
experiences. We would also like to thank all of the treatment service staff that supported the project
in both Victoria and West Australia, and members of Alcohol and other Drugs Council of Australia
(ADCA) for their support and expertise.
The authors also thank Mee Lee Easton and Ying Chen from the Victorian Data Linkages Unit, and
Rob Knight and Mark Gill for providing access to the data. This work could not have been completed
without the support of the Commonwealth Department of Health.
Finally, we would like to thank others members of the research team who assisted with the project:
Seraina Agramunt, Julia Butt, Sue Carruthers, Dina Eleftheriadis, Sarah Flynn, Jodie Grigg, Cherie
Helibronn, Barbara Hunter, Klaudia Jones, Shraddha Kashyap, Jessica Killian, Melaine McAleer,
Terence McCann, Vijay Rawat and Terry Slomp.
IV
Table of contents Acknowledgements..................................................................................................................... III
Table of contents ........................................................................................................................ IV
List of tables ................................................................................................................................ V
List of figures ............................................................................................................................ VIII
List of acronyms .......................................................................................................................... IX
Executive summary ...................................................................................................................... X
1. Introduction and overview .................................................................................................... 1
1.1 Study rationale .............................................................................................................................. 8
2. System description ............................................................................................................. 13
2.1 Method ....................................................................................................................................... 13
2.2 System values and principles ...................................................................................................... 15
2.3 Summary ..................................................................................................................................... 20
3. Client survey data: baseline and follow-up .......................................................................... 22
3.1 Methods ...................................................................................................................................... 22
3.2 Baseline results ........................................................................................................................... 30
3.3 Follow-up .................................................................................................................................... 40
3.4 Qualitative findings ..................................................................................................................... 62
3.5 Entry into PIT and the experience of treatment ......................................................................... 63
Continuity of care.............................................................................................................................. 69
Treatment barriers ............................................................................................................................ 74
Areas for improvement ..................................................................................................................... 77
4. Patient Pathways Priority 2a: Data linkage .......................................................................... 79
4.1 Introduction ................................................................................................................................ 79
4.2 Method ....................................................................................................................................... 79
4.3 Results ......................................................................................................................................... 83
5. Discussion and recommendations ................................................................................. - 114 -
5.1 Recommendations ................................................................................................................ - 120 -
6. References ....................................................................................................................... 123
V
List of tables
Table 1.1 Summary of the major international AOD treatment system outcome studies to date ..... 11
Table 2.1 Proportion of treatment episodes by treatment type and jurisdiction ............................... 16
Table 2.2 AOD treatment service setting by jurisdiction ..................................................................... 18
Table 2.3 Summary of performance and accountability approaches by jurisdiction, as reported in
2012 ...................................................................................................................................................... 19
Table 3.1 Items included in structured interview with clients ‘new’ to AOD treatment ..................... 25
Table 3.2 Participant characteristics at baseline ................................................................................. 31
Table 3.3 Drugs of concern by index treatment type at baseline ........................................................ 33
Table 3.4 Age comparison of Pathways sample and Victorian new-to-treatment population ........... 34
Table 3.5 Level of quality of life by index treatment type at baseline ................................................. 36
Table 3.6 Level of service use in past 12 months by index treatment type at baseline ...................... 38
Table 3.7 Contact with the justice system by index treatment type at baseline................................. 39
Table 3.8 Changes in personal circumstances at baseline and follow-up (post-PIT) (ns =549-554) .... 42
Table 3.9 Use in the years before and after PIT of AOD specialist, community and acute medical
service ................................................................................................................................................... 43
Table 3.10 Use in the years before and after PIT of AOD specialist, community and acute medical
service among outpatient participants ................................................................................................. 44
Table 3.11 Use in the years before and after PIT of AOD specialist, community and acute medical
service among acute withdrawal participants ...................................................................................... 45
Table 3.12 Use in the years before and after PIT of AOD specialist, community and acute medical
service among residential rehabilitation participants .......................................................................... 46
Table 3.13 Post PIT AOD specialist, community and acute medical service use by PDOC .................. 46
Table 3.14 Abstinence rates by service use post-PIT ........................................................................... 49
Table 3.15 Changes in severity of dependence on PDOC by PIT type ................................................. 50
Table 3.16 Changes in median score on each WHOQOL domain between baseline and follow-up for
each PIT type ......................................................................................................................................... 51
Table 3.17 Proportion of treatment episodes by treatment type and jurisdiction ............................. 58
Table 3.18 Abstinence and Success rates by PIT using weighted and unweighted data ..................... 59
VI
Table 3.19 Abstinence and Success rates by PDOC using weighted and unweighted data ................. 59
Table 3.20 Key outcome by PIT using weighted data .......................................................................... 60
Table 3.21 Key outcome by PDOC using weighted data ...................................................................... 60
Table 4.1 Definition of disease categories for emergency department and hospital diagnoses ........ 82
Table 4.2 Sociodemographic characteristics by ED presentations, 2009/10 to 2011/12, among those
who were AOD clients in 2010/11 ........................................................................................................ 84
Table 4.3 Sociodemographic characteristics by ED presentations in 2009/10, 2010/11 and 2011/12
.............................................................................................................................................................. 86
Table 4.4 Treatment type and treatment characteristics by ED presentation, 2009/10 to 2011/12 .. 88
Table 4.5 Treatment type and treatment characteristics by ED presentations in 2009/10, 2010/11
and 2011/12 .......................................................................................................................................... 89
Table 4.6 Drug use characteristics by ED presentations, 2009/10 to 2011/12 ................................... 91
Table 4.7 Drug use characteristics by ED presentations in 2009/10, 2010/11 and 2011/12 .............. 92
Table 4.8 Median number of ED presentations and median hours of ED stay for 2010/11 AOD
clients, 2009/10 to 2011/12.................................................................................................................. 92
Table 4.9 ED presentations for alcohol-related acute conditions by AOD treatment type, primary
drug of concern and treatment termination status, 2009/10, 2010/11 and 2011/12 ......................... 93
Table 4.10 ED presentations for other drug-related acute conditions by AOD treatment type,
primary drug of concern and treatment termination status, 2009/10, 2010/11 and 2011/12 ........... 94
Table 4.11 ED presentations for alcohol-related chronic conditions by AOD treatment type, primary
drug of concern and treatment termination status, 2009/10, 2010/11 and 2011/12 ......................... 95
Table 4.12 ED presentations for injuries by AOD treatment type, primary drug of concern and
treatment termination status, 2009/10, 2010/11 and 2011/12 .......................................................... 96
Table 4.13 ED presentations for non-AOD-related conditions by AOD treatment type, primary drug
of concern and treatment termination status, 2009/10, 2010/11 and 2011/12 ................................. 97
Table 4.14 Sociodemographic characteristics by hospital admission, 2009/10 to 2011/12 ............... 99
Table 4.15 Sociodemographic characteristics by hospital admission in 2009/10, 2010/11 and
2011/12 ............................................................................................................................................... 101
Table 4.16 Treatment type and treatment characteristics by admissions, 2009/10 to 2011/12 ...... 103
Table 4.17 Treatment type and treatment characteristics by admissions in 2009/10, 2010/11 and
2011/12 ............................................................................................................................................... 104
Table 4.18 Drug use characteristics by hospital admission, 2009/10 to 2011/12 ............................. 106
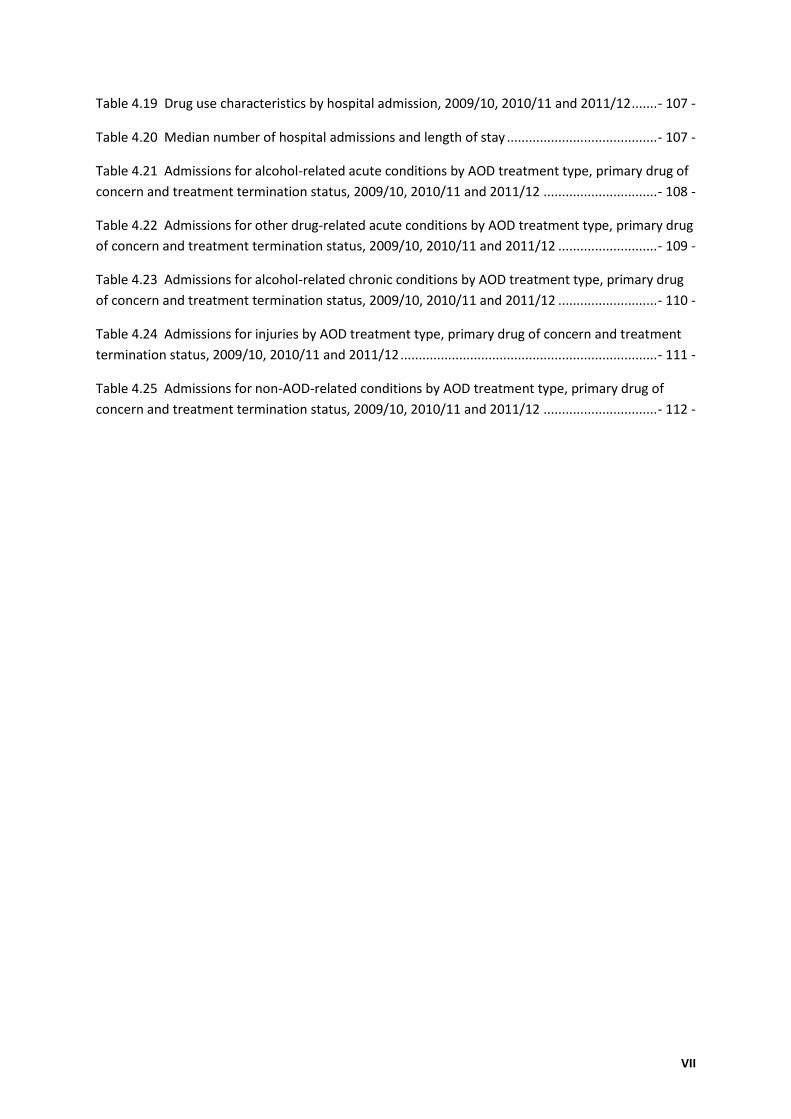
VII
Table 4.19 Drug use characteristics by hospital admission, 2009/10, 2010/11 and 2011/12 ....... - 107 -
Table 4.20 Median number of hospital admissions and length of stay ......................................... - 107 -
Table 4.21 Admissions for alcohol-related acute conditions by AOD treatment type, primary drug of
concern and treatment termination status, 2009/10, 2010/11 and 2011/12 ............................... - 108 -
Table 4.22 Admissions for other drug-related acute conditions by AOD treatment type, primary drug
of concern and treatment termination status, 2009/10, 2010/11 and 2011/12 ........................... - 109 -
Table 4.23 Admissions for alcohol-related chronic conditions by AOD treatment type, primary drug
of concern and treatment termination status, 2009/10, 2010/11 and 2011/12 ........................... - 110 -
Table 4.24 Admissions for injuries by AOD treatment type, primary drug of concern and treatment
termination status, 2009/10, 2010/11 and 2011/12 ...................................................................... - 111 -
Table 4.25 Admissions for non-AOD-related conditions by AOD treatment type, primary drug of
concern and treatment termination status, 2009/10, 2010/11 and 2011/12 ............................... - 112 -
VIII
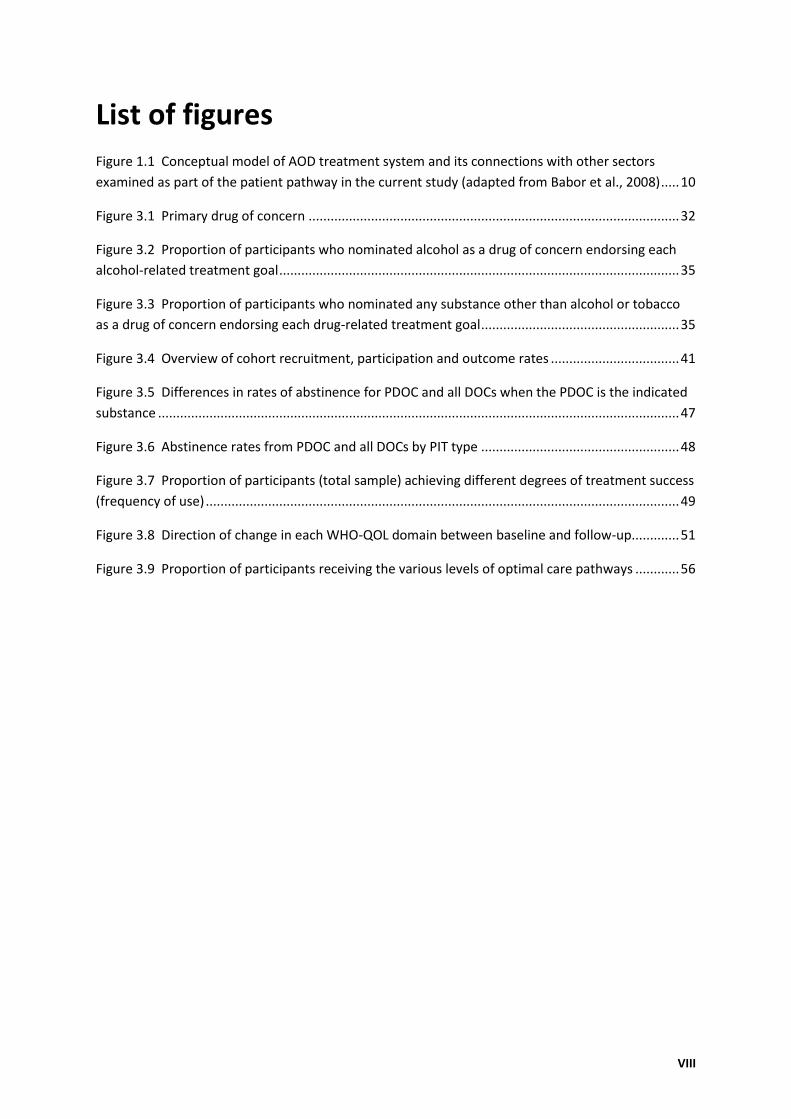
List of figures
Figure 1.1 Conceptual model of AOD treatment system and its connections with other sectors
examined as part of the patient pathway in the current study (adapted from Babor et al., 2008) ..... 10
Figure 3.1 Primary drug of concern ..................................................................................................... 32
Figure 3.2 Proportion of participants who nominated alcohol as a drug of concern endorsing each
alcohol-related treatment goal ............................................................................................................. 35
Figure 3.3 Proportion of participants who nominated any substance other than alcohol or tobacco
as a drug of concern endorsing each drug-related treatment goal ...................................................... 35
Figure 3.4 Overview of cohort recruitment, participation and outcome rates ................................... 41
Figure 3.5 Differences in rates of abstinence for PDOC and all DOCs when the PDOC is the indicated
substance .............................................................................................................................................. 47
Figure 3.6 Abstinence rates from PDOC and all DOCs by PIT type ...................................................... 48
Figure 3.7 Proportion of participants (total sample) achieving different degrees of treatment success
(frequency of use) ................................................................................................................................. 49
Figure 3.8 Direction of change in each WHO-QOL domain between baseline and follow-up............. 51
Figure 3.9 Proportion of participants receiving the various levels of optimal care pathways ............ 56
IX
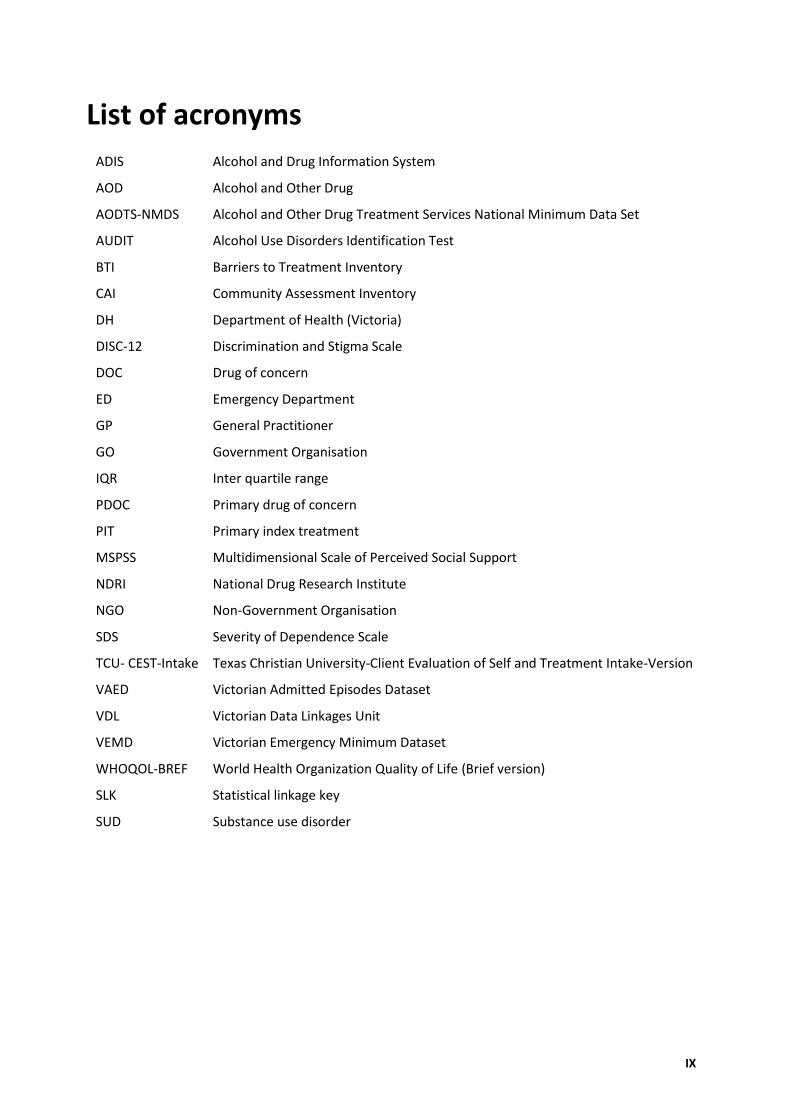
List of acronyms
ADIS Alcohol and Drug Information System
AOD Alcohol and Other Drug
AODTS-NMDS Alcohol and Other Drug Treatment Services National Minimum Data Set
AUDIT Alcohol Use Disorders Identification Test
BTI Barriers to Treatment Inventory
CAI Community Assessment Inventory
DH Department of Health (Victoria)
DISC-12 Discrimination and Stigma Scale
DOC Drug of concern
ED Emergency Department
GP General Practitioner
GO Government Organisation
IQR Inter quartile range
PDOC Primary drug of concern
PIT Primary index treatment
MSPSS Multidimensional Scale of Perceived Social Support
NDRI National Drug Research Institute
NGO Non-Government Organisation
SDS Severity of Dependence Scale
TCU- CEST-Intake Texas Christian University-Client Evaluation of Self and Treatment Intake-Version
VAED Victorian Admitted Episodes Dataset
VDL Victorian Data Linkages Unit
VEMD Victorian Emergency Minimum Dataset
WHOQOL-BREF World Health Organization Quality of Life (Brief version)
SLK Statistical linkage key
SUD Substance use disorder
X
Executive summary
1. Background:
There is now a substantial evidence base indicating that once in addiction treatment, many
individuals with alcohol and drug dependence improve. However, questions remain around what
combination of service use is associated with these improvements and how systems can be
configured to optimise and maintain positive treatment outcomes. The literature on treatment
effectiveness to date is limited in that outcome studies typically describe the response to an isolated
episode of care within a particular treatment modality (e.g., inpatient detoxification), which
represents only a fraction of the overall treatment episode. In addition, while Australian outcome
studies typically involve participants using major illicit drugs (heroin, amphetamines), there has been
no cohort study of alcohol and cannabis users in Australia, despite these being the most commonly
abused substances and the two most frequent primary drugs of concern among the 659 publicly
funded alcohol and other drug (AOD) treatment services across Australia (AIHW, 2013), accounting
for 70% of treatment episodes in 2009-10 (48% alcohol and 23% cannabis) (AIHW, 2011). Whilst
there is increasing recognition that specialist AOD services are merely one component of a larger
interconnected system which includes health and welfare services, the extent of inter- and intra-
sectorial linkage and the resulting pathways of care for clients accessing AOD specialist services
remain poorly understood. Nevertheless, Babor et al. (2008; 2010) suggest that the cumulative
impact of engaging with AOD services and non-specialist AOD services in the community should
translate into population health benefits, such as reduced mortality, morbidity, disability, suicide,
crime, unemployment and healthcare costs.
2. Study Rationale
There have been a number of international outcome studies in the addictions field although only
two in Australia – each focused on a particular class of substances. While all of the major outcome
studies have shown positive benefits for treatment, Patient Pathways is a unique study in that;
It includes both alcohol and illicit drug use
Its focus is on treatment systems and pathways through specialist and linked services, rather
than focusing exclusively on the client AOD treatment journey
It includes not only a large cohort follow-up study (with quantitative and qualitative
components), but also a linked analysis of acute harms based on data from AOD treatment
engagement, emergency departments and hospital admissions
The rationale for the Patient Pathways study was based on the recognition that clients present with
complex life problems as well as their alcohol and/or drug dependence, and are often engaged in a
diverse range of professional supports and services. The Pathways study attempted to map and
measure the systems within which individuals attempted to navigate their way through such inter-
linking services, their experiences of services and the changes in behaviours and social capital that
resulted, as well as the impact of treatment on utilisation of acute health resources.
XI
The design was unique in combining a diverse range of research methodologies and approaches to
produce a coherent model of treatment experience and navigation. The findings from each of the
components of this work are described individually prior to a description of the integrated emerging
themes and the resulting recommendations from this work.
3. Priority One: Findings from the System Description
The investigation of AOD treatment systems in each state and territory involved a documentary
analysis supported by key stakeholder interviews with a diverse range of policy makers. These
individuals subsequently participated in reviewing the initial analysis of their own jurisdictional
findings, providing invaluable context to the work conducted. The analysis showed important
commonalities as well as areas of difference across jurisdictions, with broad principles articulated in
most relevant strategic policy documents. In essence, most systems strive to provide accessible,
client-centred services that deliver evidence-based treatment within a harm-reduction framework.
There is also a general aspiration that specialist services are one part of a larger interconnected
system integrating with other health and welfare services.
Assessment, counselling and withdrawal are the central components of the treatment system in
many jurisdictions, although there is considerable variability in treatment utilised across the country.
While some client characteristics are relatively homogenous across jurisdictions (e.g. gender, age,
country of birth), there is considerable heterogeneity in terms of Indigenous status, primary drug of
concern and referral source, although it is not clear that system variations are a direct response to
differences in presenting populations or profiles. The review revealed diversity of models of service
provision across Australia, and limitations in capacity for demand modelling or mapping the
effectiveness of aspects of the treatment system.
There is apparent commitment in all states and territories to monitoring and accountability,
although the mechanisms in place vary by jurisdiction and it is an area for ongoing development.
There is clear support for ensuring AOD service systems that are accessible and responsive to the
needs of clients. Further, ensuring adequate care pathways is an objective in many states and
territories, although the challenges in achieving this are widely recognised, as are the attempts to
integrate effectively with linked services, such as primary care, mental health, criminal justice,
housing and social services.
Given the policy emphasis on accessible and interconnected service systems in most jurisdictions, it
is not clear from the evidence gathered through the document review and consultation processes
how well integrated existing AOD systems currently are, or what mechanisms exist for evaluating
this. This links to the perceived omission around formal mechanisms for demand modelling and for
mapping addiction and treatment careers. Key findings from this work have already been used by
the Drug Policy Modelling Program (DPMP), at the University of New South Wales, to inform a
Commonwealth funded review of the AOD treatment service sector.
4. Priority Two – Part 1: Treatment cohort outcomes study
In total, 796 clients were recruited between January 2012 and January 2013 from 20 AOD specialist
services in Victoria (VIC) and Western Australia (WA), of which 29% were in long-term residential
treatment, 44% in acute withdrawal services, and 27% in outpatient delivered treatment. The cohort
XII
was predominantly male (62%), Australian-born (80%), with English as their first language (95%) and
had a median age of 35.9 years. At baseline, the primary drug of concern (PDOC) was alcohol (47%);
cannabis (15%); meth/amphetamine (20%); opioids (15%); and other drugs (3%). Almost all
participants (99%) had addiction severity scores in the ‘probable dependence’ range. In addition to
severe AOD problems, the cohort had multiple life complexities. Fewer than 20% were currently
married or in a de facto relationship, fewer than one-third had participated in paid employment in
the previous 90 days, most (84%) were in receipt of government benefits, more than one-quarter
had been homeless in the past 90 days, and more than half reported having chronic medical
problems. Most had been heavily engaged in multiple AOD services and community services in the
year prior to their primary index treatment (PIT) when recruited to the study. In summary, this was a
complex sample of participants experiencing a broad range of chronic health and wellbeing
problems, who were engaged with multiple services, the majority of whom were previous users of
specialist AOD treatment.
Follow-up Results: Follow-up interviews were completed by 555 (70%) of the baseline participants
approximately one year later (mean = 380.3 days). The one-year outcome data suggested that
treatment was effective. More than half (53%) were 'treatment successes' defined as being either
abstinent from their PDOC or having reduced the frequency of non-prescribed use of the PDOC by
more than 50%, with 38% abstinent from their primary drug of choice in the month prior to the
follow-up interview. Quality of life in the physical, psychological, social and environmental domains
also improved significantly between baseline and follow-up, though mean scores remained below
Australian norms and there were high rates of ongoing involvement with specialist AOD and with
other services at the one-year follow-up.
Rates of abstinence from the PDOC during the 30 days prior to follow-up were significantly higher
among participants whose PIT was long-term residential treatment (56%), as compared to
outpatients (33%) and acute withdrawal (30%). Participants who had been in residential
rehabilitation at any point in either the year preceding their PIT or the year following had
significantly greater rates of abstinence at follow-up. Abstinence rates in the past month were
highest when the PDOC was meth/amphetamine (61%), followed by opioids (45%); cannabis (34%)
and lowest for alcohol (28%). Fourteen percent of the sample reported complete abstinence from
their PDOC throughout the entire follow-up year, and this was highest when the primary drug was
meth/amphetamine (26%, a rate markedly higher than reported in the MATES cohort study in 2012).
Taking a conservative estimate and assuming all participants who withdrew or were lost to follow-up
were still using their PDOC, the rate of treatment success in the entire baseline sample (excluding
those known to be deceased or incarcerated at follow-up) was 38% with 27% abstinent from their
PDOC in the 30 days prior to follow-up.
Predictors of treatment success (achieving abstinence or at least 50% reduced consumption of
PDOC) were examined. Significant predictors were completion of the PIT, mutual aid attendance1
post-PIT and being born outside of Australia. Significant predictors of treatment failures were having
1 Mutual aid refers to peer-support groups where people with similar experiences help each other to manage
or overcome issues and build a network of support. The most commonly attended mutual aid groups were
Alcoholics Anonymous, Narcotics Anonymous, other 12-step meetings, SMART recovery or other recovery
groups.
XIII
alcohol as the PDOC and having a longer interval between baseline and follow-up. With respect to
abstinence, a similar pattern was found whereby, significant predictors of abstinence were opioids
and meth/amphetamine as PDOC relative to alcohol, residential rehabilitation as the PIT and use of
community services as well as PIT completion and mutual aid. There was also a dose-effect of
mutual aid attendance whereby more frequent attendance generated greater benefit.
Almost three-quarters engaged in further specialist AOD treatment after their index treatment.
Rates of mutual aid engagement in the year following the baseline interview increased significantly
relative to pre-baseline rates (with 49% attending meetings). Acute medical service use (having had
an ambulance call out, ED admission or inpatient hospital admission) decreased significantly, though
remained high (with 51% having used at least one of these services at least once during the follow-
up period). Community service use remained high with 94% reporting GP visits, 35% attending
mental health services, 40% attending employment services, and 21% attending housing services in
the follow-up year.
Neither continuity in AOD specialist treatment nor community service engagement with services
meeting baseline presenting needs (in homelessness, unemployment, or poor psychological health)
were significant predictors of outcome. The strongest and most consistent predictors of abstinence
or treatment success were completion of the PIT and mutual aid attendance in the year following
their PIT. The extent to which participants received an optimal care pathway (defined by PIT
completion, continuity of AOD treatment, engagement in community services, having no unmet
needs, and mutual aid attendance) did predict abstinence from their PDOC at follow-up, with a
significantly higher likelihood of being abstinent with more optimal care pathways for alcohol but
not drug participants.
For participants who stated at baseline that abstinence was their primary treatment objective, and
this was the majority of participants in all three treatment modalities studied, the factors most
strongly associated with success were completion of the index treatment, having a treatment
journey that included residential rehabilitation and engagement in mutual aid groups (with greater
mutual aid attendance associated with better outcomes). The most notable finding was that the
outcomes were most positive when the PDOC was meth/amphetamine, which is important as it is
considered a national concern due to its relative accessibility, affordability and damaging side-effects
(Australian Crime Commission, 2014). However outcomes were markedly worse when the PDOC was
alcohol.
After weighting the data so that the Patient Pathways cohort were representative of the broader
treatment seeking population accessing AOD specialist services in Victoria and WA during 2011/12
(using data from AIHW 2013), there were few changes to the findings. Abstinence and treatment
success rates were only marginally reduced and weighted data confirmed PIT completion, mutual aid
attendance, meth/amphetamines and opioids (relative to alcohol) as significant predictors of these
outcomes. With weighted data, community service use was a significant predictor of treatment
success and the finding of significantly higher rates of abstinence among those who received any
residential rehabilitation during the two year study period was also confirmed.
XIV
5. Priority 2 – Part 2: Qualitative data
A total of 41 in-depth follow-up interviews were conducted with participants from the cohort study.
The qualitative interviews explored the individual’s route into treatment, their pathways through
specialist and other linked services, their experiences of the treatment pathway and their current
wellbeing. As demonstrated in the quantitative data, there was considerable ongoing involvement
with a range of services, but there was increased emphasis on the role of care coordination. For
participants who had not received this support, service systems were seen as complex and hard to
navigate, in spite of most participants having significant previous treatment experience. There was a
clear need for multiple service involvement as most participants described a diverse range of
complex needs that required significant support and input.
For this reason, a dominant theme in the qualitative analysis was around navigation and the need for
suitable care coordination and aftercare, particularly in the periods after completion of acute care.
Where participants did receive appropriate follow-up (even in the form of telephone calls), this was
regarded as welcome and beneficial. This was particularly important for individuals who did not have
strong family support or other forms of social capital, and only some of the sample reported
willingness to engage in mutual aid on an ongoing basis. Access to continuing and integrated care
was also limited by practical factors including geographical access, long waiting lists (particularly for
residential rehabilitation) and lack of availability of services, but also on occasion by negative
attitudes held by staff. In identifying areas for development, participants in the qualitative
interviews identified core areas around integrated care including better training in holistic
approaches and a stronger commitment to inter-agency partnership. The clear and dominant theme
from the qualitative interviews was the need for support around system navigation and the
perceived limitations of the workforce in meeting that need.
6. Priority 3: Findings from the linkage data
Overall, decreases in acute service utilisation across emergency department (ED) and hospital
inpatient settings were evident in the year following treatment engagement. These reductions were
found across most participant demographic characteristics, treatment types and drug use
characteristics. ED presentations and hospital admissions with an acute alcohol-related or other
drug-related diagnosis decreased in the year following treatment engagement, as did presentations
and admissions for a non-AOD-related condition, indicating improvements in both general health
and also the experience of acute drug-related harm, such as severe intoxication or overdose. Injury
presentations and admissions also decreased following treatment engagement, with larger
reductions evident for participants who had been engaged in residential rehabilitation in their index
year of treatment. There was stability in ED presentations and hospital admissions in the year prior
to and the year following treatment engagement for alcohol-related chronic conditions, which
reflects the long-term impacts (both morbidity and mortality) of heavy alcohol consumption even
following treatment and reduction or cessation of alcohol use. The data for the overall Victorian
AOD treatment cohort demonstrating significant reductions in emergency department presentations
in the year following engagement in AOD treatment suggest economic savings resulting from
treatment engagement.
Among the four subpopulations of AOD clients identified in terms of who presented with the key risk
factors of (i) polydrug use on entry to AOD treatment, (ii) recent injecting drug use history, (iii)
XV
homeless status on entry into treatment, and (iv) forensic status on entry into treatment, overall
reductions in ED and hospital utilisation were found following treatment engagement. This suggests
that the effects of treatment on improving health and wellbeing, and reducing health system costs
are sustained for patients presenting at higher risk of potential harm than the general AOD
treatment population. It is important to acknowledge that there were varying levels of reduction of
ED and hospital utilisation across these groups when specific treatment, drug use and
sociodemographic characteristics were examined, which offers opportunities for consideration of
targeted approaches to identify and respond to risk for specific groups within these higher risk
populations (see Supplementary Linkage Component Report).
7. Conclusion:
Patient Pathways is the largest and most ambitious research program on treatment systems and
pathways undertaken in Australia and the construction of which means its findings are of
international significance. Embedded in an analysis of system variations across Australia, the
Pathways results demonstrate that AOD treatment clients present with complex and ongoing needs
across multiple agencies and domains, whose chronicity requires a coordination within and across
professional sectors that is not always perceived to be achieved.
In spite of this, there were clear and significant improvements in the sample in use of acute health
services, in self-reported wellbeing and quality of life, alongside marked reductions in substance use.
Most participants named abstinence as their primary treatment objective and this was achieved in
the month prior to follow-up by 37% of the retained sample. The strongest treatment predictors of
abstinence were completion of the index treatment, a treatment journey including residential
rehabilitation and involvement with mutual aid groups. The study showed particularly positive
results for primary meth/amphetamine users. The study confirms the international perception that
the journey for anyone with AOD problems is protracted and characterised by multiple episodes of
care. There are significant policy and practice implications from this work as outlined below which
align with the following quote from the book Drug Policy and the Public Good (Babor et al, 2010, p.
248)
‘Policymakers who focus only on decisions about individual service programmes will usually
find that they have limited impact on the outcomes they wish to produce. In contrast,
policymakers who think and act at a systems level, and do so in light of the emerging evidence
based on the nature and impact of systems, have a much greater likelihood of making a
significant contribution to ameliorating drug problems at both the individual and population
level’.
7. Recommendations
Recommendations for promoting treatment and supporting best practice
(1) Promote the importance and benefit of accessing AOD treatment and strengthen pathways into treatment. Findings from the client survey, qualitative and linkage data illustrate that engagement with AOD treatment significantly reduces problematic substance use, improves quality of life, and reduces utilisation of acute health services. These findings are critically important for promoting clinician and client confidence. Such evidence is also important for
XVI
inspiring greater optimism about the value of treatment and recovery2 prognoses for affected families and communities, as well as key linked professions and services, such as housing, justice and mental health.
(2) (a) Promote workforce models that enhance rates of treatment completion. Given that treatment completion was a robust predictor of client outcomes, emphasis should be placed on promoting ways of building and maintaining the therapeutic alliance. This should include encouraging active client participation in care planning and review, and embedding supervision and quality assurance processes that support effective client engagement and retention in treatment.
(b) Consider structural changes to service delivery that enhance treatment completion and address barriers to help-seeking (e.g., services offered outside business hours, telephone support, etc.). Such approaches would address common barriers to treatment identified in the qualitative interviews.
Recommendations for continuity of care
(3) Promote continuity of care. Clients frequently present with complex and severe problems, and with previous experience of the treatment system. However, most funding systems currently focus on discrete, activity-based episodes of care, with little investment in structures to support continuity of care across treatment modalities and over time. In the light of the recently completed review of the AOD treatment service sector (DPMP, 2014)’, it is timely to consider funding models that promote continuity and service integration. Funding models should accommodate and promote treatment journeys that involve multiple
treatment modalities and greater linkage to follow-up care.
(4) Encourage services to engage in assertive follow-up of clients. Supported by the qualitative data, assertive follow-up of clients following treatment promotes continuity and re-engagement with the treatment system when needed. Examples could include introducing a routine telephone follow-up call 4-8 weeks after completing a treatment episode.
Recommendation for accessibility of long-term residential care
(5) Increase availability of rehabilitation places and reduce the waiting list for long-term residential care. Given the evidence from both the client survey and linkage data that better outcomes are achieved among those receiving long-term residential care, it is crucial that funders and specialist service providers recognise the critical role that rehabilitative services play in a comprehensive specialist treatment system, particularly for individuals who have greater levels of complexity. The qualitative findings indicate that long waiting times for access to residential treatment are a key barrier to treatment engagement. It is imperative that such unmet needs are addressed, and that the benefits of residential rehabilitation are promoted among clinicians and clients.
2 The term recovery as used in this report is based on work conducted by the UK Drug Policy Commission,
which defined recovery as ‘voluntarily sustained control over substance use which maximises health and
wellbeing, and participation in rights, roles and participation in society’. Controlled use in this context ‘means
‘comfortable and sustained freedom from compulsion to use’. For some this may mean abstinence, for others
it may mean abstinence supported by prescribed medication and for others consistently moderate use of
some substances (UKDPC, 2008, pp. 5-6).
XVII
Recommendation for care coordination
(6) Support care coordination. Linked to the issue of continuity of care, and identified as a key theme in the qualitative interviews, was limited availability of care coordination. Our findings highlight the importance of supporting complex clients effectively transition through the AOD treatment system and engage with relevant health and welfare services when needed, so as to enhance treatment retention and completion. While this role could be performed within agencies, there are opportunities to explore low-cost options such as telephone and online support, provided in every jurisdiction, to assist in both coordinating
care and providing a vehicle for long-term engagement and follow-up.
Recommendation for promotion of aftercare and mutual aid/peer support
(7) Specialist AOD services should develop and promote interventions and pathways to aftercare such as supportive community groups, including but not restricted to mutual aid groups. This could include assertive linkage to peer support groups, such as 12-step and SMART Recovery, using readily available and evidenced-based models that improve engagement with mutual aid (such as the MAAEZ model developed by Kaskutas and colleagues in the US). Being free and widely available (including online meetings), such support groups can be cost-effective models of aftercare, at least for some clients. Previous research has shown that such approaches require workforce training to support staff to make these initial connections and to develop relationships with mutual aid groups.
Recommendations for treatment intensity and pathways tailored to client characteristics
(8) Improve continuity of care and optimal care pathways for alcohol-dependent clients. Clients with a primary alcohol problem were less likely to have good outcomes across all arms of the study, yet benefited the most from having optimal care pathways. This suggests more intense treatment is likely to be required for these clients, but also that achieving change is more challenging in a context of high alcohol availability and acceptability. As much as possible, clients should be encouraged to continue engaging in on-going AOD treatment after completion of a treatment episode, make use of appropriate community services and receive on-going support and aftercare (e.g., mutual aid attendance). Efforts to enhance retention and early re-engagement for those who drop out of treatment are likely to improve outcomes with this population, and should be piloted. Investment in public health/community based approaches to reduce consumption and availability also warrant continued investigation so as to support individuals adversely affected by alcohol to reduce their drinking, as well as reducing and preventing alcohol-related problems across the community.
(9) Develop mechanisms for the assertive engagement of individuals with problematic meth/amphetamine use into treatment. The positive treatment outcomes achieved in this population, combined with the significant community harms accrued by those not in treatment suggests that this group should be actively engaged in treatment. This should include enhancing pathways to treatment through promoting referrals from agencies where these clients typically present (e.g. mental health, primary care and criminal justice services).
XVIII
Recommendations for future research
(10) Extend the use of linkage data, as piloted in Chapter 4. As the ‘Tracking Residential Addiction Clients for Effectiveness Research (TRACER)’ study in the UK has shown, gaining client consent for ongoing linkage work allows the mapping of long-term outcomes while requiring only limited resources, and is an important adjunct to treatment outcome research. Such data are essential for sophisticated outcome monitoring, system planning and mapping of health care and welfare service utilisation to clinical outcomes.
(11) Add a health economics dimension to such linkage studies. The linkage data offer an ideal platform for a health economics analysis of the savings associated with treatment engagement and completion by treatment type. The linkage data presented here demonstrate significant benefits in reduced acute health care utilisation, and it would be a key next step to assess its economic impact using both linkage and self-reported outcome data.
(12) Explore longer-term outcomes and pathways following AOD treatment. Given international research highlighting the broader benefits of treatment over time (up to 9 years), it is important that a further wave of follow-up is conducted to effectively measure the full impact of treatment pathways and map trajectories of recovery. Such work is particularly relevant here given that the majority of clients were still engaged with treatment services at the one year follow-up, and the full benefits of treatment engagement are unlikely to have been fully realised.
(13) Ongoing investment in treatment systems research. The present study highlights the importance of treatment systems research that considers the effectiveness of the AOD service sector itself, as well as being an integral component of a broader health and welfare system. Such studies are needed to complement the already well-established tradition of controlled studies of particular treatment modalities, which by design tell us little about the influence of context (e.g., setting, funding, workforce) and implementation challenges. Further investment in treatment system research is essential for informing the design of the Australian AOD sector, and identifying the strengths and weaknesses of particular models of care. One opportunity that exists, but is as yet unexplored, is comparing the existing jurisdictional differences in the configuration of the AOD treatment system to inform the most effective system design at a national level. Further research is also needed on how best to support the broader health and welfare system in enhancing client outcomes and reducing societal costs.
1
1. Introduction and overview
This report summarises a major program of work undertaken by Turning Point in partnership with
the National Drug Research Institute (NDRI), and Monash University and is part of a larger program
of alcohol and other drug (AOD) research funded by the Commonwealth. It is part of a wider
program of research funded by the Commonwealth Government that includes:
- The development of a quality framework for funded specialist AOD services (also a
consortium project led by Turning Point)
- A review of AOD treatment services and underpinning funding arrangements (undertaken by
DPMP)
- A review of workforce development processes and practices (undertaken by NCETA).
Extent of the problem and help seeking
Alcohol and drug misuse is a significant issue for Australia. According to the 2010 National Drug
Strategy Household Survey (AIHW, 2011), one in five (20.1%) Australians consumed alcohol at levels
that put them at risk of harm over their lifetime (more than two standard drinks a day on average),
with 28.4% drinking at least once a month at levels that put them at risk of accident or injury (more
than 4 standard drinks in a session). Recent illicit drug use (past year) was reported by 14.7% of
those aged 14 and above, including cannabis (10.3%), pharmaceuticals for non-medical purposes
(4.2%), ecstasy (3%), amphetamines (2.1%), cocaine (2.1%), hallucinogens (1.4%), and with heroin
used by 0.2% in the last 12 months.
In 2007, the National Survey of Mental Health and Wellbeing showed that one in 20 Australians
(5.1%) met the criteria for a substance use disorder, including more than one tenth (12.7%) of those
aged 16-24 years (Reavley et al., 2010). The most recent analysis of burden of disease for Australia,
in 2003, showed that alcohol accounted for 3.3% of the burden of disease, while 2% was attributed
to illicit drug use (Begg et al., 2007). This burden is significantly reduced when individuals with
alcohol or drug problems engage in specialist AOD treatment (Teesson et al. 2008; McKetin et al
2012; Gossop et al 2000; Donmall et al, 2009).
A report by the Australian Institute of Health and Welfare (2013) indicates that a total of 659 AOD
agencies provided 153,668 episodes of treatment that were closed in 2011–12, of which two-thirds
(68%) were for male clients. More than three-quarters (78%) of closed episodes ended within three
months, more than half (53%) ended within one month, one-fifth (21%) ended within one day and
only one in 11 (9%) lasted six months or longer. Alcohol was the most common principal drug of
concern (46%), followed by cannabis (22%), amphetamines (11%) and heroin (9%), though in 4 out of
5 (81%) closed episodes, the client reported additional drugs of concern. Of these, 34% reported one
additional drug and 24% reported two. Nicotine (21%) was the second most common additional drug
after cannabis (22%), but it was the principal drug for only 1% of episodes.
Alcohol was the most common principal drug of concern in all states and territories and cannabis the
second in all states and territories except South Australia, where amphetamines were more
common. Counselling was the most common type of treatment in 43% of episodes. Withdrawal
2
management and assessment only were also common: withdrawal management was a treatment
type in 18% of episodes and the main treatment type in 17%, while assessment only was the main
treatment type in 14% of episodes. Alcohol was the most common principal drug for most treatment
types, although cannabis (50%) was the most common principal drug in episodes among services
providing information and education only. Nationally, the most common source of referral for clients
receiving treatment for their own drug use in 2011–12 was self or family (41%), in all states and
territories except South Australia. The report provides a breakdown of service use by states and
territories. Whilst the median length of episodes of care nationally was 26 days, Victoria had the
highest median length of episodes of care at 38 days and South Australia the shortest at just 8 days;
the proportion of episodes of care that closed within three months ranged from 72% in Queensland
to 81% in Victoria.
Victoria: Among the two states that are the focus of the current project, Victorian AOD agencies
provided 50,004 episodes of treatment that were closed in 2011-12, of whom almost two-thirds
(66%) were male. Similarly, 66% of the 17,403 episodes of care provided by AOD agencies in
Western Australia were for males. In Victoria, alcohol was the most common principal drug of
concern (45%), followed by cannabis (23%), heroin (12%) and amphetamines (10%). When taking
into account both principal and additional drugs of concern, alcohol was still the most common
substance, accounting for 66% of episodes, whilst cannabis (49%) and amphetamines (26%) were
also high.
Western Australia: Alcohol was the most common principal drug of concern in WA, accounting for
43% of episodes, followed by cannabis (21%), amphetamines (18%) and heroin (8%). Again, when
taking into account both principal and additional drugs of concern, alcohol was still the most
common (65%), followed by cannabis (43%), amphetamines (34%) and nicotine (30%). Similar to the
national average, counselling was the most common type of primary treatment in Victoria,
accounting for 54% of closed episodes, followed by withdrawal management (21%) and support and
case management only (12%). Similarly, in WA counselling was again the most common type of main
treatment, but accounted for a higher proportion (60%) of the main treatment types than in
Victoria, and nationally. Withdrawal management was also the second highest main treatment type
in WA (14%).
Multiple and complex needs of AOD clients
Individuals presenting to public AOD services are highly marginalised and typically present with
multiple, severe and complex problems. In addition to substance use disorders, AOD service users
frequently experience unemployment, homelessness, physical and mental health comorbidity,
criminal justice involvement, social exclusion and related adversity (Laudet and White, 2010; Hesse
et al., 2007; Department of Health, 2012; VAGO, 2011). As a consequence, they place heavy
demands on the healthcare system, in particular acute medical services such as presentations to
emergency departments, ambulance call-outs, and inpatient admissions (Parthasarathy et al., 2001;
2003; Parthasarathy and Weisner 2005, Lloyd et al., 2013).
The chronic, relapsing nature of alcohol and drug addiction is characterised by cycles of treatment,
recovery, relapse, and repeated treatments (Scott et al., 2005; Dennis and Scott, 2007). However
AOD treatment is often episodic, fragmented, delivered in isolation and structured to provide
episodes of care rather than a continuing and integrated program of care (O’Brien and McLellan,
3
1996) that matched client need to intervention. This fragmented approach is particularly salient in
the context of residential treatment, which targets the most complex and severely affected
individuals, and where continuity of care is regarded as essential (Popovici et al., 2008).
A study conducted more than 20 years ago showed that clients receiving the most intensive
packages of care (including regular plus onsite medical, psychiatric, family and employment
counselling) during methadone maintenance treatment achieved the best outcomes (McLellan et al.,
1993). However, whilst exposure to treatment is an important factor, increasing the dose of any one
treatment modality alone does not improve clinical outcome. There is increasing recognition that
substance use disorders, like other chronic health problems such as diabetes, asthma, schizophrenia
etc., are best managed by ongoing monitoring and extended services than by an acute treatment
approach (McLellan et al., 2000; Lorig et al., 1999; Bodenheimer et al., 2002, Dennis et al., 2007).
The multiple and disparate needs of AOD clients must be met through a comprehensive package of
care that integrates specialist AOD treatment with non-specialist services supporting recovery and
community reintegration through housing, employment and family support (Hesse et al., 2007).
However, we know little about the extent and usefulness of service utilisation in other parts of
health and welfare since this is seldom captured in treatment outcome studies of AOD clients. The
mismatch between client severity and treatment intensity, as well as the mismatch between client
complexity and extensity and service integration, results in serial episodes of acute care as they
encounter crisis situations whilst cycling in and out of AOD treatment, resulting in a significantly
higher cost to society (AIHW, 2013).
These issues have been identified in government documents both at federal and state levels. A 2011
Victorian Auditor-General’s report criticises the AOD sector for its failure to meaningfully integrate
with non-specialist services and for inadequate pathways through specialist treatment (Victorian
Auditor-General, 2011). Within the National Drug Strategy for Australia 2010-2015 (Commonwealth
Government, 2011), under the demand reduction pillar, objective 3 is to support people to recover
from dependence and reconnect with the community, recognising that support for longer-term
recovery after treatment is most effective when the individual’s needs are placed at the centre of
their care and treatment. It highlights the role of treatment services in providing interventions
tailored to the varying needs of individuals (including the potential for access to substance-specific
treatment and services) and in referring and linking clients to a range of external services and
support (such as stable accommodation, education, vocational and employment support and social
connections). Some of the related ‘actions’ include improving communication and flow of
information between primary health care and specialist AOD providers and between clinical and
community support services, to promote continuity of care and the development of cooperative
service models. Another action is to improve links and coordination between health, education,
employment, housing and other sectors to expand the capacity to effectively link individuals from
treatment to the support required for them to reconnect with the community.
This care co-ordination can be achieved through case management which has a long and relatively
successful history for the treatment and support of several mental health conditions in the United
States, Canada, European countries and Australia (Burns, Fioritti, Holloway, Malm, & Rössler, 2001).
Case management is a client-centred strategy that includes assessment, planning, linking,
monitoring and advocacy as part of the enhancement of coordination and continuity of services, and
4
is particularly suited to AOD clients with multiple and complex needs. In particular the brokerage
case management component (Vanderplasschen et al., 2004) facilitates ongoing supportive care,
linking clients with appropriate helping resources in the community. As well as increasing
engagement in substance use disorder treatments, and active linkage to other services, it facilitates
cross agency collaboration and a transition to employment to assist clients in moving towards self-
sufficiency as they recover from AOD problems. However, a Cochrane review on the effectiveness of
case management for persons with AOD problems concluded that there is evidence supporting its
role in enhancing linkage with other services, but that evidence that it reduces drug use or produces
other beneficial outcome is not conclusive (Hesse et al., 2007).
In the US, Morgenstern et al. (2009) ran a practical clinical trial within welfare agencies comparing a
continuity of care intervention for SUDs in the form of Co-ordinated Care Management (CCM), to
usual welfare management among participants not enrolled in methadone maintenance programs.
Those receiving CCM received significantly more suitable treatment programs and ancillary services
matched to client need (e.g drug treatment, work activity, medical and mental health care, domestic
violence programs, housing, or childcare) than usual care clients and the likelihood of abstinence at
the one-year follow-up was 75% higher. The authors concluded that CCM is a promising SUD
treatment for welfare recipients, though its impact was not observed among patients receiving
methadone maintenance. An earlier Victorian report ‘Pathways- a review of the Victorian drug
treatment service system’ noted that variable connections to the other health, welfare and
employment services are required to support clients with a range of needs (Ritter et al., 2003). The
solution proposed in this service system review, however, was establishing cross-sectoral linkage
workers based in community health services, with waiting list management, assertive follow-up and
assessment carried out through a central intake unit rather than case management.
The Victorian ‘New directions for alcohol and drug treatment services – a roadmap’ document
(Department of Health, 2012) describes the new Care and Recovery Coordination role which enables
clients to be supported through treatment and connected with the other service or support needed.
The term recovery is highlighted as a key focus of the National Drug Strategy 2010-2015 (under
Objective 3 of a demand reduction approach [Pillar 1]), and states ‘recovering from drug
dependence can be a long-term process in which individuals need support and empowerment to
achieve independence, a healthy self-esteem and a meaningful life in the community. Successful
support for longer-term recovery after treatment requires strategies that are focused on the whole
individual and look across the life span. While different people will have different routes to recovery,
support for recovery is most effective when the individual’s needs are placed at the centre of their
care and treatment. Treatment service providers can help individuals recover from drug
dependence, help the individual access the internal resources they need (such as resilience, coping
skills and physical health) and ensure referral and links to a range of external services and support
(such as stable accommodation, education, vocational and employment support and social
connections)’ (Ministerial Council on Drug Strategy, 2011, p.11). A recovery-oriented approach
addresses a person’s holistic needs and circumstances with attention to what happens after formal
treatment ends. Care and recovery coordinators help reconnect AOD users with their families and
communities (e.g., by engaging with GPs, pharmacists, primary health services and other health and
human services, peer support workers, or with communities that are under-represented in
treatment), recognising that more intensive case management will be required for some.
5
Increasing community concern about health problems and service expenditure has prompted a
national program of healthcare reform in Australia, to support the efficient use of public funds.
Changes in governance, funding, and accountability arrangements are being implemented by the
Federal Government; and at state level in Victoria, through the introduction of a new AOD strategy
(Victorian Department of Health, 2012) and linked structural changes in service provision. However,
there is limited evidence to guide health system design in relation to alcohol and drug treatment –
services that currently sit outside Australia’s program of reform. AOD clients often use a range of
other services and systems; however, little is known about the magnitude and significance of this
service use. Furthermore, there is no Australian data currently available on whether, and to what
extent, AOD treatment outcomes result in better use of routine health care and reduce demand for
more intensive and costly healthcare interventions.
Treatment effectiveness / outcome studies
National data on the demand for services, characteristics of the population in need of treatment and
response to different treatment trajectories are needed to inform policy around the planning/design
of the broader treatment system and to facilitate the effective allocation of resources that will
reduce the overall cost and burden to Australian society. Large-scale, prospective, multi-site
treatment outcome studies are imperative to understanding the dynamics of treatment and its
impact on client outcomes and addiction careers over extended periods of time. However there
remains a paucity of longitudinal studies largely because of the high costs in money, effort and
organisational commitment necessary to implement, coordinate and sustain such data collection
systems over many years. The treatment outcome literature is almost entirely dominated by
research findings from the US and UK (for a summary of these studies, see Table 1).
A review of the international literature on drug treatment effectiveness undertaken for the Scottish
government (Best et al., 2010) concluded that:
significant improvements in the wake of treatment are seen across a range of indicators,
including health, offending, risk-taking, substance use and social functioning;
a range of treatment modalities demonstrate value for money, with the most recent
estimate from the Drug Treatment Outcome Research Study of a cost effectiveness ratio of
2.5:1 for savings in health and social care relative to treatment costs;
therapeutic relationships and overall service quality are important predictors of treatment
engagement and outcomes for clients;
retention in treatment for at least 90 days has been shown to be the threshold for
‘treatment gain’ in community settings;
a strong evidence base exists supporting methadone substitution treatment in maintenance
settings, but that it requires adequate psychosocial support and links to multiple addressing
complex needs in addition to prescribing;
continuity of care is a critical component of effective treatment systems; a strong evidence
base exists around linkage to peer and community ‘aftercare’ support; and
6
structured psychosocial interventions with proven efficacy in clinical trials are not routinely
translated into everyday clinical practice, due to problems around service delivery.
To date, only two treatment outcome studies have been conducted in Australia. The first is the
Australian Treatment Outcomes Study (ATOS), which recruited 825 heroin users upon entry to
maintenance therapies (methadone or buprenorphine), residential rehabilitation, and detoxification
in Sydney, Melbourne and Adelaide. The sample was followed up at one and three years (Teesson et
al., 2008) and a further sample was recruited of 80 heroin users who were not currently in
treatment. At one-year follow-up ATOS participants had received a median of two treatment
episodes since their baseline interview. There were reductions in heroin use in the past month from
baseline to 12-month follow-up (99% to 41%) which were sustained at two-year (35%) and three-
year follow-up (Teesson et al., 2008). Reductions in heroin use were accompanied by reductions in
needle sharing and injection-related health problems. There were also substantial reductions in
criminal involvement and improvements in general physical and mental health. Positive outcomes
were associated with more time in maintenance therapies and residential rehabilitation and fewer
treatment episodes. As in other studies, ATOS drew attention to the importance of stable retention
in treatment as a consistent predictor of superior treatment outcome (Darke et al., 2007). The
second Australian study, the Methamphetamines Treatment Evaluation Study (MATES) of 360
methamphetamine or amphetamine users from Sydney and Brisbane (McKetin et al., 2012) with
both 1 and 3 year follow-ups, had similar findings to ATOS. Almost half of the MATES participants
received additional treatment in the three months following their index episode. Recovery in the
MATES study was defined as continued abstinence, with reported rates of 33% at the three-month
follow-up, 14% at the one-year follow-up and only 6% at the three-year follow-up (McKetin et al.,
2012).
In addition to substance dependence, both studies gathered information on current problems,
alcohol and drug treatment experience, and past involvement with the criminal justice system. ATOS
showed that mental health and social issues were common, including anti-social (72%) and
borderline personality disorders (47%), along with high rates of attempted suicide (37%). Similarly,
many of the participants in MATES had psychiatric problems, for example major depression (38%)
and panic disorder (29%). Participants had a number of broader concerns. At baseline, half the ATOS
participants were receiving social security allowances (50%) and 41% had a prison history (Ross et
al., 2005). Just over half the MATES participants were unemployed (54%) and a substantial
proportion (31%) had been in prison (McKetin et al., 2012). Whilst both studies demonstrated
benefits from AOD treatment despite the high severity and complexity of these cases, with
substantial need for community service engagement, those with a larger treatment ‘dose’ had better
outcomes in the ATOS study, a single episode of drug treatment had only short-term benefits in the
MATES study, with a large but time-limited decrease in use of methamphetamine among clients in
residential rehabilitation.
The move to a systems model
Systems research can help to improve access, efficiency, economy, continuity of care, and
effectiveness, thereby improving the population impact of treatment services (Babor et al., 2008). As
highlighted by Babor et al (2008), most of the treatment research to date has focussed on the
efficacy of various psychotherapies (and pharmacotherapies) and client factors or treatment process
7
characteristics that mediate response to treatment. Most outcome studies have been concerned
with abstinence/reduced substance use and acute health in the short-term, focussed on a specific
modality (e.g. inpatient detoxification) or a specific drug, with very limited data gathered on the
impact of providing optimal treatment pathways for longer-term outcomes. While exposure to
treatment is an important variable in determining alcohol/drug treatment outcomes (Teesson et al.,
2008; McKetin et al., 2012), few studies have examined service utilisation within the broader social
and welfare system, hence we have limited knowledge of the optimal dose and combination of
services that best serve this complex and challenging population.
An optimal treatment pathway might include intake and assessment, inpatient withdrawal,
counselling and residential rehabilitation and care and recovery co-ordination, and links with mental
health and employment services for severely dependent clients with multiple complex needs, or
brief psychosocial interventions for lower severity clients without additional life complexities.
Spearheading this body of research is a group of US researchers (Weisner, Parthasarathy and
colleagues) demonstrating how contact with medical, mental health, welfare and legal systems
predicts clinical outcomes for this population. Engagement with such services predicted reduced
consumption in a sample of problem drinkers (Weisner et al., 2003), and in a longitudinal
observational study clients receiving continuing care (defined as having yearly primary care and
speciality substance abuse treatment and psychiatric services when needed) had twice the odds of
achieving remission at follow-ups (p<.001) as those without (Chi et al., 2011). Another US study
involving Weisner, which compared service use among private and public health clients over a
seven-year period, had similar findings. However, service use predicted remission only for private
clients, and the pattern of service use varied according to clients’ private / public status. Specifically,
private clients used more primary health and psychiatric services, while public clients tended to cycle
back into alcohol and drug treatment (Delucchi et al., 2012), a finding probably influenced by the US
healthcare financing system.
Research by Weisner and colleagues also shows the pivotal role of general practitioners in reducing
AOD clients’ use of acute services. A longitudinal observational study involving AOD clients in an
integrated managed health care plan matched client need to services and examined service
utilisation at 18 months, and then periodically over nine years. In the year before treatment, the
clients’ use of acute services was high, because of co-morbid health conditions and extreme events
such as injuries and overdose. In the year following treatment entry, clients used primary health
services a lot (Parthasarathy et al., 2012), possibly a consequence of unattended-to health problems
that had been overtaken and impacted by substance use problems. Interestingly, the frequency of
presentations to emergency departments and hospitals decreased substantially in association with
ongoing GP visits. At five-years, clients with 2-10 GP visits per annum had better alcohol and drug
treatment outcomes than clients with fewer than two visits (Mertens et al., 2008). At nine-years,
clients with a service pattern, including at least one GP session per annum and specialist treatment
as needed had lower overall health care costs (Chi et al., 2011). A ‘continuing care’ pattern of service
use - defined as regular primary care with referral to specialty care as needed, (Parthasarathy et al.,
2012), reduced overall cost, because demand for expensive services was substantially reduced.
Research involving clients in US managed-care health plans has shown that when AOD treatment is
successful, medical costs for family members are also reduced (Weisner et al., 2010). This work
reinforces the importance of service models that provide ongoing or continuing care, maintaining a
8
general level of support for clients and enabling their access to more intensive services on detection
of elevated need. There are substantial benefits for AOD clients, their families and society (in terms
both of costs and net benefits).
But while findings from the US suggest important directions for health system development, the
findings are not easily transferable to the Australian context given funding, client, and health system
variations. What is evident is the need for longitudinal research within an Australian health services
context to examine the net result of AOD on service usage and identify service models that reduce
inappropriate use of acute services while providing appropriate care. Such research will inform the
design and placement of AOD treatment in terms of integration with other parts of health service as
well as in terms of intersection with welfare services. It provides an opportunity to move beyond an
episodic, crisis-oriented approach to substance use problems to engaging in ongoing support models
that are inclusive of different parts of health, and include consideration of the role of welfare
services in responding to client concerns associated with marginalisation rather than dependence.
It is evident that, once in treatment, many clients improve. However, questions remain about what
combination of service use is associated with these improvements and how systems can be
configured to optimise and maintain these treatment outcomes. The literature on treatment
effectiveness to date is limited in that outcome studies typically describe the response to an isolated
episode of care within a particular treatment modality, e.g. inpatient detoxification, which
represents only a fraction of the overall treatment episode. In addition, while Australian outcome
studies typically involve participants using major illicit drugs (heroin, amphetamines), there has been
no cohort study of alcohol and cannabis users in Australia, despite these being the most commonly
abused substances and the two most frequent primary drugs of concern among 659 AOD services
across Australia (AIHW, 2013), accounting for 70% of treatment episodes in 2009-10 (48% alcohol
and 23% cannabis) (AIHW, 2011). Whilst there is increasing recognition that specialist AOD services
are merely one component of a larger interconnected system which includes health and welfare
services, the extent of inter and intra-sectorial linkage and the resulting pathways of care for clients
accessing AOD specialist services remain poorly understood.
Nevertheless, Babor et al. (2008; 2010) suggest that the cumulative impact of engaging with AOD
services and non-specialist AOD services in the community should translate into population health
benefits, such as reduced mortality, morbidity, disability, suicide, crime, unemployment and
healthcare costs.
1.1 Study rationale The overarching aim of the current ‘Patient Pathways’ project is to examine treatment outcomes as
they relate to trajectories of clients as they move through the AOD system, their intersection
between AOD services and other health and welfare services and the resulting demand on acute
services (see Figure 1). The research aims to examine how and when service integration occurs,
identify pertinent gaps between services, and outline optimal patient pathways in relation to
multiple treatment goals and desired outcomes (e.g. abstinence, reduced problem severity, quality
of life and treatment satisfaction) and the extent to which these vary according to patient
population (i.e. primary drug of concern, severity and client complexity).
9
This is achieved through the amalgamation of findings arising from multiple research methodologies.
The first is a review of the AOD treatment system at a national level (system description) which
provides a snapshot of the AOD treatment system in each state and territory, using two data
sources: document review and key informant interviews. The second uses quantitative research
methods in the form of a longitudinal cohort study of clients entering the AOD treatment system in
two states of Victoria and Western Australia, starting with baseline interviews which delineate the
characteristics of those entering treatment, and the extent to which they engage with primary care,
mental health acute and welfare services in the year prior to study recruitment. A one-year follow-
up enables typical treatment trajectories to be mapped out, and reports on level of satisfaction, and
the extent of subsequent engagement in health and welfare services, as well as measuring
treatment outcomes and the impact on acute service use with different treatment pathways. These
findings are complemented with data derived from the third component, involving qualitative
interviews capturing the clients’ personal experiences of their journey through the AOD treatment
system, what worked for them, and how the system can be improved to provide greater continuity
and integrated care.
Whilst longitudinal client interviews are important for determining long-term outcomes, such
approaches are reliant on the accuracy of participant recall, as well as successful retention at each
subsequent wave of assessment. Use of population level administrative data collected by health and
community service systems provides an invaluable source of information regarding AOD harms and
impacts on services, due to its capacity to capture hidden populations and to record more detailed
data than can be obtained through primary data collection methods (Matthews et al., 2013; Lloyd
and McElwee, 2011). Therefore the fourth component to the research uses record linkage data
across systems to generate a more complete picture of service utilisation without the time and recall
bias inherent in client-derived data (see ‘A study of patient pathways in alcohol and other drug
treatment - supplementary linkage component report’ (Lubman et al., 2014)) for detailed analyses
for high risk populations’). The findings from all four study components are synthesised in a final
chapter which highlights the key findings, implications for policy and practice, and provides a series
of recommendations for Commonwealth and state governments, many of whom are currently
reviewing the model of AOD service provision in Australia.
The Patient Pathways study is Australia’s largest prospective alcohol and drug treatment outcome
study, and is unique in its focus on treatment pathways and coordinated care in the year prior to
treatment entry, as well as continuity of care in the year following treatment initiation. The
Pathways study examines frequency of healthcare service use (including subsequent AOD specialist
service use, engagement with GPs, mental health etc.), as well as social/welfare service use (housing,
employment), criminal justice and acute service use (presentations to ambulances, emergency
departments, inpatient hospitalisation, etc.), providing a one-year snapshot of pathways of specialist
AOD treatment and non-specialist wraparound packages of care, with the year of experience linked
to patient outcomes.
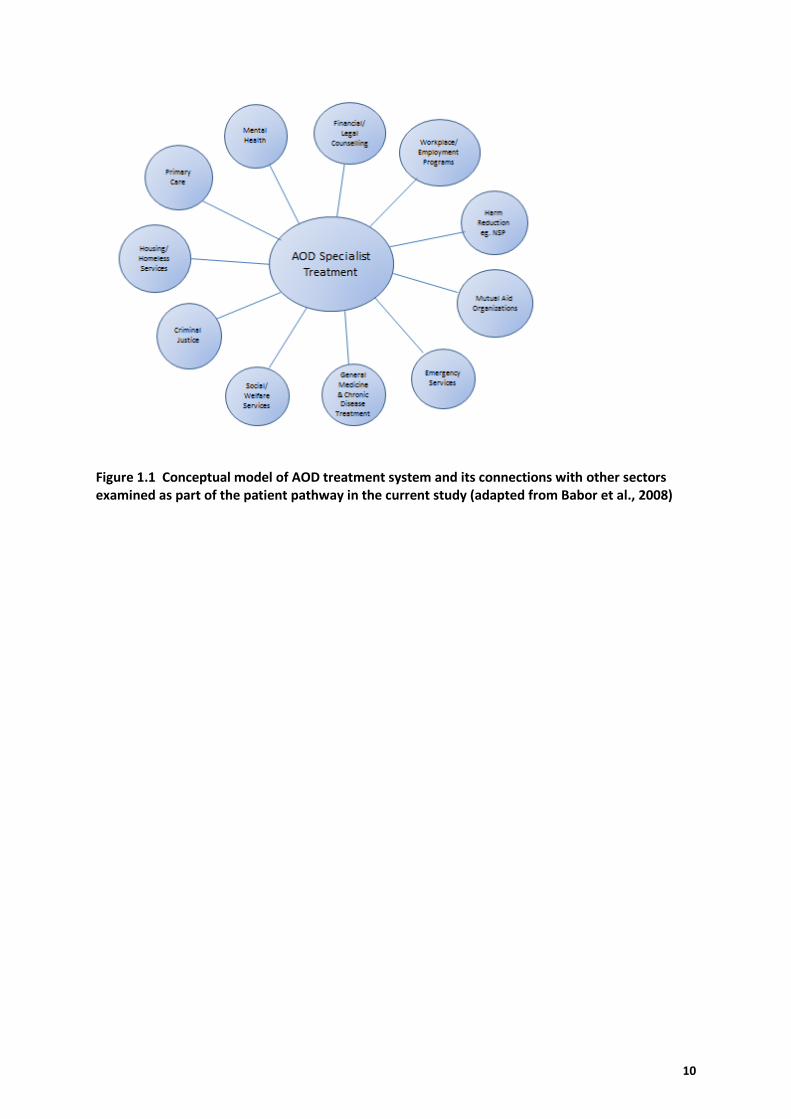
10
Figure 1.1 Conceptual model of AOD treatment system and its connections with other sectors examined as part of the patient pathway in the current study (adapted from Babor et al., 2008)
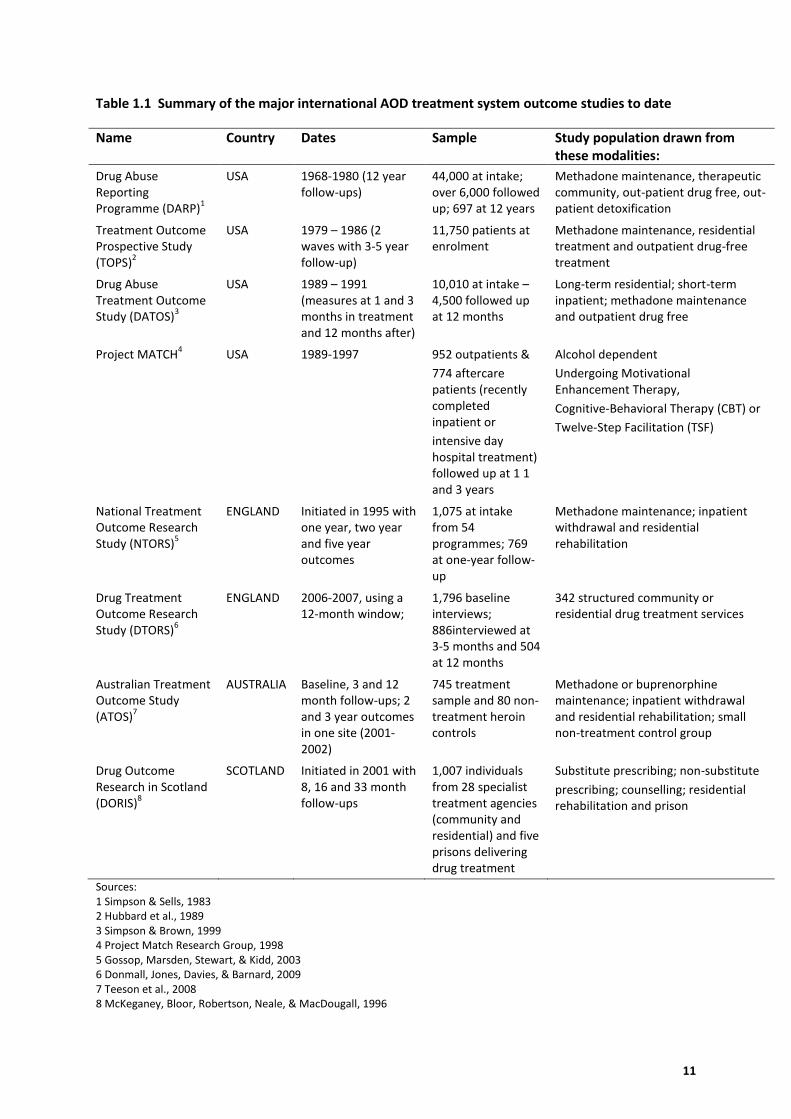
11
Table 1.1 Summary of the major international AOD treatment system outcome studies to date
Name Country Dates Sample Study population drawn from these modalities:
Drug Abuse Reporting Programme (DARP)
1
USA 1968-1980 (12 year follow-ups)
44,000 at intake; over 6,000 followed up; 697 at 12 years
Methadone maintenance, therapeutic community, out-patient drug free, out-patient detoxification
Treatment Outcome Prospective Study (TOPS)
2
USA 1979 – 1986 (2 waves with 3-5 year follow-up)
11,750 patients at enrolment
Methadone maintenance, residential treatment and outpatient drug-free treatment
Drug Abuse Treatment Outcome Study (DATOS)
3
USA 1989 – 1991 (measures at 1 and 3 months in treatment and 12 months after)
10,010 at intake –4,500 followed up at 12 months
Long-term residential; short-term inpatient; methadone maintenance and outpatient drug free
Project MATCH4 USA 1989-1997 952 outpatients &
774 aftercare patients (recently completed inpatient or
intensive day hospital treatment) followed up at 1 1 and 3 years
Alcohol dependent
Undergoing Motivational Enhancement Therapy,
Cognitive-Behavioral Therapy (CBT) or
Twelve-Step Facilitation (TSF)
National Treatment Outcome Research Study (NTORS)
5
ENGLAND Initiated in 1995 with one year, two year and five year outcomes
1,075 at intake from 54 programmes; 769 at one-year follow-up
Methadone maintenance; inpatient withdrawal and residential rehabilitation
Drug Treatment Outcome Research Study (DTORS)
6
ENGLAND 2006-2007, using a 12-month window;
1,796 baseline interviews; 886interviewed at 3-5 months and 504 at 12 months
342 structured community or residential drug treatment services
Australian Treatment Outcome Study (ATOS)
7
AUSTRALIA Baseline, 3 and 12 month follow-ups; 2 and 3 year outcomes in one site (2001-2002)
745 treatment sample and 80 non-treatment heroin controls
Methadone or buprenorphine maintenance; inpatient withdrawal and residential rehabilitation; small non-treatment control group
Drug Outcome Research in Scotland (DORIS)
8
SCOTLAND Initiated in 2001 with 8, 16 and 33 month follow-ups
1,007 individuals from 28 specialist treatment agencies (community and residential) and five prisons delivering drug treatment
Substitute prescribing; non-substitute
prescribing; counselling; residential rehabilitation and prison
Sources: 1 Simpson & Sells, 1983 2 Hubbard et al., 1989 3 Simpson & Brown, 1999 4 Project Match Research Group, 1998 5 Gossop, Marsden, Stewart, & Kidd, 2003 6 Donmall, Jones, Davies, & Barnard, 2009 7 Teeson et al., 2008 8 McKeganey, Bloor, Robertson, Neale, & MacDougall, 1996
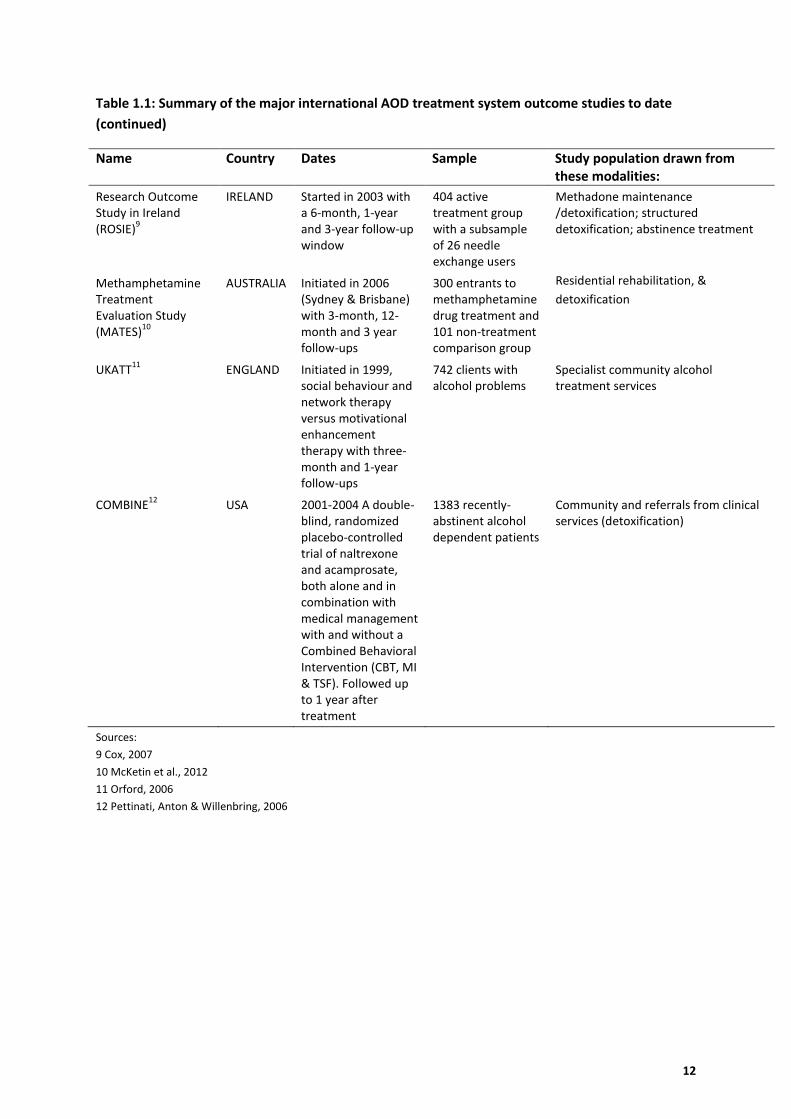
12
Table 1.1: Summary of the major international AOD treatment system outcome studies to date
(continued)
Name Country Dates Sample Study population drawn from these modalities:
Research Outcome Study in Ireland (ROSIE)
9
IRELAND Started in 2003 with a 6-month, 1-year and 3-year follow-up window
404 active treatment group with a subsample of 26 needle exchange users
Methadone maintenance /detoxification; structured detoxification; abstinence treatment
Methamphetamine Treatment Evaluation Study (MATES)
10
AUSTRALIA Initiated in 2006 (Sydney & Brisbane) with 3-month, 12-month and 3 year follow-ups
300 entrants to methamphetamine drug treatment and 101 non-treatment comparison group
Residential rehabilitation, &
detoxification
UKATT11
ENGLAND Initiated in 1999, social behaviour and network therapy versus motivational enhancement therapy with three-month and 1-year follow-ups
742 clients with alcohol problems
Specialist community alcohol treatment services
COMBINE12
USA 2001-2004 A double-blind, randomized placebo-controlled trial of naltrexone and acamprosate, both alone and in combination with medical management with and without a Combined Behavioral Intervention (CBT, MI & TSF). Followed up to 1 year after treatment
1383 recently-abstinent alcohol dependent patients
Community and referrals from clinical services (detoxification)
Sources:
9 Cox, 2007
10 McKetin et al., 2012
11 Orford, 2006
12 Pettinati, Anton & Willenbring, 2006
13
2. System description
This section addresses priority 1 of the overall study which was to document the current AOD
treatment system in Australia. This was achieved by using a mixed methods approach which
included a review of existing documents on AOD states and territories, key informant interviews
focusing on features, strengths and challenges for these systems, along with key features of an
effective systems approach and synthesis of results to identify a set of key findings for Australia.
2.1 Method
Documenting current AOD prevention and treatment systems in each Australian jurisdiction
In order to provide a ‘snapshot’ of the AOD prevention and treatment system in each state and
territory, a system synopsis was developed for each jurisdiction. Two data sources were used to
develop the synopses: document review and key informant interviews.
Document review (November 2011 – November 2013)
Publicly available material regarding the functions, resources and operation of each system was
sought from government departments, AOD peak bodies and other sources as relevant. Material
consulted included the Alcohol and Other Drug Treatment Services National Minimum Data Set
(AODTS-NMDS) 2009-103 (AIHW, 2011) and policy documents from State/Territory and
Commonwealth Governments over the time period 2008-2013. This information was used to
prepare a brief synopsis of the AOD system in each jurisdiction, with any gaps or inconsistencies in
the available information noted. Synopses were structured to cover the following areas:
1. System values and principles
2. Level and source of financial investment
3. Estimates of met and unmet need
4. Client characteristics
5. Service setting
6. Monitoring and accountability
7. Strengths and challenges
These areas were identified from a review of the literature on health services research - on how
systems are organised, financed, and delivered (Mays, 2003). This area has emerged as an important
means of informing how services and systems operate, by examining “the organisation, financing
and delivery of public health service in communities, and the impact of these services on public
health” (Mays, 2003, p. 179).
3 At the time of the consultation the 2009/10 was most recent data available.
14
Draft synopses were then distributed to key informants (described below) for input and comment. In
some cases, key informants provided comments and additional information prior to the face-to-face
consultations.
Key informant interviews (January 2012 – October 2012)
Key informants from each state and territory were approached to verify the system synopsis specific
to their jurisdiction. Within each state and territory, the most senior government employee with
direct responsibility for AOD policy and programmes and the head of the AOD sector peak body
were sent an email to explain the project and inviting them to take part in an informal consultation
interview (non-respondents were followed up with a second email request and then a telephone
call). These key informants nominated other participants and group interviews were held. A total of
39 key informants were involved (ACT = 5, NSW = 3, NT = 6, QLD = 4, SA = 4, TAS = 9, VIC = 3, WA =
5).
Each key informant was provided with the relevant draft synopsis prior to meeting with the
researchers. During the consultation, participants were asked to indicate which aspects of the
synopsis they regarded as accurately representing the AOD system in their jurisdiction, to challenge
aspects which they considered incorrect and, where possible, to provide information to fill any gaps.
Key informants were also asked to comment on the strengths and challenges of the AOD system in
which they work and to identify what they consider to be the key features of an effective system.
Notes were taken during the interview and the conversations were digitally recorded to assist with
ensuring the accuracy of the notes.
Refinement of synopses (June 2012 – July 2013)
At the conclusion of the interviews, each jurisdictional synopsis was refined to incorporate
information obtained during the consultation process. The research team received additional
documentary material from key informants before, during and after the key informant interviews.
The refined synopses were sent back to the state and territory government key informants for
further comment and subsequently finalised.
It is important to recognise that the document review and interviews were conducted in 2012 and
some jurisdictions have experienced major change since that time. Further, the Commonwealth
commissioned a major review of AOD treatment in Australia in July 2013 and the review has some
similarities with the development of synopses as part of the Pathways Project. As a consequence,
the final synopses were provided to the Commonwealth review team, to inform their work.
Summary of synopses across jurisdictions
As the synopses for each jurisdiction were lengthy, a summary version for each was developed and is
included in Appendix 1. Given the sensitivity of the material regarding the funding arrangements for
the provision of AOD services in each state and territory, and the time elapsed since consultations,
only very broad information concerning this aspect is provided. Summary synopses across all eight
jurisdictions were examined, and the commonalities and differences in AOD treatment systems
across Australia noted.
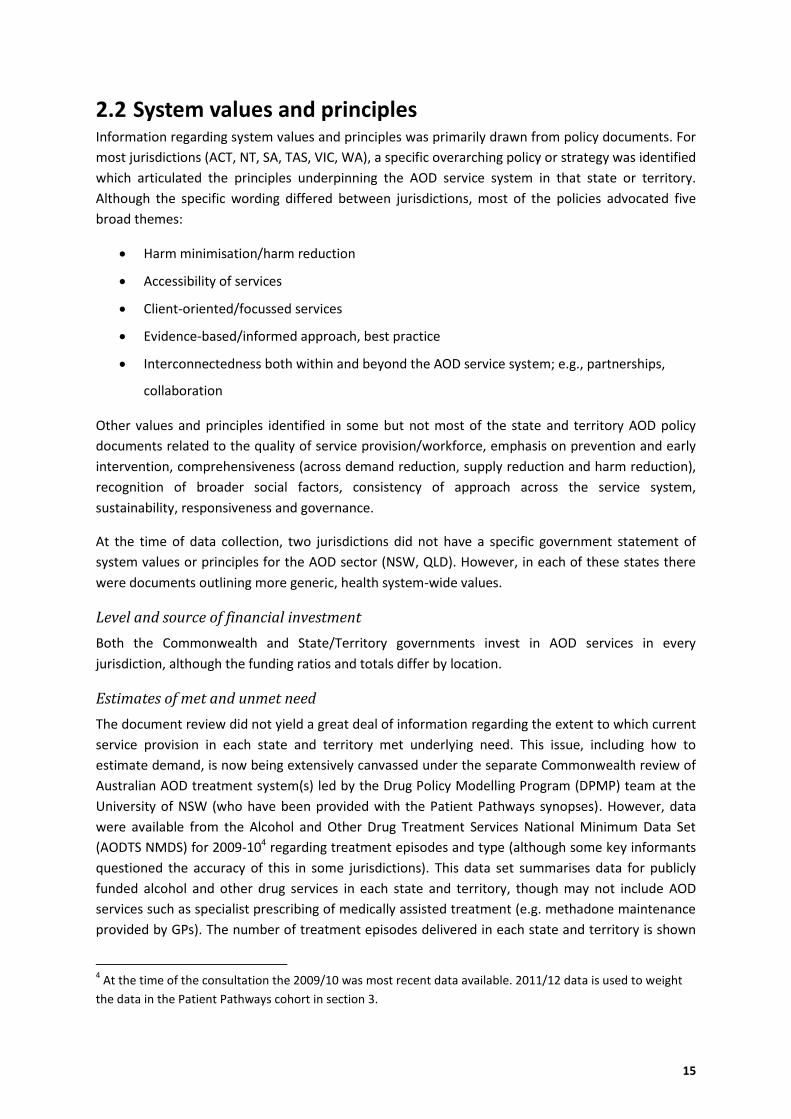
15
2.2 System values and principles Information regarding system values and principles was primarily drawn from policy documents. For
most jurisdictions (ACT, NT, SA, TAS, VIC, WA), a specific overarching policy or strategy was identified
which articulated the principles underpinning the AOD service system in that state or territory.
Although the specific wording differed between jurisdictions, most of the policies advocated five
broad themes:
Harm minimisation/harm reduction
Accessibility of services
Client-oriented/focussed services
Evidence-based/informed approach, best practice
Interconnectedness both within and beyond the AOD service system; e.g., partnerships,
collaboration
Other values and principles identified in some but not most of the state and territory AOD policy
documents related to the quality of service provision/workforce, emphasis on prevention and early
intervention, comprehensiveness (across demand reduction, supply reduction and harm reduction),
recognition of broader social factors, consistency of approach across the service system,
sustainability, responsiveness and governance.
At the time of data collection, two jurisdictions did not have a specific government statement of
system values or principles for the AOD sector (NSW, QLD). However, in each of these states there
were documents outlining more generic, health system-wide values.
Level and source of financial investment
Both the Commonwealth and State/Territory governments invest in AOD services in every
jurisdiction, although the funding ratios and totals differ by location.
Estimates of met and unmet need
The document review did not yield a great deal of information regarding the extent to which current
service provision in each state and territory met underlying need. This issue, including how to
estimate demand, is now being extensively canvassed under the separate Commonwealth review of
Australian AOD treatment system(s) led by the Drug Policy Modelling Program (DPMP) team at the
University of NSW (who have been provided with the Patient Pathways synopses). However, data
were available from the Alcohol and Other Drug Treatment Services National Minimum Data Set
(AODTS NMDS) for 2009-104 regarding treatment episodes and type (although some key informants
questioned the accuracy of this in some jurisdictions). This data set summarises data for publicly
funded alcohol and other drug services in each state and territory, though may not include AOD
services such as specialist prescribing of medically assisted treatment (e.g. methadone maintenance
provided by GPs). The number of treatment episodes delivered in each state and territory is shown
4 At the time of the consultation the 2009/10 was most recent data available. 2011/12 data is used to weight
the data in the Patient Pathways cohort in section 3.
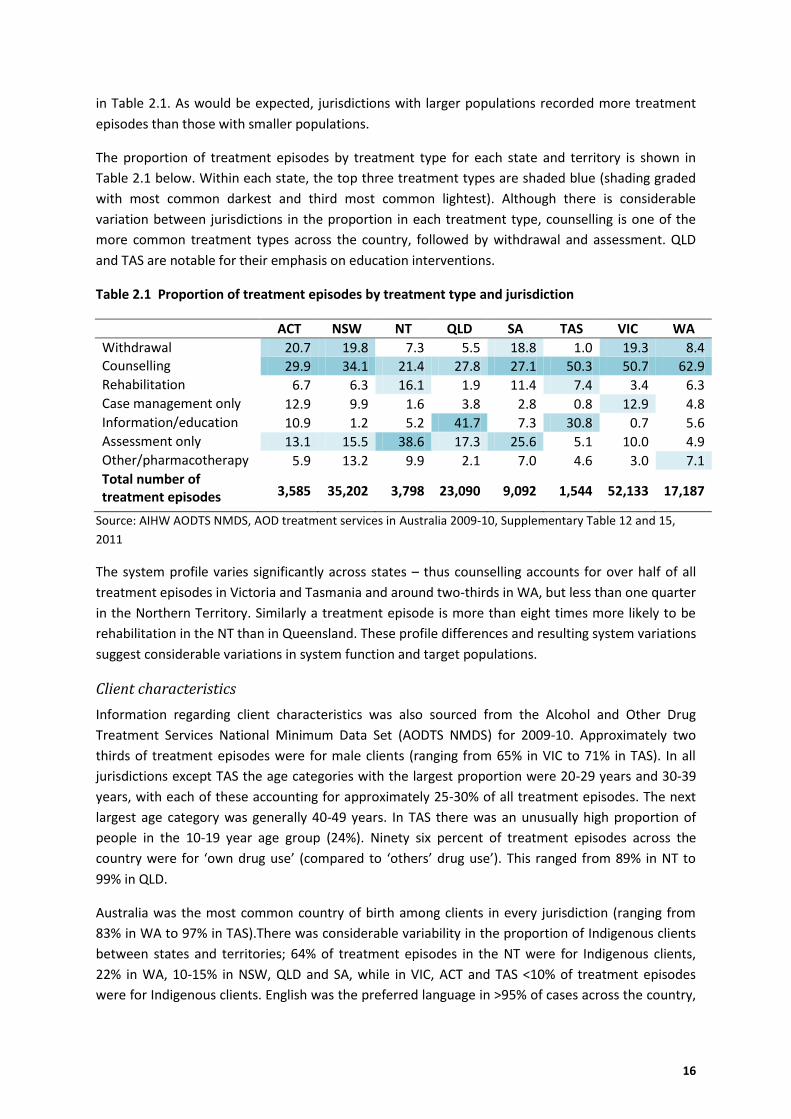
16
in Table 2.1. As would be expected, jurisdictions with larger populations recorded more treatment
episodes than those with smaller populations.
The proportion of treatment episodes by treatment type for each state and territory is shown in
Table 2.1 below. Within each state, the top three treatment types are shaded blue (shading graded
with most common darkest and third most common lightest). Although there is considerable
variation between jurisdictions in the proportion in each treatment type, counselling is one of the
more common treatment types across the country, followed by withdrawal and assessment. QLD
and TAS are notable for their emphasis on education interventions.
Table 2.1 Proportion of treatment episodes by treatment type and jurisdiction
ACT NSW NT QLD SA TAS VIC WA
Withdrawal 20.7 19.8 7.3 5.5 18.8 1.0 19.3 8.4 Counselling 29.9 34.1 21.4 27.8 27.1 50.3 50.7 62.9 Rehabilitation 6.7 6.3 16.1 1.9 11.4 7.4 3.4 6.3 Case management only 12.9 9.9 1.6 3.8 2.8 0.8 12.9 4.8 Information/education 10.9 1.2 5.2 41.7 7.3 30.8 0.7 5.6 Assessment only 13.1 15.5 38.6 17.3 25.6 5.1 10.0 4.9 Other/pharmacotherapy 5.9 13.2 9.9 2.1 7.0 4.6 3.0 7.1 Total number of treatment episodes 3,585 35,202 3,798 23,090 9,092 1,544 52,133 17,187
Source: AIHW AODTS NMDS, AOD treatment services in Australia 2009-10, Supplementary Table 12 and 15,
2011
The system profile varies significantly across states – thus counselling accounts for over half of all
treatment episodes in Victoria and Tasmania and around two-thirds in WA, but less than one quarter
in the Northern Territory. Similarly a treatment episode is more than eight times more likely to be
rehabilitation in the NT than in Queensland. These profile differences and resulting system variations
suggest considerable variations in system function and target populations.
Client characteristics
Information regarding client characteristics was also sourced from the Alcohol and Other Drug
Treatment Services National Minimum Data Set (AODTS NMDS) for 2009-10. Approximately two
thirds of treatment episodes were for male clients (ranging from 65% in VIC to 71% in TAS). In all
jurisdictions except TAS the age categories with the largest proportion were 20-29 years and 30-39
years, with each of these accounting for approximately 25-30% of all treatment episodes. The next
largest age category was generally 40-49 years. In TAS there was an unusually high proportion of
people in the 10-19 year age group (24%). Ninety six percent of treatment episodes across the
country were for ‘own drug use’ (compared to ‘others’ drug use’). This ranged from 89% in NT to
99% in QLD.
Australia was the most common country of birth among clients in every jurisdiction (ranging from
83% in WA to 97% in TAS).There was considerable variability in the proportion of Indigenous clients
between states and territories; 64% of treatment episodes in the NT were for Indigenous clients,
22% in WA, 10-15% in NSW, QLD and SA, while in VIC, ACT and TAS <10% of treatment episodes
were for Indigenous clients. English was the preferred language in >95% of cases across the country,
17
except in NT, where 54% preferred English and 29% preferred Australian Indigenous languages
(preference not stated in 17% of NT cases).
The most common source of referral to treatment was ‘self’ (35% Australia, ranging from 26% in QLD
to 45% in TAS). Referral from other alcohol and drug treatment services accounts for 10% of
referrals nationally, but this varies greatly between jurisdictions (2% in TAS to 17% in WA). Court
diversion accounts for 12% of referrals nationally, but this ranges from as low as 2% in SA to 16% in
QLD. Police diversion accounts for a higher proportion of referrals in each of these two states (30%
and 23% respectively) compared to the national average (6%).
Alcohol was the most common primary drug of concern among those in treatment across all
jurisdictions except TAS (ranging from 38% in QLD to 69% in NT). Cannabis was generally the second
most common primary drug of concern (ranging from 9% in NT to 44% in TAS), followed by opioids
(8% in QLD to 20% in ACT), although the relative contribution of heroin, methadone and morphine to
the opioids total differed by jurisdiction. Amphetamines as primary drug of concern ranged from 3%
(NT) to 14% (WA). Benzodiazepines, cocaine, ecstasy and other drug types each accounted for <5%
of cases in every jurisdiction (except ‘all other drugs’ in the NT, which was 8%).
Service setting
A range of services are offered in all jurisdictions including information/education, case
management, counselling, withdrawal management, rehabilitation, pharmacotherapy, needle and
syringe programs and sobering up facilities. All jurisdictions report a mix of Government
Organisation (GO) and Non-Government Organisation (NGO) service providers (Table 2.2).
Community Service Organisations are included here as NGO. In most jurisdictions GOs are the
predominant providers of acute services such as withdrawal and specialist pharmacotherapy, with
NGOs providing other services. In all jurisdictions beside NSW and SA there are more NGO than GO
services, although the ratios vary. Models of service delivery reported by key informants differ
according to state and territory, as do intra- and inter-sectoral linkages. All jurisdictions have some
service provision to non-metropolitan areas, although the extent to which this is provided in situ
versus by outreach differs.
Monitoring and accountability
There are monitoring and accountability systems in place in every jurisdiction, although the specifics
of these differ (Table 2.3). In the ACT, NSW, QLD and VIC there are committees/groups appointed to
oversight strategic issues which may include policy development, system planning, implementation,
service delivery and evaluation. In WA and the NT, these functions are undertaken by the Drug and
Alcohol Office and the Office of the Chief Executive respectively. At the time of consultation (2012),
services were being retendered in SA while in TAS preparations were underway to evaluate the 5
year plan. Reporting at the service level occurs in every jurisdiction, although in some jurisdictions
key informants indicated that performance reporting systems may not be comprehensive, although
there was widespread support for continuous improvement in this area. Since the consultations
occurred, Turning Point has been commissioned to map existing quality standards in greater detail
and develop a Quality Framework for Australian Government funded AOD services.
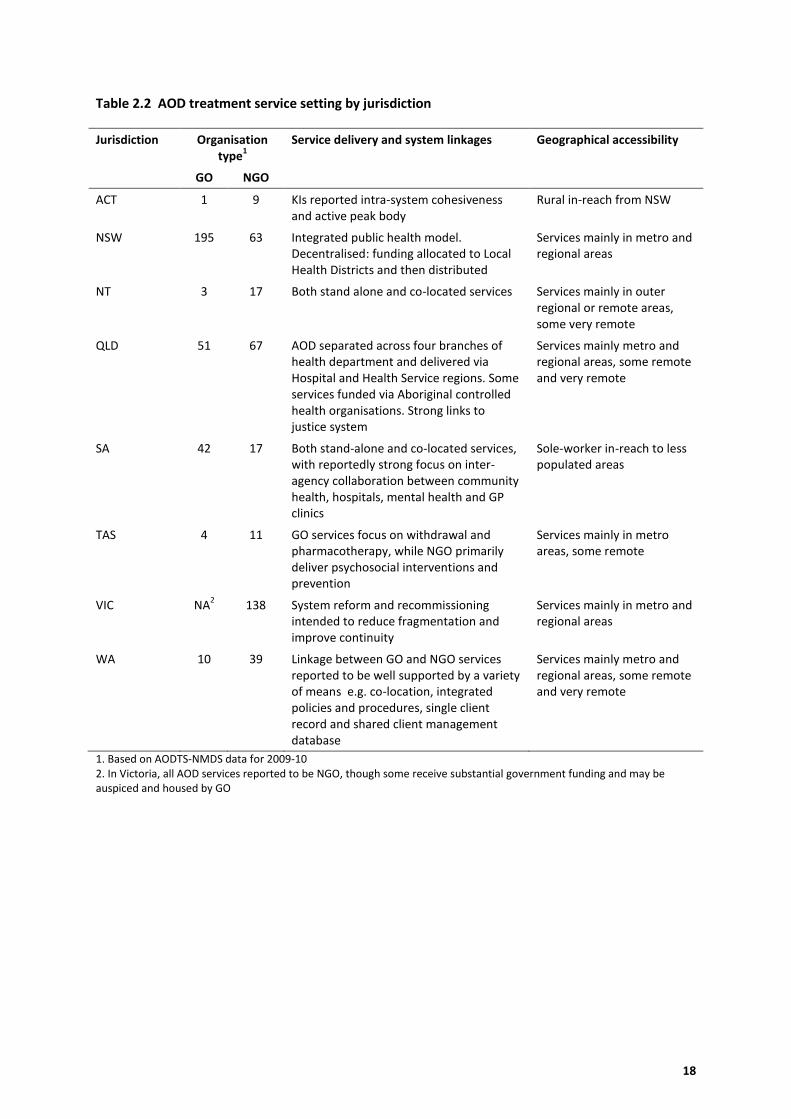
18
Table 2.2 AOD treatment service setting by jurisdiction
Jurisdiction Organisation type
1
Service delivery and system linkages Geographical accessibility
GO NGO
ACT 1 9 KIs reported intra-system cohesiveness and active peak body
Rural in-reach from NSW
NSW 195 63 Integrated public health model. Decentralised: funding allocated to Local Health Districts and then distributed
Services mainly in metro and regional areas
NT 3 17 Both stand alone and co-located services Services mainly in outer regional or remote areas, some very remote
QLD 51 67 AOD separated across four branches of health department and delivered via Hospital and Health Service regions. Some services funded via Aboriginal controlled health organisations. Strong links to justice system
Services mainly metro and regional areas, some remote and very remote
SA 42 17 Both stand-alone and co-located services, with reportedly strong focus on inter-agency collaboration between community health, hospitals, mental health and GP clinics
Sole-worker in-reach to less populated areas
TAS 4 11 GO services focus on withdrawal and pharmacotherapy, while NGO primarily deliver psychosocial interventions and prevention
Services mainly in metro areas, some remote
VIC NA2 138 System reform and recommissioning
intended to reduce fragmentation and improve continuity
Services mainly in metro and regional areas
WA 10 39 Linkage between GO and NGO services reported to be well supported by a variety of means e.g. co-location, integrated policies and procedures, single client record and shared client management database
Services mainly metro and regional areas, some remote and very remote
1. Based on AODTS-NMDS data for 2009-10 2. In Victoria, all AOD services reported to be NGO, though some receive substantial government funding and may be auspiced and housed by GO
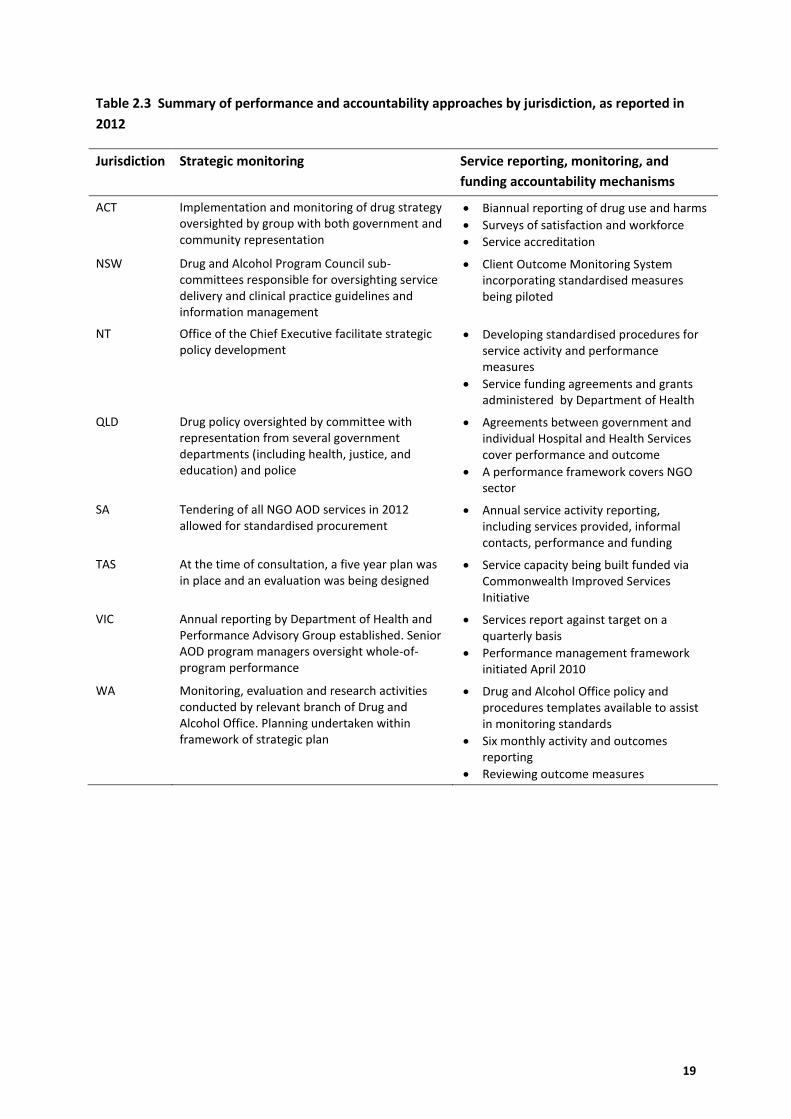
19
Table 2.3 Summary of performance and accountability approaches by jurisdiction, as reported in
2012
Jurisdiction Strategic monitoring Service reporting, monitoring, and
funding accountability mechanisms
ACT Implementation and monitoring of drug strategy oversighted by group with both government and community representation
Biannual reporting of drug use and harms
Surveys of satisfaction and workforce
Service accreditation
NSW Drug and Alcohol Program Council sub-committees responsible for oversighting service delivery and clinical practice guidelines and information management
Client Outcome Monitoring System incorporating standardised measures being piloted
NT Office of the Chief Executive facilitate strategic policy development
Developing standardised procedures for service activity and performance measures
Service funding agreements and grants administered by Department of Health
QLD Drug policy oversighted by committee with representation from several government departments (including health, justice, and education) and police
Agreements between government and individual Hospital and Health Services cover performance and outcome
A performance framework covers NGO sector
SA Tendering of all NGO AOD services in 2012 allowed for standardised procurement
Annual service activity reporting, including services provided, informal contacts, performance and funding
TAS At the time of consultation, a five year plan was in place and an evaluation was being designed
Service capacity being built funded via Commonwealth Improved Services Initiative
VIC Annual reporting by Department of Health and Performance Advisory Group established. Senior AOD program managers oversight whole-of-program performance
Services report against target on a quarterly basis
Performance management framework initiated April 2010
WA Monitoring, evaluation and research activities conducted by relevant branch of Drug and Alcohol Office. Planning undertaken within framework of strategic plan
Drug and Alcohol Office policy and procedures templates available to assist in monitoring standards
Six monthly activity and outcomes reporting
Reviewing outcome measures
20
Strengths and challenges
The consultation process in most jurisdictions yielded lists of both strengths and challenges for the
AOD system, many of which were common across states and territories. Indeed, in some places the
same factor was listed as both a strength and a challenge. Rather than attempt to exhaustively
analyse these by jurisdiction and whether a strength or a challenge, the following has been compiled
from the synopses as a broad list of issues identified for AOD service systems:
1. Issues of treatment access and appropriateness
Addressing the needs of particular population groups, especially Aboriginal and Torres Strait
Islander people, young people, women, prisoners, migrant and remote communities;
Addressing complex needs including mental health, acquired brain injury, intergenerational
substance use, tobacco use;
Responsiveness to emerging issues, e.g. drug trends.
2. Issues of service delivery
Maintaining and improving quality of service provision, standardising performance
measures, evaluation, evidence based-practice;
Sustainability of service provision, e.g. workforce capacity building, skill mix and succession
planning;
Funding, e.g. full cost of service delivery, funding inequities within sector, ensuring funding
models encourage continuity of care.
3. Issues of service context
Balance of demand reduction, harm reduction and supply reduction;
Intra-and inter-sectoral linkage, community connection
2.3 Summary The documentation of AOD treatment systems in each state and territory reveals some important
commonalities as well as areas of difference. There are broad principles which are articulated in
most relevant strategic policy documents. In essence, most systems strive to provide accessible,
client-centred services which deliver evidence-based treatment within a harm-reduction framework.
There is also a general aspiration that individual services are just one part of a larger interconnected
system, including AOD services and other health and welfare services.
Assessment, counselling and withdrawal appear to be the cornerstone of treatment in many
jurisdictions, although there is considerable variability in treatment utilised across the country.
While some client characteristics are relatively homogenous across jurisdictions (e.g. gender, age,
country of birth), there is considerable heterogeneity in terms of Indigenous status, primary drug of
concern and referral source, although it is not clear that system variations are a direct response to
differences in presenting populations or profiles.
21
There is a diversity of models of service provision across Australia. For example, there is variability in
the ratio of GO to NGO services - in the emphasis placed on different treatment types, in the degree
of centralisation versus decentralisation, and in structural support for linkages with other services.
There is apparent commitment in all states and territories to monitoring and accountability,
although the mechanisms in place to support this vary by jurisdiction and it is an area for ongoing
development. There is clear support for ensuring AOD service systems are accessible to, and
responsive, to the needs of clients. Further, ensuring the interconnectedness of services with each
other and with other sectors is an objective in many states and territories, although the challenges in
achieving this are widely recognised. As mentioned earlier, a comprehensive review of the Australian
AOD treatment system is under way. The review commenced after the consultations for this project
were undertaken, but before reporting. To avoid duplication of effort, the synopses prepared for this
project have been provided to the DPMP team to inform their project design and data collection.
Given the policy emphasis on accessible and interconnected service systems in most jurisdictions, it
is not clear from the evidence gathered through the document review and consultation processes
how well integrated existing AOD systems actually are. For example, it is not immediately clear from
the synopses how clients initially access treatment, how they progress from one phase or type of
treatment to another, and to what extent clients accessing AOD treatment also access other health
and welfare agencies. This links to the perceived omission around formal mechanisms for demand
modelling and for mapping addiction and treatment careers. It is hoped the linkage work illustrated
below will assist in addressing this issue.
22
3. Client survey data: baseline and follow-up
The purpose of client interviews was four-fold: firstly our aim was to examine populations who
engage in treatment in Victoria and WA, their substance use profile and other presenting/complex
needs; secondly, to examine the services engaged with at the primary index treatment (PIT) and the
clients’ recent history of help seeking; thirdly, to examine client pathways through AOD treatment
and other forms of peer and professional help; and fourthly, to examine client outcomes achieved
over this time and how they differ according to the extent of AOD service use and integration with
other community services - i.e., the treatment pathway engaged in.
3.1 Methods
Ethics approval
Ethics approval for this project was obtained from Eastern Health Research and Ethics Committee
(LR28/1112 for the systems description; E17/1112 for the client survey and qualitative component
and E60/1112 for the linkage component), Monash University Human Research Ethics Committee
(201200020) and Curtin University (HR11/2012).
Eligibility
To be eligible for the study, AOD treatment service clients had to be aged over 18 and must not have
participated in the same treatment type at the same service in the three weeks prior to entering
their primary index treatment (PIT).
Recruitment
Management and staff of AOD treatment services were approached to assist with the recruitment of
clients to the project. Staff were provided with a brief information sheet to show clients and were
asked to collect the contact details of those who were interested in participating. The research team
then made contact with the client to arrange a mutually convenient interview time, or, particularly
for those in residential treatment, an interview appointment was made via the service.
Response rate
A total of 1054 people provided contact details directly to the project team or via an AOD agency,
and 796 participated in the baseline interview (i.e. 76% of those who initially provided contact
details). Of the 258 people not interviewed at baseline, 26 were no longer interested in participating,
81 were ineligible (i.e. had received treatment in the past 3 weeks), 150 people were unreachable
via contacts provided, and one person was deceased. It is impossible to determine the exact number
of people who were notified about the project by AOD treatment service staff.
Settings
Participants were recruited from a range of treatment agencies in Victoria (n=13) and Western
Australia (n=8) representing the spectrum of AOD treatment services available (including various
forms of outpatient and inpatient treatment and residential rehabilitation) in each jurisdiction.
Interviews were conducted by a team of trained and experienced researchers from Turning Point
(n=5), the National Drug Research Institute (NDRI) (n=7) and Monash University (n=1).
23
Sampling frame
The Victorian agencies in the sample were selected from the statewide telephone information and
referral service at Turning Point, and represent those services in Victoria providing specialist Alcohol
and Drug treatment services as represented by the National Minimum Dataset (AODTS-NMDS) with
additional recruitment of clients receiving specialist pharmacotherapy services (SPS). For the
Western Australia sample, agencies were identified via the Drug and Alcohol listing of services,
produced by the Government of Western Australia, Drug and Alcohol Office. The rationale for the
inclusion of clients of the SPS was that they represent a significant portion of people involved in AOD
treatment at both the state and national level, but are not recorded in the same systems that
contribute to the national AODTS-NMDS.
A number of exclusion criteria served to reduce the number of services from the initial database.
Exclusion criteria included:
Services where the target group is not described as having any alcohol and/or other drugs-
related concerns
Services that do not provide for primary users (e.g. significant others or family members of
users as the target group, research groups)
Justice services (although services providing mainstream services to people referred via the
Justice system are not excluded)
Services catering exclusively to clients in recovery
Harm reduction services (i.e. AOD treatment is not the core service provided)
Services catering exclusively to clients under the age of 18 years
Services catering exclusively to Aboriginal and/or Torres Strait Islander people
Following exclusion of services not fitting the target criteria, those services from the remaining
catalogue of services were prioritised, with services providing multiple relevant AOD treatment
types selected as the primary focus for inclusion in the sample. Other services, providing a smaller
selection of treatment options (including those providing a single treatment type), were then
selected in order to supplement the services already selected as part of the sample.
The agencies selected at this initial stage were then sent invitations to participate in the study,
followed by briefing meetings. Those agencies who responded positively to the invitation to form
part of the sample group were included. Once confirmation of the involvement of a number of
agencies has been achieved, the existing sample was re-examined. A number of factors were
considered, particularly the geographical distribution of agencies across catchment areas, as well as
sufficient representation from major treatment types. Once these criteria were considered to be
sufficiently addressed, it was decided that no further agencies were required in order to meet the
estimated quota of referrals necessary to meet the interview quota. The final sample included 20
agencies (12 in Victoria; 8 in WA), which included 37 sites (21 outpatient providers; 8 inpatient
withdrawal units; 6 residential rehabilitation services (including TC); and 2 supported
accommodation services (See Appendix 2.1 for a list of AOD agencies involved as recruitment sites -
24
Measures
Clients participating in the study completed a comprehensive assessment interview at baseline and
again at follow-up assessing the areas listed below. Standardised instruments that have been
validated on Australian populations were used where available.
(i) Participant characteristics.
(ii) Pattern of substance indicated by frequency and quantity of use of all licit and illicit
substances in the past 30 days.
(iii) Problem severity using the Severity of Dependence Scale.
(iv) Quality of life – using the WHO-QOL BREF which provides a global measure of well-being,
with four sub-domains; psychological, physical, social, and environmental.
(v) Health, social/welfare and acute service utilisation in the previous 12-months was captured
using a tool developed specifically to record referral pathways and number of visits (details
collected for up to 5 contacts5) across the following areas: withdrawal services; outpatient
counselling; residential rehabilitation; peer-support/self-help programmes; GP; ambulance;
hospital emergency departments; hospital inpatient services; mental health services; legal
aid; financial counselling; employment services; family/relationship counselling; housing,
other services; criminal justice involvement.
(vi) Other measures included: the assessment of perceived levels of community support
available; perceived level of support from family, friends and significant others; treatment
motivation; treatment satisfaction; reasons for seeking AOD treatment; barriers to
treatment; and types of discrimination and stigma.
For a more detailed description of the instruments used in the baseline follow-up surveys see Table 3.1.
5 For AOD services, detailed information included drug of concern, month of contact and referral source. Only
total number of contacts was recorded for use of self-help and mutual aid programs and GP. For health and
community services detailed information included month of contact and referral source and for justice system
contacts the month of contact was recorded.
25
Table 3.1 Items included in structured interview with clients ‘new’ to AOD treatment
Domain Survey items/instrument Purpose
About the participant
Demographics, social
circumstancesa
Post code, age, gender, marital status, education level, employment status, housing situation, country of birth, cultural background, medical status
b, legal status, and family and social
relationships
To describe participant characteristics and enable comparisons between different participant groups
AOD use Primary substance of concern, other substances of concern, drug use past 30 days, drug use ‘typical’ 30 days
c, prescription drug use past 30 days
c
To identify common substances of concern, to monitor change over time
Alcohol used Alcohol Use Disorders Identification Test (AUDIT)
(Bush, et al., 1998)
First 3 items, each scored 0-4
To assess frequency and amount of alcohol consumed by those reporting drinking within past 30 days
AOD dependence
e
Severity of Dependence Scale (SDS) (Gossop et al., 1995)
5 items, each scored 0-3
To assess degree of dependence on primary substance of concern
Wellbeing
Social support Multidimensional Scale of Perceived Social Support (MSPSS) (Zimet et al., 1988)
12 items, each scored 1-7
To assess perceived level of support from family, friends and significant other
Community support for treatment entry
Community Assessment Inventory (CAI) (community subscale only) (Brown et al., 2004)
13 items, each scored 1-4
To assess perceived level of community support available
Quality of life World Health Organization Quality of Life (WHOQOL-BREF) (Skevington et al., 2004)
26 items, each scored 1-5
To assess four quality of life factors: physical health; psychological health; social relationships, and environment
Help seeking
Treatment motivation
f
Adapted from the TCU MOTFORM (originally taken from the TCU CEST Intake) (Institute of Behavioral Research, 2008). Desire for help, treatment readiness, and pressures for treatment scales. The problem recognition domain was omitted as it was deemed not relevant for clients who were already accessing treatment.
21 items, scored 1-5
To assess motivation for treatment as measured by the “desire for help” and “treatment readiness” domains and identify external influences on treatment seeking as identified by “pressures for treatment” index
Past use of services
Use of various servicesg in past 12 months, how
many times, for which drug of concern, when used, source of referral to service
To identify commonly used health and welfare services and referral pathways
Legal involvement
Any legal involvementh in past 12 months, how
many times and when To identify extent of simultaneous involvement in legal system
26
Table 3.1: Items included in structured interview with clients ‘new’ to AOD treatment (continued)
Domain Survey items/instrument Purpose
Perspectives on treatment
Reasons for treatment seeking
Events as Precipitators of Treatment Seeking questionnaire used in Swedish Addiction Treatment study, adapted from (Weisner, 1990)
14 items, yes/no. If ‘yes’ in past 12 months, rated perceived contribution to attending treatment from 1-3
To determine which life events are associated with treatment seeking
Barriers to treatmenti Barriers to Treatment Inventory (BTI)
(Rapp et al., 2006)
25 items, each scored 1-5
To assess seven perceived barriers to treatment: absence of problem, negative social support, fear of treatment, privacy concerns, time conflict, poor treatment availability, and admission difficulty.
Reflections on PIT experiences
j
Client satisfaction questionnaire (CSQ-
8) (Attkisson & Greenfield, 2004).8
items consisting of 4 possible responses
indicating satisfaction with various
elements.
To assess client satisfaction with treatment
Reflection on overall AOD service experiences j
Items 6 and 7 extrapolated from the CSQ-8.
To assess overall service effectiveness and satisfaction
Reasons for early treatment cessation
jk
Women and men in Swedish addiction treatment (Room et al., 2003)
13-16
items.
To identify contributing factors for not completing primary index treatment
Stigma Modified version of the Discrimination
and Stigma Scale DISC-12 (Brohan et
al., 2011).
4 sections, 32 items in total, each scored 0-3 or not applicable
To assess three types of discrimination: positive experienced, negative experienced, and anticipated; and overcoming discrimination
Current treatment/substance use goals
l
Items taken from the Women and Men in Swedish Addiction Treatment study (Room et al., 2003) 2 items, scored 1-5 or 1-6
To differentiate substance use goals as determined by abstinence, reduction, or harm reduction.
Current treatment experience
m
Items taken from the Women and Men in Swedish Addiction Treatment study (Room et al., 2003). 11 items each scored 1-4
To determine treatment expectations and impressions of treatment.
a Selected demographics: date of birth, nationality and cultural background not asked at follow-up b At baseline individual chronic medical problems not specified. Actual current and past chronic medical problems
collected at follow-up only. c This item was added after data collection commenced, therefore data not available for the first 19% of interviews d At baseline, alcohol use measured if participant had consumed any alcohol in the last 30 days or if alcohol was reported
as a substance of concern. At follow-up, alcohol use was measured if participant had used any alcohol since the baseline interview or if originally reported as a substance of concern.
e At baseline, severity of dependence measured only for primary substance of concern. At follow-up, severity of dependence measure for current substance of concern and original substance of concern (if different).
27
f At follow-up Part B was only asked if the participant was currently in treatment or had an upcoming appointment for AOD treatment.
g Services included: withdrawal, AOD counselling, residential rehabilitation, pharmacotherapy (follow-up only), self-help and mutual aid, general practitioner (GP) ambulance, emergency department (ED), hospital inpatient services, mental health service, legal aid, financial counselling, employment service, family/relationship counselling, housing/homelessness service, other.
h Legal involvement included: prison, CBO program, court, lock-up/watch house, remand i Asked at baseline only j Asked at follow-up only k Items only administered upon treatment non-completion. Number of items (13-16 items) administered dependent
upon primary reason for early treatment cessation l Only administered at follow-up if currently involved in AOD treatment. If not currently involved in treatment, items
rephrased as current substance use goals m Only administered at follow-up if currently involved in AOD treatment.
Data collection
The recruitment and data collection phase of the project occurred between January 2012 and
January 2013. Clients were recruited via AOD clinicians introducing the study to clients and then
forwarding the client’s details to the researchers who contacted the participant and provided further
information about the study and assessed eligibility or directly by researchers during site visits.
Informed consent was sought from all participants prior to the commencement of the interview,
including consent to collect contact information for follow-up after 12 months. Interviews followed a
structured format and were conducted face-to-face at the agency through which the person was
recruited (99%), except where factors such as distance to travel necessitated a telephone interview
(1%). The full baseline and follow-up interview schedules are in Appendix 2.2 and Appendix 2.3. A
summary of the interview schedules, including domains covered, standardised tools used and
rationale for inclusion is shown in Table 3.1. Interviews took approximately one hour to complete.
Participants were reimbursed $25 for the baseline interview and $45 for the follow-up interview in
recognition of their time and contribution.
Follow-up interviews
Contact with participants who had been interviewed at baseline commenced on average twelve
months after their baseline interview. Contact was made with participants in the same order with
which they were interviewed, so as to ensure that as many participants as possible remained within
the eligibility window. Difficulties in contacting participants were encountered. This meant that the
end of the fifteen month eligibility window did occur for a proportion of participants. As a result, an
extension of the eligibility window was discussed and implemented and extra resources were
directed at prioritising these participants. As a result, the follow-up period ranged from 7.6 to 21.2
months (mean 12.5 months), although for the vast majority of participants (85%) the follow-up
period was between nine and fifteen months post baseline.
Participants were contacted via telephone, reminded of their involvement in the baseline interview,
and offered the opportunity to engage in a follow-up telephone interview at an agreed date and
time. Participants were reminded at this stage that they would be reimbursed $45 for their
participation. At the conclusion of the follow-up data collection period, the majority of participants
were successfully re-interviewed (70%, 555). Of those who were not re-interviewed, 11 (1%) were
deceased, 19 (2%) were incarcerated, 66 (8%) no longer wished to take part (i.e. withdrew from
study) and 145 participants (18%) could not be contacted after multiple attempts were made and
28
were lost to follow-up. Follow-up interviews were conducted between December 2012 and February
2014.
Follow-up interviews were conducted by telephone at an agreed time. A small proportion of
participants requested to be interviewed in person, usually for reasons related to confidentiality or
due to preference for a cash reimbursement. Where this request was made, interviews were
conducted at Turning Point (Victoria). At the end of the follow-up interview, participants were asked
for permission to be contacted for a further interview at a later date. An overwhelming majority
(99%) gave permission for further contact by the researchers.
Follow-up procedures
Many clients were initially unable to be contacted via the telephone number provided to researchers
at the time of the baseline interview. Where this occurred a number of strategies were implemented
in order to make contact. Where consistent telephone phone calls and voicemail/text messages to
primary contact number/s were unsuccessful – or in the event of a phone number being incorrect or
disconnected – a letter and/or email was sent to the nominated addresses if provided at baseline.
Following these, the researchers made contact with the original agencies from where the participant
was originally recruited and requested the most recent contact information be provided by the
agency. Where all of these avenues of contact were unsuccessful, researchers attempted to make
contact with secondary contact persons – that is, family, friends, partners, clinicians and others
whom the participants had listed on the locator form at the time of the baseline interview and given
permission to contact in the event of a loss of contact. Where this step was required, researchers
made sure to uphold confidentiality by not disclosing the exact nature of the call. Where contact
with the participant was not possible, and all avenues of contact had been exhausted, further
contact attempts were postponed and resumed at a later date. The mean number of days between
baseline and follow-up interview was 380.3 (SD 71.8 days)
Data management
Data were either recorded on a paper-based version of the interview schedule, or entered directly
into an online version of the interview schedule via tablet. All records were transferred to Turning
Point for centralised data cleaning and analysis. Prior to analysis, 10% (n=56) of the baseline
interviews completed on paper were re-entered and data verification undertaken, which revealed a
low rate of data entry error, well within the acceptable range. Where data were missing for
individual items of a multi-item scale, decisions regarding whether to calculate the scale score or
discard all data for that scale were based on published recommendations by the scale authors where
available (WHOQOL and DISC). For other scales, scale scores were calculated based on the mean
response to non-missing items only when < 25% of items were missing. No other forms of
imputation were used to substitute for missing data and in analyses where data were missing for
some participants, those participants’ data were therefore deleted listwise for that analysis.
Personal information, such as contact details and secondary contacts were stored in a separate
password protected database.
Data analysis
Continuous variables were tested for skew and kurtosis. Where the ratio of either the skew or
kurtosis statistic to its standard error exceeded 3.1, variables were considered non-normal. Time
between baseline and follow-up was normally distributed, but other continuous variables were not.
29
Bivariate relationships between categorical variables were analysed with Pearson’s 2 statistic.
Differences between groupings of participants on normal continuous measures were analysed with
independent samples t-tests. For non-normal continuous measures, where there were 3 or more
groups, Kruskall-Wallis tests used for between-group comparisons of non-normal variables. Pairwise
comparisons (or post-hoc testing after a significant Kruskall-Wallis test result) were analysed with
Mann-Whitney U tests. Changes in single variables between baseline and follow-up were analysed
with McNemar tests (for categorical variables) or repeated measures Mann-Whitney U tests (for
continuous variables). To compare follow-up WHOQOL scale scores to published general population
means, we first raised WHOQOL scale scores to the power of 1.5 (i.e. multiplied scores by their
square root) to create distributions of scores that did not violate assumptions of symmetry (i.e.
skewness statistic: standard error ratio < 3.1 for all 4 scales). These transformed scores were then
compared to the general population means (also raised to the power of 1.5) with Wilcoxon signed
ranks tests.
Logistic regression was used to analyse predictors of binary outcomes. All predictors being tested
were entered in a single block. In models predicting the main treatment outcomes (abstinence from
PDOC (or 50% reduction in frequency of use of PDOC)), a 2-stage process was used whereby
demographic and PDOC predictors of outcome were first tested. Only statistically significant
predictors from this model were then included in a second model which also included predictor
variables indexing the PIT, service use, and the interval between baseline and follow-up. For all
analyses, the value for determining statistical significance was set to .05.
For the purpose of logistic regression analyses, the distribution of the variable “number of mutual
aid meetings (follow-up)” was normalised with a log10 transformation. Age was normalised with the
following square root transform: √(age-18). PIT duration was normalised by taking the square root of
the log10 transformation. For SDS and MSPSS scores, no transformation could be found that
simultaneously corrected both skewness and kurtosis to acceptable levels, and they were therefore
converted to binary categorical variables for inclusion in logistic regression models. For SDS, this
involved grouping those with scores > 7 (i.e. in the “severely dependent” range) into one category,
and those with a score < 7 into the other. MSPSS scores were categorised with a median split.
30
3.2 Baseline results
3.2.1 Participant characteristics
The final sample consisted of 796 participants who completed the baseline interview. Participants’
ages ranged from 18.1-71.5 (median = 35.9, IQR = 28.7-44.5). The sample was predominantly male
(62%). A large majority of the sample were born in Australia (80%) and spoke English as their first
language (95%). Regarding marital status, 20% were currently married or in a de facto relationship,
23% were currently separated or divorced, 1% were widowed, and 56% reported having never
married (and not currently in a de facto relationship). Indigenous Australians represented 7% of the
total sample (17/404; 4% in Victoria and 39/391; 10% in WA).
Most participants had completed middle secondary school, or obtained further education. While a
large majority (85%) had completed at least year 10 or higher, only 48% had completed at least year
12 and/or TAFE and/or an apprenticeship. University degrees were held by 12% of the sample.
Regarding their usual employment pattern during the previous year, 27% reported full-time
employment, 19% reported part-time employment, 6% reported carer or home duties, 1% were
retired, 2% were students, 12% reported a disability that prevented participation in employment, 1%
had been in a controlled environment that prevented participation in employment (e.g. prison), and
32% were unemployed. Data on days involved in paid employment in the past 90 days suggest a
lower rate of recent workforce participation than that suggested by participants’ reporting of their
typical past year employment pattern. Only 32% had participated in any paid employment (1 or
more days) and only 11% averaged over 4 days per week (52 or more days in total) during these 90
days.
At the time of baseline interview, 84% of participants were in receipt of some type of government
benefits, including 48% who received unemployment benefits, 25% who received sickness allowance
or disability support pension, and 11% who received some other type of benefit (e.g. student
support, aged pension, family tax benefit, etc.). Acute housing problems (defined as not having one’s
own place to stay for at least one night, requiring the participant to sleep on the streets, in a shelter,
hostel, or at a friend’s place) were experienced by 26% of the sample in the previous 90 days while
22% reported being at risk of eviction at some time during this period. At least one of these two
types of housing problems was reported by 35% of the sample. Chronic medical problems (defined
as requiring regular care and impacting on the participant’s ability to engage in activities) were
reported by 50% of the sample.
Participants were categorised by the type of substance use treatment they were receiving at
baseline (primary index treatment; PIT). Of the 796 participants who met inclusion criteria, 29 (4%)
were in assessment, 146 (18%) were receiving individual counselling, 21 (3%) were receiving group
counselling, 344 (43%) were undergoing inpatient withdrawal, 6 (1%) were undergoing home-based
withdrawal, 128 (16%) were in residential rehabilitation, 89 (11%) were in a therapeutic community,
15 (2%) were in supported accommodation, 15 (2%) were commencing pharmacotherapy, and 3
(0.4%) were referred to a peer support group.
For the purpose of further description and analysis of the sample, PIT was grouped into three
categories: withdrawal (inpatient or home-based withdrawal), outpatient (assessment, individual or
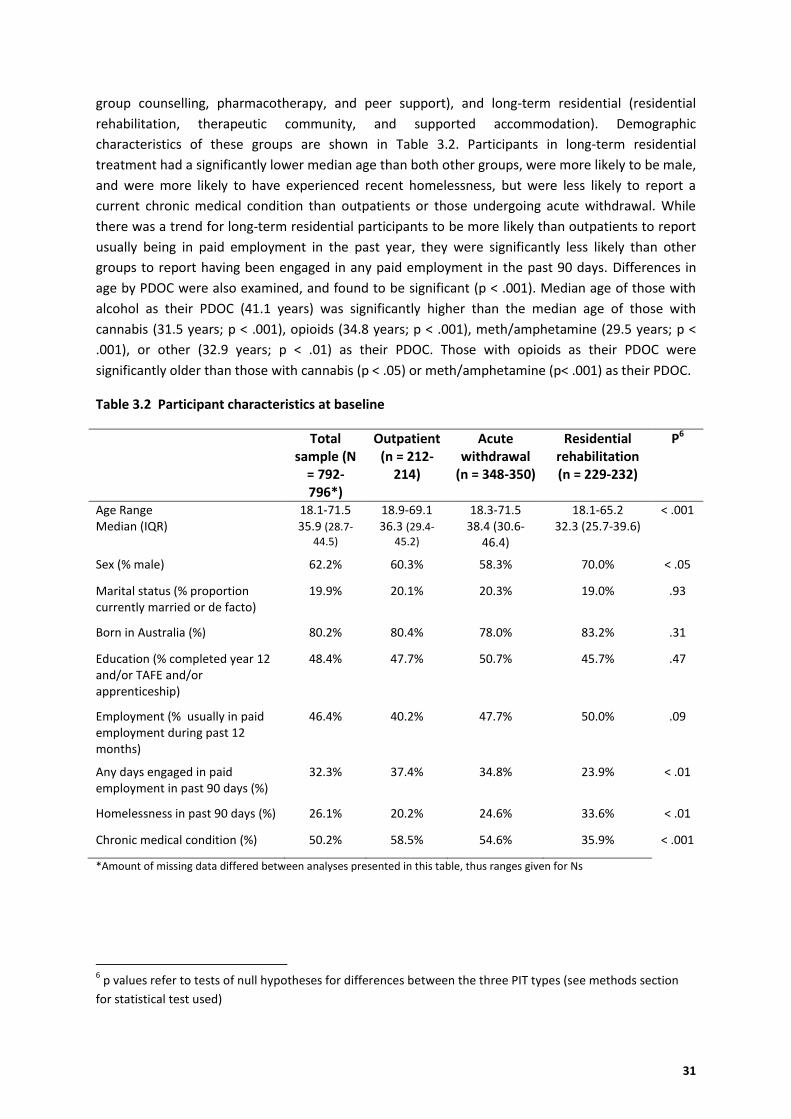
31
group counselling, pharmacotherapy, and peer support), and long-term residential (residential
rehabilitation, therapeutic community, and supported accommodation). Demographic
characteristics of these groups are shown in Table 3.2. Participants in long-term residential
treatment had a significantly lower median age than both other groups, were more likely to be male,
and were more likely to have experienced recent homelessness, but were less likely to report a
current chronic medical condition than outpatients or those undergoing acute withdrawal. While
there was a trend for long-term residential participants to be more likely than outpatients to report
usually being in paid employment in the past year, they were significantly less likely than other
groups to report having been engaged in any paid employment in the past 90 days. Differences in
age by PDOC were also examined, and found to be significant (p < .001). Median age of those with
alcohol as their PDOC (41.1 years) was significantly higher than the median age of those with
cannabis (31.5 years; p < .001), opioids (34.8 years; p < .001), meth/amphetamine (29.5 years; p <
.001), or other (32.9 years; p < .01) as their PDOC. Those with opioids as their PDOC were
significantly older than those with cannabis (p < .05) or meth/amphetamine (p< .001) as their PDOC.
Table 3.2 Participant characteristics at baseline
Total sample (N
= 792-796*)
Outpatient (n = 212-
214)
Acute withdrawal
(n = 348-350)
Residential rehabilitation (n = 229-232)
P6
Age Range Median (IQR)
18.1-71.5 35.9 (28.7-
44.5)
18.9-69.1 36.3 (29.4-
45.2)
18.3-71.5 38.4 (30.6-
46.4)
18.1-65.2 32.3 (25.7-39.6)
< .001
Sex (% male) 62.2% 60.3% 58.3% 70.0% < .05
Marital status (% proportion currently married or de facto)
19.9% 20.1% 20.3% 19.0% .93
Born in Australia (%) 80.2% 80.4% 78.0% 83.2% .31
Education (% completed year 12 and/or TAFE and/or apprenticeship)
48.4% 47.7% 50.7% 45.7% .47
Employment (% usually in paid employment during past 12 months)
46.4% 40.2% 47.7% 50.0% .09
Any days engaged in paid employment in past 90 days (%)
32.3% 37.4% 34.8% 23.9% < .01
Homelessness in past 90 days (%) 26.1% 20.2% 24.6% 33.6% < .01
Chronic medical condition (%) 50.2% 58.5% 54.6% 35.9% < .001
*Amount of missing data differed between analyses presented in this table, thus ranges given for Ns
6 p values refer to tests of null hypotheses for differences between the three PIT types (see methods section
for statistical test used)
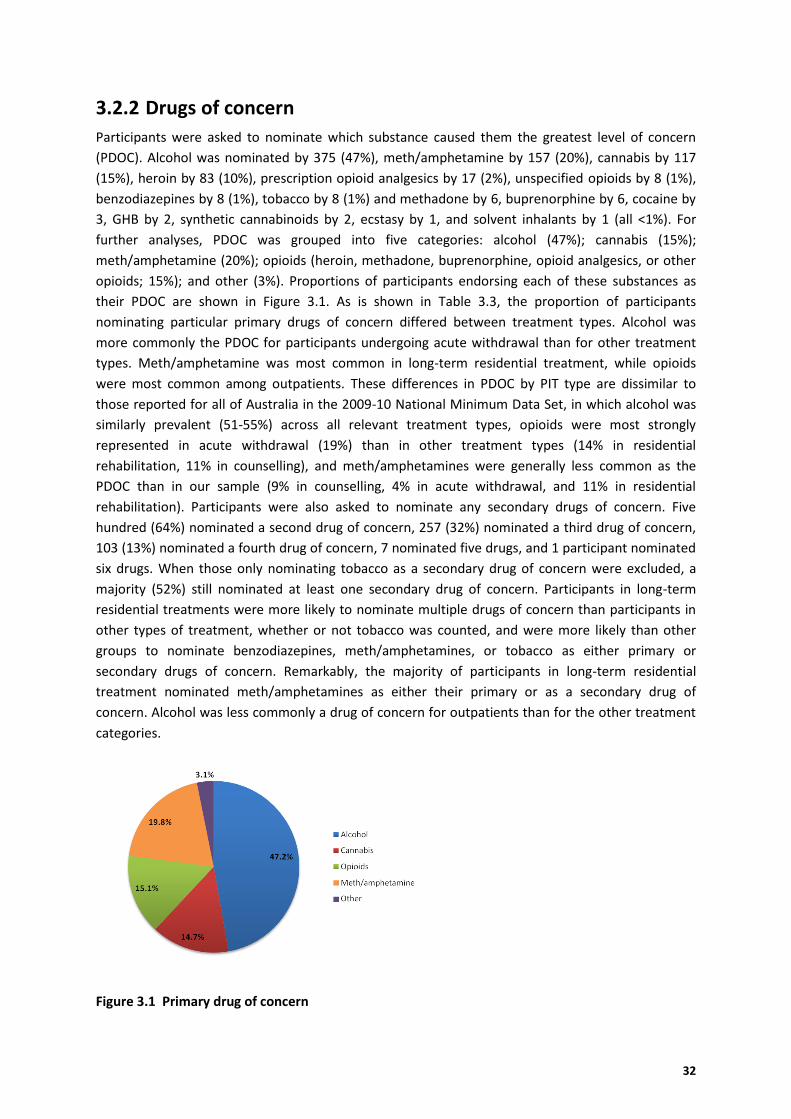
32
3.2.2 Drugs of concern
Participants were asked to nominate which substance caused them the greatest level of concern
(PDOC). Alcohol was nominated by 375 (47%), meth/amphetamine by 157 (20%), cannabis by 117
(15%), heroin by 83 (10%), prescription opioid analgesics by 17 (2%), unspecified opioids by 8 (1%),
benzodiazepines by 8 (1%), tobacco by 8 (1%) and methadone by 6, buprenorphine by 6, cocaine by
3, GHB by 2, synthetic cannabinoids by 2, ecstasy by 1, and solvent inhalants by 1 (all <1%). For
further analyses, PDOC was grouped into five categories: alcohol (47%); cannabis (15%);
meth/amphetamine (20%); opioids (heroin, methadone, buprenorphine, opioid analgesics, or other
opioids; 15%); and other (3%). Proportions of participants endorsing each of these substances as
their PDOC are shown in Figure 3.1. As is shown in Table 3.3, the proportion of participants
nominating particular primary drugs of concern differed between treatment types. Alcohol was
more commonly the PDOC for participants undergoing acute withdrawal than for other treatment
types. Meth/amphetamine was most common in long-term residential treatment, while opioids
were most common among outpatients. These differences in PDOC by PIT type are dissimilar to
those reported for all of Australia in the 2009-10 National Minimum Data Set, in which alcohol was
similarly prevalent (51-55%) across all relevant treatment types, opioids were most strongly
represented in acute withdrawal (19%) than in other treatment types (14% in residential
rehabilitation, 11% in counselling), and meth/amphetamines were generally less common as the
PDOC than in our sample (9% in counselling, 4% in acute withdrawal, and 11% in residential
rehabilitation). Participants were also asked to nominate any secondary drugs of concern. Five
hundred (64%) nominated a second drug of concern, 257 (32%) nominated a third drug of concern,
103 (13%) nominated a fourth drug of concern, 7 nominated five drugs, and 1 participant nominated
six drugs. When those only nominating tobacco as a secondary drug of concern were excluded, a
majority (52%) still nominated at least one secondary drug of concern. Participants in long-term
residential treatments were more likely to nominate multiple drugs of concern than participants in
other types of treatment, whether or not tobacco was counted, and were more likely than other
groups to nominate benzodiazepines, meth/amphetamines, or tobacco as either primary or
secondary drugs of concern. Remarkably, the majority of participants in long-term residential
treatment nominated meth/amphetamines as either their primary or as a secondary drug of
concern. Alcohol was less commonly a drug of concern for outpatients than for the other treatment
categories.
Figure 3.1 Primary drug of concern
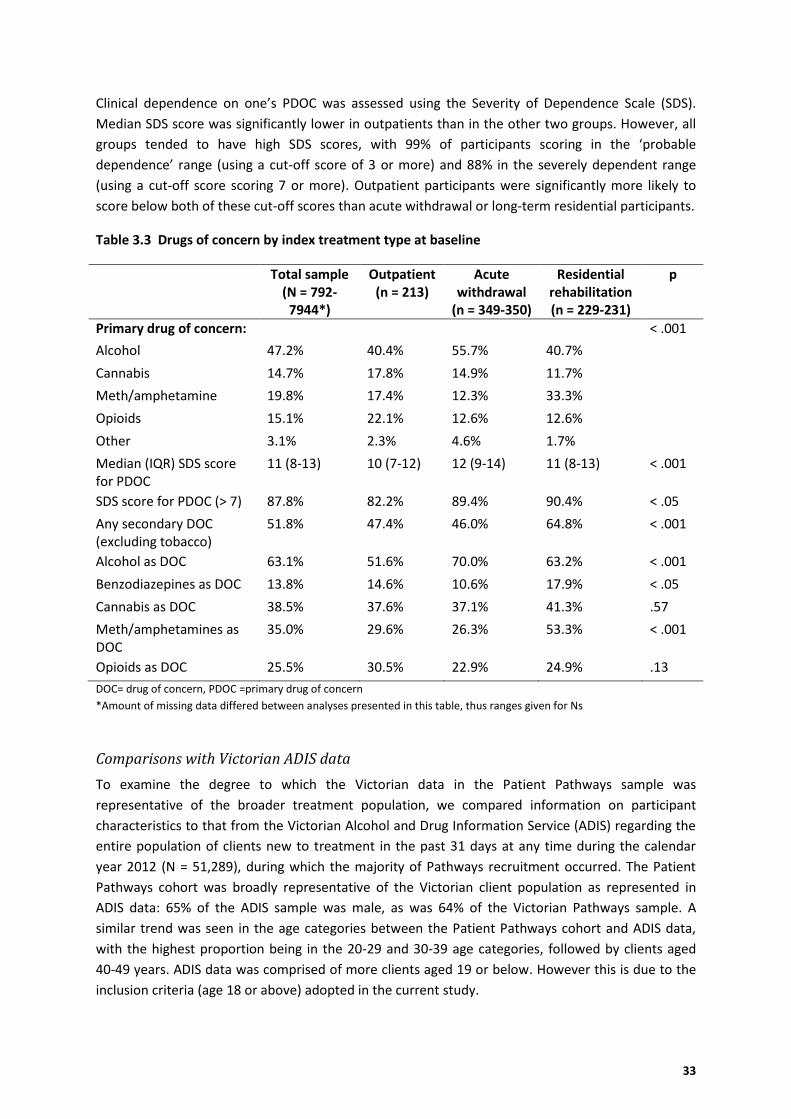
33
Clinical dependence on one’s PDOC was assessed using the Severity of Dependence Scale (SDS).
Median SDS score was significantly lower in outpatients than in the other two groups. However, all
groups tended to have high SDS scores, with 99% of participants scoring in the ‘probable
dependence’ range (using a cut-off score of 3 or more) and 88% in the severely dependent range
(using a cut-off score scoring 7 or more). Outpatient participants were significantly more likely to
score below both of these cut-off scores than acute withdrawal or long-term residential participants.
Table 3.3 Drugs of concern by index treatment type at baseline
Total sample (N = 792-
7944*)
Outpatient (n = 213)
Acute withdrawal
(n = 349-350)
Residential rehabilitation (n = 229-231)
p
Primary drug of concern: \
< .001
Alcohol 47.2% 40.4% 55.7% 40.7%
Cannabis
14.7% 17.8% 14.9% 11.7%
Meth/amphetamine
19.8% 17.4% 12.3% 33.3%
Opioids
15.1% 22.1% 12.6% 12.6%
Other
3.1% 2.3% 4.6% 1.7%
Median (IQR) SDS score for PDOC
11 (8-13) 10 (7-12) 12 (9-14) 11 (8-13) < .001
SDS score for PDOC (> 7) 87.8% 82.2% 89.4% 90.4% < .05
Any secondary DOC (excluding tobacco)
51.8% 47.4% 46.0% 64.8% < .001
Alcohol as DOC 63.1% 51.6% 70.0% 63.2% < .001
Benzodiazepines as DOC 13.8% 14.6% 10.6% 17.9% < .05
Cannabis as DOC 38.5% 37.6% 37.1% 41.3% .57
Meth/amphetamines as DOC
35.0% 29.6% 26.3% 53.3% < .001
Opioids as DOC 25.5% 30.5% 22.9% 24.9% .13
DOC= drug of concern, PDOC =primary drug of concern
*Amount of missing data differed between analyses presented in this table, thus ranges given for Ns
Comparisons with Victorian ADIS data
To examine the degree to which the Victorian data in the Patient Pathways sample was
representative of the broader treatment population, we compared information on participant
characteristics to that from the Victorian Alcohol and Drug Information Service (ADIS) regarding the
entire population of clients new to treatment in the past 31 days at any time during the calendar
year 2012 (N = 51,289), during which the majority of Pathways recruitment occurred. The Patient
Pathways cohort was broadly representative of the Victorian client population as represented in
ADIS data: 65% of the ADIS sample was male, as was 64% of the Victorian Pathways sample. A
similar trend was seen in the age categories between the Patient Pathways cohort and ADIS data,
with the highest proportion being in the 20-29 and 30-39 age categories, followed by clients aged
40-49 years. ADIS data was comprised of more clients aged 19 or below. However this is due to the
inclusion criteria (age 18 or above) adopted in the current study.
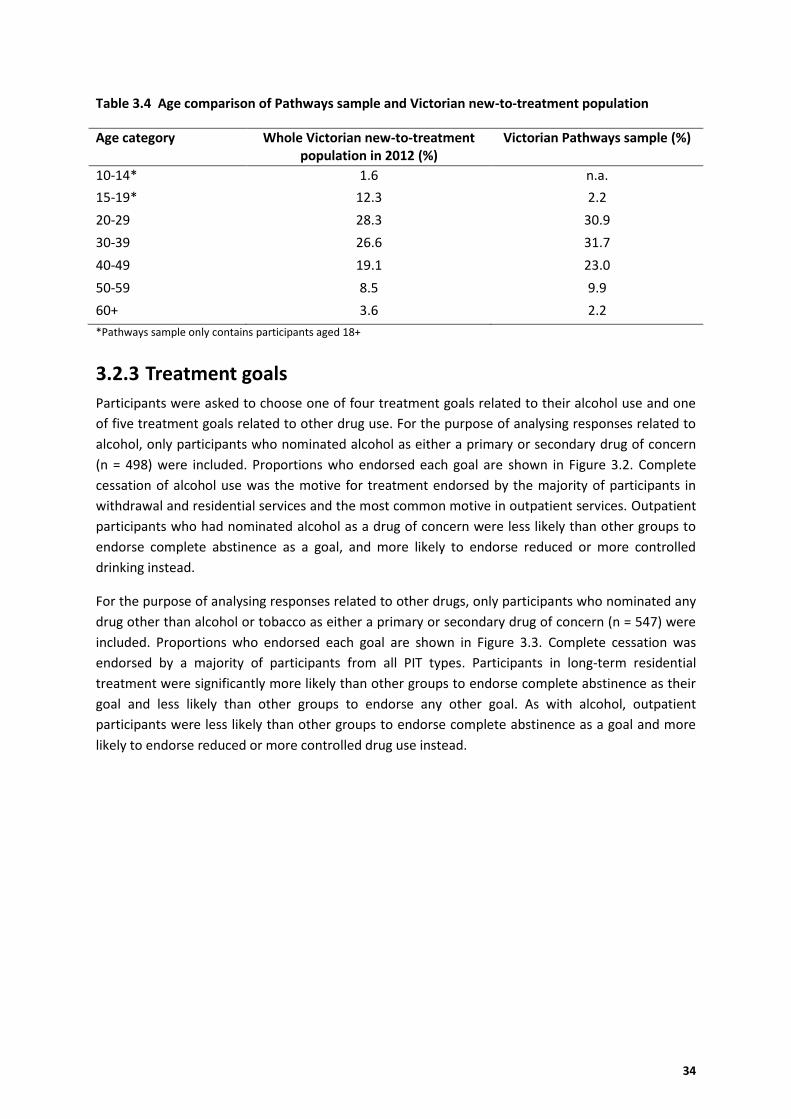
34
Table 3.4 Age comparison of Pathways sample and Victorian new-to-treatment population
Age category Whole Victorian new-to-treatment population in 2012 (%)
Victorian Pathways sample (%)
10-14* 1.6 n.a.
15-19* 12.3 2.2
20-29 28.3 30.9
30-39 26.6 31.7
40-49 19.1 23.0
50-59 8.5 9.9
60+ 3.6 2.2
*Pathways sample only contains participants aged 18+
3.2.3 Treatment goals
Participants were asked to choose one of four treatment goals related to their alcohol use and one
of five treatment goals related to other drug use. For the purpose of analysing responses related to
alcohol, only participants who nominated alcohol as either a primary or secondary drug of concern
(n = 498) were included. Proportions who endorsed each goal are shown in Figure 3.2. Complete
cessation of alcohol use was the motive for treatment endorsed by the majority of participants in
withdrawal and residential services and the most common motive in outpatient services. Outpatient
participants who had nominated alcohol as a drug of concern were less likely than other groups to
endorse complete abstinence as a goal, and more likely to endorse reduced or more controlled
drinking instead.
For the purpose of analysing responses related to other drugs, only participants who nominated any
drug other than alcohol or tobacco as either a primary or secondary drug of concern (n = 547) were
included. Proportions who endorsed each goal are shown in Figure 3.3. Complete cessation was
endorsed by a majority of participants from all PIT types. Participants in long-term residential
treatment were significantly more likely than other groups to endorse complete abstinence as their
goal and less likely than other groups to endorse any other goal. As with alcohol, outpatient
participants were less likely than other groups to endorse complete abstinence as a goal and more
likely to endorse reduced or more controlled drug use instead.
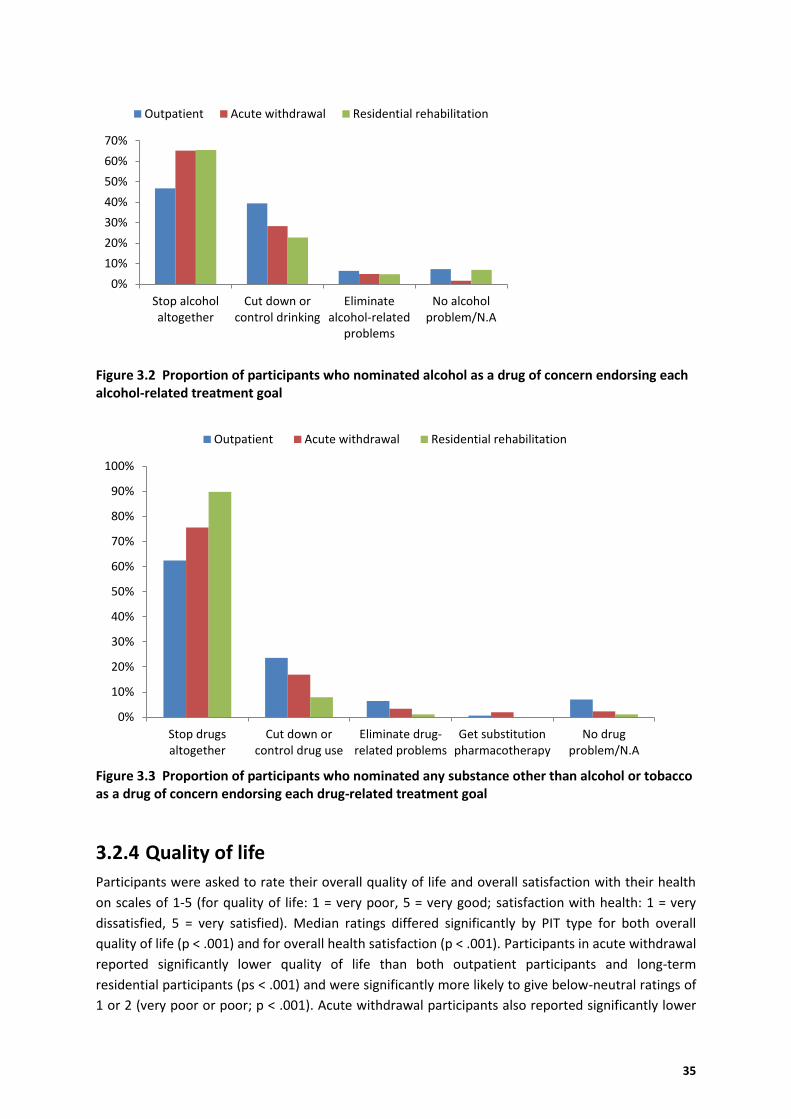
35
Figure 3.2 Proportion of participants who nominated alcohol as a drug of concern endorsing each alcohol-related treatment goal
Figure 3.3 Proportion of participants who nominated any substance other than alcohol or tobacco as a drug of concern endorsing each drug-related treatment goal
3.2.4 Quality of life
Participants were asked to rate their overall quality of life and overall satisfaction with their health
on scales of 1-5 (for quality of life: 1 = very poor, 5 = very good; satisfaction with health: 1 = very
dissatisfied, 5 = very satisfied). Median ratings differed significantly by PIT type for both overall
quality of life (p < .001) and for overall health satisfaction (p < .001). Participants in acute withdrawal
reported significantly lower quality of life than both outpatient participants and long-term
residential participants (ps < .001) and were significantly more likely to give below-neutral ratings of
1 or 2 (very poor or poor; p < .001). Acute withdrawal participants also reported significantly lower
0%
10%
20%
30%
40%
50%
60%
70%
Stop alcoholaltogether
Cut down orcontrol drinking
Eliminatealcohol-related
problems
No alcoholproblem/N.A
Outpatient Acute withdrawal Residential rehabilitation
0%
10%
20%
30%
40%
50%
60%
70%
80%
90%
100%
Stop drugsaltogether
Cut down orcontrol drug use
Eliminate drug-related problems
Get substitutionpharmacotherapy
No drugproblem/N.A
Outpatient Acute withdrawal Residential rehabilitation
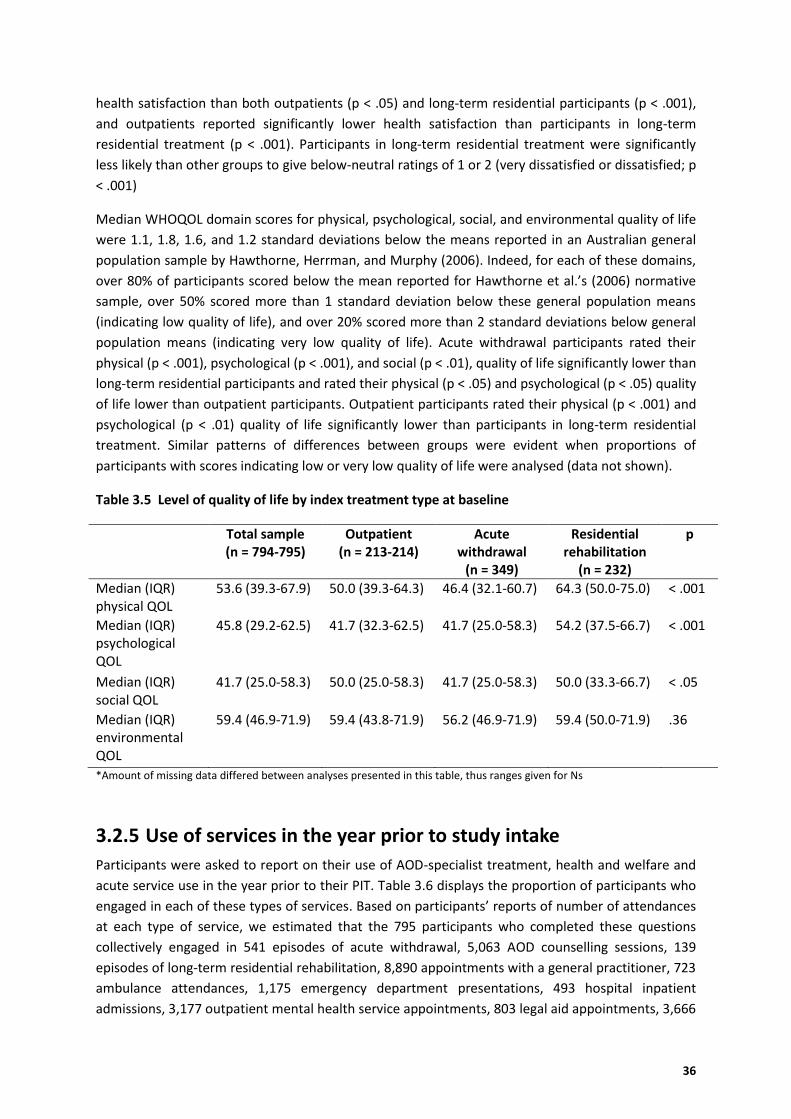
36
health satisfaction than both outpatients (p < .05) and long-term residential participants (p < .001),
and outpatients reported significantly lower health satisfaction than participants in long-term
residential treatment (p < .001). Participants in long-term residential treatment were significantly
less likely than other groups to give below-neutral ratings of 1 or 2 (very dissatisfied or dissatisfied; p
< .001)
Median WHOQOL domain scores for physical, psychological, social, and environmental quality of life
were 1.1, 1.8, 1.6, and 1.2 standard deviations below the means reported in an Australian general
population sample by Hawthorne, Herrman, and Murphy (2006). Indeed, for each of these domains,
over 80% of participants scored below the mean reported for Hawthorne et al.’s (2006) normative
sample, over 50% scored more than 1 standard deviation below these general population means
(indicating low quality of life), and over 20% scored more than 2 standard deviations below general
population means (indicating very low quality of life). Acute withdrawal participants rated their
physical (p < .001), psychological (p < .001), and social (p < .01), quality of life significantly lower than
long-term residential participants and rated their physical (p < .05) and psychological (p < .05) quality
of life lower than outpatient participants. Outpatient participants rated their physical (p < .001) and
psychological (p < .01) quality of life significantly lower than participants in long-term residential
treatment. Similar patterns of differences between groups were evident when proportions of
participants with scores indicating low or very low quality of life were analysed (data not shown).
Table 3.5 Level of quality of life by index treatment type at baseline
Total sample (n = 794-795)
Outpatient (n = 213-214)
Acute withdrawal
(n = 349)
Residential rehabilitation
(n = 232)
p
Median (IQR) physical QOL
53.6 (39.3-67.9) 50.0 (39.3-64.3) 46.4 (32.1-60.7) 64.3 (50.0-75.0) < .001
Median (IQR) psychological QOL
45.8 (29.2-62.5) 41.7 (32.3-62.5) 41.7 (25.0-58.3) 54.2 (37.5-66.7) < .001
Median (IQR) social QOL
41.7 (25.0-58.3) 50.0 (25.0-58.3) 41.7 (25.0-58.3) 50.0 (33.3-66.7) < .05
Median (IQR) environmental QOL
59.4 (46.9-71.9) 59.4 (43.8-71.9) 56.2 (46.9-71.9) 59.4 (50.0-71.9) .36
*Amount of missing data differed between analyses presented in this table, thus ranges given for Ns
3.2.5 Use of services in the year prior to study intake
Participants were asked to report on their use of AOD-specialist treatment, health and welfare and
acute service use in the year prior to their PIT. Table 3.6 displays the proportion of participants who
engaged in each of these types of services. Based on participants’ reports of number of attendances
at each type of service, we estimated that the 795 participants who completed these questions
collectively engaged in 541 episodes of acute withdrawal, 5,063 AOD counselling sessions, 139
episodes of long-term residential rehabilitation, 8,890 appointments with a general practitioner, 723
ambulance attendances, 1,175 emergency department presentations, 493 hospital inpatient
admissions, 3,177 outpatient mental health service appointments, 803 legal aid appointments, 3,666
37
employment service appointments, and 1,068 attendances at a housing or homelessness service in
the year prior to their PIT. Overall, 68% of participants had previously attended some type of AOD
service. Prior AOD service use was significantly more common among those in long-term residential
treatment (80%) than outpatient participants (60%) or acute withdrawal participants (64%).
Participants in long-term residential treatment were significantly more likely than those in other
groups to report prior attendance at an acute withdrawal service (perhaps reflecting the fact that
supervised acute withdrawal is a prerequisite for attendance at many long-term residential services)
and engagement in previous long-term residential treatments.
While there were no differences between groups in the proportion who had attended an
appointment with a general practitioner (GP), or in mean number of visits, it is noteworthy that 25%
of the sample averaged more than one GP visit per month (13 or more visits in the past year),
suggesting a high rate of general health problems in at least a large minority of the sample. This is
further supported by the fact that 60% of participants used an acute health service (ambulance,
emergency department (ED), or hospital inpatient admission) in this 12-month period, including 53%
who reported at least one ED presentation. While overall proportion of participants attending these
service types did not differ significantly between groups, long-term residential participants were
significantly more likely to report multiple (2 or more) ED presentations than outpatient participants
or acute withdrawal participants (37% vs. 23% and 29% respectively). Outpatient participants were
significantly more likely than other groups to have attended outpatient mental health services and
housing/homelessness services.
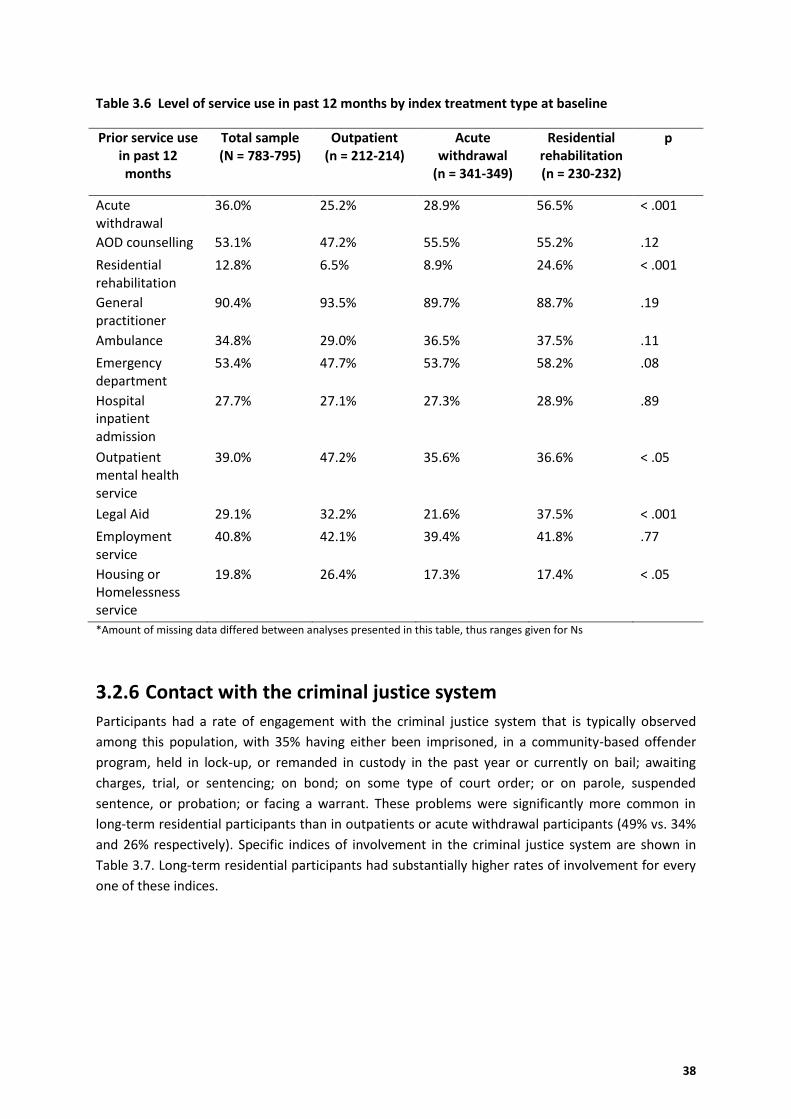
38
Table 3.6 Level of service use in past 12 months by index treatment type at baseline
Prior service use in past 12 months
Total sample (N = 783-795)
Outpatient (n = 212-214)
Acute withdrawal
(n = 341-349)
Residential rehabilitation (n = 230-232)
p
Acute withdrawal
36.0% 25.2% 28.9% 56.5% < .001
AOD counselling 53.1% 47.2% 55.5% 55.2% .12
Residential rehabilitation
12.8% 6.5% 8.9% 24.6% < .001
General practitioner
90.4% 93.5% 89.7% 88.7% .19
Ambulance 34.8% 29.0% 36.5% 37.5% .11
Emergency department
53.4% 47.7% 53.7% 58.2% .08
Hospital inpatient admission
27.7% 27.1% 27.3% 28.9% .89
Outpatient mental health service
39.0% 47.2% 35.6% 36.6% < .05
Legal Aid 29.1% 32.2% 21.6% 37.5% < .001
Employment service
40.8% 42.1% 39.4% 41.8% .77
Housing or Homelessness service
19.8% 26.4% 17.3% 17.4% < .05
*Amount of missing data differed between analyses presented in this table, thus ranges given for Ns
3.2.6 Contact with the criminal justice system
Participants had a rate of engagement with the criminal justice system that is typically observed
among this population, with 35% having either been imprisoned, in a community-based offender
program, held in lock-up, or remanded in custody in the past year or currently on bail; awaiting
charges, trial, or sentencing; on bond; on some type of court order; or on parole, suspended
sentence, or probation; or facing a warrant. These problems were significantly more common in
long-term residential participants than in outpatients or acute withdrawal participants (49% vs. 34%
and 26% respectively). Specific indices of involvement in the criminal justice system are shown in
Table 3.7. Long-term residential participants had substantially higher rates of involvement for every
one of these indices.
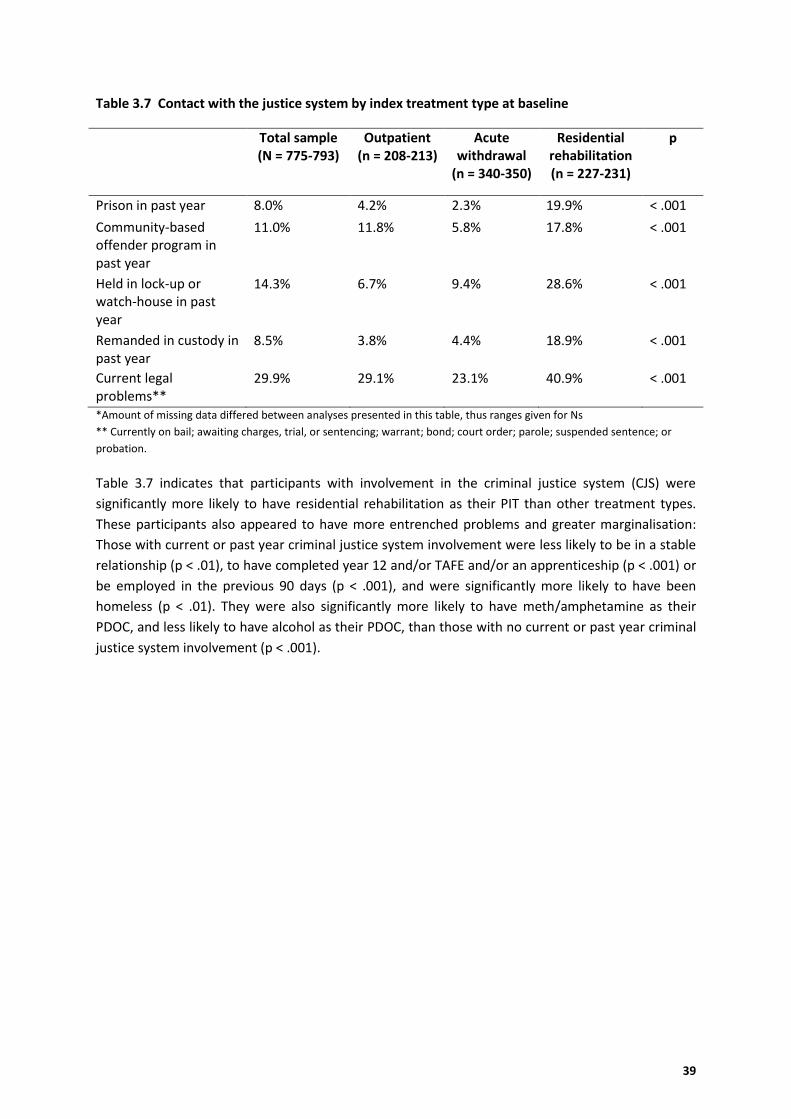
39
Table 3.7 Contact with the justice system by index treatment type at baseline
Total sample (N = 775-793)
Outpatient (n = 208-213)
Acute withdrawal
(n = 340-350)
Residential rehabilitation (n = 227-231)
p
Prison in past year 8.0% 4.2% 2.3% 19.9% < .001
Community-based offender program in past year
11.0% 11.8% 5.8% 17.8% < .001
Held in lock-up or watch-house in past year
14.3% 6.7% 9.4% 28.6% < .001
Remanded in custody in past year
8.5% 3.8% 4.4% 18.9% < .001
Current legal problems**
29.9% 29.1% 23.1% 40.9% < .001
*Amount of missing data differed between analyses presented in this table, thus ranges given for Ns
** Currently on bail; awaiting charges, trial, or sentencing; warrant; bond; court order; parole; suspended sentence; or
probation.
Table 3.7 indicates that participants with involvement in the criminal justice system (CJS) were
significantly more likely to have residential rehabilitation as their PIT than other treatment types.
These participants also appeared to have more entrenched problems and greater marginalisation:
Those with current or past year criminal justice system involvement were less likely to be in a stable
relationship (p < .01), to have completed year 12 and/or TAFE and/or an apprenticeship (p < .001) or
be employed in the previous 90 days (p < .001), and were significantly more likely to have been
homeless (p < .01). They were also significantly more likely to have meth/amphetamine as their
PDOC, and less likely to have alcohol as their PDOC, than those with no current or past year criminal
justice system involvement (p < .001).
40
3.3 Follow-up
Overview
The outcomes for 73% (585/796) of the sample were ascertained, with 555 (70%) of participants
successfully re-interviewed, 11 deceased and 19 incarcerated. Sixty-six participants (8%) withdrew
from the study and 145 (18%) could not be contacted and were lost to follow-up. The participants
who completed follow-up interviews were compared to those who did not on several baseline
demographic, substance use, and treatment variables to detect potential sources of bias in follow-up
data. Follow-up completers did not differ significantly from non-completers in gender, marital status,
whether or not they were born in Australia, having English as a first language or not, completion of
either year 12 and/or TAFE and/or an apprenticeship, usual employment pattern in the past 12
months, current receipt of government benefits, SDS score for their PDOC, overall QOL, overall
health satisfaction, physical QOL, psychological QOL, social QOL, or environmental QOL ratings, nor
current receipt of government benefits (all ps >. 05).
Those who completed a follow-up interview were significantly older at baseline than non-completers
(p < .001). Participants from Western Australia were significantly less likely to complete the follow-
up interview than participants from Victoria (64% vs. 75%, p <. 001) and those who had experienced
homelessness in the 90 days prior to baseline were less likely to complete the follow-up interview
than those who did not (61% vs. 73%; p < .01). Participants who reported suffering a chronic medical
condition at baseline were more likely to be followed up than those who did not (73% vs. 67%; p <
.05). Participants who were involved in the criminal justice system at baseline were also significantly
less likely to complete the follow-up interview than those with no criminal justice system
involvement (60% vs. 74%, p < .001). Participants whose PIT was outpatient treatment were most
likely to complete the follow-up interview, while those in long-term residential treatment were least
likely (outpatient: 82%, acute withdrawal: 69%, long-term residential: 59%; p < .001). Having
meth/amphetamine as the PDOC was associated with a significantly lower likelihood of completing
the follow-up interview than other PDOC categories (alcohol: 73%, cannabis: 73%, opioids: 73%,
meth/amphetamine: 59%, other: 64%; p < .01).
The time between baseline and follow-up interviews ranged from 232 to 644 days (mean = 380.3, SD
= 71.8). This follow-up interval differed significantly between PIT types (p < .001). Outpatient
participants’ mean follow-up interval (400.2 days) was significantly longer than the follow-up
intervals for those whose PIT was acute withdrawal (375.2 days) or long-term residential treatment
(363.9 days).
PIT completed: 364/553 (66%) reported completing their PIT and 33 (6%; 28 outpatients, 5 long-
term rehabilitation participants) were still in the same programme as when recruited. The
proportion of participants who had either completed their PIT or were still engaged in it was
significantly higher for acute withdrawal (86%), followed by long-term residential rehabilitation
(64%) and lowest among outpatient participants, (59%), p < .001.
Treatment satisfaction: Those who were no longer in their PIT (completed or ceased before
completion; N = 513) were asked “Did you feel you successfully achieved what you wanted from
treatment?” Positive endorsement of this item was significantly higher among acute withdrawal
participants (77%) and long-term residential participants (70%) relative to outpatients (62%) (p <
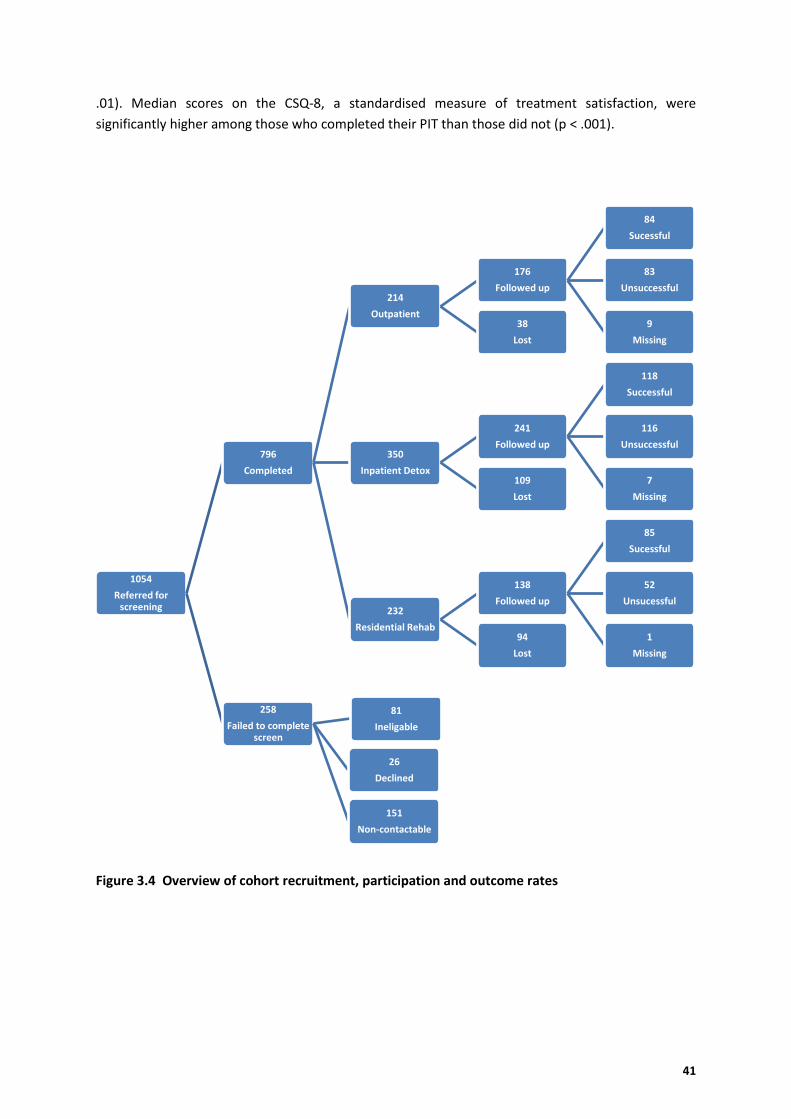
41
.01). Median scores on the CSQ-8, a standardised measure of treatment satisfaction, were
significantly higher among those who completed their PIT than those did not (p < .001).
Figure 3.4 Overview of cohort recruitment, participation and outcome rates
1054
Referred for screening
796
Completed
214
Outpatient
176
Followed up
84
Sucessful
83
Unsuccessful
9
Missing
38
Lost
350
Inpatient Detox
241
Followed up
118
Successful
116
Unsuccessful
7
Missing
109
Lost
232
Residential Rehab
138
Followed up
85
Sucessful
52
Unsucessful
1
Missing
94
Lost
258
Failed to complete screen
81
Ineligable
26
Declined
151
Non-contactable
42
3.3.1 Duration of PIT
Participants who were not still engaged in their PIT at follow-up (i.e. whose PIT was either completed
or ended prematurely) were asked about the duration spent engaged in the PIT. Among outpatient
participants whose PIT had ended prior to follow-up (n = 123), duration of engagement in PIT ranged
from 1-483 days (median = 70; IQR = 28-168). No acute withdrawal participants (n = 234) were still
engaged in their PIT at follow-up, and PIT duration ranged from 1-22 days. A seven-day course of
treatment was the norm for this group, with 62% reporting this as their duration, 10% reporting
shorter durations, and 28% reporting durations of 8 or more days. Long-term residential treatment
duration in those not still engaged in their PIT at follow-up (n = 129) ranged from 4 to 392 days
(median = 63, IQR = 28-143.5).
3.3.2 Changes in personal circumstances between baseline and follow-up
Table 3.8 shows that there were some markers of increased stability and functioning one year after
the PIT. Whilst unemployment rates were unchanged, the proportion of participants receiving
unemployment benefits at the time of follow-up had fallen significantly. In addition, a significantly
lower proportion had experienced recent homelessness at follow-up. There were non-significant
trends in a positive direction for both stable relationships and criminal justice involvement.
Table 3.8 Changes in personal circumstances at baseline and follow-up (post-PIT) (ns =549-554)
Baseline n (%) Follow-up n (%) p
Unemployment (no paid employment in past 90 days)
368 (67.0) 367 (66.8) 1.0
Current receipt of unemployment benefits 248 (44.8) 211 (38.1) < .01
Homeless/housing issues 126 (22.8) 99 (17.9) < .05
Criminal justice involvement 142 (25.8) 122 (22.1) .09
Stable relationship (married/de facto) 109 (19.7) 119 (21.5) .29
3.3.3 Service use post-PIT
There were few changes in the proportion using AOD specialist, community and acute services
between baseline and follow-up, with almost all (94%) visiting a GP and more than two thirds
attending further AOD-specialist treatment (see Table 3.9). In contrast, the proportion engaging with
financial counselling services (12%) and family/relationship counselling services (8%) remained
similarly low, and significantly dropped for legal aid (from 26% to 20%). The proportion engaging
with acute withdrawal decreased significantly whilst the proportion who engaged with residential
rehabilitation increased significantly. There was a significant increase in the proportion who engaged
with mutual aid groups (e.g. AA, NA, other 12-step, SMART Recovery or other recovery groups such
as Gamblers Anonymous, etc.,) which were attended by 33% at baseline and 49% at follow-up.
Although more than half of participants had used at least one type of acute health service
(ambulance, ED, hospital inpatient admission) at follow-up, there was a statistically significant
decrease in rates of acute service use relative to rates of use before baseline. There was a 16%
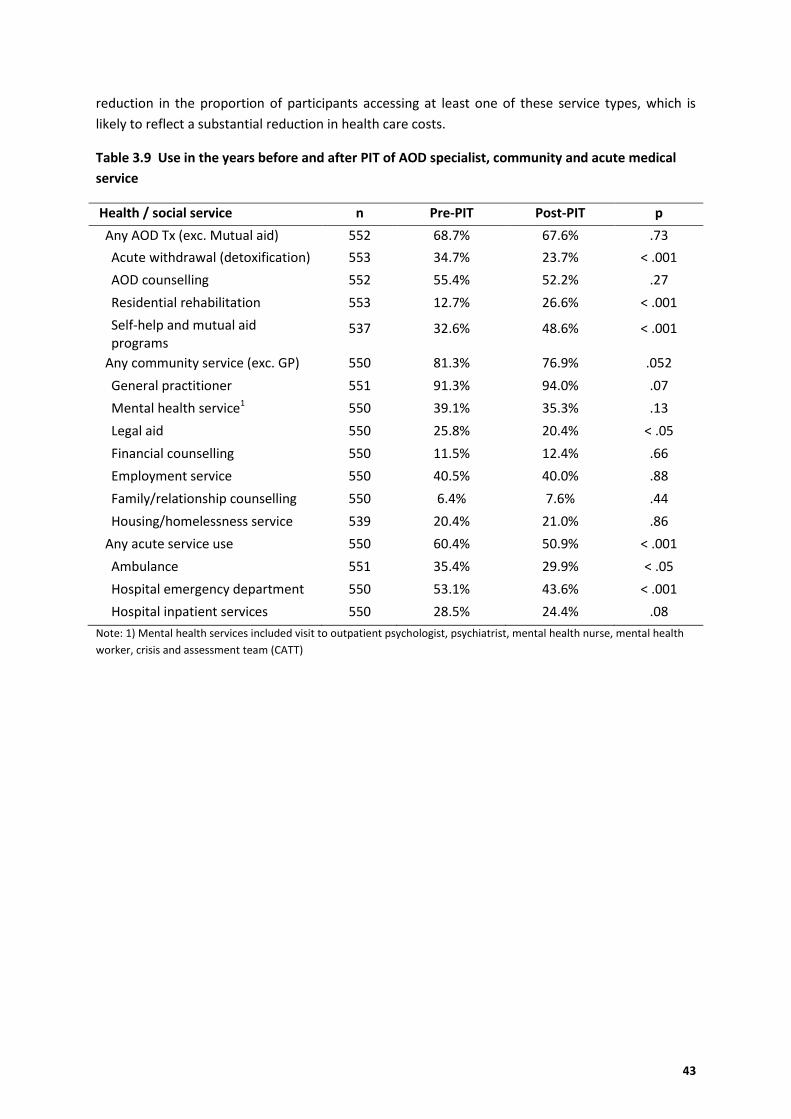
43
reduction in the proportion of participants accessing at least one of these service types, which is
likely to reflect a substantial reduction in health care costs.
Table 3.9 Use in the years before and after PIT of AOD specialist, community and acute medical
service
Health / social service n Pre-PIT Post-PIT p
Any AOD Tx (exc. Mutual aid) 552 68.7% 67.6% .73
Acute withdrawal (detoxification) 553 34.7% 23.7% < .001
AOD counselling 552 55.4% 52.2% .27
Residential rehabilitation 553 12.7% 26.6% < .001
Self-help and mutual aid programs
537 32.6% 48.6% < .001
Any community service (exc. GP) 550 81.3% 76.9% .052
General practitioner 551 91.3% 94.0% .07
Mental health service1 550 39.1% 35.3% .13
Legal aid 550 25.8% 20.4% < .05
Financial counselling 550 11.5% 12.4% .66
Employment service 550 40.5% 40.0% .88
Family/relationship counselling 550 6.4% 7.6% .44
Housing/homelessness service 539 20.4% 21.0% .86
Any acute service use 550 60.4% 50.9% < .001
Ambulance 551 35.4% 29.9% < .05
Hospital emergency department 550 53.1% 43.6% < .001
Hospital inpatient services 550 28.5% 24.4% .08
Note: 1) Mental health services included visit to outpatient psychologist, psychiatrist, mental health nurse, mental health
worker, crisis and assessment team (CATT)
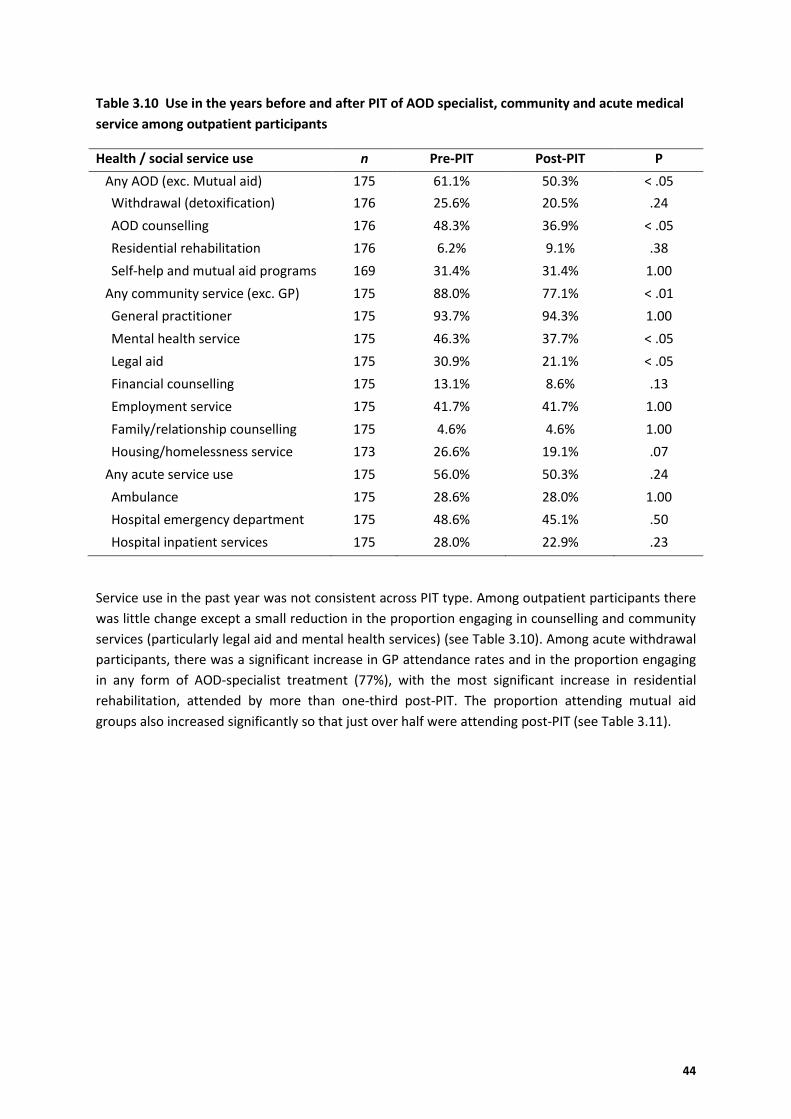
44
Table 3.10 Use in the years before and after PIT of AOD specialist, community and acute medical
service among outpatient participants
Health / social service use n Pre-PIT Post-PIT P
Any AOD (exc. Mutual aid) 175 61.1% 50.3% < .05
Withdrawal (detoxification) 176 25.6% 20.5% .24
AOD counselling 176 48.3% 36.9% < .05
Residential rehabilitation 176 6.2% 9.1% .38
Self-help and mutual aid programs 169 31.4% 31.4% 1.00
Any community service (exc. GP) 175 88.0% 77.1% < .01
General practitioner 175 93.7% 94.3% 1.00
Mental health service 175 46.3% 37.7% < .05
Legal aid 175 30.9% 21.1% < .05
Financial counselling 175 13.1% 8.6% .13
Employment service 175 41.7% 41.7% 1.00
Family/relationship counselling 175 4.6% 4.6% 1.00
Housing/homelessness service 173 26.6% 19.1% .07
Any acute service use 175 56.0% 50.3% .24
Ambulance 175 28.6% 28.0% 1.00
Hospital emergency department 175 48.6% 45.1% .50
Hospital inpatient services 175 28.0% 22.9% .23
Service use in the past year was not consistent across PIT type. Among outpatient participants there
was little change except a small reduction in the proportion engaging in counselling and community
services (particularly legal aid and mental health services) (see Table 3.10). Among acute withdrawal
participants, there was a significant increase in GP attendance rates and in the proportion engaging
in any form of AOD-specialist treatment (77%), with the most significant increase in residential
rehabilitation, attended by more than one-third post-PIT. The proportion attending mutual aid
groups also increased significantly so that just over half were attending post-PIT (see Table 3.11).
45
Table 3.11 Use in the years before and after PIT of AOD specialist, community and acute medical
service among acute withdrawal participants
Health / social service use n Pre-PIT Post-PIT P
Any AOD (exc. Mutual aid) 240 67.1% 76.7% < .05
Withdrawal (detoxification) 240 28.8% 27.1% .75
AOD counselling 239 59.0% 60.3% .84
Residential rehabilitation 240 7.9% 34.2% < .001
Self-help and mutual aid programs
233 30.0% 50.2% < .001
Any community service (exc. GP) 239 76.2% 77.0% .90
General practitioner 239 90.0% 95.4% < .05
Mental health service 239 37.2% 37.2% 1.00
Legal aid 239 18.8% 19.2% 1.00
Financial counselling 239 13.0% 15.5% .46
Employment service 239 38.9% 36.8% .64
Family/relationship counselling 239 6.3% 8.8% .34
Housing/homelessness service 232 18.1% 19.0% .89
Any acute service use 239 59.8% 55.2% .29
Ambulance 239 37.2% 33.9% .43
Hospital emergency department 239 51.9% 46.0% .17
Hospital inpatient 239 28.5% 28.9% 1.00
Among participants in residential rehabilitation (Table 3.12) there was little change except a
reduction in the proportion undergoing inpatient detoxification post-PIT and in their acute service
use (though this is likely an artefact of their increased time in residential services where substance
use is prohibited and where they receive more regular medical attention). There was however a
significant increase in the proportion attending mutual aid meetings, with over two-thirds attending
during the year after their PIT, though this could reflect the philosophy of the PIT type; since
encouragement to engage in peer-support following discharge is common in residential
rehabilitation settings (or even a component of the rehabilitation treatment itself).
46
Table 3.12 Use in the years before and after PIT of AOD specialist, community and acute medical
service among residential rehabilitation participants
Health / social service n Pre-PIT Post-PIT P
Any AOD (exc. Mutual aid) 137 81.0% 73.7% .16
Withdrawal (detoxification) 137 56.9% 21.9% < .001
AOD counselling 137 58.4% 57.7% 1.00
Residential rehabilitation 137 29.2% 35.8% .25
Self-help and mutual aid programs
135 38.5% 67.4% < .001
Any community service (exc. GP) 136 81.6% 76.5% .28
General practitioner 137 90.5% 91.2% 1.00
Mental health service 136 33.1% 28.7% .41
Legal aid 136 31.6% 21.3% < .05
Financial counselling 136 6.6% 11.8% .14
Employment service 136 41.9% 43.4% .89
Family/relationship counselling 136 8.8% 9.6% 1.00
Housing/homelessness service 134 16.4% 26.9% < .05
Any acute service use 136 66.9% 44.1% < .001
Ambulance 137 40.9% 25.5% < .01
Hospital emergency department 136 61.0% 37.5% < .001
Hospital inpatient 136 29.4% 18.4% < .05
3.3.4 Service use Post-PIT by Primary drug type
Participants with opioids as their PDOC were much more likely to engage in specialist AOD services
post-PIT. Participants with alcohol as their PDOC were more likely to engage with acute services in
the year following their PIT. In contrast, use of community services and mutual aid showed little
variation according to PDOC. The referral source for the 36 outpatient participants who attended an
acute withdrawal post-PIT was most commonly self-referral (n=16, 44%) followed by referral from an
AOD service (n=13, 36%). The referral source for the 82 acute withdrawal participants who attended
residential rehabilitation post-PIT was most commonly self-referral (n=38, 47%) followed by referral
from AOD service (n=21, 26%), and then referral from an emergency department (n=15, 19%).
Table 3.13 Post PIT AOD specialist, community and acute medical service use by PDOC
Service type attended Alcohol (%)
Cannabis (%)
Opioids (%)
Meth/amphet (%)
Total (%)
p
AOD services (not including mutual aid or pharmacotherapy)
67.0 64.7 67.4 69.6 67.6 .76
Community service 72.8 82.4 80.2 79.3 77.0 .21
Acute or emergency services 58.1 42.4 41.9 46.7 51.0 < .05
Mutual aid or self help groups 50.4 35.7 51.2 53.8 48.6 .12
Pharmacotherapy 17.2 9.4 60.7 9.8 21.6 < .001
47
3.3.5 Participant outcomes
(A) Abstinence
At follow-up 37.5% (208/554) reported that they had been abstinent from their PDOC in the month
prior to interview. Abstinence rates were highest when the PDOC was meth/amphetamine (61%),
followed by opioids (45%); cannabis (34%) and lowest for alcohol (28%). Participants who were
prescribed their PDOC, or a pharmacologically similar substance (e.g. substitution
pharmacotherapy), but only used it as prescribed (i.e. never used more than the prescribed dose or
sourced additional illicit supplies of the substance) were considered abstinent for the purpose of
these analyses (n = 22). A similarly superior outcome for participants with meth/amphetamine as
their PDOC was observed when abstinence from all drugs of concern other than tobacco was
analysed (see Figure 3.5).
Figure 3.5 Differences in rates of abstinence for PDOC and all DOCs when the PDOC is the indicated substance
Rates of abstinence were significantly higher among those for whom residential rehabilitation was
their PIT (56%; p < .001). Abstinence rates were 33% among those for whom outpatient counselling
was their PIT and 30% among those for whom acute withdrawal was their PIT. The rates of
abstinence from all drugs of concern (DOCs) other than tobacco by PIT are shown a similar trend
(see Figure 3.6). Twenty-one percent of the sample were entirely abstinent from all drugs in the past
month, including alcohol (but not including tobacco) at follow-up. The highest rate of complete
abstinence was achieved by long-term residential participants (30%), which was significantly higher
than rates achieved by other PIT groups (outpatient: 16%; acute withdrawal: 20%, p < .05). Taking a
conservative estimate and assuming all participants lost to follow-up (excluding those deceased or
incarcerated from the analysis) were still using, the overall past month abstinence rate from PDOC
was 27%.
These results consistently show long-term residential treatment to be associated with higher rates of
abstinence. To test this further, we compared participants who had any residential rehabilitation
either in the year preceding their PIT, as their PIT, or between their PIT and follow-up (n = 253) to
participants with no residential rehabilitation during this 2 year period (n = 302). Participants who
28.1
34.1
45.5
60.9
40 37.5
26.7 25.9
33
43.5
31.2 30.5
0
10
20
30
40
50
60
70
Alcohol Cannabis Opioids Meth/amphet Other Total
pe
rce
nta
ge o
f cl
ien
ts
Primary Drug of Concern
PDOC only All DOCs
48
had been in any residential rehabilitation were significantly more likely to be abstinent from all DOCs
(40% versus 22%; p < .001) and from their PDOC (48% versus 29%; p < .001). Fourteen percent
reported being abstinent from their PDOC during the past year, and rates were 26% when the PDOC
was meth/amphetamine, 17% for opioids, 16% for cannabis, and 8% for alcohol (p < .001). Only 4%
reported being entirely abstinent from all drug and alcohol use during the past year. .
Figure 3.6 Abstinence rates from PDOC and all DOCs by PIT type
Differences in abstinence rates by age, gender, ethnicity
Logistic regression results showed that being older predicted lower likelihood of abstinence from
PDOC (OR = 0.85, CI = 0.74-0.98), but not all DOCs (OR = .96, CI = 0.83-1.11), though this is likely to
be biased by the higher drop-out rate among younger participants. There were no significant
differences in gender with abstinence rates of 35% for men and 41% for women for PDOC (p = .21)
and 27% of men and 35% of women for all DOCs (p = .08). There were no significant differences in
the rates according to ethnicity, which for PDOC were 37% for Australian-born and 42% for foreign-
born participants (p = .32), though there was a near-significant trend for foreign-born participants to
be more likely to abstain from all their DOCs (29% among Australian-born; 38% among foreign-born;
p = .06) (Table 3.14).
33.0 30.4
55.8
37.5
26.7 25.3
44.5
30.5
0.0
10.0
20.0
30.0
40.0
50.0
60.0
Outpatient Acute withdrawal Residentialrehabilitation
Total
Pe
rce
nta
ge o
f p
arti
cip
ants
Treatment type
PDOC only
All DOCs
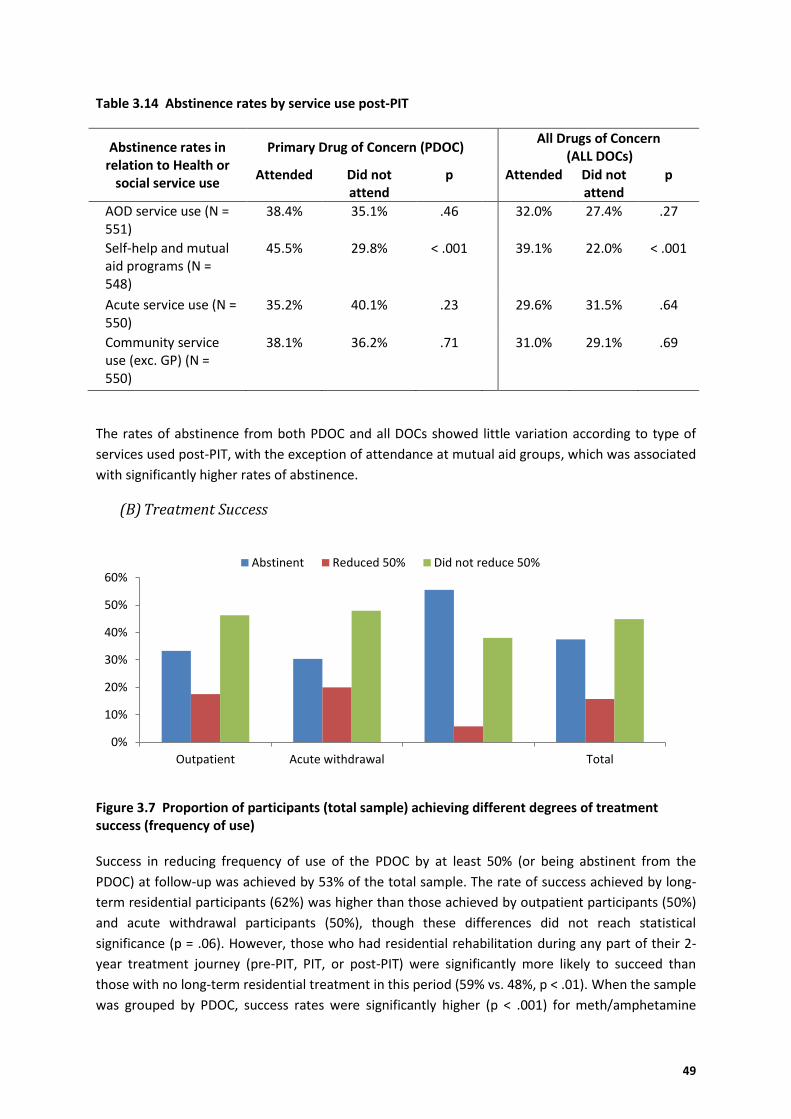
49
Table 3.14 Abstinence rates by service use post-PIT
Abstinence rates in relation to Health or
social service use
Primary Drug of Concern (PDOC) All Drugs of Concern
(ALL DOCs)
Attended Did not attend
p Attended Did not attend
p
AOD service use (N = 551)
38.4% 35.1% .46 32.0% 27.4% .27
Self-help and mutual aid programs (N = 548)
45.5% 29.8% < .001 39.1% 22.0% < .001
Acute service use (N = 550)
35.2% 40.1% .23 29.6% 31.5% .64
Community service use (exc. GP) (N = 550)
38.1% 36.2% .71 31.0% 29.1% .69
The rates of abstinence from both PDOC and all DOCs showed little variation according to type of
services used post-PIT, with the exception of attendance at mutual aid groups, which was associated
with significantly higher rates of abstinence.
(B) Treatment Success
Figure 3.7 Proportion of participants (total sample) achieving different degrees of treatment success (frequency of use) Success in reducing frequency of use of the PDOC by at least 50% (or being abstinent from the
PDOC) at follow-up was achieved by 53% of the total sample. The rate of success achieved by long-
term residential participants (62%) was higher than those achieved by outpatient participants (50%)
and acute withdrawal participants (50%), though these differences did not reach statistical
significance (p = .06). However, those who had residential rehabilitation during any part of their 2-
year treatment journey (pre-PIT, PIT, or post-PIT) were significantly more likely to succeed than
those with no long-term residential treatment in this period (59% vs. 48%, p < .01). When the sample
was grouped by PDOC, success rates were significantly higher (p < .001) for meth/amphetamine
0%
10%
20%
30%
40%
50%
60%
Outpatient Acute withdrawal Total
Abstinent Reduced 50% Did not reduce 50%
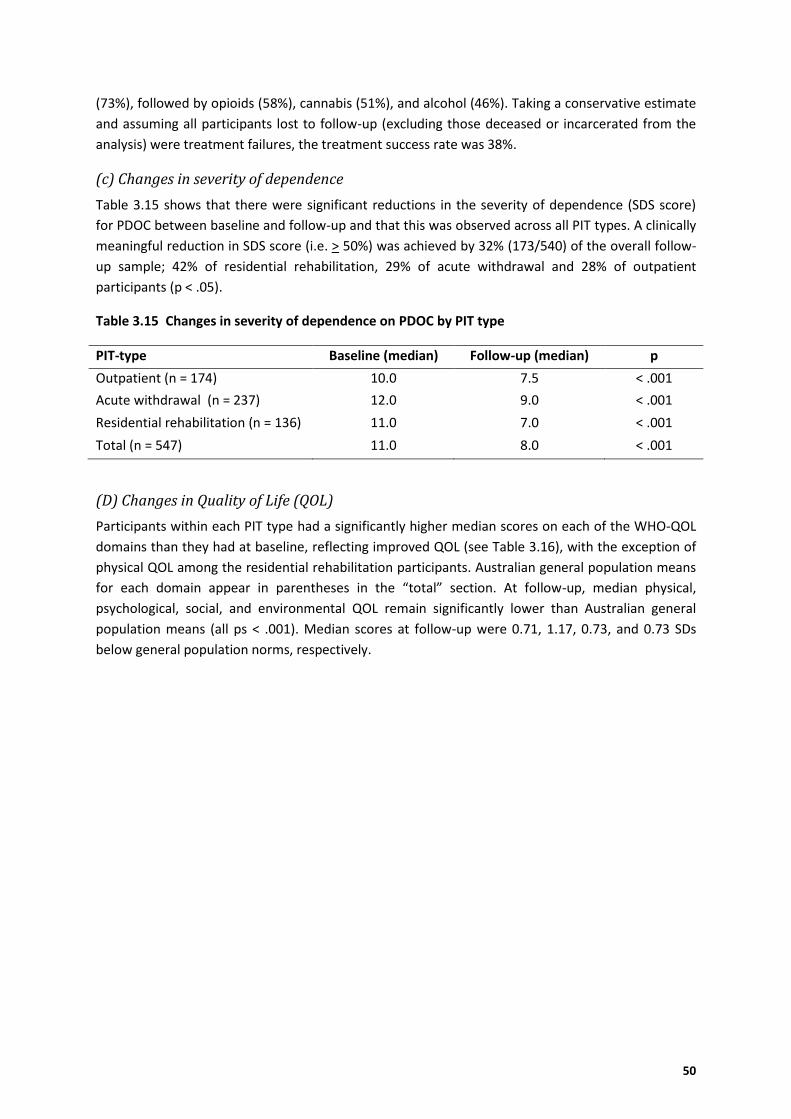
50
(73%), followed by opioids (58%), cannabis (51%), and alcohol (46%). Taking a conservative estimate
and assuming all participants lost to follow-up (excluding those deceased or incarcerated from the
analysis) were treatment failures, the treatment success rate was 38%.
(c) Changes in severity of dependence
Table 3.15 shows that there were significant reductions in the severity of dependence (SDS score)
for PDOC between baseline and follow-up and that this was observed across all PIT types. A clinically
meaningful reduction in SDS score (i.e. > 50%) was achieved by 32% (173/540) of the overall follow-
up sample; 42% of residential rehabilitation, 29% of acute withdrawal and 28% of outpatient
participants (p < .05).
Table 3.15 Changes in severity of dependence on PDOC by PIT type
PIT-type Baseline (median) Follow-up (median) p
Outpatient (n = 174) 10.0 7.5 < .001
Acute withdrawal (n = 237) 12.0 9.0 < .001
Residential rehabilitation (n = 136) 11.0 7.0 < .001
Total (n = 547) 11.0 8.0 < .001
(D) Changes in Quality of Life (QOL)
Participants within each PIT type had a significantly higher median scores on each of the WHO-QOL
domains than they had at baseline, reflecting improved QOL (see Table 3.16), with the exception of
physical QOL among the residential rehabilitation participants. Australian general population means
for each domain appear in parentheses in the “total” section. At follow-up, median physical,
psychological, social, and environmental QOL remain significantly lower than Australian general
population means (all ps < .001). Median scores at follow-up were 0.71, 1.17, 0.73, and 0.73 SDs
below general population norms, respectively.
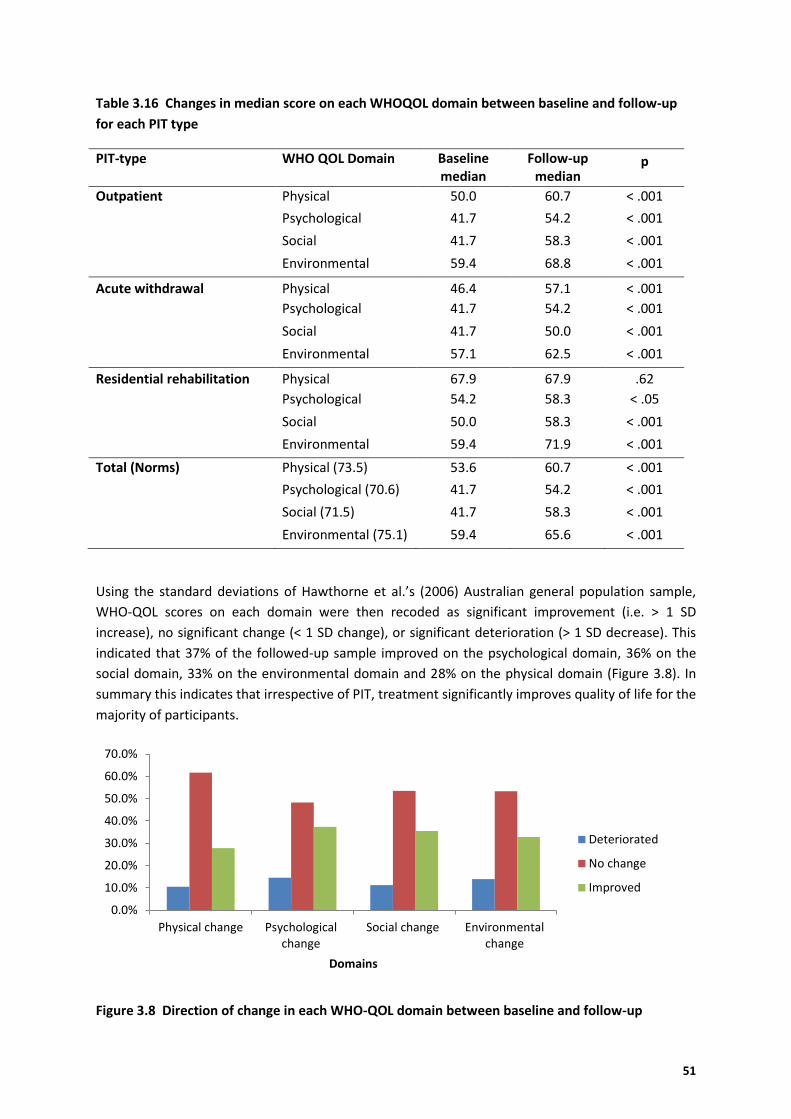
51
Table 3.16 Changes in median score on each WHOQOL domain between baseline and follow-up
for each PIT type
PIT-type WHO QOL Domain Baseline median
Follow-up median
p
Outpatient Physical 50.0 60.7 < .001
Psychological 41.7 54.2 < .001
Social 41.7 58.3 < .001
Environmental 59.4 68.8 < .001
Acute withdrawal Physical 46.4 57.1 < .001
Psychological 41.7 54.2 < .001
Social 41.7 50.0 < .001
Environmental 57.1 62.5 < .001
Residential rehabilitation Physical 67.9 67.9 .62
Psychological 54.2 58.3 < .05
Social 50.0 58.3 < .001
Environmental 59.4 71.9 < .001
Total (Norms) Physical (73.5) 53.6 60.7 < .001
Psychological (70.6) 41.7 54.2 < .001
Social (71.5) 41.7 58.3 < .001
Environmental (75.1) 59.4 65.6 < .001
Using the standard deviations of Hawthorne et al.’s (2006) Australian general population sample,
WHO-QOL scores on each domain were then recoded as significant improvement (i.e. > 1 SD
increase), no significant change (< 1 SD change), or significant deterioration (> 1 SD decrease). This
indicated that 37% of the followed-up sample improved on the psychological domain, 36% on the
social domain, 33% on the environmental domain and 28% on the physical domain (Figure 3.8). In
summary this indicates that irrespective of PIT, treatment significantly improves quality of life for the
majority of participants.
Figure 3.8 Direction of change in each WHO-QOL domain between baseline and follow-up
0.0%
10.0%
20.0%
30.0%
40.0%
50.0%
60.0%
70.0%
Physical change Psychologicalchange
Social change Environmentalchange
Domains
Deteriorated
No change
Improved
52
(E)Defining unmet needs
It was hypothesised that participants with more extensive AOD specialist treatment and greater
engagement with community service would achieve better outcomes. However not all participants
would need to engage with all of the various community services examined. It was expected that
participants who were homeless or unemployed at baseline would achieve better outcomes if they
engaged with employment/housing agencies during the one-year period, and that those who did not
engage with these services would have had an on-going ‘unmet need’. As there was no measure of
mental health morbidity at baseline, the psychological domain score on the WHO-QOL was used as a
proxy measure of psychological ill-health (> 1.5 SD below Australian norms), with an expectation
that those participants would have done better had they engaged with mental health services and
that there would be an unmet need in relation to mental health if they had not. In total, 25% of the
sample was identified as having an unmet need for employment services, (38% among long-term
residential participants, 21% among outpatient participants, and 22% among acute withdrawal
participants; p < .001). Unmet housing service needs were identified in 14% of the sample (15%
among long-term residential participants, 12% among outpatient participants, and 15% among acute
withdrawal participants; p = .64). Unmet mental health service needs were identified in 34% of the
sample (28% among long-term residential participants, 35% among outpatient participants, and 38%
among acute withdrawal participants; p = .13).
3.3.6 Predictors of treatment success
Demographic Predictors Demographic and PDOC predictors (transformed age, gender, born in Australia, in marriage or de
facto relationship at baseline, PDOC, SDS score for PDOC > 7) of treatment success (abstinence from
PDOC or > 50% reduction in frequency of use of PDOC relative to baseline rate of use) were first
analysed with binary logistic regression. Being foreign-born was significantly associated with higher
likelihood of treatment success (OR = 1.88, CI = 1.19-2.99), as was PDOC (p < .001). Compared with
participants for whom alcohol was the PDOC, participants with opioids (OR = 1.74, CI = 1.03-2.93) or
meth/amphetamine (OR = 3.53, CI = 2.00-6.22) as the PDOC had increased likelihood of success.
PDOC and being born in Australia were therefore included as predictors in the following analyses.
(Appendix 2.4)
Baseline Predictors (complexity, PIT and PDOC) The subsequent model examined treatment success with PIT type, PIT completion, unmet need in
terms of employment, housing and mental health (meaning problem present at baseline but did not
engage with the relevant service post-PIT), any post-PIT AOD service use (including
pharmacotherapy), any ‘other’ community service use (i.e. excluding housing, mental health and
employment agencies), any mutual aid attendance, interval between baseline and follow-up (in
days), and transformed PIT duration.
Having opioids (OR = 1.92, CI = 1.08-3.42), or meth/amphetamine (OR = 4.05, CI = 2.21-7.42) relative
to alcohol as the PDOC, PIT-completion (OR = 2.01, CI = 1.27-3.18), and mutual aid attendance in the
12 months prior to follow-up (OR = 1.80, CI = 1.19-2.72) were significant predictors. Being foreign-
born also predicted a higher likelihood of success (OR = 1.93, CI = 1.18-3.16), while a longer interval
between baseline and follow-up was associated with reduced likelihood of success (OR = 0.997, CI =
0.994-0.9998). Surprisingly, after controlling for the effects of other variables, increased PIT duration
53
predicted reduced likelihood of success (OR = 0.25, CI = 0.07-0.86). Unmet needs, attending AOD
services post-PIT, and community service engagement did not predict treatment success. However,
the positive effect for mutual aid attendance is likely to reflect the high rates of (often mandatory)
mutual aid attendance in the long-term residential group, since mutual aid was not a significant
predictor when analyses were restricted to the other 2 PIT types (Appendix 2.4).
3.3.7 Predictors of abstinence from PDOC
Demographic Predictors Demographic and PDOC predictors (transformed age, gender, born in Australia, in marriage or de
facto relationship at baseline, PDOC, SDS score for PDOC > 7) of abstinence from the PDOC were first
analysed with binary logistic regression. PDOC was the only significant predictor of abstinence (p <
.001). Participants who reported opioids (OR = 2.38, CI = 1.41-4.00) or meth/amphetamine (OR =
4.42, CI = 2.57-7.61) as their PDOC were more likely to be abstinent than those who reported alcohol
as their PDOC. PDOC was therefore included in the following regression model
Predictors (need and overall service engagement) The model examined abstinence from the PDOC as the outcome with PIT type, PIT completion,
unmet need in terms of employment, housing and mental health, any post-PIT AOD service use, any
community service use (other than housing, mental health and employment agencies), any mutual
aid attendance, interval between baseline and follow-up (in days), PDOC, and transformed PIT
duration. PDOC was again a significant predictor (p < .001) and opioids (OR = 2.18, CI = 1.21-3.93)
and meth/amphetamine (OR = 3.88, CI = 2.18-6.91) were again associated with higher rates of
abstinence than alcohol. PIT type was also a significant predictor (p < .001), with long-term
residential treatment associated with significantly higher (OR = 2.06, CI = 1.16-3.66), and acute
withdrawal with non-significantly lower (OR = 0.58, CI = 0.28-1.23) rates of abstinence than
outpatient treatment. PIT completion (OR = 2.73, CI = 1.66-4.50), engagement in mutual aid in the
12 months prior to follow-up (OR = 1.67, CI = 1.09-2.57), and use of community services (OR = 1.56,
CI = 1.04-2.34) also significantly predicted higher rates of abstinence. Surprisingly, having an unmet
need for employment services also predicted increased likelihood of abstinence (OR = 1.67, CI =
1.07-2.62), though given the lack of temporal resolution to determine exactly when participants
experienced unemployment and accessed employment services, this is difficult to interpret. As with
treatment success, the effect of mutual aid appears to be largely driven by the high attendance rates
in the long-term residential group. However, further univariate logistic regression analysis indicated
that, among those with any mutual aid attendance, a 10-fold increase in number of mutual aid
meetings attended more than doubled the likelihood of achieving abstinence from their PDOC (OR =
2.34, CI = 1.58-3.49).
A consistent finding from the regression models is that participants with alcohol as their primary
drug of concern are less likely to achieve reduction of use or abstinence than those with other
PDOCs (particularly opioids and meth/amphetamine). Since PDOC was a significant predictor, the
regression analyses predicting abstinence from PDOC were re-run separately for those with alcohol
as their PDOC and those with other drugs (other than tobacco) as their PDOC. For participants with
alcohol as their PDOC, having residential rehabilitation as the PIT (OR = 2.79, CI = 1.07-7.27),
attending ‘other’ community services (OR = 2.11, CI = 1.14-3.88), and attending mutual aid (OR =
1.99, CI = 1.03-3.85) were predictors of increased likelihood of abstinence from PDOC, while having
54
an unmet housing service need (OR = 0.23, CI = 0.06-0.86) predicted decreased likelihood of
abstinence.
When the PDOC was any substance other than alcohol or tobacco, completing the PIT (OR = 3.40, CI
= 1.74-6.64) predicted significantly higher likelihood of abstinence at follow-up. There was a
significant overall effect of PIT type which appears to be due to the combined effect of non-
significant trends for those with acute withdrawal as their PIT to be less (OR = 0.40, CI = 0.15-1.07),
and those with long-term residential treatment as their PIT to be more likely (OR = 2.10, CI = 0.97-
4.52) to achieve abstinence than outpatient participants. The overall effect of PDOC did not reach
significance (p = .06), though it appeared that those with meth/amphetamine as their PDOC were
more likely to achieve abstinence than those with cannabis as their PDOC (OR = 2.60, CI = 1.23-5.50).
Longer follow-up intervals (OR = 0.995, CI = 0.991-0.999) and, surprisingly, longer PIT duration (OR =
0.16, CI = 0.03-0.81) were associated with lower rates of abstinence from the PDOC.
3.3.8 Characteristics of participants who attended Mutual Aid Groups
The proportion of participants who attended mutual aid meetings increased from around one third
of the sample in the year prior to baseline to almost half in the year prior to follow-up, although
some of these may have done so as part of their rehabilitation or aftercare programs. Mutual aid
attendance was broken down into the different types of meetings attended. Alcoholics Anonymous
was attended by 33% of the follow-up sample, Narcotics Anonymous by 33%, SMART Recovery by
5% and 'other' recovery groups by 5%. Among participants who attended any meetings in the 12
months prior to follow-up (n = 267), number of meetings attended ranged from 1-500 (median = 20,
IQR = 6-65). A logistic regression analysis was performed to identify characteristics of participants
who attend Mutual Aid Groups in the year prior to follow-up, with the following entered as
predictors; transformed age, gender, PIT-type, SDS score at baseline > 7, PDOC, any mutual aid
group attendance at baseline, total perceived social support (median split), and total number of
complexities (homelessness, unemployment, poor psychological quality of life, poor physical quality
of life, and current involvement in the criminal justice system; range 0-5; this variable met criteria to
be considered normally distributed and was therefore included in logistic regression models without
transformation).
Those attending Mutual Aid groups at baseline were more than four times as likely to attend post-
PIT (OR = 4.60, CI = 2.99-7.05). Participants with acute withdrawal as their PIT were more than twice
as likely to attend as outpatient participants (OR = 2.75, CI = 1.71-4.41), and residential rehabilitation
participants were nearly five times as likely to attend compared to outpatient participants (OR =
4.95, CI = 2.85-8.60). The only other significant predictor was severe dependence, as indexed by an
SDS score > 7: participants with severe dependence were more likely than those with a lower level of
dependence to attend (OR = 2.15, CI = 1.14-4.03) (Appendix 2.4).
3.3.9 Predictors of acute service use
Demographic Predictors We examined whether demographic or PDOC variables (transformed age, sex, whether or not in
stable marital/de facto relationship, born in Australia, PDOC, SDS score for PDOC > 7) predicted
55
follow-up acute health service use (ambulance, emergency department, and/or hospital inpatient
admission) after controlling for whether or not participants had used acute health services in the 12
months prior to baseline. Baseline acute health service use significantly increased likelihood of
follow-up acute health service use (OR = 2.75, CI = 1.91-3.94). While the overall effect of PDOC was
non-significant (p = .15), pair-wise comparisons between specific PDOC groupings involving the
reference group (alcohol) suggested that participants with opioids as their PDOC were less likely to
use these services (OR = 0.56, CI = 0.34-0.95). PDOC was therefore selected for inclusion in the
subsequent model (Appendix 2.4).
Baseline Predictors (complexity, PIT and PDOC) The subsequent model examined likelihood of follow-up acute service use with PIT type, PIT
completion (completed or still engaged vs. prematurely ended), the presence of housing, criminal
justice, and employment issues (at baseline), poor physical and poor psychological QOL score (at
baseline), interval between baseline and follow-up (in days), PDOC, and baseline acute health service
use as a control variable. Having cannabis as a PDOC relative to alcohol (OR = 0.53, CI = 0.31-0.91), or
opioids relative to alcohol (OR = 0.45, CI = 0.26-0.76), acute service use at baseline (OR = 2.86, CI =
1.97-4.16) and having poor physical QOL (OR = 1.57, CI = 1.02-2.41), and follow-up interval (OR =
1.004, CI = 1.001-1.007) at baseline were the only significant predictors of follow-up acute service
use. When the model was re-run with alcohol vs. other drugs as PDOC, participants with alcohol as
their PDOC were almost twice as likely (OR = 1.85, CI = 1.27-2.69) to have used acute services post-
PIT than those with other drugs as their PDOC, after controlling for other variables in the model
(Appendix 2.4).
3.3.10 Continuity in AOD specialist treatment
Participants were recoded as having had continuity in AOD treatment or not, specific to their PIT. For
participants whose PIT was acute withdrawal, 1 “treatment continuity” point was awarded for
having outpatient counselling pre-PIT, and one further point awarded for either residential
rehabilitation or counselling post-PIT. For outpatients, 1 point was awarded for any pre-PIT AoD
service attendance and 1 point for any post-PIT AoD service (pharmacotherapy was not counted for
this purpose). For participants whose PIT was long-term residential treatment, 1 point was awarded
for counselling or acute withdrawal pre-PIT and 1 point for counselling post-PIT. Continuity scores
were therefore 0 (PIT-only), 1 (PIT + relevant treatment before or after) and 2 (PIT + relevant
treatment both before and after). A chi-square test found no significant association between this
continuity score and treatment success (abstinent from PDOC or at least 50% reduction in days used
PDOC; p = .52), PDOC abstinence (p = .17), or abstinence from all DOCs (p = .17). When attendance
at mutual aid was added to the pathway (i.e. earning an extra one point in the AOD continuity
score), PDOC success and abstinence again did not differ by score (ps = .82 and .07, respectively), but
abstinence rates from all DOCs were significantly higher for those with more extended AOD
treatment pathways (18%, 29%, 31%, and 37%, respectively, for those scoring 0, 1, 2, and 3, p < .05).
3.3.11 Optimal care pathways as predictor of outcome
Participants were assigned an optimal care pathway score based on the following; having had
relevant pre-PIT AOD specialist treatment (1 point), completing their PIT (1 point), having had
relevant post-PIT AOD specialist treatment (1 point), engaging in other community services (except
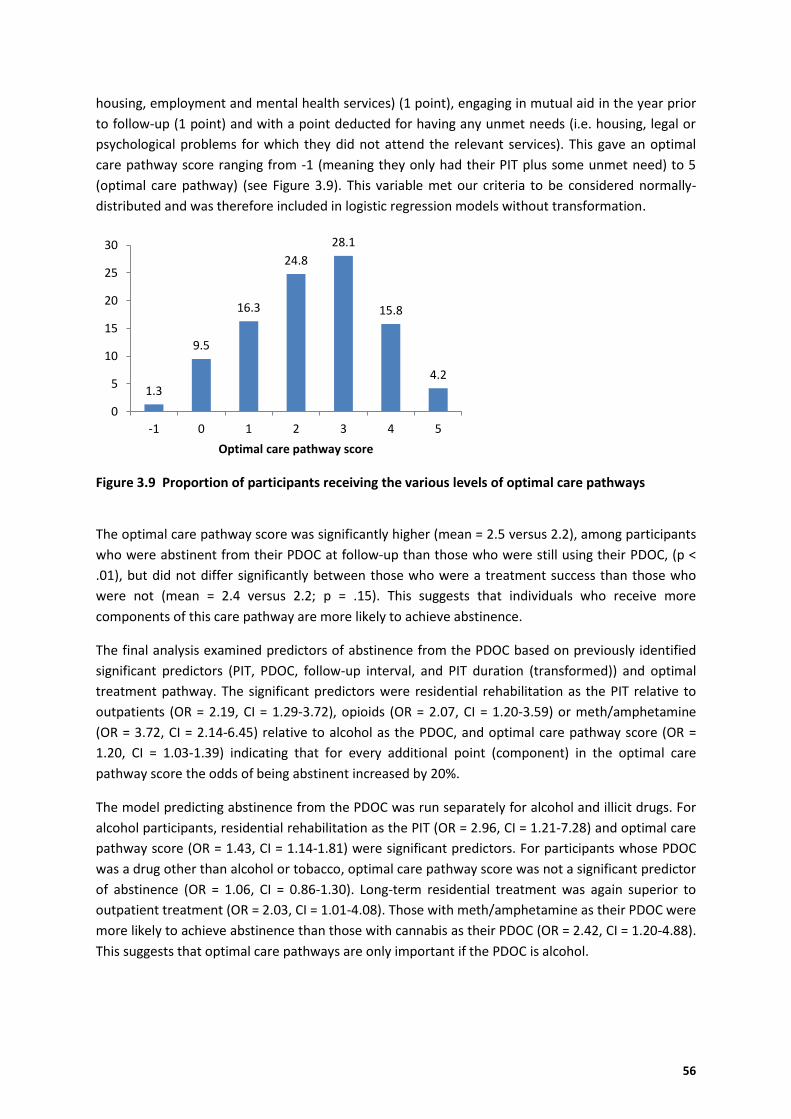
56
housing, employment and mental health services) (1 point), engaging in mutual aid in the year prior
to follow-up (1 point) and with a point deducted for having any unmet needs (i.e. housing, legal or
psychological problems for which they did not attend the relevant services). This gave an optimal
care pathway score ranging from -1 (meaning they only had their PIT plus some unmet need) to 5
(optimal care pathway) (see Figure 3.9). This variable met our criteria to be considered normally-
distributed and was therefore included in logistic regression models without transformation.
Figure 3.9 Proportion of participants receiving the various levels of optimal care pathways
The optimal care pathway score was significantly higher (mean = 2.5 versus 2.2), among participants
who were abstinent from their PDOC at follow-up than those who were still using their PDOC, (p <
.01), but did not differ significantly between those who were a treatment success than those who
were not (mean = 2.4 versus 2.2; p = .15). This suggests that individuals who receive more
components of this care pathway are more likely to achieve abstinence.
The final analysis examined predictors of abstinence from the PDOC based on previously identified
significant predictors (PIT, PDOC, follow-up interval, and PIT duration (transformed)) and optimal
treatment pathway. The significant predictors were residential rehabilitation as the PIT relative to
outpatients (OR = 2.19, CI = 1.29-3.72), opioids (OR = 2.07, CI = 1.20-3.59) or meth/amphetamine
(OR = 3.72, CI = 2.14-6.45) relative to alcohol as the PDOC, and optimal care pathway score (OR =
1.20, CI = 1.03-1.39) indicating that for every additional point (component) in the optimal care
pathway score the odds of being abstinent increased by 20%.
The model predicting abstinence from the PDOC was run separately for alcohol and illicit drugs. For
alcohol participants, residential rehabilitation as the PIT (OR = 2.96, CI = 1.21-7.28) and optimal care
pathway score (OR = 1.43, CI = 1.14-1.81) were significant predictors. For participants whose PDOC
was a drug other than alcohol or tobacco, optimal care pathway score was not a significant predictor
of abstinence (OR = 1.06, CI = 0.86-1.30). Long-term residential treatment was again superior to
outpatient treatment (OR = 2.03, CI = 1.01-4.08). Those with meth/amphetamine as their PDOC were
more likely to achieve abstinence than those with cannabis as their PDOC (OR = 2.42, CI = 1.20-4.88).
This suggests that optimal care pathways are only important if the PDOC is alcohol.
1.3
9.5
16.3
24.8
28.1
15.8
4.2
0
5
10
15
20
25
30
-1 0 1 2 3 4 5
Optimal care pathway score
57
3.3.12 Predictors of outcomes among participants with complex needs
The following analyses explored whether engaging in the appropriate service (housing, mental
health or employment) for those with an identified need at baseline impacted on outcome
(abstinence from PDOC). The first step involved identifying demographic and PDOC characteristics
(transformed age, gender, marital status, born in Australia, PDOC, and SDS > 7) that predicted PDOC
abstinence at follow-up. In the case of those with recent homelessness (n = 125) at baseline, both
PDOC and SDS category were significant predictors, while for those with employment difficulties (n =
296) or with poor psychological QOL (n = 308) at baseline, only PDOC was a significant predictor.
PDOC (and SDS for those with recent homelessness) were therefore added to a second regression
model predicting PDOC abstinence at follow-up, which included engagement in the relevant service
use (e.g. housing service use post-PIT when analyses were run on those with recent homelessness at
baseline), optimal AOD treatment pathway (0, 1, or 2), any other community service use, any mutual
aid attendance, PIT completed, PIT-type, follow-up interval, and PIT duration (transformed).
For participants with recent homelessness at baseline, having cannabis (OR = 6.55, CI = 1.33-32.16)
or meth/amphetamine (OR = 12.29, CI = 2.85-52.94) compared to alcohol as the PDOC were
significant predictors of PDOC abstinence, along with having an SDS score > 7 (OR = 6.61, CI = 1.10-
39.63). There was an overall significant effect of AOD treatment pathway (p < .05), though this is
difficult to interpret because neither scoring 1 point (OR = 1.41, CI = 0.26-7.59), not scoring 2 points
(OR = 0.28, CI = 0.04-1.76) predicted an outcome significantly different to scoring 0 points. Engaging
with a housing service between baseline and follow-up was not a significant predictor of abstinence.
For participants with poor psychological QOL at baseline, having cannabis (OR = 2.78, CI = 1.24-6.26),
meth/amphetamine (OR = 5.13, CI = 2.19-11.97) or opioids (OR = 3.18, CI = 1.53-6.60) as a PDOC
compared to alcohol were significant predictors of PDOC abstinence, as were PIT completed (OR =
2.11, CI = 1.07-4.16) and mutual aid attendance (OR = 1.97, CI = 1.07-3.62). Engaging a mental health
service in the year after their PIT was not a predictor of abstinence, though engagement in these
services is likely to be associated with greater morbidity, which in turn is likely to be associated with
poorer outcomes, thus confounding our ability to detect any positive effect of engagement.
Finally, for participants with employment problems at baseline, having meth/amphetamine (OR =
8.60, CI = 3.76-19.63) or cannabis (OR = 2.51, CI = 1.06-5.95) as a PDOC compared to alcohol, having
residential rehabilitation as their PIT (OR = 3.28, CI = 1.43-7.50), PIT-completed (OR = 2.83, CI = 1.39-
5.74) and mutual aid attendance (OR = 1.94, CI = 1.005-3.73) were significant predictors of PDOC
abstinence. Engaging with an employment service significantly predicted reduced likelihood of
abstinence from the PDOC (OR = 0.44, CI = 0.24-0.78). There was an overall effect of AoD pathway
score (p < .01) but this was difficult to interpret as neither having 1 point (OR = 1.70, CI = 0.65-4.41)
nor having 2 points (OR = 0.57, CI = 0.21-1.51) significantly predicted a different outcome from those
with 0 points.
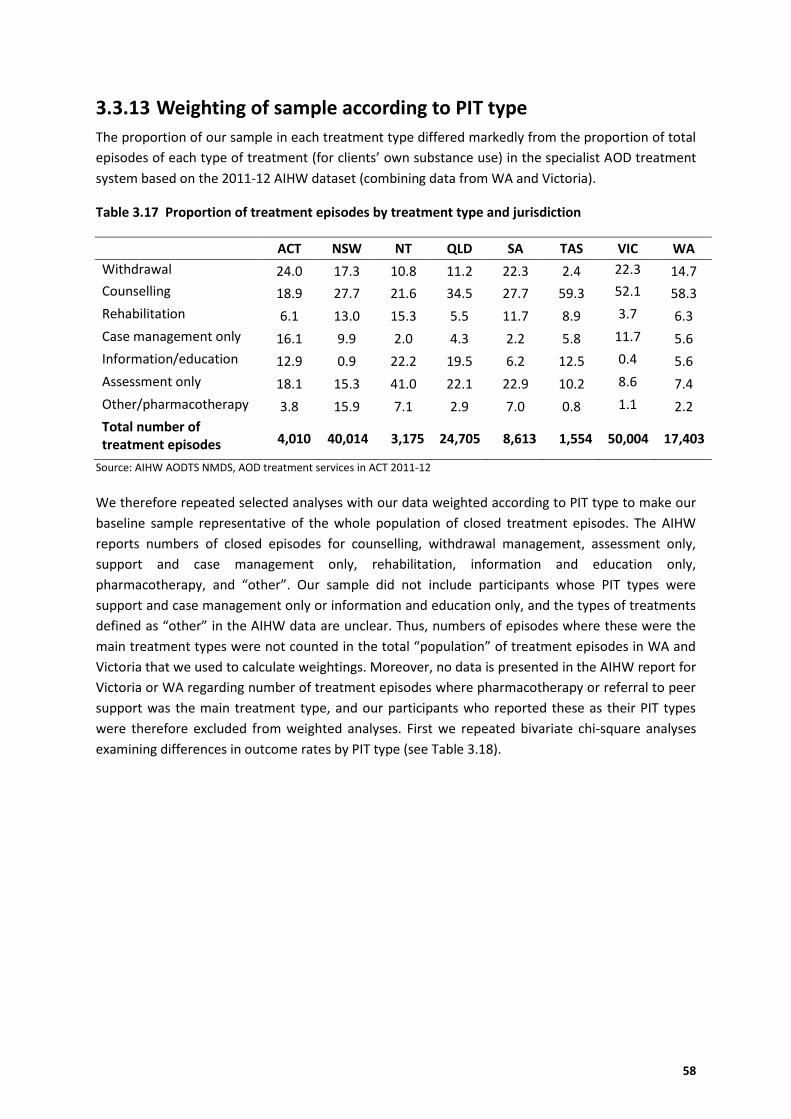
58
3.3.13 Weighting of sample according to PIT type
The proportion of our sample in each treatment type differed markedly from the proportion of total
episodes of each type of treatment (for clients’ own substance use) in the specialist AOD treatment
system based on the 2011-12 AIHW dataset (combining data from WA and Victoria).
Table 3.17 Proportion of treatment episodes by treatment type and jurisdiction
ACT NSW NT QLD SA TAS VIC WA
Withdrawal 24.0 17.3 10.8 11.2 22.3 2.4 22.3 14.7
Counselling 18.9 27.7 21.6 34.5 27.7 59.3 52.1 58.3
Rehabilitation 6.1 13.0 15.3 5.5 11.7 8.9 3.7 6.3
Case management only 16.1 9.9 2.0 4.3 2.2 5.8 11.7 5.6
Information/education 12.9 0.9 22.2 19.5 6.2 12.5 0.4 5.6
Assessment only 18.1 15.3 41.0 22.1 22.9 10.2 8.6 7.4
Other/pharmacotherapy 3.8 15.9 7.1 2.9 7.0 0.8 1.1 2.2
Total number of treatment episodes 4,010 40,014 3,175 24,705 8,613 1,554 50,004 17,403
Source: AIHW AODTS NMDS, AOD treatment services in ACT 2011-12
We therefore repeated selected analyses with our data weighted according to PIT type to make our
baseline sample representative of the whole population of closed treatment episodes. The AIHW
reports numbers of closed episodes for counselling, withdrawal management, assessment only,
support and case management only, rehabilitation, information and education only,
pharmacotherapy, and “other”. Our sample did not include participants whose PIT types were
support and case management only or information and education only, and the types of treatments
defined as “other” in the AIHW data are unclear. Thus, numbers of episodes where these were the
main treatment types were not counted in the total “population” of treatment episodes in WA and
Victoria that we used to calculate weightings. Moreover, no data is presented in the AIHW report for
Victoria or WA regarding number of treatment episodes where pharmacotherapy or referral to peer
support was the main treatment type, and our participants who reported these as their PIT types
were therefore excluded from weighted analyses. First we repeated bivariate chi-square analyses
examining differences in outcome rates by PIT type (see Table 3.18).
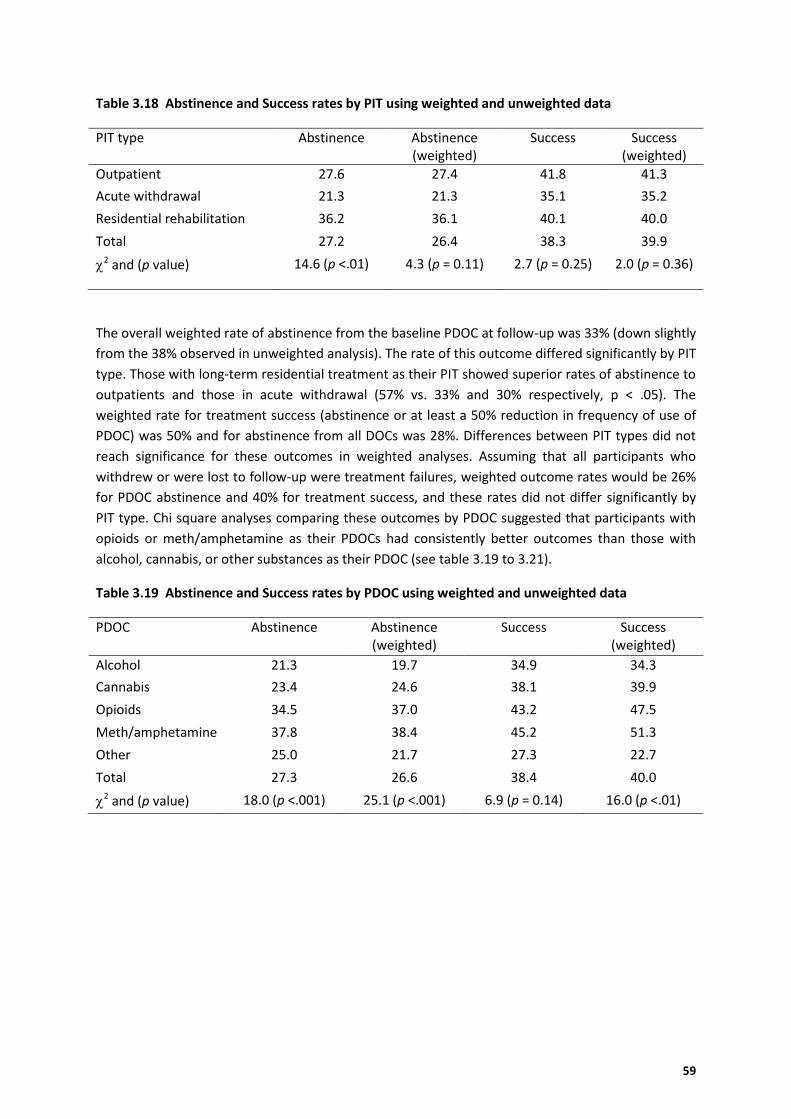
59
Table 3.18 Abstinence and Success rates by PIT using weighted and unweighted data
PIT type Abstinence Abstinence (weighted)
Success Success (weighted)
Outpatient 27.6 27.4 41.8 41.3
Acute withdrawal 21.3 21.3 35.1 35.2
Residential rehabilitation 36.2 36.1 40.1 40.0
Total 27.2 26.4 38.3 39.9
2 and (p value) 14.6 (p <.01) 4.3 (p = 0.11) 2.7 (p = 0.25) 2.0 (p = 0.36)
The overall weighted rate of abstinence from the baseline PDOC at follow-up was 33% (down slightly
from the 38% observed in unweighted analysis). The rate of this outcome differed significantly by PIT
type. Those with long-term residential treatment as their PIT showed superior rates of abstinence to
outpatients and those in acute withdrawal (57% vs. 33% and 30% respectively, p < .05). The
weighted rate for treatment success (abstinence or at least a 50% reduction in frequency of use of
PDOC) was 50% and for abstinence from all DOCs was 28%. Differences between PIT types did not
reach significance for these outcomes in weighted analyses. Assuming that all participants who
withdrew or were lost to follow-up were treatment failures, weighted outcome rates would be 26%
for PDOC abstinence and 40% for treatment success, and these rates did not differ significantly by
PIT type. Chi square analyses comparing these outcomes by PDOC suggested that participants with
opioids or meth/amphetamine as their PDOCs had consistently better outcomes than those with
alcohol, cannabis, or other substances as their PDOC (see table 3.19 to 3.21).
Table 3.19 Abstinence and Success rates by PDOC using weighted and unweighted data
PDOC Abstinence Abstinence (weighted)
Success Success (weighted)
Alcohol 21.3 19.7 34.9 34.3
Cannabis 23.4 24.6 38.1 39.9
Opioids 34.5 37.0 43.2 47.5
Meth/amphetamine 37.8 38.4 45.2 51.3
Other 25.0 21.7 27.3 22.7
Total 27.3 26.6 38.4 40.0
2 and (p value) 18.0 (p <.001) 25.1 (p <.001) 6.9 (p = 0.14) 16.0 (p <.01)
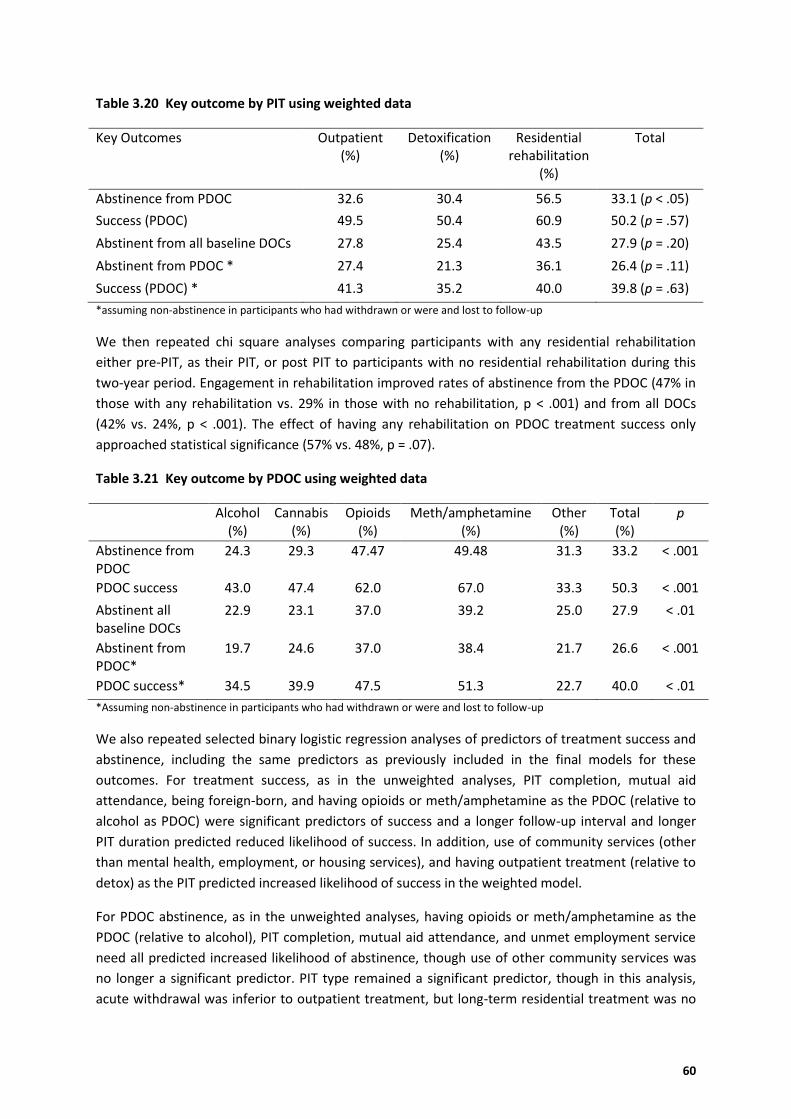
60
Table 3.20 Key outcome by PIT using weighted data
Key Outcomes Outpatient (%)
Detoxification (%)
Residential rehabilitation
(%)
Total
Abstinence from PDOC 32.6 30.4 56.5 33.1 (p < .05)
Success (PDOC) 49.5 50.4 60.9 50.2 (p = .57)
Abstinent from all baseline DOCs 27.8 25.4 43.5 27.9 (p = .20)
Abstinent from PDOC * 27.4 21.3 36.1 26.4 (p = .11)
Success (PDOC) * 41.3 35.2 40.0 39.8 (p = .63)
*assuming non-abstinence in participants who had withdrawn or were and lost to follow-up
We then repeated chi square analyses comparing participants with any residential rehabilitation
either pre-PIT, as their PIT, or post PIT to participants with no residential rehabilitation during this
two-year period. Engagement in rehabilitation improved rates of abstinence from the PDOC (47% in
those with any rehabilitation vs. 29% in those with no rehabilitation, p < .001) and from all DOCs
(42% vs. 24%, p < .001). The effect of having any rehabilitation on PDOC treatment success only
approached statistical significance (57% vs. 48%, p = .07).
Table 3.21 Key outcome by PDOC using weighted data
Alcohol (%)
Cannabis (%)
Opioids (%)
Meth/amphetamine (%)
Other (%)
Total (%)
p
Abstinence from PDOC
24.3 29.3 47.47 49.48 31.3 33.2 < .001
PDOC success 43.0 47.4 62.0 67.0 33.3 50.3 < .001
Abstinent all baseline DOCs
22.9 23.1 37.0 39.2 25.0 27.9 < .01
Abstinent from PDOC*
19.7 24.6 37.0 38.4 21.7 26.6 < .001
PDOC success* 34.5 39.9 47.5 51.3 22.7 40.0 < .01
*Assuming non-abstinence in participants who had withdrawn or were and lost to follow-up
We also repeated selected binary logistic regression analyses of predictors of treatment success and
abstinence, including the same predictors as previously included in the final models for these
outcomes. For treatment success, as in the unweighted analyses, PIT completion, mutual aid
attendance, being foreign-born, and having opioids or meth/amphetamine as the PDOC (relative to
alcohol as PDOC) were significant predictors of success and a longer follow-up interval and longer
PIT duration predicted reduced likelihood of success. In addition, use of community services (other
than mental health, employment, or housing services), and having outpatient treatment (relative to
detox) as the PIT predicted increased likelihood of success in the weighted model.
For PDOC abstinence, as in the unweighted analyses, having opioids or meth/amphetamine as the
PDOC (relative to alcohol), PIT completion, mutual aid attendance, and unmet employment service
need all predicted increased likelihood of abstinence, though use of other community services was
no longer a significant predictor. PIT type remained a significant predictor, though in this analysis,
acute withdrawal was inferior to outpatient treatment, but long-term residential treatment was no
61
longer superior to outpatient treatment. Re-analysis with long-term residential treatment as the
reference PIT did, however, show that long-term residential treatment as PIT was superior to acute
withdrawal as PIT. When the optimal care pathway score was entered as a predictor, rather than
individual components of the pathway, this pathway score and having opioids or
meth/amphetamine as the PDOC (relative to alcohol) were the only significant predictors of
abstinence.
Repeating the above weighted analyses only for participants with alcohol as their PDOC showed that
mutual aid attendance and “other” community service use predicted both treatment success and
PDOC abstinence. For PDOC abstinence, PIT completion and (in contrast to previous findings) a
longer follow-up interval were also positive predictors. When the overall pathway score was
entered, rather than its individual components, this pathway score and follow-up interval were
significant predictors of abstinence.
Repeating the weighted analyses only including participants with drugs other than alcohol or
tobacco as their PDOC showed that PIT completion, being foreign-born, and having opioids or
meth/amphetamine (relative to cannabis) as the PDOC were significant predictors of treatment
success. Longer follow-up interval, longer PIT duration, and further post-PIT AOD service use
predicted reduced likelihood of success. PDOC, PIT completion, follow-up interval, and PIT duration
were also significant predictors of PDOC abstinence (all effects in the same direction as for
prediction of treatment success). While the overall effect of PIT type was not a significant predictor
of PDOC abstinence, when long-term residential treatment was entered as the reference PIT, it
predicted significantly better likelihood of abstinence than having acute withdrawal as the PIT. When
the overall optimal care pathway score was entered as a predictor, rather than its individual
components, only PDOC, follow-up interval, and PIT duration were significant predictors, while the
optimal pathway score was not.
In summary, overall the weighted analyses generated few changes in terms of participant outcomes.
After weighting the data, abstinence and success rates were only slightly reduced relative to the
unweighted analyses and remained highest among with long-term residential rehabilitation PIT and
having attended this treatment at any point in the past two-years remained significantly associated
with higher abstinence rates. When examining predictors of success, using weighted data confirmed
PIT completion and mutual aid and meth/amphetamines and opioids relative to alcohol as the PDOC
as significant predictors, but residential rehabilitation was no longer superior to the other PIT types.
A further finding to note concerns the impact of engagement in community services on outcomes.
This was a significant predictor of abstinence in the unweighted (but not weighted) data, and a
significant predictor of success in the weighted (but not unweighted) data.
62
3.4 Qualitative findings This section summarises the qualitative findings about participants’ experience of AOD treatment
and contact with non-AOD services such as mental health, housing and homelessness services,
medical and social services.
The qualitative component provides an in-depth perspective of participants’ experience of
treatment, including pathways into and out of AOD treatment. In addition, this component sought to
explore participants’ experience of formal and informal supports (e.g., family, friends, self-help
groups) and service responses, the level of integration between the AOD and non-AOD systems, and
the perceived effectiveness of services and areas for improvement.
3.4.1 Methods
Sampling process
Qualitative interviews were conducted with 41 participants between February and April 2014. A
two-stage purposive sampling approach was used to identify potential participants from the sample
of 550 participants who had completed a baseline and follow-up interview and agreed to be re-
contacted for future research interviews. As the main purpose of the qualitative interviews was to
explore experiences of the AOD treatment system and non-AOD systems, the first stage of the
sampling approach was designed to ensure a diversity of experiences in terms of:
Perceived effectiveness of PIT
PDOC reported at baseline
PIT type (i.e., outpatient, acute withdrawal, residential rehabilitation)
Engagement with AOD treatment post PIT (high =3 or more contacts; medium use = 2
contacts; low = 1 or no contact)
Engagement with acute and/or community services post PIT (high = 5 or more; medium = 3
to 4; low = 2 or fewer)
Two members of the research team assessed participants’ eligibility based on the above variables
and identified 120 potential participants, 60 of whom were recruited from Western Australia and 60
from Victoria. The second stage of the sampling approach involved assigning each of the 120
potential participants a priority score based on the date of the follow-up interview. Interviews
completed most recently were marked as ‘high’ priority to increase the likelihood of successful
contact.
Data collection
A semi-structured interview schedule was used to explore six broad topics: experience of seeking
AOD treatment; experience of PIT; follow-up AOD care post-PIT; accessing non-AOD services;
experience of AOD and non-AOD services working together; experience of informal support (e.g.,
family, friends, self-help groups) as well as issues important to the participant’s unique experience.
The interviews were contacted by two interviewers. Participants were contacted via telephone,
63
reminded of their involvement in the follow-up interview, and offered the opportunity to engage in
an in-depth telephone interview at a mutually agreeable date and time.
Consent for the interview to be audio-recorded was sought from the participant as part of the
interview overview. All participants consented for the interview to be audio-recorded. Participants
were reimbursed $30 for their time.
Analysis
Audio-recordings were transcribed and NVivo10, a qualitative software package, was used to
organise the interview data into a set of codes with common experiences grouped under the same
code. Codes were grouped into provisional themes and sub-themes. Provisional themes were then
clustered into groups of themes, and those insufficiently grounded in the data were omitted. A more
focused analytical ordering of themes and was then undertaken. Finally, exemplars were identified
to illustrate the different themes and sub-themes relating to the treatment experience. Identifying
information such as town or suburb has been removed from the exemplars and the name of the
AOD agencies providing the PIT has been replaced with generic labels such as ‘AOD service A’.
Pseudonyms have been used in the three case studies.
Structure
Qualitative interview findings are presented in four broad sections (see Appendix 2.5 for interview
schedule):
Entry into PIT and the treatment experience
Continuity of care and service links
Barriers
Areas for improvement
3.5 Entry into PIT and the experience of treatment
AOD treatment prior to PIT
For the majority of participants, the PIT was not their first experience of AOD treatment, as they had
previously engaged in one or more forms of AOD treatment such as counselling, typically from a
specialist AOD service, inpatient withdrawal or residential rehabilitation. Furthermore, events
leading to participants’ initial and subsequent contacts with AOD services were occasionally
reported and reflected the ‘4 Ls model’ of harm, which often bring cases into treatment (i.e., liver,
lover, livelihood, and law; Roizen and Weisner, 1979).
Then I stopped seeing her and about two months later, which isn't - but yeah, had a bit of
psychotic episode and then got into trouble with the law and had a car accident. Yeah, lost
my relationship and the house, that wasn't good. I didn't realise how much it was keeping me
in check, just seeing someone (Interviewee 38).
Level of complexity
Co-morbidities were common among the participants, as the majority indicated they had previous
contact with a psychologist and/or psychiatrist. Reported mental health concerns ranged from
64
psychotic disorders, such as schizophrenia, to depression and mood disorders. Some therapeutic
relationships were long-standing, suggesting contact with mental health services pre-dated the PIT.
Contact with the prison system and/or housing services (to apply for stable housing) or
homelessness services also indicates that the participants have multiple needs. While less common,
some reported a recent history of domestic violence, and others indicated they had ongoing co-
morbid health issues. As illustrated in the exemplar below, multiple issues experienced by
participants are evident through their contact with a range of services and the cumulative impact of
issues fluctuated over time, as issues tended to be present before and after PIT.
I've got a family support worker, but they're more early intervention for the children. Now
I've got a - I go to a women's centre who has an intense support worker that works more
intensively with myself. Then the house that I'm staying in at the moment, it's a DV house
(i.e. domestic violence crisis accommodation service) so I've got a housing worker though
them. They monitor where I'm at on my housing list through the Government (Interviewee
26).
Referral to PIT
The referral pathway into the PIT was reflective of participants’ existing support networks (e.g.,
mental health service, GP, AOD service) and prior engagement with AOD treatment. Involvement of
a health worker, typically an AOD worker, was common and the support came in many forms, from
making the referral on behalf of the participant, and in some cases providing transportation to and
from the PIT, to exploring treatment options with the participant and providing ongoing support.
[Interviewer: So can you tell me the good things, if any, about your experience accessing the
inpatient withdrawal unit] It was very easy going. Yeah it was all done for me so I was really
lucky in that sort of sense. I'm not sure, if I was on my own it'd be a bit harder, but yeah it
was very straightforward and they all organised it for me. So all I had to do was turn up, so
that was really good, yeah (Interviewee 24).
My first experience was at [AOD service E]. I had talked through my - the full extent of my
problem with my GP, and she had given me the phone number of [AOD service E] and they
talked to me about detoxification...Yep. She [GP] said that she would support me whether I
wanted help with my drinking or not, and said this is a good first contact (Interviewee 19).
Prior treatment experience and knowledge of the referral processes enabled other participants to
self-refer to PIT. Furthermore, initiating contact with an AOD service and organising supporting
documentation, such as a referral letter from a GP, provided some participants with a sense of
ownership.
Well, what I did was I had to make the phone call [to the withdrawal unit] and then let the
counsellor I was seeing at the time [know]. I also had to get the referral from the doctor, oh
god there was quite a bit involved. But I managed - second time was a lot easier than the
first time, the second time I organised a lot more myself. Because I wanted to do it myself
and I was keen to do it the second time (Interviewee 27).
65
Information on awareness of treatment services was also sourced through family and friends and
the participants’ own research. Participants tended to be less familiar with the AOD system and had
fewer formal supports. Few reported that their referral to PIT was the result of a mandated court
order.
Entry and admission into PIT
For most participants, entry into PIT was straightforward, with completing forms and attending
assessment interviews considered a standard component of the admission process. Prior treatment
experience enabled them to navigate the AOD system and organise a package of care, such as
inpatient withdrawal followed by long-term residential treatment. For these participants, waiting
lists were a source of frustration, and often required them to frequently contact the service
regarding an admission date. For some participants, making regular contact with a service
demonstrated their level of commitment and/or level of need.
Just the waiting list basically, it was really, really ‘chockers’ when I tried to get there. It was
quite disheartening, you know.... Yeah, I think it was four or five months which is quite a long
time. ...I contact[ed them] at least once a fortnight. Towards the end I was ringing them
every day (Interviewee 16).
Entry and admission into PIT often involved referrals between services within the same agency (i.e.,
intra service referrals) or referrals between two or more AOD agencies (i.e., inter service referrals).
In many cases, intra-and-inter service referral processes were streamlined as assessment
information was passed from one service to the next. From the participant’s perspective this
reduced the need to repeat their story. Access to treatment was also facilitated by services providing
or organising transport to take the participant from one treatment site to the next.
Well, I found with [AOD service F] that program and then you go to the [AOD service G]. I
found that's a very good service, because what happens is you complete the six weeks and
what they do is they personally drive you down [AOD service F to AOD service G]...The
process is [made] a lot easier, because you don't have to go through all the paperwork and
it's all linked up (Interviewee 27).
Components of treatment received
As part of the interview, participants were asked to describe what happened during treatment and if
anything were missing from their treatment experience. This section is divided into two parts:
inpatient and residential treatment, followed by outpatient treatment.
66
Inpatient and residential treatment
For participants receiving acute withdrawal or residential rehabilitation, the treatment experience
reflected three main themes:
Supportive service environment
Skills and insights gained from psycho-educational group work
Learning from peers
Supportive service environment
‘Feeling safe’ was frequently mentioned by participants and this was typically attributed to the
quality of care provided by clinicians, particular the management of withdrawal symptoms. The non-
judgmental and respectful approach of staff also contributed to the treatment experience.
Just the safety aspect, knowing that I was around people who knew what was going on really
(Interviewee 18).
The communal living aspect of residential and inpatient treatment, such as sharing household
responsibilities and eating together was viewed as a positive part of the treatment experience by
many participants. For others, the structured nature of the residential program and the emphasis
placed on developing a healthy daily routine was beneficial.
[Interviewer: So if someone asked you to describe what happens in [residential rehabilitation]
what would you tell them?] It's quite life changing. They teach you basic boundaries and life
skills, like cooking and getting up early in the morning, even to hanging your towel up,
making your bed. Just things that when you're on drugs you kind of lose that from when you
were a child. Which I think is fantastic. Then comes the personal growth and it's very
protected in there, so it's quite innocent and real, if you know what I mean. [So they helped
you to get organised?]. Yeah, definitely. In the real world (Interviewee 20).
For some participants, a positive group dynamic within the inpatient unit or residential service was
associated with a supportive environment, which led to most participants engaging in various
activities.
Benefits from psycho-educational group work
According to participants, residential treatment was structured around psycho-educational group-
work (e.g., relapse prevention, mindfulness, behaviour management, reflective learning, goal
setting) as well as physical and creative activities. These activities were associated with personal
growth and increased awareness.
I'd say it was a lot of learning - you know, learning about drugs and what they do to you. Sort
of like why you take them. Sort of like learning about triggers and stuff like that and learning
about yourself. So I'd say it's a big learning thing (Interviewee 32).
A number of participants indicated that the communal living and range of activities undertaken
during inpatient or residential treatment may not align with everyone’s preferred way of learning or
67
personality but there was a sense that it is up to the individual to take what they can from the
experience. Furthermore, some found the intensity of the group session confronting as participants
disclosed personal challenges or difficulties.
There was a lot of group work and sometimes it became a bit ‘full-on’, but, overall, it was a
really good program. [Interviewer: A bit full on, okay]. The subjects - I don't know.
Emotionally intense, I suppose? Either for myself or for other people, watching what other
people had been through. Having to face up to issues and deal with things (Interviewee 38).
Individual counselling was considered a beneficial component of residential rehabilitation and few
participants mentioned that one-to-one counselling was available during inpatient withdrawal;
however this was not part of the regular program. Others mentioned that staff was generally
responsive to requests for a private discussion.
Learning from peers
The opportunity to learn about and engage with self-help groups such as AA and to a lesser degree,
other mutual aid programs was provided during inpatient withdrawal and residential rehabilitation.
According to most participants, attending group activities, including self-help meetings such as AA
was a compulsory part of residential rehabilitation; however it was also encouraged in inpatient
withdrawal units. Learning from peers in recovery was valuable for many participants in terms of
exploring new options of support and generating a sense of hope that recovery was achievable. In
contrast, a small number of participants found the concepts of AA confusing and did not benefit
from the sessions.
[Interviewer: In terms of the activities, though, was there any one in particular or a couple of
particular activities that were really good or...] Possibly the ones where the people came in
and shared their experiences [NA]. Yeah because when they came in and were talking about
their experiences it helped us feel like, well people have done it and you can see how far
they've come in life now and it gave us that, encouraged to want to be strong and know that
we can do it (Interviewee 28).
Sharing the treatment experience with others was a key benefit of the treatment for many
participants. For some, it helped normalise their addiction, and others drew strength from fellow
clients.
I think you cope better together, or I find that I do. Yeah you share experiences and that sort
of thing. If I was to go there alone I think I'd struggle a bit more because I was going on my
own (Interviewee 22).
Outpatient treatment: Having access to someone to talk to
‘Having someone to talk to’ was regarded as one of the main benefits of outpatient counselling.
Similar to inpatient services, learning techniques to modify behaviour (e.g., managing cravings),
mindfulness techniques, anger management and goal setting were common elements of the
treatment experience. While participants were generally satisfied with the treatment they received
and found the experience to be beneficial, some indicated that it was often difficult to apply the
68
techniques on an ongoing basis. This was also a factor for participants receiving inpatient or
residential treatment.
Just talking with my counsellor about my issues. It's something that - with heroin addiction, it's
the reason I use heroin, so I didn't have to think and talk about my problems and issues. I'd
buried my problems for so long it was just helpful to be able to talk to someone who was
wanting to listen to my problems, and able to give me steps and provide me with tools that I
can use to overcome my issues (Interviewee 3).
The following case study illustrates a successful AOD treatment experience including entry into
treatment
Case study 1: Successful AOD treatment experience
Alex was aged between 20 and 25 and lived in a regional city and had been using alcohol and cannabis for a
number of years. However recently his use had increased and he was experiencing significant relationship,
health and financial problems ‘I was starting to spiral out of control and I was hitting rock bottom’. Alex
realised he needed help and contacted a community health centre. Alex started to see an alcohol and drug
counsellor and together they discussed possible treatment options including residential rehabilitation. Apart
from general counselling, Alex had not received AOD treatment before and he was unsure if he wanted to go to
rehab. After a few more counselling sessions, and encouragement from the AOD counsellor, Alex decided he
had nothing to lose ‘I woke up and I thought no, this is it. This is my time to go and do it’. The AOD counsellor
contacted the residential rehabilitation and arranged an initial meeting and a plan was developed which
included inpatient withdrawal, and transportation from the inpatient withdrawal unit to the rehabilitation. For
Alex, access was timely and streamlined - ‘All up, entry into treatment was easy as the AOD counsellor and
rehab service organised everything’. Following inpatient withdrawal, Alex spent two months in residential
rehabilitation. Treatment provided Alex with an opportunity to learn about the adverse effects of drugs and
address different areas in his life which were sources of stress (e.g. financial and relationship issues). As he
said: ‘I was getting every aspect of my life sorted out whilst living there. Like I’m talking financial advice,
relationships – I’m talking lots of things – and I mean every area’. In addition, Alex developed a healthy routine
including morning exercise and an interest in various creative activities like song writing. This provided him
with a new sense of motivation and confidence as he ‘wanted to excel in life and get somewhere and not be a
nobody’. Alex had regular contact with his family during his stay in residential rehabilitation and this contact
was a great source of support.
Post treatment completion, Alex received a number of follow-up calls from the residential rehabilitation. The
follow-up calls were useful as they reminded Alex of what he had achieved. According to Alex, the calls ‘just
[confirmed in the back of your head], you’re not going to go back down that pathway, unless you want to end
up back there and go through all the shit that you’ve already been through’. After leaving rehabilitation, he re-
engaged with his AOD counsellor as a way of closing his treatment journey. Alex also resumed his
apprenticeship and secured a new job.
69
Continuity of care
AOD care pathways and post treatment support
Follow-up care is viewed as a fundamental component of effective treatment, yet half of the
participants reported that they received AOD-specific follow-up support after their index treatment
episode. For those who did, the follow-up support was generally pre-arranged in terms of
completing inpatient withdrawal followed by residential rehabilitation. Participants who received
residential treatment either as part of their PIT treatment experience, or following their PIT, often
reported that they also received or accessed some form of aftercare. In some cases, the aftercare
was arranged as part of their treatment exit plan and involved outpatient counselling. For some
participants, their treatment pathway was facilitated by a key worker, particularly in rural settings,
where a rural AOD clinician provided support pre and post PIT. For others, accessing multiple
services provided by the one AOD treatment agency ensured continuity of care.
Well because I am from [regional area], my drug and alcohol counsellor drove me to
[metropolitan suburb] and then after the week she came and picked me up and brought me
back home. [Interviewer: Yeah. So you felt that you didn't need any further contact or
assistance?] Assistance yeah no. Because when I came back home I still had my AOD
counsellor so she was still always really supportive (Interviewee 28).
[Interviewer: Did you also say that you were doing some counselling, like you continued on
with the counselling that you were doing? Yeah so before [outpatient group program] I
would have seen her every once a week but I only saw her once while I was doing [outpatient
group program] in those four weeks. Then I saw her after [outpatient group program] more
regularly. [Interviewer: So you continued to see the counsellor, and what…] Yeah.
[Interviewer…were the good things, if any, about the assistance you received from the
counsellor?] I guess she motivated me to finish it and she was there to have another opinion
on. So yeah she was a check in person, so just letting her know how I was doing and what I
was doing in the program and that sort of thing and how I was going (Interviewee 24).
Few participants who received outpatient treatment as their PIT reported receiving any follow-up
contact from the service once their treatment had finished. However, most participants indicated
that they were encouraged or given the option to re-engage with the service for further support.
Similarly, some participants receiving inpatient withdrawal treatment were encouraged to re-engage
with the service if they required additional support. Others did not expect to receive any follow-up
contact from the inpatient withdrawal service as treatment had been completed, and others felt it
was the client’s responsibility to contact the service if further treatment was needed. For a few
participants, the role or need of follow-up support only became apparent in the months following
treatment. As one participant explained, ‘I didn’t realise at the time that I needed more.’ This
suggests that staggered follow-up contact may facilitate re-engagement or the opportunity for a
brief intervention.
[Interviewer: So after you finished up with the detox, did you make any further contact or
receive any assistance from them?] Yeah, I got a few calls and that. [Interviewer: From [AOD
service J?] Yeah, they would have called me a few times but I would have said yeah, look, I'm

70
fine. [Interviewer: So you were fine at the time?]. Oh probably not, yeah. To me I was. My life
actually revolves around on and off and on and off use, because I've got ADHD as I said and
I've been on amphetamine pills since I was a kid. So amphetamine's part of my life
(Interviewee 22).
When participants were asked ‘what service or assistance if any, would you have liked to receive
following inpatient withdrawal’, the majority of participants suggested a follow-up telephone call
and some recommended follow-up counselling. This was the case for participants who had a
subsequent treatment in place after the PIT, as well as those with no plans for further treatment. A
few participants expressed dissatisfaction with the lack of follow-up care provided.
[Interviewer: What services or assistance if any, would you have liked to have received
following the acute withdrawal?] I really would have liked some follow-up, maybe even a
home visit or something like that. Just someone to touch base with me and say, hey, are you
coping? Are you going to your counselling sessions? Or if there's anything else that you
need. Yeah, it just seemed to be a little bit like, once you're out the door, that's it. But then,
again, like I said, I think that's the nature of detox (Interviewee 41).
Multi sector links
The presence of a key worker, such as an AOD clinician, housing worker, mental health worker,
welfare worker, or job network provider, was a stable source of support for many participants and
these workers provided links to a range of services within and across the health and non-health
system.
For example, several participants reported contact with multiple health professionals and in some
cases, care plans were in place and an integrated team approach was supported through regular
contact. These arrangements often meant that they had access to a wide range of options and
communication channels were clear.
Yeah, that's when I got out [of prison] this time and I joined up with a [mental health service]
and they're taking care of me. They've got a four-psych team, like a doctor, what do you call
it: a case manager and a nurse (Interviewee 21).
[Interviewer: Do you think that services work together to support or help you or not really?]
Yeah, no, they do. My GP, he's really good and the doctor in [rural town] they all work
together and they all know that I see drug and alcohol counsellors and all that sort of stuff.
But mainly it's just the social workers and the counsellors and all, that they have meetings
every month and they sit down and they work out what they could do better and what they
could improve on and all that sort of stuff. So they all work together or they do down here
anyway. [Interviewer: What were the good things if any about services working together to
help you, what are the good things?] You don't have to repeat yourself. I can just say
something to my drug and alcohol counsellor and she says can I discuss this with somebody
else and I say you can, you can talk to the other workers and that sort of thing. They're
always coming up with things that might help (Interviewee 16).
71
For other participants, a welfare or church-based service, or community health service was
instrumental in terms of providing practical supports (e.g., food, electrical appliances) and
suggesting other services that could assist.
It's good because there's a couple - there's like about seven people in there and there's a lady
that runs the group and she brings people in for all different things like the police officer in to
tell you to be careful for this, this, this or that. Or a painting person to come in and show you
how to paint or a jewellery person. A Centrelink person they get to come, if you'd got a
problem with that. It's pretty good. Because there's other people you can bounce off each
other sort of thing. It's people you know because it's your community sort of thing. So that
makes it a bit easier (Interviewee 7).
Job network agencies are not providers of therapeutic care, however many participants indicated
that the job network agencies facilitated access to a range of essential services such as mental
health, AOD treatment and housing. Given that addressing housing, employment and training needs
are critical to an individual’s recovery capital, the service linkage role of job network providers has a
therapeutic benefit.
They're a job search network and you get a worker who has to help you. Because I've been in
and out of jail a lot and use heroin a lot they get me work ready. Make sure that my - if I
need drug and alcohol counselling I get drug and alcohol counselling. If I need psychiatric
help, to talk to someone about stuff, go to see the psych. If he thinks I'm a bit better than
that then go into a course or something (Interviewee 37).
However in other cases, the level of coordination between services was unclear, with few formalised
links between them.
Well I've gone and seen [housing service], I've gone – [employment agency] are helping me
out. I've seen [family service and financial service] as well, yeah, all them. Some of them help
me out with food, some of them help me out with getting my bills paid. Some of them help
me out with I don't know, a combination. I got a tent and swag a couple of months ago,
yeah, so they've been pretty sweet (Interviewee 22).
As one participant who had contact with a number of services, including an AOD service and support
group and community based services said, ‘so one referral tends to lead to another, which is good’.
A variety of care pathways were experienced by participants ranging from optimal to fragmented.
The two cases studies below provide an illustration of both ends of the care pathway spectrum.
72
Case study 2: successful treatment journey and linkages with services
Joe had received AOD treatment on and off over the past five years, had previous contact with the legal
system and had experienced ongoing mental health issues. Following the most recent episode of inpatient
withdrawal, Joe engaged in a short-term supported accommodation program. As part of the program, Joe was
required to attend AOD counselling at a nearby AOD specialist service. Accessing the counselling was fairly
easy and required an initial telephone call to book an assessment appointment. Joe attended counselling on a
regular basis and ‘clicked’ with the counsellor. Around this time, Joe became a new father and was given full
custody of his child. Joe had few friends and received little support from his family. In many ways, Joe’s AOD
counsellor was his main support source. Together, Joe and the counsellor developed a care plan as a way to
help Joe identify and manage immediate issues as well as work through some long-standing problems
associated with violence, drug use and low self-esteem. To help Joe address his mental health issues, the AOD
counsellor recommended that Joe speak with his GP about organising a mental health plan and referral to a
psychologist. Through recommendations and support from his AOD counsellor, Joe also accessed a crisis
centre which provided emergency supplies and links to financial support services, including an advocate who
helped Joe organise a payment plan arrangement with utility providers. Bit by bit, Joe’s support network
expanded as he became engaged with a range of services including a parenting support group, a family
support worker and a child health nurse who made regular home visits. During this time, Joe stopped seeing
the AOD counsellor as the counsellor changed job, but this was okay as Joe felt he had achieved a lot from the
counselling and had established supports in place.
Given the number of services Joe was engaged with, the referral pathway was often unclear. However, in Joe’s
case one referral tended to lead to another referral and via the support he received from multiple sources he
was able to maintain custody of his child, manage his mental health and minimise the risk of relapse. As Joe
said ‘it was like I might not have directly asked the question, but they helped me to realise that it is a question
that is worth being asked, because there is a link. There is something they can provide’.
Case study 3: Complex needs and high level of services use (or fragmented service experience)
Jim has had episodic contact with various AOD and welfare agencies for over a decade. He is quite
knowledgeable and proactive about engaging with the services that he needs. He self-referred to his most
recent detox centre, by attending his regular GP in order to get the appropriate referral – “Listen Doc, I need to
get this paperwork filled so I can go into detox”. Jim’s main goal has been attending rehab, however this has
been complicated by factors including homelessness and mental health issues. He has made numerous
attempts at rehab, largely driven by his need for accommodation. Jim has overall been very satisfied with the
quality of the programs and has developed rapport with the staff, whom he describes as “very compassionate
people”. He has, however struggled with the daily rigours of life in rehab occasionally, and has gotten into
trouble and been asked to leave. By admitting responsibility, he has been allowed to re-enter some services.
A recent stint in rehab has seen Jim reach a crossroads. He is “over rehabs” after repeat attempts, but still
wants to address AOD issues, and long-term housing needs. He has been in contact with numerous housing
and welfare services, and is on a waiting list, but still requires further assistance. He has been proactive by
contacting various telephone counselling and referral services. Jim is currently seeing a counsellor at an AOD
service, but thinks he should visit his GP for referral to “some free psychology sessions” via a mental health
plan. Ultimately, he wants ongoing psychological counselling and support to address past and current
relationships, though his financial situation has prevented this. Due to his drinking, multiple ambulance
attendances, emergency room admissions and arrests have occurred. Jim admits to being a “disturbance to
the neighbourhood” which puts his current accommodation at risk. Jim recognises the gravity of his situation,
73
and that he has “come to a point... where he has got crisis going on in my life... not just accommodation, but
also to do with my addiction...”
Jim has limited informal support. His main support source is his mother, though the relationship is complicated
by a restraining order due to an outburst in her presence, and the fact that “she gets a lot of anxiety” caused
by his circumstances. Although he can blackout and behave inappropriately, his mother remains supportive.
Jim has attempted to expand his informal support base, and has recently been attending church and has had
some informal mentoring from a pastor. He has a close friend from whom he receives support, but has tended
to alienate himself from most friends due to his problems with alcohol: “no one wants to know me when I’ve
been drinking...”
Psychological issues have been one of the main difficulties Jim has encountered in seeking treatment.. Services
have previously had difficulty in getting in contact with Jim due to numerous periods where he has been off
the grid: lost phones, address changes etc. Despite having a case manager that he describes as “a nice lady”,
she often appears disengaged with his situation and so he feels he is doing “more work for myself than
sometimes what she’s doing”. Again, this tends to occur when he is most in need of assistance. Jim reports
that a housing worker has been somewhat helpful and recently linked in with a tenancy advocate to assist him
concerning his likely eviction. Jim’s main priorities going forward are obtaining counselling, staying clean and
sober and having stable accommodation. He would also like to gain some employment, even if this is
voluntary. He faces immediate concerns, however, including an impending eviction, which is limiting overall
progress.
Significant other support as recovery capital
Family was viewed as a significant source of support for participants; however some associated this
form of support with guilt feelings as much as gratitude. A small number of participants had a
supportive partner and a few others sought support from extended family members as opposed to
immediate family.
I've had a lot of support from my family which has been good in some aspects. Like I can't
believe how supportive they've been because [unclear] dealing with the law last year, the car
accident. Yeah, my family basically knew I'd taken drugs, but they came in and I've had
financial support and emotional support and I didn't actually ask them for it and I didn't
expect them to, considering because I was on drugs at the time (Interviewee 38).
Connections with friends were also important, yet these relationships were often closely managed
as a way to avoid placing any burden on the relationship. In most cases, participants identified one
or more close friends. Some participants had also made the decision to distance themselves from
their drinking or drug using friends. This often left participants feeling lonely and socially isolated,
especially participants who had little or no contact with family.
So I didn't actually have any real close circle of friends anymore. The only close circle of
friends that I developed were to do with drugs. So at the moment the only people I know
really if I go through my phonebook is people to do with drugs. Yeah so there's no support
network there (Interviewee 26).
Mutual help groups such as AA were the main support source for a small number, and these
participants attended AA groups during their PIT. As one participant explained ‘it [AA] helps you to
74
have a way of living beyond any rehabilitation period’. Several participants had experienced AA or
NA either prior to or after PIT, but chose not to return.
Involvement in a community or non-AOD specific support group, church or club provided some
participants with support and social connections, while at the same time it created an opportunity
for participants to make a positive contribution and help others. These connections also provided
participants with a sense of belonging.
I spend a bit of time at the soup kitchen, helping out there – cooking and handing out
groceries and stuff. We do – also I’m a Rotarian...[Interviewer: In what way, if at all, are
these informal supports helpful to you?] Oh they just keep me involved socially. Not isolated,
keep me doing stuff. It’s fairly satisfying activities in the – trying to help people out
(Interviewee 39).
Treatment barriers Factors identified by participants as impeding access to treatment services tended to focus on their
ability to get to services; affordability of services (especially where multiple/concurrent service
supports are required); staff attitudes; attitudes of non-AOD service staff; and the capacity of
services.
Ability to access services is influenced by a number of factors. For some participants, the ability to
attend an appointment at a service is impeded by their access to transportation, with some relying
on family to transport them and others relying on public transport (if they can afford it).
Appointment and scheduled meeting times were a challenge for some. This was due to treatment
services being available only during the business day, when they needed to be at work or engaged in
study. One participant suggested that at least one ‘late night’ opening would improve their ability to
access services. For others, frustrations surrounded the need for a referral to see a
psychologist/psychiatrist or the inability to access counsellors routinely on the phone outside of
counselling sessions and session times. This was balanced with frustrations surrounding access to
practitioners with long waiting times. At least one participant described the impact of mental health
issues on their ability to access AOD services.
[Interviewer: What things, if any, made it difficult or hard for you to access any of these services?] Sometimes getting out of the house, but that would be - yeah, that's just a personal problem. Yeah, sometimes if I was having anxiety attacks, just actually getting there (Interviewee 38).
Transport and scheduling issues relating to counselling services could be addressed with the
increased use of telephone or online counselling.
But being able to access those things, because $5 to get around town to get to these services
is a lot of money when you haven't got any, as you know... .I think that comes back to being
able to have access at home for those that are really sick, that are really struggling to get - I
mean to where I am now, to where I was back then, getting out of the house was just really
hard. It was a tough chore. [Interviewer: So home access to really get over that transport
hurdle?] Yeah. I think so and maybe telephone, a lot more telephone contact maybe from
the services rather than having to go in (Interviewee 41).
75
Affordability of services
Some participants expressed frustration with the cost of services, either the value-for-money, or at
their inability to access services because of their cost. A common complaint from participants was
about the disjuncture between length of funding and time required to recover from substance use
disorders. This was particularly evident in relation to post-treatment counselling support.
Well you had to pay for it, even with psychologists with the counselling I followed it up and it
was virtually a fulltime job, mate. It really was, just to get to see a psychologist for free.
Then when I - into my second sessions he goes, oh you know you only get five sessions for
free and then you've got to pay. It was sort of like I just said I'm not working. I haven't got
$220 to pay you every week. It was like, well why continue because he said, you need long-
term counselling. But the government won't pay for it... When you're a recovering alcoholic
and you've got no job and you've lost your career and everything else that goes with it, you
haven't got $220 to pay a psychologist every week. So that's not his fault, it's the
government's fault (Interviewee 40).
Negative staff attitudes and behaviours
The most commonly reported barrier to treatment involved perceived negative staff attitudes and
behaviours. A key complaint surrounded a lack of clarity and communication of rules and regulations
within treatment services, particularly residential services. Participants cited examples of a lack of
information being provided prior to entry into the service and described situations where
information provided prior to entry was directly contradicted upon entry.
The staff were pretty verbally abusive towards my children on the first day they got there and
they were just running around and being kids pretty much. I'm like this is a place that I
waited six months to go to because it was meant to be for children and their mothers. When
they were getting told off for being kids, I just felt that it was wrong (Interviewee 26).
Several expressed concern about the assumptions staff made about them, and suggested that
clinical judgements may have been made based on these assumptions rather than facts.
Honestly, they judge you a bit too much. They look at - people that use drugs aren't like
people in society obviously. They're not exactly functional, right, else they'd be - have a job or
whatever or trying to look for work. But they look at you like you shouldn't - what are you
doing here you should be out like - you shouldn't even be here you piece of ‘shit’ more or less,
you should be doing the right thing. That's the feeling you get from them. Besides that, their
services are helpful but the way they treat - well I don't know if it's treat - the way they talk
to you maybe isn’t - doesn’t sound nice (Interviewee 27).
For one participant, a desire to retain a sense of privacy impacted on their sense of self and mental
health:
It only became hard for myself as an individual when I had to tell so many different people
my life story. That actually started affecting me a little bit because I didn't want so many
people having different judgements on me. I just wanted the one person kind of thing
(Interviewee 28).
76
A small number of participants expressed concern about the possible impact disclosure of their
substance use would have on their ability to access non-AOD services, like Centrelink and primary
health care.
Between leaving [AOD service K] is where it all stopped virtually, the support which is
probably what most people need. It was just red tape from there, it was go see a GP and you
needed a medical plan. At one stage I rocked up to an appointment and they didn't have my
medical plan so they wouldn't see me unless I paid $220, and yeah. It's just red tape
virtually... . I mean [AOD service K], I'm not blaming them at all. When I left they emailed a -
I mean it's probably half my GP’s fault. They emailed all my stuff back to him and he was
meant to organise everything and yeah, he failed. In dealing with him and the psychology
and whatever else and yeah, like I said I showed up there and they wouldn't see me because
he hadn't sent them my medical plan. Because they won't see anyone without proof of a
medical - sorry mental health plan is what I'm trying to say. Yeah, sorry. Not medical, mental
health plan. So then I had to leave that day and then - yeah, it was all just too hard, mate.
When you're recovering from any substance, sometimes you just say fuck it and go get a hit
or go buy a carton of piss [laughs], which is virtually what I'd done (Interviewee 40).
Limited capacity of services
A number of participants identified service capacity issues as critical barriers to accessing both AOD
treatment services and non-AOD services (post AOD treatment). Some of the issues were related to
the capacity of services within a given catchment area, and the limited ability of services to offer
treatment places to people living outside of their zone.
They didn't have a lot of outreach services and being someone with anxiety and agoraphobia
not being able to get to those services made it very difficult for me. I wasn't getting the
proper treatment and - yeah... When I was living back in [regional city] I ended up moving
out to a smaller suburb away from [regional city] and there was - the majority of the services
wouldn't come out there because they said I was out of their catchment zone and they didn't
offer that outreach service to that area. There were no services in that area that could have
helped me, which made my mental health issues worse, which led me more to binge drinking
and smoking and that (Interviewee 26).
The prioritisation processes for AOD services mean some people can be on waiting lists for a long
time before they receive any treatment or support. Good communication practice around this,
however, ensures that services manage participant expectations quite well.
They get 20 phone calls a day or whatever and they've only got a certain amount of beds.
They obviously rate you on your seriousness and if you're on drugs or whatever, and if you're
only an alcoholic there it was like you were a lower rung. [They had guys] on meth and ice
for five years, they're definitely going to get put in ahead of you. That's what it was like is
you get put up - that's what it felt like is, oh yeah in a couple of weeks you should be in. Then
you ring them Tuesday between nine and 10 and then, oh sorry we've had a few more urgent
admissions and you're back on the waiting list sort of thing (Interviewee 10).
It never used to, yeah, and then I'll be honest with you, about six months ago I rang up [AOD
service A] and asked if I can get some counselling to help get myself drug free and all that
77
stuff and I'm not good in groups to be honest. They said no we can't help you there's only
like group sessions for the moment. You have to go on like a six month waiting list. I thought
well - I go, ‘no, it's alright, don't worry about it’. It put me straight off. I didn't want to wait
six months to get help. I wanted more or less help there and then to get off of it. It's not
every other time, this is only once though. Every other time it's been pretty good
(Interviewee 37).
For several participants, housing is a critical post-treatment need. However, as participants
identified the waiting list prioritisation process for housing services means an extended wait for
most.
I honestly believe that apart from being very supportive and offering counselling, which they
do as well, I think they're really good. But they're also very - I mean one of things they say to
you at the end of this interview, which all sounds very promising and hopeful, is that they
don’t have any accommodation. So for a single person like me, you're on the bottom of the
list for housing (Interviewee 41).
Yeah, but they couldn't get me a house or anything like that. You've got to apply and there's
just a massive waiting list in [regional area], massive, massive, massive like three year
waiting list, four year waiting list (Interviewee 22).
Areas for improvement
More one-to-one counselling
Several participants expressed dissatisfaction with the lack of one-to-one counselling available
during residential care. Whilst recognising the benefits of group counselling such as learning from
peers and sharing experiences, they felt that their personal needs were not sufficiently met in this
format. Often they had anticipated that individual counselling would be part of the treatment and
those that did receive some felt more counselling would have been beneficial.
Identify and be trained to manage multiple needs
Some participants expressed concern that their multiple issues were not adequately understood or
managed by treatment staff, and that staff packaged this as a concern in terms of the impact the
client’s behaviour may have on others. Participants suggested an improved understanding of why
people misuse substances, of mental health problems, and the interconnectedness of mental health
and drug and alcohol use is required, and clinicians who are trained in mental health and AOD.
Adopt a holistic approach to recovery
The need to adopt a holistic approach to treatment and recovery is important. Whilst few
participants discussed this explicitly, some identified that care pathways need to include a holistic
approach, ensuring that AOD treatment occurs simultaneously with support in addressing their
other needs, for example, mental health. One participant felt that this would facilitate increased
quality and sustainability of recovery.
78
Improve inter-agency communication about participant care plans and history
Central to the notion of a holistic approach to care and recovery is that of clear communication and
links between the various areas of assistance the participant may need. Some participants felt that
the process of referral was sound; however, in reality, agencies did not communicate well enough
(or at all) about participant needs, experiences and treatment effectiveness. Frustration was
expressed at the lack of a central database/system that shared client information to facilitate
greater understanding of an individual’s personal and treatment history.
Yes, they do talk, if you let them talk to each about what's happening with you. But yeah,
maybe there needs to be a care plan or a case management thing so that when this person
comes in they go, we've tried this, try this, maybe we can go here (Interviewee 9).
So that is, a crisis happens, it's like, okay, so this is - maybe this is what she's done before,
she's gone to [AOD service E], she's detoxed, she's been off alcohol for so many months. This
crisis has happened again, how can we help her this time? This worked, and that didn’t work
(Interviewee 41).
Improve communication with clients about their planned care
In keeping with this perceived lack of communication across agencies, some participants felt that
there was a lack of transparency and communication with clients about their planned care,
especially where that care involved multiple agencies, departments or clinicians.
Yes, as a client I would like to learn an overall picture, all these different departments doing
their best. I would actually like to learn an overall, whereas at the moment it's like this
person's got that and that person's got that, blah, blah, blah, blah. It's all segmented
(Interviewee 17).
79
4. Patient Pathways Priority 2a: Data linkage
4.1 Introduction This chapter focuses on the Victorian data linkage component of the Patient Pathways Project, which
involved linking Victorian alcohol and drug treatment service data, emergency department
presentations data and hospital admitted episodes data across three years.
The aim of the data linkage component was to provide evidence on people’s engagement with
medical and clinical services prior to and following engagement with specialist AOD treatment, and
to obtain a better understanding of service utilisation by clients prior to, during and following AOD
treatment engagement. The objectives are threefold.
1. To describe client characteristics, the proportion of clients that presented at hospital
emergency departments, and the proportion of clients that become hospital inpatients.
2. To compare the health service utilisation by variables such as severity of problem, patient
demographics, and AOD specialist service use.
3. To compare the health service utilisation between two jurisdictions in Australia.
The third objective was not achievable as WA data could not be accessed. An alternative was
considered using Queensland data, however timely access was not possible. As an alternative to
presenting data for an additional jurisdiction, analyses have been undertaken examining
characteristics and patterns of ED and hospital utilisation for four subpopulations with risk factors
for elevated rates of harm – (i) AOD clients engaging in polydrug use on entry into treatment, (ii)
AOD clients who had recently engaged in injecting drug use on entry into treatment, (iii) AOD clients
who were homeless on entry into treatment and (iv) forensic clients. These results provide
important information regarding outcomes and service utilisation for high risk populations, and are
provided in the linkage supplementary report.
4.2 Method The use of administrative datasets provides cost-effective population level data for analysis of
health, disease, treatment and service utilisation. Extending this use to record or data linkage in
health research improves data utility. While Victorian AOD treatment, ED and hospitalisation
datasets are available, data linkage has not been used to date to explore health service utilisation by
Victorian AOD treatment clients. Data are presented examining patterns and characteristics of ED
presentations and hospital admissions across three years – the year prior to AOD treatment
engagement (2009/10), the year of AOD treatment engagement (2010/11) and the year following
AOD treatment engagement (2011/12) – in order to determine change following treatment for AOD
clients at a whole-of-population level.
4.2.1 Data sources
Three data sources are used:
Victorian Alcohol and Drug Information System (ADIS),
80
Victorian Emergency Minimum Dataset (VEMD), and
Victorian Admitted Episodes Dataset (VAED).
Victorian Alcohol and Drug Information System (ADIS)
The Victorian Department of Health funds community-based agencies to provide specialist alcohol
and drug treatment services across the state. The collection of client information is a mandatory
requirement, and data is collated in ADIS. The ADIS database is a register of client-level data from
government-funded, specialist AOD treatment services in Victoria. In this report, we present data
from ADIS clients with a course of treatment start date between 1 July 2010 and 30 June 2011 (index
year). A course of treatment is defined as the period of contact within defined dates of
commencement and cessation between a client and a treatment provider or team of providers.
Consequently any one client may have undertaken multiple courses of treatment in a given year, or
across multiple years.
Victorian Emergency Minimum Dataset (VEMD)
VEMD contains demographic, administrative and clinical data detailing all presentations to Victorian
public hospitals with a 24-hour Emergency Department (ED). VEMD data were included from 01 July
2009 through to 30 June 2012. The VEMD contains a range of information regarding each
presentation. This includes three fields for International Classification of Disease-10 (ICD-10)
diagnoses and a series of data items relating to injury surveillance. There are around 1.4 million
VEMD presentations per annum for all diagnoses.
Victorian Admitted Episodes Dataset (VAED)
Hospitalisations were obtained from the Victorian Admitted Episodes Dataset (VAED), a database
maintained by the Victorian DH. VAED records all acute hospital statistical separations (i.e. inpatient
treatment episodes) in Victoria, and includes information on causes of admission (ICD-10 coding),
age and sex. Statistical separations include admissions to different parts of the hospital (e.g. ICU
discharge to general ward admissions). Separations are used as a proxy measure for hospitalisations.
The term ‘acute hospitals’ refers to public, private and denominational hospitals, acute rehabilitation
and extended care (sub-acute) facilities, day procedure centres and designated acute psychiatric
units in public hospitals. Residential care (nursing homes), hostels, supported residential services
and state managed psychiatric institutions are not included in the VAED. VAED data was included
from 01 July 2009 through to 30 June 2012. There are around 2.1 million VAED separations per
annum.
4.2.2 Measures
The datasets included client’s encrypted identifier, demographics (e.g. gender, age groups, country
of birth, and indigenous status), socioeconomic variables (e.g. employment status, living
arrangement), AOD treatment variables (e.g. treatment type, primary drug of concern), admission,
and diagnostic variables for ED and hospital admissions (e.g. ICD-10 code for principal diagnosis) (see
Appendix 3.1 for detailed information of measures used in the report.)
81
4.2.3 Data Linkage Manipulation and Analysis
Data linkage
The linkage of the three selected datasets (ADIS, VEMD, and VAED) involved a series of processes
designed to maximise the number of cases linked, but minimise the risk of incorrectly linked
unrelated cases across the service settings included.
The Victorian Data Linkages (VDL) at Department of Health (DH) linked all three datasets (of which
the DH is the data custodians). Linkage involved a probabilistic and deterministic matching, in a two-
step process at VDL. First, the VEMD and VAED datasets underwent data cleaning via probabilistic
matching, where multiple ED presentations or hospitalisations were identified for a single client.
Second, deterministic matching was used to link ADIS to VEMD and VAED.
A statistical linkage key (SLK) was created based on aspects of family name, given name, date of birth
and gender, with actual names and dates of birth omitted. VDL provided ADIS, VAED and VEMD
records data files and SLK files separately to Turning Point via an online secure data exchange
facility. VDL provided datasets were linked by Turning Point staff in two stages:
1. Records datasets were linked with SLK files. The ADIS dataset was linked with the ADIS SLK
file using ADIS outlet ID and ADIS episode ID. The VAED dataset was linked with the VAED
SLK file using VAED ID. The VEMD dataset was linked with the VEMD SLK file using VEMD ID
2. The ADIS dataset was linked with VAED and VEMD separately using SLK
Data cleaning
The research team at Turning Point undertook extensive data cleaning and preparation of ADIS,
VEMD, and VAED datasets.
All data files received from VDL were first cleaned for missing values and mis-coding (e.g. treatment
start date was after treatment termination day). Then all data files were checked whether the record
IDs were all unique identifiers (ADIS outlet ID, ADIS episode ID, VAED ID and VEMD ID). Records with
duplicate record IDs were removed to ensure correct links of record data files with SLK files. After
record data files were linked to SLK files, we were able to identify multiple records from one client.
Data were then checked for un-matched gender and age group codes for individual clients, to reduce
possible mismatched cases introduced by probabilistic matching. Consistent age and gender for
patients were first checked in the ADIS dataset, including different genders, jump of client’s age
groups in three years (e.g. client’s age group changed from 5-9 years old in 09/10 to 15-19 years old
in 10/11) or client’s age in a year was older than the year after. Client records with mismatched age
and gender were deleted in ADIS. The ADIS dataset was then linked with both VAED and VEMD using
the SLK, and was used as a reference dataset for cleaning mismatched records in VAED and VEMD
data (inconsistent gender and age group from multiple records of the same client). Patient
characteristics, treatment types and drug use variables in ADIS dataset were also re-grouped to
reduce reporting groups contain numbers less than five (see Appendix 3.1).
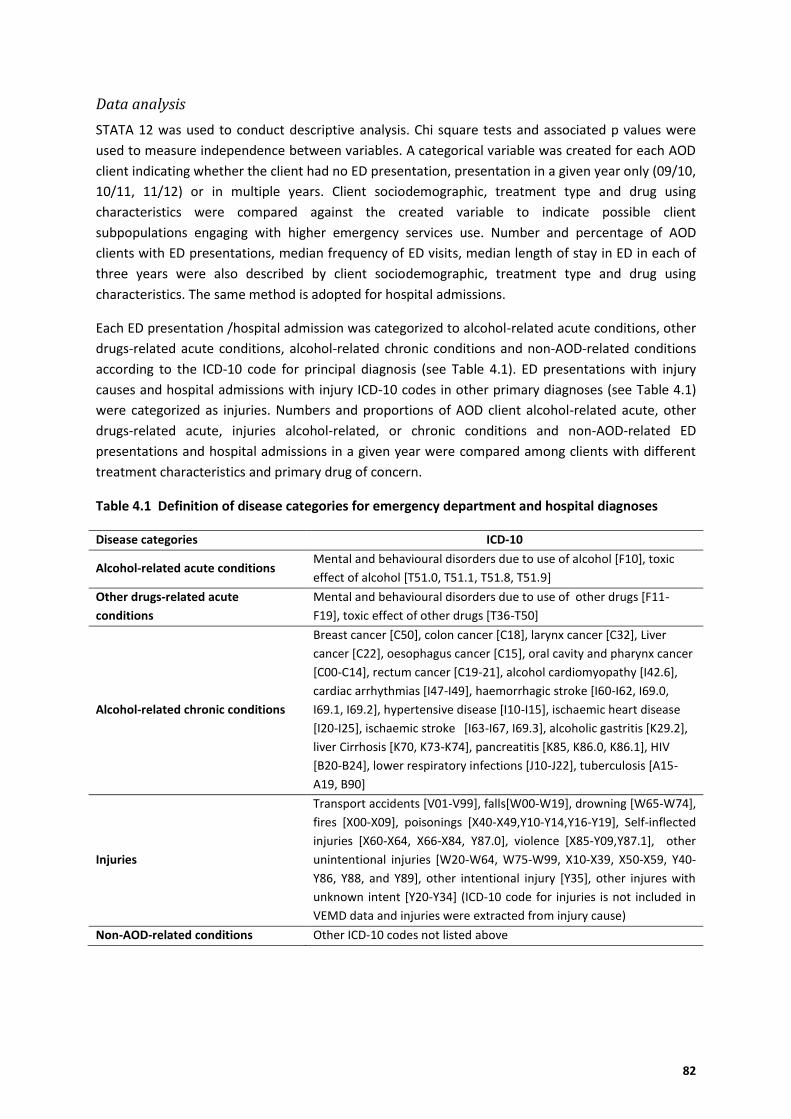
82
Data analysis
STATA 12 was used to conduct descriptive analysis. Chi square tests and associated p values were
used to measure independence between variables. A categorical variable was created for each AOD
client indicating whether the client had no ED presentation, presentation in a given year only (09/10,
10/11, 11/12) or in multiple years. Client sociodemographic, treatment type and drug using
characteristics were compared against the created variable to indicate possible client
subpopulations engaging with higher emergency services use. Number and percentage of AOD
clients with ED presentations, median frequency of ED visits, median length of stay in ED in each of
three years were also described by client sociodemographic, treatment type and drug using
characteristics. The same method is adopted for hospital admissions.
Each ED presentation /hospital admission was categorized to alcohol-related acute conditions, other
drugs-related acute conditions, alcohol-related chronic conditions and non-AOD-related conditions
according to the ICD-10 code for principal diagnosis (see Table 4.1). ED presentations with injury
causes and hospital admissions with injury ICD-10 codes in other primary diagnoses (see Table 4.1)
were categorized as injuries. Numbers and proportions of AOD client alcohol-related acute, other
drugs-related acute, injuries alcohol-related, or chronic conditions and non-AOD-related ED
presentations and hospital admissions in a given year were compared among clients with different
treatment characteristics and primary drug of concern.
Table 4.1 Definition of disease categories for emergency department and hospital diagnoses
Disease categories ICD-10
Alcohol-related acute conditions Mental and behavioural disorders due to use of alcohol [F10], toxic
effect of alcohol [T51.0, T51.1, T51.8, T51.9]
Other drugs-related acute
conditions
Mental and behavioural disorders due to use of other drugs [F11-
F19], toxic effect of other drugs [T36-T50]
Alcohol-related chronic conditions
Breast cancer [C50], colon cancer [C18], larynx cancer [C32], Liver
cancer [C22], oesophagus cancer [C15], oral cavity and pharynx cancer
[C00-C14], rectum cancer [C19-21], alcohol cardiomyopathy [I42.6],
cardiac arrhythmias [I47-I49], haemorrhagic stroke [I60-I62, I69.0,
I69.1, I69.2], hypertensive disease [I10-I15], ischaemic heart disease
[I20-I25], ischaemic stroke [I63-I67, I69.3], alcoholic gastritis [K29.2],
liver Cirrhosis [K70, K73-K74], pancreatitis [K85, K86.0, K86.1], HIV
[B20-B24], lower respiratory infections [J10-J22], tuberculosis [A15-
A19, B90]
Injuries
Transport accidents [V01-V99], falls[W00-W19], drowning [W65-W74],
fires [X00-X09], poisonings [X40-X49,Y10-Y14,Y16-Y19], Self-inflected
injuries [X60-X64, X66-X84, Y87.0], violence [X85-Y09,Y87.1], other
unintentional injuries [W20-W64, W75-W99, X10-X39, X50-X59, Y40-
Y86, Y88, and Y89], other intentional injury [Y35], other injures with
unknown intent [Y20-Y34] (ICD-10 code for injuries is not included in
VEMD data and injuries were extracted from injury cause)
Non-AOD-related conditions Other ICD-10 codes not listed above
83
4.3 Results
4.3.1 Client characterstics and emergency department presentations
Table 4.2 shows the sociodemographic characteristics of AOD clients in 2010/11 (index year) and
their ED engagement from 2009/10 to 2011/12. There were 25,229 AOD clients who started
treatment in the index year. Over two-thirds (68%) were male, with the highest proportion of clients
within the 25 to 34 year age group (29%). The majority of AOD clients were unemployed, living with
family and residing in a private residence. Only half of the cohort resided in metropolitan
Melbourne. While a minority of clients were either Aboriginal and/or Torres Strait Islander (7%), this
is a higher proportion than the population distribution in Victoria.
More than half (52%) of the AOD clients did not present to ED over the three years. However, almost
one-quarter (23%) presented on multiple occasions over the three years. These patterns varied
across sociodemographic groups. Of note, 26% of females had multiple ED presentations, while 22%
of males presented to ED on multiple occasions. The unemployed had higher proportions of multiple
ED presentations than the employed. Those living alone had higher proportions of multiple ED
presentations than those living with family or others. Being homeless was associated with higher
proportions of multiple ED presentations, as was living in metropolitan Melbourne compared with
the remainder of the state.
Table 4.3 shows these same sociodemographic characteristics by ED presentation, and indicates
changes pre- and post-treatment. In general, the proportions of pre-AOD treatment ED
presentations (2009/10) were higher than the proportions of post-AOD treatment ED presentations
(2011/12); this is true with respect to gender, age groups (with the exception of clients under 15
years), country of birth, Indigenous status, employment type (except ‘other’), living status,
accommodation status (except for ‘in custody’), homeless status and region. Comparatively greater
reductions in ED presentations were shown for AOD clients who were homeless than those with a
home as well as for those with unstable accommodation than those living in a private residence.
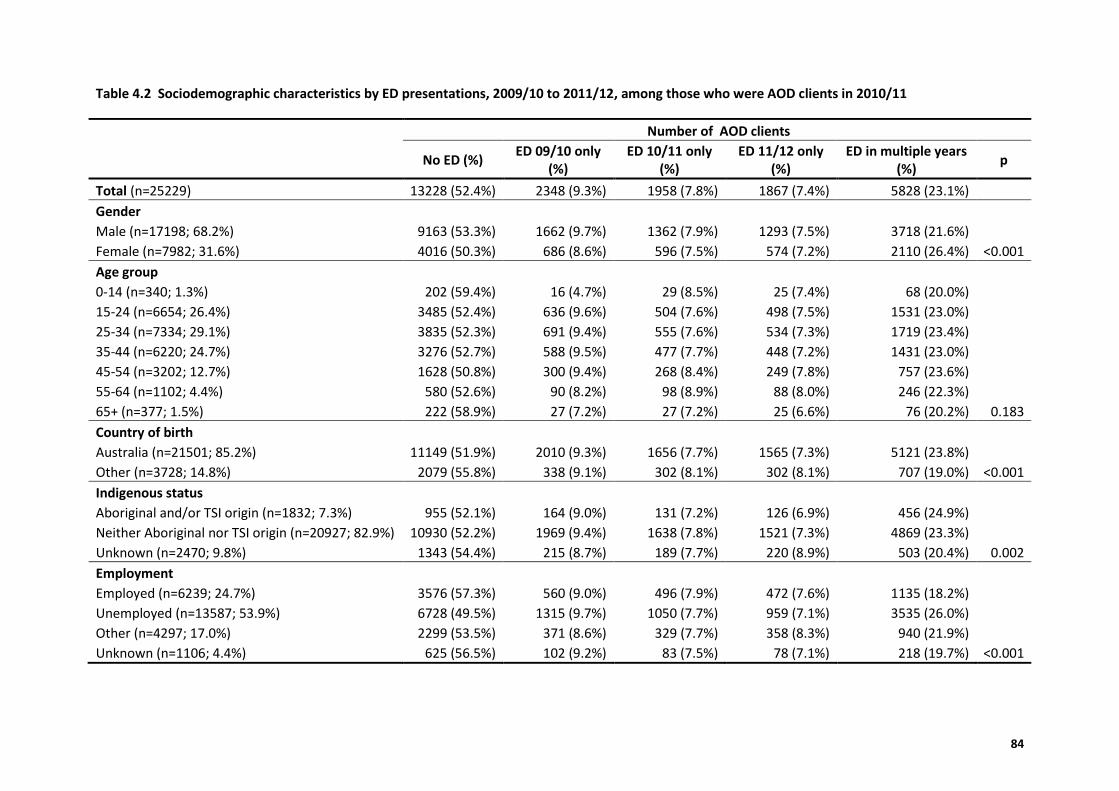
84
Table 4.2 Sociodemographic characteristics by ED presentations, 2009/10 to 2011/12, among those who were AOD clients in 2010/11
Number of AOD clients
No ED (%) ED 09/10 only
(%) ED 10/11 only
(%) ED 11/12 only
(%) ED in multiple years
(%) p
Total (n=25229) 13228 (52.4%) 2348 (9.3%) 1958 (7.8%) 1867 (7.4%) 5828 (23.1%)
Gender
Male (n=17198; 68.2%) 9163 (53.3%) 1662 (9.7%) 1362 (7.9%) 1293 (7.5%) 3718 (21.6%) Female (n=7982; 31.6%) 4016 (50.3%) 686 (8.6%) 596 (7.5%) 574 (7.2%) 2110 (26.4%) <0.001
Age group 0-14 (n=340; 1.3%) 202 (59.4%) 16 (4.7%) 29 (8.5%) 25 (7.4%) 68 (20.0%)
15-24 (n=6654; 26.4%) 3485 (52.4%) 636 (9.6%) 504 (7.6%) 498 (7.5%) 1531 (23.0%) 25-34 (n=7334; 29.1%) 3835 (52.3%) 691 (9.4%) 555 (7.6%) 534 (7.3%) 1719 (23.4%) 35-44 (n=6220; 24.7%) 3276 (52.7%) 588 (9.5%) 477 (7.7%) 448 (7.2%) 1431 (23.0%) 45-54 (n=3202; 12.7%) 1628 (50.8%) 300 (9.4%) 268 (8.4%) 249 (7.8%) 757 (23.6%) 55-64 (n=1102; 4.4%) 580 (52.6%) 90 (8.2%) 98 (8.9%) 88 (8.0%) 246 (22.3%) 65+ (n=377; 1.5%) 222 (58.9%) 27 (7.2%) 27 (7.2%) 25 (6.6%) 76 (20.2%) 0.183
Country of birth
Australia (n=21501; 85.2%) 11149 (51.9%) 2010 (9.3%) 1656 (7.7%) 1565 (7.3%) 5121 (23.8%) Other (n=3728; 14.8%) 2079 (55.8%) 338 (9.1%) 302 (8.1%) 302 (8.1%) 707 (19.0%) <0.001
Indigenous status
Aboriginal and/or TSI origin (n=1832; 7.3%) 955 (52.1%) 164 (9.0%) 131 (7.2%) 126 (6.9%) 456 (24.9%) Neither Aboriginal nor TSI origin (n=20927; 82.9%) 10930 (52.2%) 1969 (9.4%) 1638 (7.8%) 1521 (7.3%) 4869 (23.3%) Unknown (n=2470; 9.8%) 1343 (54.4%) 215 (8.7%) 189 (7.7%) 220 (8.9%) 503 (20.4%) 0.002
Employment Employed (n=6239; 24.7%) 3576 (57.3%) 560 (9.0%) 496 (7.9%) 472 (7.6%) 1135 (18.2%)
Unemployed (n=13587; 53.9%) 6728 (49.5%) 1315 (9.7%) 1050 (7.7%) 959 (7.1%) 3535 (26.0%) Other (n=4297; 17.0%) 2299 (53.5%) 371 (8.6%) 329 (7.7%) 358 (8.3%) 940 (21.9%) Unknown (n=1106; 4.4%) 625 (56.5%) 102 (9.2%) 83 (7.5%) 78 (7.1%) 218 (19.7%) <0.001
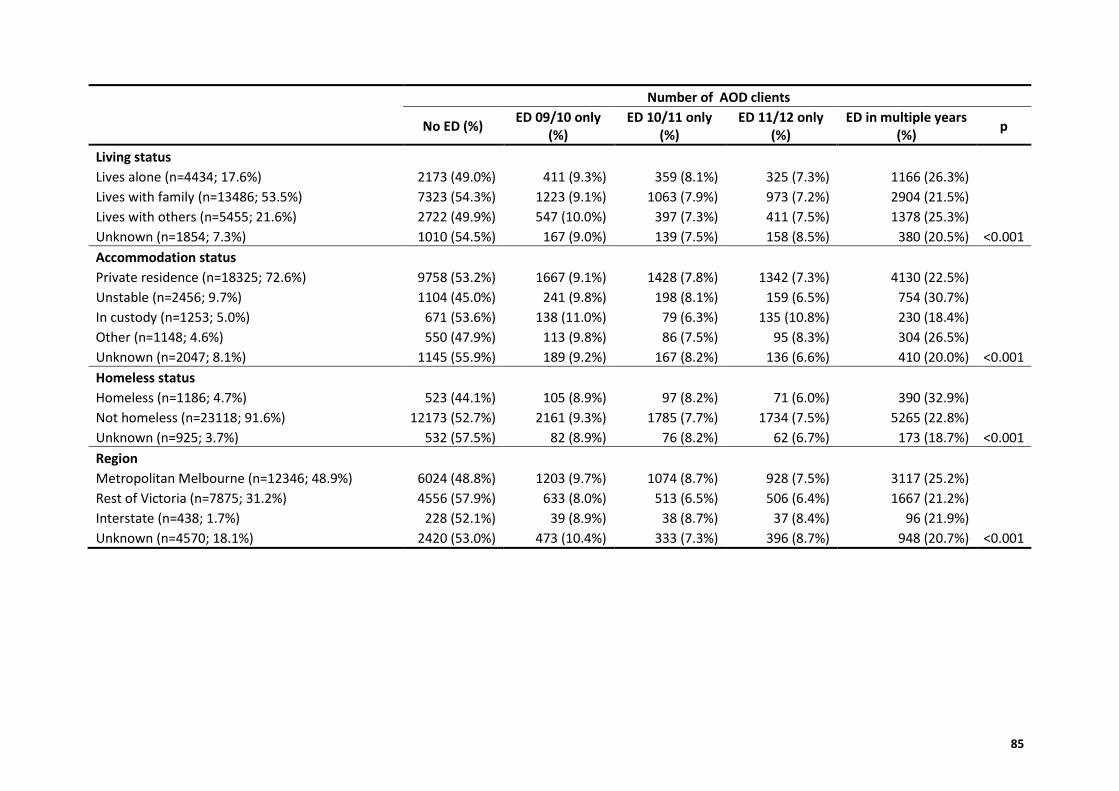
85
Number of AOD clients
No ED (%) ED 09/10 only
(%) ED 10/11 only
(%) ED 11/12 only
(%) ED in multiple years
(%) p
Living status
Lives alone (n=4434; 17.6%) 2173 (49.0%) 411 (9.3%) 359 (8.1%) 325 (7.3%) 1166 (26.3%) Lives with family (n=13486; 53.5%) 7323 (54.3%) 1223 (9.1%) 1063 (7.9%) 973 (7.2%) 2904 (21.5%) Lives with others (n=5455; 21.6%) 2722 (49.9%) 547 (10.0%) 397 (7.3%) 411 (7.5%) 1378 (25.3%) Unknown (n=1854; 7.3%) 1010 (54.5%) 167 (9.0%) 139 (7.5%) 158 (8.5%) 380 (20.5%) <0.001
Accommodation status Private residence (n=18325; 72.6%) 9758 (53.2%) 1667 (9.1%) 1428 (7.8%) 1342 (7.3%) 4130 (22.5%)
Unstable (n=2456; 9.7%) 1104 (45.0%) 241 (9.8%) 198 (8.1%) 159 (6.5%) 754 (30.7%) In custody (n=1253; 5.0%) 671 (53.6%) 138 (11.0%) 79 (6.3%) 135 (10.8%) 230 (18.4%) Other (n=1148; 4.6%) 550 (47.9%) 113 (9.8%) 86 (7.5%) 95 (8.3%) 304 (26.5%) Unknown (n=2047; 8.1%) 1145 (55.9%) 189 (9.2%) 167 (8.2%) 136 (6.6%) 410 (20.0%) <0.001
Homeless status
Homeless (n=1186; 4.7%) 523 (44.1%) 105 (8.9%) 97 (8.2%) 71 (6.0%) 390 (32.9%) Not homeless (n=23118; 91.6%) 12173 (52.7%) 2161 (9.3%) 1785 (7.7%) 1734 (7.5%) 5265 (22.8%) Unknown (n=925; 3.7%) 532 (57.5%) 82 (8.9%) 76 (8.2%) 62 (6.7%) 173 (18.7%) <0.001
Region Metropolitan Melbourne (n=12346; 48.9%) 6024 (48.8%) 1203 (9.7%) 1074 (8.7%) 928 (7.5%) 3117 (25.2%)
Rest of Victoria (n=7875; 31.2%) 4556 (57.9%) 633 (8.0%) 513 (6.5%) 506 (6.4%) 1667 (21.2%) Interstate (n=438; 1.7%) 228 (52.1%) 39 (8.9%) 38 (8.7%) 37 (8.4%) 96 (21.9%) Unknown (n=4570; 18.1%) 2420 (53.0%) 473 (10.4%) 333 (7.3%) 396 (8.7%) 948 (20.7%) <0.001
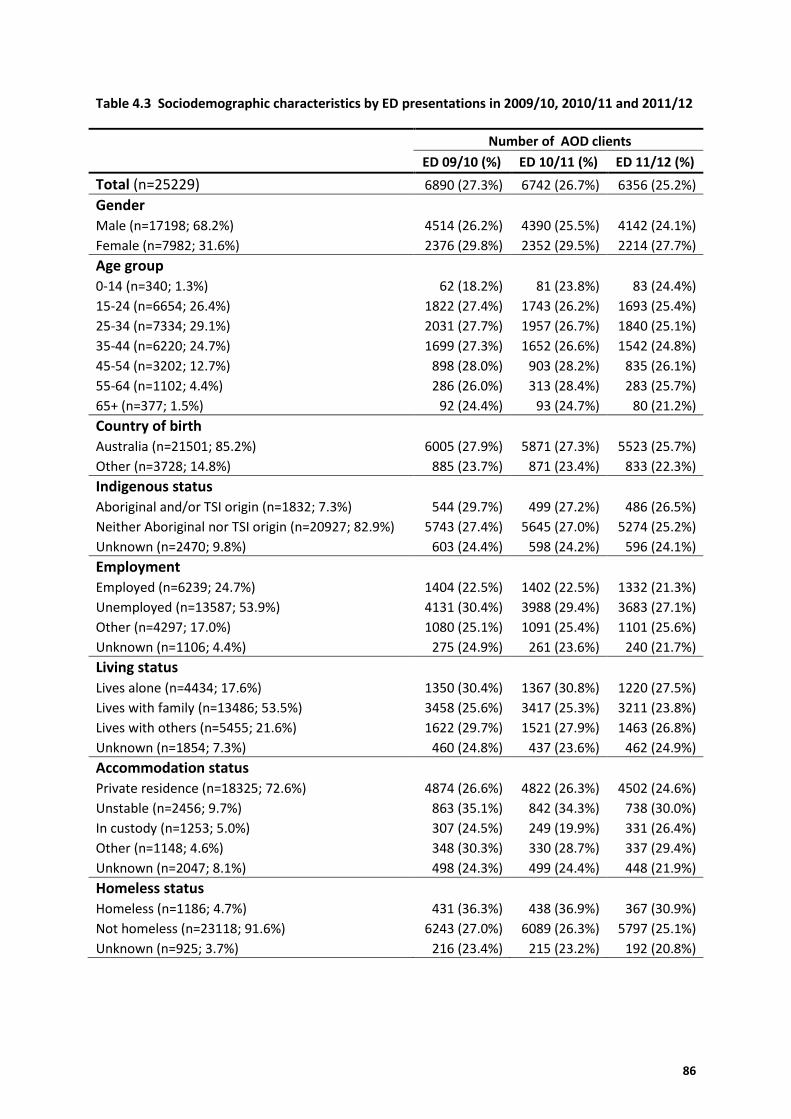
86
Table 4.3 Sociodemographic characteristics by ED presentations in 2009/10, 2010/11 and 2011/12
Number of AOD clients
ED 09/10 (%) ED 10/11 (%) ED 11/12 (%)
Total (n=25229) 6890 (27.3%) 6742 (26.7%) 6356 (25.2%)
Gender
Male (n=17198; 68.2%) 4514 (26.2%) 4390 (25.5%) 4142 (24.1%)
Female (n=7982; 31.6%) 2376 (29.8%) 2352 (29.5%) 2214 (27.7%)
Age group 0-14 (n=340; 1.3%) 62 (18.2%) 81 (23.8%) 83 (24.4%)
15-24 (n=6654; 26.4%) 1822 (27.4%) 1743 (26.2%) 1693 (25.4%)
25-34 (n=7334; 29.1%) 2031 (27.7%) 1957 (26.7%) 1840 (25.1%)
35-44 (n=6220; 24.7%) 1699 (27.3%) 1652 (26.6%) 1542 (24.8%)
45-54 (n=3202; 12.7%) 898 (28.0%) 903 (28.2%) 835 (26.1%)
55-64 (n=1102; 4.4%) 286 (26.0%) 313 (28.4%) 283 (25.7%)
65+ (n=377; 1.5%) 92 (24.4%) 93 (24.7%) 80 (21.2%)
Country of birth
Australia (n=21501; 85.2%) 6005 (27.9%) 5871 (27.3%) 5523 (25.7%)
Other (n=3728; 14.8%) 885 (23.7%) 871 (23.4%) 833 (22.3%)
Indigenous status
Aboriginal and/or TSI origin (n=1832; 7.3%) 544 (29.7%) 499 (27.2%) 486 (26.5%)
Neither Aboriginal nor TSI origin (n=20927; 82.9%) 5743 (27.4%) 5645 (27.0%) 5274 (25.2%)
Unknown (n=2470; 9.8%) 603 (24.4%) 598 (24.2%) 596 (24.1%)
Employment Employed (n=6239; 24.7%) 1404 (22.5%) 1402 (22.5%) 1332 (21.3%)
Unemployed (n=13587; 53.9%) 4131 (30.4%) 3988 (29.4%) 3683 (27.1%)
Other (n=4297; 17.0%) 1080 (25.1%) 1091 (25.4%) 1101 (25.6%)
Unknown (n=1106; 4.4%) 275 (24.9%) 261 (23.6%) 240 (21.7%)
Living status
Lives alone (n=4434; 17.6%) 1350 (30.4%) 1367 (30.8%) 1220 (27.5%)
Lives with family (n=13486; 53.5%) 3458 (25.6%) 3417 (25.3%) 3211 (23.8%)
Lives with others (n=5455; 21.6%) 1622 (29.7%) 1521 (27.9%) 1463 (26.8%)
Unknown (n=1854; 7.3%) 460 (24.8%) 437 (23.6%) 462 (24.9%)
Accommodation status Private residence (n=18325; 72.6%) 4874 (26.6%) 4822 (26.3%) 4502 (24.6%)
Unstable (n=2456; 9.7%) 863 (35.1%) 842 (34.3%) 738 (30.0%)
In custody (n=1253; 5.0%) 307 (24.5%) 249 (19.9%) 331 (26.4%)
Other (n=1148; 4.6%) 348 (30.3%) 330 (28.7%) 337 (29.4%)
Unknown (n=2047; 8.1%) 498 (24.3%) 499 (24.4%) 448 (21.9%)
Homeless status
Homeless (n=1186; 4.7%) 431 (36.3%) 438 (36.9%) 367 (30.9%)
Not homeless (n=23118; 91.6%) 6243 (27.0%) 6089 (26.3%) 5797 (25.1%)
Unknown (n=925; 3.7%) 216 (23.4%) 215 (23.2%) 192 (20.8%)
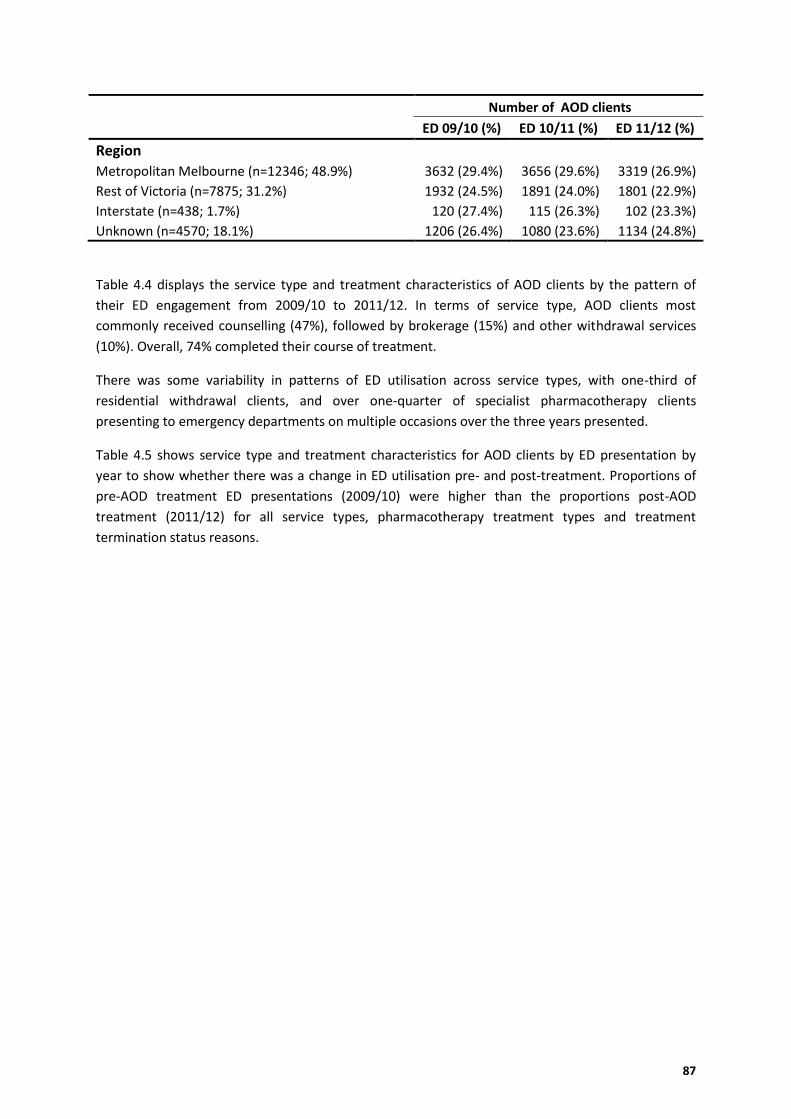
87
Number of AOD clients
ED 09/10 (%) ED 10/11 (%) ED 11/12 (%)
Region Metropolitan Melbourne (n=12346; 48.9%) 3632 (29.4%) 3656 (29.6%) 3319 (26.9%)
Rest of Victoria (n=7875; 31.2%) 1932 (24.5%) 1891 (24.0%) 1801 (22.9%)
Interstate (n=438; 1.7%) 120 (27.4%) 115 (26.3%) 102 (23.3%)
Unknown (n=4570; 18.1%) 1206 (26.4%) 1080 (23.6%) 1134 (24.8%)
Table 4.4 displays the service type and treatment characteristics of AOD clients by the pattern of
their ED engagement from 2009/10 to 2011/12. In terms of service type, AOD clients most
commonly received counselling (47%), followed by brokerage (15%) and other withdrawal services
(10%). Overall, 74% completed their course of treatment.
There was some variability in patterns of ED utilisation across service types, with one-third of
residential withdrawal clients, and over one-quarter of specialist pharmacotherapy clients
presenting to emergency departments on multiple occasions over the three years presented.
Table 4.5 shows service type and treatment characteristics for AOD clients by ED presentation by
year to show whether there was a change in ED utilisation pre- and post-treatment. Proportions of
pre-AOD treatment ED presentations (2009/10) were higher than the proportions post-AOD
treatment (2011/12) for all service types, pharmacotherapy treatment types and treatment
termination status reasons.
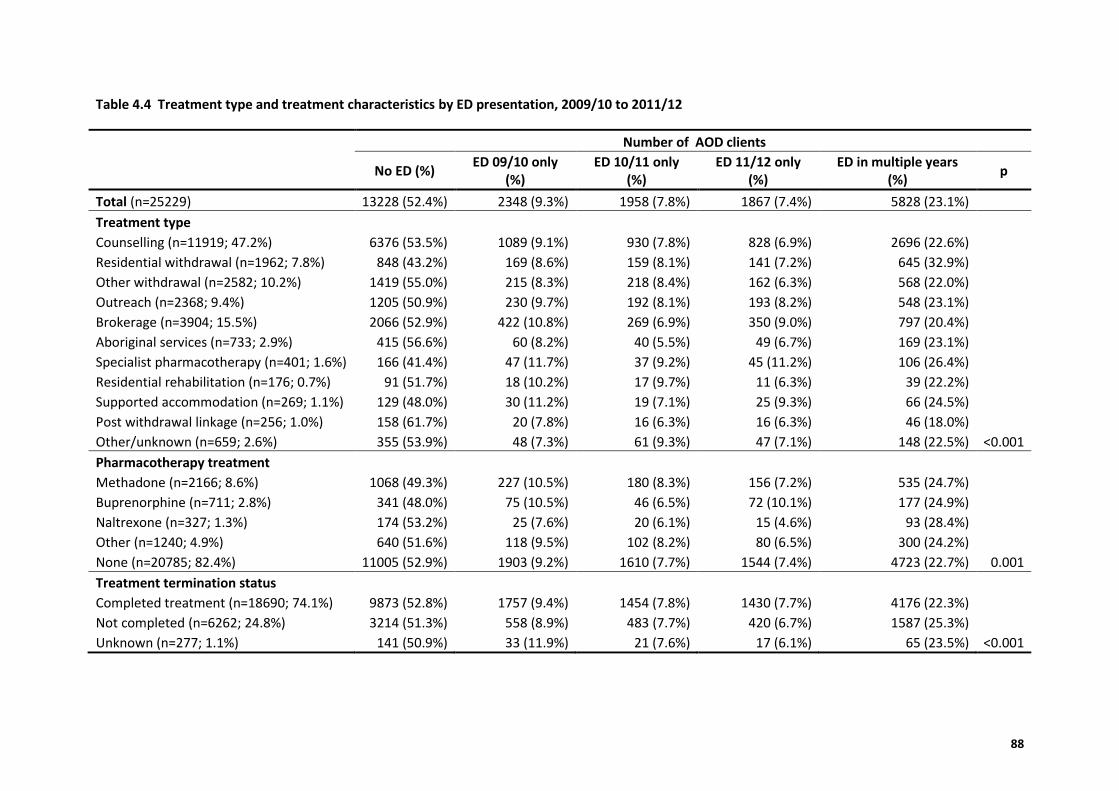
88
Table 4.4 Treatment type and treatment characteristics by ED presentation, 2009/10 to 2011/12
Number of AOD clients
No ED (%) ED 09/10 only
(%) ED 10/11 only
(%) ED 11/12 only
(%) ED in multiple years
(%) p
Total (n=25229) 13228 (52.4%) 2348 (9.3%) 1958 (7.8%) 1867 (7.4%) 5828 (23.1%)
Treatment type
Counselling (n=11919; 47.2%) 6376 (53.5%) 1089 (9.1%) 930 (7.8%) 828 (6.9%) 2696 (22.6%) Residential withdrawal (n=1962; 7.8%) 848 (43.2%) 169 (8.6%) 159 (8.1%) 141 (7.2%) 645 (32.9%) Other withdrawal (n=2582; 10.2%) 1419 (55.0%) 215 (8.3%) 218 (8.4%) 162 (6.3%) 568 (22.0%) Outreach (n=2368; 9.4%) 1205 (50.9%) 230 (9.7%) 192 (8.1%) 193 (8.2%) 548 (23.1%) Brokerage (n=3904; 15.5%) 2066 (52.9%) 422 (10.8%) 269 (6.9%) 350 (9.0%) 797 (20.4%) Aboriginal services (n=733; 2.9%) 415 (56.6%) 60 (8.2%) 40 (5.5%) 49 (6.7%) 169 (23.1%) Specialist pharmacotherapy (n=401; 1.6%) 166 (41.4%) 47 (11.7%) 37 (9.2%) 45 (11.2%) 106 (26.4%) Residential rehabilitation (n=176; 0.7%) 91 (51.7%) 18 (10.2%) 17 (9.7%) 11 (6.3%) 39 (22.2%) Supported accommodation (n=269; 1.1%) 129 (48.0%) 30 (11.2%) 19 (7.1%) 25 (9.3%) 66 (24.5%) Post withdrawal linkage (n=256; 1.0%) 158 (61.7%) 20 (7.8%) 16 (6.3%) 16 (6.3%) 46 (18.0%) Other/unknown (n=659; 2.6%) 355 (53.9%) 48 (7.3%) 61 (9.3%) 47 (7.1%) 148 (22.5%) <0.001
Pharmacotherapy treatment Methadone (n=2166; 8.6%) 1068 (49.3%) 227 (10.5%) 180 (8.3%) 156 (7.2%) 535 (24.7%)
Buprenorphine (n=711; 2.8%) 341 (48.0%) 75 (10.5%) 46 (6.5%) 72 (10.1%) 177 (24.9%) Naltrexone (n=327; 1.3%) 174 (53.2%) 25 (7.6%) 20 (6.1%) 15 (4.6%) 93 (28.4%) Other (n=1240; 4.9%) 640 (51.6%) 118 (9.5%) 102 (8.2%) 80 (6.5%) 300 (24.2%) None (n=20785; 82.4%) 11005 (52.9%) 1903 (9.2%) 1610 (7.7%) 1544 (7.4%) 4723 (22.7%) 0.001
Treatment termination status
Completed treatment (n=18690; 74.1%) 9873 (52.8%) 1757 (9.4%) 1454 (7.8%) 1430 (7.7%) 4176 (22.3%) Not completed (n=6262; 24.8%) 3214 (51.3%) 558 (8.9%) 483 (7.7%) 420 (6.7%) 1587 (25.3%) Unknown (n=277; 1.1%) 141 (50.9%) 33 (11.9%) 21 (7.6%) 17 (6.1%) 65 (23.5%) <0.001
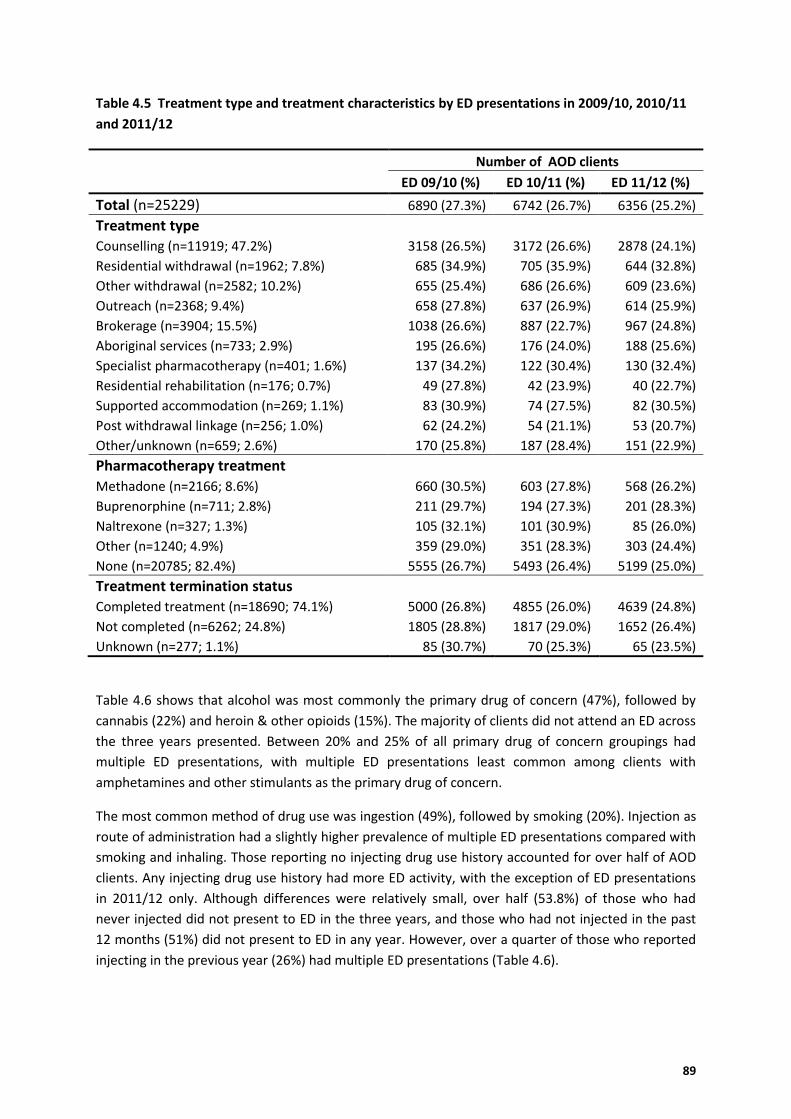
89
Table 4.5 Treatment type and treatment characteristics by ED presentations in 2009/10, 2010/11
and 2011/12
Number of AOD clients
ED 09/10 (%) ED 10/11 (%) ED 11/12 (%)
Total (n=25229) 6890 (27.3%) 6742 (26.7%) 6356 (25.2%)
Treatment type
Counselling (n=11919; 47.2%) 3158 (26.5%) 3172 (26.6%) 2878 (24.1%)
Residential withdrawal (n=1962; 7.8%) 685 (34.9%) 705 (35.9%) 644 (32.8%)
Other withdrawal (n=2582; 10.2%) 655 (25.4%) 686 (26.6%) 609 (23.6%)
Outreach (n=2368; 9.4%) 658 (27.8%) 637 (26.9%) 614 (25.9%)
Brokerage (n=3904; 15.5%) 1038 (26.6%) 887 (22.7%) 967 (24.8%)
Aboriginal services (n=733; 2.9%) 195 (26.6%) 176 (24.0%) 188 (25.6%)
Specialist pharmacotherapy (n=401; 1.6%) 137 (34.2%) 122 (30.4%) 130 (32.4%)
Residential rehabilitation (n=176; 0.7%) 49 (27.8%) 42 (23.9%) 40 (22.7%)
Supported accommodation (n=269; 1.1%) 83 (30.9%) 74 (27.5%) 82 (30.5%)
Post withdrawal linkage (n=256; 1.0%) 62 (24.2%) 54 (21.1%) 53 (20.7%)
Other/unknown (n=659; 2.6%) 170 (25.8%) 187 (28.4%) 151 (22.9%)
Pharmacotherapy treatment Methadone (n=2166; 8.6%) 660 (30.5%) 603 (27.8%) 568 (26.2%)
Buprenorphine (n=711; 2.8%) 211 (29.7%) 194 (27.3%) 201 (28.3%)
Naltrexone (n=327; 1.3%) 105 (32.1%) 101 (30.9%) 85 (26.0%)
Other (n=1240; 4.9%) 359 (29.0%) 351 (28.3%) 303 (24.4%)
None (n=20785; 82.4%) 5555 (26.7%) 5493 (26.4%) 5199 (25.0%)
Treatment termination status
Completed treatment (n=18690; 74.1%) 5000 (26.8%) 4855 (26.0%) 4639 (24.8%)
Not completed (n=6262; 24.8%) 1805 (28.8%) 1817 (29.0%) 1652 (26.4%)
Unknown (n=277; 1.1%) 85 (30.7%) 70 (25.3%) 65 (23.5%)
Table 4.6 shows that alcohol was most commonly the primary drug of concern (47%), followed by
cannabis (22%) and heroin & other opioids (15%). The majority of clients did not attend an ED across
the three years presented. Between 20% and 25% of all primary drug of concern groupings had
multiple ED presentations, with multiple ED presentations least common among clients with
amphetamines and other stimulants as the primary drug of concern.
The most common method of drug use was ingestion (49%), followed by smoking (20%). Injection as
route of administration had a slightly higher prevalence of multiple ED presentations compared with
smoking and inhaling. Those reporting no injecting drug use history accounted for over half of AOD
clients. Any injecting drug use history had more ED activity, with the exception of ED presentations
in 2011/12 only. Although differences were relatively small, over half (53.8%) of those who had
never injected did not present to ED in the three years, and those who had not injected in the past
12 months (51%) did not present to ED in any year. However, over a quarter of those who reported
injecting in the previous year (26%) had multiple ED presentations (Table 4.6).

90
Polydrug use was common, being recorded for 43% of AOD clients. There was little difference across
ED presentations compared with those reporting no polydrug use. Those with polydrug use had a
slightly lower proportion of ED presentations prior to treatment and higher proportion for multiple
ED presentations, however the relationship was not statistically significant (Table 4.6).
Table 4.7 shows these same drug characteristics for AOD clients by ED presentation across the three
years – the year prior to treatment, year of treatment, and the year post-treatment. In general, the
proportions of pre-AOD treatment ED presentations (2009/10) were higher than the proportions of
post-AOD treatment ED presentations (2011/12) with the exception of clients with amphetamines
and other stimulants as the primary drug of concern (no change), and inhalation as a method of use
(no change).
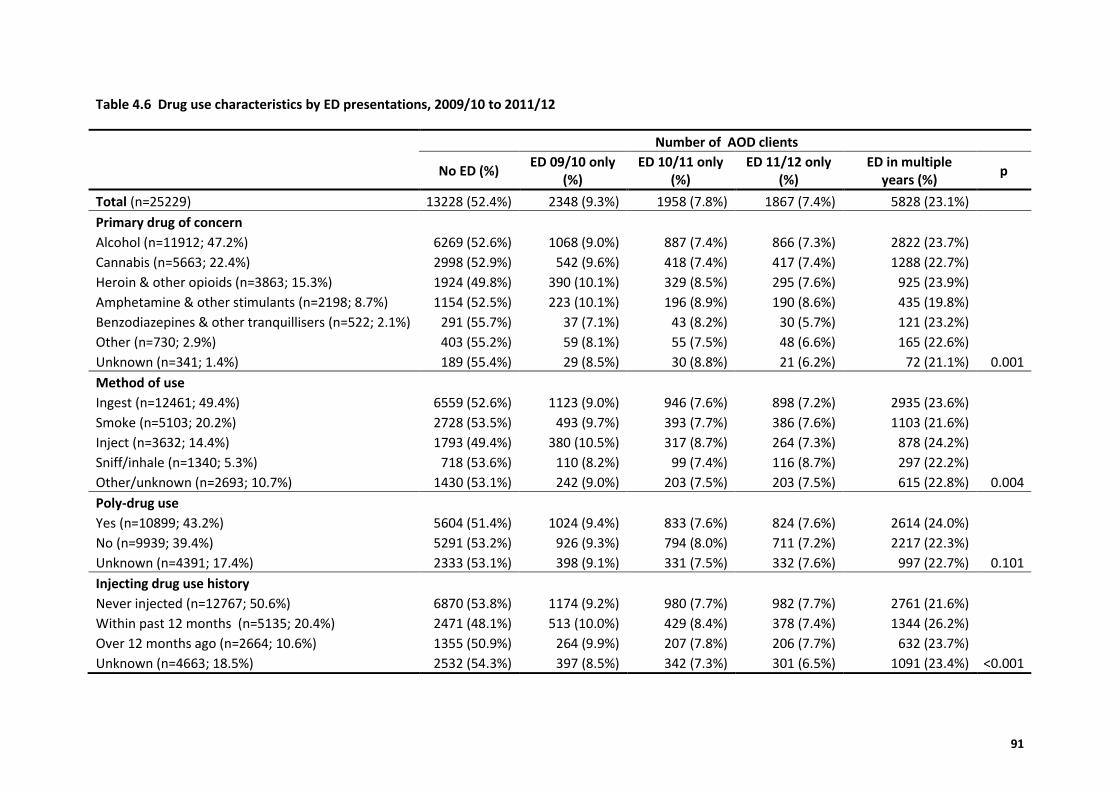
91
Table 4.6 Drug use characteristics by ED presentations, 2009/10 to 2011/12
Number of AOD clients
No ED (%) ED 09/10 only
(%) ED 10/11 only
(%) ED 11/12 only
(%) ED in multiple
years (%) p
Total (n=25229) 13228 (52.4%) 2348 (9.3%) 1958 (7.8%) 1867 (7.4%) 5828 (23.1%)
Primary drug of concern Alcohol (n=11912; 47.2%) 6269 (52.6%) 1068 (9.0%) 887 (7.4%) 866 (7.3%) 2822 (23.7%)
Cannabis (n=5663; 22.4%) 2998 (52.9%) 542 (9.6%) 418 (7.4%) 417 (7.4%) 1288 (22.7%) Heroin & other opioids (n=3863; 15.3%) 1924 (49.8%) 390 (10.1%) 329 (8.5%) 295 (7.6%) 925 (23.9%) Amphetamine & other stimulants (n=2198; 8.7%) 1154 (52.5%) 223 (10.1%) 196 (8.9%) 190 (8.6%) 435 (19.8%) Benzodiazepines & other tranquillisers (n=522; 2.1%) 291 (55.7%) 37 (7.1%) 43 (8.2%) 30 (5.7%) 121 (23.2%) Other (n=730; 2.9%) 403 (55.2%) 59 (8.1%) 55 (7.5%) 48 (6.6%) 165 (22.6%) Unknown (n=341; 1.4%) 189 (55.4%) 29 (8.5%) 30 (8.8%) 21 (6.2%) 72 (21.1%) 0.001
Method of use
Ingest (n=12461; 49.4%) 6559 (52.6%) 1123 (9.0%) 946 (7.6%) 898 (7.2%) 2935 (23.6%) Smoke (n=5103; 20.2%) 2728 (53.5%) 493 (9.7%) 393 (7.7%) 386 (7.6%) 1103 (21.6%) Inject (n=3632; 14.4%) 1793 (49.4%) 380 (10.5%) 317 (8.7%) 264 (7.3%) 878 (24.2%) Sniff/inhale (n=1340; 5.3%) 718 (53.6%) 110 (8.2%) 99 (7.4%) 116 (8.7%) 297 (22.2%) Other/unknown (n=2693; 10.7%) 1430 (53.1%) 242 (9.0%) 203 (7.5%) 203 (7.5%) 615 (22.8%) 0.004
Poly-drug use Yes (n=10899; 43.2%) 5604 (51.4%) 1024 (9.4%) 833 (7.6%) 824 (7.6%) 2614 (24.0%)
No (n=9939; 39.4%) 5291 (53.2%) 926 (9.3%) 794 (8.0%) 711 (7.2%) 2217 (22.3%) Unknown (n=4391; 17.4%) 2333 (53.1%) 398 (9.1%) 331 (7.5%) 332 (7.6%) 997 (22.7%) 0.101
Injecting drug use history
Never injected (n=12767; 50.6%) 6870 (53.8%) 1174 (9.2%) 980 (7.7%) 982 (7.7%) 2761 (21.6%) Within past 12 months (n=5135; 20.4%) 2471 (48.1%) 513 (10.0%) 429 (8.4%) 378 (7.4%) 1344 (26.2%) Over 12 months ago (n=2664; 10.6%) 1355 (50.9%) 264 (9.9%) 207 (7.8%) 206 (7.7%) 632 (23.7%) Unknown (n=4663; 18.5%) 2532 (54.3%) 397 (8.5%) 342 (7.3%) 301 (6.5%) 1091 (23.4%) <0.001
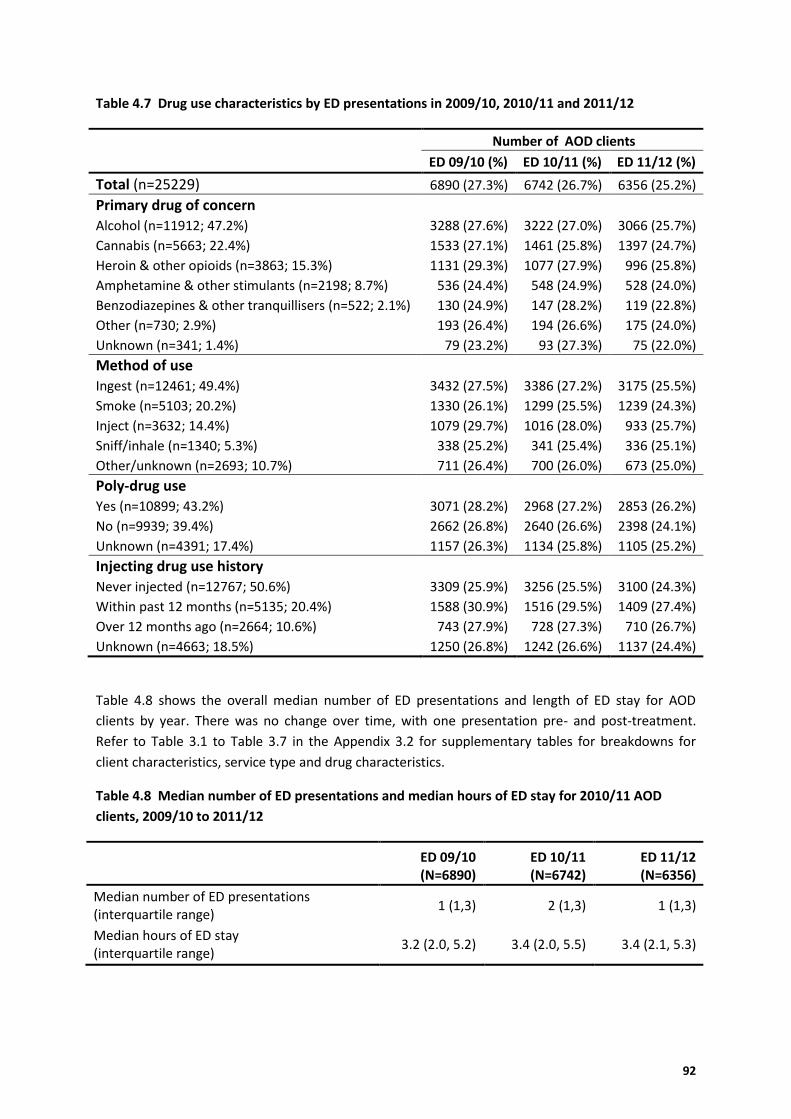
92
Table 4.7 Drug use characteristics by ED presentations in 2009/10, 2010/11 and 2011/12
Number of AOD clients
ED 09/10 (%) ED 10/11 (%) ED 11/12 (%)
Total (n=25229) 6890 (27.3%) 6742 (26.7%) 6356 (25.2%)
Primary drug of concern Alcohol (n=11912; 47.2%) 3288 (27.6%) 3222 (27.0%) 3066 (25.7%)
Cannabis (n=5663; 22.4%) 1533 (27.1%) 1461 (25.8%) 1397 (24.7%)
Heroin & other opioids (n=3863; 15.3%) 1131 (29.3%) 1077 (27.9%) 996 (25.8%)
Amphetamine & other stimulants (n=2198; 8.7%) 536 (24.4%) 548 (24.9%) 528 (24.0%)
Benzodiazepines & other tranquillisers (n=522; 2.1%) 130 (24.9%) 147 (28.2%) 119 (22.8%)
Other (n=730; 2.9%) 193 (26.4%) 194 (26.6%) 175 (24.0%)
Unknown (n=341; 1.4%) 79 (23.2%) 93 (27.3%) 75 (22.0%)
Method of use
Ingest (n=12461; 49.4%) 3432 (27.5%) 3386 (27.2%) 3175 (25.5%)
Smoke (n=5103; 20.2%) 1330 (26.1%) 1299 (25.5%) 1239 (24.3%)
Inject (n=3632; 14.4%) 1079 (29.7%) 1016 (28.0%) 933 (25.7%)
Sniff/inhale (n=1340; 5.3%) 338 (25.2%) 341 (25.4%) 336 (25.1%)
Other/unknown (n=2693; 10.7%) 711 (26.4%) 700 (26.0%) 673 (25.0%)
Poly-drug use Yes (n=10899; 43.2%) 3071 (28.2%) 2968 (27.2%) 2853 (26.2%)
No (n=9939; 39.4%) 2662 (26.8%) 2640 (26.6%) 2398 (24.1%)
Unknown (n=4391; 17.4%) 1157 (26.3%) 1134 (25.8%) 1105 (25.2%)
Injecting drug use history
Never injected (n=12767; 50.6%) 3309 (25.9%) 3256 (25.5%) 3100 (24.3%)
Within past 12 months (n=5135; 20.4%) 1588 (30.9%) 1516 (29.5%) 1409 (27.4%)
Over 12 months ago (n=2664; 10.6%) 743 (27.9%) 728 (27.3%) 710 (26.7%)
Unknown (n=4663; 18.5%) 1250 (26.8%) 1242 (26.6%) 1137 (24.4%)
Table 4.8 shows the overall median number of ED presentations and length of ED stay for AOD
clients by year. There was no change over time, with one presentation pre- and post-treatment.
Refer to Table 3.1 to Table 3.7 in the Appendix 3.2 for supplementary tables for breakdowns for
client characteristics, service type and drug characteristics.
Table 4.8 Median number of ED presentations and median hours of ED stay for 2010/11 AOD
clients, 2009/10 to 2011/12
ED 09/10 (N=6890)
ED 10/11 (N=6742)
ED 11/12 (N=6356)
Median number of ED presentations (interquartile range)
1 (1,3) 2 (1,3) 1 (1,3)
Median hours of ED stay (interquartile range)
3.2 (2.0, 5.2) 3.4 (2.0, 5.5) 3.4 (2.1, 5.3)
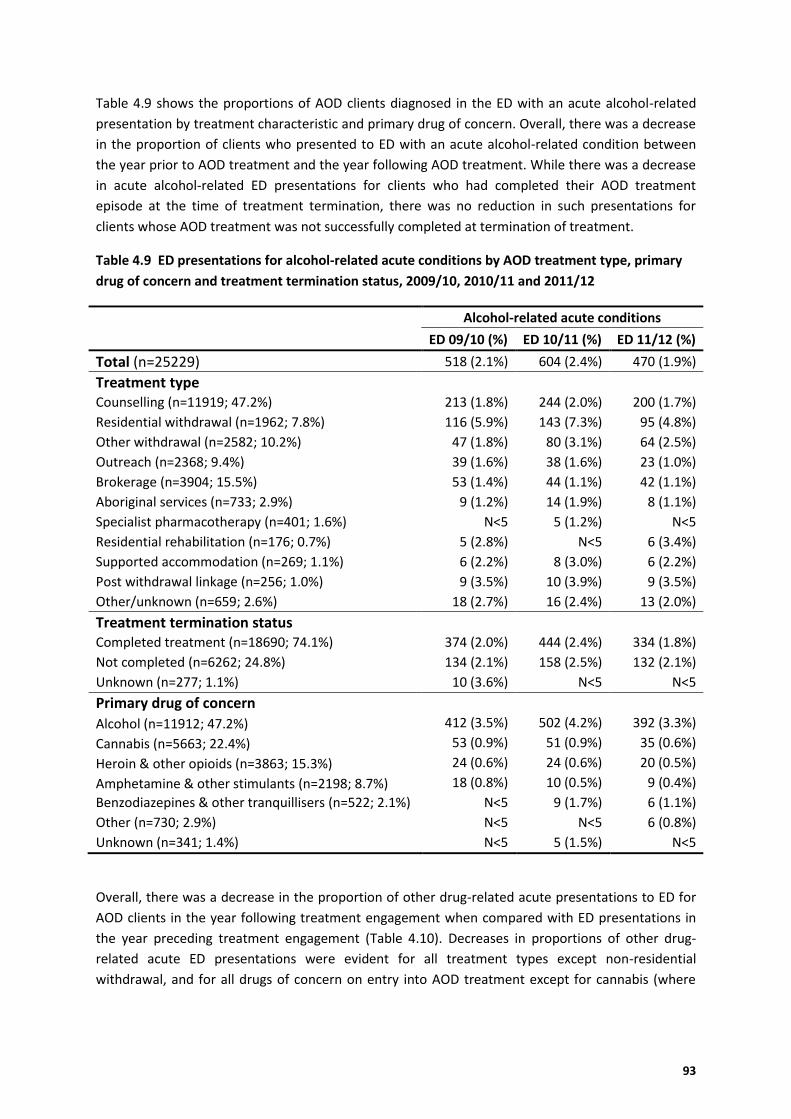
93
Table 4.9 shows the proportions of AOD clients diagnosed in the ED with an acute alcohol-related
presentation by treatment characteristic and primary drug of concern. Overall, there was a decrease
in the proportion of clients who presented to ED with an acute alcohol-related condition between
the year prior to AOD treatment and the year following AOD treatment. While there was a decrease
in acute alcohol-related ED presentations for clients who had completed their AOD treatment
episode at the time of treatment termination, there was no reduction in such presentations for
clients whose AOD treatment was not successfully completed at termination of treatment.
Table 4.9 ED presentations for alcohol-related acute conditions by AOD treatment type, primary
drug of concern and treatment termination status, 2009/10, 2010/11 and 2011/12
Alcohol-related acute conditions
ED 09/10 (%) ED 10/11 (%) ED 11/12 (%)
Total (n=25229) 518 (2.1%) 604 (2.4%) 470 (1.9%)
Treatment type
Counselling (n=11919; 47.2%) 213 (1.8%) 244 (2.0%) 200 (1.7%)
Residential withdrawal (n=1962; 7.8%) 116 (5.9%) 143 (7.3%) 95 (4.8%)
Other withdrawal (n=2582; 10.2%) 47 (1.8%) 80 (3.1%) 64 (2.5%)
Outreach (n=2368; 9.4%) 39 (1.6%) 38 (1.6%) 23 (1.0%)
Brokerage (n=3904; 15.5%) 53 (1.4%) 44 (1.1%) 42 (1.1%)
Aboriginal services (n=733; 2.9%) 9 (1.2%) 14 (1.9%) 8 (1.1%)
Specialist pharmacotherapy (n=401; 1.6%) N<5 5 (1.2%) N<5
Residential rehabilitation (n=176; 0.7%) 5 (2.8%) N<5 6 (3.4%)
Supported accommodation (n=269; 1.1%) 6 (2.2%) 8 (3.0%) 6 (2.2%)
Post withdrawal linkage (n=256; 1.0%) 9 (3.5%) 10 (3.9%) 9 (3.5%)
Other/unknown (n=659; 2.6%) 18 (2.7%) 16 (2.4%) 13 (2.0%)
Treatment termination status
Completed treatment (n=18690; 74.1%) 374 (2.0%) 444 (2.4%) 334 (1.8%)
Not completed (n=6262; 24.8%) 134 (2.1%) 158 (2.5%) 132 (2.1%)
Unknown (n=277; 1.1%) 10 (3.6%) N<5 N<5
Primary drug of concern
Alcohol (n=11912; 47.2%) 412 (3.5%) 502 (4.2%) 392 (3.3%)
Cannabis (n=5663; 22.4%) 53 (0.9%) 51 (0.9%) 35 (0.6%)
Heroin & other opioids (n=3863; 15.3%) 24 (0.6%) 24 (0.6%) 20 (0.5%)
Amphetamine & other stimulants (n=2198; 8.7%) 18 (0.8%) 10 (0.5%) 9 (0.4%)
Benzodiazepines & other tranquillisers (n=522; 2.1%) N<5 9 (1.7%) 6 (1.1%)
Other (n=730; 2.9%) N<5 N<5 6 (0.8%)
Unknown (n=341; 1.4%) N<5 5 (1.5%) N<5
Overall, there was a decrease in the proportion of other drug-related acute presentations to ED for
AOD clients in the year following treatment engagement when compared with ED presentations in
the year preceding treatment engagement (Table 4.10). Decreases in proportions of other drug-
related acute ED presentations were evident for all treatment types except non-residential
withdrawal, and for all drugs of concern on entry into AOD treatment except for cannabis (where
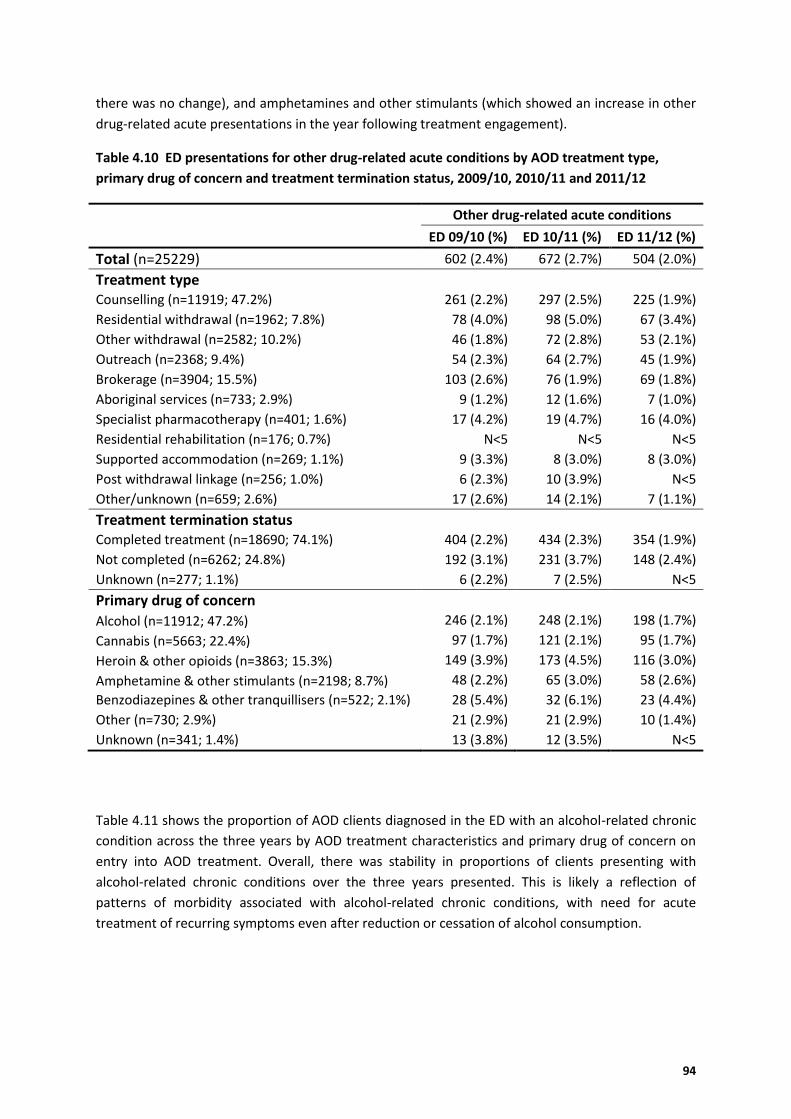
94
there was no change), and amphetamines and other stimulants (which showed an increase in other
drug-related acute presentations in the year following treatment engagement).
Table 4.10 ED presentations for other drug-related acute conditions by AOD treatment type,
primary drug of concern and treatment termination status, 2009/10, 2010/11 and 2011/12
Other drug-related acute conditions
ED 09/10 (%) ED 10/11 (%) ED 11/12 (%)
Total (n=25229) 602 (2.4%) 672 (2.7%) 504 (2.0%)
Treatment type
Counselling (n=11919; 47.2%) 261 (2.2%) 297 (2.5%) 225 (1.9%)
Residential withdrawal (n=1962; 7.8%) 78 (4.0%) 98 (5.0%) 67 (3.4%)
Other withdrawal (n=2582; 10.2%) 46 (1.8%) 72 (2.8%) 53 (2.1%)
Outreach (n=2368; 9.4%) 54 (2.3%) 64 (2.7%) 45 (1.9%)
Brokerage (n=3904; 15.5%) 103 (2.6%) 76 (1.9%) 69 (1.8%)
Aboriginal services (n=733; 2.9%) 9 (1.2%) 12 (1.6%) 7 (1.0%)
Specialist pharmacotherapy (n=401; 1.6%) 17 (4.2%) 19 (4.7%) 16 (4.0%)
Residential rehabilitation (n=176; 0.7%) N<5 N<5 N<5
Supported accommodation (n=269; 1.1%) 9 (3.3%) 8 (3.0%) 8 (3.0%)
Post withdrawal linkage (n=256; 1.0%) 6 (2.3%) 10 (3.9%) N<5
Other/unknown (n=659; 2.6%) 17 (2.6%) 14 (2.1%) 7 (1.1%)
Treatment termination status
Completed treatment (n=18690; 74.1%) 404 (2.2%) 434 (2.3%) 354 (1.9%)
Not completed (n=6262; 24.8%) 192 (3.1%) 231 (3.7%) 148 (2.4%)
Unknown (n=277; 1.1%) 6 (2.2%) 7 (2.5%) N<5
Primary drug of concern
Alcohol (n=11912; 47.2%) 246 (2.1%) 248 (2.1%) 198 (1.7%)
Cannabis (n=5663; 22.4%) 97 (1.7%) 121 (2.1%) 95 (1.7%)
Heroin & other opioids (n=3863; 15.3%) 149 (3.9%) 173 (4.5%) 116 (3.0%)
Amphetamine & other stimulants (n=2198; 8.7%) 48 (2.2%) 65 (3.0%) 58 (2.6%)
Benzodiazepines & other tranquillisers (n=522; 2.1%) 28 (5.4%) 32 (6.1%) 23 (4.4%)
Other (n=730; 2.9%) 21 (2.9%) 21 (2.9%) 10 (1.4%)
Unknown (n=341; 1.4%) 13 (3.8%) 12 (3.5%) N<5
Table 4.11 shows the proportion of AOD clients diagnosed in the ED with an alcohol-related chronic
condition across the three years by AOD treatment characteristics and primary drug of concern on
entry into AOD treatment. Overall, there was stability in proportions of clients presenting with
alcohol-related chronic conditions over the three years presented. This is likely a reflection of
patterns of morbidity associated with alcohol-related chronic conditions, with need for acute
treatment of recurring symptoms even after reduction or cessation of alcohol consumption.
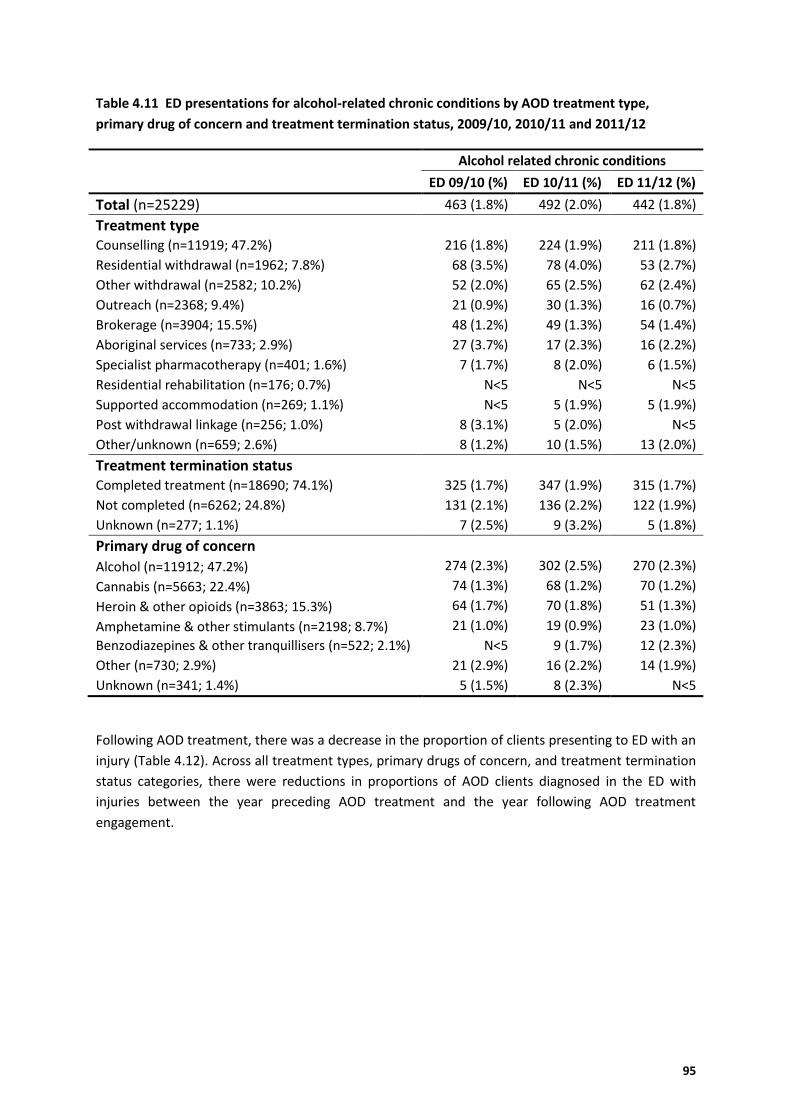
95
Table 4.11 ED presentations for alcohol-related chronic conditions by AOD treatment type,
primary drug of concern and treatment termination status, 2009/10, 2010/11 and 2011/12
Alcohol related chronic conditions
ED 09/10 (%) ED 10/11 (%) ED 11/12 (%)
Total (n=25229) 463 (1.8%) 492 (2.0%) 442 (1.8%)
Treatment type
Counselling (n=11919; 47.2%) 216 (1.8%) 224 (1.9%) 211 (1.8%)
Residential withdrawal (n=1962; 7.8%) 68 (3.5%) 78 (4.0%) 53 (2.7%)
Other withdrawal (n=2582; 10.2%) 52 (2.0%) 65 (2.5%) 62 (2.4%)
Outreach (n=2368; 9.4%) 21 (0.9%) 30 (1.3%) 16 (0.7%)
Brokerage (n=3904; 15.5%) 48 (1.2%) 49 (1.3%) 54 (1.4%)
Aboriginal services (n=733; 2.9%) 27 (3.7%) 17 (2.3%) 16 (2.2%)
Specialist pharmacotherapy (n=401; 1.6%) 7 (1.7%) 8 (2.0%) 6 (1.5%)
Residential rehabilitation (n=176; 0.7%) N<5 N<5 N<5
Supported accommodation (n=269; 1.1%) N<5 5 (1.9%) 5 (1.9%)
Post withdrawal linkage (n=256; 1.0%) 8 (3.1%) 5 (2.0%) N<5
Other/unknown (n=659; 2.6%) 8 (1.2%) 10 (1.5%) 13 (2.0%)
Treatment termination status
Completed treatment (n=18690; 74.1%) 325 (1.7%) 347 (1.9%) 315 (1.7%)
Not completed (n=6262; 24.8%) 131 (2.1%) 136 (2.2%) 122 (1.9%)
Unknown (n=277; 1.1%) 7 (2.5%) 9 (3.2%) 5 (1.8%)
Primary drug of concern
Alcohol (n=11912; 47.2%) 274 (2.3%) 302 (2.5%) 270 (2.3%)
Cannabis (n=5663; 22.4%) 74 (1.3%) 68 (1.2%) 70 (1.2%)
Heroin & other opioids (n=3863; 15.3%) 64 (1.7%) 70 (1.8%) 51 (1.3%)
Amphetamine & other stimulants (n=2198; 8.7%) 21 (1.0%) 19 (0.9%) 23 (1.0%)
Benzodiazepines & other tranquillisers (n=522; 2.1%) N<5 9 (1.7%) 12 (2.3%)
Other (n=730; 2.9%) 21 (2.9%) 16 (2.2%) 14 (1.9%)
Unknown (n=341; 1.4%) 5 (1.5%) 8 (2.3%) N<5
Following AOD treatment, there was a decrease in the proportion of clients presenting to ED with an
injury (Table 4.12). Across all treatment types, primary drugs of concern, and treatment termination
status categories, there were reductions in proportions of AOD clients diagnosed in the ED with
injuries between the year preceding AOD treatment and the year following AOD treatment
engagement.
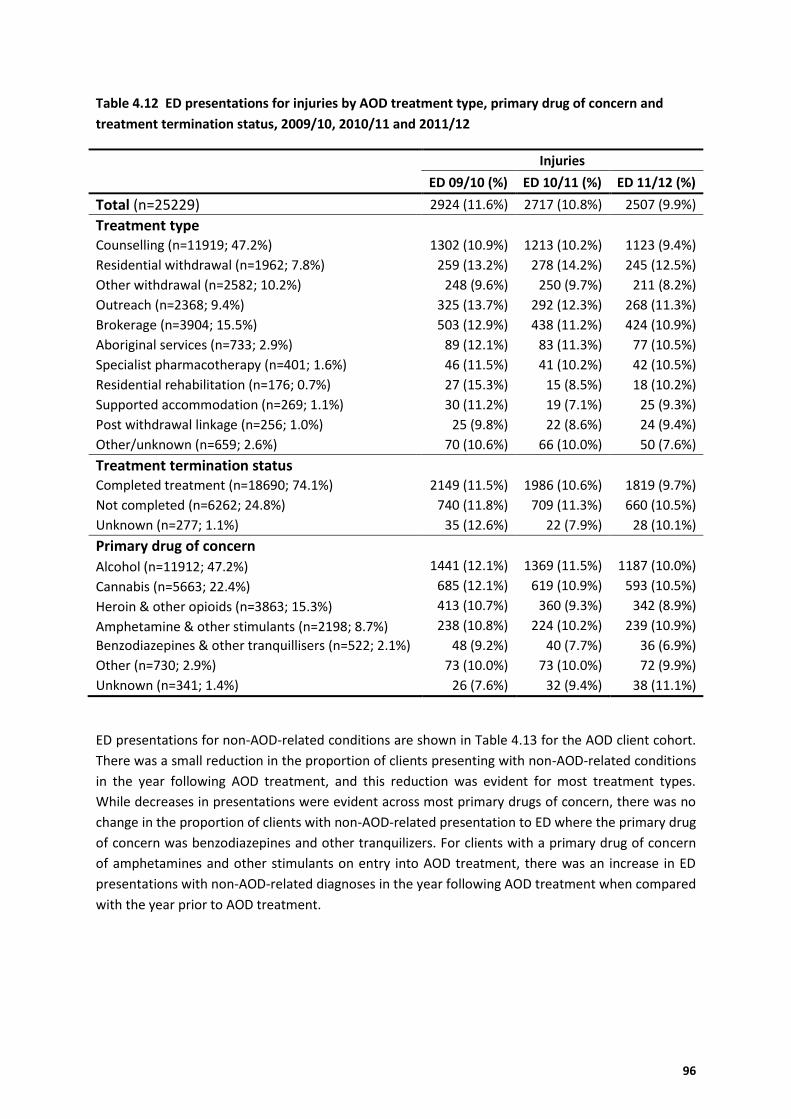
96
Table 4.12 ED presentations for injuries by AOD treatment type, primary drug of concern and
treatment termination status, 2009/10, 2010/11 and 2011/12
Injuries
ED 09/10 (%) ED 10/11 (%) ED 11/12 (%)
Total (n=25229) 2924 (11.6%) 2717 (10.8%) 2507 (9.9%)
Treatment type
Counselling (n=11919; 47.2%) 1302 (10.9%) 1213 (10.2%) 1123 (9.4%)
Residential withdrawal (n=1962; 7.8%) 259 (13.2%) 278 (14.2%) 245 (12.5%)
Other withdrawal (n=2582; 10.2%) 248 (9.6%) 250 (9.7%) 211 (8.2%)
Outreach (n=2368; 9.4%) 325 (13.7%) 292 (12.3%) 268 (11.3%)
Brokerage (n=3904; 15.5%) 503 (12.9%) 438 (11.2%) 424 (10.9%)
Aboriginal services (n=733; 2.9%) 89 (12.1%) 83 (11.3%) 77 (10.5%)
Specialist pharmacotherapy (n=401; 1.6%) 46 (11.5%) 41 (10.2%) 42 (10.5%)
Residential rehabilitation (n=176; 0.7%) 27 (15.3%) 15 (8.5%) 18 (10.2%)
Supported accommodation (n=269; 1.1%) 30 (11.2%) 19 (7.1%) 25 (9.3%)
Post withdrawal linkage (n=256; 1.0%) 25 (9.8%) 22 (8.6%) 24 (9.4%)
Other/unknown (n=659; 2.6%) 70 (10.6%) 66 (10.0%) 50 (7.6%)
Treatment termination status
Completed treatment (n=18690; 74.1%) 2149 (11.5%) 1986 (10.6%) 1819 (9.7%)
Not completed (n=6262; 24.8%) 740 (11.8%) 709 (11.3%) 660 (10.5%)
Unknown (n=277; 1.1%) 35 (12.6%) 22 (7.9%) 28 (10.1%)
Primary drug of concern
Alcohol (n=11912; 47.2%) 1441 (12.1%) 1369 (11.5%) 1187 (10.0%)
Cannabis (n=5663; 22.4%) 685 (12.1%) 619 (10.9%) 593 (10.5%)
Heroin & other opioids (n=3863; 15.3%) 413 (10.7%) 360 (9.3%) 342 (8.9%)
Amphetamine & other stimulants (n=2198; 8.7%) 238 (10.8%) 224 (10.2%) 239 (10.9%)
Benzodiazepines & other tranquillisers (n=522; 2.1%) 48 (9.2%) 40 (7.7%) 36 (6.9%)
Other (n=730; 2.9%) 73 (10.0%) 73 (10.0%) 72 (9.9%)
Unknown (n=341; 1.4%) 26 (7.6%) 32 (9.4%) 38 (11.1%)
ED presentations for non-AOD-related conditions are shown in Table 4.13 for the AOD client cohort.
There was a small reduction in the proportion of clients presenting with non-AOD-related conditions
in the year following AOD treatment, and this reduction was evident for most treatment types.
While decreases in presentations were evident across most primary drugs of concern, there was no
change in the proportion of clients with non-AOD-related presentation to ED where the primary drug
of concern was benzodiazepines and other tranquilizers. For clients with a primary drug of concern
of amphetamines and other stimulants on entry into AOD treatment, there was an increase in ED
presentations with non-AOD-related diagnoses in the year following AOD treatment when compared
with the year prior to AOD treatment.
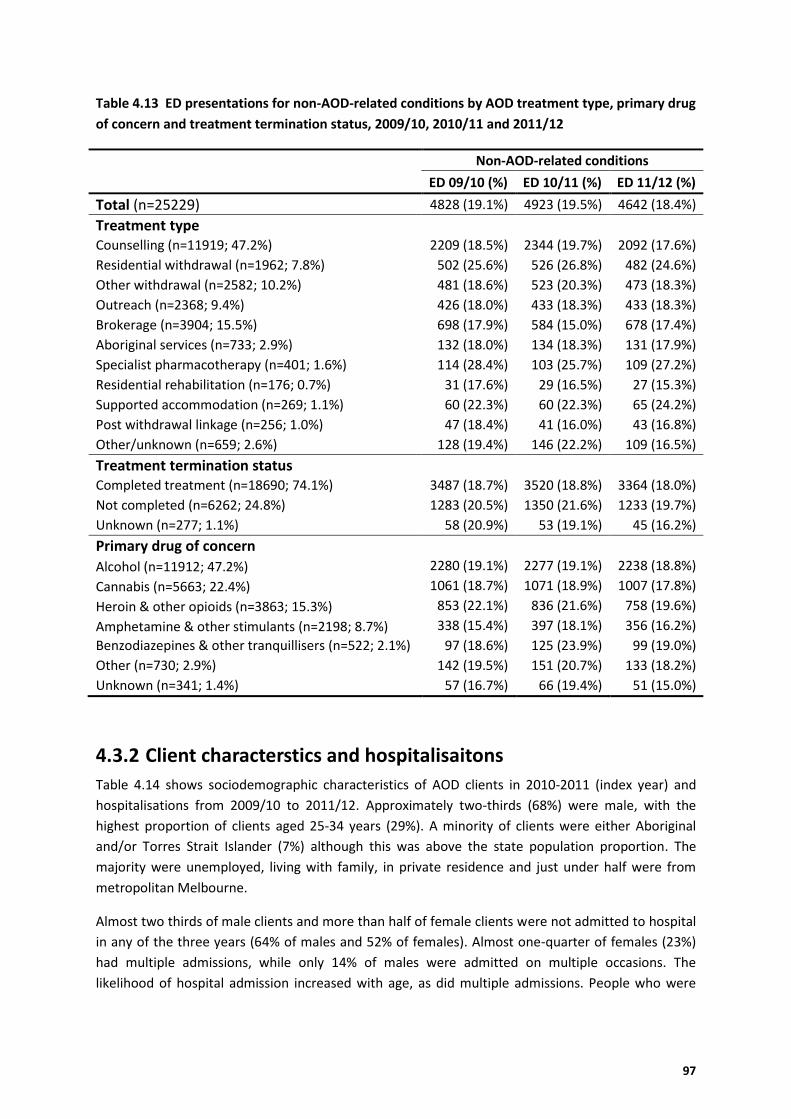
97
Table 4.13 ED presentations for non-AOD-related conditions by AOD treatment type, primary drug
of concern and treatment termination status, 2009/10, 2010/11 and 2011/12
Non-AOD-related conditions
ED 09/10 (%) ED 10/11 (%) ED 11/12 (%)
Total (n=25229) 4828 (19.1%) 4923 (19.5%) 4642 (18.4%)
Treatment type
Counselling (n=11919; 47.2%) 2209 (18.5%) 2344 (19.7%) 2092 (17.6%)
Residential withdrawal (n=1962; 7.8%) 502 (25.6%) 526 (26.8%) 482 (24.6%)
Other withdrawal (n=2582; 10.2%) 481 (18.6%) 523 (20.3%) 473 (18.3%)
Outreach (n=2368; 9.4%) 426 (18.0%) 433 (18.3%) 433 (18.3%)
Brokerage (n=3904; 15.5%) 698 (17.9%) 584 (15.0%) 678 (17.4%)
Aboriginal services (n=733; 2.9%) 132 (18.0%) 134 (18.3%) 131 (17.9%)
Specialist pharmacotherapy (n=401; 1.6%) 114 (28.4%) 103 (25.7%) 109 (27.2%)
Residential rehabilitation (n=176; 0.7%) 31 (17.6%) 29 (16.5%) 27 (15.3%)
Supported accommodation (n=269; 1.1%) 60 (22.3%) 60 (22.3%) 65 (24.2%)
Post withdrawal linkage (n=256; 1.0%) 47 (18.4%) 41 (16.0%) 43 (16.8%)
Other/unknown (n=659; 2.6%) 128 (19.4%) 146 (22.2%) 109 (16.5%)
Treatment termination status
Completed treatment (n=18690; 74.1%) 3487 (18.7%) 3520 (18.8%) 3364 (18.0%)
Not completed (n=6262; 24.8%) 1283 (20.5%) 1350 (21.6%) 1233 (19.7%)
Unknown (n=277; 1.1%) 58 (20.9%) 53 (19.1%) 45 (16.2%)
Primary drug of concern
Alcohol (n=11912; 47.2%) 2280 (19.1%) 2277 (19.1%) 2238 (18.8%)
Cannabis (n=5663; 22.4%) 1061 (18.7%) 1071 (18.9%) 1007 (17.8%)
Heroin & other opioids (n=3863; 15.3%) 853 (22.1%) 836 (21.6%) 758 (19.6%)
Amphetamine & other stimulants (n=2198; 8.7%) 338 (15.4%) 397 (18.1%) 356 (16.2%)
Benzodiazepines & other tranquillisers (n=522; 2.1%) 97 (18.6%) 125 (23.9%) 99 (19.0%)
Other (n=730; 2.9%) 142 (19.5%) 151 (20.7%) 133 (18.2%)
Unknown (n=341; 1.4%) 57 (16.7%) 66 (19.4%) 51 (15.0%)
4.3.2 Client characterstics and hospitalisaitons
Table 4.14 shows sociodemographic characteristics of AOD clients in 2010-2011 (index year) and
hospitalisations from 2009/10 to 2011/12. Approximately two-thirds (68%) were male, with the
highest proportion of clients aged 25-34 years (29%). A minority of clients were either Aboriginal
and/or Torres Strait Islander (7%) although this was above the state population proportion. The
majority were unemployed, living with family, in private residence and just under half were from
metropolitan Melbourne.
Almost two thirds of male clients and more than half of female clients were not admitted to hospital
in any of the three years (64% of males and 52% of females). Almost one-quarter of females (23%)
had multiple admissions, while only 14% of males were admitted on multiple occasions. The
likelihood of hospital admission increased with age, as did multiple admissions. People who were

98
under 35 years, employed, living with family, and from metropolitan Melbourne were least likely to
be hospitalised across the three years of interest.
In general, the proportions of pre-AOD treatment hospital admissions (2009/10) were higher than
the proportions following AOD treatment engagement (2011/12). This pattern was evident for
gender, age groups (with the exception of clients under 15 years and between 55-64 years), country
of birth, Indigenous status, employment type, living status, accommodation status (except for those
in custody), homeless status and region (Table 4.15).
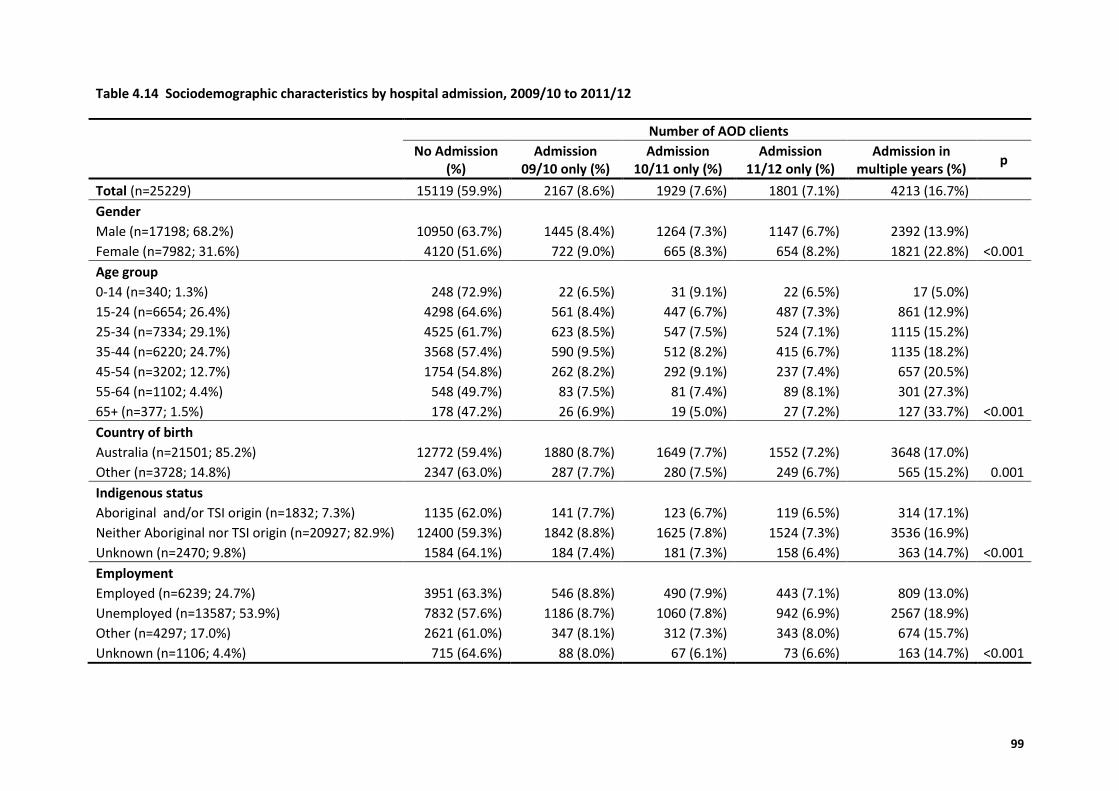
99
Table 4.14 Sociodemographic characteristics by hospital admission, 2009/10 to 2011/12
Number of AOD clients
No Admission (%)
Admission 09/10 only (%)
Admission 10/11 only (%)
Admission 11/12 only (%)
Admission in multiple years (%)
p
Total (n=25229) 15119 (59.9%) 2167 (8.6%) 1929 (7.6%) 1801 (7.1%) 4213 (16.7%)
Gender
Male (n=17198; 68.2%) 10950 (63.7%) 1445 (8.4%) 1264 (7.3%) 1147 (6.7%) 2392 (13.9%) Female (n=7982; 31.6%) 4120 (51.6%) 722 (9.0%) 665 (8.3%) 654 (8.2%) 1821 (22.8%) <0.001
Age group 0-14 (n=340; 1.3%) 248 (72.9%) 22 (6.5%) 31 (9.1%) 22 (6.5%) 17 (5.0%)
15-24 (n=6654; 26.4%) 4298 (64.6%) 561 (8.4%) 447 (6.7%) 487 (7.3%) 861 (12.9%) 25-34 (n=7334; 29.1%) 4525 (61.7%) 623 (8.5%) 547 (7.5%) 524 (7.1%) 1115 (15.2%) 35-44 (n=6220; 24.7%) 3568 (57.4%) 590 (9.5%) 512 (8.2%) 415 (6.7%) 1135 (18.2%) 45-54 (n=3202; 12.7%) 1754 (54.8%) 262 (8.2%) 292 (9.1%) 237 (7.4%) 657 (20.5%) 55-64 (n=1102; 4.4%) 548 (49.7%) 83 (7.5%) 81 (7.4%) 89 (8.1%) 301 (27.3%) 65+ (n=377; 1.5%) 178 (47.2%) 26 (6.9%) 19 (5.0%) 27 (7.2%) 127 (33.7%) <0.001
Country of birth
Australia (n=21501; 85.2%) 12772 (59.4%) 1880 (8.7%) 1649 (7.7%) 1552 (7.2%) 3648 (17.0%) Other (n=3728; 14.8%) 2347 (63.0%) 287 (7.7%) 280 (7.5%) 249 (6.7%) 565 (15.2%) 0.001
Indigenous status
Aboriginal and/or TSI origin (n=1832; 7.3%) 1135 (62.0%) 141 (7.7%) 123 (6.7%) 119 (6.5%) 314 (17.1%) Neither Aboriginal nor TSI origin (n=20927; 82.9%) 12400 (59.3%) 1842 (8.8%) 1625 (7.8%) 1524 (7.3%) 3536 (16.9%) Unknown (n=2470; 9.8%) 1584 (64.1%) 184 (7.4%) 181 (7.3%) 158 (6.4%) 363 (14.7%) <0.001
Employment Employed (n=6239; 24.7%) 3951 (63.3%) 546 (8.8%) 490 (7.9%) 443 (7.1%) 809 (13.0%)
Unemployed (n=13587; 53.9%) 7832 (57.6%) 1186 (8.7%) 1060 (7.8%) 942 (6.9%) 2567 (18.9%) Other (n=4297; 17.0%) 2621 (61.0%) 347 (8.1%) 312 (7.3%) 343 (8.0%) 674 (15.7%) Unknown (n=1106; 4.4%) 715 (64.6%) 88 (8.0%) 67 (6.1%) 73 (6.6%) 163 (14.7%) <0.001
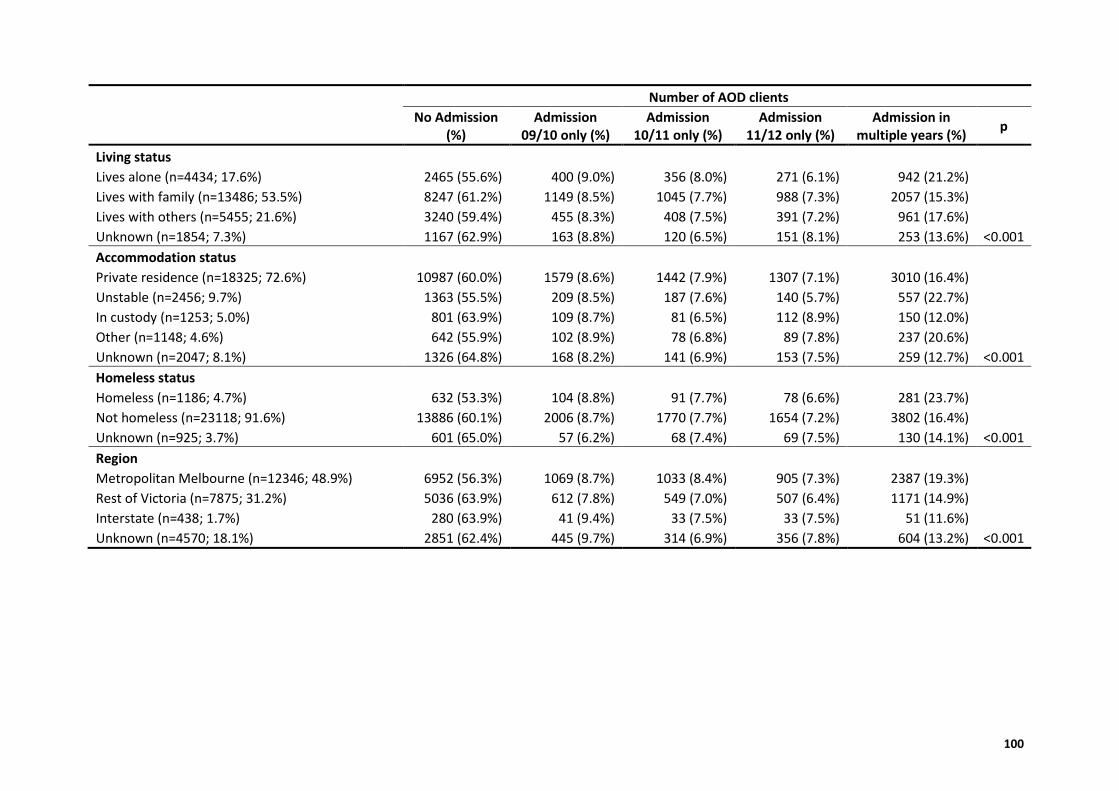
100
Number of AOD clients
No Admission (%)
Admission 09/10 only (%)
Admission 10/11 only (%)
Admission 11/12 only (%)
Admission in multiple years (%)
p
Living status
Lives alone (n=4434; 17.6%) 2465 (55.6%) 400 (9.0%) 356 (8.0%) 271 (6.1%) 942 (21.2%) Lives with family (n=13486; 53.5%) 8247 (61.2%) 1149 (8.5%) 1045 (7.7%) 988 (7.3%) 2057 (15.3%) Lives with others (n=5455; 21.6%) 3240 (59.4%) 455 (8.3%) 408 (7.5%) 391 (7.2%) 961 (17.6%) Unknown (n=1854; 7.3%) 1167 (62.9%) 163 (8.8%) 120 (6.5%) 151 (8.1%) 253 (13.6%) <0.001
Accommodation status Private residence (n=18325; 72.6%) 10987 (60.0%) 1579 (8.6%) 1442 (7.9%) 1307 (7.1%) 3010 (16.4%)
Unstable (n=2456; 9.7%) 1363 (55.5%) 209 (8.5%) 187 (7.6%) 140 (5.7%) 557 (22.7%) In custody (n=1253; 5.0%) 801 (63.9%) 109 (8.7%) 81 (6.5%) 112 (8.9%) 150 (12.0%) Other (n=1148; 4.6%) 642 (55.9%) 102 (8.9%) 78 (6.8%) 89 (7.8%) 237 (20.6%) Unknown (n=2047; 8.1%) 1326 (64.8%) 168 (8.2%) 141 (6.9%) 153 (7.5%) 259 (12.7%) <0.001
Homeless status
Homeless (n=1186; 4.7%) 632 (53.3%) 104 (8.8%) 91 (7.7%) 78 (6.6%) 281 (23.7%) Not homeless (n=23118; 91.6%) 13886 (60.1%) 2006 (8.7%) 1770 (7.7%) 1654 (7.2%) 3802 (16.4%) Unknown (n=925; 3.7%) 601 (65.0%) 57 (6.2%) 68 (7.4%) 69 (7.5%) 130 (14.1%) <0.001
Region Metropolitan Melbourne (n=12346; 48.9%) 6952 (56.3%) 1069 (8.7%) 1033 (8.4%) 905 (7.3%) 2387 (19.3%)
Rest of Victoria (n=7875; 31.2%) 5036 (63.9%) 612 (7.8%) 549 (7.0%) 507 (6.4%) 1171 (14.9%) Interstate (n=438; 1.7%) 280 (63.9%) 41 (9.4%) 33 (7.5%) 33 (7.5%) 51 (11.6%) Unknown (n=4570; 18.1%) 2851 (62.4%) 445 (9.7%) 314 (6.9%) 356 (7.8%) 604 (13.2%) <0.001
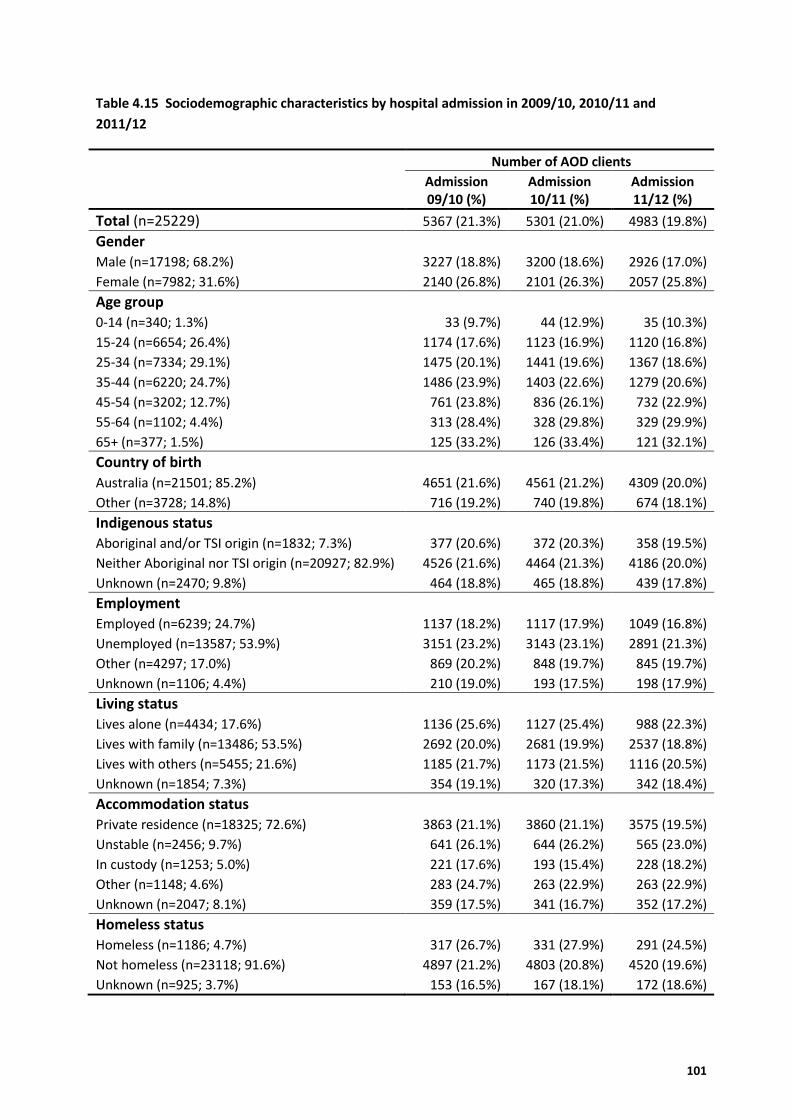
101
Table 4.15 Sociodemographic characteristics by hospital admission in 2009/10, 2010/11 and
2011/12
Number of AOD clients
Admission 09/10 (%)
Admission 10/11 (%)
Admission 11/12 (%)
Total (n=25229) 5367 (21.3%) 5301 (21.0%) 4983 (19.8%)
Gender
Male (n=17198; 68.2%) 3227 (18.8%) 3200 (18.6%) 2926 (17.0%)
Female (n=7982; 31.6%) 2140 (26.8%) 2101 (26.3%) 2057 (25.8%)
Age group 0-14 (n=340; 1.3%) 33 (9.7%) 44 (12.9%) 35 (10.3%)
15-24 (n=6654; 26.4%) 1174 (17.6%) 1123 (16.9%) 1120 (16.8%)
25-34 (n=7334; 29.1%) 1475 (20.1%) 1441 (19.6%) 1367 (18.6%)
35-44 (n=6220; 24.7%) 1486 (23.9%) 1403 (22.6%) 1279 (20.6%)
45-54 (n=3202; 12.7%) 761 (23.8%) 836 (26.1%) 732 (22.9%)
55-64 (n=1102; 4.4%) 313 (28.4%) 328 (29.8%) 329 (29.9%)
65+ (n=377; 1.5%) 125 (33.2%) 126 (33.4%) 121 (32.1%)
Country of birth
Australia (n=21501; 85.2%) 4651 (21.6%) 4561 (21.2%) 4309 (20.0%)
Other (n=3728; 14.8%) 716 (19.2%) 740 (19.8%) 674 (18.1%)
Indigenous status
Aboriginal and/or TSI origin (n=1832; 7.3%) 377 (20.6%) 372 (20.3%) 358 (19.5%)
Neither Aboriginal nor TSI origin (n=20927; 82.9%) 4526 (21.6%) 4464 (21.3%) 4186 (20.0%)
Unknown (n=2470; 9.8%) 464 (18.8%) 465 (18.8%) 439 (17.8%)
Employment Employed (n=6239; 24.7%) 1137 (18.2%) 1117 (17.9%) 1049 (16.8%)
Unemployed (n=13587; 53.9%) 3151 (23.2%) 3143 (23.1%) 2891 (21.3%)
Other (n=4297; 17.0%) 869 (20.2%) 848 (19.7%) 845 (19.7%)
Unknown (n=1106; 4.4%) 210 (19.0%) 193 (17.5%) 198 (17.9%)
Living status
Lives alone (n=4434; 17.6%) 1136 (25.6%) 1127 (25.4%) 988 (22.3%)
Lives with family (n=13486; 53.5%) 2692 (20.0%) 2681 (19.9%) 2537 (18.8%)
Lives with others (n=5455; 21.6%) 1185 (21.7%) 1173 (21.5%) 1116 (20.5%)
Unknown (n=1854; 7.3%) 354 (19.1%) 320 (17.3%) 342 (18.4%)
Accommodation status Private residence (n=18325; 72.6%) 3863 (21.1%) 3860 (21.1%) 3575 (19.5%)
Unstable (n=2456; 9.7%) 641 (26.1%) 644 (26.2%) 565 (23.0%)
In custody (n=1253; 5.0%) 221 (17.6%) 193 (15.4%) 228 (18.2%)
Other (n=1148; 4.6%) 283 (24.7%) 263 (22.9%) 263 (22.9%)
Unknown (n=2047; 8.1%) 359 (17.5%) 341 (16.7%) 352 (17.2%)
Homeless status
Homeless (n=1186; 4.7%) 317 (26.7%) 331 (27.9%) 291 (24.5%)
Not homeless (n=23118; 91.6%) 4897 (21.2%) 4803 (20.8%) 4520 (19.6%)
Unknown (n=925; 3.7%) 153 (16.5%) 167 (18.1%) 172 (18.6%)
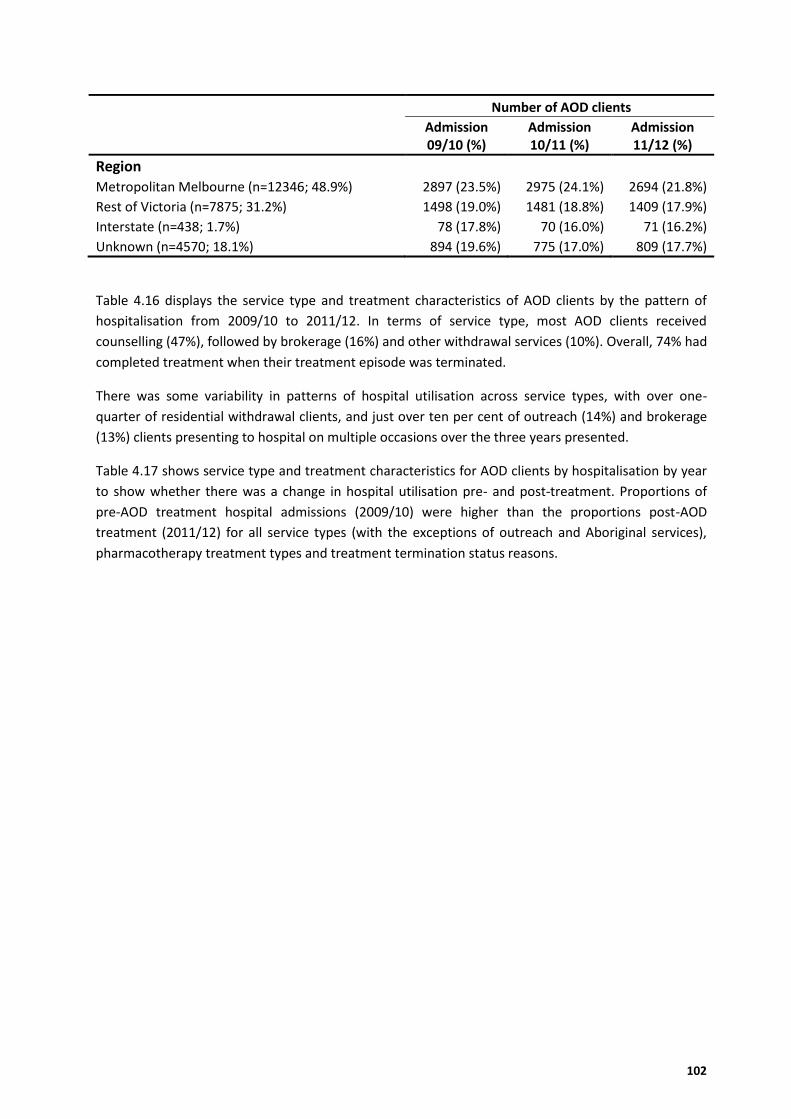
102
Number of AOD clients
Admission 09/10 (%)
Admission 10/11 (%)
Admission 11/12 (%)
Region Metropolitan Melbourne (n=12346; 48.9%) 2897 (23.5%) 2975 (24.1%) 2694 (21.8%)
Rest of Victoria (n=7875; 31.2%) 1498 (19.0%) 1481 (18.8%) 1409 (17.9%)
Interstate (n=438; 1.7%) 78 (17.8%) 70 (16.0%) 71 (16.2%)
Unknown (n=4570; 18.1%) 894 (19.6%) 775 (17.0%) 809 (17.7%)
Table 4.16 displays the service type and treatment characteristics of AOD clients by the pattern of
hospitalisation from 2009/10 to 2011/12. In terms of service type, most AOD clients received
counselling (47%), followed by brokerage (16%) and other withdrawal services (10%). Overall, 74% had
completed treatment when their treatment episode was terminated.
There was some variability in patterns of hospital utilisation across service types, with over one-
quarter of residential withdrawal clients, and just over ten per cent of outreach (14%) and brokerage
(13%) clients presenting to hospital on multiple occasions over the three years presented.
Table 4.17 shows service type and treatment characteristics for AOD clients by hospitalisation by year
to show whether there was a change in hospital utilisation pre- and post-treatment. Proportions of
pre-AOD treatment hospital admissions (2009/10) were higher than the proportions post-AOD
treatment (2011/12) for all service types (with the exceptions of outreach and Aboriginal services),
pharmacotherapy treatment types and treatment termination status reasons.
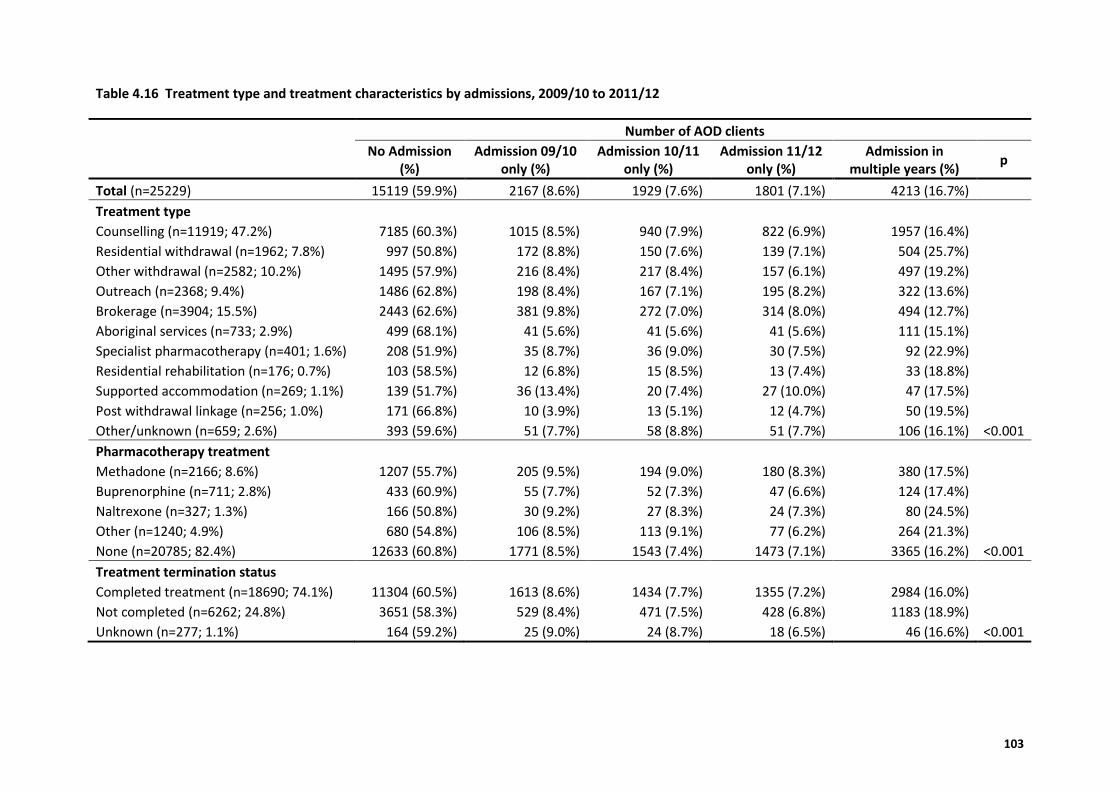
103
Table 4.16 Treatment type and treatment characteristics by admissions, 2009/10 to 2011/12
Number of AOD clients
No Admission (%)
Admission 09/10 only (%)
Admission 10/11 only (%)
Admission 11/12 only (%)
Admission in multiple years (%)
p
Total (n=25229) 15119 (59.9%) 2167 (8.6%) 1929 (7.6%) 1801 (7.1%) 4213 (16.7%)
Treatment type
Counselling (n=11919; 47.2%) 7185 (60.3%) 1015 (8.5%) 940 (7.9%) 822 (6.9%) 1957 (16.4%) Residential withdrawal (n=1962; 7.8%) 997 (50.8%) 172 (8.8%) 150 (7.6%) 139 (7.1%) 504 (25.7%) Other withdrawal (n=2582; 10.2%) 1495 (57.9%) 216 (8.4%) 217 (8.4%) 157 (6.1%) 497 (19.2%) Outreach (n=2368; 9.4%) 1486 (62.8%) 198 (8.4%) 167 (7.1%) 195 (8.2%) 322 (13.6%) Brokerage (n=3904; 15.5%) 2443 (62.6%) 381 (9.8%) 272 (7.0%) 314 (8.0%) 494 (12.7%) Aboriginal services (n=733; 2.9%) 499 (68.1%) 41 (5.6%) 41 (5.6%) 41 (5.6%) 111 (15.1%) Specialist pharmacotherapy (n=401; 1.6%) 208 (51.9%) 35 (8.7%) 36 (9.0%) 30 (7.5%) 92 (22.9%) Residential rehabilitation (n=176; 0.7%) 103 (58.5%) 12 (6.8%) 15 (8.5%) 13 (7.4%) 33 (18.8%) Supported accommodation (n=269; 1.1%) 139 (51.7%) 36 (13.4%) 20 (7.4%) 27 (10.0%) 47 (17.5%) Post withdrawal linkage (n=256; 1.0%) 171 (66.8%) 10 (3.9%) 13 (5.1%) 12 (4.7%) 50 (19.5%) Other/unknown (n=659; 2.6%) 393 (59.6%) 51 (7.7%) 58 (8.8%) 51 (7.7%) 106 (16.1%) <0.001
Pharmacotherapy treatment Methadone (n=2166; 8.6%) 1207 (55.7%) 205 (9.5%) 194 (9.0%) 180 (8.3%) 380 (17.5%)
Buprenorphine (n=711; 2.8%) 433 (60.9%) 55 (7.7%) 52 (7.3%) 47 (6.6%) 124 (17.4%) Naltrexone (n=327; 1.3%) 166 (50.8%) 30 (9.2%) 27 (8.3%) 24 (7.3%) 80 (24.5%) Other (n=1240; 4.9%) 680 (54.8%) 106 (8.5%) 113 (9.1%) 77 (6.2%) 264 (21.3%) None (n=20785; 82.4%) 12633 (60.8%) 1771 (8.5%) 1543 (7.4%) 1473 (7.1%) 3365 (16.2%) <0.001
Treatment termination status
Completed treatment (n=18690; 74.1%) 11304 (60.5%) 1613 (8.6%) 1434 (7.7%) 1355 (7.2%) 2984 (16.0%) Not completed (n=6262; 24.8%) 3651 (58.3%) 529 (8.4%) 471 (7.5%) 428 (6.8%) 1183 (18.9%) Unknown (n=277; 1.1%) 164 (59.2%) 25 (9.0%) 24 (8.7%) 18 (6.5%) 46 (16.6%) <0.001
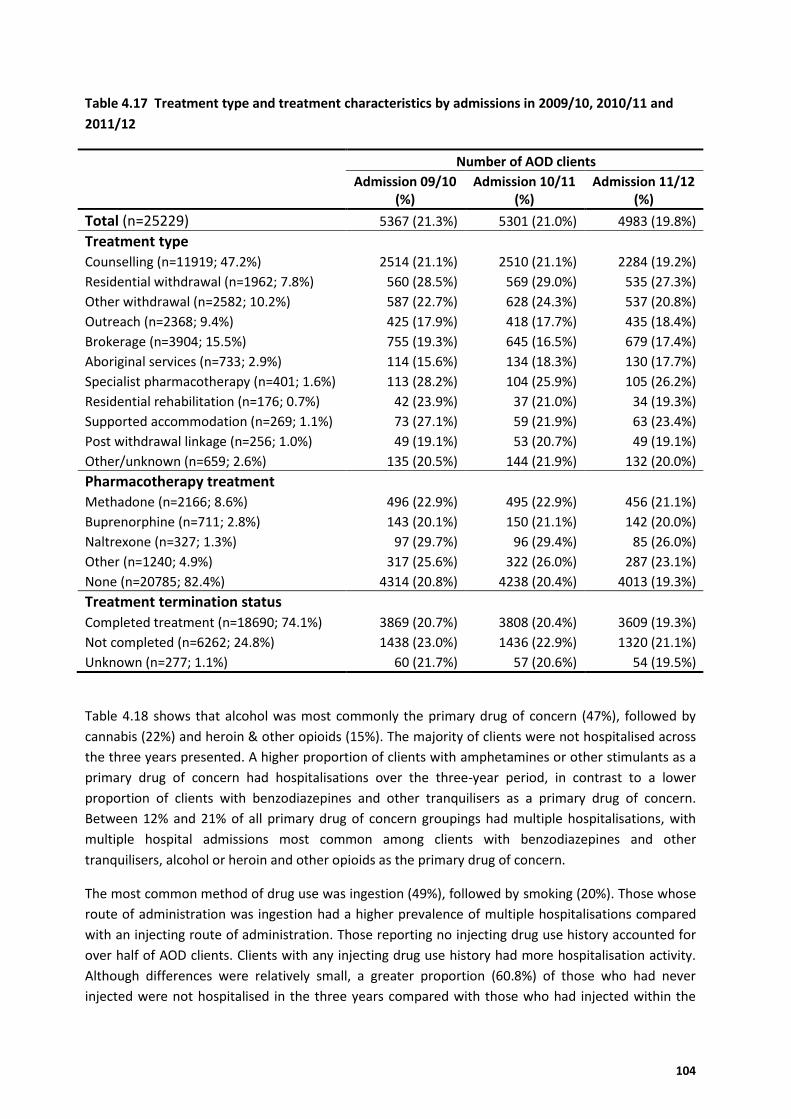
104
Table 4.17 Treatment type and treatment characteristics by admissions in 2009/10, 2010/11 and
2011/12
Number of AOD clients
Admission 09/10 (%)
Admission 10/11 (%)
Admission 11/12 (%)
Total (n=25229) 5367 (21.3%) 5301 (21.0%) 4983 (19.8%)
Treatment type
Counselling (n=11919; 47.2%) 2514 (21.1%) 2510 (21.1%) 2284 (19.2%)
Residential withdrawal (n=1962; 7.8%) 560 (28.5%) 569 (29.0%) 535 (27.3%)
Other withdrawal (n=2582; 10.2%) 587 (22.7%) 628 (24.3%) 537 (20.8%)
Outreach (n=2368; 9.4%) 425 (17.9%) 418 (17.7%) 435 (18.4%)
Brokerage (n=3904; 15.5%) 755 (19.3%) 645 (16.5%) 679 (17.4%)
Aboriginal services (n=733; 2.9%) 114 (15.6%) 134 (18.3%) 130 (17.7%)
Specialist pharmacotherapy (n=401; 1.6%) 113 (28.2%) 104 (25.9%) 105 (26.2%)
Residential rehabilitation (n=176; 0.7%) 42 (23.9%) 37 (21.0%) 34 (19.3%)
Supported accommodation (n=269; 1.1%) 73 (27.1%) 59 (21.9%) 63 (23.4%)
Post withdrawal linkage (n=256; 1.0%) 49 (19.1%) 53 (20.7%) 49 (19.1%)
Other/unknown (n=659; 2.6%) 135 (20.5%) 144 (21.9%) 132 (20.0%)
Pharmacotherapy treatment Methadone (n=2166; 8.6%) 496 (22.9%) 495 (22.9%) 456 (21.1%)
Buprenorphine (n=711; 2.8%) 143 (20.1%) 150 (21.1%) 142 (20.0%)
Naltrexone (n=327; 1.3%) 97 (29.7%) 96 (29.4%) 85 (26.0%)
Other (n=1240; 4.9%) 317 (25.6%) 322 (26.0%) 287 (23.1%)
None (n=20785; 82.4%) 4314 (20.8%) 4238 (20.4%) 4013 (19.3%)
Treatment termination status
Completed treatment (n=18690; 74.1%) 3869 (20.7%) 3808 (20.4%) 3609 (19.3%)
Not completed (n=6262; 24.8%) 1438 (23.0%) 1436 (22.9%) 1320 (21.1%)
Unknown (n=277; 1.1%) 60 (21.7%) 57 (20.6%) 54 (19.5%)
Table 4.18 shows that alcohol was most commonly the primary drug of concern (47%), followed by
cannabis (22%) and heroin & other opioids (15%). The majority of clients were not hospitalised across
the three years presented. A higher proportion of clients with amphetamines or other stimulants as a
primary drug of concern had hospitalisations over the three-year period, in contrast to a lower
proportion of clients with benzodiazepines and other tranquilisers as a primary drug of concern.
Between 12% and 21% of all primary drug of concern groupings had multiple hospitalisations, with
multiple hospital admissions most common among clients with benzodiazepines and other
tranquilisers, alcohol or heroin and other opioids as the primary drug of concern.
The most common method of drug use was ingestion (49%), followed by smoking (20%). Those whose
route of administration was ingestion had a higher prevalence of multiple hospitalisations compared
with an injecting route of administration. Those reporting no injecting drug use history accounted for
over half of AOD clients. Clients with any injecting drug use history had more hospitalisation activity.
Although differences were relatively small, a greater proportion (60.8%) of those who had never
injected were not hospitalised in the three years compared with those who had injected within the
105
past 12 months (57%) or greater than 12 months preceding AOD treatment engagement (58%).
However, clients who had injected in the past 12 months demonstrated the highest proportion of
multiple hospitalisations across the three years (18%) (Table 4.18).
Polydrug use was common, being recorded for 43% of AOD clients. There was little difference across
hospital admissions compared with those with no reported polydrug use. Clients with reported
polydrug use had a slightly higher proportion of hospitalisations prior to treatment and lower
proportion for multiple hospital admissions (Table 4.18).
Table 4.19 shows these same drug characteristics for AOD clients by hospitalisation across the three
years – the year prior to treatment, year of treatment, and the year post-treatment. Proportions of
pre-AOD treatment hospital admissions (2009/10) were higher than the proportions of post-AOD
treatment hospital admissions (2011/12).
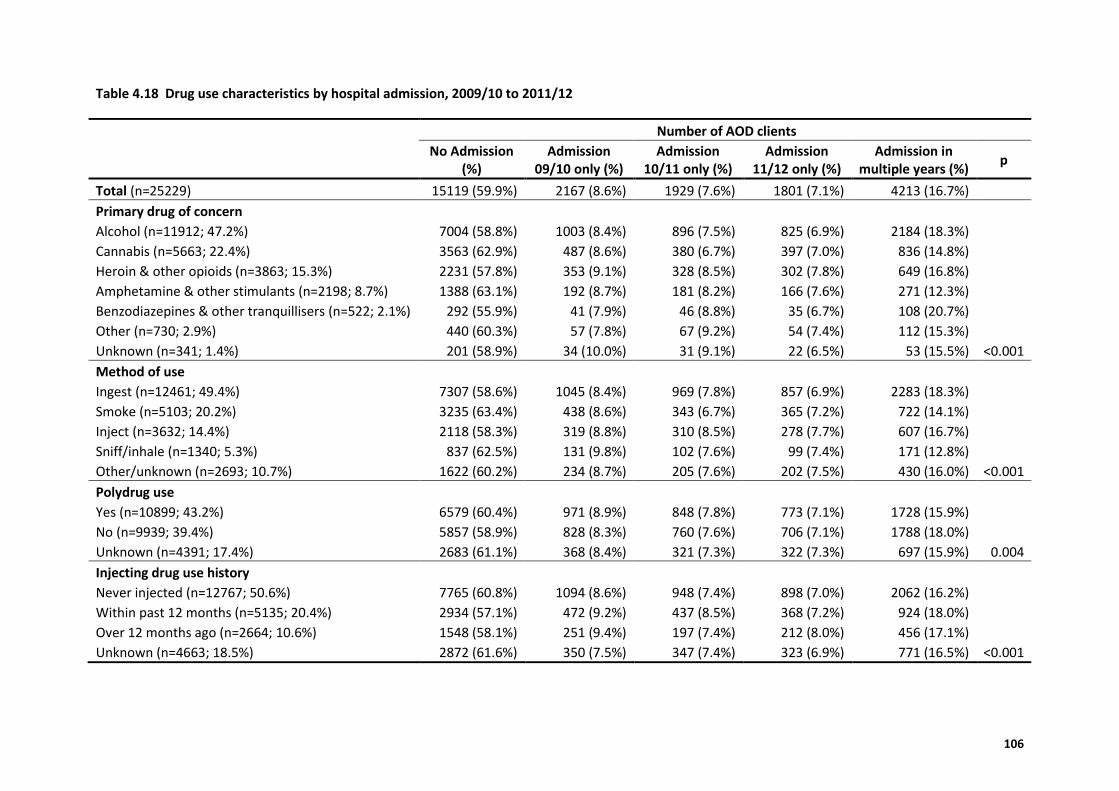
106
Table 4.18 Drug use characteristics by hospital admission, 2009/10 to 2011/12
Number of AOD clients
No Admission (%)
Admission 09/10 only (%)
Admission 10/11 only (%)
Admission 11/12 only (%)
Admission in multiple years (%)
p
Total (n=25229) 15119 (59.9%) 2167 (8.6%) 1929 (7.6%) 1801 (7.1%) 4213 (16.7%)
Primary drug of concern Alcohol (n=11912; 47.2%) 7004 (58.8%) 1003 (8.4%) 896 (7.5%) 825 (6.9%) 2184 (18.3%)
Cannabis (n=5663; 22.4%) 3563 (62.9%) 487 (8.6%) 380 (6.7%) 397 (7.0%) 836 (14.8%) Heroin & other opioids (n=3863; 15.3%) 2231 (57.8%) 353 (9.1%) 328 (8.5%) 302 (7.8%) 649 (16.8%) Amphetamine & other stimulants (n=2198; 8.7%) 1388 (63.1%) 192 (8.7%) 181 (8.2%) 166 (7.6%) 271 (12.3%) Benzodiazepines & other tranquillisers (n=522; 2.1%) 292 (55.9%) 41 (7.9%) 46 (8.8%) 35 (6.7%) 108 (20.7%) Other (n=730; 2.9%) 440 (60.3%) 57 (7.8%) 67 (9.2%) 54 (7.4%) 112 (15.3%) Unknown (n=341; 1.4%) 201 (58.9%) 34 (10.0%) 31 (9.1%) 22 (6.5%) 53 (15.5%) <0.001
Method of use
Ingest (n=12461; 49.4%) 7307 (58.6%) 1045 (8.4%) 969 (7.8%) 857 (6.9%) 2283 (18.3%) Smoke (n=5103; 20.2%) 3235 (63.4%) 438 (8.6%) 343 (6.7%) 365 (7.2%) 722 (14.1%) Inject (n=3632; 14.4%) 2118 (58.3%) 319 (8.8%) 310 (8.5%) 278 (7.7%) 607 (16.7%) Sniff/inhale (n=1340; 5.3%) 837 (62.5%) 131 (9.8%) 102 (7.6%) 99 (7.4%) 171 (12.8%) Other/unknown (n=2693; 10.7%) 1622 (60.2%) 234 (8.7%) 205 (7.6%) 202 (7.5%) 430 (16.0%) <0.001
Polydrug use Yes (n=10899; 43.2%) 6579 (60.4%) 971 (8.9%) 848 (7.8%) 773 (7.1%) 1728 (15.9%)
No (n=9939; 39.4%) 5857 (58.9%) 828 (8.3%) 760 (7.6%) 706 (7.1%) 1788 (18.0%) Unknown (n=4391; 17.4%) 2683 (61.1%) 368 (8.4%) 321 (7.3%) 322 (7.3%) 697 (15.9%) 0.004
Injecting drug use history
Never injected (n=12767; 50.6%) 7765 (60.8%) 1094 (8.6%) 948 (7.4%) 898 (7.0%) 2062 (16.2%) Within past 12 months (n=5135; 20.4%) 2934 (57.1%) 472 (9.2%) 437 (8.5%) 368 (7.2%) 924 (18.0%) Over 12 months ago (n=2664; 10.6%) 1548 (58.1%) 251 (9.4%) 197 (7.4%) 212 (8.0%) 456 (17.1%) Unknown (n=4663; 18.5%) 2872 (61.6%) 350 (7.5%) 347 (7.4%) 323 (6.9%) 771 (16.5%) <0.001
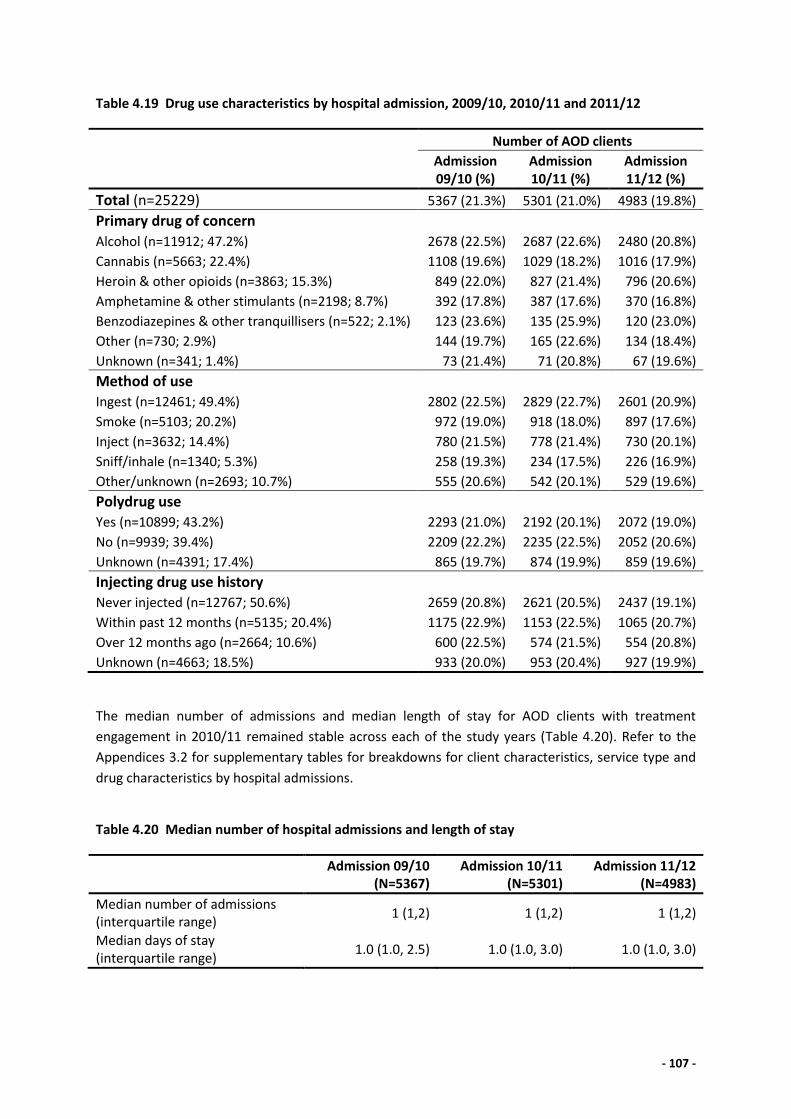
- 107 -
Table 4.19 Drug use characteristics by hospital admission, 2009/10, 2010/11 and 2011/12
Number of AOD clients
Admission 09/10 (%)
Admission 10/11 (%)
Admission 11/12 (%)
Total (n=25229) 5367 (21.3%) 5301 (21.0%) 4983 (19.8%)
Primary drug of concern Alcohol (n=11912; 47.2%) 2678 (22.5%) 2687 (22.6%) 2480 (20.8%)
Cannabis (n=5663; 22.4%) 1108 (19.6%) 1029 (18.2%) 1016 (17.9%)
Heroin & other opioids (n=3863; 15.3%) 849 (22.0%) 827 (21.4%) 796 (20.6%)
Amphetamine & other stimulants (n=2198; 8.7%) 392 (17.8%) 387 (17.6%) 370 (16.8%)
Benzodiazepines & other tranquillisers (n=522; 2.1%) 123 (23.6%) 135 (25.9%) 120 (23.0%)
Other (n=730; 2.9%) 144 (19.7%) 165 (22.6%) 134 (18.4%)
Unknown (n=341; 1.4%) 73 (21.4%) 71 (20.8%) 67 (19.6%)
Method of use
Ingest (n=12461; 49.4%) 2802 (22.5%) 2829 (22.7%) 2601 (20.9%)
Smoke (n=5103; 20.2%) 972 (19.0%) 918 (18.0%) 897 (17.6%)
Inject (n=3632; 14.4%) 780 (21.5%) 778 (21.4%) 730 (20.1%)
Sniff/inhale (n=1340; 5.3%) 258 (19.3%) 234 (17.5%) 226 (16.9%)
Other/unknown (n=2693; 10.7%) 555 (20.6%) 542 (20.1%) 529 (19.6%)
Polydrug use Yes (n=10899; 43.2%) 2293 (21.0%) 2192 (20.1%) 2072 (19.0%)
No (n=9939; 39.4%) 2209 (22.2%) 2235 (22.5%) 2052 (20.6%)
Unknown (n=4391; 17.4%) 865 (19.7%) 874 (19.9%) 859 (19.6%)
Injecting drug use history
Never injected (n=12767; 50.6%) 2659 (20.8%) 2621 (20.5%) 2437 (19.1%)
Within past 12 months (n=5135; 20.4%) 1175 (22.9%) 1153 (22.5%) 1065 (20.7%)
Over 12 months ago (n=2664; 10.6%) 600 (22.5%) 574 (21.5%) 554 (20.8%)
Unknown (n=4663; 18.5%) 933 (20.0%) 953 (20.4%) 927 (19.9%)
The median number of admissions and median length of stay for AOD clients with treatment
engagement in 2010/11 remained stable across each of the study years (Table 4.20). Refer to the
Appendices 3.2 for supplementary tables for breakdowns for client characteristics, service type and
drug characteristics by hospital admissions.
Table 4.20 Median number of hospital admissions and length of stay
Admission 09/10
(N=5367) Admission 10/11
(N=5301) Admission 11/12
(N=4983)
Median number of admissions (interquartile range)
1 (1,2) 1 (1,2) 1 (1,2)
Median days of stay (interquartile range)
1.0 (1.0, 2.5) 1.0 (1.0, 3.0) 1.0 (1.0, 3.0)
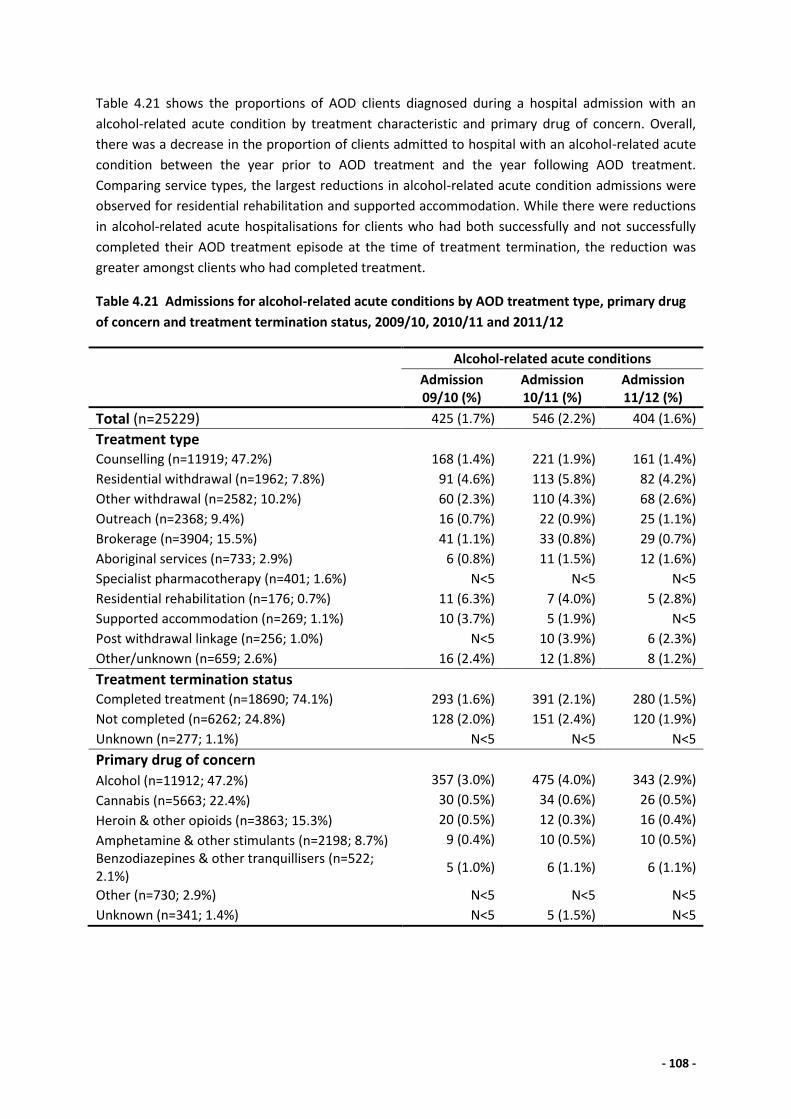
- 108 -
Table 4.21 shows the proportions of AOD clients diagnosed during a hospital admission with an
alcohol-related acute condition by treatment characteristic and primary drug of concern. Overall,
there was a decrease in the proportion of clients admitted to hospital with an alcohol-related acute
condition between the year prior to AOD treatment and the year following AOD treatment.
Comparing service types, the largest reductions in alcohol-related acute condition admissions were
observed for residential rehabilitation and supported accommodation. While there were reductions
in alcohol-related acute hospitalisations for clients who had both successfully and not successfully
completed their AOD treatment episode at the time of treatment termination, the reduction was
greater amongst clients who had completed treatment.
Table 4.21 Admissions for alcohol-related acute conditions by AOD treatment type, primary drug
of concern and treatment termination status, 2009/10, 2010/11 and 2011/12
Alcohol-related acute conditions
Admission 09/10 (%)
Admission 10/11 (%)
Admission 11/12 (%)
Total (n=25229) 425 (1.7%) 546 (2.2%) 404 (1.6%)
Treatment type
Counselling (n=11919; 47.2%) 168 (1.4%) 221 (1.9%) 161 (1.4%)
Residential withdrawal (n=1962; 7.8%) 91 (4.6%) 113 (5.8%) 82 (4.2%)
Other withdrawal (n=2582; 10.2%) 60 (2.3%) 110 (4.3%) 68 (2.6%)
Outreach (n=2368; 9.4%) 16 (0.7%) 22 (0.9%) 25 (1.1%)
Brokerage (n=3904; 15.5%) 41 (1.1%) 33 (0.8%) 29 (0.7%)
Aboriginal services (n=733; 2.9%) 6 (0.8%) 11 (1.5%) 12 (1.6%)
Specialist pharmacotherapy (n=401; 1.6%) N<5 N<5 N<5
Residential rehabilitation (n=176; 0.7%) 11 (6.3%) 7 (4.0%) 5 (2.8%)
Supported accommodation (n=269; 1.1%) 10 (3.7%) 5 (1.9%) N<5
Post withdrawal linkage (n=256; 1.0%) N<5 10 (3.9%) 6 (2.3%)
Other/unknown (n=659; 2.6%) 16 (2.4%) 12 (1.8%) 8 (1.2%)
Treatment termination status
Completed treatment (n=18690; 74.1%) 293 (1.6%) 391 (2.1%) 280 (1.5%)
Not completed (n=6262; 24.8%) 128 (2.0%) 151 (2.4%) 120 (1.9%)
Unknown (n=277; 1.1%) N<5 N<5 N<5
Primary drug of concern
Alcohol (n=11912; 47.2%) 357 (3.0%) 475 (4.0%) 343 (2.9%)
Cannabis (n=5663; 22.4%) 30 (0.5%) 34 (0.6%) 26 (0.5%)
Heroin & other opioids (n=3863; 15.3%) 20 (0.5%) 12 (0.3%) 16 (0.4%)
Amphetamine & other stimulants (n=2198; 8.7%) 9 (0.4%) 10 (0.5%) 10 (0.5%)
Benzodiazepines & other tranquillisers (n=522; 2.1%)
5 (1.0%) 6 (1.1%) 6 (1.1%)
Other (n=730; 2.9%) N<5 N<5 N<5
Unknown (n=341; 1.4%) N<5 5 (1.5%) N<5
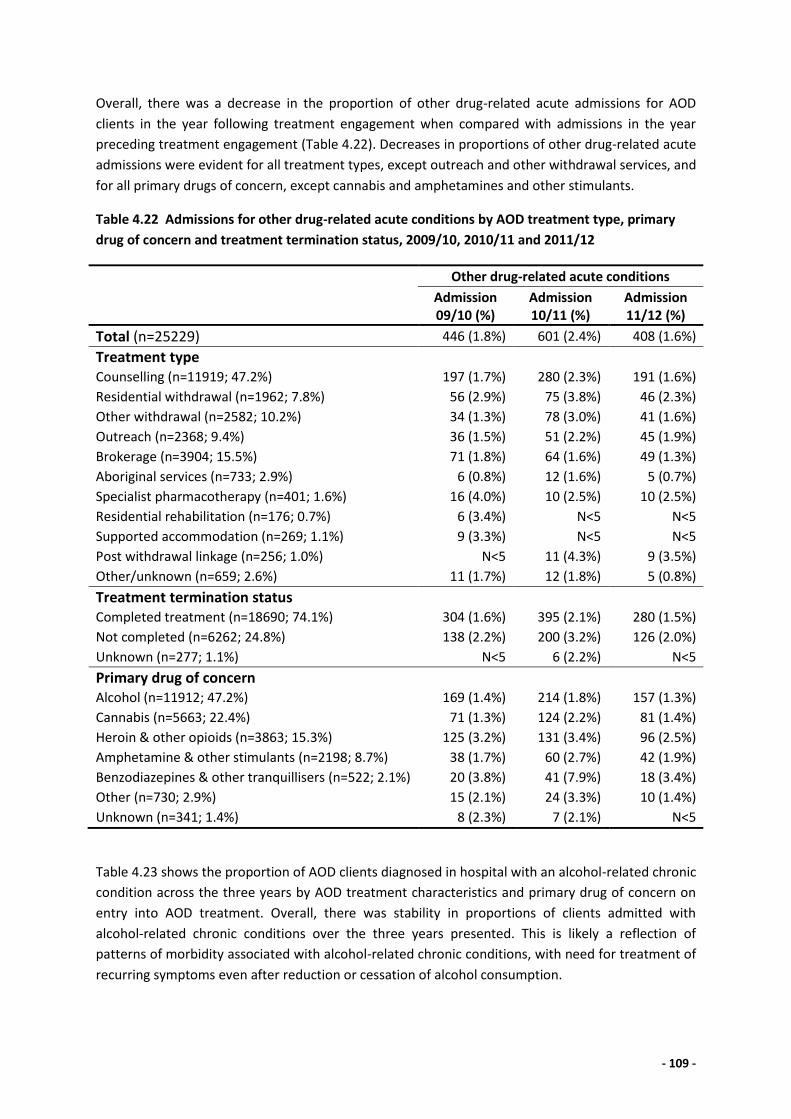
- 109 -
Overall, there was a decrease in the proportion of other drug-related acute admissions for AOD
clients in the year following treatment engagement when compared with admissions in the year
preceding treatment engagement (Table 4.22). Decreases in proportions of other drug-related acute
admissions were evident for all treatment types, except outreach and other withdrawal services, and
for all primary drugs of concern, except cannabis and amphetamines and other stimulants.
Table 4.22 Admissions for other drug-related acute conditions by AOD treatment type, primary
drug of concern and treatment termination status, 2009/10, 2010/11 and 2011/12
Other drug-related acute conditions
Admission 09/10 (%)
Admission 10/11 (%)
Admission 11/12 (%)
Total (n=25229) 446 (1.8%) 601 (2.4%) 408 (1.6%)
Treatment type
Counselling (n=11919; 47.2%) 197 (1.7%) 280 (2.3%) 191 (1.6%)
Residential withdrawal (n=1962; 7.8%) 56 (2.9%) 75 (3.8%) 46 (2.3%)
Other withdrawal (n=2582; 10.2%) 34 (1.3%) 78 (3.0%) 41 (1.6%)
Outreach (n=2368; 9.4%) 36 (1.5%) 51 (2.2%) 45 (1.9%)
Brokerage (n=3904; 15.5%) 71 (1.8%) 64 (1.6%) 49 (1.3%)
Aboriginal services (n=733; 2.9%) 6 (0.8%) 12 (1.6%) 5 (0.7%)
Specialist pharmacotherapy (n=401; 1.6%) 16 (4.0%) 10 (2.5%) 10 (2.5%)
Residential rehabilitation (n=176; 0.7%) 6 (3.4%) N<5 N<5
Supported accommodation (n=269; 1.1%) 9 (3.3%) N<5 N<5
Post withdrawal linkage (n=256; 1.0%) N<5 11 (4.3%) 9 (3.5%)
Other/unknown (n=659; 2.6%) 11 (1.7%) 12 (1.8%) 5 (0.8%)
Treatment termination status
Completed treatment (n=18690; 74.1%) 304 (1.6%) 395 (2.1%) 280 (1.5%)
Not completed (n=6262; 24.8%) 138 (2.2%) 200 (3.2%) 126 (2.0%)
Unknown (n=277; 1.1%) N<5 6 (2.2%) N<5
Primary drug of concern
Alcohol (n=11912; 47.2%) 169 (1.4%) 214 (1.8%) 157 (1.3%)
Cannabis (n=5663; 22.4%) 71 (1.3%) 124 (2.2%) 81 (1.4%)
Heroin & other opioids (n=3863; 15.3%) 125 (3.2%) 131 (3.4%) 96 (2.5%)
Amphetamine & other stimulants (n=2198; 8.7%) 38 (1.7%) 60 (2.7%) 42 (1.9%)
Benzodiazepines & other tranquillisers (n=522; 2.1%) 20 (3.8%) 41 (7.9%) 18 (3.4%)
Other (n=730; 2.9%) 15 (2.1%) 24 (3.3%) 10 (1.4%)
Unknown (n=341; 1.4%) 8 (2.3%) 7 (2.1%) N<5
Table 4.23 shows the proportion of AOD clients diagnosed in hospital with an alcohol-related chronic
condition across the three years by AOD treatment characteristics and primary drug of concern on
entry into AOD treatment. Overall, there was stability in proportions of clients admitted with
alcohol-related chronic conditions over the three years presented. This is likely a reflection of
patterns of morbidity associated with alcohol-related chronic conditions, with need for treatment of
recurring symptoms even after reduction or cessation of alcohol consumption.
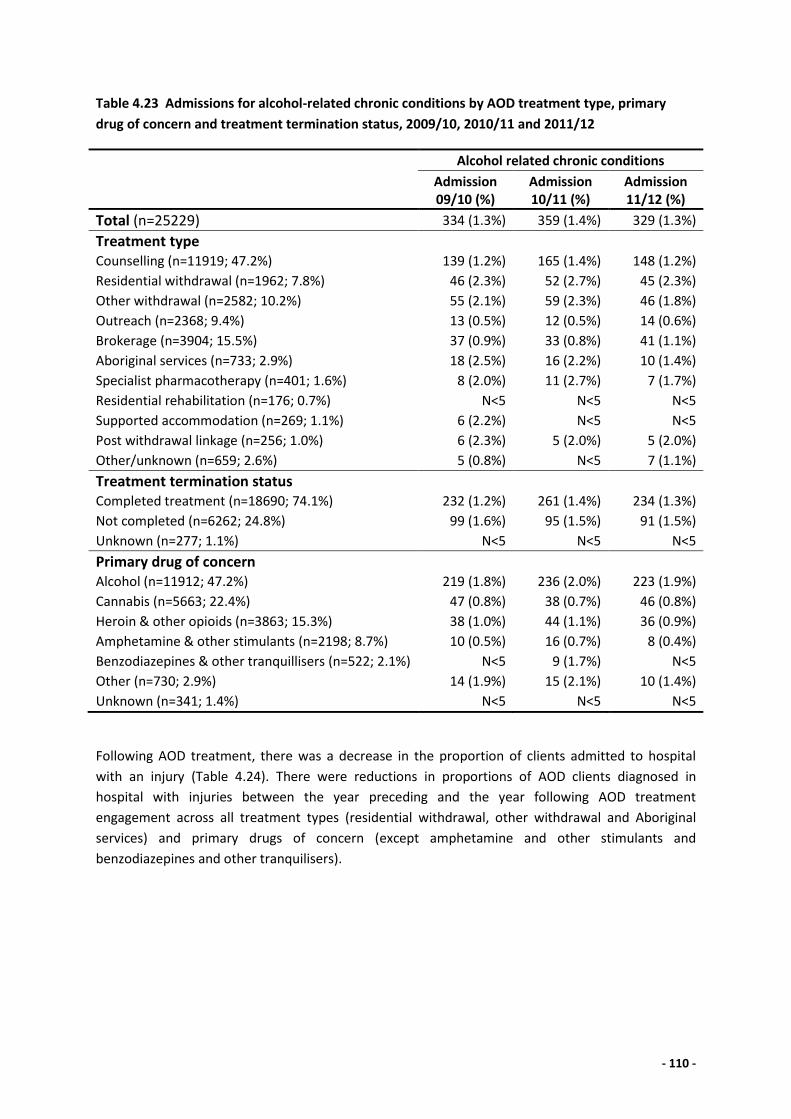
- 110 -
Table 4.23 Admissions for alcohol-related chronic conditions by AOD treatment type, primary
drug of concern and treatment termination status, 2009/10, 2010/11 and 2011/12
Alcohol related chronic conditions
Admission 09/10 (%)
Admission 10/11 (%)
Admission 11/12 (%)
Total (n=25229) 334 (1.3%) 359 (1.4%) 329 (1.3%)
Treatment type
Counselling (n=11919; 47.2%) 139 (1.2%) 165 (1.4%) 148 (1.2%)
Residential withdrawal (n=1962; 7.8%) 46 (2.3%) 52 (2.7%) 45 (2.3%)
Other withdrawal (n=2582; 10.2%) 55 (2.1%) 59 (2.3%) 46 (1.8%)
Outreach (n=2368; 9.4%) 13 (0.5%) 12 (0.5%) 14 (0.6%)
Brokerage (n=3904; 15.5%) 37 (0.9%) 33 (0.8%) 41 (1.1%)
Aboriginal services (n=733; 2.9%) 18 (2.5%) 16 (2.2%) 10 (1.4%)
Specialist pharmacotherapy (n=401; 1.6%) 8 (2.0%) 11 (2.7%) 7 (1.7%)
Residential rehabilitation (n=176; 0.7%) N<5 N<5 N<5
Supported accommodation (n=269; 1.1%) 6 (2.2%) N<5 N<5
Post withdrawal linkage (n=256; 1.0%) 6 (2.3%) 5 (2.0%) 5 (2.0%)
Other/unknown (n=659; 2.6%) 5 (0.8%) N<5 7 (1.1%)
Treatment termination status
Completed treatment (n=18690; 74.1%) 232 (1.2%) 261 (1.4%) 234 (1.3%)
Not completed (n=6262; 24.8%) 99 (1.6%) 95 (1.5%) 91 (1.5%)
Unknown (n=277; 1.1%) N<5 N<5 N<5
Primary drug of concern
Alcohol (n=11912; 47.2%) 219 (1.8%) 236 (2.0%) 223 (1.9%)
Cannabis (n=5663; 22.4%) 47 (0.8%) 38 (0.7%) 46 (0.8%)
Heroin & other opioids (n=3863; 15.3%) 38 (1.0%) 44 (1.1%) 36 (0.9%)
Amphetamine & other stimulants (n=2198; 8.7%) 10 (0.5%) 16 (0.7%) 8 (0.4%)
Benzodiazepines & other tranquillisers (n=522; 2.1%) N<5 9 (1.7%) N<5
Other (n=730; 2.9%) 14 (1.9%) 15 (2.1%) 10 (1.4%)
Unknown (n=341; 1.4%) N<5 N<5 N<5
Following AOD treatment, there was a decrease in the proportion of clients admitted to hospital
with an injury (Table 4.24). There were reductions in proportions of AOD clients diagnosed in
hospital with injuries between the year preceding and the year following AOD treatment
engagement across all treatment types (residential withdrawal, other withdrawal and Aboriginal
services) and primary drugs of concern (except amphetamine and other stimulants and
benzodiazepines and other tranquilisers).
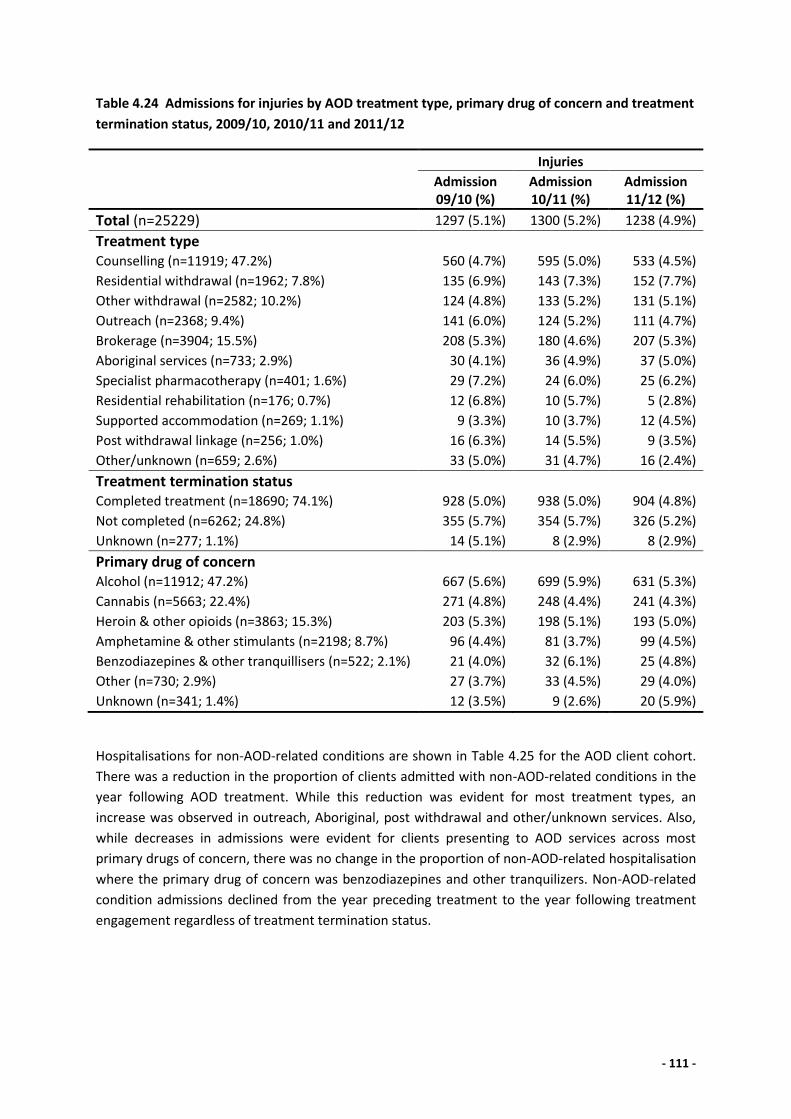
- 111 -
Table 4.24 Admissions for injuries by AOD treatment type, primary drug of concern and treatment
termination status, 2009/10, 2010/11 and 2011/12
Injuries
Admission 09/10 (%)
Admission 10/11 (%)
Admission 11/12 (%)
Total (n=25229) 1297 (5.1%) 1300 (5.2%) 1238 (4.9%)
Treatment type
Counselling (n=11919; 47.2%) 560 (4.7%) 595 (5.0%) 533 (4.5%)
Residential withdrawal (n=1962; 7.8%) 135 (6.9%) 143 (7.3%) 152 (7.7%)
Other withdrawal (n=2582; 10.2%) 124 (4.8%) 133 (5.2%) 131 (5.1%)
Outreach (n=2368; 9.4%) 141 (6.0%) 124 (5.2%) 111 (4.7%)
Brokerage (n=3904; 15.5%) 208 (5.3%) 180 (4.6%) 207 (5.3%)
Aboriginal services (n=733; 2.9%) 30 (4.1%) 36 (4.9%) 37 (5.0%)
Specialist pharmacotherapy (n=401; 1.6%) 29 (7.2%) 24 (6.0%) 25 (6.2%)
Residential rehabilitation (n=176; 0.7%) 12 (6.8%) 10 (5.7%) 5 (2.8%)
Supported accommodation (n=269; 1.1%) 9 (3.3%) 10 (3.7%) 12 (4.5%)
Post withdrawal linkage (n=256; 1.0%) 16 (6.3%) 14 (5.5%) 9 (3.5%)
Other/unknown (n=659; 2.6%) 33 (5.0%) 31 (4.7%) 16 (2.4%)
Treatment termination status
Completed treatment (n=18690; 74.1%) 928 (5.0%) 938 (5.0%) 904 (4.8%)
Not completed (n=6262; 24.8%) 355 (5.7%) 354 (5.7%) 326 (5.2%)
Unknown (n=277; 1.1%) 14 (5.1%) 8 (2.9%) 8 (2.9%)
Primary drug of concern
Alcohol (n=11912; 47.2%) 667 (5.6%) 699 (5.9%) 631 (5.3%)
Cannabis (n=5663; 22.4%) 271 (4.8%) 248 (4.4%) 241 (4.3%)
Heroin & other opioids (n=3863; 15.3%) 203 (5.3%) 198 (5.1%) 193 (5.0%)
Amphetamine & other stimulants (n=2198; 8.7%) 96 (4.4%) 81 (3.7%) 99 (4.5%)
Benzodiazepines & other tranquillisers (n=522; 2.1%) 21 (4.0%) 32 (6.1%) 25 (4.8%)
Other (n=730; 2.9%) 27 (3.7%) 33 (4.5%) 29 (4.0%)
Unknown (n=341; 1.4%) 12 (3.5%) 9 (2.6%) 20 (5.9%)
Hospitalisations for non-AOD-related conditions are shown in Table 4.25 for the AOD client cohort.
There was a reduction in the proportion of clients admitted with non-AOD-related conditions in the
year following AOD treatment. While this reduction was evident for most treatment types, an
increase was observed in outreach, Aboriginal, post withdrawal and other/unknown services. Also,
while decreases in admissions were evident for clients presenting to AOD services across most
primary drugs of concern, there was no change in the proportion of non-AOD-related hospitalisation
where the primary drug of concern was benzodiazepines and other tranquilizers. Non-AOD-related
condition admissions declined from the year preceding treatment to the year following treatment
engagement regardless of treatment termination status.
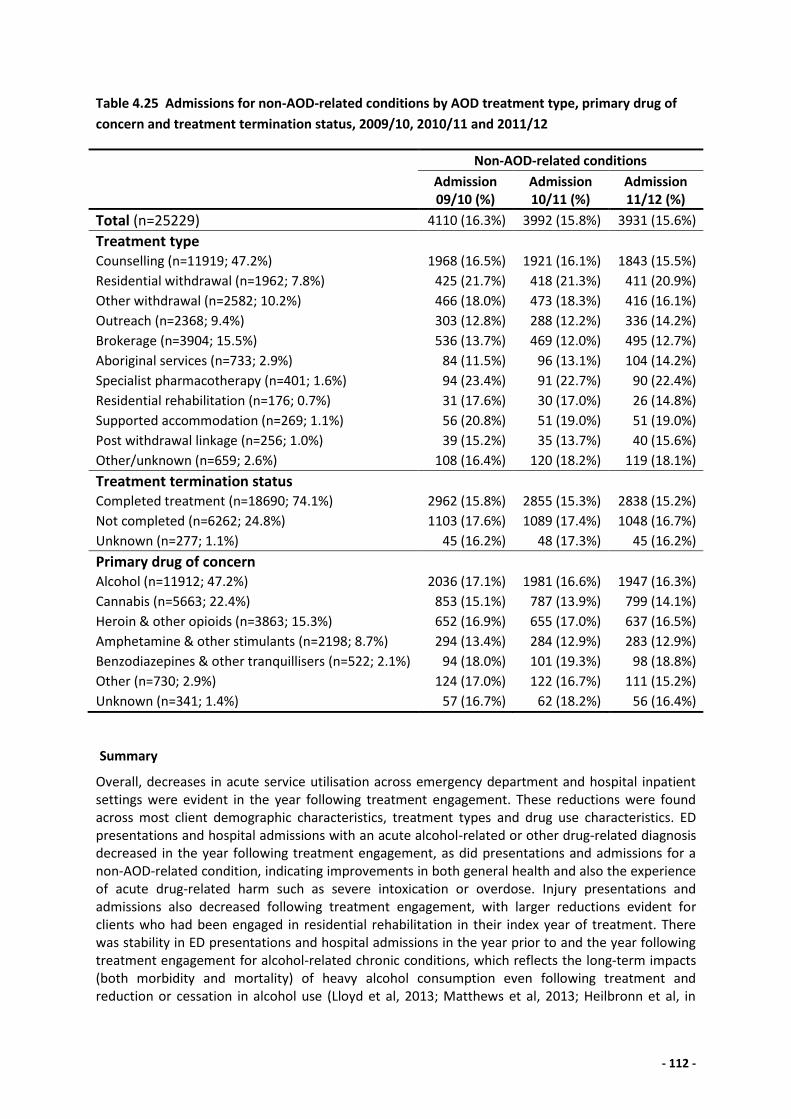
- 112 -
Table 4.25 Admissions for non-AOD-related conditions by AOD treatment type, primary drug of
concern and treatment termination status, 2009/10, 2010/11 and 2011/12
Non-AOD-related conditions
Admission 09/10 (%)
Admission 10/11 (%)
Admission 11/12 (%)
Total (n=25229) 4110 (16.3%) 3992 (15.8%) 3931 (15.6%)
Treatment type
Counselling (n=11919; 47.2%) 1968 (16.5%) 1921 (16.1%) 1843 (15.5%)
Residential withdrawal (n=1962; 7.8%) 425 (21.7%) 418 (21.3%) 411 (20.9%)
Other withdrawal (n=2582; 10.2%) 466 (18.0%) 473 (18.3%) 416 (16.1%)
Outreach (n=2368; 9.4%) 303 (12.8%) 288 (12.2%) 336 (14.2%)
Brokerage (n=3904; 15.5%) 536 (13.7%) 469 (12.0%) 495 (12.7%)
Aboriginal services (n=733; 2.9%) 84 (11.5%) 96 (13.1%) 104 (14.2%)
Specialist pharmacotherapy (n=401; 1.6%) 94 (23.4%) 91 (22.7%) 90 (22.4%)
Residential rehabilitation (n=176; 0.7%) 31 (17.6%) 30 (17.0%) 26 (14.8%)
Supported accommodation (n=269; 1.1%) 56 (20.8%) 51 (19.0%) 51 (19.0%)
Post withdrawal linkage (n=256; 1.0%) 39 (15.2%) 35 (13.7%) 40 (15.6%)
Other/unknown (n=659; 2.6%) 108 (16.4%) 120 (18.2%) 119 (18.1%)
Treatment termination status
Completed treatment (n=18690; 74.1%) 2962 (15.8%) 2855 (15.3%) 2838 (15.2%)
Not completed (n=6262; 24.8%) 1103 (17.6%) 1089 (17.4%) 1048 (16.7%)
Unknown (n=277; 1.1%) 45 (16.2%) 48 (17.3%) 45 (16.2%)
Primary drug of concern
Alcohol (n=11912; 47.2%) 2036 (17.1%) 1981 (16.6%) 1947 (16.3%)
Cannabis (n=5663; 22.4%) 853 (15.1%) 787 (13.9%) 799 (14.1%)
Heroin & other opioids (n=3863; 15.3%) 652 (16.9%) 655 (17.0%) 637 (16.5%)
Amphetamine & other stimulants (n=2198; 8.7%) 294 (13.4%) 284 (12.9%) 283 (12.9%)
Benzodiazepines & other tranquillisers (n=522; 2.1%) 94 (18.0%) 101 (19.3%) 98 (18.8%)
Other (n=730; 2.9%) 124 (17.0%) 122 (16.7%) 111 (15.2%)
Unknown (n=341; 1.4%) 57 (16.7%) 62 (18.2%) 56 (16.4%)
Summary
Overall, decreases in acute service utilisation across emergency department and hospital inpatient settings were evident in the year following treatment engagement. These reductions were found across most client demographic characteristics, treatment types and drug use characteristics. ED presentations and hospital admissions with an acute alcohol-related or other drug-related diagnosis decreased in the year following treatment engagement, as did presentations and admissions for a non-AOD-related condition, indicating improvements in both general health and also the experience of acute drug-related harm such as severe intoxication or overdose. Injury presentations and admissions also decreased following treatment engagement, with larger reductions evident for clients who had been engaged in residential rehabilitation in their index year of treatment. There was stability in ED presentations and hospital admissions in the year prior to and the year following treatment engagement for alcohol-related chronic conditions, which reflects the long-term impacts (both morbidity and mortality) of heavy alcohol consumption even following treatment and reduction or cessation in alcohol use (Lloyd et al, 2013; Matthews et al, 2013; Heilbronn et al, in

- 113 -
press). It is important to note that many clients were still actively engaged in treatment in the year following the index year, and the full effects of treatment may not have been captured in such a short time between service engagement and outcome. Further exploration of client trajectories within and across treatment, health and other system is necessary at a population level to enable identification of transitions and outcomes of AOD treatment engagement within and across client populations.
- 114 -
5. Discussion and recommendations
This multi-method project incorporated four major phases of work (a systems description, cohort
study, detailed qualitative interviews and data linkage) with the aim of detailing the AOD system, its
clients and their experiences, pathways and outcomes. Indeed, the Patient Pathways cohort,
recruited from a wide diversity of treatment services across two states, is the largest AOD treatment
outcomes study completed in Australia, with a follow-up rate of around 70%. The study is unique in
terms of including a broad range of primary drugs of concern that present to the AOD treatment
system, thereby allowing direct comparisons between users of both alcohol and illicit drugs,
including diverted pharmaceuticals.
At treatment intake, the cohort reported severe substance use problems as well as substantial
complexity in terms of their life situation – with high rates of homelessness, unemployment, acute
health problems, including poor psychological health as well as a low quality of life and community
engagement. As such, it is not surprising that the sample reported high levels of multiple service
involvement, both at treatment intake and at one-year follow-up. The sample predominantly
consisted of participants with chronic substance dependence and significant life complexity. Indeed,
for the majority of the sample, PIT at recruitment was not their first experience of the specialist AOD
treatment system, and the majority had lengthy addiction and treatment careers. As such, it is
important to acknowledge this context when considering the positive changes identified at the 12
month follow-up across multiple domains.
At follow-up, there were marked improvements in substance use and wellbeing across the cohort as
well as reductions in acute health care use, which was also a finding of the data linkage component.
Where treatment success is defined as either achieving abstinence or a reduction in substance using
days greater than 50% in the last month, 55% of the sample achieved this milestone. Furthermore, if
the higher threshold of abstinence from their PDOC is used, this was achieved by 37% of the overall
sample who were successfully followed-up. Whilst these treatment outcomes are likely to be
inflated by the bias in follow-up (i.e. that those lost to follow are likely to have had poorer
outcomes), this inherent limitation is common to all outcome studies relying on participant self-
reported outcome data. Nonetheless, rates of abstinence from PDOC remained higher than
comparable treatment studies internationally, which may reflect the short follow-up window, with
14% of the sample having achieved continuous abstinence from their PDOC in the year before
follow-up. This rate is consistent with findings from the MATES study of methamphetamine
dependent users, which also reported a complete abstinence rate of 14% at one year (McKetin et al,
2012). In addition, 16% of the sample reported abstinence from all drugs in the past month,
suggesting around one in six study participants who were followed up had been abstinent for at
least one month. Taking a conservative estimate and assuming all participants lost to follow-up
(excluding those deceased or incarcerated) were still using their PDOC, the overall past month
abstinence rate from their PDOC was 27%, with a treatment success rate of 39%.
There were also significant gains in quality of life at the follow-up assessment, suggesting that
engagement with specialist AOD services has an impact on wellbeing that extends beyond
behavioural changes in problematic substance use. In terms of health systems, there was a
significant reduction in acute health service utilisation, although the overall figure was still high, with
- 115 -
more than half of the sample reporting an acute health episode in the year following initial
treatment engagement.
The main predictors of achieving abstinence at follow-up were completion of the index treatment
(i.e. PIT), having an index treatment that included residential rehabilitation (or engaging in
rehabilitation in the year before or after the PIT) and participating in mutual aid groups in the year
after index treatment. Additionally, there was a dose effect for mutual aid engagement with greater
frequency of meeting attendance associated with higher rates of abstinence – for every ten
meetings attended there was an 8% increase in the likelihood of abstinence, which supports the
finding of Kaskutas (2009). Our study findings are consistent with international literature that
emphasises the importance of treatment retention and completion (Simpson and Sells, 1990;
Gossop et al., 2001), continuity of care (Chi et al., 2011) and the benefits of mutual aid engagement
either as a stand-alone form of aftercare or as an adjunctive therapy (Kelly et al, 2013).
The finding that participants who had residential rehabilitation treatment achieved better outcomes
is particularly noteworthy given their greater social disadvantage/adversity at baseline, with
significantly greater rates of imprisonment, attendance at a community-based offender program,
being held in a lock-up or watch-house, remanded in custody and having legal problems in the year
before study entry relative to those with acute withdrawal or outpatient services as their PIT. The
issue of long waiting times was raised in the qualitative interviews and so the potential to increase
the number of residential rehabilitation places warrants consideration. Whilst they are significantly
more costly, in the current study at least, they were associated with better outcomes for a
population more heavily involved in the criminal justice/legal system and hence likely to generate
further costs to society in terms of recidivism, repeated incarceration and high social dysfunction
with ongoing substance dependence.
There are key lessons here for Australian treatment services around effective engagement and the
building of therapeutic alliances to promote sufficient treatment retention to allow the impact of
treatment to be experienced (Simpson, 2004), and to ensure that, in response to a chronic and
relapsing condition (O’Brien and McLellan, 1995), there are adequate linkages and pathways from
specialist formal settings of treatment to community-based recovery-focussed organisations. It is
important that continued support includes approaches that are responsive to the client with the aim
of supporting them to complete treatment as well as engaging in ongoing aftercare. Previous
research has identified scepticism among AOD specialist workers on the benefits of mutual aid (Day
et al, 2010; Gaston-Lopez et al, 2010), and therefore providing workforce training that overcomes
worker resistance is critical to ensuring effective pathways to ongoing community support. Indeed,
active linkage to peer support has been identified as an effective pathway by international research
(Timko et al., 2006; Manning et al., 2012, Kaskutas et al, 2009), and is considered an important
component of an integrated treatment system (White, 2009).
The current findings also provide a strong Australian evidence base demonstrating the effectiveness
of residential rehabilitation programs in reducing substance use, and are consistent with a growing
international literature that is supportive of this treatment modality (e.g. Vanderplasschen et al.,
2014). Both MATES and ATOS demonstrated preferential outcomes among clients who had engaged
with rehabilitation (McKetin et al., 2012; Teesson et al., 2008). In the UK NTORS outcome study,
where residential services were grouped together (inpatient withdrawal as well as residential
- 116 -
rehabilitation), around half of the residential clients maintained abstinence from their primary
substance over the subsequent follow-up periods of the study spanning up to five years. There is a
strong argument from the Pathways study that for complex clients, rehabilitation will play a
significant role in their treatment and is the modality most likely to help them achieve abstinence
and improved wellbeing. This is consistent with both the model of service – clients will go to
residential services knowing that they are generally abstinence-oriented – and that, in
developmental terms, a period of residential stay can be a sufficient ‘turning point’ in a
developmental trajectory (Best, 2014). However given the higher cost of residential rehabilitation, it
is important to identify alternative cost-effective models of care and integration within the
community.
What the current study did not successfully demonstrate was that integrated treatment across
different service types – such as engagement in housing, employment services and other community
support services translates into better outcomes. However, this finding that should be treated with
caution as our ability to map the nature, timing and duration of integrated treatment was limited
and restricted to the year following their PIT. It is possible that the benefit of engagement in
community health and welfare services will influence substance use outcomes in subsequent years,
as is supported by US data which demonstrates the effectiveness of a continuing care model
(involving GP visits, ongoing AOD specialist treatment and support from psychiatric services where
needed) on substance use outcomes at nine years follow-up (Chi & Weisner, 2008).
It is important to note that there were differences in outcomes by PDOC, with participants with
alcohol problems showing markedly poorer outcomes. It is likely that characteristics associated with
alcohol–dependent individuals presenting to treatment, such as them being older and experiencing
alcohol-related cognitive impairments (Stavro et al., 2013), as well as the pervasive nature of alcohol
and its greater social acceptability relative to illicit drugs, pose particular challenges for this group.
Individuals in this group were also significantly higher users of acute services – a finding supported
by the data linkage component of the project, which also showed greater health service utilisation
among individuals with alcohol problems. In spite of this effect, participants with a primary alcohol
concern did show a more robust benefit from receiving an ‘optimal care pathway’ that involved
completion of the index treatment, continuity of care, adequate engagement with community
services and engagement in mutual aid groups. Although the overall gain for participants with
alcohol problems was less consistent than for those with primary drug concerns, those who received
an optimal pathway of care demonstrated significantly greater improvements in terms of abstinence
rates than those who did not. The findings suggest that individuals with primary alcohol concerns
require intensive treatment packages to support their treatment journeys and recovery pathways.
The data demonstrated positive outcomes for participants whose primary drug of concern was
meth/amphetamine (mainly methamphetamine). At the follow-up interview, more than one quarter
of participants who cited meth/amphetamine as their PDOC reported no use of the drug since the
index treatment. This rate is markedly higher than the 14% reported by McKetin and colleagues in
2012, though it was reported that rehabilitation treatment was associated with elevated rates of
abstinence, consistent with the findings of the Pathways study. Given the increasing rates of
meth/amphetamine use in Australia, and the public concern around individual and community
harms associated with use of this class of drugs, it is encouraging that there are consistently positive
findings for meth/amphetamine users, both in terms of abstinence and reduced use. The Australian
- 117 -
Crime Commission (2014) reports that as a result of its relative accessibility, affordability and
destructive side-effects, methamphetamine (ice) use is considered a national concern. This suggests
the need to assertively promote treatment engagement for this population with stronger marketing
around the effectiveness of treatment to the general population.
There is also some evidence from both the qualitative and quantitative phases of the project that
one of the key components of an effective treatment model is efficient coordination of service
integration. While completion of treatment and continuity of care were indicated as key factors in
predicting positive outcomes, the qualitative data suggests that this may be linked to ongoing care
coordination (in particular in the periods after completion of acute interventions) underpinned by a
strong and ongoing therapeutic alliance. The cohort in the current study were involved in a diverse,
and at times, bewildering array of services across the range of helping professions, and our
qualitative findings indicate that participants wanted greater support in navigating the system. This
is not a counselling role but a coordination one in which the client’s needs are monitored by a care
coordinator whose role is to identity and support the client to engage effectively and in a timely
manner with the most appropriate services.
Although the linkage component of the study was conducted in only one state (Victoria), it remains a
key strength of the overall study design as it links individual experience and self-report to both
objective markers of harm and to the benefits of treatment for a much larger and diverse treatment
population – including all clients engaging in AOD treatment over the course of a year. Indeed,
consistent with the cohort data, the linkage component identified significant decreases in service
utilisation across emergency department (ED) and hospital inpatient settings in the year following
treatment engagement. These reductions in acute service use were found across most participant
demographic characteristics, treatment types and drug use characteristics, though were most
evident among those who had received long-term residential treatment as their PIT.
Among the four subpopulations of AOD clients presenting with risk factors of polydrug use on entry
to AOD treatment, recent injecting drug use history, homeless status on entry into treatment, and
forensic status on entry into treatment, overall reductions in ED and hospital utilisation were found
following treatment engagement. This finding suggests that the effects of treatment on improving
health and wellbeing, and reducing health system costs are sustained for patients presenting at
higher risk of potential harm than the general AOD treatment population. It is important to
acknowledge that there were varying levels of reduction of ED and hospital utilisation within these
groups when specific treatment, drug use and sociodemographic characteristics were examined,
which offers opportunities for consideration of targeted approaches to identify and respond to risk
for specific groups within these higher risk populations (refer to data linkage supplementary report
for results for the subpopulation analyses).
ED presentations and hospital admissions with an acute alcohol-related or other drug-related
diagnosis decreased in the year following treatment engagement, as did presentations and
admissions for a non-AOD-related condition, indicating improvements in both general health and
also the experience of acute drug-related harm, such as severe intoxication or overdose. Injury
presentations and admissions also decreased following treatment engagement, with larger
reductions evident for clients who had been engaged in residential rehabilitation in their index year
of treatment. There was stability in ED presentations and hospital admissions in the year prior to and
- 118 -
the year following treatment engagement for alcohol-related chronic conditions, which reflects the
long-term impacts (both morbidity and mortality) of heavy alcohol consumption even following
treatment and reduction or cessation in alcohol use (Lloyd et al., 2013; Matthews et al., 2013;
Heilbronn et al., in press).
It is important to note that many clients were still actively engaged in treatment in the year
following the index year, and the full effects of treatment may not have been captured in such a
short time between service engagement and the measurement of outcome. Further exploration of
client trajectories within and across treatment, health and other systems is necessary at a
population level to enable identification of the transitions and outcomes of AOD treatment
engagement within and across differing client populations. Below we recommend further waves of
data collection to test the longevity of benefits reported here, and there are clear opportunities to
supplement and enhance direct patient assessment across multiple waves and through linkage of
health and community service system data.
There are a number of important limitations that must be considered when interpreting the findings
of the Pathways study. The overarching positive finding that AOD treatment is effective must be
interpreted with caution given the absence of a no-treatment control group. Whilst the Victorian
sample of pathways participants were broadly representative of the Victorian treatment population
in terms of gender and age and PDOC, they were not representative of the treatment modality due
to an over-sampling of residential services and an under-sampling of community outpatients. Table
2.1 shows the breakdown of treatment type by jurisdiction on the year prior to recruitment.
Inpatient withdrawal accounted for 44% of the pathways cohort and yet only 20% of all Victorian
and 8% of all WA treatment episodes. Residential rehabilitation accounted for 29% of the pathways
cohort and yet only 3% of all Victorian data and 6% of all WA treatment episodes. Outpatient
counselling accounted for only 27% of the pathways cohort, but 51% of all Victorian and 63% of all
WA treatment episodes. As such, those in residential treatment were over-represented in the
current sample, because of their greater accessibility and availability for successful recruitment and
completion of baseline interviews. Outpatient counselling clients who agreed to participate and
actually attended the interview appointment may also represent a more stable end of the spectrum
and hence the findings may not be equally representative of the broader treatment-seeking
population within each of the modalities.
The participant retention rate of just under 70% is acceptable but we have no linkage data for the
those who could not be followed up, and consequently, the positive response to treatment
engagement may be inflated since it is based only on participants willing to be re-interviewed. A
major study limitation is the missed opportunity of consenting participants at intake for linkage of
their service utilisation data across systems which would have significantly strengthened the study
findings and enabled service engagement pathways to be explored for participants who could not be
followed up, as well as providing detailed information on objective indicators of harm. It was also
not possible to test the participant-level findings against system-level factors of treatment processes
and pathways.
A further limitation is that the design and method of the follow-up did not enable us to thoroughly
examine sequences of service engagement – either prior to baseline or between baseline and
follow-up, and so our ability to report on optimal pathways is somewhat limited. Furthermore, the
- 119 -
reliability/accuracy of self-reported data on AOD, community health and welfare and acute medical
service use over the course of a one-year period is not known and may have been susceptible to
recall bias, particularly in the qualitative interviews where clients were asked to recall their
experience over the past two years. Despite intentional sampling of both treatment successes and
failures for the qualitative interviews, more than two-thirds of those interviewed reported
treatment successes and hence their data could portray a more positive experience of treatment.
The question of how to best measure integrated pathways remains outstanding, and will be an
important one for future projects of this kind. The high levels of multi-agency engagement in this
cohort at both baseline and follow-up would suggest the importance of mapping intensity and
sequencing of multi-agency engagement, and there is additional work to be done in this area. One
final limitation to highlight was that a standardised measure of mental disorder or symptomatology
was not included in the interview assessment battery. Whilst the WHO-QOL psychological domain
served as a proxy measure of poor psychological health, it would have been useful given the high
prevalence of co-morbid psychiatric conditions among treatment seeking AOD clients (Teesson,
Slade, & Mills, 2009) to have understood which conditions (e.g., personality disorder, PTSD, major
depression etc) were associated with poorer outcomes within the different treatment pathways. The
fact that the presence of unmet need in terms of psychological health (meaning an abnormal QoL
and not attending mental health services post-PIT) had little influence on outcome may be due to its
(poor) measurement using this tool.
Despite these limitations, the Pathways study constitutes the largest client outcome study
undertaken in Australia with a respectable follow-up rate. Further, the inclusion of a diverse range of
treatment-seeking individuals, across different treatment types and drugs of concern, provides
valuable new information that addresses a significant evidence gap within the Australian context.
For these reasons, there are significant implications for policy and practice. As argued previously by
Babor et al. (2010, p. 248), “Policymakers who focus only on decisions about individual service
programmes will usually find that they have limited impact on the outcomes they wish to produce.
In contrast, policymakers who think and act at a systems level, and do so in light of the emerging
evidence based on the nature and impact of systems, have a much greater likelihood of making a
significant contribution to ameliorating drug problems at both the individual and population level.”
Conclusions: The Patient Pathways program of research has been innovative in its adoption of a
multi-method approach – a systems approach to mapping the structures and processes of specialist
AOD treatment and delivery at a jurisdictional level; a cohort study involving recruitment and follow-
up of 800 alcohol and drug users in treatment, and supplemented by in-depth qualitative interviews
of a sub-sample; and analysis of treatment effectiveness using linked ED presentations and hospital
admissions for all individuals engaged in specialist treatment in Victoria over three years. The
qualitative and quantitative cohort data and the linkage analysis provide a consistently positive
message about treatment effectiveness that demonstrate clear gains in wellbeing, as well as
reductions in substance use and acute health service utilisation. This is particularly likely to occur if
rehabilitation occurs at some point in the window of analysis, the index treatment is completed, and
the individual goes on to engage in mutual aid in the community. The results are particularly
encouraging for primary users of amphetamine type stimulants. However, the picture is not
universally positive – around half of the sample showed either no or small reductions in their
substance use despite ongoing involvement with specialist AOD and other forms of professional help
services. Improvements in employment and housing were limited and there was considerable
- 120 -
ongoing utilisation of acute health services. These problems are particularly prevalent among
participants with primary alcohol problems – who benefit most from optimal care pathways. Further
testing of this and equivalent samples are required, both to test the durability of the positive effects
reported and to allow us to refine and develop the underlying conceptual framework.
5.1 Recommendations Recommendations for promoting treatment and supporting best practice
(1) Promote the importance and benefit of accessing AOD treatment and strengthen pathways into treatment. Findings from the client survey, qualitative and linkage data illustrate that engagement with AOD treatment significantly reduces problematic substance use, improves quality of life, and reduces utilisation of acute health services. These findings are critically important for promoting clinician and client confidence. Such evidence is also important for inspiring greater optimism about the value of treatment and recovery7 prognoses for affected families and communities, as well as key linked professions and services, such as housing, justice and mental health.
(2) (a) Promote workforce models that enhance rates of treatment completion. Given that treatment completion was a robust predictor of client outcomes, emphasis should be placed on promoting ways of building and maintaining the therapeutic alliance. This should include encouraging active client participation in care planning and review, and embedding supervision and quality assurance processes that support effective client engagement and retention in treatment.
(b) Consider structural changes to service delivery that enhance treatment completion and address barriers to help-seeking (e.g., services offered outside business hours, telephone support, etc.). Such approaches would address common barriers to treatment identified in the qualitative interviews.
Recommendations for continuity of care
(3) Promote continuity of care. Clients frequently present with complex and severe problems, and with previous experience of the treatment system. However, most funding systems currently focus on discrete, activity-based episodes of care, with little investment in structures to support continuity of care across treatment modalities and over time. In the light of the recently completed Review of the AOD Treatment Service Sector, it is timely to consider funding models that promote continuity and service integration. Funding models should accommodate and promote treatment journeys that involve multiple treatment
modalities and greater linkage to follow-up care.
(4) Encourage services to engage in assertive follow-up of clients. Supported by the qualitative data, assertive follow-up of clients following treatment promotes continuity and re-
7 The term recovery as used in this report is based on work conducted by the UK Drug Policy Commission,
which defined recovery as ‘voluntarily sustained control over substance use which maximises health and
wellbeing, and participation in rights, roles and participation in society’. Controlled use in this context ‘means‘
comfortable and sustained freedom from compulsion to use’. For some this may mean abstinence, for others it
may mean abstinence supported by prescribed medication and for others consistently moderate use of some
substances (UKDPC, 2008, pp. 5-6).
- 121 -
engagement with the treatment system when needed. Examples could include introducing a routine telephone follow-up call 4-8 weeks after completing a treatment episode.
Recommendation for accessibility of long-term residential care
(5) Increase availability of rehabilitation places and reduce the waiting list for long-term residential care. Given the evidence from both the client survey and linkage data that better outcomes are achieved among those receiving long-term residential care, it is crucial that funders and specialist service providers recognise the critical role that rehabilitative services play in a comprehensive specialist treatment system, particularly for individuals who have greater levels of complexity. The qualitative findings indicate that long waiting times for access to residential treatment are a key barrier to treatment engagement. It is imperative that such unmet needs are addressed, and that the benefits of residential rehabilitation are promoted among clinicians and clients.
Recommendation for care coordination
(6) Support care coordination. Linked to the issue of continuity of care, and identified as a key theme in the qualitative interviews, was limited availability of care coordination. Our findings highlight the importance of supporting complex clients effectively transition through the AOD treatment system and engage with relevant health and welfare services when needed, so as to enhance treatment retention and completion. While this role could be performed within agencies, there are opportunities to explore low-cost options such as telephone and online support, provided in every jurisdiction, to assist in both coordinating
care and providing a vehicle for long-term engagement and follow-up.
Recommendation for promotion of aftercare and mutual aid/peer support
(7) Specialist AOD services should develop and promote interventions and pathways to aftercare such as supportive community groups, including but not restricted to mutual aid groups. This could include assertive linkage to peer support groups, such as 12-step and SMART Recovery, using readily available and evidenced-based models that improve engagement with mutual aid (such as the MAAEZ model developed by Kaskutas and colleagues in the US). Being free and widely available (including online meetings), such support groups can be cost-effective models of aftercare, at least for some clients. Previous research has shown that such approaches require workforce training to support staff to make these initial connections and to develop relationships with mutual aid groups.
Recommendations for treatment intensity and pathways tailored to client characteristics
(8) Improve continuity of care and optimal care pathways for alcohol-dependent clients. Clients with a primary alcohol problem were less likely to have good outcomes across all arms of the study, yet benefited the most from having optimal care pathways. This suggests more intense treatment is likely to be required for these clients, but also that achieving change is more challenging in a context of high alcohol availability and acceptability. As much as possible, clients should be encouraged to continue engaging in on-going AOD treatment after completion of a treatment episode, make use of appropriate community services and receive on-going support and aftercare (e.g., mutual aid attendance). Efforts to enhance retention and early re-engagement for those who drop out of treatment are likely to improve outcomes with this population, and should be piloted. Investment in public health/community based approaches to reduce consumption and availability also warrant
- 122 -
continued investigation so as to support individuals adversely affected by alcohol to reduce their drinking, as well as reducing and preventing alcohol-related problems across the community.
(9) Develop mechanisms for the assertive engagement of individuals with problematic meth/amphetamine use into treatment. The positive treatment outcomes achieved in this population, combined with the significant community harms accrued by those not in treatment suggests that this group should be actively engaged in treatment. This should include enhancing pathways to treatment through promoting referrals from agencies where these clients typically present (e.g. mental health, primary care and criminal justice services).
Recommendations for future research
(10) Extend the use of linkage data, as piloted in Chapter 4. As the ‘Tracking Residential Addiction Clients for Effectiveness Research (TRACER)’ study in the UK has shown, gaining client consent for ongoing linkage work allows the mapping of long-term outcomes while requiring only limited resources, and is an important adjunct to treatment outcome research. Such data are essential for sophisticated outcome monitoring, system planning and mapping of health care and welfare service utilisation to clinical outcomes.
(11) Add a health economics dimension to such linkage studies. The linkage data offer an ideal platform for a health economics analysis of the savings associated with treatment engagement and completion by treatment type. The linkage data presented here demonstrate significant benefits in reduced acute health care utilisation, and it would be a key next step to assess its economic impact using both linkage and self-reported outcome data.
(12) Explore longer-term outcomes and pathways following AOD treatment. Given international research highlighting the broader benefits of treatment over time (up to 9 years), it is important that a further wave of follow-up is conducted to effectively measure the full impact of treatment pathways and map trajectories of recovery. Such work is particularly relevant here given that the majority of clients were still engaged with treatment services at the one year follow-up, and the full benefits of treatment engagement are unlikely to have been fully realised.
(13) Ongoing investment in treatment systems research. The present study highlights the importance of treatment systems research that considers the effectiveness of the AOD service sector itself, as well as being an integral component of a broader health and welfare system. Such studies are needed to complement the already well-established tradition of controlled studies of particular treatment modalities, which by design tell us little about the influence of context (e.g., setting, funding, workforce) and implementation challenges. Further investment in treatment system research is essential for informing the design of the Australian AOD sector, and identifying the strengths and weaknesses of particular models of care. One opportunity that exists, but is as yet unexplored, is comparing the existing jurisdictional differences in the configuration of the AOD treatment system to inform the most effective system design at a national level. Further research is also needed on how best to support the broader health and welfare system in enhancing client outcomes and reducing societal costs.
123
6. References
AIHW. (2011a). 2010 National Drug Strategy Household Survey report. Drug statistics series no. 25. Cat. no. PHE 145. Canberra: Australian Institute of Health and Welfare.
AIHW. (2011b). Alcohol and other drug treatment services in Australia 2009–2010: report on the National Minimum Data Set. Drug treatment series no. 14. Cat. no. HSE 114. Canberra: Australian Institute of Health and Welfare.
AIHW. (2013). Alcohol and other drug treatment services in Australia 2011–12. Drug treatment series 21. Cat. no. HSE139. Canberra: AIHW.
Attkisson, C., & Greenfield, T. (2004). The UCSF Client Satisfaction Scales: I. The Client Satisfaction Questionnaire-8. In M. E. Maruish (Ed.), The use of psychological testing for treatment planning and outcomes assessment (3 ed.). Mahwah, NJ, US: Lawrence Erlbaum Associates Publishers.
Babor, T. F., Stenius, K., & Romelsjo, A. (2008). Alcohol and drug treatment systems in public health perspective: mediators and moderators of population effects. International Journal of Methods in Psychiatric Research, 17(1), S50-S59.
Begg, S., Vos, T., Barker, B., Stevenson, C., Stanley, L., & Lopez, A. D. (2007). The burden of disease and injury in Australia 2003. Canberra: AIHW.
Best, D. (2014). Strength, support, setbacks and solutions. Brighton, East Sussex: Pavillion. Best, D., Rome, A., Hanning, K., White, W., Gossop, M., Taylor, A., & Perkins, A. (2010). Research for
recovery: A review of the drugs evidence base. Scottish Government Social Research. Bodenheimer, T., Wagner, E., & Grumbach, K. (2002). Improving primary care for patients with
chronic illness: The chronic care model. JAMA, 288, 1775-1779. Brohan, E., Slade, M., Clement, S., Rose, D., Sartorius, N., & Thornicroft, G. (2011). Further
development and psychometric validation of the discrimination and stigma scale (DISC-12). Psychiatrische Praxis, 38.
Brown, B., O'Grady, K., Battjes, R., & Katz, E. (2004). The Community Assessment Inventory - Client views of supports to drug abuse treatment. Journal of Substance Abuse and Treatment 27, 241-251.
Burns, T., Fioritti, A., Holloway, F., Malm, U., & Rossler, W. (2001). Case management and assertive community treatment in Europe. Psychiatr Serv, 52(5), 631-636.
Bush, K., Kivlahan, D. R., McDonell, M. B., Fihn, S. D., & Bradley, K. A. (1998). The AUDIT alcohol consumption questions (AUDIT-C): an effective brief screening test for problem drinking. Ambulatory Care Quality Improvement Project (ACQUIP). Alcohol Use Disorders Identification Test. Arch Intern Med, 158(16), 1789-1795.
Chi, F., Parthasarathy, S., Mertens, J., & Weisner, C. (2011). Continuing care and long-term substance use outcomes in managed care : early evidence for a primary care-based model. Psychiatric Services, 2011, 62, 10, 1194-1200.
Chi, F., & Weisner, C. (2008). Nine-year psychiatric trajectories and substance use outcomes: An application of the group-based modelling approach. Eval Rev, 32(1), 39-58.
Cox, G., & Comiskey, C. (2007). Characteristics of opiate users presenting for a new treatment episode: Baseline data from the national drug treatment outcome study in Ireland (ROSIE). Drugs: education, prevention and policy, 14(3), 217-230.
Darke, S., Ross, J., & Teesson, M. (2007). The Australian Treatment Outcome Study (ATOS): what have we learnt about treatment for heroin dependence? Drug and Alcohol Review, 26(1), 49-54.
Day, E., Gaston, R. L., Furlong, E., Murali, V., & Copello, A. (2005). UK substance misuse treatment workers' attitudes to twelve-step self-help groups. Substance Abuse Treatment, 29, 321-327.
124
Delucchi, K., Kline, S., & Weisner, C. (2012). Remission from alcohol and other drug problem use in public and private treatment samples over seven years. Drug and Alcohol Dependence, 2012, 124, 1-2, 57-62.
Dennis, M., & Scott, C. K. (2007). Managing addiction as a chronic condition. Addict Sci Clin Pract, 4(1), 45-55.
Department of Health. (2012). New directions for alcohol and drug treatment services: A roadmap. Melbourne: State of Victoria, Department of Health.
Donmall, M., Jones, A., Davies, L., & Barnard, M. (2009). Summary of key findings from the Drug Treatment Outcomes Research Study (DTORS) Research report 23. London: Home office.
Gaston, R. L., Best, D., Day, E., & White, W. (2010). Perceptions of 12-step interventions among UK substance misuse patients attending residential inpatient treatment in a UK treatment setting. Groups in Addiction & Recovery, 5, 306-323.
Gossop, M., Darke, S., Griffiths, P., Hando, J., Powis, B., Hall, W., & Strang, J. (1995). The Severity of Dependence Scale: psychometric properties in English and Australian samples of heroin, cocaine and amphetamine users. Addiction, 90(5), 607-614.
Gossop, M., Marsden, J., Stewart, D., & Rolfe, A. (2000). Reductions in acquisitive crime and drug use after treatment of addiction problems: one year follow-up outcomes. Drug and Alcohol Dependence, 58, 165-172.
Gossop, M., Marsden, J., Stewart, D., & Treacy, S. (2001). Outcomes after methadone maintenance and methadone reduction treatments: two year follow-up results from the National Treatment Outcome Research Study. Drug and Alcohol Dependence, 62(3), 255-264.
Hawthorne, G., Herrman, H., & Murphy, B. (2006). Interpreting the WHOQOL-Brèf: Preliminary Population Norms and Effect Sizes. Social Indicators Research, 77(1), 37-59.
Heilbronn, C., Matthews, S., & Lloyd, B. (in press). Social determinants, drinking and chronic disease: The role of social determinants of health in alcohol consumption and alcohol related chronic disease in Victoria. Fitzroy, Victoria: Turning Point.
Hesse, M., Vanderplasschen, W., Rapp, R., Broekaert, E., & Fridell, M. (2007). Case management for persons with substance use disorders. Cochrane Database of Systematic Reviews, 2007(4:CD006265).
Institute of Behavioral Research. (2008). TCU MOTForm scales and item scoring guide. Retrieved from http://www.ibr.tcu.edu/pubs/datacoll/Forms/adc-MOTsg.pdf: Texas Christian University.
Kaskutas, L. (2009). Alcoholics Anonymous effectiveness: faith meets science. J. Addict. Dis., 28, 145-157.
Kaskutas et al 2009bhttp://www.ncbi.nlm.nih.gov/pmc/articles/PMC2746399/ Kelly, J. F., Stout, R. L., & Slaymaker, V. (2013). Emerging adults' treatment outcomes in relation to
12-step mutual-help attendance and active involvement. Drug Alcohol Depend., 129(1-2), 151-157.
Lloyd, B., Barratt, M., Ferris, J., Best, D., & Lubman, D. (2013). Factors influencing mortality among alcohol and drug treatment clients in Victoria, Australia: the role of demographic and substance use characteristics. Australian & New Zealand Journal of Psychiatry, 47(9), 859-867.
Lloyd, B. K., & McElwee, P. R. (2011). Trends over time in characteristics of pharmaceutical drug-related ambulance attendances in Melbourne. Drug and Alcohol Review, 30(3), 271-280. doi: 10.1111/j.1465-3362.2011.00292.x
Lorig, K., Sobel, D., Steward, A., Brown, B., Bandura, A., Ritter, P., . . . Holman, H. (1999). Evidence suggesting that a chronic disease self-management program can improve health status while reducing hospitalisation: a randomized trial Medical Care, 37(1), 5-14.
Manning, V., Best, D., Faulkner, N., Titherington, E., Morinan, A., Keaney, F., . . . Strang, J. (2012). Does active referral by a doctor or 12-Step peer improve 12-Step meeting attendance? Results from a pilot randomised control trial. Drug and Alcohol Dependence, 126, 131-137.
125
Matthews, S., Jayasekara, H., & Lloyd, B. (2012). The Victorian Alcohol Statistics Series: Alcohol-related harms and use across Victorian Local Government Areas 2000/01-2009/10. Fitzroy, Victoria: Turning Point Alcohol and Drug Centre.
Matthews, S., Jayasekara, H., & Lloyd, B. (2013). The Victorian Alcohol Statistics Series: Alcohol-related harms and use across Victorian Local Government Areas 2000/01-2009/10. Fitzroy, Victoria: Turning Point Alcohol and Drug Centre.
McKeganey, N., Bloor, M., Robertson, M., Neale, J., & MacDougall, J. (1996). Abstinence and drug abuse treatment: Results for the drug outcome research in Scotland study. Drugs: education, prevention and policy, 13(6), 537-550.
McKetin, R., Najman, J., Baker, A., Lubman, D., Dawe, S., Ali, R., . . . Mamun, A. (2012). Evaluating the impact of community-based treatment options on methamphetamine use: findings from the Methamphetamine Treatment Evaluation Study (MATES). [Evaluation Studies Research Support, Non-U.S. Gov't]. Addiction, 107(11), 1998-2008. doi: 10.1111/j.1360-0443.2012.03933.x
McLellan, A., Arndt, I., Metzger, D., Woody, G., & O'Brien, C. (1993). The effects of psychosocial services in substance abuse treatment. Journal of the American Medical Association, 269(15), 1953-1959.
McLellan, A., Lewis, D., O Brien, C., & Kleber, H. (2000). Drug dependence, a chronic medical illness: implications for treatment, insurance, and outcomes evaluation JAMA, 284, 1689-1695.
Ministerial Council on Drug Strategy. (2011). The National Drug Strategy 2010-2015: A framework for action on alcohol, tobacco and other drugs, from http://www.nationaldrugstrategy.gov.au/internet/drugstrategy/Publishing.nsf/content/nds2015
Morgenstern, J., Hogue, A., Dauber, S., Dasaro, C., & McKay, J. R. (2009). A practical clinical trial of coordinated care management to treat substance use disorders among public assistance beneficiaries. . Journal of Consulting and Clinical Psychology, 77(2), 257-269.
O'Brien, C., & McLellan, A. (1996). Myths about the treatment of addiction. Lancet, 347(8996), 237-240.
Orford, J., Hodgson, R., Copello, A., John, B., Smith, M., Black, R., Fryer, K., Handforth, L., Alwyn, T., Kerr, C., Thistlethwaite, G., & Slegg, G. on behalf of the UKATT Research Team. (2006). The clients' perspective on change during treatment for an alcohol problem: qualitative analysis of follow-up interviews in the UK Alcohol Treatment Trial. Addiction, 101, 60-68. doi: 10.1111/j.1360-0443.2005.01291.x
Parthasarathy, S., Mertens, J., Moore, C., & Weisner, C. (2003). Utilization and cost impact of integrating substance abuse treatment and primary care. Med Care, 41(3), 357-367.
Parthasarathy, S., Weisner, C., Hu, T.-W., & Moore, C. (2001). Association of outpatient alcohol and drug treatment with health care utilization and cost: Revisiting the offset hypothesis. Journal of Studies on Alcohol, 62, 89-97.
Pettinati, H. M., Anton, R. F., & Willenbring, M. L. (2006). The COMBINE study: an overview of the largest pharmacotherapy study to date for treating alcohol dependence. Psychiatry, 3(10), 36-39.
Popovici, I., French, M. T., & McKay, J. R. (2008). Economic evaluation of continuing care interventions in the treatment of substance abuse: recommendations for future research. Evaluation Review, 32(6), 547-568. doi: 10.1177/0193841x08316311
Project Match Research Group. (1998). Matching patients with alcohol disorders to treatments: Clinical implications from Project MATCH. Journal of Mental Health, 7(6), 589-602. doi: 10.1080/09638239817743
Rapp, R. C., Xu, J., Carr, C. A., Lane, T. D., Wang, J., & R., C. (2006). Treatment barriers identified by substance abusers assessed at a centralized intake unit. Journal of Substance Abuse Treatment, 30, 227-235.
126
Reavley, N., Cvetkovski, S., Jorm, A., & Lubman, D. (2010). Help-seeking for substance use, anxiety and affective disorders among young people: results from the 2007 Australian National Survey of Mental Health and Wellbeing. . Australian & New Zealand Journal of Psychiatry Research, 44(8), 729-735.
Ritter, A., Berends, L., Clemens, S., Devaney, M., Richards, J., Bowen, K., & Tiffen, R. (2003). Pathways: A review of the Victorian drug treatment service system. Fitzroy, Victoria: Turning Point Alcohol & Drug Centre.
Room, R., Palm, J., Romelsjö, A., Stenius, K., & Storbjörk, J. (2003). Women and men in alcohol and drug treatment: An overview of a Stockholm County study [English Translation]. Nordisk alkohol- och narkotikatidskrift 20, 91-100. [available in English:
www.robinroom.net/womenmen.doc]. Ross, J., Teesson, M., Darke, S., Lynskey, M., Ali, R., Ritter, A., & Cooke, R. (2005). The characteristics
of heroin users entering treatment: findings from the Australian Treatment Outcome Study (ATOS). Drug and Alcohol Review, 24(5), 411-418. doi: 10.1080/09595230500286039
Scott, C., Dennis, M., & Foss, M. (2005). Utilizing Recovery Management Checkups to shorten the cycle of relapse, treatment reentry, and recovery. Drug and Alcohol Dependence, 78(3), 325-338. doi: 10.1016/j.drugalcdep.2004.12.005
Simpson, D., & Brown, B. (1999). Special issue on treatment process and outcome studies from DATOS. Drug and Alcohol Dependence, 57(2).
Simpson, D. D. (2004). A conceptual framework for drug treatment process and outcomes. Substance Abuse Treatment, 27, 99-121.
Simpson, D. D., & Sells, S. B. (1990). Opiod addiction and treatment: A 12-year follow-up. Malabar, FL: Krieger.
Simpson, D., & Sells, S. (1983). Effectiveness for treatment of drug abuse: an overview of the DARP research program. Advances in Alcohol and Substance Abuse, 2, 7-29.
Skevington, S., Lotfy, M., & O'Connell, K. (2004). The World Health Organization’s WHOQOL-BREF quality of life assessment: Psychometric properties and results of the international field trial. A Report from the WHOQOL Group. Quality of Life Research, 13, 299-310.
Stavro, K., Pelletier, J., & Potvin, S. (2013). Widespread and sustained cognitive deficits in alcoholism: a meta-analysis. Addict Biol, 18(2), 203-213.
Teesson, M., Mills, K., Ross, J., Darke, S., Williamson, A., & Havard, A. (2008). The impact of treatment on 3 years' outcome for heroin dependence: findings from the Australian Treatment Outcome Study (ATOS). Addiction, 103(1), 80-88. doi: 10.1111/j.1360-0443.2007.02029.x
Teesson, M., Slade, T., & Mills, K. (2009). Comorbidity in Australia: Findings of the 2007 National Survey of Mental Health and Wellbeing. Australia and New Zealand Journal of Psychiatry 43 (7), 606-614
Timko, C., DeBenedetti, A., & Billow, R. (2006). Intensive referral to 12 step self-help groups and 6-month substance disorder outcomes. Addiction 101, 678-688.
Vanderplasschen, W., Rapp, R., Wolf, J., & Broekaert, E. (2004). Comparative review of the development and implementation of case management for substance use disorders in North America and Europe. Psychiatr Serv, 55(8), 913-922.
Vanderplasschen, W., Vandevelde, S., & Broekaert, E. (2014). Therapeutic communities for treating addictions in Europe: Evidence, current practices and future challenges. In European Monitoring Centre for Drugs and Drug Addiction (Ed.). Spain.
Victorian Auditor-General. (2011). Managing Drug and Alcohol Prevention and Treatment Services. Melbourne: State Government of Victoria.
Weisner, C. (1990). The alcohol treatment-seeking process from a problem perspective: Response to events. British Journal of Addiction, 85(5), 561-569.
Weisner, C., Delucchi, K., Matzger, H., & Schmidt, L. (2003). The role of community services and informal support on five-year drinking trajectories of alcohol dependent and problem drinkers. Journal of Studies on Alcohol, 64, 862-873.

127
Weisner, C., Hinman, A., Lu, Y., Chi, F. W., & Mertens, J. (2010). Addiction treatment ultimatums and U.S. health reform: A case study. Nordi Studies on Alcohol and Drugs, 27(6), 685-698.
White, W. (2009). The mobilisation of community resources to support long-term addiction recovery. J Subst Abuse Treat, 36, 146-158.
Zimet, G. D., Dahlem, N. W., Zimet, S. G., & Farley, G. K. (1988). The multidimensional scale of perceived social support. Journal of Personality Assessment, 52(1), 30-41.