Embed Size (px)
Citation preview
A STUDY OF MATHEMATICS HOMEWORK PRACTICES IN SELECTED SECONDARY SCHOOLS IN KENYA
BONIFACE NJOROGE NGARUIYA
U N IV E R S I T Y OF NA IRO B I CAST AFRICANA COllECTJQB
A Thesis submitted in fulfilment for the degree of Doctor of Philosophy (Ph.D.) in the University of Nairobi.
© August 2002
11
DECLARATION
This thesis is my original work and has not been presentedfor a degree in any other University
BONIFACE NJOROGE NGARUIYA
This thesis has been submitted for examination with our approval as University supervisors
UN IVERS ITY OF NAIROBIPAST AFRICANA COLLECTION
Prof. P. O. Obonyo DigoloAssociate Professor Department of Educational Communication and Technology Faculty of Education University of Nairobi
Dr. Ndichu GitauSenior Lecturer Department of Educational Communication and Technology Faculty of Education Kenvatta University
Ill
DEDICATION
This work is dedicated to my father, . Teacher Mathew Ngaruiya
For his enduring encouragement
and to
Mr J. Gachoho (Gaichanjiru Sec Sch.) and Mr E. Deam (Nakuru High Sch.) mathematics teachers, who patiently encouraged me and other students through
Mathematics difficulties, because they believed it was their duty to do so.
IV
ACKNOWLEDGEMENTI wish to thank my supervisors Prof. P .0.0 . Digolo and Dr. Edwin N Gitau for guidance given throughout the study, and in getting this document to this form. Thanks to Prof. Peter Mutunga who introduced me to issues in Mathematics teaching and learning. 1 also wish to mention the kind encouragement and role model offered by Dr Jane Gatumu, and later Dr John Mwangi and Dr Japheth Origa all of the Educational
’ Communication and Technology Department of the University of Nairobi. Let me also thank Mr Timothy Maonga, the Department chairman and the Dean of the Faculty of Education, Dr Gerald Kimani, for the administrative support that they offered me during the study.
I am especially grateful to the Deutscher Akademischer Austaushdienst (DAAD) who facilitated this study by a research fellowship through the University of Nairobi. Let me also thank the students, teachers and principals of schools who gave time to participatein th is Study. UN IVERS ITY OF NA IROB I
EAST AFRICANA COLLECTION
Thanks to E. Nakhumicha, J. Nyaga, G Chikenjo, H. Gachomo, and P. Mbugua who patiently helped me in the data collection and coding, and for their commitment to support scholarship. Thanks to P. Kirimi who organised for the typing and production of this final document.
I would also like to acknowledge my family’s support through out the period of the study, they who understood that I had to take time off to only study, or be away on field work. Many thanks to you, Pauline for listening tirelessly as 1 clarified my ideas on this study. I will mention the challenge offered by my daughter, Cecilia, who would work tirelessly at her schoolwork and unknowingly encourage me to persist at this work Lastly, I thank all my friends who helped in one way or another in the study, or simply understood when I could not be with them socially, because of this study.
V
AbstractHomework is a common phenomenon in many Kenyan secondary schools, defined as work that is assigned by the class teacher to be done outside the class time. The poor performance o f mathematics.is a concern to many, (c .f . Daily Nation 1998, February 25:6 and Standard 1992,June 9:8). This is despite the fact that mathematics teaching in Kenya is given almost five hours or 11.1 % of instructional time in a week.
Homework is part of teacher’s strategies (Stem. 1995) which has an impact on learning outcomes in mathematics. Yet there has not been so much research on what is done, how it is done and how homework can be planned to meet the needs of different pupils. This dissertation is an attempt at a more detailed study to highlight the situation in Kenya.The study had the following objectives:1. Identify the nature of mathematics homework given to secondary school students in
Kenya2. Investigate teachers’ perceptions on the value of homework3 Find out the opinions o f secondary school students regarding homework4 Investigate the relationship between selected demographic, psychological and
school variables in relation to homework and achievement in mathematics.
Being a basic study in homework, this research was designed as a cross sectional survey. It collated original information on this important area and perhaps may pave
VI
way for other research designs, (Babie,1986). Strang (1975) also advocated that further studies on homework first observe, identify and describe behaviours and teaching related to homework.
A multistage random sample of 1783 secondary school students and 147 mathematics teachers was selected in four provinces of Kenya namely; Central, Coast, Nairobi and Western. The students were selected from Form 2 and Form 4 classes in the secondary schools. Mathematics teachers of Form 2 and Form 4 classes were selected from the schools selected. Questionnaires and achievement tests were the main instruments used to collect the data for the study Interviews and classroom observation were also used to provide supplementary information, which is used to explain and validate the data obtained from the main instruments.
Descriptive statistics (Percentages, frequencies, means,) and inferential statistics ( analysis of variance, correlation) techniques were used to summarize the relationships in the data. The SPSS computer program was used in the analysis.
From the study, it have emerged homework is considered an important activity by both students and teachers. Many students preferred less homework to be able to have time for their own revision in mathematics and other subjects.
1. The teaching of mathematics, as regards homework, did not seem to have a sound theoretical base and students express dissatisfaction with it. Homework
Vll
was given almost daily in all schools, was the same for all students in the class.It was almost always given at the end of the lesson, sourced from the class text, and was drill on the content covered in the lesson.
2. Teachers and student differed on their perceptions of on the negative aspects of mathematics homework, and reasons for non-completion. Perceived difficulty of mathematics and the quantity were the most important reasons for noncompletion of homework. Form2 and Form 4 classes differed on their perception of mathematics homework difficulty. There was no difference between boys on this variable.
3. Achievement in mathematics was negatively related to the number of hours a student put into mathematics homework/study, with the weaker students taking more time on homework. Time spent on homework by both boys and girls was not significantly different. There was a difference, though when students were stratified by class and residence.
4. Low achieving students tended to have lower attitude scores on homework than higher achieving ones. Boys and girls were found to differ on their attitudes to homework, with boys slightly ahead. Boarders also had significantly higher attitude mean scores than day scholars. Students’ self-rating on ability in mathematics was significantly related to their attitude to homework.
5. Most students preferred to do their mathematics homework in the morning with more, but with more day scholars than boarders, and more boys than girls preferring the evening to the morning. Day scholars seemed to be disadvantaged
Vlll
with respect to study facilities (books, study desks, lighting), and on the help they could get from friends on difficult homework.
The study looked at the bigger picture in homework, but is consequently limited in its description of the fine detail that would enable the researcher to make more definite statements on the relationship between homework and achievement in mathematics. Recommendations for action include providing for disadvantaged students through community centres and addressing the disparity between teacher and students perception arising from mathematics homework. Recommendations for further research are outlined in the thesis.
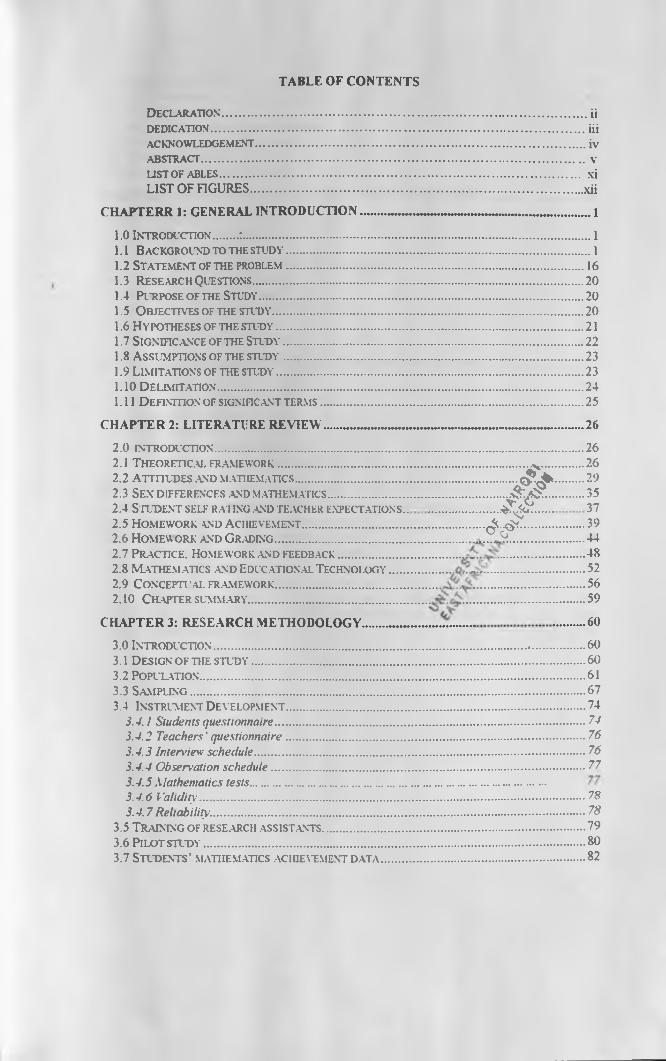
TABLE OF CONTENTSDeclaration..................................................................................................... iiDEDICATION........................................................................................................................... iiiACKNOWLEDGEMENT................................................................................... iv.ABSTRACT............................................................................................................................. VUSTOFABLES...................................................................................................................... xiLIST OF FIGURES............................................................................................................ xii
CHAPTERR 1: GENERAL INTRODUCTION............................................................................11.0 Introduction........:.................................................................................................................. 11.1 Background to the study.................................................................................................... 11.2 Statement of the problem..................................................................................................161.3 Research Questions............................................................................................................ 201.4 Purpose of the Study.......................................................................................................... 201.5 O bjectives of the study...................................................................................................... 201.6 Hypotheses of the study.....................................................................................................211.7 Significance of the Study.................................................................................................. 221.8 Assumptions of the study.................................................................................................. 231.9 Limitations of the study.....................................................................................................231.10 Delimitation........................................................................................................................241.11 D efinition of significant terms...................................................................................... 25
CHAPTER 2: LITERATURE REVIEW ........................................................ - ..........................262.0 introduction...............................................................2.1 Theoretical framework..........................................2.2 Attitudes and mathematics....................................2.3 Sex differences .and mathematics..........................2.4 Student self rat ing .and teacher expectations..2.5 Homework and Achievement..................................2.6 Homework .and Grading...........................................2.7 Practice. Homework .and feedback.......................2.8 Mathematics and Educational Technology......2.9 Conceptu al framework...........................................2.10 Chapter summary....................................................
CHAPTER 3: RESEARCH METHODOLOGY...............
:e E ; #
= & =....... ..................
....
2626293537394448525659
.603.0 Introduction................................................................................................................ 603.1 D esign of the st u d y ........................................................................................................................603.2 Population.......................................................................................................................................... 613.3 Sam pling ..............................................................................................................................................673.4 Instrument Development........................................................................................................... 74
3.4.1 Students questionnaire...................................................................................................... 743.4.2 Teachers' questionnaire...................................................................................................763.4.3 lnter\’iew schedule.............................................................................................................763.4.4 Observation schedule....................................................................................................... 773.4.5 Mathematics tests................................................................................................3.4.6 Validity...............................................................................................................................783.4.7 Reliability........................................................................................................................... 78
3.5 Training of rese.arch assistants...............................................................................................793.6 Pilot study ......................................................................................................................................... 803.7 Students' mathematics achievement data ......................................................................... 82
3.8 D ata collection.............................................................................................................................. 853.8.1 Procedure..........................................................................................................................853.8.2 Observation........................................................................................................................853.8.3 Administration o f questionnaires..................................................................................... 863.8.4 A dministration o f inten’iew s............................................................................................ 86
3.9 Units of analysis.............................................................................................................................873.10 D ata coding .and Analysis.........................................................................................................87
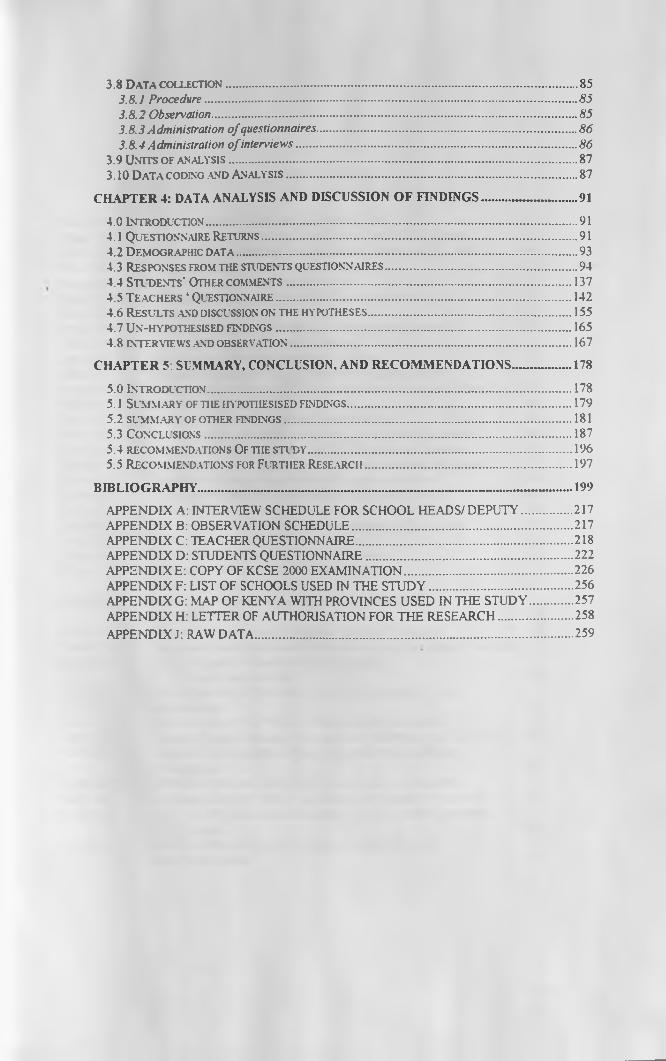
CHAPTER 4: DATA ANALYSIS AND DISCUSSION O F FINDING S..................................914.0 Introduction..................................................................................................................................... 914.1 Questionnaire Returns................................................................................................................. 914.2 D emographic d a t a .......................................................................................................................... 934.3 Responses from the students questionnaires..................................................................... 944.4 Students' Other comments.......................................................................................................1374.5 Teachers ‘ Questionnaire.......................................................................................................... 1424.6 Results and discussion on the hypotheses..........................................................................1554.7 Un - hypothesised findings.......................................................................................................... 1654.8 INTERVIEWS AND OBSERVATION..................................................................................................... 167
CHAPTER 5: SUMMARY, CONCLUSION, AND RECOM M ENDATIONS......................1785.0 Lntroductton...................................................................................................................................1785.1 Sum mary of the hypothesised findings.................................................................................1795.2 summ ary of other findings........................................................................................................1815.3 Conclusions.................................................................................................................................... 1875.4 recommendations Of the study ............................................................................................... 1965.5 Recommendations for Further Research .......................................................................... 197
BIBLIOGRAPHY.......................................................................................................................................199APPENDIX A: INTERVIEW SCHEDULE FOR SCHOOL HEADS/ DEPUTY...................217APPENDIX B: OBSERVATION SCHEDULE............................................................................... 217APPENDIX C: TEACHER QUESTIONNAIRE..............................................................................218APPENDIX D: STUDENTS QUESTIONNAIRE.......................................................................... 222APPENDIX E: COPY OF KCSE 2000 EXAMINATION.............................................................226APPENDIX F: LIST OF SCHOOLS USED IN THE S T U D Y ....................................................256APPENDIX G: MAP OF KENYA WITH PROVINCES USED IN THE STUDY................257APPENDIX H: LETTER OF AUTHORISATION FOR THE RESEARCH........................... 258.APPENDIX J: RAW DATA.................................................................................................................. 259
XI
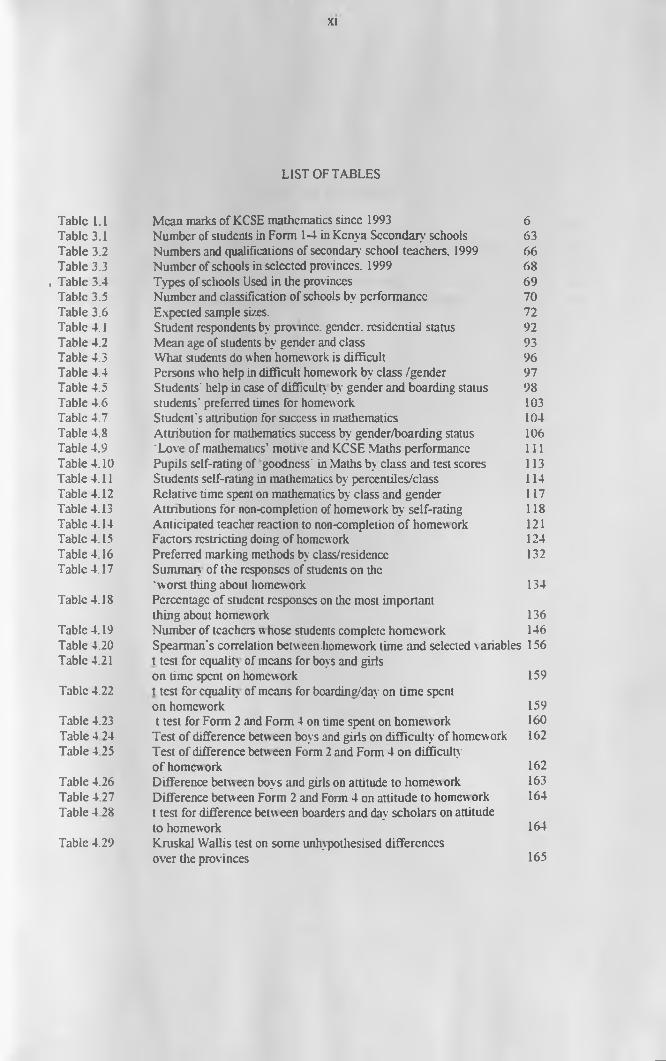
LIST OF TABLES
Tabic 1.1 Mean marks of KCSE mathematics since 1993 6Table 3.1 Number of students in Form 1-4 in Kenya Secondary- schools 63Table 3.2 Numbers and qualifications of secondary school teachers. 1999 66Table 3.3 Number of schools in selected provinces. 1999 68
, Table 3.4 Types of schools Used in the provinces 69Table 3.5 Number and classification of schools by performance 70Table 3.6 Expected sample sizes. 72Table 4.1 Student respondents by province. gender, residential status 92Table 4.2 Mean age of students by gender and class 93Table 4.3 What students do when homework is difficult 96Table 4.4 Persons who help in difficult homework by class /gender 97Table 4.5 Students'help in case of difficulty by gender and boarding status 98Table 4.6 students' preferred times for homework 103Table 4.7 Student's attribution for success in mathematics 104Table 4.8 Attribution for mathematics success by gender/boarding status 106Table 4.9 'Love of mathematics' motive and KCSE Maths performance 111Table 4.10 Pupils self-rating of goodness' in Maths by class and test scores 113Table 4.11 Students self-rating in mathematics by percentiles/class 114Table 4.12 Relative time spent on mathematics by class and gender 117Table 4.13 Attributions for non-completion of homework by self-rating 118Table 4.14 Anticipated teacher reaction to non-completion of homew ork 121Tabic 4.15 Factors restricting doing of homework 124Table 4.16 Preferred marking methods by class/residence 132Table 4.17 Summary of the responses of students on the
‘worst thing about homework 134Table 4.18 Percentage of student responses on the most important
thing about homework 136Table 4.19 Number of teachers w hose students complete homew ork 146Table 4.20 Spearman's correlation between.homework time and selected variables 156Table 4.21 t test for equality of means for boys and girls
on time spent on homework 159Table 4.22 t test for equality of means for boarding/day on time spent
on homework 159Table 4.23 t test for Form 2 and Form 4 on time spent on homework 160Table 4 24 Test of difference betw een boys and girls on difficulty of homework 162Table 4.25 Test of difference betw een Form 2 and Form 4 on difficulty
of homework 162Table 4.26 Difference between boys and girls on attitude to homework 163Table 4.27 Difference between Form 2 and Form 4 on attitude to homework 164Table 4 28 t test for difference betw een boarders and day scholars on attitude
to homework 164Table 4.29 Kruskal Wallis test on some unhypothesised differences
over the provi nces 165
Xll
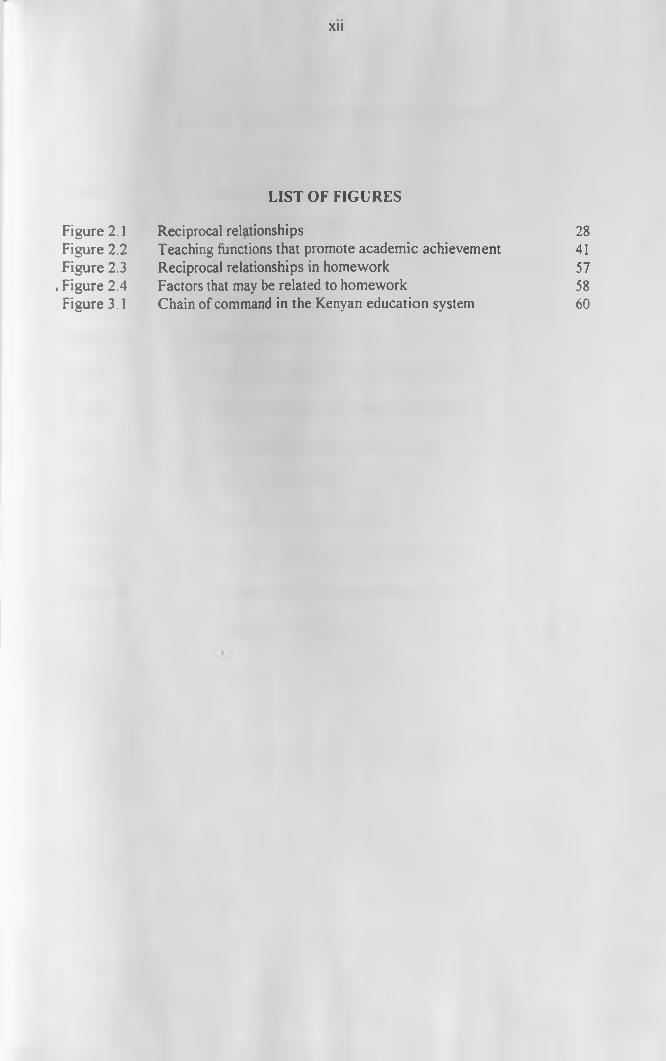
LIST OF FIGURESFigure 2.1 Reciprocal relationships 28Figure 2.2 Teaching functions that promote academic achievement 41Figure 2.3 Reciprocal relationships in homework 57
, Figure 2.4 Factors that may be related to homework 58Figure 3.1 Chain of command in the Kenyan education system 60
Xlll
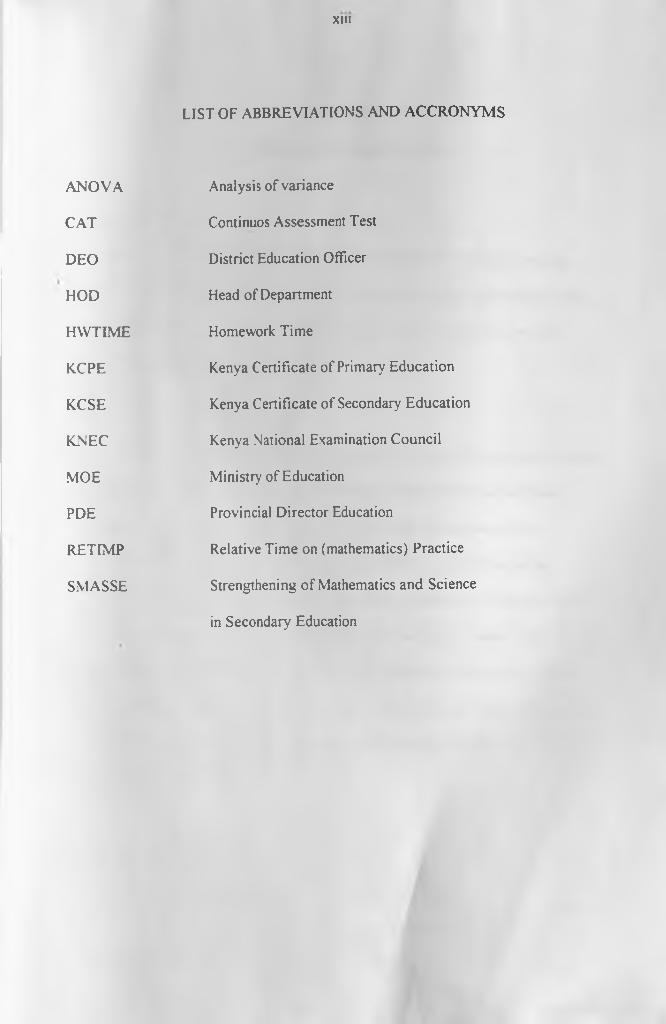
LIST OF ABBREVIATIONS AND ACCRONYMS
ANOVA Analysis of varianceCAT Continuos Assessment Test
DEO District Education OfficerHOD Head of DepartmentHWTIME Homework TimeKCPE Kenya Certificate of Primary EducationKCSE Kenya Certificate of Secondary EducationKNEC Kenya National Examination CouncilMOE Ministry of EducationPDE Provincial Director EducationRETIMP Relative Time on (mathematics) PracticeSMASSE Strengthening of Mathematics and Science
in Secondary Education
1
CHAPTER 1GENERAL INTRODUCTION
1.0 IntroductionIn this first chapter, a background showing a rationale for the choice o f the study is given. This chapter also describes the gap that this study hoped to fill, the objectives and hypotheses of the study, purpose and significance o f the study, and limitations of this study.
1.1 Background to the studyIn almost every country of the world, education is now acknowledged to be one
important means of promoting economic, social and national development, Fagerlind & Saha (1983), Malyamkono et al. (1982). Education is also considered to be one sure way for individual self-development including upward career mobility and economic well being, Weisbrod (1970), Republic of Kenya (1964). With the decreasing opportunities for university entrance and employment, many people are concerned with students' performance in national examinations. In Kenya, only about 0.5 % of those entering Standard One ever make it to university (Republic of Kenya 1984), making the Kenyan school system very competitive.
This may also be observed from the high number of newspaper articles commenting on performance once the Kenya Certificate of Primary Education (KCPE) and Kenya Certificate o f Secondary Education (KCSE) results are announced around January and March respectively o f each year.
2
To cushion their children from failure, many parents and schools encourage private tuition (coaching) for their pupils in preparation for national examinations. For instance, Kapiyo (1980) in a study of mathematical achievement among standard Seven pupils reported that many pupils in Kisumu Municipality schools were attending evening coaching in English and mathematics. Similarly the 'Daily Nation’ (1991, October 19:20) had this to say on coaching:
The Kenyan system of education is heavily skewed towards examination success and it has been embedded in the minds of students, their parents and teachers that extra tuition is necessary to insure against probable failure. Contrary to the belief that coaching is only rampant in urban schools, it is in fact common in rural areas as well.
A preliminary search for articles in the local daily newspapers in the 1980s and 1990s revealed many articles on private tuition but few on homework. This may suggest that parents, teachers and students long for their children’s success in examinations, and one important route to such success is through tuition. Since all are aware of homework, it would also imply that homework is not taken as seriously as coaching or that the public is satisfied with the way homework is conducted toward success, or even that they don’t care about its possible contribution. This latter position is untenable in view of the foregoing evidence.
According to the International Dictionary o f Education (Page, 1979:164), homework is school -work done at home. For clarity, it may be added that it is work assigned by or in conjunction with a teacher in class to be done after
3
lesson time, no matter where it is done. It may be done within the school, at home, or elsewhere. Some may refer to it as assignment, perhaps to emphasise that it is given by the teacher, and to remove the association with the home for boarding schools. Almost every pupil in Kenya is familiar with homework, being an old instructional technique.
Most mathematics textbooks contain many exercises after every topic which students are expected to work on. Leder and Gunstone (1990:110) argue that "the pages o f graded examples found in many textbooks in use today are reminiscent of Thorndike's (1922, 1924) own graded drill and practice examples". The assumption is that students would attempt/or do the problems after the explanations, and in so doing learn mathematics.
In China it is reported that parents resisted an innovative 'homework -free ' program developed by educational experts from the East Normal University fearing that their children might not make it to high school and university (Curriculum Review, 1995, January: 4). In Japan, Shiba (1986) reports a successful private tuition programme, the Kumon Institute of Education that has been used successfully to uplift the performance o f students especially in mathematics and English. The programme is worth mentioning because essentially it manages students' progress through worksheet tasks, that a teacher assigns and marks, an equivalent of homework.
4
Mathematics is considered important for scientific and technological development (Travers & Westbury 1989:33) and consequently are compulsory subjects in the Kenya secondary school curriculum, Eshiwani (1981:1). The first 1EA study of mathematics noted that:
In recent years a growing recognition of the importance of mathematics has led to a widespread concern in many societies about the output o f mathematics learning that emerges from educational systems. Mathematics is, or is seen to be, of such importance that the qualityand quantity has become.. a social issue. Travers and Westbury
n o « o i A7\ U N IV E R S IT Y OF NAIROBIU 10/j EASTAFRICANACOLLECTIO*
Locally, scholars have also lauded the place of mathematics in science and technology as being ‘‘at the centre of socio-numeric transactionism and technological development (Gunga, 1998:1) and as “ the foundation stone of Scientific and Technological education.” (Kimani, 1991). The relationship between education, science and mathematics is succinctly summarised by Kuku (1990) -in a discussion on the role of mathematics sciences in African development:
The social and economic development of any country or continent could be measured in terms of its development in science andtechnology. Since we cannot have technology without science andneither can we have science without mathematics, it is clear the socialand economic development of a country or continent ultimately dependson its development in the mathematical sciences
Hussen (1967 243) similarly reported that in all countries, the number o f scientists and technologists produced at the various levels were inadequate because students found mathematics dull or difficult or both. Being such an important subject to Science and Technology, Mathematics is a compulsory subject to all pupils in all countries in the world. Three international studies on the teaching and learning of Mathematics were based on such considerations. (Hussen, 1967), (Travers & Westbury 1989). Travers and Westbury (1989:1) had this to say about mathematics:
Through out the world, mathematics occupies a central place in the school curriculum In most school systems between 12 and 15 percent of student time is devoted to mathematics... In view of the importance of mathematics in society and in the schools, the efficacy o f mathematics teaching and learning demands continued and sustained scrutiny.
In Kenya, the Mathematics syllabus in schools has been changed thrice in the last 40 years. At first there was the traditional Mathematics, then came the new/modem, and lastly the appropriate mathematics since 1981 to the present. Many comments were recorded in the local press on modem
mathematics, thus confirming that Mathematics is a social concern. In Britain, there was the Cockcroft committee which was instituted to study Mathematics teaching and learning in schools (Cockroft 1982). In the USA, Kline (1980) mentions several groups that campaigned for and helped shape the Mathematics curriculum .Despite the importance accorded to Mathematics, the problem of poor performance is worldwide. For example, Holmes (1983) reported low
6
performance (with many failing) in Mathematics in Israel. In explaining some o f the reasons which prompted the introduction of modem (new) Mathematics Kline (1980: 8) reports that “ there was general agreement in the 1950’s and even before that the teaching o f mathematics had been unsuccessful. Student grades in mathematics were far lower than in other subjects.” Nichter (1984) in a study for the UNESCO science improvement project in Africa reported a shortage o f Science and Mathematics teachers. This in turn was caused by poor results in these subjects at the school level. The Gachathi Report in Kenya (Republic o f Kenya. 1976:67) reported a similar problem.
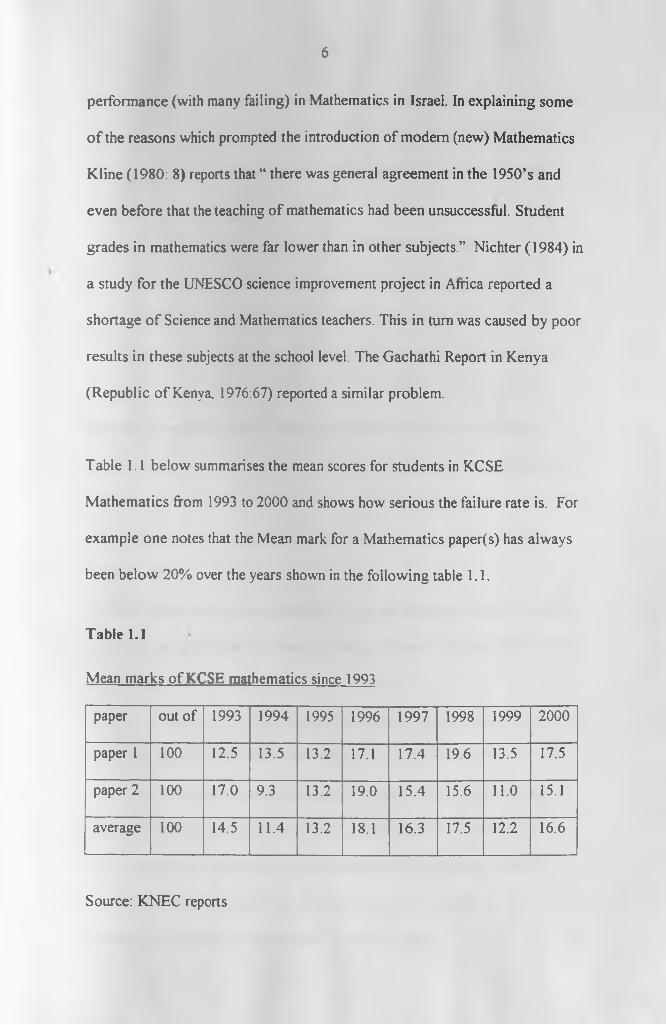
Table 1.1 below summarises the mean scores for students in KCSE Mathematics from 1993 to 2000 and shows how serious the failure rate is. For example one notes that the Mean mark for a Mathematics paper(s) has always been below 20% over the years shown in the following table 1.1.
Table 1.1
Mean marks of KCSE mathematics since 1993paper out of 1993 1994 1995 1996 1997 1998 1999 2000paper 1 100 12.5 13.5 13.2 17.1 17.4 19.6 13.5 17.5paper 2 100 17.0 9.3 13.2 19.0 15.4 15.6 11.0 15.1average 100 14.5 11.4 13.2 18.1 16.3 17.5 12.2 16.6
Source: KNEC reports
7
Many people in Kenya are concerned with the performance in Mathematics and English which are done poorly year in year out. In reacting to the announcement o f the KCSE 1997 results, an editorial of the Daily Nation (1998, February 25:6) commented that:
... also worth noting in the results is the poor performance in mathematics ... a trend that has continued for some time now...This is a serious indictment of a nation whose eyes arefocussed on industrial take-off in the first quarter of the next century.
Similarly an editorial of the' Standard'- estimated to be the second largest readership daily in Kenya - (1992, June 9:8) lamented the poor performance in Mathematics especially in secondary schools and at the polytechnics. They were concerned that poor performance in mathematics lowers students overall performance.In 1996, there was a serious exchange of views from people all over Kenya in reaction to an article, the “Mathematics failure debacle”. (Muya, 1996: October 12) in which he wrote that.
... in KCPE where more than 30 per cent o f candidates get grade A and B, more than half of the standard eight candidates get grade D+ and above. However most pupils become mathematically incompetent when they join secondary school. In 1995 KCSE only about 5.25
per cent of the 140,000 candidates scored B- and above, only 18.5 per cent of the candidates managed a grade D+ and above.
(Note: In the grading system, grade D+ is the pass mark.).
8
Several suggestions were put forward as to why there was a problem. Primary school teachers blamed secondary school teacher for laxity, secondary school teachers blamed primary teachers for teaching the students only to get the answer without working methodically. Bull (1996, November 2), explained that “no subject depends on the teacher like mathematics. To those who ‘cannot’ do Mathematics their inability can almost certainly be traced to a poor teacher" while Wahome (1996, November 6) explained that the methods and tools are critical saying that mathematics “lessons are inevitably a monotonous dreary experience o f books, chalk and of course the cane. This erodes the students interest. ... primary school teachers effectively use oranges to teach fractions, balls for spheres and even fingers and toes to aid enumeration". Kimamo (1996,October 28), was of the opinion that “teachers can boost the students’ morale by dispelling the latter’s feeling [that] they are a special or exceptional breed of people as they are able to teach Mathematics”.
The editor (Daily Nation 1996, October 14) commented that “it certainly doesn’t make sense for the Ministry of Education to continue to keep staff on the payroll to teach a subject in which the majority fail” . This may be the feeling o f a number of people, if the editorial of a wide circulation daily newspaper be the voice of some majority in a country. Tsuma (1996, October 19), suggested that “the problem of poor performance in Mathematics is serious enough to warrant mounting a national seminar similar to the one organised by the Commission for Higher Education (CHE) on science education in 1990.”
9
Similarly commenting on the performance of the 1990 KCSE examination, the KNEC reported that candidates seem to lack basic knowledge o f Mathematics and even to have forgotten what they learned in primary school. They suggested that this problem should be dealt with through remedial teaching.
One wonders why Mathematics (and English) which are given so much time onthe timetable are the least well performed in Kenya national examinations. Onewould expect that, other things being equal, time allocated to a subject would beroughly related to achievement in the subject. Stallings & Kaskowitz (1974),Psacharopoulos (1986). Other research, however, seems to show no significantrelationship perhaps because allocated time is only a rough indicator of timeactually spent learning, Roseshine & Berliner (1978). Coulter (1979) argues thatout of class learning especially homework is an important factor not consideredin such time-achievement studies. UHIVESS1TV 0F NA|ROt,
EAST AFRICANA COLLECTIO*
At the secondary school level o f the current 8-4-4 system, there are seven and six instructional periods per week for mathematics and English respectively. This works to about 15% and 13% of the school time. It is thought that these two subjects also receive the largest amounts of homework and tuition. Could it be that students are not satisfied with the use of time in these subjects for example, too much homework or have they formed negative attitudes towards these subjects as a result of the homework practices and teaching?
10
KNEC (1995:83) reports an unfortunate state of affairs in mathematics that:The performance [of mathematics in KCSE 1993/1994] indicates that some candidates may have ‘dropped’ mathematics after may be two years in secondary school...there is no other reason than lack of interest in the subject that can make them ‘drop’ the subject. Lack of interest could be due to the way the subject is taught. We therefore request teachers to devise ways of making maths interesting to their students.
Dropping Mathematics may be unfortunate considering the fact that Mathematics is a compulsory subject which is required in many post-secondary courses and in other spheres of life in an increasingly technological world. Dropping Mathematics by Form 2 certainly narrows down students’ choice, but without the students’ full awareness of the consequences of such actions.
For example a look at the KCSE enrolments between 1997 and 2000 for Physics (more associated with Mathematics) showed a 21.17 % increase as compared to46.8 % in Biology (less associated with mathematics). Students who avoid Mathematical courses also tend to avoid courses that need Mathematics, (Sells, 1976), while students who choose to study Mathematics are more likely to pursue science courses, (Thomas, 1984).
Whereas there could be other reasons for poor performance in Mathematics, motivation with the right attitude is central to the learning of mathematics or any other subject, for that matter. But it is so much more important in mathematics because the subject requires students to deliberately and logically
apply themselves to solve puzzles using known rules, [Gunga (1998:17)]. Mutunga and Breakell (1987:221) assert that if mathematics students are dissatisfied or discouraged, they may exhibit unfortunate behaviour or they may refuse to exert any reasonable effort to the task at hand.
Sears (1966:22) similarly contends that "in any thoughtful attack upon the improvement of education for pupils who must live in this modem world, one is immediately struck by the fundamental role of attitudes and motivations in the learning process". Good and Brophy (1987:310) suggest that for students to be motivated to learn they need a supportive environment, appropriate level of task difficulty and meaningful objectives and:
.. not continued practice on skills that have already been mastered ... and working on tasks that are assigned merely to fill time rather than achieve meaningful learning objectives.
Appropriate level of task difficulty is defined as " when students are clear enough about what to do and how to do it so that they achieve high levels of success if they apply reasonable effort." One anticipates a motivation problem when the student is asked to do Mathematics homework tasks that are too difficult or unclear.
As stated above, pupils could do poorly in mathematics because of their low motivation that results from poor teaching methods. Homework is one aspect of teaching mathematics, being one of the teacher’s strategies (Stem, 1995).
12
Holder & Mitson (1974:ix) caution that" that teaching produces learning, and that learning is a result of teaching are the twin fallacies on which traditional schools are based, in many school schools a lot of teaching, but not learning takes place.” This would seem to summarise the situation in mathematics well: students are taught Mathematics almost every day in the week, yet they don’t seem to learn, if the Mathematics reports of the KNEC are anything to go by. KNEC (2000) argues that poor performance in a subject indicates areas of the syllabus not covered or poorly covered, and suggests how such areas could be better managed or taught better. Though there is plenty of research on factors that contribute to success in mathematics none looks at how homework is organised in Kenya or how it contributes to failure or success in Mathematics.
Homework is a variable that teachers themselves can alter to improve learning in mathematics. Mathematics homework can serve as feedback to the student and teacher in the learning of mathematics. Have the skills learnt today been mastered? Are the students ready to move on to the next topic? But it can also be used negatively, perhaps unwittingly, to convince the student that they are not good at all in Mathematics.
Oliveira-Lima (1983) considers tests and examinations as “ a necessary tool for the teachers to control their classes with, in the absence of better teaching methods o f motivation. If they didn’t have the power to fail people, the great majority o f teachers would be unable to practise their profession”. Perhaps homework in mathematics offers the teachers such a daily examination to keep
13
in control or even to while away time to cover For lack of planning? Klieband, (1995) similarly asserts that “ Practice and drill [homework?]... persist not because they have specific pedagogical sanction but because they are proven instruments of control”. To motivate students to do homework, Ashworth(1981) advocates that teachers must select homework carefully to ensure that students can do most or all the problems given. Otherwise, it will be the usual state of affairs that “often the homework leads to frustration and annoyance on the part o f the child and the parent as they watch the child prove to himself he is no good and doesn’t know how to do maths.” Ashworth (1981:71).
U N IV E R S IT Y OF NAIROSte a s t a f r i c a n a c o l l e c t i o m
It seems that in many good performing schools in the KCSE, a high degree of efficiency is built into the instructional system reducing the need for extra tuition. Muya (1991, February 23:19) reported Griffins, the Director of the Starehe Boys Centre (school) as saying that students start preparing for KCSE in Form 1 and that without good management of time there cannot be success in these examinations. Sr. Claudia of the Precious Blood school (a leading girls school in Kenya) was quoted in the 'Daily Nation' saying that "the 8-4-4 curriculum is quite demanding and both teachers and pupils and teachers do extra work to cover the syllabi", (‘Daily Nation’ 1991, February 23). In outlining her school’s position, another Principal o f the same school said that “our foremost goal is not academic achievement but the integrity and well being of the whole person. As a consequence good results may follow.” (Vogel, 1998). Maneno, the then Alliance School (another leading National school) principal had similar sentiments when he said
14
It is not only the quality of students selected in form one that matter but also what actually happens to the student in the four years he is preparing for his 'O levels. This is what matters. If nothing positive and constructive happens, the student will certainly do poorly.(Weekly Review: 1984, March 2)
Chege (1992 July 4:14) argues that though Catholic Schools in New York have larger classes, less professional teachers, more limited resources and less expenditure per student, students perform well. Although there could be other explanations for such performance, he underlines the contribution of homework saying that:
Catholic schools give more homework to pupils, especially those that are disadvantaged in one way or another ... Catholic Schools in the United States Perform better in English and Maths and that in intellectual development, they significantly outpace public schools.
OFSTED (1995:2) in their report on homework concluded that homework has the potential to raise standards, extend the curriculum coverage, allow more effective use of class time and improve students’ study skills and attitudes to learning. ILEA (1984) also called the Hargreaves Report (1984) similarly emphasized the importance of homework in cutting down instructional time in British secondary schools.
Among many instructional methods books skimmed in local libraries, the author found only a few that gave more than a cursory treatment - about a paragraph or
15
two - of homework/ assignments. Among these are Arends (1981:70 -94), Bell (1978; 391-395), Patel and Ayot, (1987:110- 117).
Stem (1995: 47) had a similar concern over lack o f emphasis on homework in Britain and wrote:
Practically every course 1 have been on has either ignored homework altogether, or at best, just mentioned it. With homework I really do think we differentiate or die - either differentiate or set mindless tasks or set no homework.. .much less time seems to be spent justifying, planning for, and supporting homework, than is spent on classwork. There hasn't been so much research on what is done, how it is done, and how
homework (like classwork) can be planned to meet the needs o f different pupils and to allow all pupils equal opportunities.
Grambs and Carr (1979:319) state that homework must be genuinely aimed at learning otherwise it would be busywork, which is destructive for it destroys students’ confidence in the teacher’s values. Where homework is used effectively it is assigned when needed and not as part of a daily or weekly ritual. The amount of homework should be controlled so that it does not make excessive demands on the students’ time, Butler (1969). One therefore wonders whether teachers in secondary schools follow accepted learning principles in their organisation and management of Mathematics homework, despite lack of guidance on homework from common books.
16
Some research has been done in the USA and Britain on homework but in Kenya only two studies were found that touched on the issue of homework. (Kibanza, 1980), Eshiwani (1983). This latter study by Eshiwani, (1983) reported that:
over 60 per cent of the schools had no formal prep or homework given to pupils. Although prep appears on the timetables, pupils are left to do
what they like. Headmasters do not check on their teachers to make sure they set assignments for prep/ homework. In other words, prep/ homework is not taken seriously either by pupils or by teachers in most schools in western Kenya, (p.27)
It should be worthwhile to probe Mathematics homework in Kenya to find out how it works and how it can be best organised to improve students’ performance in Mathematics. It seems possible that good organisation of homework could obviate the need for private tuition, and thus help raise the performance in Mathematics of all or most students whatever their social economic status. Eshiwani (1983:27) argued that homework should be taken seriously as an integral part of the teaching /learning process saying "Here is a variable that is virtually costless in terms of money but which seems to provide a high return in terms o f school achievement."
1.2 Statement of the problemThe poor performance of mathematics is a concern to many, (c .f . Daily Nation 1998, February 25:6 and Standard 1992,June 9:8). Homework is part of
17
teacher’s strategies,(Stem, 1995), and it is one important way through which learning time can be extended, (Arends, 1991). The Hargreaves Report (1984) in Britain noted that in secondary education homework can contribute the equivalent of at least 20% saving in full time study and that poor homework policies contribute to enlarging the achievement gap between higher and lower achievers. Through homework the student can learn to be responsible for “responsibility is predicated by [sic] autonomy ... there is no where in mathematics is the learner more autonomous than during homework”, (Spandano. 1996).
Although homework is an important area of concern to parents, pupils and teachers, it has not been adequately addressed in Kenya. There has not been so much research on what is done, how it is done or how homework can be planned to meet the needs of different pupils in mathematics.
One study by Eshiwani (1983) was counted, but even this one, touched on homework incidentally. It looked at homework as one of the variables that contribute to poor performance among primary and secondary school pupils in Western Kenya. (Eshiwani, 1983). The study did not distinguish between prep and homework. Although the two aspects are related, this study will distinguish between them and emphasise on homework because in it there is an implication for partnership between the teacher and the student. Prep time is preparation time, time when the students are expected to do their own personal study and complete homework in the various subjects. During prep students may choose
18
to do homework in mathematics or some other activity. A more focused study is therefore needed to highlight the situation in Kenya.
In Kenya the secondary school student has about as many hours to learn outside class (4 p.m. to 10 p.m.) as they do in class (8am -4pm). This means that a student can put as many hours into his or her own study as with teaching. Although all schools have the same time assigned for learning Mathematics, (allocated time) the time actually spent learning Mathematics (engaged time), will differ from school to school depending on the efficiency o f the instructional process.
Learning time in which students are actively engaged and experiencing a high rate of success (at least 75%) - called Academic Learning Time (ALT) is the most highly correlated with achievements, (Denham & Liberman, 1980). Yet teachers could be taught to change the Academic learning time of their students for the better in twelve hours. (Berliner, 1978). Caillods and Postlethwaite (1989: 188) recommend that "homework is highly associated with increased achievement and it is important that it takes place in greater amounts as pupils ascend the school system".
One equitable way to extend academic learning time in mathematics is through good homework management (Arends, 1985:83). Homework is well managed when students work on homework and teachers are willing to supervise it to help individual students to achieve higher in mathematics. Hamblin (1981)
19
advocates that “consistent training in homework methods is necessary if negative attitudes are not to develop ... pupils not only under-function in school but also in homework” Butler (1969:373) warns that homework is inefficient for the time consumed is often disproportionate to the value gained, and that it often results in misconceptions and the making of so many errors that much time is spent in the next session of the class correcting errors made at home, errors that could have been prevented by sufficient preparation in class.
In talking about rights and duties of a pupil in the school, Jensen & walker (1989:158) propose that there be a statute on homework spelling out the obligation to do homework, homework period on the time table, overall load of homework, spreading of homework tasks, and the possibility o f being exempted from homework as a way of giving leave. Is there such planning for homework towards a culture that values homework as an important school activity?Are Kenyan secondary school students adequately engaged and do they experience high rates of success in after class mathematics activities especially through homework? Could the homework itself be the problem in learning mathematics? How do secondary school teachers and students in Kenya view homework and how does the homework focus in schools affect their performance in mathematics? Do secondary school teachers put the necessary effort to guide students to show their working method or do they encourage the system of the ‘answer only’ used in the primary school? After all secondary school Mathematics teachers have a whole four years to inculcate desired values
20
in the more mature students. The researcher has attempted to answer some of these questions along the objectives and hypotheses stated below.
1.3 Research QuestionsThe following are questions this study attempted to answer:1. What is the nature and context of mathematics homework given to
secondary school students in Kenya?2. How do students and teachers perceive such homework?3. What are mathematics teachers perceptions of homework4. Is there a relationship between selected variables related to homework in
mathematics and achievement?
, , „ , L 0 U N IV E R S IT Y OF N A IR O B I1.4 Purpose of the Study EAST AFRICANA COLLECTIONThis study investigated the kinds of mathematics homework given to secondary
school students, students and teachers' perception on its value and how certain variables associated with homework in secondary schools relate to achievement in mathematics
1.5 Objectives of the studyThe objectives of the study were to:
1. Identify the nature and protocol of Mathematics homework given to secondary school students in Kenya.
2. Find out the opinions of secondary school students regardinghomework
21
3. Investigate Teachers perceptions of secondary school mathematics teachers on the value of homework.
4. Examine the relationship between students’ self-rating o f ability in mathematics and perception of mathematics homework
5. Determine the relationship between homework and achievement in mathematics
1.6 Hypotheses of the studyTo achieve the objectives of the study, the following null hypotheses were generated and tested:HOI There is no significant relationship between time spent on homework
and achievement in mathematics.H02 There is no significant difference between boys and girls on the amount
o f time they spend on mathematics homework H03 There is no significant difference between boarders and day scholars in
time spent on daily homework.H04 There is no significant difference between Form 2 and Form 4 students
in the time they spend on daily homework.H05 There is no significant difference between boys and girls in their
perception of mathematics homework difficulty.H06 There is no significant difference between boarders and day scholars in
their perception of difficulty of Mathematics homework.H07: There is no significant difference between Form 2 and Form 4 students
in their perceptions of homework difficulty.
22
H08 There is no significant difference between Form 2 students and Form 4 students on attitude to Mathematics homework
H 09 There is no significant difference between boarders and day scholars in their attitude to homework
HO 10 There is no significant correlation between students' self rating in mathematics and their attitudes to homework.
1.7 Significance of the StudyFrom a preliminary literature review, it was thought that this would be perhaps among the fewest studies in Kenya to address the issue of homework to some detail. It suggests ways of improving the management of homework for better student learning in mathematics. It is hoped that this study will provide reliable information on the extent of mathematics homework and its organisation in Kenyan Secondary Schools. It will also help parents, teachers and students, and school administrators to gain needed insights on how homework could be better organised to help improve performance in mathematics.
It could also, possibly, stimulate a need for more studies in the area as more questions are raised on mathematics homework. We need to study homework for us to be able to see why it works or why it does not.
23
1.8 Assumptions of the studyIn this study it was assumed that:1. Homework can contribute to student achievement and that it was given in
all schools2. Marks and grades obtained from schools and KNEC are reliable and valid
measures of achievement.3. School administrators, teachers, and students all share the same goal o f
attaining the learners’ full potential performance in mathematics.4. Views expressed towards mathematics homework are accurate and a good index for actual behaviour.
1.9 Limitations of the study.This study concentrated on teachers and the students in their secondary schools even though it recognised that the home environment may also be important in promoting interest and persistence on homework tasks. The first IEA study of Mathematics Achievement reported that “pupils judgements of the importance of mathematics are associated with the extent to which their parents want them to do well, and to a lesser extent with their parents own attitudes towards mathematics”, (Pidgeon, 1967:105). For purposes of economy, the parent and the social economic status of the students were deliberately left out o f the research, despite them having an important role in shaping the aspirations of their children and motivating them towards schoolwork.
24
Secondly, there are many other environmental factors that would affect the mathematics mean grades at KCSE in schools, and student attitudes toward mathematics, which this study did not seek to control. For example, this study did not collect information on the actual ability o f the students sampled, perhaps as measured by their last examination (KCPE), or how such scores could interact with their school to shape future aspirations and perceptions for particular respondents towards mathematics homework. It is hoped that, however, this study can serve as some beginning for further research in this area.
This study too took a lot of time to complete, having being done simultaneously with other regular teaching duties. For example, the pilot study was done in 1998 but the main study was done in 2000 due to logistical problems. Some aspects as is normal in a survey may have changed but the researcher is o f the opinion that there are many other aspects of this study that remain valid for purposes o f discussion on the situation in Mathematics homework.
1.10 DelimitationThis study was limited to secondary schools in Kenya. Specifically the samples were taken from Form 2 and 4 students and their teachers. Generalisations to other levels o f education and to other classes in the secondary school must be applied cautiously.
25
1.11 Definition of significant termsHead of Department (HOD): A teacher appointed to oversee and co-ordinate
the academic activities o f a department. Mathematics is a sub-department in the Science department, but in larger schools it operates as an independent department.
Homework focus: The extent to which homework is emphasised as shown by amount of homework, marking, and administrative involvement.
Kenya Certificate of Primary Education: (KCPE):The summativeexamination done at the completion of eight years of primary school.
Kenya Certificate of Secondary Education: ( KCSE): The summative examination done at the end of four years o f secondary school.
Kenya National Examination Council (KNEC): the National examining bodywhich sets, administers, and processes the KCPE and KCSE.
U N IV E R S IT Y OF NA IROB IMatatu: Public commuter vehicles EASTAFRICANACOLLECTIOH
Out huts : A single or double room outside the main house, built for unmarried Male adolescents who feel uncomfortable sleeping in the main house, especially in the rural areas. Cooking is done from the main house.
Private Tuition/coaching: Practice of giving students extra teaching and preparation for examinations, usually for a fee, to raise their achievement in school and national examinations.
Protocol: Routines, practices that surround or are adopted in homeworkSMASSE: Strengthening of Mathematics and Science in Secondary Education.
A joint project of the Ministry of Education, Kenya and Japanese Government aimed at improving the teaching of Mathematics and Science in Kenya.
2 6
CHAPTER 2 LITERATURE REVIEW
2.0 IntroductionThe review of literature focused on the pertinent areas of theory, practice, and research. It sought to help understand and form a basis for the present research on homework in secondary schools. In this chapter literature is reviewed in nine
sections as follows:(i) the theoretical framework for the study(ii) sex differences and mathematics(iii) attitudes and mathematics(iv) students’ self-rating and teacher expectations(v) homework and achievement(vi) homework and grading(vii) practice, feedback and homework(viii) mathematics and educational technology(ix) conceptual framework
2.1 Theoretical frameworkIn this study, the behavioural approach to the understanding of learning was assumed The behaviourist view is based on the definition of learning in terms of observable changes in behaviour. This theory is based on the stimulus - response -reinforcement model after Thorndike (1927) and Skinner (1961). According to Thorndike’s law of effect learning involves forming bonds between situations (stimuli) and desired responses, asserting that the connection
27
between a situation and a response is strengthened when they are followed by a satisfying state of affairs (reinforcement). He further proposed a law of effect that the more a Stimulus - Response (S - R) bond is practised the stronger it becomes. Skinner emphasised the role of reinforcement in shaping behaviour, by reinforcing desired responses or their approximations. Operants (responses) which are reinforced get a higher probability o f recurring. Behaviourists assume that learning is controlled by environmental variables. According to Joyce and Weil (1992: 292),
People respond to variables in their environment. These external forces stimulate individuals to behave in certain ways: either to exhibit or avoid behaviours... From this stance the task of the psychologist is to discover what kinds of environmental variables affect behaviour in
which ways. The educator ascertaining these relationships can apply the findings directly to his or her work - changing variables to change behaviour.
Desirable behaviour should be rewarded to increase its probability o f being exhibited again. There are many environmental variables within the instructional process that can affect achievement in the secondary school (for example, Fraser et al„ 1987:399), but this study will look at the context of homework in mathematics and how this relates to achievement in mathematics.
Bandura (1977) in his Social Learning Theory (now called social cognitive theory - cognitive because it explains about thought processes like cognitive theories) proposes an extension (revision) to the behaviourist position. Bandura
28
argues that for some social learning, reinforcement does not seem to play a critical role in influencing the individual’s behaviour as advocated by firm behaviourists. Individuals model behaviour of others without prior practice and reinforcement. Reinforcement does not act directly but only causes individuals to expect certain consequences. Eggen and Kauchak (1997:215) summarise the teachers’ role thus:
Teachers should specify what behaviours will be reinforced so that students can adapt their behaviour accordingly, second, learners need feedback so that they know what behaviours have resulted in desired consequences.
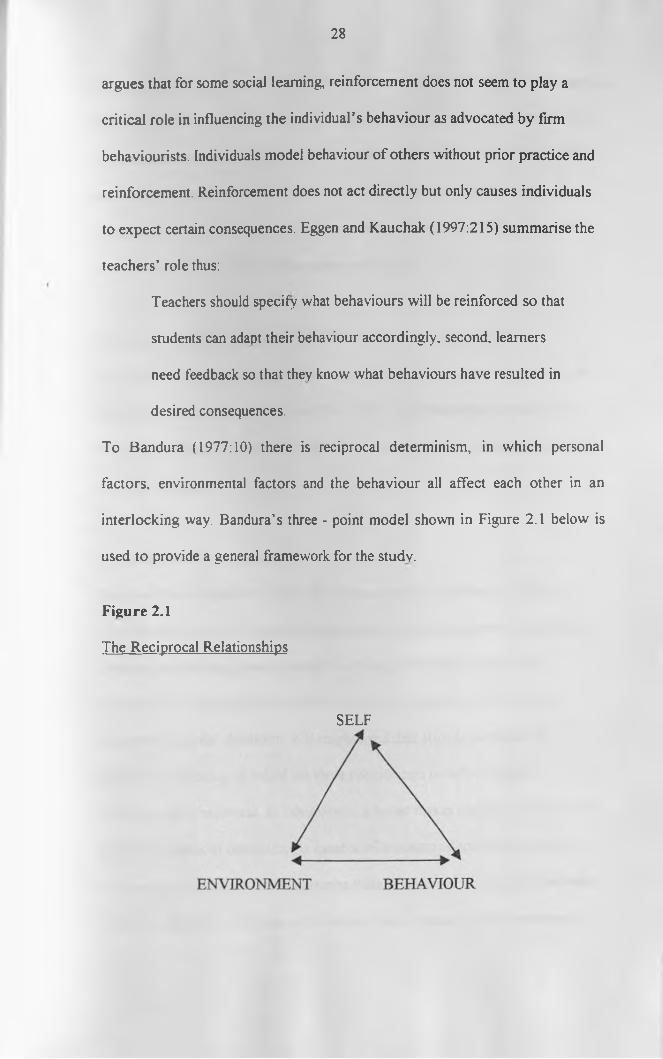
To Bandura (1977:10) there is reciprocal determinism, in which personal factors, environmental factors and the behaviour all affect each other in an interlocking way. Bandura’s three - point model shown in Figure 2.1 below is used to provide a general framework for the study.
Figure 2.1The Reciprocal Relationships
SELF
29
For example, students may look at their environment, form an idea o f what their efforts are likely to lead to and willingly decide to behave desirably. The eventual improved performance in mathematics is the behaviour which schools may wish to promote. This in turn may affect how students feel about themselves and mathematics, put the necessary effort in mathematics, pass in mathematics, be a model to a future class and so on.
The Social Cognitive Theory while admitting the importance of the environment emphasises that the latter interacts with two other components; the self and the behaviour itself. Viewed this way, it is important to consider how the individual’s motivations and aspirations towards specific tasks interacts with the environment.
2.2 Attitudes and mathematicsThere are many definitions of attitudes but according to Rokeach (1970:112)“an attitude is a relatively enduring organisation o f beliefs around an object or situation predisposing one to respond in some preferential manner." By organisation is meant that an attitude is a cluster, grouping of two or more elements. From the definition, it is emphasised that attitudes are kind of permanent, enduring. A belief has three components namely: cognitive, affective and behavioural. In other words, a belief makes one say “I know ’ with different degrees of conviction, is capable of arousing affect and must lead to some action if activated. But sometimes there is observed discrepancy between behaviour and attitudes because he cautions that a person’s social behaviour is
30
mediated by at least two types of attitudes -one activated by the object and the other activated by the situation.
Attitudes to mathematics or to homework would thus refer to the relatively enduring organisation of beliefs around Mathematics or homework that may lead to students acting in certain desirable ways towards Mathematics or homework. The student acquires and organises some beliefs, say, on whether Mathematics is enjoyable, hard, or useful as attitudes. Such attitudes are relatively enduring and may guide a students reactions to encounters with Mathematics /homework (Antonen, 1967). Part o f the consequences of such endurance is the fact that deeply rooted attitudes are difficult to change, with bad consequences. Once attitudes have been formed, they can be very difficult to change.
Positive attitudes assist the learning of mathematics; negative attitudes not only inhibit learning but ...very often persist into adult life and affect job choice. By the end of primary school years a child’s attitude is often becoming fixed and will determine the way in which he will approach mathematics at the secondary stage.” Cockcroft par.345.
Attitudes are very important in the learning and use of mathematics because they determine the students’ willingness to study Mathematics. Callahan (1971). Bell, Costello & Kuchemann (1983). Teachers o f Mathematics must concern themselves with the development of positive attitudes towards Mathematics, (Johnson. 1957). In fact, differences in ability to learn in upper primary schools
31
and junior secondary schools may be because o f attitudes as Wall (1977:120) aptly states.
Many of the differences have little to do with cognitive ability itself but in the differences of interests, attitudes, and motivations which have become established in primary schools and earlier, and which combine to make pupils unable or unwilling to profit from the kinds of education they are offered in the teens.
Negative attitudes to mathematics may be caused by difficult homework (Ashworth, 1981), and inappropriate or poorly thought out homework (busywork). Teachers must sincerely explain the value of homework given to the students and let their belief, attitude towards the importance of such work come through to students. This way students may not be hostile towards mathematics and may take the time needed to learn from homework, (Johnson & Rising, 1972:96).
U N IV E R S IT Y OF NA IRO B I EAST AFRICANA COLLECTIO*
In one nation-wide study on secondary school students’ perception of Mathematics teachers and classes, Cooper & Petrosky (1976) asked high school students to write essays on their Mathematics classes. One finding o f the study was that homework should be seen by students to be purposeful. Students complained that they were often not prepared for the homework they were asked to do and the homework was merely checked rather than used for instruction. Grambs and Carr (1979:319) similarly underlined the importance of perceived purpose in homework:

32
If students see worth in an assignment, they will do it. It is that simple. Certainly most students will ‘complete’ assignments -whether mechanically, or by copying or by sharing in a division of labour with others - in order to stay within the bounds of safety. But the assignment in which students becomes involved is one for which they see a reason.
Difficult homework makes children experience repeated failure proving to them that they are no good, while poor homework makes the student doubt if homework has any value worth his time. (Ashworth, 1981), Arends (1995). Yet, Joyce and Weil (1992:312) noted that:
It is clear both from research and from the author’s own experience students are often asked to work from their texts or workbooks with almost no explanation and/or practice. Students need to have a high degree of success ... when they have received about 90 per cent accuracy on the structured practice examples.
Giving extra Mathematics work to students can also be discouraging and boring to good students, yet such exercises may not extend the students’ knowledge. If the student is dissatisfied or discouraged by too much work, he may exhibit unfortunate behaviour or he may refuse to exert any reasonable effort to the task at hand.(Mutunga and Breakell, 1987:221).
Callahan (1971) similarly states that pupils feelings are crucial for they have an effect upon the amount of work, and the effort put forward in learning mathematics. Unfortunately, in mathematics the student is reinforced positively
33
or negatively by every problem that they do, that they are good or weak at it. Bell, Costello and Kuchemann (1983:259) summarise the situation saying that:
With Mathematics more than in any other subject the pupils work is likely to be judged in terms of simple ‘right’ and ‘wrong’ criteria. And that repeated failure must play a major role in determining motivation and attitudes to mathematics
Covington (1983) explained that since failure evokes feelings of unworthiness and self-rejection, individuals develop their own tactics of avoiding the implications of failure. High effort followed by failure arouses suspicions of incompetence while not trying minimises information about ones inability in the face o f failure. Thus students tend to develop a:
... safe strategy for students when risking failure designed to minimise teacher punishment and reduce, at least temporarily, the shame and humiliation that accompanies failure: Try ,or at least appear to try,
but not too energetically and with excuses always handy, p i49 Similarly, the Cockcroft (1982:67-68) committee cautioned that:
Mathematics is a difficult subject to teach and to learn [because its hierarchical] ... requires hard work and much practice, whatever ones
attainment may be... whatever their level of attainment, pupils should not be allowed to experience repeated failure
Pupils should not be allowed to form negative attitudes since positive attitudes are necessary to the correct performance o f Mathematics tasks. Yet, even negative attitudes can be changed by the patient teacher. Good and Brophy
34
(1991,318) say that the motivations of all students, even the most extreme case of failure syndrome or learned helplessness, can be carefully reshaped through socialisation designed to help them see that success can be achieved with reasonable effort.
Poor classroom teaching leaves students unclear of what was taught and exacerbates problems in doing homework given. The Cockcroft Committee(1982) on the teaching of Mathematics in Britain summarised reported adverse comments on poor teaching as follows:
An alleged inability on the part of some teachers to explain clearly, on a tendency to ignore some of those in the class, on an unwillingness to answer questions and on moving through the course too quickly...and also of teachers who had not required their pupils to do sufficient work and of teachers who had been unable to state the purpose o f the work which was being done- ‘do it to pass your exams. Par.202
The socialisation o f the student with respect to mathematics may also cause poor attitudes - how much emphasis do the parents and school community put on mathematics? Pidgeon (1967) contends that pupils’ attitudes to mathematics are associated with the extent to which their parents want them to do well and to a lesser extent the parents’ own attitude towards mathematics. In Kenya where a majority of students study in boarding schools for about 9 months in a year, the researcher would think that such a relationship might be ascribed more to the school than to the parents.
35
In a study of 259 Form 4 students in five schools, Rono (1991) found significant relationships between peer pressure to take certain subjects, pressure to do homework and achievement. Mathematics is commonly associated with failure and performing poorly in Mathematics may be quite acceptable in some groups but like Costello (199.1:126) states, “the notion that successful people need not be embarrassed but can be rather proud of their inadequate mathematical ability is absurd and patently counterproductive’-
The attitude to mathematics was found to be positively related to achievement in mathematics, (Aiken, 1970). Kibanza (1980) found that attitude to Mathematics scores correlated significantly with achievement scores of Form 2 students in Kenya. Fagerlind and Leal (1981) found the same to be true for upper primary school students in Portugal in a study on the effects o f the school and the home on mathematics achievement. Fagerlind and Leal, however, found that teachers’ experience and qualifications were not related to achievement in Mathematics. In the same study, it was reported that students of female teachers seemed to like Mathematics more than students of male teachers.
2.3 Sex differences and mathematicsEshiwani (1974) in a study of 12 secondary schools in Kenya found slight differences in favour of boys in attitudes towards Mathematics. Pidgeon (1967) made a similar finding with girls enjoying Mathematics and being confident less than boys. Girls are more likely to perceive Mathematics as difficult as
36
compared to boys and “during the secondary [school] years, girls attitudes to maths deteriorate rather more than those of boys” Costello (1991:146)
Boys tend to outdo girls in problem solving while girls seem to outdo boys in computations. In prediction, a skill required in science and in Mathematics problem solving, Otieno-Al ego (1989:182) found that “despite the fact that both sexes are poor at making predictions, the samples of boys had more competent achievers than girls”. It is interesting that this was true regardless o f class, with Form 2 boys doing better than Form 3 girls! This may be attributed to the fact that girls are raised in a more restrictive environment where conformity and dependence are emphasised (Graybill, 1975:341).
Girls are more reflective and careful while boys tend to be more impulsive and risk takers, guessing more, in an impulsive /reflective continuum. Boys also tend to persist at difficult tasks more than girls, (Scott-Hodgetts,1986). One would, thus expect girls to do classwork and homework much better than boys. In a study of 183 boys and 181 girls in grade 7 -1 2 (median ages 12 and 17 years). Emmerich (1978) found attitudes a function of age and sex with the older students being more self directed and confident. Sex differences in attitudes and achievement in mathematics have been associated with differential socialisation especially on what is masculine and feminine, Homer (1968). Girls are more likely to view mathematics as masculine, fear to succeed in such an area and thus tend to perform below their capacity because of the conflict involved in being successful, (Ernest, 1989). In fact girls are actually more
37
likely to be surprised by success because they more expect to fail, Costello(1991). Dweck and Bush (1976) found sex differences in learned helplessness with girls more prone to it. They defined learned helplessness as a belief that failure in a task is insurmountable and that further effort is futile.Girls are more likely to explain failure in terms o f poor ability. Dweck et al (1978), Fennema (1981).
2.4 Student self rating and teacher expectationsStudent attitudes are derived from their teachers’ and to a lesser extent their parents ‘ attitudes, (Cockcroft, 1982). Mwangi (1982), however, found no significant relationship between a teacher’s attitude to mathematics teaching and student achievement in mathematics. Costello (1991), reports that in good work, mathematics teachers are more likely to praise boys as talented (ability) in mathematics while girls are more likely to be praised for hard work, effort. In other words, boys’ success is likely to be attributed to stable causes while girls’ success is attributed to unstable causes. It would seem that teachers expected boys more than girls in mixed classes to succeed in mathematics. Leinhardt, Seewald and Engel (1979) found that in lower classes teachers made more academic contacts with boys in mathematics and more in reading to girls. (Badger, 1981). Braun (1976) argued that teachers perceived girls’ behaviour in the classroom as more compliant and consistent with academic norms.
Good & Brophy (1974) reported that low-expectation students do receive less praise and more criticism than high expectation students in evaluative feedback.
38
even through non-verbal class interaction. Such students are likely to be affected by the teacher criticism, perform even lower and in turn confirm the teacher’s expectation. They reason that the students reaction to such expectations is dependent on the credibility of the teacher and the self image of the learner. Braun (19.76:209) underlines the importance of the teachers expectation of students saying: “ ...it is the ‘teacher expectation of pupil’ and the vicious cycle it triggers that will determine largely the child’s self image, and ultimately academic success or failure.” Wall (1977:138) summarises the situation, which appears even more applicable in mathematics homework, thus:
His judgement of his own success or failure in a task is in part, a matter of whether he sees himself as able to perform satisfactorily; in part
it stems from the judgement made about his performance by the teacher; and in part from comparisons he and others make between his performance and that of the best or worst in his group. ... to a very considerable extent controllable by the teacher ... and in how far tasks and criteria of successful performance are clearly defined and understood.
Covington (1983:147) makes a similar assertion saying that students’ “failure evokes suspicions of inability, .failure creates a feeling of unworthiness and self-rejection”. The students feeling about him/her self is likely to depend on his perception of his/her performance relative to others in the class. This is likely to cause pupils to distort how they rate their ability. For example, students may view themselves poor so as not to be hurt by criticism arising from poor performance, (Bettleheim, 1961).
39
In a study, on the discrepancy between how teachers and students feel about a situation, it was reported that teachers perceptions of the school situation were substantially different from those of students. Teachers appeared largely unaware of the negative feelings of their students (Fleischman report, 1973), (Ishiyama & Chabassol, 1985).
2.5 Homework and AchievementThe study by Eshiwani, (1983) provided some useful insights on the factors that influenced achievement in schools of Western Kenya, among them homework. The study though, did not distinguish between prep and homework. Although the two aspects are related, this study distinguished between them and emphasised on homework because in it there is an implication for partnership between the teacher and the student. Kibanza (1980:124) in a study o f 440 Form 2 pupils in Kirinyaga District, Kenya found among other things, that the “number of hours devoted to homework... to be poor predictors of achievement in mathematics". There was a correlation of 0.02 between homework hours and achievement on a test. He also found that pupil scores on attitude to mathematics were reasonably good predictors o f achievement in mathematics.Di Napoli (1937) did an experimental study on mathematics homework involving 1200 children in 5th and 7th grades (the equivalent of upper primary school in Kenya). He assigned half of the students to half an hour of Mathematics homework which was included as part of the grade at the end of term, and an other half an hour of voluntary homework that was not graded. He
40
did not find conclusive evidence for homework, suggesting the contribution of other factors to pupils' school achievement.
Rutter et al (1979:11) in a longitudinal study of 12 schools in London concluded that:
Academically successful schools tended to have an emphasis on examinations and homework. .. But it may well be that in addition to its practical value in providing opportunities for the consolidation of the learning of work introduced in school time, homework may also be of symbolic importance in emphasising the schools' concern for academic progress, and its expectation that pupils have the ability and self-
discipline needed to work without direct supervision.Fisher et al (1980) found that engagement rate (percentage of time students are
actively engaged on a mathematics task) is related to students’ learning and students who perform tasks at a high success rate learn more than those who perform at a low rate of success do. They also suggested a model with five teaching functions that are important in promoting higher academic achievement: Diagnosis, Prescription, Presentation, Student activity, Feedback and Monitoring. As noted earlier, for best results, the teacher must diagnose the learner's needs, prescribe a course of action, and get the student to do something. The instructor must keep on monitoring the process at each stage to take corrective action. Classwork and homework and the resulting monitoring and feedback are implied in the model.
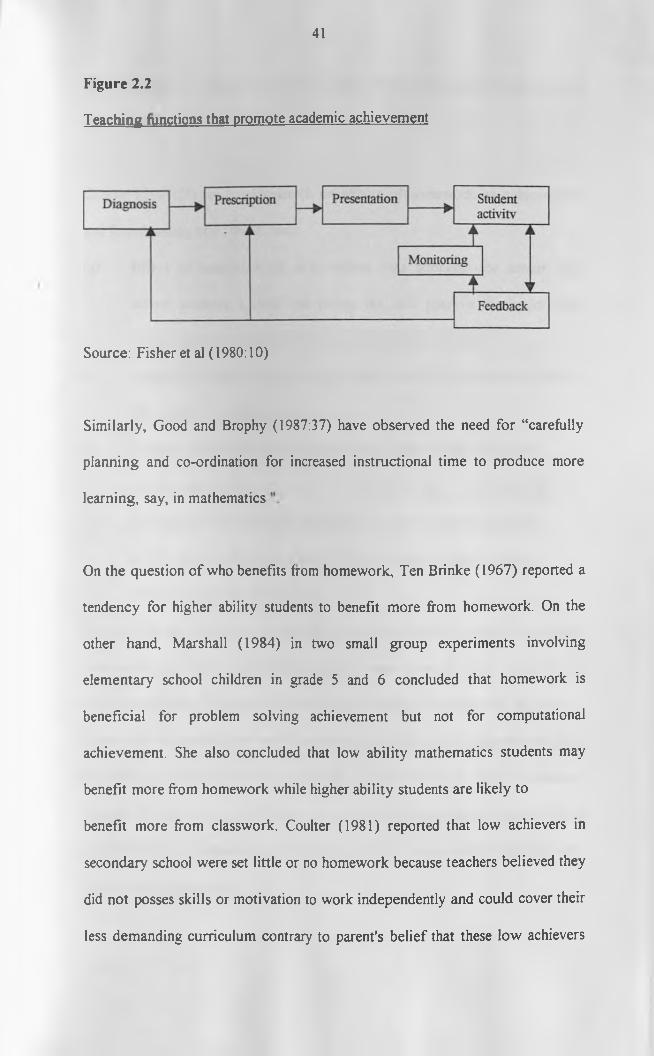
41
Figure 2.2Teaching functions that promote academic achievement
Source: Fisher et al (1980:10)
Similarly, Good and Brophy (1987:37) have observed the need for “carefully planning and co-ordination for increased instructional time to produce more learning, say, in mathematics
On the question of who benefits from homework, Ten Brinke (1967) reported a tendency for higher ability students to benefit more from homework. On the other hand, Marshall (1984) in two small group experiments involving elementary school children in grade 5 and 6 concluded that homework is beneficial for problem solving achievement but not for computational achievement. She also concluded that low ability mathematics students may benefit more from homework while higher ability students are likely to benefit more from classwork. Coulter (1981) reported that low achievers in secondary school were set little or no homework because teachers believed they did not posses skills or motivation to work independently and could cover their less demanding curriculum contrary to parent's belief that these low achievers
42
were the ones who needed it most. This only widened the gap between low and high achievers.
Cooper (1989:75) reviewed research on effects o f homework on achievement and found among other things that:(a) Effect of homework on achievement was strongest for senior high
school students, a little less strong but still positive for junior high school students and absent for upper elementary students.
(b) Homework related to the learning of simple tasks is more effective than that related to complex tasks.
(c) Homework's effects on standardised tests, were similar to those onteacher made tests. U N IV E R S I T Y OF N A IR O B I
EAST AFRICANA COLLECTION
(d) Homework that focused on preparation for new content or practice of old content was more effective than homework related solely to content of present day's work.
Bond and Smith (1966) on homework in USA elementary schools found that homework involving independent research was given in only 15% of the districts, individual differences were ignored in assigning homework and only in one third of the districts was homework corrected, graded and returned. Lee and Pruitt (1979:31) present a typology of homework as follows: practice, preparation, extension, and creative. It was found interesting to be able to find out the kinds of homework given in Kenya and to what extent it agreed with sound learning principles.
43
Research on homework paints different pictures on the usefulness o f homework. In a review of homework experiments in mathematics, Austin (1978) found sixteen favouring achievement, and thirteen showing no difference. That notwithstanding, Bruce (1986:44) in a study on raising school quality in developing countries suggests th a t" assignment o f homework ... shows promise in raising student achievement." Similarly, the Cockcroft committee (1982:par248) implicitly accented to homework saying that:
All pupils need opportunities to practice skills and routines which have been acquired recently, and to consolidate those which they already possess, so that these may be available for use in problem solving and investigational [sic] work ... practice of basic skills is not itself sufficient to develop the ability to solve problems or to investigate.
Although the results on the effect of homework may appear inconclusive, one would want to agree with Richards (1982) that:
. homework of the right kind under the right set of conditions positively influences academic achievement....However, uncovering all of the factors influencing homework and then unambiguously testing these factors in experimental settings will not be an easy task, for a wide variety of factors, some quite subtle, seen to effect the success or failure of homework.
On the other hand, Strang (1960:32), faced with such contradictory findings on homework research suggested that researchers unshackle themselves from the constraints and assumptions of rigid experimental designs and to first to
44
observe, identify and describe the teaching behaviours and teaching conditions related to homework. Those observations would provide clues that would be used to evaluate the success of homework against selected pupil characteristics. This study is a response to such call, for to know whether homework is useful or not in the Kenyan situation, one must study the homework in its Kenyan context.
2.6 Homework and GradingCullen et al (1975) experimentally manipulated negative and positive incentives in terms o f grades to see what effect they would have on making students finish an easy assignment. It was found that students did more work if tied to a grade and negative incentives were more effective than positive ones. 58.3%, 35.9% and 86.4% of the students did not complete the assignment under positive, negative, and no incentives respectively. It is worth asking why some students (over one-third) did not complete the assignment whatever the type o f incentive. This suggests that there are other factors, other than grades, that contribute to homework completion or non-completion.
Such factors may be, for example, students Locus of control, how the students view and value the grades; observation of student ‘models’ and academic focus of other close persons such as parents, teachers, and peers. Abidha, (1993), for example, found that students may prefer the strict, rigid authoritarian teacher and perhaps finish their work. Perhaps, this finding might apply in homework.
45
Moore (1984) in an investigation of the influence o f locus of control and homework on achievement for high school students, found that the locus of control of a student had a positive effect on grades and test scores and that homework time influenced grades more than test scores. He also concluded that higher ability was associated with internal locus o f control.
Teachers need to know why their pupils do not get problems right, not simply putting ticks and wrongs along attempted problems, Mutunga and Breakell (1987: 216). Cockroft (1982: par 415), in supporting the need for supportive marking observed that marking of written work is the form of assessment which is most apparent to a pupil and it should be both diagnostic and supportive. This way the teacher becomes aware of the kind of mistakes their students do and act accordingly.
Gray (1974:103) writing on assessment alerts the teacher to the possible negative effects o f such marking of students work in that:
pupils resist information about their performance if they feel it carries an unfavourable judgement of their personal competence. Whatever the intentions of the teacher may be, that’s how marks and marking feels to many pupils, unless care is taken to anticipate and dispel the antagonism.
Weiner (1977), who observed that individuals avoid feedback and information as a protective coping strategy, has also echoed such concerns. The teacher will need to be aware o f the needs of individual learners in assigning homework for

45
Moore (1984) in an investigation of the influence of locus of control and homework on achievement for high school students, found that the locus of control of a student had a positive effect on grades and test scores and that homework time influenced grades more than test scores. He also concluded that higher ability was associated with internal locus o f control.
Teachers need to know why their pupils do not get problems right, not simply putting ticks and wrongs along attempted problems, Mutunga and Breakell (1987: 216). Cockroft (1982: par 415), in supporting the need for supportive marking observed that marking of written work is the form of assessment which is most apparent to a pupil and it should be both diagnostic and supportive. This way the teacher becomes aware of the kind of mistakes their students do and act accordingly.
Gray (1974:103) writing on assessment alerts the teacher to the possible negative effects of such marking of students work in that:
pupils resist information about their performance if they feel it carries an unfavourable judgement of their personal competence. Whatever the intentions of the teacher may be, that’s how marks and marking feels to many pupils, unless care is taken to anticipate and dispel the antagonism.
Weiner (1977), who observed that individuals avoid feedback and information as a protective coping strategy, has also echoed such concerns. The teacher will need to be aware of the needs of individual learners in assigning homework for
46
the feedback strategies to be meaningful. For example, Dacey (1976:2) cautions that reinforcement may not be effective for pupils who believe that they have no control over what happens to them (‘external locus of control'),
In an experimental study, Christensen (1968) found that there was no significant difference in student achievement even when grading of students was suspended for one semester. Small, et al., (1967) found no significant differences in achievement between students whose mathematics homework was graded carefully each day and those whose work was occasionally checked by teacher. Similarly Austin (1976), in an experimental study of nine junior high school students found no difference in achievement between two groups whose homework was either corrected without comment or those whose homework was commented on after correction. Actually, only in two high schools did the second group outdo the first. These studies might suggest that either feedback is not important or that there are other factors that interact with homework to produce achievement.
Some secondary school teachers seem to recognise the importance of marking students work in raising student achievement. Mwaniki (1994:7), then a teacher of Mathematics in Strathmore School (a leading Kenyan secondary school), wrote the following on grading homework: “ it is important for the learner to know why a full mark was not obtained for a particular question and what is needed of him or her to improve his or her future performance." He then proposes 66 correction symbols which he was using in giving feedback to
47
students after personally checking their work! At another level in the same school students are taught the virtue of hard work.
Griffins (1996:50), the Starehe school (a leading national school) director, emphasizes the importance of marking in the induction of new teachers which may well be applicable in any other school. “ Starehe boys love two things: bread and marks . Thus it behoves teachers to mark with care and be able to justify their marking”. He further narrates (p. 16) an incidence where in studying students’ end of term reports he noted that the performance of 24% in a major subject [read mathematics] was not up to par. On launching investigations he found out that:
...one teacher had not been marking his pupil assignments, thus leaving them without signposts; two teachers had rushed various topics despite pupils’ protests that they had not properly understood
He then states that the problem was remedied, though it is difficult to tell if the students’ improvement was due to grading of the assignments or due to the academic focus (concern). Okinda & Luciani (1994:20) another secondary teacher, in his guide on how to pass examinations testifies for the need to mark homework saying:
“Assignment is the best way to do revision.. the solution to finishing homework and still sparing some time to read is by learning to work faster... teachers should redouble their efforts in helping students
succeed by marking late into the night. 1 did it and obtained results thatwere hard to believe.”
48
In a paper on Teaching/Leaming conditions in developing countries, Caillods and Postlethwaite (1989:182) also advocate for grading of homework to raise achievement that:
teachers who spend time preparing lessons and marking homework and class work tend to achieve better results with their students than those who do not . If the homework is marked and gone through individually with each pupil, to help pupils to see their shortcomings and how to improve them, then the children learn much more.
From research, it appears grading homework may not be very useful in raising achievement whereas pedagogical evidence seems to suggest otherwise. One may think that either the research overlooked certain important contexts or the pedagogical evidence is exaggerated.
2.7 Practice, Homework and feedbackIn this section some literature is outlined that helps put homework in the context of practice towards mastery. An old adage says, “practice makes perfect”. Does practising skills always produce perfection. In what circumstances does practice lead to increased performance9 Pearson and Tierney (1983), writing on reading practice research concluded that there is something missing in a ‘practice only’ approach to strategy learning. They proposed that future researchers must address the interrelated issues of the kind and context of practice, the explicitness of practice, and the ownership/autonomy afforded by the practice.
49
There’s evidence to suggest that regular, ’’short, intense, highly motivated practice produce more learning than fewer longer practice sessions...all practice sessions should be monitored that boredom and apathy do not undercut their effectiveness.” (Joyce and Weil, 1992:313).
Grambs & Carr (1979:319) also emphasize importance of homework that can be finished within reasonable time. The Jesuit Education Association Manual (1957) suggests that the total homework (for all the subjects) should not exceed 3 hours in a day for the average student. To arrive at the time students take for homework, the manual suggests that teachers do the assignment and allow students four times the time the teacher takes.
Students need to see why they should do homework before they can do it well. This is an area for motivation. In a discussion on motivation in work, Hackman and Oldham (1976) proposed a job characteristics model which relates feedback to motivation, especially internal motivation. They argue that skill variety, task identity, task significance, autonomy and feedback are five job characteristics which are necessary in a motivating job. For best performance the worker needs to experience three critical psychological states: meaningfitlness (its important), responsibility (I am accountable, responsible for performance or non performance) and feedback (knowledge of how well I am performing).
They proposed that the motivation potential (MPS) of a job is related to the five job characteristics as MPS = [SV + TI +TS]/3 * autonomy * feedback. This means that the motivation potential is the average score for skill variety (SV),
50
task identity (TI) and task significance (TS) multiplied by autonomy and feedback. Since the average score is multiplied with autonomy and feedback this model implies that if either is missing (0) then the motivating potential for the job would also be zero! This underlines the importance of autonomy and feedback in performance.
Whereas this may be difficult to translate into practical calculations, the model would imply the fact that for students to perform well in Mathematics homework tasks (job), they need to know the importance of the homework, feel autonomous and be able to know how well they are doing. Marking of homework to give feedback, variety of the Mathematics homework given and teachers reactions to completion of homework are therefore some factors that are likely to influence students’ motivation towards the mathematical ‘jobs'
Joyce & Weil (1992:313) outline a desirable approach to practice. It should start with structured practice in class as the teacher supervises, and “when the students are able to practise with accuracy, they are ready for independent practice under conditions when assistance is not available in the environment." Homework is an example o f independent practice where students can practice doing mathematics on their own. To reap maximum benefits students should know what to do and how to do it.
Becker et al., (1975: 102) propose that as students master a skill, there should be a shift from massed practice to distributed practice, and from immediate
51
feedback to delayed feedback. In USA, Giannotes (1989) found that students in a cumulative practice group completed fewer assignments than the massed practice group. The cumulative practice group was less likely to believe that doing the homework given was useful in learning algebra.
Feedback should be provided regularly because ‘Regular feedback is more desirable than sporadic feedback because it offers students more information and reduces the amount of time they practise making errors, if their work is incorrect’. Emmer et. al.( 1984:45). On feedback, Arends (1985: 300) suggests that at the initial stages of practice students should get meaningful feedback and knowledge of results given in a positive manner. He further suggests that students should be taught how to judge their own performance (self-monitoring and goal setting) and not to be satisfied with extrinsic feedback from the teacher. Stiggins, (1994) similarly advocates that students be taught to evaluate their own work. Schunk (1994) observes that goals set by students are more effective than those imposed by a teacher. Bandura (1986), terms such a strategy as ‘self regulation’, a process where students influence their own academic goals.
Feedback provided should as far as possible refer to tasks and individual effort if it is not to be discouraging to the students. There is need to assess individual effort and achievement in providing feedback. Very often the teacher provides feedback on achievement without relating it to the effort individuals take to be able to show the student where improvements can be made or greater effort
52
required and in this way to transfer to the pupil himself the means o f judgement of his performance. (Wall 1980:149)
The Jesuit High school administrators guide advocates strongly for homework as a practice phase in learning saying that "as long as Jesuit teaching methods are governed by Jesuit objectives, homework will always be an essential phase of the learning process" especially in mathematics and foreign languages. The manual however adds that students need feedback to persist in correct task habits saying:
Homework is worse than useless if it is not regularly checked, corrected and returned. Students will not persevere in careful study when they know the teacher will not look at the results.They thus are practically encouraged to develop habits of thoughtless and slovenly performance, (p. 178)
2.8 Mathematics and Educational TechnologyGalbraith (1967:12), a renowned economist defined technology as the systematic application of scientific or other knowledge to practical tasks. From this perspective. Educational Technology would therefore be the systematic application of scientific or other knowledge to the practical tasks o f education. This conception of educational technology as a process is wider than the more common one which sees educational technology as a product (things of technology). For example, how can we raise the achievement of secondary
53
school students in mathematics given our facilities and curriculum? To this end, Rowntree (1982:1) states:
Educational technology is as wide as education itself; it is concerned with the design and evaluation of curricula and learning experiences and with problems of implementing and renovating them. Essentially it is a rational problem solving approach to education, a way o f thinking sceptically and systematically about learning and teaching.
Over the years, educationists have made several efforts to develop technologies of instruction to ensure a more effective instruction. Heinich et al (1985:306) defines a technology of instruction as: "a learning pattern designed to provide reliable, effective instruction to each learner through application of scientific principles of human learning". Examples are Programmed Instruction, Programmed Tutoring, Personalised System of Instruction (PSI), Audio- Tutorial Systems, Students Teams Achievement Divisions (STAD), Program for Learning in Accordance with Needs (PLAN), and Bloom's learning for mastery. The latter is a strategy for bringing all or almost all students to a specified level of mastery.Block (1971 :passim) has noted that mastery learning is especially useful in subjects that are highly structured, have a stable content and stress convergent thinking. (English and mathematics, for example, would be well suited to such techniques). It is based after Caroll's (1963) model of school learning and pupil aptitude that assumes that virtually all students can achieve mastery learning of a task if given enough time and good instruction. It has however, received its share o f criticism especially that it slows down good students (Arlin, 1984) and
54
that it may lower the self concept of recycled students while inducing the better students to exert least effort to tasks.(Cox and Dunn ,1979).
In the Personalised System of Instruction (PSI) the students learn individually, on their own, and take tests to prove mastery when they feel ready. Proctors (student guides) usually provide them with tutorial support. The teacher acts mainly as a manager and planner of instruction. "The designers of PSI aimed to maximise rewards for conscientious study, minimise frustration, and eliminate fear connected with not knowing where one is going, how well one is doing and what surprise the instructor is going to pull on the final exam." (Heinich , Molenda and Russel, 1985:317). In Kenya's situation, the PSI and Bloom's Learning for Mastery systems, can be easily incorporated into conventional systems of learning to add effectiveness and efficiency. These principles can be adopted in homework to address individual students needs for mastery in mathematics.
Shiba (1986:306 - 330) has reported a successful private tuition programme in Japan called the Kumon Institute of Education. This technology of instruction has been used to improve the performance of students in structural subjects especially mathematics and English. It uses mastery learning techniques and students are then able to score high marks in school. It is reported that the method/system also helps students form the habit of consistent and independent study every day and learning to concentrate in school for future learning. After an initial placement test, students are given worksheets to work on from 10-25
55
minutes at home and 2 days in a week in a Kumon classroom. The students work on the worksheets every day, take worksheets for marking, and continue until a perfect score is obtained. Standard completion times o f the worksheets are known, and student progress is measured against these standards, which also help to ascertain the student's 'just right' point (where worksheets are not too difficult or too easy). Students receive feedback often. Incidentally, the Kumon Education System is now in Kenya offering tuition to pupils in mathematics.The Kumon system reminds us of a well-organised homework scheme. It is possible to organise homework in ways that can ensure effective learning for individual learners.
U N IV E R S IT Y OF NAIROBIEAST AFRICANA COLLECTION
If we accept that a goal of learning mathematics as a subject (including the KCSE) is skilled performance, then we need to find ways o f applying the skill approach in teaching and learning of mathematics. Landa (1974) emphasises the need for teachers to analyse the skill to be learnt and design appropriate algorithmic instruction, knowing their learners. He warns against presumption that tasks are simple and obvious since the degree to which a task is performed automatically obscures the complexity of such tasks. Students need to be guided through such tasks, to practice the skills under supervision and independently.
Romiszowski (1981) suggests that in cases of poor performance, one looks at the performer and his environment. Did the problem learner ever perform well? Have they mastered the prerequisites, or is the task just boring? Questions such as these may guide us in looking for answers in the case o f mathematics,
56
especially the contribution o f homework. If homework is well planned, it can avail students with the opportunity in all the four stages in the skill cycle and to practise problem solving to skill level. Class time provides learners with the opportunity to acquire knowledge and to practise under supervision as he or she receives feedback.2.9 Conceptual frameworkThis study uses a behaviour-person-environment conceptual model using ideas from the Bandura (1977) model and Romiszoski (1981) skill learning cycle discussed earlier. The Bandura model,shown in Ffigure 2.3 emphasises the reciprocal determinism between the personal, environmental and the behaviour factors in trying to understand how persons learn to behave in certain ways. Romiszoski (1981) also considers the environment important in analysing failure in performance. Rokeach (1970) similarly states that where there is discrepancy between behaviour and an attitude we must remember that an attitude is situational. For example a student may really hate mathematics but not be able to respond accordingly before their own teachers as this might be interpreted as rude. This way, we must understand a students’ situation before we can make statements on why or how homework may be used to raise achievement.On the student personal factors, we may include factors such as the learner’s attitude, self-rating on how good (he) is in Mathematics and therefore how well he believes his actions can influence further good performance. On the environment, the researcher hoped to study the context, and nature of
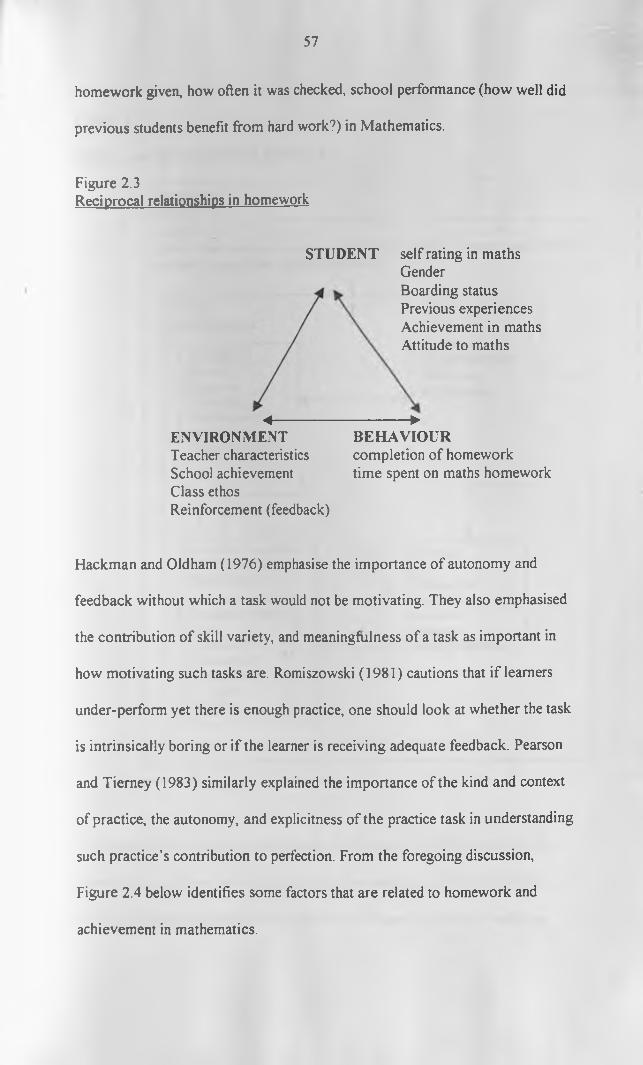
57
homework given, how often it was checked, school performance (how well did previous students benefit from hard work?) in Mathematics.
Figure 2.3Reciprocal relationships in homework
STUDENT self rating in maths GenderBoarding status Previous experiences Achievement in maths Attitude to maths
◄-------------------------------------►ENVIRONMENT BEHAVIOURTeacher characteristics completion of homeworkSchool achievement time spent on maths homeworkClass ethosReinforcement (feedback)
Hackman and Oldham (1976) emphasise the importance of autonomy and feedback without which a task would not be motivating. They also emphasised the contribution of skill variety, and meaningful ness of a task as important in how motivating such tasks are. Romiszowski (1981) cautions that if learners under-perform yet there is enough practice, one should look at whether the task is intrinsically boring or if the learner is receiving adequate feedback. Pearson and Tierney (1983) similarly explained the importance of the kind and context of practice, the autonomy, and explicitness of the practice task in understanding such practice’s contribution to perfection. From the foregoing discussion, Figure 2.4 below identifies some factors that are related to homework andachievement in mathematics.
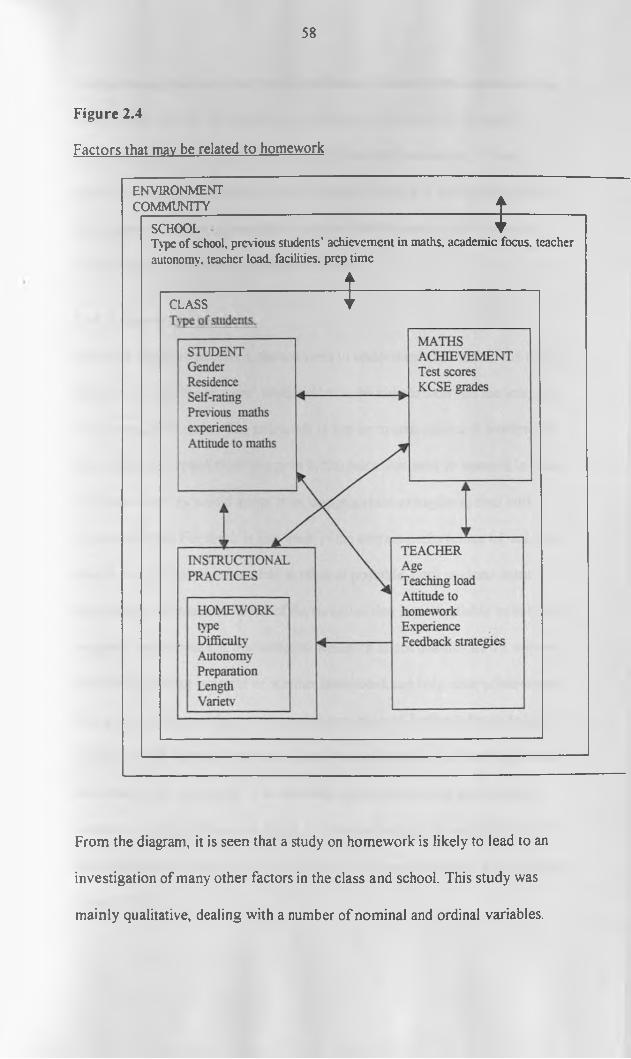
58
Figure 2.4Factors that may be related to homework
ENVIRONMENTCOMMUNITY *SCHOOL
Type of school, previous students’ achievement in maths, academic focus, teacher autonomy, teacher load, facilities, prep time
CLASS *
From the diagram, it is seen that a study on homework is likely to lead to an investigation of many other factors in the class and school. This study was mainly qualitative, dealing with a number of nominal and ordinal variables.
59
The following main variables were investigated: achievement as measured by class tests and KCSE (for the Form 4); attitudes to homework; Gender; homework time; Students residential status; teaching experience; Class; perceived homework difficulty, and students’self-rating in mathematics. This study has also attempted to qualitatively describe the nature and context of homework given in Kenyan secondary schools.
2.10 Chapter summaryFrom the literature reviewed, there is need to understand the learner, the task (homework) and the learners’ environment to be able to motivate the learner in doing prescribed tasks. The task needs to appear manageable and worthwhile for students to expend their energy in it. Students also need to succeed in tasks set, otherwise they would adopt other inappropriate strategies to deal with resultant failure. Feedback is important in the correct performance o f task and should be provided to the student as often as possible, until students learn to internalise it. Homework is one of the variables that is manipulable to help raise students’ performance in mathematics. Research is not unanimous on whether homework grading is useful or whether homework can help raise achievement. However, intuitive evidence tells us that provision of feedback (knowledge of results) in skill learning is necessary and that one needs to put time in learning something to be successful. The researcher intended to study mathematics homework (what and how) in Kenya to throw some light on why homework in Mathematics may or may not be successful in raising Mathematics performanceat the KCSE.
60
CHAPTER 3RESEARCH METHODOLOGY
3.0 IntroductionThis study comprised a survey of mathematics homework practices at the secondary school level, in Kenya. Homework as pointed out before is an aspect of mathematics teaching that is assumed to be present in varying degrees in all Kenya schools. The following sections describe how the samples were chosen and the procedures used to come up with the data in chapter 4.
3.1 Design of the studyThe research design adopted is the cross sectional survey, which is appropriate in situations where the researcher does not have much control over the variables. Though the design has the weakness o f lack of experimental control, and therefore it cannot raise definite answers, “ it is likely that the primary value of the method is in raising specific questions about general problems that can then be explored more systematically using other methods ” (Mason & Bramble 1997:45)Descriptive research was chosen because of its appropriateness in collecting original data on this important topic and the possibility it offers in making descriptive assertions about a large population (Babbie, 1986: 228). Further, this is in line with Strang (1975:27) who suggested that on mathematics homework research:
It may be more productive for researchers to unshackle themselves from the constraints and assumptions of rigid experimental designs and first
61
to observe, identify and describe teaching behaviours and teaching conditions related to homework, and then to proceed to evaluate them against a variety of relevant pupil growth measures.
Such information could help in understanding the current homework situation in mathematics learning and help provide another way of looking at the problem, in search of solutions. After the description of the status quo in homework, this study attempts to describe some relationships in the data as hypothesized earlier.
3.2 PopulationThe population under study consisted of secondary school students and mathematics teachers in Kenya. As pointed out earlier, mathematics is a compulsory subject for all primary and secondary school s in Kenya. This means that all the schools and students in Kenya form the population. The schools are located in different parts of Kenya.
Geographically, Kenya is divided into eight administrative provinces namely Eastern, Western, North Eastern, Central, Coast, Rift valley, Nairobi and Nyanza. A sketch showing the relative locations o f each province is shown in the appendix. Each province is further subdivided into a number of districts, such that in Kenya they all total to about 65. (About 65 since they change from time to time). Each province is put under provincial administration appointed by the Central government, including a Provincial Director of Education (PDE). The PDE is responsible for the education standards in a province. Each district
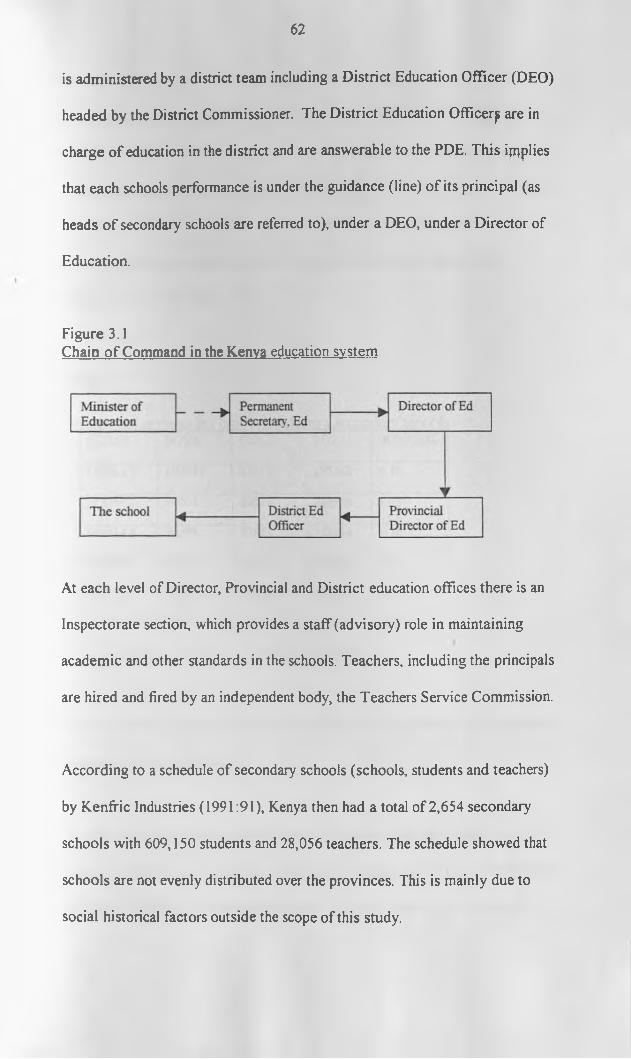
6 2
is administered by a district team including a District Education Officer (DEO) headed by the District Commissioner. The District Education Officer^ are in charge of education in the district and are answerable to the PDE. This implies that each schools performance is under the guidance (line) of its principal (as heads of secondary schools are referred to), under a DEO, under a Director of Education.
Figure 3.1Chain o f Command in the Kenya education system
At each level of Director, Provincial and District education offices there is an Inspectorate section, which provides a staff (advisory) role in maintaining academic and other standards in the schools. Teachers, including the principals are hired and fired by an independent body, the Teachers Service Commission.
According to a schedule of secondary schools (schools, students and teachers) by Kenffic Industries (1991:91), Kenya then had a total of 2,654 secondary schools with 609,150 students and 28,056 teachers. The schedule showed that schools are not evenly distributed over the provinces. This is mainly due to social historical factors outside the scope of this study.
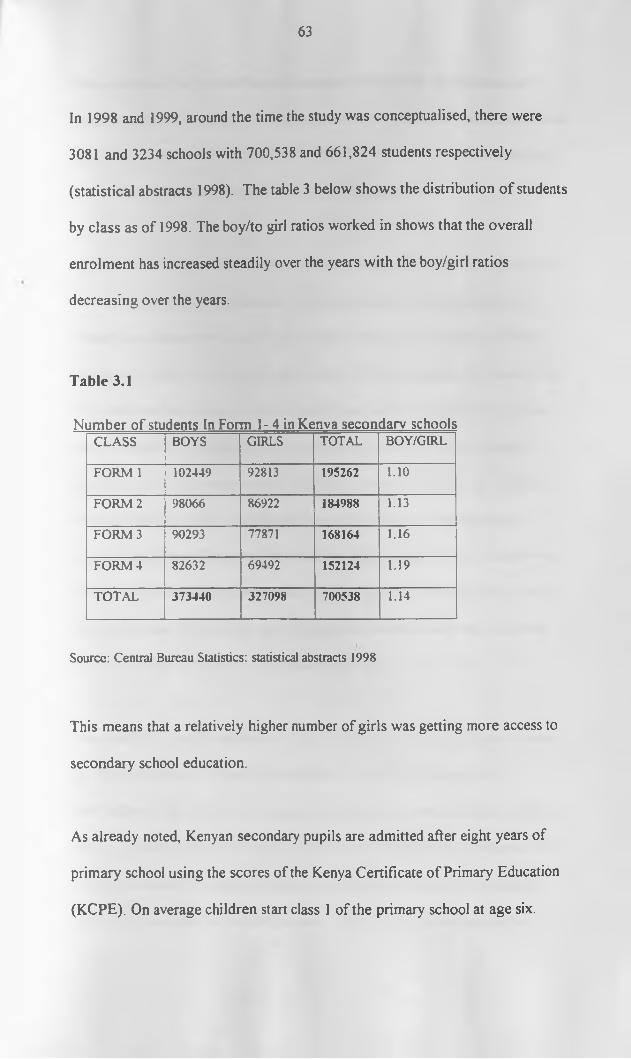
63
In 1998 and 1999, around the time the study was conceptualised, there were 3081 and 3234 schools with 700,538 and 661,824 students respectively (statistical abstracts 1998). The table 3 below shows the distribution o f students by class as of 1998. The boy/to girl ratios worked in shows that the overall enrolment has increased steadily over the years with the boy/girl ratios decreasing over the years.
Table 3.1
Number of students In Form 1- 4 in Kenya secondary schoolsCLASS BOYS GIRLS TOTAL BOY/GIRL
FORM 1 102449 92813 195262 1.10FORM 2 98066 86922 184988 1.13
FORM 3 90293 77871 168164 1.16FORM 4 82632 69492 152124 1.19TOTAL 373440 327098 700538 1.14
Source: Central Bureau Statistics: statistical abstracts 1998
This means that a relatively higher number of girls was getting more access to secondary school education.
As already noted, Kenyan secondary pupils are admitted after eight years of primary school using the scores of the Kenya Certificate of Primary Education (KCPE). On average children start class 1 of the primary school at age six.

64
Thus, secondary school students will have an average age of fourteen and eighteen years for form one and four respectively. The KCPE examination was used and is used to select students for admission to Form 1. The best students go to national schools and the poorest to the local schools.
The schools in Kenya have a kind of traditional ranking as national, provincial, district, local, and private schools. Previously the government would give financial support to the schools in the order stated with the national schools getting the highest and the government-assisted schools getting the lowest. The categorisation then was government maintained school, government-assisted school, harambee (self-help) schools and private schools. The government schools were further categorised as national, provincial and district. National schools would thus have the best facilities while the government-assisted schools would have the worst. Nowadays all public schools (other than private schools) get financial support especially in the form of teachers' salaries from the government. The schools seem to generally maintain their earlier ranking outlooks though there are some notable exceptions.
The exceptions may be explained by the Form one students’ admission system, and by the individual schools’ peculiarities. To allow for an equitable distribution of the Form one places, a national school takes about five students ffom each district using the KCPE order of merit, subject to pupil choice. The provincial schools take the next best lot that was not selected by the national schools. A provincial school should take students from the administrative
65
boundaries of the province but again for reasons o f equity the government has maintained that 85% of students must be selected from the district in which the school is located. This means that some provincial schools are essentially district schools but depending on the district of location they could have very good students of the quality in national schools. In fact some national schools have a class that selects students from within the province of location.
The district schools (these include community schools) select students last. Boarding schools are generally more popular than day schools with parents and thus district boarding schools are in high demand despite selecting students last. Due to the historical reason cited earlier, some district boarding schools have been able to build a tradition of excellence and therefore attract better students than provincial schools. Some ‘district’ schools are run more like commercial schools, their major aim to raise funds for the school and therefore would attract the poorest students that could not be admitted elsewhere. Admittedly some local day schools attract some very good students, initially selected to more prestigious boarding schools, but don’t take up their place because o f inability to pay high fees demanded by such boarding schools. This categorisation has was reasonably represented in the sample.
In describing the population, one should note that schools are also categorised by gender and by boarding status. Thus schools may be described as girls’, boys’ or mixed. They may also be described as day, boarding or mixed day and boarding. Using these two dimensions we can have girls’ boarding, girls’ day,
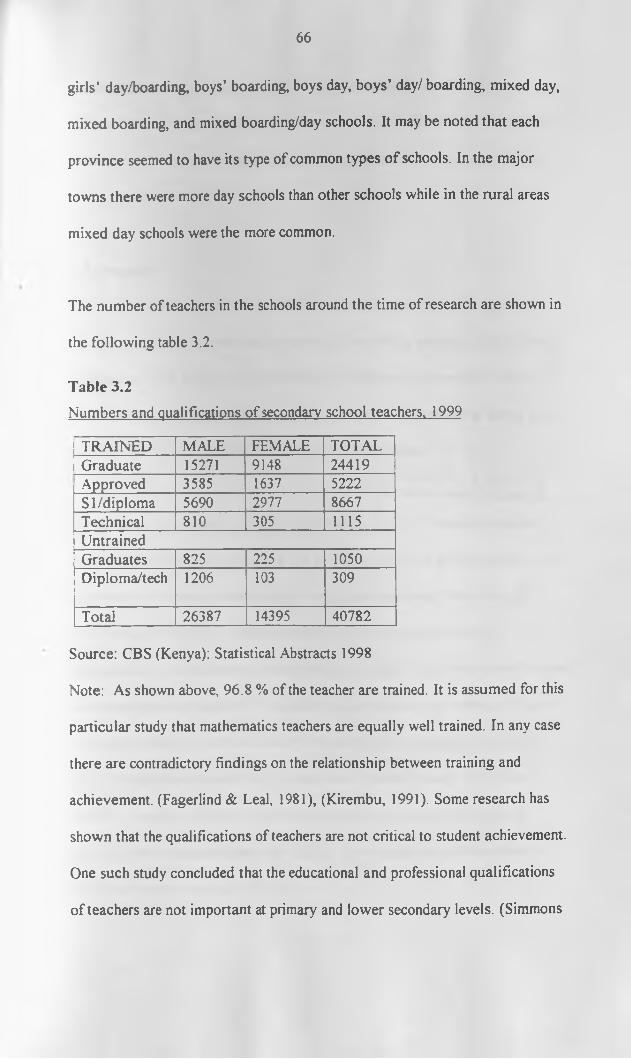
66
girls’ day/boarding, boys’ boarding, boys day, boys’ day/ boarding, mixed day, mixed boarding, and mixed boarding/day schools. It may be noted that each province seemed to have its type of common types o f schools. In the major towns there were more day schools than other schools while in the rural areas mixed day schools were the more common.
The number of teachers in the schools around the time of research are shown in the following table 3.2.
Table 3.2Numbers and qualifications of secondary school teachers. 1999
TRAINED MALE FEMALE TOTALi Graduate 15271 9148 24419
Approved 3585 1637 5222SI/diploma 5690 2977 8667Technical 810 305 1115UntrainedGraduates 825 225 1050Diploma/tech 1206 103 309
Total 26387 14395 40782Source: CBS (Kenya): Statistical Abstracts 1998Note: As shown above, 96.8 % of the teacher are trained. It is assumed for this particular study that mathematics teachers are equally well trained. In any case there are contradictory findings on the relationship between training and achievement. (Fagerlind & Leal, 1981), (Kirembu, 1991). Some research has shown that the qualifications of teachers are not critical to student achievement. One such study concluded that the educational and professional qualifications of teachers are not important at primary and lower secondary levels. (Simmons
67
and Alexander, 1980). The researcher did not go into the qualifications of teachers because it was thought that this could reduce teachers’ willingness to respond. Mathematics is a relatively technical subject and it is more likely to attract qualified teachers to teach it.
3.3 SamplingIt was not practically possible to survey the whole population making it necessary to obtain a representative sample from which generalisations to the population could be made. The information in the previous section, with an update from the Ministry of Education documents at the provincial level, wasused to obtain a representative multistage random sample.
U N IV E R S IT Y OF NA IROB I EAST AFRICANA COLIECTIQM
For purposes of comparison and to allow the possibility o f making broader statements about the population, it was decided to use half of the provinces for the research. A four-province sample was picked randomly from the eight provinces in the country. This was done by arranging the provinces alphabetically and numbering them from one to eight. The Province was chosen as a sampling unit because o f its stability in representing the regions of Kenya. As noted earlier, the number of districts have recently changed from time to time. The provinces picked for the study were Central, Coast, Nairobi and western. In each province schools were selected to represent the types of schools using the gender/boarding criteria. The population that was used for sampling is shown in the Table 3.3.
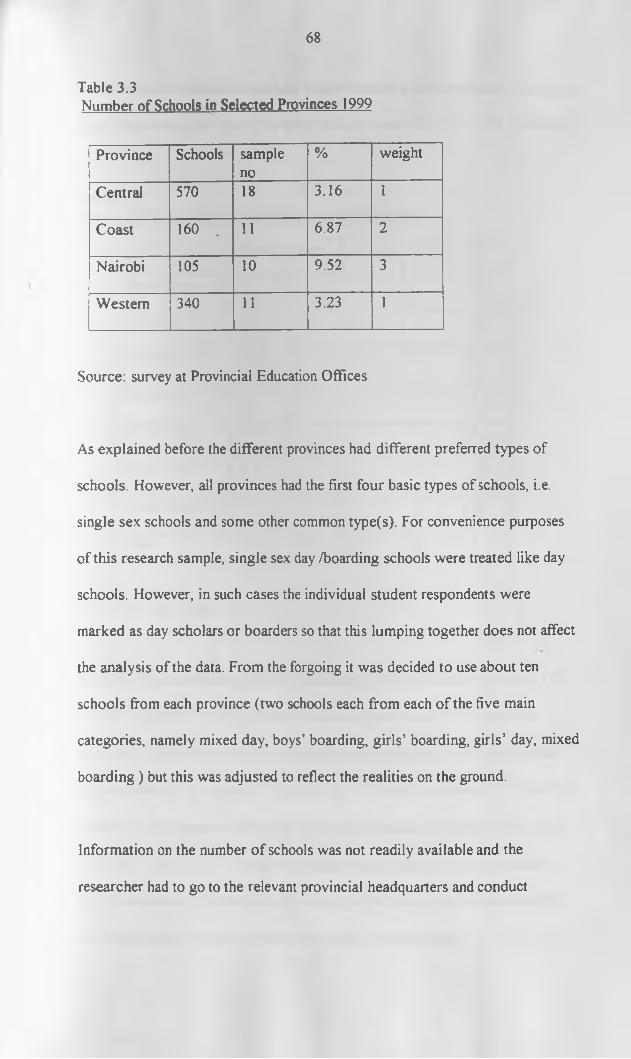
68
Table 3.3Number of Schools in Selected Provinces J .999
Province Schools sampleno
% weight
Central 570 18 3.16 1
Coast 160 . 11 6.87 2
Nairobi 105 10 9.52 3
Western 340 11 3.23 1
Source: survey at Provincial Education Offices
As explained before the different provinces had different preferred types of schools. However, all provinces had the first four basic types of schools, i.e. single sex schools and some other common type(s). For convenience purposes of this research sample, single sex day /boarding schools were treated like day schools. However, in such cases the individual student respondents were marked as day scholars or boarders so that this lumping together does not affect the analysis of the data. From the forgoing it was decided to use about ten schools from each province (two schools each from each of the five main categories, namely mixed day, boys’ boarding, girls’ boarding, girls’ day, mixed boarding ) but this was adjusted to reflect the realities on the ground.
Information on the number of schools was not readily available and the researcher had to go to the relevant provincial headquarters and conduct
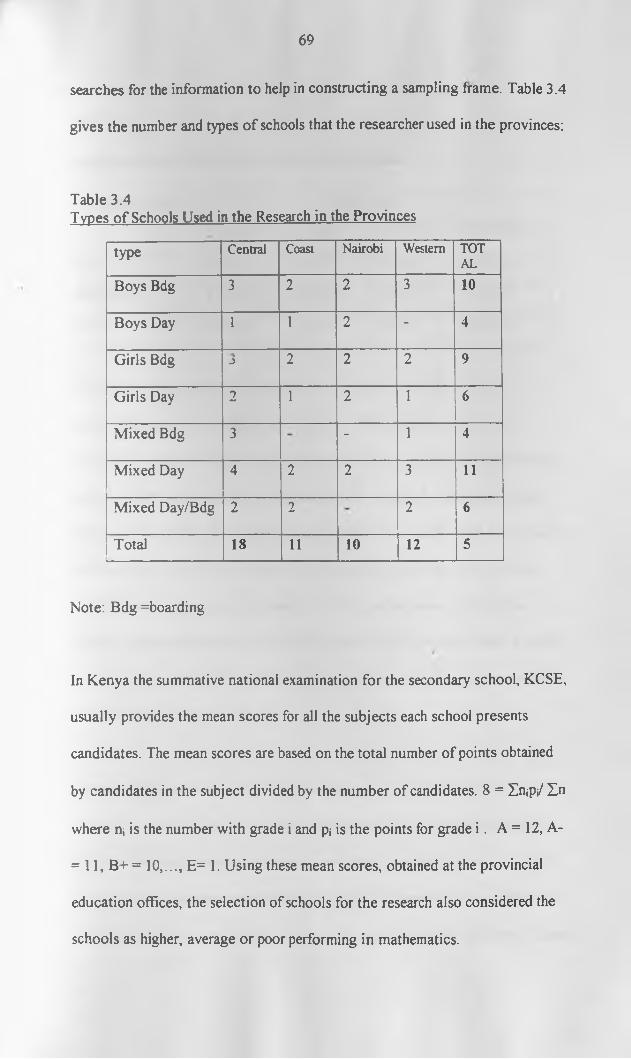
69
searches for the information to help in constructing a sampling frame. Table 3.4 gives the number and types o f schools that the researcher used in the provinces:
Table 3.4Types o f Schools Used in the Research in the Provinces
type Central Coast Nairobi Western TOTAL
Boys Bdg 3 2 2 3 10
Boys Day 1 1 2 “ 4
Girls Bdg 3 2 2 2 9
Girls Day 2 1 2 1 6Mixed Bdg 3 - 1 4Mixed Day 4 2 2 3 11Mixed Day/Bdg 2 2 2 6Total 18 11 10 12 5
Note: Bdg =boarding
In Kenya the summative national examination for the secondary school, KCSE, usually provides the mean scores for all the subjects each school presents candidates. The mean scores are based on the total number of points obtained by candidates in the subject divided by the number of candidates. 8 = Snip/ Zn where n* is the number with grade i and p; is the points for grade i . A = 12, A- = 11, B+ = 10,..., E= 1. Using these mean scores, obtained at the provincial education offices, the selection of schools for the research also considered the schools as higher, average or poor performing in mathematics.
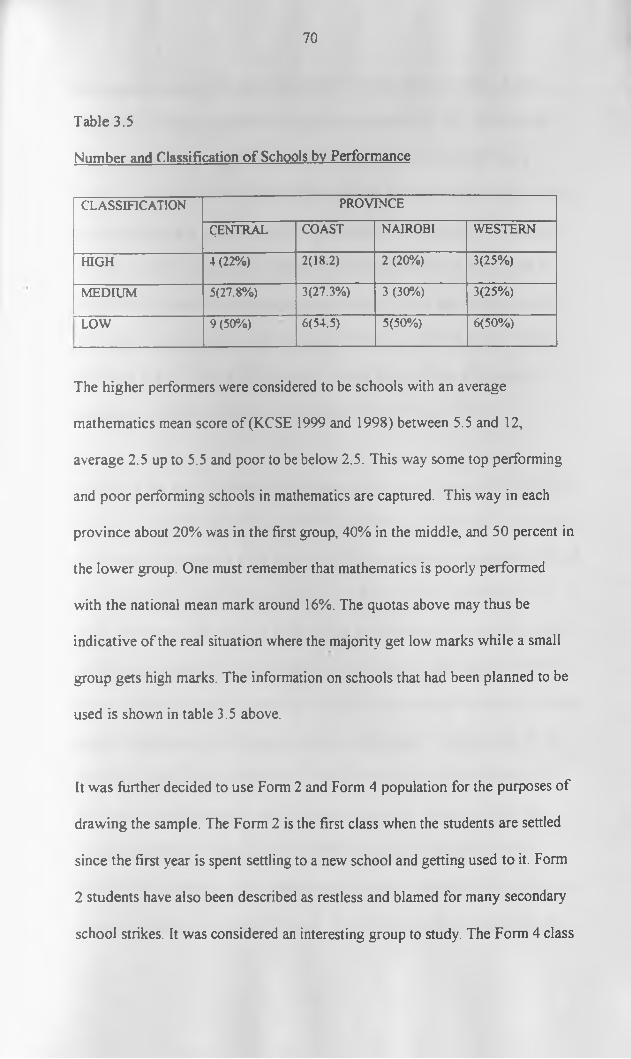
70
Table 3.5Number and Classification o f Schools by Performance
CLASSIFICATION PROVINCECENTRAL COAST NAIROBI WESTERN
HIGH 4 (22%) 2(18.2) 2 (20%) 3(25%)
MEDIUM 5(27.8%) 3(27.3%) 3 (30%) 3(25%)
LOW 9 (50%) 6(54.5) 5(50%) 6(50%)
The higher performers were considered to be schools with an average mathematics mean score of (KCSE 1999 and 1998) between 5.5 and 12, average 2.5 up to 5.5 and poor to be below 2.5. This way some top performing and poor performing schools in mathematics are captured. This way in each province about 20% was in the first group, 40% in the middle, and 50 percent in the lower group. One must remember that mathematics is poorly performed with the national mean mark around 16%. The quotas above may thus be indicative of the real situation where the majority get low marks while a small group gets high marks. The information on schools that had been planned to be used is shown in table 3.5 above.
It was further decided to use Form 2 and Form 4 population for the purposes of drawing the sample. The Form 2 is the first class when the students are settled since the first year is spent settling to a new school and getting used to it. Form 2 students have also been described as restless and blamed for many secondary school strikes. It was considered an interesting group to study. The Form 4 class

71
was used because it is the last class in the secondary school system. Fourth formers do a terminal summative external examination (KCSE) which might affect their work patterns. The same KCSE scores were also to serve as a validation measure for the teacher made tests that were used in the study. Using the two classes was hoped to provide information on differences or similarities between students in them. For example, the two classes would help gauge if homework increased as students approach Form 4. In the year 2000 when the field study was conducted there were 86,318 boys and 80434 girls in Form 2 (totalling 166,752); and 83,032 boys and 72811 girls in Form 4 in Kenya secondary schools (totalling 155,843). (Republic of Kenya, 2001)
Initially it had been envisaged that ten students in Form Two and ten students in Form Four would be randomly selected to participate in the study, for purposes of economy. Assuming a class size of forty, this would have represented 25% of the sample. Two mathematics teachers in a school would be selected for the study. However, after the pilot study, it was found that some schools had many streams necessitating making a fresh decision on how to get a sample. Where there were more than two streams in a school, it was decided to use two streams selected randomly for selecting the student respondents. Consequently, it was decided to adjust the respondents in a class to between fifteen and twenty. It was found administratively easier to involve about half the class while the increased numbers would allow for statistical tests to be applied on class samples during analysis. The respondents in a class were selected systematically using the class list as a sampling frame. Teachers were asked to start from the
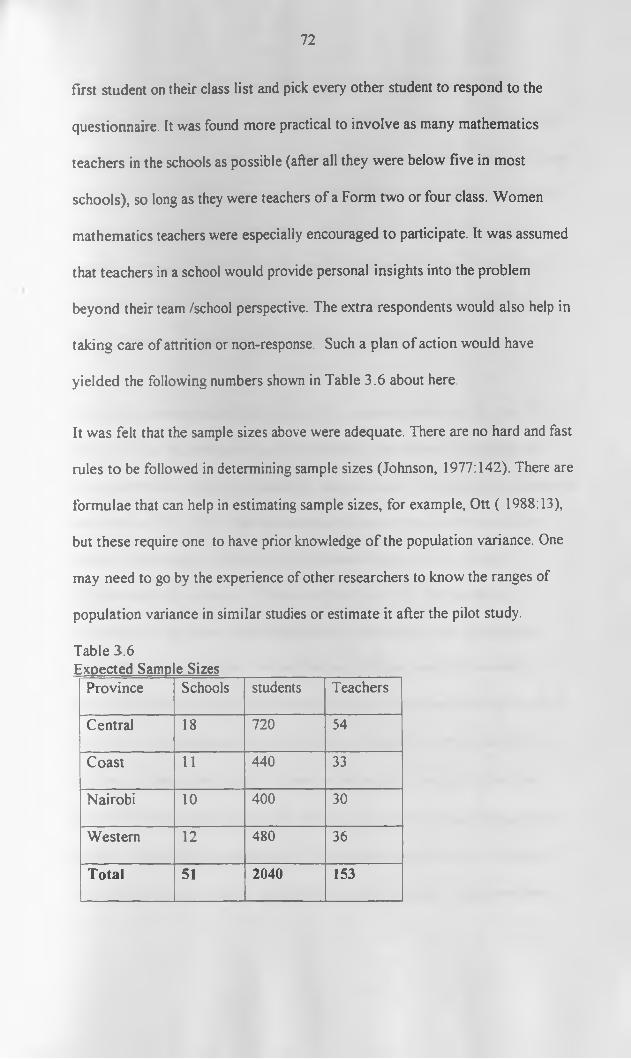
72
first student on their class list and pick every other student to respond to the questionnaire. It was found more practical to involve as many mathematics teachers in the schools as possible (after all they were below five in most schools), so long as they were teachers of a Form two or four class. Women mathematics teachers were especially encouraged to participate. It was assumed that teachers in a school would provide personal insights into the problem beyond their team /school perspective. The extra respondents would also help in taking care of attrition or non-response. Such a plan of action would have yielded the following numbers shown in Table 3.6 about here.
It was felt that the sample sizes above were adequate. There are no hard and fast rules to be followed in determining sample sizes (Johnson, 1977:142). There are formulae that can help in estimating sample sizes, for example, Ott ( 1988:13), but these require one to have prior knowledge o f the population variance. One may need to go by the experience of other researchers to know the ranges of population variance in similar studies or estimate it after the pilot study.Table 3.6ExDected SamD e Sizes
Province Schools students TeachersCentral 18 720 54Coast 11 440 33Nairobi 10 400 30Western 12 480 36Total 51 2040 153
73
Youngman (1979) and Balian (1981) think that a sample o f 200 -300 is sufficient for a survey so long as sample sizes o f 30 or more are maintained for statistical analysis purposes. Similar research in Kenya has used relatively large samples. Okumbe (1992) in a study of job satisfaction of graduate teachers in Kenya used 30 schools in two districts and in so doing sampled 243 graduate teachers. Kimani (1991) used 705 in-service teachers, Somerset (1969) 1543 form 4 students in 24 secondary schools in Kenya, while Nyaga (1997) used 408 students and 62 teachers from one (Embu) district.
Due to the administrative and stratification purposes (analysing the data in small groups) it was felt necessary to have a relatively big sample. It will also be remembered that a sample is picked for the purpose of estimating the population parameters. “No matter what the shape of the underlying distribution of the scores, the sampling distribution of the mean will tend to be a normal distribution with a mean g.” (Mason and Brabble : 195). The sampling distribution of the mean is the distribution of the mean of specific samples drawn from the population. The standard error o f the mean (the standard deviation o f the sampling distribution of means) is estimated from the standard deviation and population size as eg =cx/Vn. os is inversely proportional to Vn
and thus as the sample size n increases, o» decreases. As n approaches the
population size, oe approaches zero. Within practical limits then, the larger the
sample, the smaller the standard error of the mean, and the better. The larger the sample size the closer to the population values, a quality called precision.
74
3.4 Instrument DevelopmentThis study used questionnaires, an interview schedule and an observation schedule. No suitable published instruments were available to investigate this topic. The researcher developed own instruments to collect required data based on the objectives of the study. Two self administered questionnaires, one for teachers and one for students, consisting mainly o f closed questions; an observation and interview schedules were used. The instruments were pre-tested and improved on later during the pilot study.
3.4.1 Students questionnaireThe students’ questionnaire was designed to collect information on homework from the students’ point of view. It was designed to contain more items than teachers’ questionnaire for it was expected that students would be more willing to respond and are more reliable in their responses, Aubrecht (1986); Mosley and Smith (1982). Redundancy was built into the questionnaires to help check on the consistency of responses between items and between respondents. For example both teachers and students were asked how often homework was given and marked.
The students’ questionnaire had an introductory section with a request to respond sincerely, it not being a test, and with a pledge of confidentiality. A second section elicited the respondents' biographic data that would help in the analysis and interpretation o f the responses. The fourth section solicited the
75
respondents’ attitudes and opinions relating to homework administration in secondary schools.
In the third section students were required to choose one or more answer that best described their views, but to add other answers where they felt necessary. Some questions were left deliberately open ended for students to describe their positions. The instrument in full can be found in the appendix D.
The last section in the students’ questionnaire required the respondents to react to statements on a Likert-type scale with five choices. The students' questionnaire had thirty (30) items. For example, students were asked to Strongly Agree (SA), Agree (A), be Undecided (U), Disagree (D) or to Strongly Disagree (SD) with the following statements.
1. Homework is a waste of students' timeSA.,... A.... U.... D.... SD.....
2. I enjoy doing mathematics homeworkSA.... A.... U.... D.... SD....
The responses were put below each of the statements in a bid to reduce response set where students tick one category even without reading the statements. The scoring for six items were reversed while the " SA: A: U : D: SD:"response order was retained, to further safeguard against response set. This, together with the instructions at the beginning o f the questionnaire
76
(encouragement to respond sincerely and the promise of confidentiality) was expected to contribute to the reliability o f the instrument. It will also be noted that some questions were asked indirectly, assuming that people will be cautious in making statements that are likely to get them to be seen in negative light. For example, students were asked ‘why do some students not complete homework’ rather than ‘why don’t you complete homework’ or ‘Students need to be supervised when doing homework’ rather than ‘I need supervision during homework’. The questionnaire was printed on pink colour to attract pupils’ attention.
3.4.2 Teachers’ questionnaireThe teachers’ questionnaire was printed on green paper for easy distinction from the pupils’ questionnaire. It was structured after the students’ questionnaire; to supplement the latter, but also to provide information on teachers’ perception on homework. Teachers were requested to provide information on the frequency of assigning and marking homework, sources of homework and on their views on the importance o f homework.The questionnaire had an introduction, biographic data section, questions section and an attitude/opinion section with twenty items. Some questions in the attitude section were actually perception questions, but it was found necessary to measure some of those opinions on an ordinal scale.3.4.3 Interview scheduleAn unstructured interview schedule was developed to investigate the positions
of different schools on homework, and to find out if any procedures were
77
adopted to ensure that teachers and students followed the school policy. The interview schedule was used to guide a discussion with the school principal/deputy principal.
3.4.4 Observation scheduleAn observation schedule was used to observe the class environment in which homework is assigned. The researcher observed the kinds of homework given, and any structuring activities such as explanations on homework in ten randomly selected schools. Four, three, two and one schools were selected from C entral, Western, Coast and Nairobi provinces respectively depending on the relative number of schools. A Form 2 and a Form 4 class in a selected school were observed All in all, seventeen classes were visited. The researcher personally attended and observed mathematics classes in eleven classes. It must be noted that the classes were visited with the teachers’ consent and this may have interfered with the observation.
3.4.5 Mathematics testsTwo mathematics papers set and scored by the Kenya National Examination were done by all Form four students in the sample. The marks the students got in the two papers have been averaged out of 200 and converted to a grade on a scale o f 1 to 12. It was assumed that the KCSE mathematics papers were reliable and valid having been set by the national examining body, the Kenya National Examinations Council.Copies of the instruments are appended at the end of the research report.
78
3.4.6 Valid ity
Much care was taken to ensure the validity of the instruments through three ways. First, the items for the instruments were developed around the objectives of the study. Major concepts and routines in homework were listed, a number of items drafted, studied and revised as necessary while following guidelines suggested in literature, for example, Balian (1981: 76 - 78, 84) and Prewitt (1975: 70 - 90). Items used were those judged useful to answer the research questions.
U N IV E R S IT Y OF N A IR O i t EAST AFRtCANA COLLECTION
Secondly, three experts from this field scrutinised the instruments for logical (content) validity and to help improve on clarity. Finally, the pilot study was used to observe the construct validity of the instruments especially through item analysis. Items were added, modified for clarity or dropped as necessary to improve on the validity of the instruments at every stage.
3.4.7 ReliabilityThe reliability of a measuring instrument is an indication of its repeatability. Reliability analysis using the split - half method was attempted to establish the reliability of the attitudinal part of the students questionnaire. The reliability score for two schools was found to have a split half correlation coefficient of0.803. This was adjusted using the Spear-Brown Prophesy Formula to compensate for the reduction of the test by half (in the split half method). The Spear-Brown prophesy formula is given by 2r/l+ r where r is the Pearson correlation between the two halves. The correlation was thus adjusted to 0.891.
79
About half the items had an inter-item correlation o f over 0.500. It was however, noted that the reliability coefficients varied with the number of items and respondents used. Where some respondents left out some items this seemed
to affect the scores.
The two mathematics papers for the Form 4 were assumed to be valid and reliable in line with the KNEC’s mandate. In their year 2000 KCSE report (KNEC 200 l:v), the KNEC explained its mandate as:
To develop and administer examinations annually for (KCPE),.. (KCSE) and Post-schools candidates and to ensure that these examinations are free from bias and are valid, reliable, relevant, efficient and of globally accepted standards...To achieve its mandate... the council develops, moderates, prints, distributes, administers, marks, processes examinations and awards certificates...
3.5 Training of research assistantsThis study made use of two research assistants to help in data collection. The researcher explained the research design to them, and trained them on procedures to be followed for data validity and reliability. The research assistants were used to help administer instruments, collect needed data in the schools and to follow up as necessary. The pilot study was particularly useful in the training, since they accompanied the researcher in the visits to schools.
80
3.6 Pilot studyThe pilot study conducted in the second school term 1998 was an important stage o f this study. It was expected that this would help to review the instruments, the subjects, the environment, and the process and loopholes in instrument administration as Balian (1981:90) cautions:
The vast majority of doctoral and professional researchers would have been better of in taking less time to actually collect data and more time pilot testing . . ..the pilot test allows the researcher to review instruments, subjects, the four special hazards, and actual test administration, all in one operation and simultaneously.
In view of the importance o f pilot testing, a pilot study was conducted to help improve the research instruments and data collection procedures. The researcher and the research assistants worked together in the pilot study to acquire the necessary experience and to enhance reliability in collection of data in the main study.
A sample of two schools in two provinces was used for the study. Up to fifteen students in a class and two teachers were selected from each school. One school was a girls’ school while the other was a boys’ school. This made a total of 55 students and eight teachers.
The researcher learnt a lot during this pilot study stage. First, he was brought into contact with real respondents and real mathematics teaching situations.
81
This forced the researcher to modify some strategies that had been suggested earlier. It was mentioned how the numbers of respondents had to be revised for easier administration of the questionnaires. Again, it was obvious that despite the assurances of confidentiality some schools and teachers were suspicious and would not give the study their full co-operation. Most teachers though were enthusiastic about participating in the study.
For example, it had been envisaged that teachers would give their identities in the questionnaires for follow-up in the study (for example to find out how their perceptions of homework affect their students’) but the general reaction was to omit names. The researcher had to go through the school principal who would instruct/request the Head of Mathematics/Science Department to get the participants. The Head of Department would in turn ask mathematics teachers to fill the questionnaires or refer the researcher to the teachers. The definite control of responses that the researcher planned for was not obvious. The researcher could not move at his pace but would have to negotiate with others. The questionnaires had to be reworded to get more information and to check for contradicting information.
Some heads also expressed their concern that the study would take a lot of their pupils’ time. The students’ questionnaire took about twenty - six minutes to fill and the mathematics test about an hour for the slower students. There was concern expressed by the teachers that either their students had not covered the material tested or that they would not administer it to their students for it did not
8 2
meet their standards. The questionnaire had to be edited to take about eighteen to twenty minutes and the mathematics test dropped and replaced with teacher marks in two consecutive terms around the time o f the study.
All this meant that the research would move at a slower pace than envisaged. In the actual study the researcher decided to get information piecemeal to tap the teachers co-operation better. For example the observation, interviews, students’ questionnaire, teachers’ questionnaires, and requests for marks were done at different occasions (however, the overall picture o f the request was mentioned to the school Principal in an introductory letter seeking permission to do the research ). It was also found necessary to write a ‘Questionnaire administration instructions sheet’ guiding the teacher on how to administer the questionnaire in cases where the researcher/research assistant would not be allowed into the classroom.
Some responses that were previously not included in the questionnaires were added in depending on their popularity with the respondents. Some items were added or dropped from the questionnaires or their wording was improved on.
3.7 Students’ mathematics achievement dataAs mentioned earlier it was realised that administering the achievement test set in all the schools was administratively harder than envisaged. In most cases, the school authority did not mind the test but the researcher would have to schedule the test with a mathematics teacher, and this depended on the co-operation of
83
the teacher. Further, it was found difficult to schedule a test that would occupy a fraction of the class, even after class time. On the other hand some pupils did not write their names on the questionnaires and the test answer sheets implying a need for non identification, or simply wrote their names and left the
instruments unfilled. -
In this case, it was decided to use the average mark awarded by the class mathematics teacher in end o f term examinations. The end of first term and second term 2000 (when the study was done) marks in mathematics were used since these marks defined the student at the time of the study. These marks were used to provide a measure of achievement in mathematics in the study.
These, too, were the marks that the students saw and perhaps reacted to (in terms o f reinforcement or forming expectations on better future performance). While the marks for the previous term were available, the researcher had to wait for the marks of the end o f term during which the research was conducted.
Despite the disadvantages o f lack of control over the validity /reliability of these marks, the researcher sees them as a rough (raw) indicator of the pupils achievement in Mathematics. This system was found to have three advantages:(i) the marks for each student was/ would be available without the student
being aware of the fact(ii) no further time would be required to schedule tests in schools
84
(iii) there was/would be an indirect validation by the teacher on whether names given by students were real or fictitious.
The marks were judged to be good enough because:(i) In the bigger schools, examinations, including mathematics and science
are set by a panel using set guidelines.(ii) Where the SMASSE (Strengthening of Mathematics and Science in
Secondary School Education) project is on. Form 2 and Form 4 students do common examinations at the district level.
(iii) Mathematics is a structured subject with a tendency towards convergent answers. In such circumstances it may be assumed that the deviation of teacher awarded marks is less compared to subjects like, say, history.
(iv) Many mathematics teachers are involved in marking the KCSE and are thus familiar with standards of marking and setting examinations. Most of the schools also did a common district mock examination in the second term. Such examinations have a common marking scheme.
The disadvantage is that the marks are obtained from different tests, different conditions, and different teachers The average o f two scores obtained by the student at two different examinations is expected to be a better indicator of how good an achiever the student is in mathematics. The correlation between the two terms' marks in all classes is high in the order o f more than 0.8. For the Form 4 class the validity o f the teachers’ marks is supported by medium to high correlation between their scores and those of the KCSE. This agrees with Cooper (1989) who observed that the effect of homework on teacher made tests
85
was similar to those on standardised tests. As a further validation, students were asked to rate themselves on how good they were in mathematics.
3.8 Data collection3.8.1 ProcedureA letter seeking to be allowed by the school principal to do research in the school was sent in advance. Thereafter the researcher went on a convenient date, reported to the school head. Where the principal was not found, the researcher or research assistant reported to the deputy principal. In most cases the researcher was sent to the Deputy Principal for assistance or to the head of science/mathematics department to assist with the practicalities of questionnaire administration. The head of department would handle the test administration or would delegate the questionnaire administration to some other willing teacher. The teacher delegated to would in turn administer the questionnaire or allow the researcher/research assistant into the class to do the same. In most cases the researcher would insist on waiting for the student questionnaires or would be given a date when to collect the completed questionnaires. Most teachers assisting were co-operative but there were some in isolated cases where the students would be rushed through even without fully completing the questionnaires.
3.8.2 ObservationThe researcher made seventeen visits to mathematics classrooms. This helped to validate the questionnaire responses and indicate how homework is actually
86
handled in class. The researcher observed homework structuring activities and time taken for such activities, and obtained samples of pupils’ mathematics exercise books. The researcher made an effort to establish good rapport with the teacher to minimise the halo and the Hawthorne effects.
3.8.3 Administration of questionnairesStudent questionnaires were administered in class at a convenient time, as advised by the school administration, to selected students. The administration of the questionnaire was done by a school teacher, researcher/ research assistant or both. Teachers were given the questionnaires and encouraged to respond without much delay. The researcher or a research assistant made a deliberate effort to get the co-operation of mathematics teachers to get the questionnaires filled in the same day or at most within the week. Some teachers, however, delayed with the questionnaire beyond a week. Where the questionnaires were misplaced or lost the individual teachers were requested to fill another one.
3.8.4 Administration of interviewsSchool heads or deputy heads were interviewed by the researcher or research assistant using an unstructured interview schedule. The interviewer had a micro-cassette recorder to help record responses accurately and unobtrusively. This way it is believed the responses were more spontaneous and sincere. The responses were transcribed and coded later after the interview.
87
3.9 Units of analysisThis study analysed responses given mainly at the individual respondents’ and school level, but also at the provincial level to a limited extent. The schools and individuals seemed to interact with each other, and provinces seemed to have their peculiarities too. The school was used as the sampling unit.
3.10 Variables in the studyThis study used the following nine main variables:1. Mathematics achievement as measured by class tests and KCSE (for the Form 4); 2. attitudes to homework; 3. Gender; 4. homework time; 5. residential status; 6. teaching experience; 7. Class; 8. perceived homework difficulty, and9. students’self-rating in mathematics.
3.10 Data coding and AnalysisWhen questionnaires were returned to the researcher or /research assistant, they were checked for completeness and any necessary step taken. It was noted that in some cases the students did not complete filling in the questionnaire, a page may have fallen off, or they had not given their names, even after encouragement to do so, for possible follow-up or would leave some questions blank. Some did not even return their questionnaires. For purposes of comparison the fact whether a student gave his/her identity was coded as a dichotomous variable. Gaps in the questionnaire were left as gaps in therelevant school code sheets.
88
The questionnaires were labelled by the school they came from, and numbered to facilitate easy identification during the coding process. The questionnaire was labelled with a number that identified the school and the respondent to prevent mix up or for future cross-checking of responses. For purposes of confidentiality and anonymity, all respondents (teachers, students, and schools) are referred to by code numbers. The identification numbers for the students and teachers are related to that of the school for easy reference. The number identifies the school- class/province - respondent. For example the number 25:4-13 identifies respondent 13 in Form 4 of school code S25, while the number 10:1-13 for a teacher identifies a teacher no. 13 from school code 10 in province 1.
The questionnaires were summarised into code sheets for each school and class by either the research assistants or the researcher. Two code books were prepared incorporating the variables investigated in the students’ and teachers’ questionnaires. The returned questionnaires were processed against these code books.The researcher and the research assistants did the coding. The work was quite tedious and took a lot of time. The coding involved converting the pupil responses to numeric values that could be used by the computer for the data analysis. The code sheets could not cater for all the possible responses of students /teachers but they did cover the more frequent ones. New alternative coding was added when it became clear that a particular response was actually
89
different than those provided for. Pupils in different schools came up with new categories that could not fit into previous ones.
It was necessary to continually revise the list o f responses to a particular item or the list needed to be revisited to accommodate a new choice. But an effort was made to make the categories as independent as possible. Where the possible categories of responses were modified, a note was made against the necessary item on the code book. Most of the questions were straightforward and there were no differences between the coders. Some students though would add other responses than given in the options. Differences would usually occur where the respondent had modified their answer from that given, or had given a qualifying statement that would probably change their answer from one code to another. In such a case, the coders would differ on the coding. Those other responses were added as options where it was felt they introduced a different idea from any in the options. The researcher went through all the code sheets and rectified any errors in coding that may have been there The researcher has checked and rechecked the individual group code sheets against the original pupil responses for consistency of coding, so it is as if all the coding was done by one person.
The data collected was entered into the computer, checked and cleaned for obvious errors, for example where a value was typed that did not correspond with the values allowed for the variable. The error would be corrected, and perhaps the source of the error noted. The important variables were checked for the characteristics o f the distributions using P-P or Q-Q plots.
90
The data was analysed using the Statistical Package for the Social Sciences (SPSS). Because of the computer facility, it was possible to analyse the data in different ways to follow up the hypotheses and objectives of the study. Descriptive statistics, such as measures of central tendency (mean, percentages etc.) and inferential statistics (such as contingency tables, x2, t /F tests, ANOVA, correlation, Mann-whitney U and Kruskal-Wallis H tests) with respect to the hypotheses and objectives of the study were used and reported accordingly.
U N IV E R S I T Y OF NAIROBI EAST AFRICANA COLLECTION
The interviews and observations made during the study helped in the analysis and interpretation of the data obtained from the questionnaires.
91
CHAPTER 4:DATA ANALYSIS AND DISCUSSION OF FINDINGS
4.0 IntroductionThis chapter presents the analysis of the data collected and a discussion o f the same. The study was aimed at achieving the following objectives:i) Identify the nature of mathematics homework given to secondary school
studentsii) Find out the opinions of secondary school students regarding homeworkiii) Investigate secondary school teachers perceptions on homeworkiv) Examine the relationship between students self rating on ability in
mathematics and their perceptions of mathematics homeworkv) Determine the relationship between homework-related variables and
achievement in mathematics.The last two objectives were translated into several hypotheses, which this study tested and reports. The data collected in the study, findings and the attendant discussion are presented in this chapter.4.1 Questionnaire ReturnsAll in all 1783 students responded to the questionnaire making 87.4% of the expected return. The students were from rural (43%) -away from town, semi- urban [small towns or suburb of a city] (34%) and urban schools - in a city - (23%). Most day students in city schools take a ‘matatu’ to school while only some in a semi-urban school use such means to get to school. Almost all day scholars in rural areas walk to school. This return rate is considered acceptable.
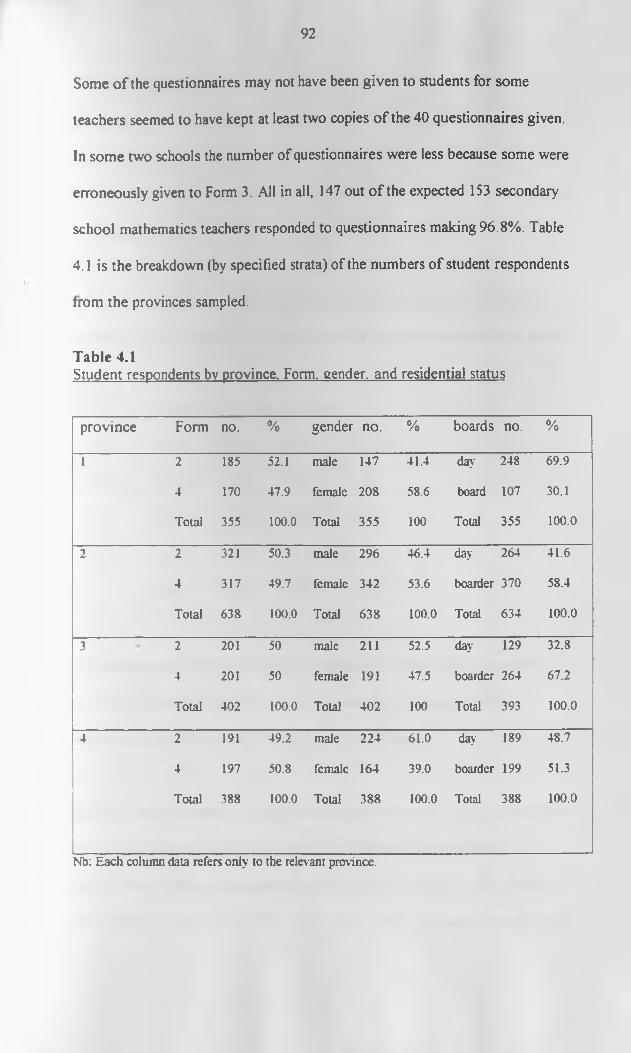
92
Some o f the questionnaires may not have been given to students for some teachers seemed to have kept at least two copies o f the 40 questionnaires given. In some two schools the number of questionnaires were less because some were erroneously given to Form 3. All in all, 147 out o f the expected 153 secondary school mathematics teachers responded to questionnaires making 96.8%. Table4.1 is the breakdown (by specified strata) of the numbers of student respondents from the provinces sampled.
Table 4.1Student respondents bv province. Form, gender, and residential status
p ro v in c e Form no. % gender no. % boards no. %1 2 185 52.1 male 147 41.4 day 248 69.9
4 170 47.9 female 208 58.6 board 107 30.1Total 355 100.0 Total 355 100 Total 355 100.0
2 2 321 50.3 male 296 46.4 day 264 41.6
4 317 49.7 female 342 53.6 boarder 370 58.4
Total 638 100.0 Total 638 100.0 Total 634 100.0
3 2 201 50 male 211 52.5 day 129 32.84 201 50 female 191 47.5 boarder 264 67.2
Total 402 100.0 Total 402 100 Total 393 100.0
4 2 191 49.2 male 224 61.0 day 189 48.7
4 197 50.8 female 164 39.0 boarder 199 51.3Total 388 100.0 Total 388 100.0 Total 388 100.0
Nb: Each column data refers only to the relevant province.
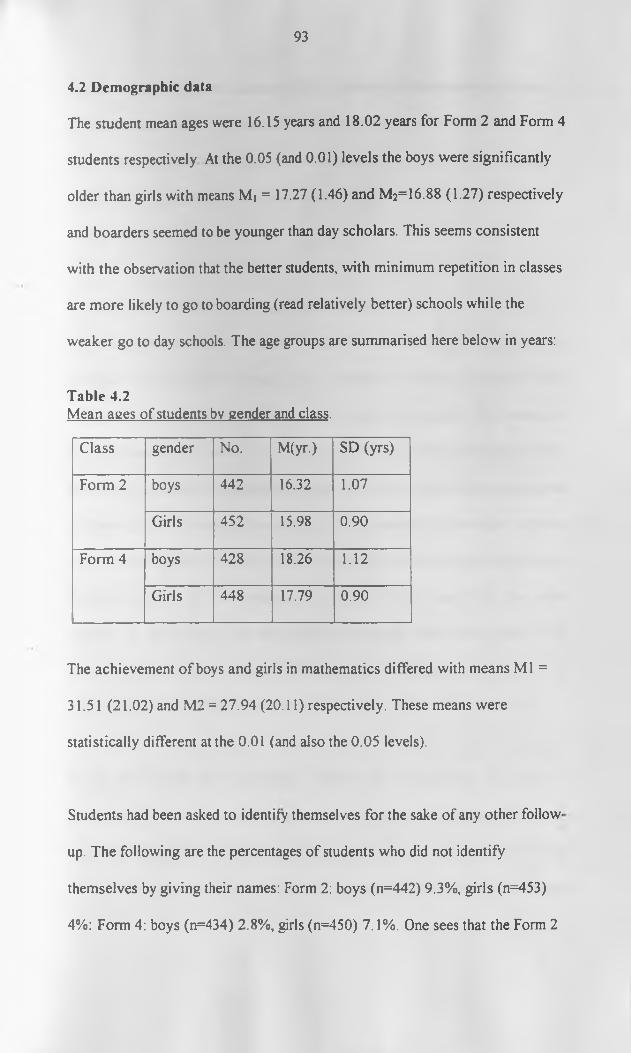
93
4.2 Demographic dataThe student mean ages were 16.15 years and 18.02 years for Form 2 and Form 4 students respectively At the 0.05 (and 0.01) levels the boys were significantly older than girls with means Mi = 17.27 (1.46) and M2=16.88 (1.27) respectively and boarders seemed to be younger than day scholars. This seems consistent with the observation that the better students, with minimum repetition in classes are more likely to go to boarding (read relatively better) schools while the weaker go to day schools. The age groups are summarised here below in years:
Table 4.2Mean ages of students by gender and class.
Class gender No. M(yr.) SD (yrs)Form 2 boys 442 16.32 1.07
Girls 452 15.98 0.90Form 4 boys 428 18.26 1.12
Girls 448 17.79 0.90
The achievement o f boys and girls in mathematics differed with means Ml = 31.51 (21.02) and M2 = 27.94 (20.11) respectively. These means were statistically different at the 0.01 (and also the 0.05 levels).
Students had been asked to identify themselves for the sake of any other followup. The following are the percentages of students who did not identify themselves by giving their names: Form 2: boys (n=442) 9.3%, girls (n=453) 4%: Form 4: boys (n=434) 2.8%, girls (n=450) 7.1%. One sees that the Form 2
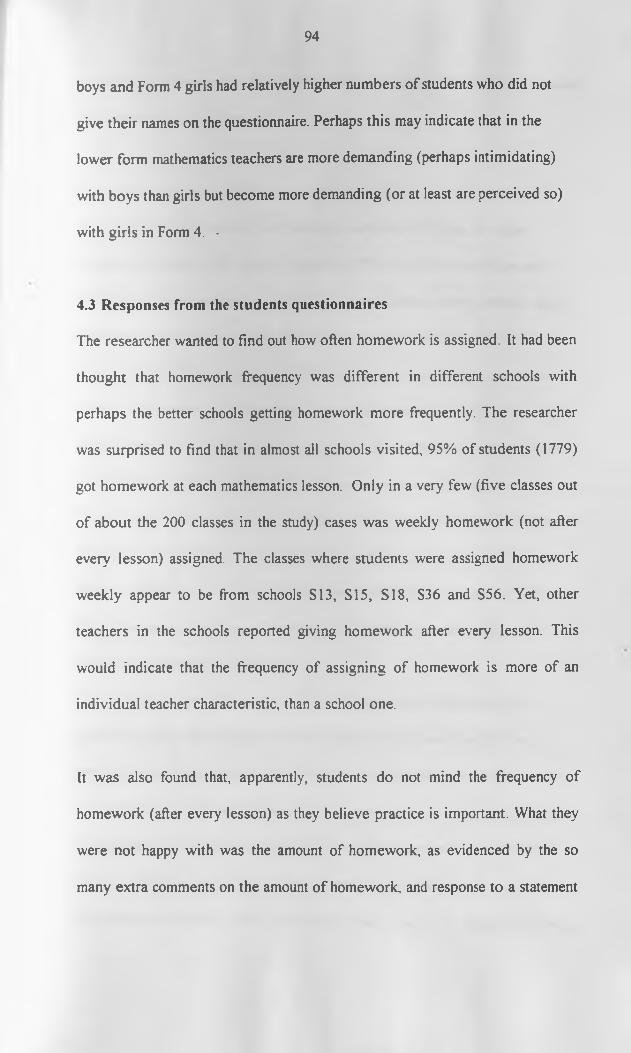
94
boys and Form 4 girls had relatively higher numbers of students who did not give their names on the questionnaire. Perhaps this may indicate that in the lower form mathematics teachers are more demanding (perhaps intimidating) with boys than girls but become more demanding (or at least are perceived so) with girls in Form 4. •
4.3 Responses from the students questionnairesThe researcher wanted to find out how often homework is assigned. It had been thought that homework frequency was different in different schools with perhaps the better schools getting homework more frequently. The researcher was surprised to find that in almost all schools visited, 95% of students (1779) got homework at each mathematics lesson. Only in a very few (five classes out of about the 200 classes in the study) cases was weekly homework (not after every lesson) assigned. The classes where students were assigned homework weekly appear to be from schools S I3, SI5, S I8, S36 and S56. Yet, other teachers in the schools reported giving homework after every lesson. This would indicate that the frequency of assigning of homework is more of an individual teacher characteristic, than a school one.
It was also found that, apparently, students do not mind the frequency of homework (after every lesson) as they believe practice is important. What they were not happy with was the amount of homework, as evidenced by the so many extra comments on the amount of homework, and response to a statement
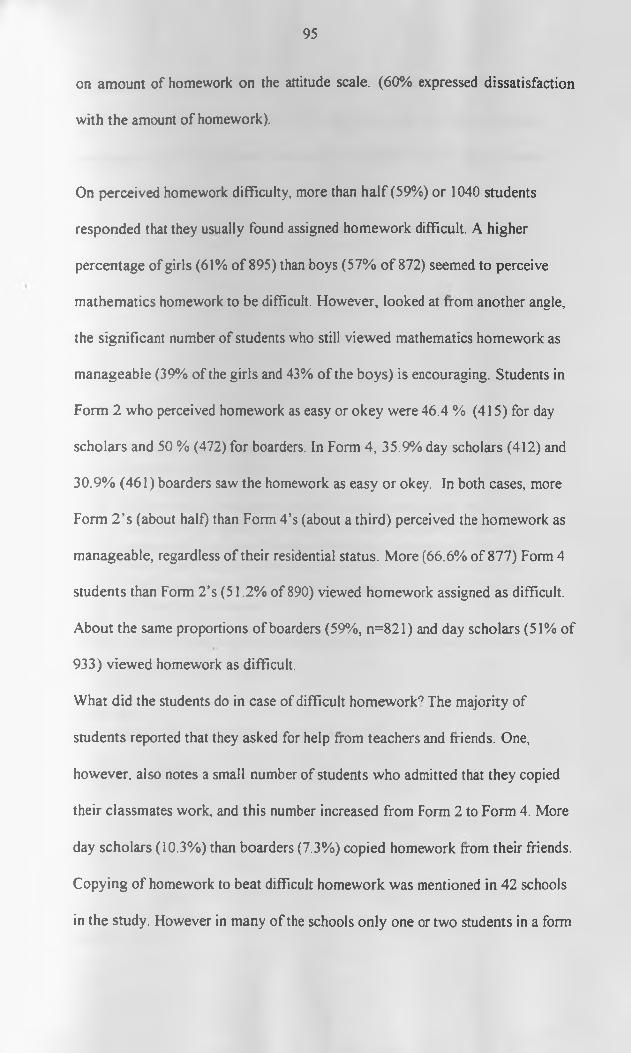
95
on amount of homework on the attitude scale. (60% expressed dissatisfaction with the amount of homework).
On perceived homework difficulty, more than half (59%) or 1040 students responded that they usually found assigned homework difficult. A higher percentage of girls (61% of 895) than boys (57% of 872) seemed to perceive mathematics homework to be difficult. However, looked at from another angle, the significant number of students who still viewed mathematics homework as manageable (39% of the girls and 43% of the boys) is encouraging. Students in Form 2 who perceived homework as easy or okey were 46.4 % (415) for day scholars and 50 % (472) for boarders. In Form 4, 35.9% day scholars (412) and 30.9% (461) boarders saw the homework as easy or okey. In both cases, more Form 2 ’s (about half) than Form 4’s (about a third) perceived the homework as manageable, regardless of their residential status. More (66.6% of 877) Form 4 students than Form 2’s (51.2% of 890) viewed homework assigned as difficult. About the same proportions of boarders (59%, n=821) and day scholars (51% of 933) viewed homework as difficult.What did the students do in case of difficult homework9 The majority of students reported that they asked for help from teachers and friends. One, however, also notes a small number of students who admitted that they copied their classmates work, and this number increased from Form 2 to Form 4. More day scholars (10.3%) than boarders (7.3%) copied homework from their friends. Copying of homework to beat difficult homework was mentioned in 42 schools in the study. However in many of the schools only one or two students in a form
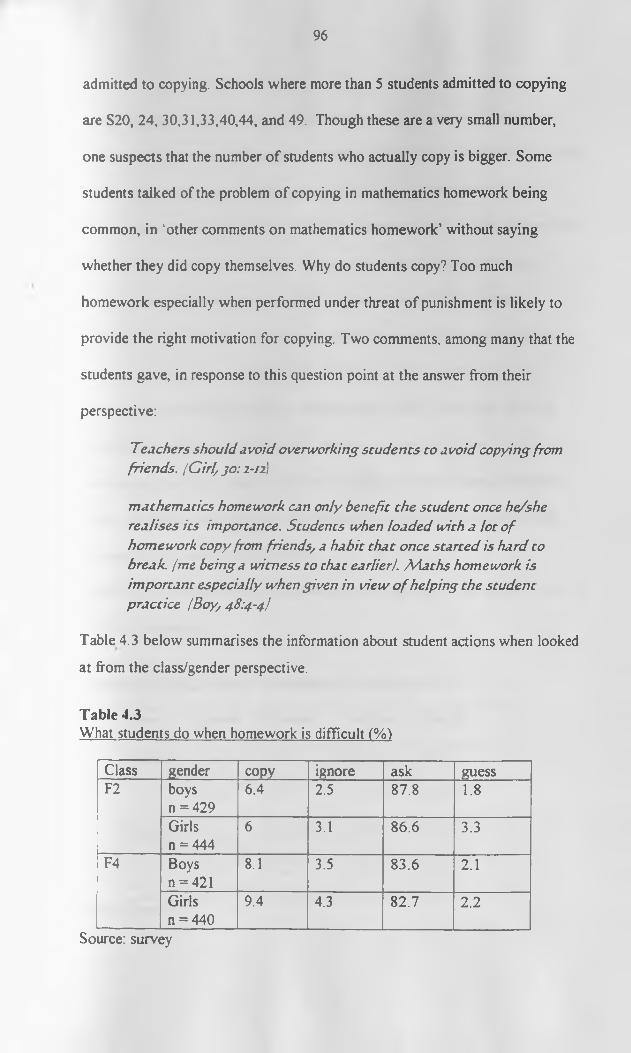
96
admitted to copying. Schools where more than 5 students admitted to copying are S20, 24, 30,31,33,40,44, and 49. Though these are a very small number, one suspects that the number o f students who actually copy is bigger. Some students talked of the problem of copying in mathematics homework being common, in ‘other comments on mathematics homework’ without saying whether they did copy themselves. Why do students copy? Too much homework especially when performed under threat of punishment is likely to provide the right motivation for copying. Two comments, among many that the students gave, in response to this question point at the answer from their perspective:
Teachers should avoid overworking students co avoid copying from friends. (C irf jo : 2-12)
m athematics homework can only benefit the student once he/she realises its importance. Students when loaded with a lot o f homework copy from friends/ a habit tha t once started is hard to break. (me being a w itness to that earlier/. AAaths homework is im portant especially when given in view o f helping the student practice (Boy, 48:4-4)
Table 4.3 below summarises the information about student actions when looked at from the class/gender perspective.
Table 4.3What students do when homework is difficult (%)
Class gender copy ignore ask guessF2 boys
n = 4296.4 2.5 87.8 1.8
Girls n = 444
6 3.1 86.6 3.3F4 Boys
n = 4218.1 3.5 83.6 2.1
Girls n = 440
9.4 4.3 82.7 2.2Source: survey
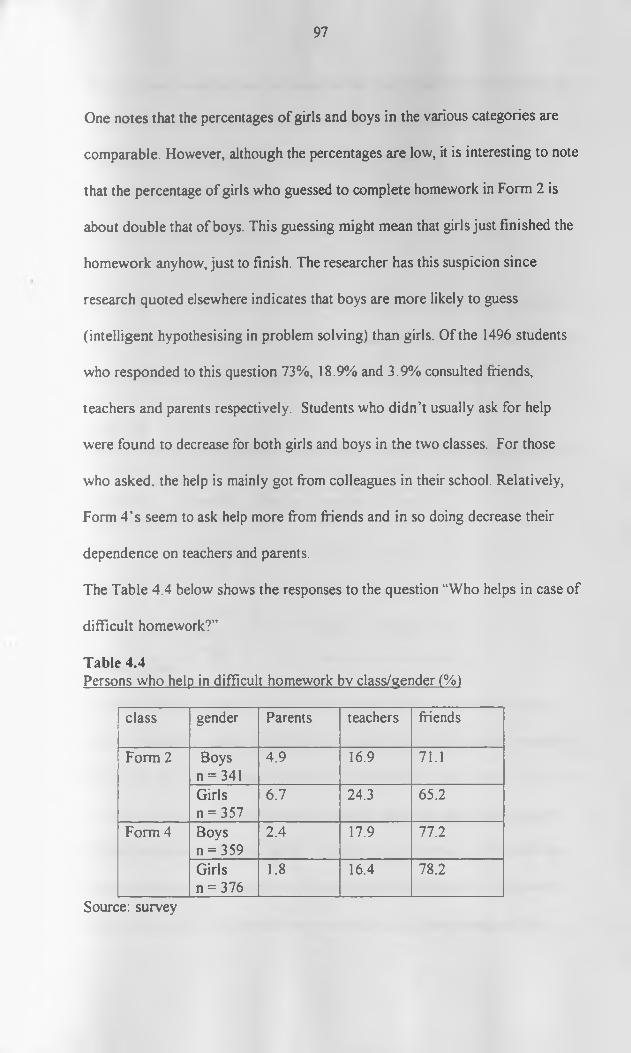
97
One notes that the percentages of girls and boys in the various categories are comparable. However, although the percentages are low, it is interesting to note that the percentage of girls who guessed to complete homework in Form 2 is about double that of boys. This guessing might mean that girls just finished the homework anyhow, just to finish. The researcher has this suspicion since research quoted elsewhere indicates that boys are more likely to guess (intelligent hypothesising in problem solving) than girls. Of the 1496 students who responded to this question 73%, 18.9% and 3.9% consulted friends, teachers and parents respectively. Students who didn’t usually ask for help were found to decrease for both girls and boys in the two classes. For those who asked, the help is mainly got from colleagues in their school. Relatively, Form 4 ’s seem to ask help more from friends and in so doing decrease their dependence on teachers and parents.The Table 4.4 below shows the responses to the question “Who helps in case of difficult homework?”Table 4.4Persons who help in difficult homework bv class/gender (%)
class gender Parents teachers friends
Form 2 Boys n = 341
4.9 16.9 71.1Girls n = 357
6.7 24.3 65.2Form 4 Boys
n = 3592.4 17.9 77.2
Girls n = 376
1.8 16.4 78.2Source: survey
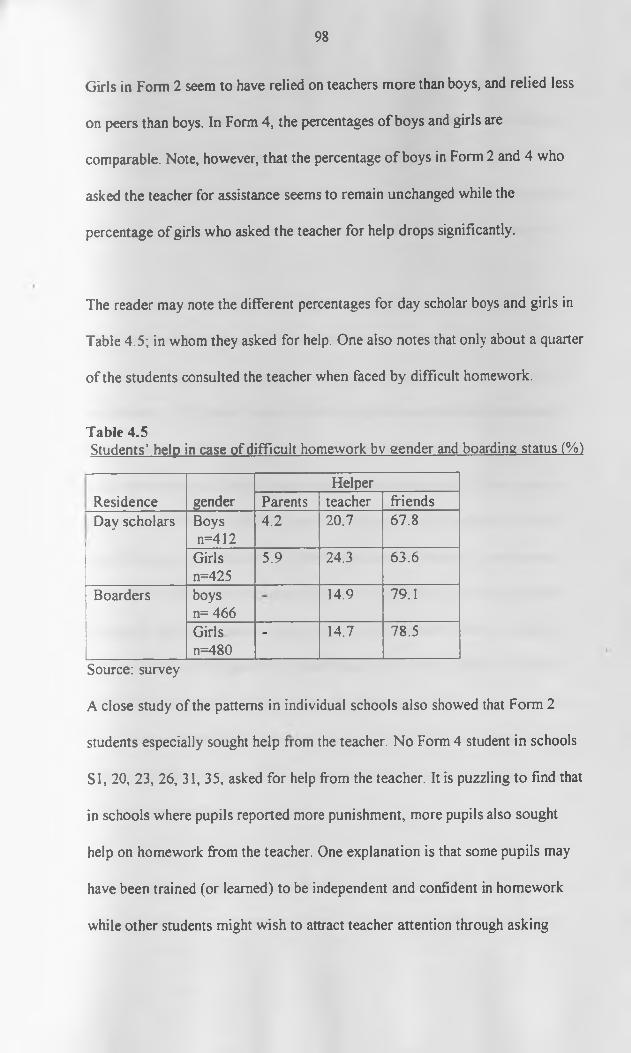
98
Girls in Form 2 seem to have relied on teachers more than boys, and relied less on peers than boys. In Form 4, the percentages of boys and girls are comparable. Note, however, that the percentage o f boys in Form 2 and 4 who asked the teacher for assistance seems to remain unchanged while the percentage of girls who asked the teacher for help drops significantly.
The reader may note the different percentages for day scholar boys and girls in Table 4.5; in whom they asked for help. One also notes that only about a quarter of the students consulted the teacher when faced by difficult homework.
Table 4.5Students’ help in case of difficult homework by gender and boarding status (%)
Residence genderHelper
Parents teacher friendsDay scholars Boys
n=4124.2 20.7 67.8
Girlsn=425
5.9 24.3 63.6Boarders boys
n= 46614.9 79.1
Girlsn=480
- 14.7 78.5Source: surveyA close study of the patterns in individual schools also showed that Form 2 students especially sought help from the teacher. No Form 4 student in schools SI, 20, 23, 26, 31, 35, asked for help from the teacher. It is puzzling to find that in schools where pupils reported more punishment, more pupils also sought help on homework from the teacher. One explanation is that some pupils may have been trained (or learned) to be independent and confident in homework while other students might wish to attract teacher attention through asking
99
questions related to homework. In the classroom observations some six instances were of students were noted attempting to forestall teachers demand on homework by asking questions about homework. Comments given in this study seem to indicate that teachers were perceived by students to be impatient with the low achieving students or those who had difficulty in mathematics.
Day scholars, who usually dispersed from school after lessons, may have been particularly disadvantaged. They scattered away from their friends and may have been limited in the consultation they would get from the easily accessible neighbour(s). They would be at a disadvantage because the friends were not around and the teacher didn’t seem to be as accessible as one would suppose. In towns the problem is likely to be exacerbated since houses of fellow students are scattered over the suburb or even in different suburbs, and where culture may discourage ‘unnecessary’ visitors in the spirit of privacy. In such a case, the pupil is likely to be discouraged, spend time practising errors or even feel frustrated, all with negative consequences in achievement. Table 4.5 above shows that the percentages for people chosen to help were different for day scholars but similar for boarders. Day scholar girls were less likely to get help from friends, especially if homework was done in the evenings. Girls are less likely to be allowed out into the night, possibly due to the extra protection that is usually accorded girls in the African culture.
Some students especially in day schools got help from parents with more girls getting such help, but decreasing from Form 2 to 4, to about a half and one
100
third. We may note the relatively higher percentage of students in Form 2 who received help from parents in homework compared to Form 4’s.This is likely to motivate such students to learn mathematics. The percentages of students who received parental help in homework got lower at Form 4 as possibly the content became more technical for the parent, and as the student got more independent. Another interesting observation is the fact that boarders seem to get help more from friends (79%), while a higher percentage of day scholars gets help from the mathematics teacher(s). Some 307 students gave a second choice, and when that is taken into consideration the percentage of students who consult friends, teachers and parents add to 74.6%, 33.6% and 5.5 % respectively. This compares well with the figures already discussed.
Where is homework usually done9 Of the 1748 students who answered this question, 70.3 %, 12.7%, and 13% reported that they usually do their homework in class, sitting room and /or in a bedroom room at home. The class is likely to be free o f distractions, except in poorly disciplined schools, and more comfortable too. The researcher observed some relatively high noise levels in class, (that is inconsistent with serious study) in some of the schools visited. Fortunately, 92% of boarders and about 45% of day scholars used the class as the place where they usually did their mathematics homework. Only 44 % of girls and 47.1 % of boy day scholars did their homework in class in the school, while 27% and 20% of girls and boys respectively did homework in the sitting room. The percentages for boys and girls who did their homework in a bedroom/private room are 26.7% and 25.7% respectively. Relatively fewer girls
101
than boys were left in class to finish homework after school, possibly because they were expected home on time, and were more likely to be assigned other household chores like looking after younger siblings or helping in the kitchen. Such a girl student could be punished for not completing homework but yet she was the one more groomed to be a responsible member of the society.
The sitting room in a residential house is likely to be a more distracting environment - the television is there, and other members of the family use it as a social room. The bedroom has fewer distractions, but it is likely to be shared by another family member and possibly lack in necessary furniture. Some students may not have a study desk in the bedroom and resort to doing homework on the bed. The situation for boys is likely to be different, especially in the rural areas where boys have out huts, which nevertheless may be shared by other boys in the family. The work output of a boy intending to do homework might be influenced by the work ethic of the other occupants of the hut. For boys, this might also make the problem o f asking for help from friends in case o f difficult homework easier
If the responses of some 350 students who gave a second choice are considered, class would have 71.3%, sitting room 17.3%, and bedroom/private room 19.6%. These proportions are not much different from the case discussed.
Students were also asked if their teacher minded if homework was completed or not. The percentage o f students who thought the teacher did not mind was 16%,
102
but this seems to increase from Form 2 to 4 from 13% to about 20%. Whereas boys and girls in Form 4 had the same percentage (19.7%), girls in Form 2 are 5% points higher than the boys (15.3% and 10.2%). Why should more Form 2 girls than boys have thought that teachers did not mind completion of homework? Perhaps teachers were more lenient to younger girls, (possibly the teacher seeing the girls innocence in non- completion) or more girls than boys in Form 2 simply did not complete homework.
U N IV E R S IT Y OF NA IROB ICAST AFRiCANA C0 LLECTI0 JI
When do students prefer to do their homework? Table 4.6 provides a synopsis o f the responses. Generally, the early mornings seemed to be a preferable time for students (over 50%) to do homework. The percentages of students who preferred to do homework in the morning are higher for the boarders than day scholars, and for girls more than boys regardless o f their residential status. Day school girls are more likely to be involved in household chores in the evening and be very tired at the end o f the day, preferring to study, do homework, early in the morning. Relatively more day school boys than girls may have studied in the evening because they had relatively fewer responsibilities in the evenings. Some boarding schools especially boys schools allow boys to stay on after the compulsory prep at about 10 p.m. In mixed boarding schools it was noted that boys were likely to have more prep time in the evening since girls were asked to leave for their dormitories about thirty minutes before the boys did, ostensibly to prevent them from mingling mischievously with the boys. Working on homework after prep for both boys and girls in such schools seems more unlikely for the same reason o f caution.
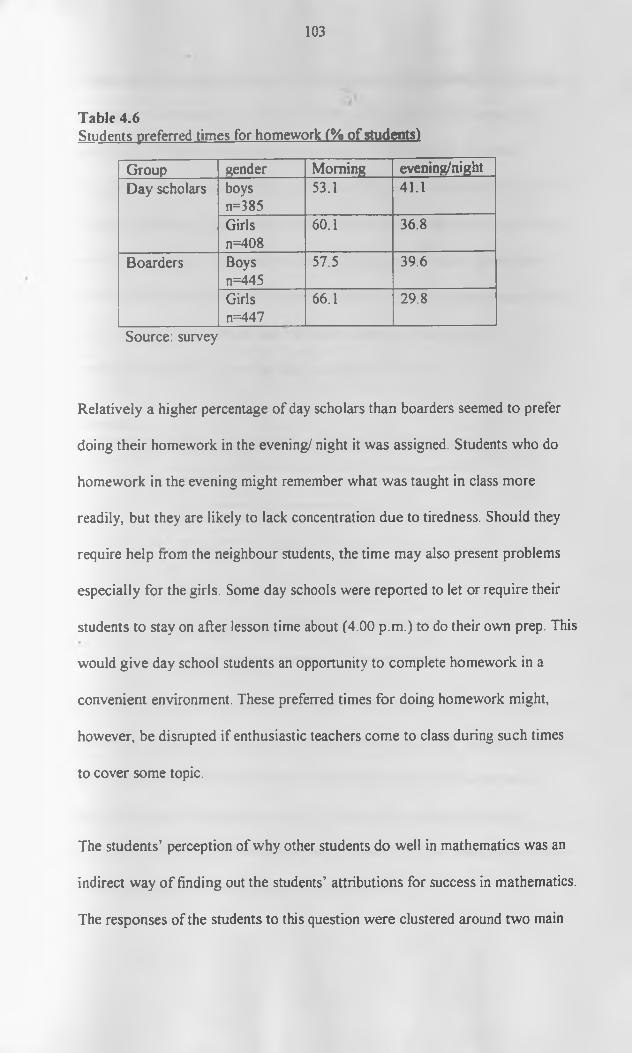
103
Table 4.6Students preferred times for homework (% of students)
Group gender Morning evening/nightDay scholars boys
n=38553.1 41.1
Girlsn=408
60.1 36.8
Boarders Boysn=445
57.5 39.6Girlsn=447
66.1 29.8
Source: survey
Relatively a higher percentage of day scholars than boarders seemed to prefer doing their homework in the evening/ night it was assigned. Students who do homework in the evening might remember what was taught in class more readily, but they are likely to lack concentration due to tiredness. Should they require help from the neighbour students, the time may also present problems especially for the girls. Some day schools were reported to let or require their students to stay on after lesson time about (4.00 p.m.) to do their own prep. This would give day school students an opportunity to complete homework in a convenient environment. These preferred times for doing homework might, however, be disrupted if enthusiastic teachers come to class during such times to cover some topic.
The students' perception of why other students do well in mathematics was an indirect way of finding out the students’ attributions for success in mathematics. The responses of the students to this question were clustered around two main
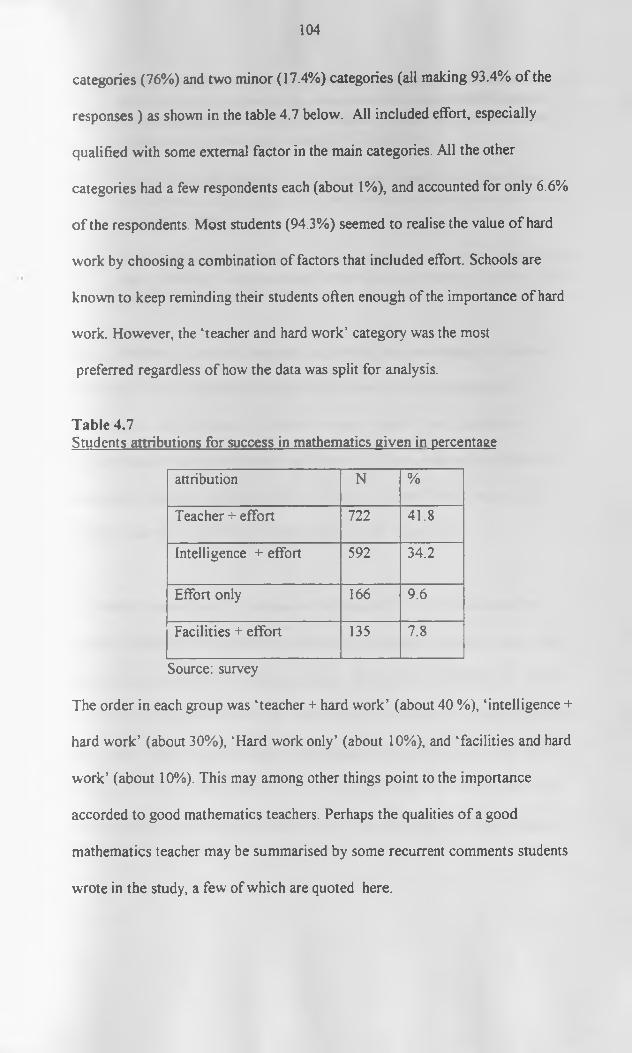
104
categories (76%) and two minor (17.4%) categories (all making 93.4% of the responses ) as shown in the table 4.7 below. All included effort, especially qualified with some external factor in the main categories. All the other categories had a few respondents each (about 1%), and accounted for only 6.6% o f the respondents. Most students (94.3%) seemed to realise the value o f hard work by choosing a combination of factors that included effort. Schools are known to keep reminding their students often enough of the importance of hard work. However, the ‘teacher and hard work’ category was the most preferred regardless o f how the data was split for analysis.
Table 4.7Students attributions for success in mathematics given in percentage
attribution N %Teacher + effort 722 41.8Intelligence + effort 592 34.2
Effort only 166 9.6Facilities + effort 135 7.8
Source: surveyThe order in each group was ‘teacher + hard work’ (about 40 %), ‘intelligence + hard work’ (about 30%), ‘Hard work only’ (about 10%), and ‘facilities and hard work’ (about 10%). This may among other things point to the importance accorded to good mathematics teachers. Perhaps the qualities of a good mathematics teacher may be summarised by some recurrent comments students wrote in the study, a few of which are quoted here.
105
a m aths teacher should not be harsh> boring/ lazy. Books should be marked after every lesson. A lso a m aths teacher should explain u n til a ll students understand. A teacher should not give homework from a topic she/he hasn't taught. /G irl, 29:1 -1)
teachers should always try and mark each pupils work individually an d correct their mistakes. This w ill bring better performance in their students. /Boy, S4:4~j)W e should be given teachers o f our choice who are loving, serious, and hard working. Lazy teachers contribute to studen ts' failure. (Girl, 36:4 -17)
Form 2 students, especially boarders, had the highest percentage for 'teacher + hard work’ (44.5%) while the Form 2 girls have a higher percentage of 'intelligence and hard work’. Perhaps we may expect Form 2 students to believe that they are more clever than Form 4 ‘s if one equates the number of homework problems got right with cleverness. For both Form 2 and 4, day scholars had the higher % for ‘effort only’ (13.6% and 9.3%).
In Table 4.8 about here the perspective is changed from class/residence to gender /residence. Note that the difference in percentage between boarders and day scholars in the first two categories are wider for boys than for girls. Girls have relatively higher percentages than boys in the category of'intelligence and hard work’ while boys have higher percentages in the 'teacher and hard work’ category. Why do day scholars have a higher percentage for ‘hard work only’ than boarders, and about double for girl day scholars compared to girl boarders?
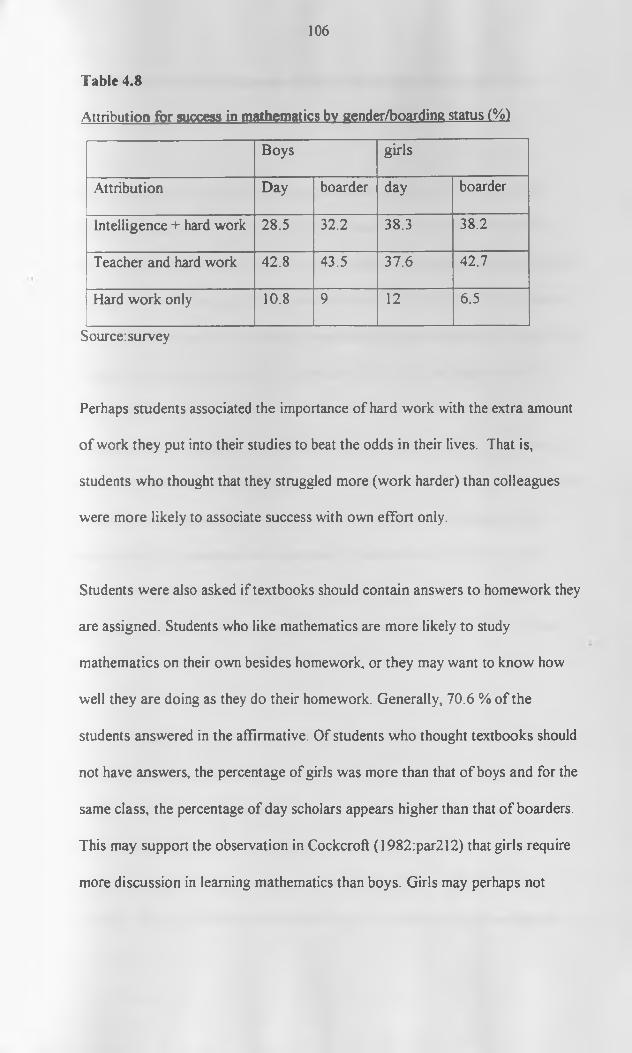
106
Table 4.8Attribution for success in mathematics by gender/boarding status (%)
Boys girlsAttribution Day boarder day boarder
Intelligence + hard work 28.5 32.2 38.3 38.2
Teacher and hard work 42.8 43.5 37.6 42.7
Hard work only 10.8 9 12 6.5Source:survey
Perhaps students associated the importance of hard work with the extra amount o f work they put into their studies to beat the odds in their lives. That is, students who thought that they struggled more (work harder) than colleagues were more likely to associate success with own effort only.
Students were also asked if textbooks should contain answers to homework they are assigned. Students who like mathematics are more likely to study mathematics on their own besides homework, or they may want to know how well they are doing as they do their homework. Generally, 70.6 % of the students answered in the affirmative. Of students who thought textbooks should not have answers, the percentage of girls was more than that o f boys and for the same class, the percentage of day scholars appears higher than that of boarders. This may support the observation in Cockcroft (1982:par212) that girls require more discussion in learning mathematics than boys. Girls may perhaps not
107
require textbooks to have answers because that is likely to deny them the opportunity to discuss the homework answers with their teacher.
The percentage of Form 2’s who think textbooks should not have answers is higher than Form 4’s. It does not look plausible that Form 2 students did not like to do their own mathematics work. Therefore, one would think that teachers marked their work or gave them answers to mark for themselves. Such students would have no need for the answers. Another likely explanation is that the Form 2 ’s actually required more teacher (feedback) attention, and approval in line with their age. Form 4 students were more likely to do their own practice in preparation for mocks and the KCSE, and were likely to need such answers for revision. Some students gave the reason why textbooks should not have answers as that it encourages cheating in homework. It may seem that such cheating students did not appreciate the importance of homework. There is room for more checking of students’ work by teachers, in line with what they preach; that the method followed to arrive at an answer is more important than the answer itself.
When the group was split by class and gender, the percentages were as follows for the ‘textbooks should not have answers’ category: 38% for both girls and boys in Form 2, and 14% and 27% for boys and girls in Form 4. One wonders why the value for form 4 boys appears extraordinarily low in comparison to other groups. 86% of the boys wanted their mathematics textbooks to have answers. This may mean that the form 4 boys did more own practice than the
108
other groups and required answers for such practice. It could also mean that they required or received less o f the teachers marking and thus checked their own homework or did more extra practice in their study of mathematics. From the classroom observation of a few pupils’ mathematics exercise books, it would seem that Form 4 students marked their own homework often.
Day scholars’ percentage for the ‘should not have’ was higher than that of boarders (day scholars Form 2, 41.1%; Form 4, 21.5 %; boarders Form 2, 35.3%; and Form 4, 19.9%). This may be related to the students’ ability (performance) in mathematics since the test scores and K.CSE mathematics grades seem related with the boarding status (r = 0.216, N = 1633: 0.240, N = 770: both significant at the 0.01 levels).Do teachers mind whether homework is completed or not? This question aimed at finding out whether students believed that their teachers considered it important for homework to be completed. The teacher may think that he/she is strict whereas students consider him /her lenient and vice versa. Most students (83.8%, n= 1766) accepted that the teacher would mind if homework was not completed. One also notes the 16.2 % who thought their teachers did not mind. To take a closer look, the information was looked at by dividing it by class and /residential status. The figures for ‘no’ are 8.7%, 16.6%. 22.3%, 17.2% for Form 2 day, Form 2 boarders, Form 4 day, and Form 4 boarders respectively.
It is noted that the figure for Form 2 day scholars is unusually low. This may be contributed by boys since the Form 2 boys percentage (10.1 %) is lower than
109
average compared with Form 2 girls (15.3%), Form 4 girls (19.6%), and Form 4 boys (19.7 %). One notes that Form 4 boys and girls have the same percent for whether the teacher minds completion of homework, whereas Form 2 boys and girls differ. This may be either because boys in Form 2 took mathematics homework seriously more than girls did or, teachers actually were more lenient on girls who did not complete homework.
After a careful observation of the data, it was noted that the percentage of students who reported that their teacher did not mind completion was not related to their performance in mathematics. It was seen that the critical quality was whether their homework was checked. Of students who said that the teacher minds completion, 90% reported that their work was checked regularly, while only 46 % of students who thought that their teacher doesn’t mind completion had their work checked regularly. It was observed earlier that more boys than girls, and more Form 2 than Form 4 respondents reported their work as being marked regularly. This may explain why the percentages for form four saying ‘no’ is higher than Form 2’s.
The study also wanted to understand factors that motivate students to complete homework. Among the choices were ‘own personal goals’ to mean that their own personal goals motivate them regardless of the type of homework or other external persons. Among the choices given a big group (752) 43.6%) of students chose ‘own goals’, (484) 28% chose ‘love of maths’ while (198) 11.5%
110
‘type of homework’ and 12.1% (208) the ‘teacher pressure’. The data was split by gender, class, and residential status for a closer look.
Parents (though a few of them) helped pupils (especially day scholars) complete homework perhaps by encouragement or by actually offering help when students were ‘stuck’. This motivation is especially cited by more girls than boys and by more Form 2’s than Form 4’s. On teacher as a motivating factor, less Form 2 girls than boys cited this motivation. Perhaps this is consistent with the finding that more girls than boys thought that their mathematics teacher did not mind completion, or to the fact that fewer girls than boys got their work checked. The Fonm Four boarders boys show a higher percentage (15.5%, n=198) than day scholars (10.1%, n=226). This may be related to the students’ perception of anticipated teacher action and marking.
On ‘love o f mathematics' as a motivating factor to complete homework, Form 4 girls especially day scholar girls and Form 4-day scholars seem to have comparatively lower values than average. Actually Form 4 day scholar girls have the lowest value (21.5%, n=209) in the groups showing that more such girls than boys may not have cared much about mathematics. On the ‘type of homework’ motivating students to complete, there is a bigger number of day scholars than boarders. This also may have implications for the design of homework in that lower achievers complete homework when it seems within their ability. It seems there is a relationship between the KCSE grade and the
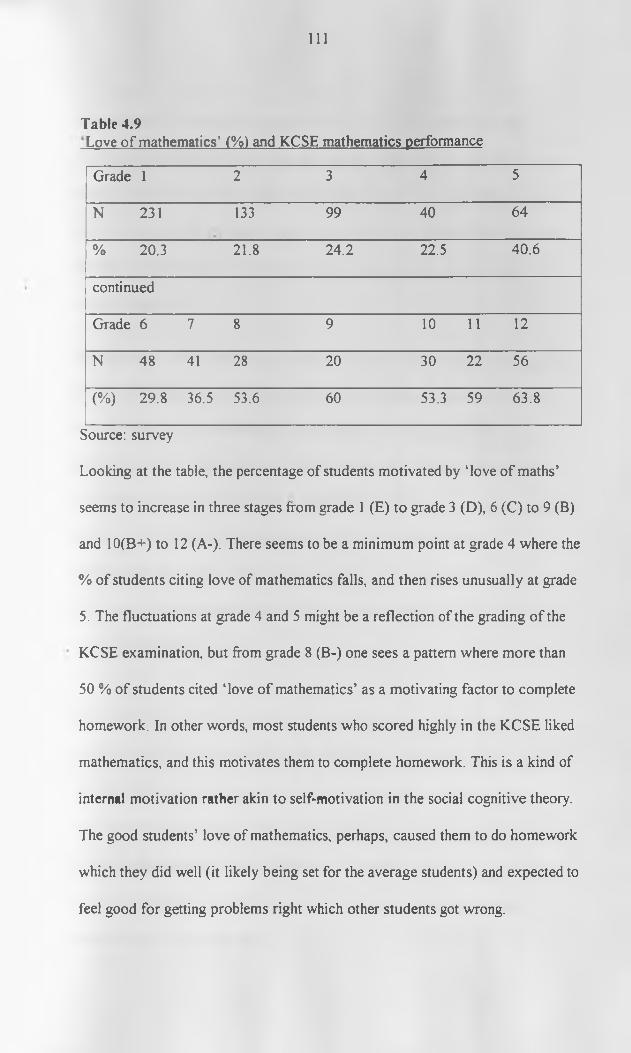
I l l
Table 4.9Love o f mathematics’ (%) and KCSE mathematics performanceGrade 1 2 3 4 5
N 231 133 99 40 64
% 20.3 21.8 24.2 22.5 40.6
continuedGrade 6 7 8 9 10 11 12N 48 41 28 20 30 22 56
(%) 29.8 36.5 53.6 60 53.3 59 63.8Source: surveyLooking at the table, the percentage of students motivated by ‘love of maths’seems to increase in three stages from grade 1 (E) to grade 3 (D), 6 (C) to 9 (B) and 10(B+) to 12 (A-). There seems to be a minimum point at grade 4 where the % of students citing love of mathematics falls, and then rises unusually at grade5. The fluctuations at grade 4 and 5 might be a reflection of the grading of the KCSE examination, but from grade 8 (B-) one sees a pattern where more than 50 % of students cited iove of mathematics’ as a motivating factor to complete homework. In other words, most students who scored highly in the KCSE liked mathematics, and this motivates them to complete homework. This is a kind of internal motivation rather akin to self-motivation in the social cognitive theory. The good students’ love of mathematics, perhaps, caused them to do homework which they did well (it likely being set for the average students) and expected to feel good for getting problems right which other students got wrong.
112
On own goals, values for day scholar boys, Form 2 boys and Form 2 day scholars were unusually lower than the average, especially Form 2 day scholar boys (34.7%, n= 202). This might indicate that Form 2 boy day scholars might not be so clear about their goal, aspirations in life. One wonders why this is so, but this question cannot be resolved by this study and may require other research attention.
One measure of how students are in daily mathematics including mathematics is to ask their teachers. Another, even better way is to ask the student how good they feel they are in mathematics, because that may summarise their experiences with mathematics, with self concept, and teachers expectations. It was thought that students used the homework they did every day, and the marks they got in class tests to form an opinion of how good they were in mathematics. To ask the students how good they are in mathematics was to ask them to say how successful they find themselves in mathematics homework and in other mathematics activities.
About half (57 %) of the students rated themselves average, 20.6% as poor, 16.6% as good, and 5.6% as very good. If the ‘very good’ are added to ‘good’, we have a bigger ‘good’ group with 22.2% of the students, which compares well with the 21% for ‘poor’. From table 4.10 below, we note that Form 2 boys have the highest percentage for ‘average’, and that the total for boys’ ‘average’ and ‘good’ is higher than that of the for girls. More girls than boys rated themselves poor in mathematics.
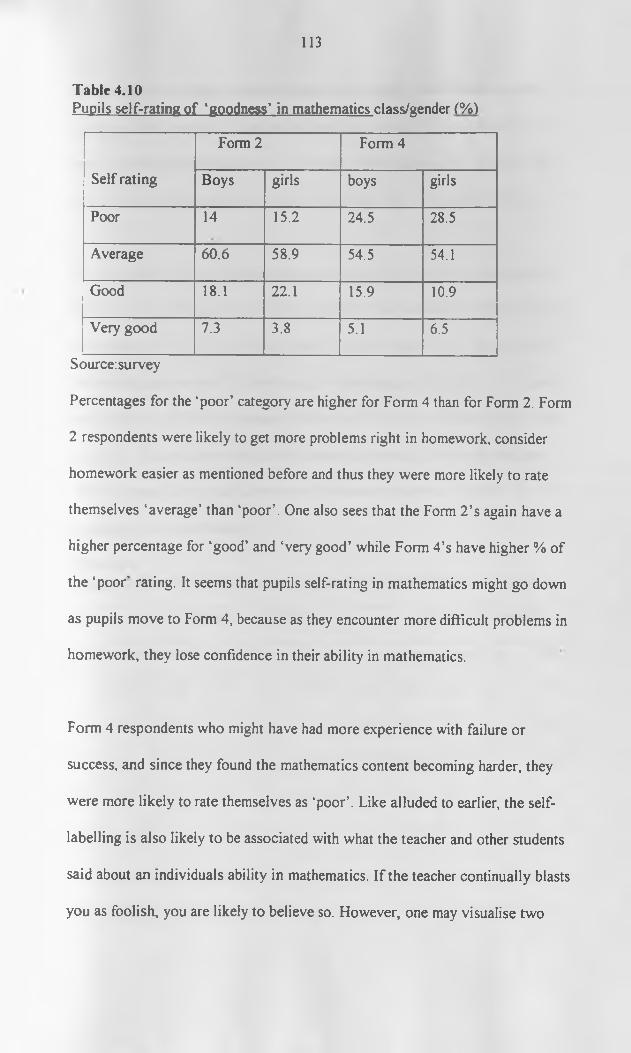
113
Table 4.10Pupils self-rating of ‘goodness’ in mathematics class/gender (%)
Form 2 Form 4Self rating Boys girls boys girlsPoor 14 15.2 24.5 28.5Average 60.6 58.9 54.5 54.1Good 18.1 22.1 15.9 10.9Very good 7.3 3.8 5.1 6.5
Source:surveyPercentages for the ‘poor’ category are higher for Form 4 than for Form 2. Form 2 respondents were likely to get more problems right in homework, consider homework easier as mentioned before and thus they were more likely to rate themselves ‘average’ than ‘poor’. One also sees that the Form 2’s again have a higher percentage for ‘good’ and ‘very good’ while Form 4’s have higher % of the ‘poor' rating. It seems that pupils self-rating in mathematics might go down as pupils move to Form 4, because as they encounter more difficult problems in homework, they lose confidence in their ability in mathematics.
Form 4 respondents who might have had more experience with failure or success, and since they found the mathematics content becoming harder, they were more likely to rate themselves as ‘poor’. Like alluded to earlier, the self- labelling is also likely to be associated with what the teacher and other students said about an individuals ability in mathematics. If the teacher continually blasts you as foolish, you are likely to believe so. However, one may visualise two
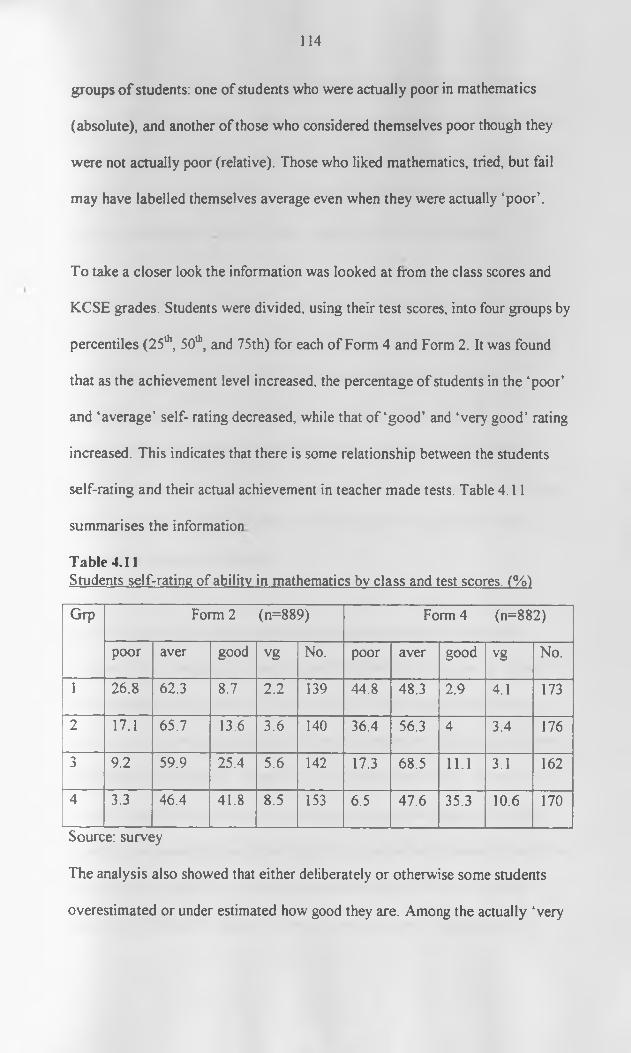
114
groups o f students: one of students who were actually poor in mathematics (absolute), and another of those who considered themselves poor though they were not actually poor (relative). Those who liked mathematics, tried, but fail may have labelled themselves average even when they were actually ‘poor’.
To take a closer look the information was looked at from the class scores and KCSE grades. Students were divided, using their test scores, into four groups by percentiles (25th, 50th, and 75th) for each of Form 4 and Form 2. It was found that as the achievement level increased, the percentage of students in the ‘poor’ and ‘average’ self- rating decreased, while that o f ‘good’ and ‘very good’ rating increased. This indicates that there is some relationship between the students self-rating and their actual achievement in teacher made tests. Table 4.11 summarises the information Table 4.11Students self-rating of ability in mathematics bv class and test scores. (%)Grp Form 2 (n=889) Form 4 (n=882)
poor aver good vg No. poor aver good vg No.1 26.8 62.3 8.7 2.2 139 44.8 48.3 2.9 4.1 1732 17.1 65.7 13.6 3.6 140 36.4 56.3 4 3.4 1763 9.2 59.9 25.4 5.6 142 17.3 68.5 11.1 3.1 1624 3.3 46.4 41.8 8.5 153 6.5 47.6 35.3 10.6 170Source: surveyThe analysis also showed that either deliberately or otherwise some students overestimated or under estimated how good they are. Among the actually ‘very
115
good’ students there was a number of students who described themselves as ‘poor’ and ‘average’ (about 10%), and among those actually poor (from the test scores), there was a number (about 10%) of students who described themselves as ‘good’ and ‘very good’. Some ‘very good’ students had a tendency to underrate themselves while the ‘poor’ tended to over-rate themselves.
But why would this be? It may seem that poor students shied away from the ‘poor’ tag while the good students knew how much they still had to learn thus underestimating their ability. Or is it that the students had not had the opportunity to learn to form realistic assessments of their ability in mathematics? Sifuna (1989:277) found similar reactions when he asked teachers to rate themselves. He reported a tendency for the academically lower teachers to overate (high) themselves while the better teachers underrated themselves (weak and average).
At least from their complaints about discouraging remarks in homework, students did not feel happy when the teacher labelled them ‘poor’ or ‘weak’ in their homework. The undesirability o f ‘weak’, ‘poor’ comments is discussed elsewhere. Another interesting thing is that for some few students two answers were given, for example, ‘sometimes poor sometimes average’ showing that perhaps the self rating may not be very stable and might depend on feedback pupils get in homework, and class work. It was noted that in some few schools the correlation between self-rating and achievement was low. A possible explanation is that self-rating o f how good students are in mathematics is
116
malleable and could be shaped by the teacher for good or for worse. If this were true, it may have implications on how teachers award marks in mathematics, comments they make arising from students performance of homework or the difficulty level of the homework and tests they set for students.
Students self rating is significantly related to their test scores (r = 0.39, N=1632, sigf= 0.000) and to KCSE performance (r = 0.419, N = 838, sigf= 0.000). An improved self concept (self rating) especially in daily in mathematics might lead to better performance but this cannot be said conclusively from the data in this study.
Generally, about half o f the students spent up to one hour on mathematics homework assigned in the day. The higher the percentage of time up to one hour spent in homework, the lower the percentage o f time spent beyond one hour. Form 2 boarders have the highest percentage on time spent up to one hour (62%) meaning that many of them took a relatively short time to complete homework. More than a half of the Form 4-day scholars (57%) took more than an hour on homework. The proportion of Form 4 who took two hours on homework is bigger than for form 2’s, while the proportion of Form 2’s who took about 30 minutes to complete homework is higher than that of Form 4’s. Perhaps this is because students were given more homework in Form 4 than in Form 2, or because the homework assigned became increasingly harder.
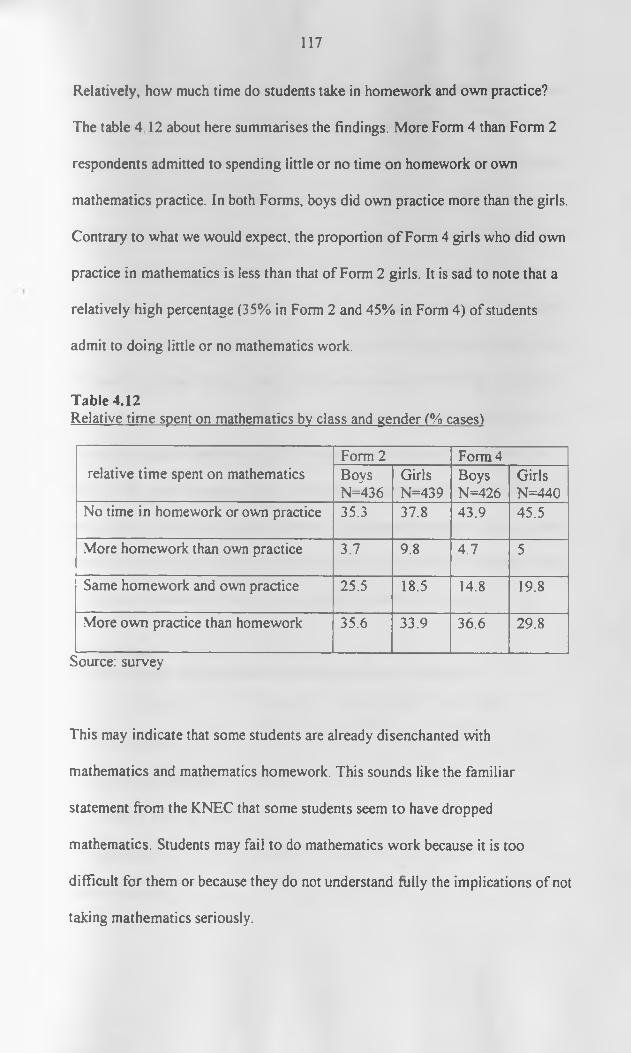
117
Relatively, how much time do students take in homework and own practice? The table 4 12 about here summarises the findings. More Form 4 than Form 2 respondents admitted to spending little or no time on homework or own mathematics practice. In both Forms, boys did own practice more than the girls. Contrary to what we would expect, the proportion o f Form 4 girls who did own practice in mathematics is less than that of Form 2 girls. It is sad to note that a relatively high percentage (35% in Form 2 and 45% in Form 4) of students admit to doing little or no mathematics work.
Table 4.12Relative time spent on mathematics by class and gender (% cases!
relative time spent on mathematicsForm 2 Form 4BoysN=436
GirlsN=439
BoysN=426
GirlsN=440
No time in homework or own practice 35.3 37.8 43.9 45.5More homework than own practice 3.7 9.8 4.7 5Same homework and own practice 25.5 18.5 14.8 19.8More own practice than homework 35.6 33.9 36.6 29.8
Source: survey
This may indicate that some students are already disenchanted with mathematics and mathematics homework. This sounds like the familiar statement from the KNEC that some students seem to have dropped mathematics. Students may fail to do mathematics work because it is too difficult for them or because they do not understand fully the implications of not taking mathematics seriously.
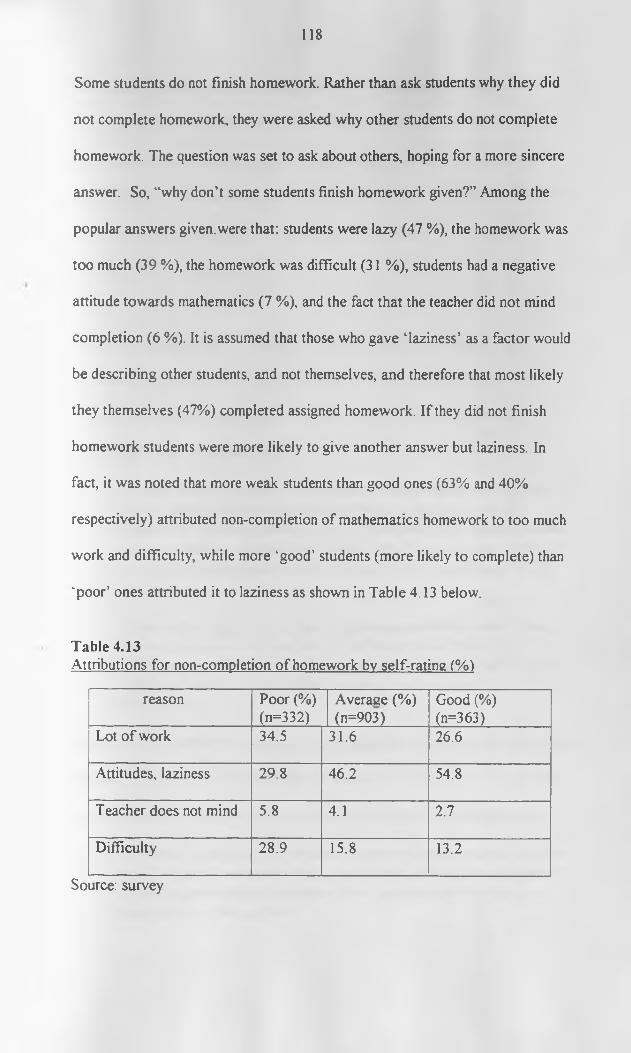
118
Some students do not finish homework. Rather than ask students why they did not complete homework, they were asked why other students do not complete homework. The question was set to ask about others, hoping for a more sincere answer. So, “why don’t some students finish homework given?” Among the popular answers given.were that: students were lazy (47 %), the homework was too much (39 %), the homework was difficult (31 %), students had a negative attitude towards mathematics (7 %), and the fact that the teacher did not mind completion (6 %). It is assumed that those who gave ‘laziness’ as a factor would be describing other students, and not themselves, and therefore that most likely they themselves (47%) completed assigned homework. If they did not finish homework students were more likely to give another answer but laziness. In fact, it was noted that more weak students than good ones (63% and 40% respectively) attributed non-completion of mathematics homework to too much work and difficulty, while more ‘good’ students (more likely to complete) than ‘poor’ ones attributed it to laziness as shown in Table 4.13 below.
Table 4.13Attributions for non-completion of homework by self-rating (%)
reason Poor (%) (n=332)
Averaee (%) (n=903)
Good(%) (n=363)
Lot o f work 34.5 31.6 26.6Attitudes, laziness 29.8 46.2 54.8Teacher does not mind 5.8 4.1 2.7Difficulty 28.9 15.8 13.2
Source: survey
119
We should, however, note that altogether 70% of the students thought that homework difficulty and homework amount are reasons for non-completion of mathematics homework assigned. The reasons given seem to depend on the residential status and the class o f the students, but not on the gender, (residence: X2 = 23.289,df 5, Cramer’s V =0.121, sigf. 0.000 / class: Z2 = 31.566, df 5 , Cramers V= 0.14, sigf. 0.000)
From other comments by the students it is clear that in many classes, theamount o f homework was considered rather too much or on the higher side.Comments about the quantity o f homework were very frequent with thefollowing two as typical examples.
G ive us about / problems /hocjo like we are given] so chat you can finish quickly, practise and reread what you did. A lso a lot o f homework in maths consumes a lo t o f tim e and discourages students who are unable to do hence they copy from friends or guess (cook'] so as to avoid bad comments from our teacher and punishm ent"(G irl, So: 4-2)
"Versonally, l don't chink that a lo t o f homework helps much since you m ay be given a lot, y e t you d id not understand thus it m ay even discourage you. Therefore a little homework perfectly done and lots o f personal practice is w hat helps students to pass m aths" lboy, 42:2-8/
Students also complained of being given mathematics homework for which theyfelt they are not ready. Unfortunately the teacher in giving homework believesthat students have understood. The following comments illustrate the point:
(i) there is no need o f giving maths homework yet the teacher doesn't teach. M achs homework should not be given for the sake o f giving. It should be given for the purpose either to understand the topic or to practise on it. (boy,49:2-18)
120
(ii)Teachers should stop assuming that we are supposed to know everything since we are in Form 4 (girl, 50:4 -3 )
(iii(Mathematics homework is terrible unless one is sure of what he is doing. We actually need proper explanations from our teachers. M ost important, students should be encouraged even if they fail (boy, 4 9 :4 -6 )
Some students preferred that teachers ensure that they understood before being assigned homework. The ‘explanation’ method of teaching observed in many sample schools seemed to take a lot of lesson time leaving students with little or no practice in learnt skills before being assigned homework
Some smaller group (106 students) saw non-completion of homework as related to whether the teacher minded or not. Teachers who were perceived as not minding completion were likely to just assign homework and continue in the next lesson as if it had not been assigned, without checking if it was done or not. Students who took time to complete assigned homework complained that they were discouraged by such a situation. Additionally teachers may also need to take time to understand why students do not complete homework. Some students reported that they were not able to complete homework because they did not have facilities e.g. proper room, study lamp/kerosene, or there were other domestic problems at home, interruptions by teachers during prep or even homework from other teachers. The teacher who considers student difficulties when assigning homework is more likely to encourage students towards ownership o f homework (Spadano, 1996).
Students were asked to explain what their teacher does when they don’t
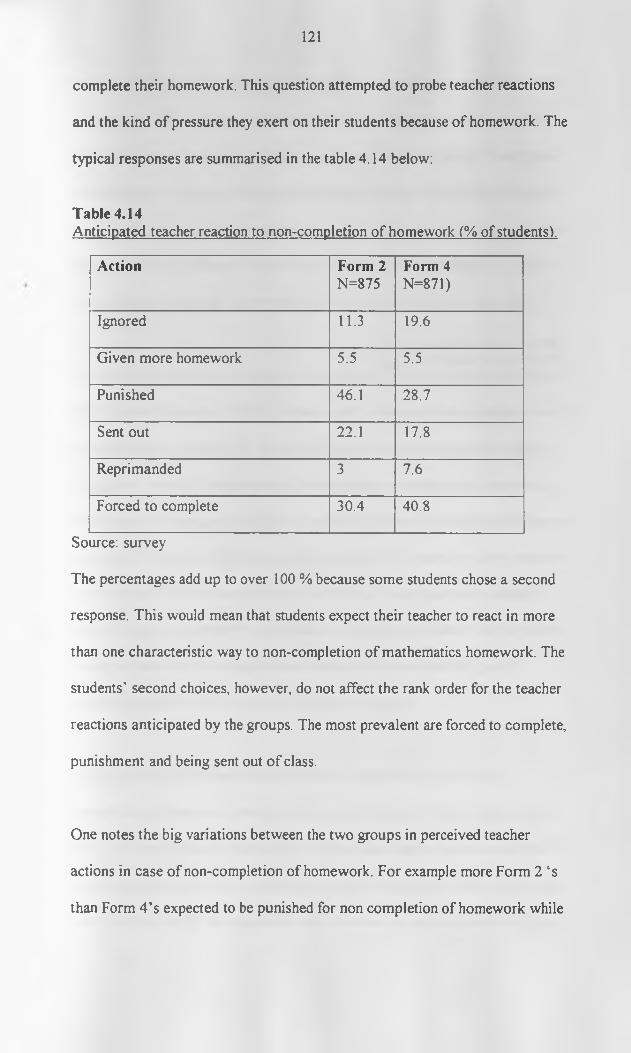
121
complete their homework. This question attempted to probe teacher reactions and the kind of pressure they exert on their students because of homework. The typical responses are summarised in the table 4.14 below:
Table 4.14Anticipated teacher reaction to non-completion o f homework (% of students).
Action Form 2 Form 4N=875 N=871)
Ignored 11.3 19.6Given more homework 5.5 5.5Punished 46.1 28.7Sent out 22 .1 17.8Reprimanded 3 7.6Forced to complete 30.4 40.8
Source: surveyThe percentages add up to over 100 % because some students chose a second response. This would mean that students expect their teacher to react in more than one characteristic way to non-completion of mathematics homework. The students’ second choices, however, do not affect the rank order for the teacher reactions anticipated by the groups. The most prevalent are forced to complete, punishment and being sent out of class.
One notes the big variations between the two groups in perceived teacher actions in case of non-completion of homework. For example more Form 2 ‘s than Form 4 ’s expected to be punished for non completion of homework while
122
more Form 4 ’s expected the teacher to ignore non completion or to force them to complete. The ‘forced to complete homework’ was explained to mean that the teacher asked students to take time in the mathematics lesson to complete the homework. In some cases the mathematics teacher would go back to relax in the staff room as ‘rogue’ students completed the homework. In some schools the researcher was offered to administer the research questionnaire in a class whose students were left unattended because they “had homework to do”.
U N IV E R S IT Y OF NA IROB IEAST AFRICANA COLLECTIONAlmost a fifth of students expected to be sent out o f class for non-completion of
mathematics homework. From the researcher’s observation such students would be asked to get out and kneel, sit on the dusty floor, stand outside the class or just get out of sight! Students would be required to complete the homework while outside or just get out. We may suspect some such students just hid away some other favourite book to read while outside. While some students expected to be sent out for non- completion of homework, some students expected the teacher to ignore. Actually it was observed in some two classes that the teacher tended to tone down on completion of homework when specific (good?) students explained that they were not able to complete.
Sending pupils out seemed to be a common way of dealing with noncompletion of homework, being mentioned in 35 (about 70%) schools in the study. From classroom observation it seemed that there were some students who were more likely to be sent out than others. The mathematics teacher was more likely to ask for an explanation why homework was not completed from
123
the better students while punishing or sending out the weaker students. More students were sent out in some schools, especially in S12, S15, S28, S34, S35 and S50. The researcher heard that the principals in such schools were usually aware of such methods but were reluctant to interfere in ‘trained’ teachers’ ways of dealing with errant students, so as not to be accused o f ‘undermining discipline in the school’. Two principals who taught mathematics were themselves observed to send students for non-completion of homework. Griffin (1996) from his experience in Starehe Boys Centre says sending out students is counterproductive.
Whether students are punished in class, sent out o f class, or forced to complete homework immediately in class, a lot of time may be spent on the administration (assigning, checking, and dealing with non-completion, review) o f homework rather than on learning mathematics. These actions may not be very beneficial to the student who is failing in mathematics.
Students were also asked to state what facilities restricted their doing of homework well. The most common answers are listed in Table 4.15 about here. Some 397 students gave a second answer and these have been included in the calculations. One sees that books (reference and text) are among the factors that hindered proper performance of mathematics homework. Compared to boarders, day scholars appear disadvantaged on textbooks, lighting (as basic as a lamp and kerosene), writing materials and room. Books still are a major
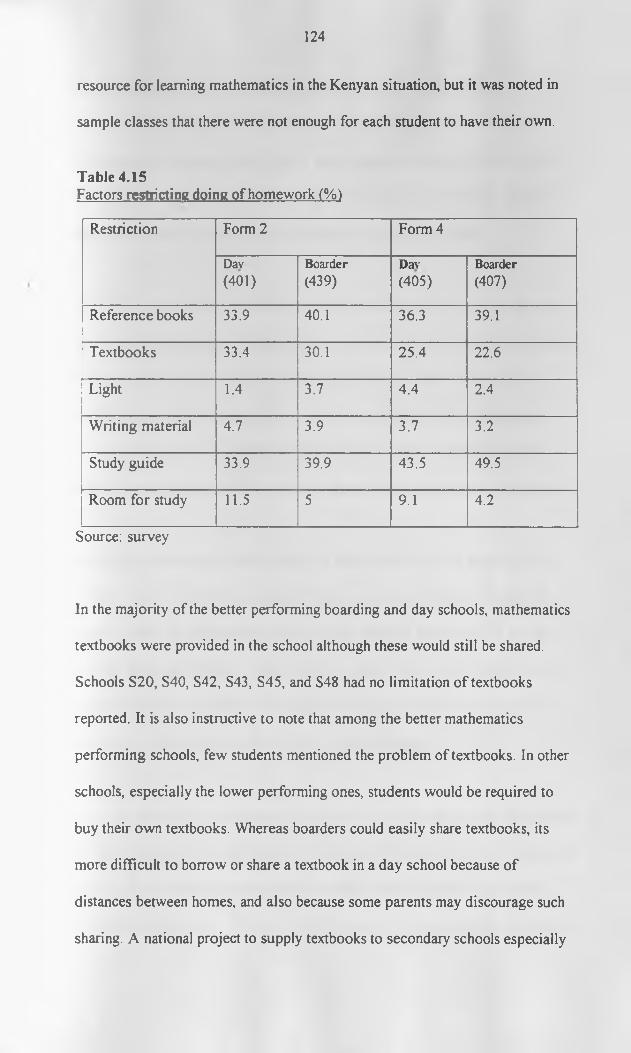
124
resource for learning mathematics in the Kenyan situation, but it was noted in sample classes that there were not enough for each student to have their own.
Table 4.15Factors restricting doing of homework (%)
Restriction Form 2 Form 4Dav(401)
Boarder(439)
Dav(405)
Boarder(407)
Reference books 33.9 40.1 36.3 39.1Textbooks 33.4 30.1 25.4 2 2 .6
Light 1.4 3.7 4.4 2.4Writing material 4.7 3.9 3.7 3.2Study guide 33.9 39.9 43.5 49.5Room for study 11.5 5 9.1 4.2
Source: survey
In the majority of the better performing boarding and day schools, mathematics textbooks were provided in the school although these would still be shared. Schools S20, S40, S42, S43, S45, and S48 had no limitation of textbooks reported. It is also instructive to note that among the better mathematics performing schools, few students mentioned the problem of textbooks. In other schools, especially the lower performing ones, students would be required to buy their own textbooks. Whereas boarders could easily share textbooks, its more difficult to borrow or share a textbook in a day school because of distances between homes, and also because some parents may discourage such sharing. A national project to supply textbooks to secondary schools especially
125
in day schools, (c.f. Republic o f Kenya, 2001: 136 notes poor students disadvantage who cannot afford to pay for books.) might help. The lower percentage for textbooks and a higher percentage for reference books noted in the table 4.14 above may describe the general situation that boarding schools had a better capital base that could be used to purchase textbooks.
One other observation is that Form 4 students seemed to have more books than the Form 2 students did. Whether this was deliberate or not is clear. Parents and school administrators are likely to be more generous with the more mature students because the students can demand them or deserve the textbooks for revision. More Form 4’s than Form 2’s seemed satisfied with the textbooks with a lower percentage (only a quarter) mentioning textbooks as a limitation.
The study guide was also mentioned by a big number (587) of students. The Form 4 ‘s have a higher percentage for this response perhaps in line with the finding earlier that they find homework more difficult than Form 2’s. It was perhaps not clear whether a human guide or a book guide was required, but the response served to indicate that students encounter problems in mathematics homework, which could be alleviated by study guidance.
Note that although the percentages for lighting as a problem are low, the figures for day scholars are double those of the boarders. Boarders may have mentioned lighting as a problem because around the time of the study there was power rationing in the country. The problem of lighting is likely to be more serious in
126
the rural areas where the lamp may be lacking or even kerosene to run the lamp during homework.
The number of students that cited room as a restriction was sizeable (122) and the teacher might put this into consideration in assigning homework especially in day schools. Students who cite room as a problem are divided about equally between boys and girls (56/66). One would guess that girls in Kenya are particularly disadvantaged in that they do not have own huts like boys in rural areas do. But perhaps they do not consider that a problem. Some parents may deal with this problem by taking their daughters to boarding school.
Students who reported that their homework was checked regularly were 84.6 % (n=1742) while 15.4% (268) o f students reported that their homework was never marked. This would be a satisfactory state o f affairs if some students meant exactly that. However, from other observation and students other comments, it seems that the students included checking the homework themselves as a form of checking homework. Students complained that they often marked their own homework. They may have done this from answers provided at the back of a textbook, or from answers provided by the mathematics teacher in a subsequent mathematics lesson.
More boys reported their work as marked regularly (87%) compared to 82 % of girls. Similarly more Form 2 respondents (87.9%) than Form 4 ones (81.5%) reported their work was marked regularly. Some students complained o f their
127
books not being marked by teachers who seemed to favour some students as the following comment would suggest:
Teachers should mark allche books w ithout discrimination and have good attitude towards a ll students"lform 4 girl, 38.4 .4!
Students were asked what teachers’ marking methods they found useful. Moststudents (about 60%) preferred that in marking homework, teachers’ commentsbe included with the marks or grades. Other categories that seemed to attractsome students were just ticks and wrongs (about 15%), a simple markingmethod. The categories o f ‘marks only’, ‘general comments in class’, and‘grades only’ attracted less than 10% each. This indicates the importanceattached to teacher feedback by the students. However, teachers are able toprovide valuable comments only when they carefully check the student’shomework.
Incidentally, when pupils were asked what would discourage them most in homework, most responses were centered on comments that originate from homework marking. Of the 1112 students (62.4% o f student respondents) who answered this question, 69.1% of them said they were discouraged by the teacher comments they got. 25.5% said they did not get discouraging comments while 5.1% said whatever comments teachers gave were for their own (students’) good. If we allow for student fear, we may suspect that those who were unwilling to answer the question were likely to lean towards the discouraged group. Incidentally, this was an open-ended question, so the responses were reflective of the students’ strong feelings.
128
O f those who said something discouraged them in homework, about three- quarters said the remark ‘poor’ or ‘weak’ on their homework discouraged them. The students explained their discouragement from the ‘poor’ and ‘weak’ related comments using different words as shown by the sample comments below. The comment ‘Poor’, ‘weak’, with or without an adjective was considered most discouraging because:• I t makes me feel depressed because it seems che ceacher does noc
appreciate what l have done.• I t makes me feel chat l can't do anything and it also undermines your
dignity.• I t makes a student worry and hate mathematics.• I t discourages me from doing mathematics revision.• I t makes me look inferior.• l lose the morale to do mathematics.• I t makes me feel inferior and discouraged.• You lose the heart o f working on because even i f you work hard you are
going to g e t the same comment, so one sits back.• It show s that you have no chance o f improving, better use 'below average'• I t doesn 't encourage one to work hard.• I t makes me lose hope in mathematics.• I t makes me feel ashamed to show someone m y book hence l cannot be
helped.• I t makes me feel discouraged and neglected b y the teacher.• I t makes you lose hope because may be you had struggled very hard to
finish.• B etter write 'trial' even i f the student gets nothing to encourage them to
try neatt time.• O ne feels despised in class and shows you th a t you can never pass.• I t show s that the teacher does not appreciate your effort since you m ay
have tried your level best.
Several students in each school made comments about being discouraged by the comment ‘poor’/ ‘weak'. Looking at the reactions o f students to such a comment on their homework, it seems that mathematics teachers would rather
129
avoid such discouraging phrases, whatever their intentions. It affects the students’ self-concept and their will power to continue trying to learn mathematics.
One also notes that there was some mismatch between the teachers’ and students’ perceptions on the evaluation of homework. Students seemed to expect the teacher to appreciate the effort expended, for example the time spent on the homework or the ‘hard thinking’ put in. Teachers, on the other hand, seemed to ignore the effort expended, judge the product, say, how many problems the student got right, and to expect students to understand that accuracy was the ultimate measure of good work.
Incidentally, 14% of the respondents to this question said they were discouraged by the way the homework was marked or not marked. From the comments, it was observed that some teachers just asked students to mark their own work, or when they marked, students did not get adequate feedback on where they went wrong.
Students also mentioned that some teachers discouraged them through comments made in class after homework. Such comments were: ‘you need prayers’; ‘the problems were self explanatory’; ‘wake up’; ‘you won’t escape an E ’; ‘no matter how hard you try you will still fail’; ‘you cannot make it’; ‘you ;will surely fail’; ‘use your common sense’; ‘the best [students] will remain the
130
best’; while the rest will remain where they are’; ‘you better leave school’; ‘think or sink’; ‘you came to learn, not to be spoon-fed’.
Perhaps, the teachers used such comments in a bid to prod the class on, to work harder towards success, but those comments were not well received by students, and certainly they are not kind. Some other discouraging comments reported by student such as ‘silly’, ‘stupid’, ‘foolish’, ‘lazy’, ‘hopeless’, ‘cow’, and ‘goat’ sound a bit peculiar. The comments might be an indication of the teacher’s frustration in teaching students who did not seem to grasp the ‘basic’ concepts quickly, but surely such comments could not help students build positive attitudes towards mathematics. Luckily, reports o f the abusive comments were not common, being concentrated in some few low performing schools. It seems also that the negative comments were characteristics of some individual mathematics teachers.A few students’ reactions to such a situation are mentioned here as examples
Teachers should scop discouraging and abusing students sim ply because they are weak. [ boy, 28:4-8 ].
I chink students attitude towards m athematics should be made positive by encouraging them where they fee l they are failures and guiding them. They should not undermine or te ll students th a t they cannot make it as this makes one panic and g e t confused [Girl, 29 :4 - 8).
Teachers should not discourage students by writing too many comments in the [exercise/ books (Boy, 4 :4 -19).
Teachers should not discourage students who perform poorly in mathematics homework because they always try their level best and the more they discourage them the more th ey hate the subject and the
131
teacher such that even they cannot concentrate while the teacher is teaching". (Girl, 38-4 -9 )
Methods that students preferred to be used in marking their homework, are summarised in the table 4.16 about here. Generally, students regardless o f their gender, class and boarding status seemed to place the methods in the following order of merit: (i) teacher commenting on difficult problems asked in class, (ii) the teacher marks each students work, (iii) exchanging books as students mark,(iv) students marking their own homework, and finally [and only a few students], (vi) students marking their own work from the textbook.
U N IV E R S IT Y OP NA IROB I EAST AFRICANA COLLECTIOMThe interesting thing is that more (about 70% for first choice and second
choice) pupils than in other categories preferred the teacher to solve difficult problems on the board to marking their books individually.
One would expect that most students would prefer that their homework be marked individually than listen to a revision in class. One explanation is that the weaker students might have preferred to have their work unmarked to getting discouraging personal comments. In fact, only in the students who rated themselves good was the percentage in the first choice for ‘marking by teacher’ higher than for ‘comment on difficult problems’. Students who cheated on homework would also like it better that their exercise books were not perused through by the teacher. But perhaps commenting on difficult mathematics problems in class was the practical compromise that had been found to work bymost teachers.
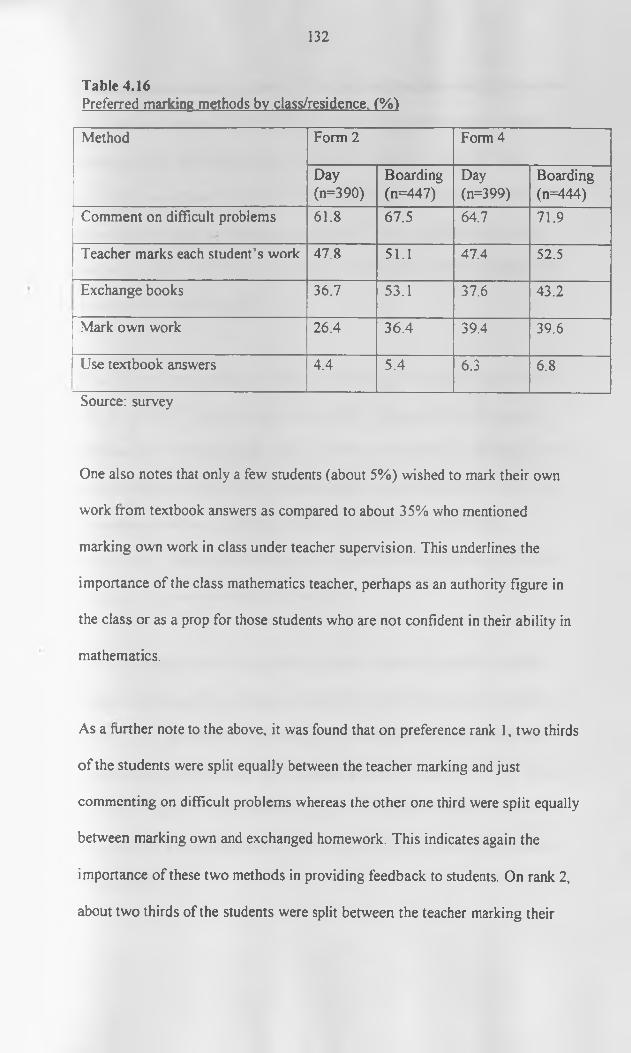
132
Table 4.16Preferred marking methods by class/residence. (%)Method Form 2 Form 4
Day(n=390)
Boarding(n=447)
Day(n=399)
Boarding(n=444)
Comment on difficult problems 61.8 67.5 64.7 71.9Teacher marks each student’s work 47.8 51.1 47.4 52.5Exchange books 36.7 53.1 37.6 43.2Mark own work 26.4 36.4 39.4 39.6Use textbook answers 4.4 5.4 6.3 6 .8
Source: survey
One also notes that only a few students (about 5%) wished to mark their own work from textbook answers as compared to about 35% who mentioned marking own work in class under teacher supervision. This underlines the importance of the class mathematics teacher, perhaps as an authority figure in the class or as a prop for those students who are not confident in their ability in mathematics.
As a further note to the above, it was found that on preference rank 1, two thirds of the students were split equally between the teacher marking and just commenting on difficult problems whereas the other one third were split equally between marking own and exchanged homework. This indicates again the importance of these two methods in providing feedback to students. On rank 2, about two thirds of the students were split between the teacher marking their
133
books, and commenting on difficult problems with the latter having about two thirds o f such students. This would mean that students who ranked teacher marking books’ first would also rank ‘teacher commenting on difficult problems’ second and vice versa. It was surprising, however to find that only about a third would rank teacher marking first. This may also indicate that teacher marking is either not expected by a majority of students, or they don't even desire for such marking.
What did students perceive to be the worst thing about homework? Generally, 49.9%, 22.4%, 7.7%, 10.1% and 4 % represent the percentage of sampled students who thought that the worst thing about homework is ‘taking too much time/ being too much work’, ‘working alone’, ‘proving oneself wrong’, ‘not rewarding the effort put’ and that there was ‘nothing wrong’ with it respectively. Almost a half o f the girls, (and consistently more than boys) felt that there was too much work in homework.
Table 4.17 summarizes the students’ responses by their class and boarding status. Percentages for working alone differ for boarders and day scholars. As one can see, the prospect of working alone was more worrisome to the day scholar than to the boarder, and consistently more for the boys than for the girls. This may support the proposition that girls were likely to work at homework and classwork more persistently than boys, especially if the amount was not discouraging.
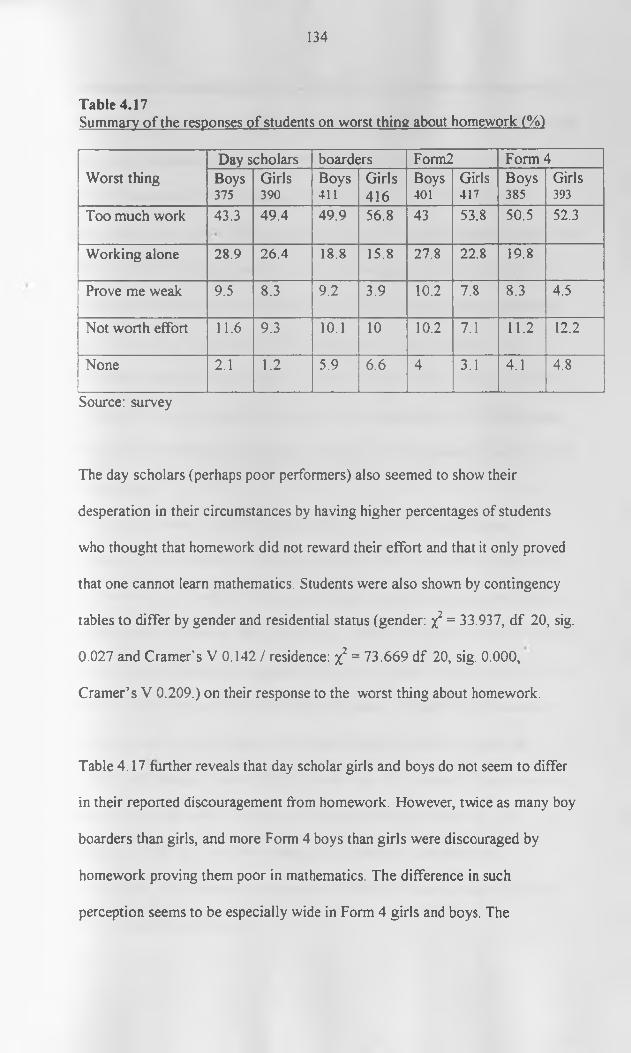
134
Table 4.17Summary o f the responses of students on worst thine about homework (%)
Worst thingDay scholars boarders Form2 Form 4
Boys375
Girls390
Boys411
Girls416
Boys401
Girls417
Boys385
Girls393
Too much work 43.3 49.4 49.9 56.8 43 53.8 50.5 52.3
Working alone 28.9 26.4 18.8 15.8 27.8 22.8 19.8Prove me weak 9.5 8.3 9.2 3.9 10.2 7.8 8.3 4.5Not worth effort 11.6 9.3 10.1 10 10.2 7.1 1 1 .2 12.2
None 2.1 1 .2 5.9 6 .6 4 3.1 4.1 4.8Source: survey
The day scholars (perhaps poor performers) also seemed to show their desperation in their circumstances by having higher percentages of students who thought that homework did not reward their effort and that it only proved that one cannot learn mathematics. Students were also shown by contingency tables to differ by gender and residential status (gender: %2 = 33.937, df 20, sig. 0.027 and Cramer’s V 0.142 / residence: x2 = 73.669 df 20, sig. 0.000, Cramer’s V 0.209.) on their response to the worst thing about homework.
Table 4.17 further reveals that day scholar girls and boys do not seem to differ in their reported discouragement from homework. However, twice as many boy boarders than girls, and more Form 4 boys than girls were discouraged by homework proving them poor in mathematics. The difference in such perception seems to be especially wide in Form 4 girls and boys. The
135
percentage for boarding girls is unusually low (3.9%) and requires explanation. Why boarding girls have a percentage about a half of that of other groups on the response that homework can prove them weak in mathematics is interesting.One also notes that the percentage (4.5%) for girls in Form 4 is rather low, being also about a half of the value for the boys. But why would more boys than girls be afraid of being proved weak in mathematics, especially in Form 4? Perhaps mathematics was viewed more as a boys’ domain so boys were more embarrassed by failure (especially the supposedly ‘better’ boarders) in homework than boys. This seems to support Costello (1991) that girls are more surprised by success since they expect to fail in mathematics. This way, when they fail in mathematics homework, girls may not be bothered by the fact as the boys would.If more boys were likely to be embarrassed by failure in mathematics homework, this was likely to encourage more boys to adopt face saving tactics such as not putting effort and mocking those who put a too serious an effort in mathematics homework. One case in point is likely to support such a view. In a closer look at the schools responses to this item, it was noted that school S7, in which teachers were really pushing their students to achieve in mathematics through daily homework and a ‘mathematics hour’, students also had the highest percentage of fear of being proved weak by homework. Parenthetically, copying does not seem to be a face saving tactic for such students. The percentages for girls and boys who copy to complete homework are comparable, so students do not copy their friends work to save face but most likely to avoid punishment.
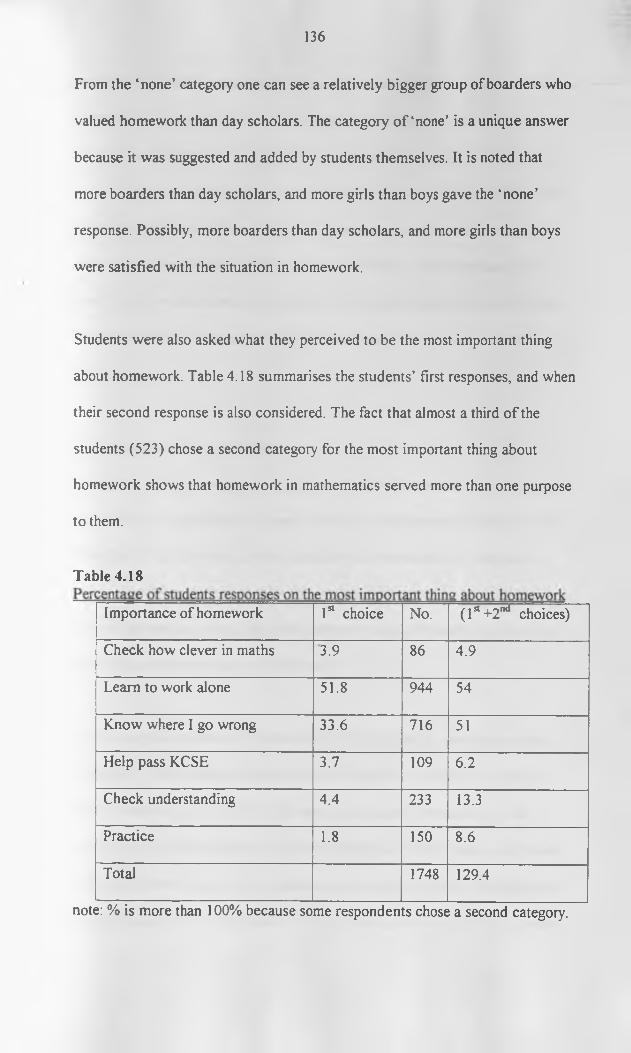
136
From the ‘none’ category one can see a relatively bigger group of boarders who valued homework than day scholars. The category o f ‘none’ is a unique answer because it was suggested and added by students themselves. It is noted that more boarders than day scholars, and more girls than boys gave the ‘none’ response. Possibly, more boarders than day scholars, and more girls than boys were satisfied with the situation in homework.
Students were also asked what they perceived to be the most important thing about homework. Table 4.18 summarises the students’ first responses, and when their second response is also considered. The fact that almost a third of the students (523) chose a second category for the most important thing about homework shows that homework in mathematics served more than one purpose to them.
Table 4.18Importance of homework 1st choice No. ( 1st +2 nd choices)Check how clever in maths 3.9 8 6 4.9Learn to work alone 51.8 944 54Know where I go wrong 33.6 716 51Help pass KCSE 3.7 109 6 .2
Check understanding 4.4 233 13.3Practice 1.8 150 8 .6
Total 1748 129.4note: % is more than 100% because some respondents chose a second category.

137
From the data in the study, the two purposes of mathematics homework students perceived to be most important were to give them opportunity in learning to work alone -independent study- (54%) and to provide students with feedback about where they went wrong (revision?) in mathematics (51%). Another 13% o f students said that the best thing about homework was that they were able to check their understanding of a topic. One notes that independent work is the most popular whether the first rank only or both ranks are considered On the whole, therefore, pupils seemed to agree that it is necessary to do homework for the reasons given.
4.4 Students’ Other commentsAmong the students sampled, 532 students (or 30%) answered an open question on any other comments they wanted to add about mathematics homework. To make that extra comment students must have felt strongly about the issues raised. A number of students, however, gave a clue as to their motivation when they added that they hoped that their comments would be useful in improving the situation in the teaching of mathematics.
In analysing the comments, the research also looked at the motivation o f the comments. The comments were considered roughly as (negative) complaints about something that should be addressed in the pupil’s situation (e g. we should be given less homework), neutral making a statement that is not related to the pupils own situation and (positive) encouraging remarks that showed the pupil was hopeful in mathematics. Among these respondents, 373 (71%) were
138
complaining of some aspect o f mathematics teaching and learning in relation to homework. From the many negative remarks about how things should be in mathematics/ homework, one suspects that all is not well. One, however, is encouraged by the 29% who gave some positive remark, expressing hope or giving some advice about how mathematics/ homework should be approached to be successful.
It was also interesting to note that the negative or positive comments were clustered around class groups. That is, students from the same class or school were more likely to have related comments. This would indicate that attitudes in mathematics were more of a group problem than individual phenomenon. To tackle negative attitudes one would, thus, have to tackle the attitude o f the group. Two HODs of mathematics in some poor performing schools lamented that it is difficult to change a class’ attitude because ‘your encouraging comments are likely to be contradicted by the bigger crowd out there in the school’. To tackle the attitude of a class towards mathematics, one may have to tackle the attitude of the school first or as well.
63% of the respondents who volunteered comments made a comment about Mathematics teaching, 16% dwelt on mathematics/homework while 12 % made comments on what students should or should not do in mathematics/homework. Some students felt, for example that mathematics as a subject should be /reduced removed from schools while some felt that it is so important that some more time should be availed for the study of mathematics. Among the 532
139
respondents 208 gave a second response and this is included in the percentages reported. The categories used are not mutually exclusive; a comment on ignoring individual differences could be categorised as an aspect of poor teaching. The comments could be lumped together to make more inclusive categories but it was thought more information would be obtained when they were segregated. The most frequent themes of the comments were:(i) That the amount of mathematics homework be reduced (22.2%),(ii) how mathematics should be taught - qualities of a mathematics teacher,
organisation of the class, preparation of students for homework, and pace of instruction. (18%),
(iii) importance of mathematics/homework and the need to take it seriously by both teachers and students(18.%),
(iv) attitudes to mathematics, - difficult/easy, boring/interesting, liking/hating (15.1%)
(v) that mathematics homework should be checked regularly and / or corrected in class, (13.3%),
(vi) that poor performers be respected and considered in mathematics homework ( 1 2 .8%),
(vii) that teachers encourage and not discourage performance in mathematics homework (8 .6 %).
(viii) that other sources other than the textbook be used for homework, (3 .8%)(ix) that teachers make themselves approachable (not harsh) and avoid
punishment for homework, (7.1%)
140
Comments on mathematics teaching dwelt mainly on the fact that teachers should take time to explain issues clearly before assigning homework, to repeat an explanation on how a solution was obtained if asked to, and to remember to match their explanation pace to their students understanding. Some few comments also talked about the need for group work in mathematics. Comments that dwelt on how mathematics should be taught, or homework organised, or about the qualities of a good mathematics teacher were placed here.
mathematics teachers should not be la zy or favour only the bright studen ts in mathematics. lnstead/ they should be more close to the weaker students to establish a good m athematics ground for them to ensure good performance in mathematics for A LL the students and not a fraction them. (G irl, 9:4-2)
The teacher should repeat a topic tirelessly when he/she finds tha t it was poorly performed in homework. The teachers should try and give encouraging comments/ like tried/ can do better, (girl/ 54:2-15)
m aths is a good subject but it depends on how your teacher is, whether he is very harsh or relaxed (approachable). I f a teacher does no t bother to look Icheck/ homework students take chat as an advantage and take m aths very lightly, (boy/ 55:4-12)
O n m y side l would sa y that some teachers think they are so / veryj intelligent for teaching students mathematics and are very pretty. They should know th a t a candle does not lose its light by lighting others, (boy/ 33:4 -14)
Comments on individual differences were mainly complaints that teachers seemed to take more time with or to favour the faster students. Some students felt that some other students’ homework is marked more often than theirs, or that the mathematics teachers seemed to trust on certain students’ ability to understand or complete homework. Comments were categorised here when they
141
mainly dwelt on differentiation of students. The following two comments serve as a example:
Teachers should understand th a t not a ll students are fast learners but som e are slow learners and therefore th ey should neither be too fa st or slow in teaching mathematics. /boy/ 43:2-13j
The teacher should a ttend each and every student book not favouring some. They should talk politely and no t in a harsh manner, i f the teacher does this to me personally l would do better in maths, (girf 36-4 -7)AAaths teachers should not favour only those who know maths e.g. selecting students who know m athem atics and putting them into a group and neglecting others. They should mark all the books without discrimination and have good attitudes towards all the students, (girl, 38:4-4
Incidentally remarks about irascibility of teachers, homework difficulty, mathematics teaching, checking homework and individual differences were found to be more likely to come from students in the lower two quartiles. More comments on the need for right attitudes to homework for success came from students in the highest quartile in achievement.
Comments about the need to encourage students, need to take homework seriously, and on the quantity of homework came from students in all quartiles. Most of the students who complained of the need for marking homework and discussing homework also reported that their homework was rarely checked. The students’ beliefs towards homework were rather surprising or they do not seem to agree with expectations. For example, 70% of students expected teachers to give them homework without consulting them. Students did not mind homework with 92% disagreeing that it is a waste of time. Good practice
142
would necessitate differentiated homework, but 81% of the students disagreed with such a view. They further would not want to repeat problems that they got wrong in homework. Only 31% of student expressed a view that they often know the purpose of homework, making one think that for a majority o f students too, homework is a necessary ritual led by the teacher, which students acquiesce to, to go through school smoothly.
Despite these observations, it should be pointed out there were a lot of variations across and within the schools that this study smoothes out in the explanations. In schools, some correlations were very high while some were very low. Some responses to items were clustered around certain points while other classes or schools clustered around other responses. For example on why students do not complete homework 20% of Form 2 students and 41% of students in Form 4 at School S39 said it was because the homework was difficult, while only 5% of Form 4 students at S34 gave the reason of difficulty. This would show that different schools and classes had different aspirations and spirit in mathematics /homework due to their circumstances. Yet to see the bigger picture of the homework situation in Kenya, one has to take some attention away from the detail o f the smaller pictures in the schools.
4.5 Teachers ‘ QuestionnaireAmong the 147 teacher respondents, 98 were male and 49 female. Their mean teaching experience was 8.7 years with a standard deviation of 6.3 years. Most of the teachers were relatively young, with 65% of the sample having a
143
maximum of eight years experience. Of the sample, 71% had a teaching experience of up to 10 years, and only 15% of them had a teaching experience of over fifteen years. One may conclude that most of the teachers in the sample were graduates of the relatively new 8-4-4 education system in Kenya. About 46% of the respondents taught one or two mathematics classes, while 54% taught three or four mathematics classes. Each class would add a maximum of seven lessons a week to a teacher’s load. Teachers with three or four mathematics classes were therefore, more likely to be teaching mathematics only Those teachers with one or two mathematics classes would have had to beef up their total teaching load with their second teaching subject. An exploration of the data using contingency tables showed that the teaching experience of the mathematics teachers was not related to teachers’ behaviour towards homework.
Most teachers (96%) reported that they assigned homework for all students to attempt at every lesson. This shows that there was no purposive homework, which was differentiated to cater for special interest groups. 90% (130) of the teachers reported that the kind of homework they gave was practice on the work that was covered in the lesson with only 6 % reporting that they asked students to read ahead. This is unlike what Bell (1978) envisaged when he said that to be useful homework should provide the student with a combination of a review of topics covered previously with current and unfamiliar topics to help students assimilate and accommodate a variety of mathematical objects into their cognitive structures. Further, such practice homework is likely only to help
144
students learn facts and skills, and conceptual structures while general strategies in problem solving, investigation work and appreciation of mathematics are largely ignored.
Most teachers (90%) reported that they themselves made the decision on how much homework was assigned. Some ten teachers also mentioned the Head of Mathematics Department and the class teacher as other persons who made decisions on the amount of homework assigned.
Asked if they planned for homework they assigned, 80% of the teachers said they did. Many of those who said that they planned for homework did not answer the next question on how they did. Among the few teachers who answered this question, most of the teachers said they planned by picking questions to be assigned. Three teachers mentioned that they planned by going through the work as in the following, “/g o through the work to be assigned in order to fin d out where the students can easily make mistakes." (Lady teacher, 25:4-27) and “selecting the questions carefully and then working them out to ascertain their difficulty lever' (male teacher, 53:3-21) and “select questions in advance fo r exercise and work out questions in advance" (male teacher, 9:1- 33). Since the teacher is almost sure to be able to do all or most of the problems in the pupils’ textbooks, some preparation in terms of actually working out the problems to be assigned might be some good practice. The manual for Jesuit high schools’ (1957) suggests that teachers quadruple the time they spend doing problems to be assigned to estimate the time that students need to do the
145
homework. Incidentally, only 11% of the teachers agreed that they should do such problems
Asked if they assigned homework during the holidays, 6 8% (112) of the teachers answered in the affirmative. Only 22% o f the Mathematics teachers did not assign homework in the holidays. However, like the regular homework during school term, teachers rarely checked it or used it any further for instruction. The main purpose of such homework seemed to help keep students busy during school holidays.
On the source of homework. 91% of the teachers reported that they got the homework from the mathematics class text, while 52% also (2nd choice) reported that they also got homework from past examination papers. The most common textbooks used by most teachers were the Form course book by the Kenya Institute of Education, and Mathematics for Kenya secondary Schools by Patel. A study of the exercises found at the end o f topics (and this is what was assigned) show that they are questions summarising the content of the topic testing the students mainly at the comprehension and application levels of Bloom’s (1965) taxonomy. The questions seem to be modelled after the KCSE examination. There are no practical questions or further research questions in the books. It is possible that such teachers mentioning past papers as a source of homework had a Form 4 class. The teacher would probably teach a topic in class and pick some related questions from the past paper(s) and assign as homework. This may also serve to indicate how exam oriented our secondary
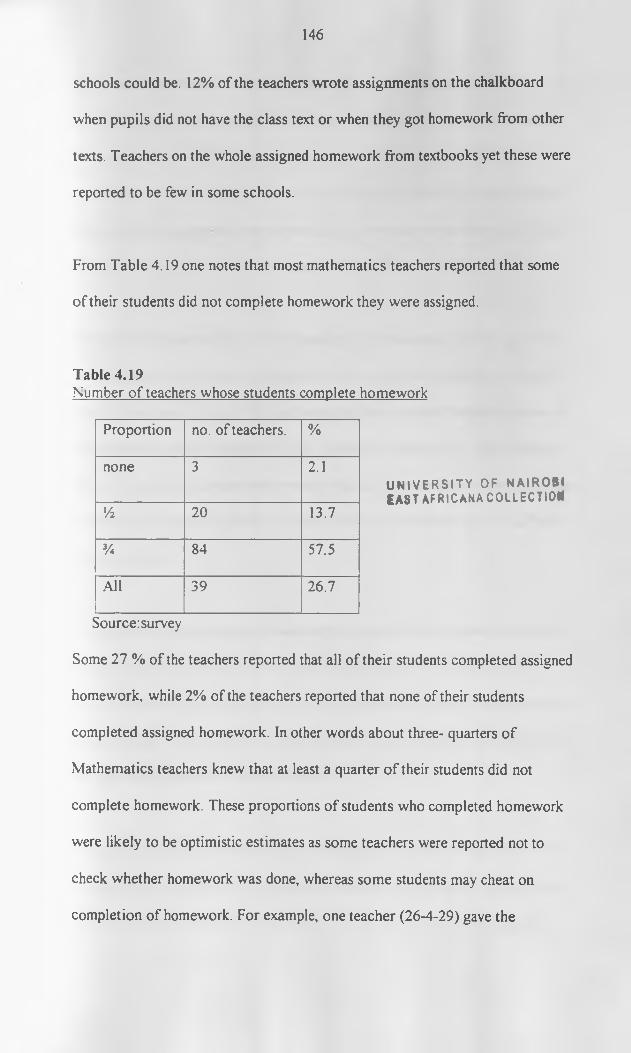
146
schools could be. 12% of the teachers wrote assignments on the chalkboard when pupils did not have the class text or when they got homework from other texts. Teachers on the whole assigned homework from textbooks yet these were reported to be few in some schools.
From Table 4.19 one notes that most mathematics teachers reported that some of their students did not complete homework they were assigned.
Table 4.19Number of teachers whose students complete homework
U N IV E R S IT Y OF NA IROB I EAST AFRICANA COLLECTIOB
Source: surveySome 27 % of the teachers reported that all of their students completed assigned homework, while 2% of the teachers reported that none of their students completed assigned homework. In other words about three- quarters o f Mathematics teachers knew that at least a quarter o f their students did not complete homework. These proportions of students who completed homework were likely to be optimistic estimates as some teachers were reported not to check whether homework was done, whereas some students may cheat on completion of homework. For example, one teacher (26-4-29) gave the
Proportion no. of teachers. %none 3 2.1
% 2 0 13.7% 84 57.5All 39 26.7
147
proportion of students who completed his homework as three-quarters but complained in another section that less than a half hand in work to be marked when he wanted to. Still, one may be concerned with the group that did not complete homework. When we say 14% of teachers (20 teachers) reported that half of their students complete homework, then we are saying that at least eight hundred (40 x 20) students in the schools visited do not complete homework.
Incidentally, when the data was grouped by sex o f students (as boys, girls and mixed) in the school taught, it was noticed that eighteen mathematics teachers (36%) from boys’ schools reported that all of their students finished homework (mixed schools had 10 teachers (21%). Looked at another way, only 4 teachers (8%) in boys schools reported that up to a half o f their students did not complete homework, compared with six teachers (13%) in girls schools and 13 (27%) in mixed schools.
Thus the order of percentage students who completed mathematics homework assigned seems to be boys’ school, girls’ schools and mixed schools in that order. Since many of the mixed schools had students who are relatively weaker academically, we may guess that the completion o f homework was related to the perceived difficulty of the homework.
On holiday homework, five teachers (10%) in boys’ schools assigned none as compared to 17 teachers (35%) in mixed schools. In other words, mathematics teachers in boys’ schools were more likely to assign homework during the
148
holidays, followed by teachers in girls’ schools and finally by teachers in mixed schools. This may be because mathematics teachers in mixed schools less expected their students to do such homework.
To clarify this, teachers were asked to judge generally how good their students were in mathematics on a scale of 1 to 4 in ascending order, (explained to be associated with grades E/D, C, B. and A. Generally, 67% of the mathematics teachers believed their students to be poor. Responses from teachers in boys’ schools were concentrated around grade C and B (37% and 47% = 84%), girls schools around E/D, C and B (19.6% ,54.6% and 15.2% = 89%), and mixed schools around E/D and C (23.7%, 61.7%= 85%). That is, teachers in boys’ schools perceived their students to be better students than mathematics teachers in the mixed schools. Such perception may be a reflection of the teachers’ expectation that boys can do better than girls in mathematics
What did mathematics teachers do when their students did not complete homework0 The main categories for the responses were 'punish’ (40%), ‘insist that they first complete it’ (56%) and 16% would ‘reprimand the students’. The percentages would add to over 100% because some 42 teachers chose a second response. When teachers were divided by location of their school it seemed that punishment for non-completion of homework is more common in rural schools than in urban schools. Only seven teachers mentioned sending students out of class for non-completion of homework. In two schools the researcher also witnessed cases of boarding students being sent home (by the mathematics
149
teacher through the school administration office) to bring a parent for noncompletion of homework, but that was not reported by any teacher. With the kind of numbers reported earlier as not completing homework, mathematics teachers might spend quite some time dealing with homework issues.
On marking, 52 teachers (36%) reported that they rarely (occasionally or never) marked students’ work with teachers in girls schools reporting a higher percentage than average (twenty teachers or 44%). This agrees with earlier data reviewed which revealed that girls’ homework is marked less often than that of boys. 40% of the teachers reported that they mark all homework. We should put a caveat in interpreting this percentage because a number of comments from students implied that teachers may mark only books of selected few students.
The methods that teachers preferred to mark with (find practical) were mainly: commenting on difficult problems asked by students (42%), marking each pupils work (38%) and providing answers for students to mark (18%). This may mean that even among the 40 % of teachers who said that they marked all homework, there were some who rarely saw the work of their students. Incidentally, these are the same methods that most students preferred to be used for them to know how they were getting on. It is interesting to note that the order o f practicality o f marking methods given by teachers is similar to the students’ preference order for marking methods. Or perhaps students just wrote what happens in their classes.
150
Any marked assignment was returned by the next lesson by 79% of the teachers. Twenty-four teachers (17%) returned it by the end o f the week. If homework collected for marking was not returned soon, students would be constrained in doing more mathematics work in the meanwhile, unless students had at least two mathematics exercise books. Only in five schools were students found to have two exercise books for mathematics, and this seemed to depend on particular class teachers (not the school).
About 89% of the teachers gave answers to an assignment at the beginning of the next lesson. Any issues on homework were discussed at the beginning of the following lesson by 76% of the teachers. Another 12% (15 teachers) discussed homework issues at a subsequent prep, while Eleven teachers (8%) discussed homework with those interested individuals (the latter meaning homework was assigned but not discussed in class). Homework was normally given at the end of the lesson around the time that the end of lesson bell rang. Since most teachers discussed homework in the next lesson, this may mean that students often proceeded to do homework without adequate clarity o f what was expected of them, except to do specific problems from the class text. As it can be seen homework can take a lot of time.
Most of the teacher respondents (73%) mentioned that the biggest hindrance to marking homework was a big teaching load (number of lessons taught in a week). Fifteen teachers (13%) mentioned poor students as the reason they found it discouraging to mark (one teacher put it that he could mark his students’
151
mathematics homework with his eyes closed- to indicate how poor they are), while 11% attributed their hindrance to big classes that discourage one to mark.
Who made decisions about homework in the school? A majority of the teacher respondents (90%) reported that they decided themselves on how much homework to assign and to check. Perhaps this is an area where head teachers could help. In schools that achieved better in mathematics it was noted that there was accountability of the teacher and students in their use of time. The word ‘time’ was more likely to be used in explanations given in the
questionnaire or in discussion. The school principal kept tuned to the academic school directly or through the Heads of Department.
It was noted that only in about a quarter of the schools (10% of the teachers) was the homework checked by someone else other than by the teacher. Since in most of these cases only one teacher in a school said the Head of Department checks, one may guess that such respondents were the Heads of Department. Ideally, the Head of Mathematics Department (HOD) should monitor the teaching in his department but practically the head of department was judged to have little authority over the class mathematics teacher, unless such HOD was well supported by the school Principal. The feeling one got on the ground was that mathematics teachers were more or less autonomous in assigning and marking homework with HOD’s o f mathematics exercising littleformal control.
152
Teachers were also asked to whom they gave remedial help in the school Mathematics work. This statement was expected to provide a clue as to the academic focus (concern for academic excellence) of the teacher and the school. About a third of the teachers did not respond to this item. Of those who did, 35% (35 teachers) reported that they gave extra help those failing students identified as weak, 20% gave it to all students while 40% of the teachers reported that they gave help to those who sought it. Most likely these might be some enthusiastic students who would seek such help. Like Bell & Costello(1983) point out, not all students who like Mathematics excel in it, nor do those students who are good in mathematics always enjoy it. Helping those who sought for help would leave out many students who deserved to be helped to catch up in Mathematics but who were not courageous enough to present themselves to the teacher. It may also be pointed out that a closer look at the data showed that most of the teachers who mentioned helping weak students came from the better performing schools in KCSE mathematics. In most of the poor performing schools teachers were more likely not to respond or to say that they helped those who came to them for help. Few students may be helped this way as elsewhere in the study it is reported that some students perceived their mathematics teachers as unapproachable. A Pearson correlation o f the order of 0.6, with a significance value of 0.000 was found between the proportion of mathematics teacher respondents in a school who helped weak pupils, and the school’s KCSE mathematics mean score. This however may need a more controlled study to determine certainly the relationships between remedial teaching and student performance.
153
On a follow-up question about the kinds of remedial help teachers give to their students of mathematics, only 85 (just over half) mathematics teachers responded. Among the common kinds of remedial help mathematics teachers gave were helping weak students (25%), done by giving them extra work that matched their level; assisting individuals who sought assistance (22%); helping students solve difficult problems after homework (11%), and giving extra lessons during preps (11%). Only three teachers reported giving re-teaching of the topic when students had a problem with mathematics homework. Five teachers mentioned private coaching as a form of remedial help given to students. In one school, the Mathematics teacher was getting paid some extra money by some few parents to revise Mathematics class work (coach) with those parents’ children during preps and on Saturday mornings. Students of that particular teacher got significantly higher grades than students of other teachers in the school, presumably because he spent more time with such students.
Teachers were asked about the worst thing about homework in an open question. The answers given were analysed and put into themes. Fifty four of the teacher respondents (43%) perceived ‘students copying each others work’ as the worst thing about homework, 22% that it is ‘too much work for the teacher’, and 17% complained of ‘non completion’ o f work they assigned. Other comments were that it was boring (16 teachers), routine that overloaded students (5 teachers), and that homework was often done contrary to what students were shown in class (5 teachers). This may mean that the teachers were
154
not on the whole very happy with the situation that obtained from homework, the dissatisfaction being loaded on the students (copying, non- completion, doing it wrongly).
Students, however, complained that teachers said they copied even when they had not. Either teachers over reported the problem of copying or students under reported it, since over half o f the teachers thought it was a problem. Another possible explanation is that due to difficulty, students worked out homework in groups or in consultation with other students. When such students presented their work for marking the teacher was likely to see some similarity in the presentation of the work. Students were also more likely to copy when they knew that their teacher would not check the homework, or at least not thoroughly.
The responses of teachers when asked to respond to an open question on ‘the best thing about homework is ... ’ were analysed using the themes used earlier to analyse those of students on the most important thing about homework. The response that homework gives students practice was written by 51% of the teacher respondents. They said that homework gives students a chance to practice on content taught and at the same time to increase their knowledge. This is consistent with the idea that homework is useful to students (regardless of what teachers do about homework) and students should get lots o f it. Another 18% of the teachers stated that the best thing about mathematics homework is that it helps students test their understanding of the content taught. Interestingly,
155
each of these two themes received below 5% of the responses from the students. The reader may remember that the most frequent responses to this question from students were ‘learning to work alone’ (52%) and ‘getting feedback from working out problems’ (34%).
Of the teachers, 17 % said that they were able to evaluate the success and progress of their teaching through mathematics homework. This is an important answer considering the fact that homework should be given to serve some specified objective(s). If the objective was to test understanding o f the topic, then performance of students in homework would be able to test if the topic was successfully learnt. Unfortunately, homework seemed to be perceived by teachers as a student business, something students had to do.
Of the extra comments that teachers volunteered, 32% were on the importance of homework, while 18% o f the teachers complained that students attitude to homework was negative. Some few teachers (8%) mentioned that the teaching load for mathematics teachers be reduced to about 15 to 18 lessons, and the class size reduced to about 20 to 25 students, to allow for more efficient teaching of mathematics including marking homework. This study notes the 8% of the teachers who commented that teachers needed to design homework better to motivate students to do it.
4.6 Results and discussion on the hypothesesBelow are reported the results obtained in testing the hypothesis of the study.
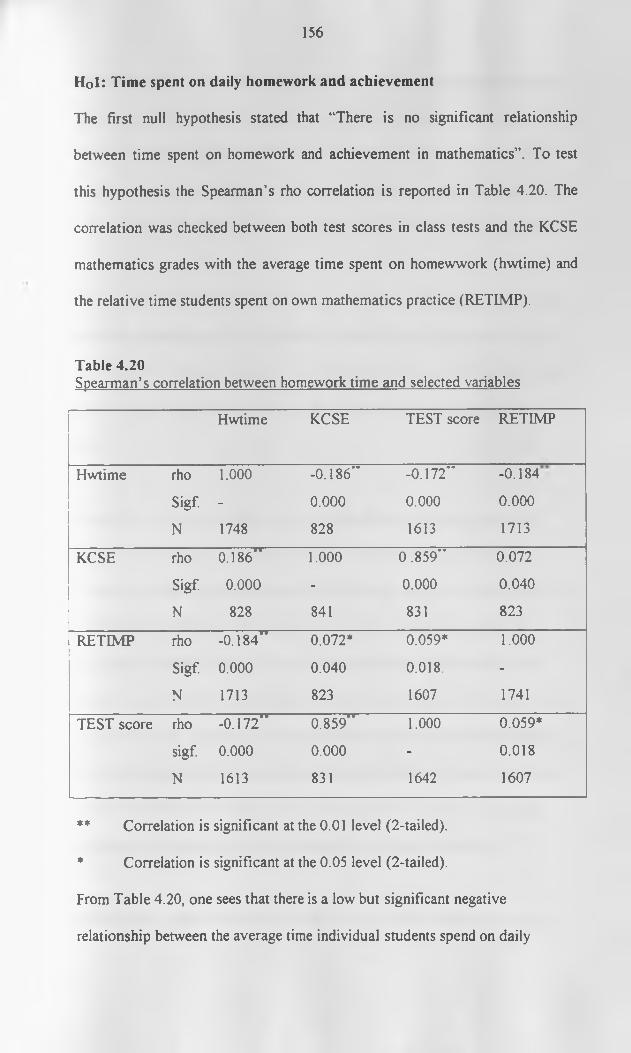
156
H01: Time spent on daily homework and achievementThe first null hypothesis stated that “There is no significant relationship between time spent on homework and achievement in mathematics”. To test this hypothesis the Spearman’s rho correlation is reported in Table 4.20. The correlation was checked between both test scores in class tests and the KCSE mathematics grades with the average time spent on homewwork (hwtime) and the relative time students spent on own mathematics practice (RET1MP).
Table 4.20Spearman’s correlation between homework time and selected variables
Hwtime KCSE TEST score RETIMP
Hwtime rho 1.000 -0.186" -0.172" -0.184Sigf. - 0.000 0.000 0.000N 1748 828 1613 1713
KCSE rho 0.186" 1.000 0.859" 0.072Sigf. 0.000 - 0.000 0.040N 828 841 831 823
RETIMP rho -0.184" 0.072* 0.059* 1.000Sigf. 0.000 0.040 0.018. -N 1713 823 1607 1741
TEST score rho -0.172" 0.859" 1.000 0.059*sigf. 0.000 0.000 - 0.018N 1613 831 1642 1607
** Correlation is significant at the 0.01 level (2-tailed).* Correlation is significant at the 0.05 level (2-tailed).From Table 4.20, one sees that there is a low but significant negative relationship between the average time individual students spend on daily
157
mathematics homework (hwtime) and achievement. In other words, there is a tendency for lower performing students to spend more time on homework. This may not be surprising since this study found that, generally, teachers assign the same homework for all students to do. Some students are likely to finish quickly while others are likely, to waste a lot of time trying to fathom the homework.
Unfortunately these weaker students may have been convinced that they could not learn mathematics when they know that they spend more time to finish a task that other students complete in significantly less time. Such students could become discouraged and yet they are the students who need encouragementmost.
Homework assigned in different schools may differ in quantity and in the relative difficulty (with respect to particular students). When correlations between time spent and achievement for individual schools were calculated, the relationship seemed to hold except that for some schools it was high and significant whereas in some few schools it was low but still positive. The average time individual students spend on homework assigned in a day is likely to depend on the student and on the task itself. In the few schools where there was a low positive relationship between homework time and achievement, the teacher was likely to be using a more individualised approach in assigning mathematics homework and helping students who were in difficulty.
Alternatively, students were asked to say how much time they spent on own
158
related to relative time spent on own practice. This would mean that there is a tendency for students who spend more time on homework (read low achievers) to spend less time on own practice. A few good students (from their test score or KCSE mathematics scores) complained that too much homework denied them the opportunity to do their own practice, yet this is what would count in a the KCSE. This may not be true if the mathematics teacher set homework on a variety o f mathematical skills. The majority of the teachers gave homework to give students practice in the topic taught in the day, so it could not be very useful for revising mathematics.
From the Table 4.20, it is also clear that mathematics test scores for Form 4 students and the KCSE grades for the same students are highly correlated (0.859) and significant at the 0.001 level. This might help to allay fears about the reliability of the class teachers test scores used in the study.
H02: Gender/ hwtimeH02 There is no significant difference between boys and girls on the amount
of time they spend on mathematics homeworkTo test this hypothesis the t test, a parametric test was used. The t test is basedOn the fact that the standard error of the difference o f the means in two groupsIs normally distributed (just like the standard error o f the mean)._t = sample 1 mean - sample 2 mean
Standard error o f the difference in the two means
The results are shown in Table 4.21.
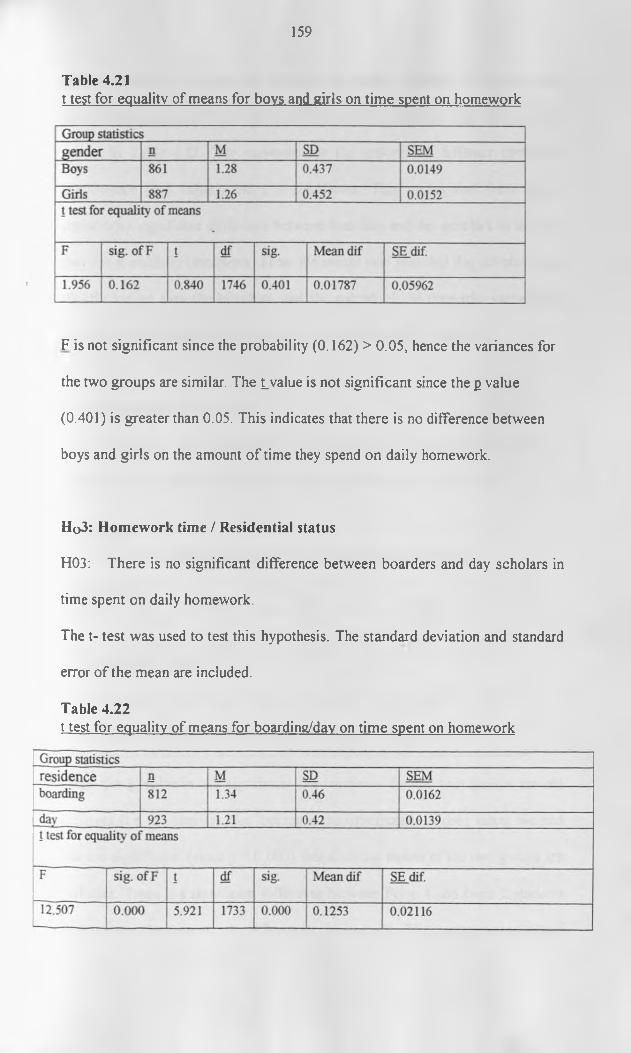
159
Table 4.21t test for equality of means for bovs and girls on time spent on homework
F is not significant since the probability (0.162) > 0.05, hence the variances for the two groups are similar. The Lvalue is not significant since the g value (0.401) is greater than 0.05. This indicates that there is no difference between boys and girls on the amount o f time they spend on daily homework.
Ho3: Homework time / Residential statusH03: There is no significant difference between boarders and day scholars intime spent on daily homework.The t- test was used to test this hypothesis. The standard deviation and standarderror of the mean are included.Table 4.22t test for equality of means for boarding/dav on time spent on homework
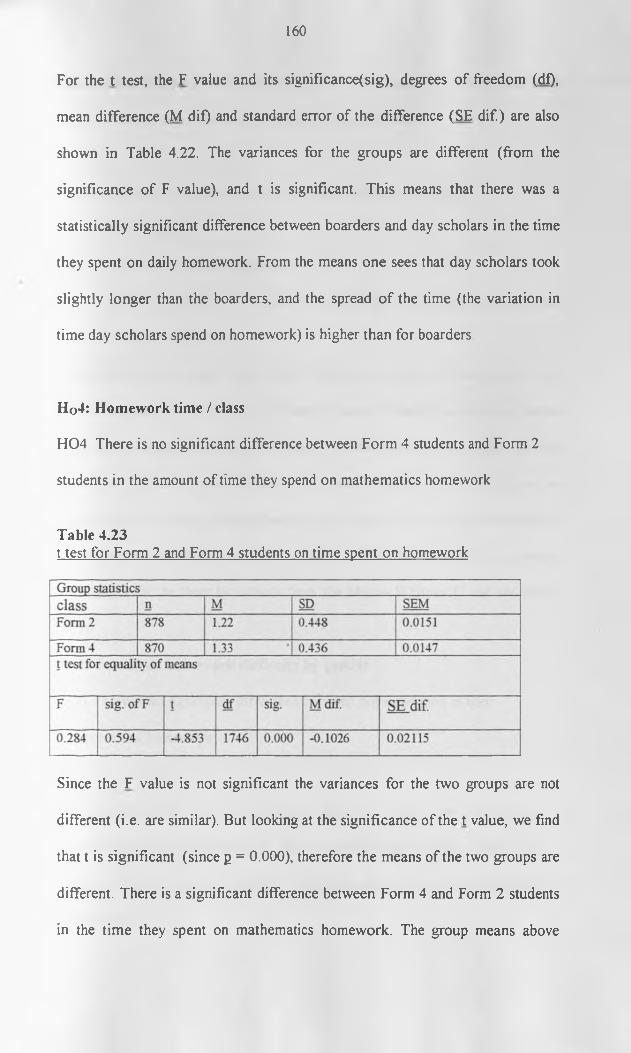
160
For the t test, the F value and its significance(sig), degrees of freedom (df), mean difference (M dif) and standard error of the difference (SE dif.) are also shown in Table 4.22. The variances for the groups are different (from the significance of F value), and t is significant. This means that there was a statistically significant difference between boarders and day scholars in the time they spent on daily homework. From the means one sees that day scholars took slightly longer than the boarders, and the spread o f the time (the variation in time day scholars spend on homework) is higher than for boarders.
H04: Homework time / classH04 There is no significant difference between Form 4 students and Form 2 students in the amount of time they spend on mathematics homework
Table 4.23t test for Form 2 and Form 4 students on time spent on homework
Since the F value is not significant the variances for the two groups are not different (i .e. are similar). But looking at the significance of the t value, we find that t is significant (since p = 0.000), therefore the means of the two groups are different. There is a significant difference between Form 4 and Form 2 students in the time they spent on mathematics homework. The group means above
161
indicate that Form 4 students took more time with homework. Incidentally, the Mann-Whitney test would have yielded comparable results.
Hypotheses Ho5, Ho6, and Ho7 dwelt on the difference between(i) boys and girls .(ii) boarders and day scholars and(iii) Form 2 and Form 4 students respectively with respect to perceived
homework difficulty.Students had been asked to say how difficult the homework they usually got was on a scale of 1 to 4 (very difficult to easy). These hypotheses are tested using a non-parametric test, the Mann-Whitney U test, since the variable homework difficulty was ordinal. The Mann-Whitney U test is almost as powerful as the t- test, and tests the number of times an item is ranked higher in one group over another group. The Z statistic corrects for ties in the two groups. The results for the three hypothesis from the Mann- Whitney U test are shown below:Ho5: Perceived homework difficulty by genderH05 There is no significant difference between boys and girls in their perception of homework.
The significance for the z value is greater than 0.05, thus it is not significant even at the 0.05 level (Table 4.24). The hypothesis was accepted. There is no difference between boys and girls in their perception of homework difficulty inmathematics.
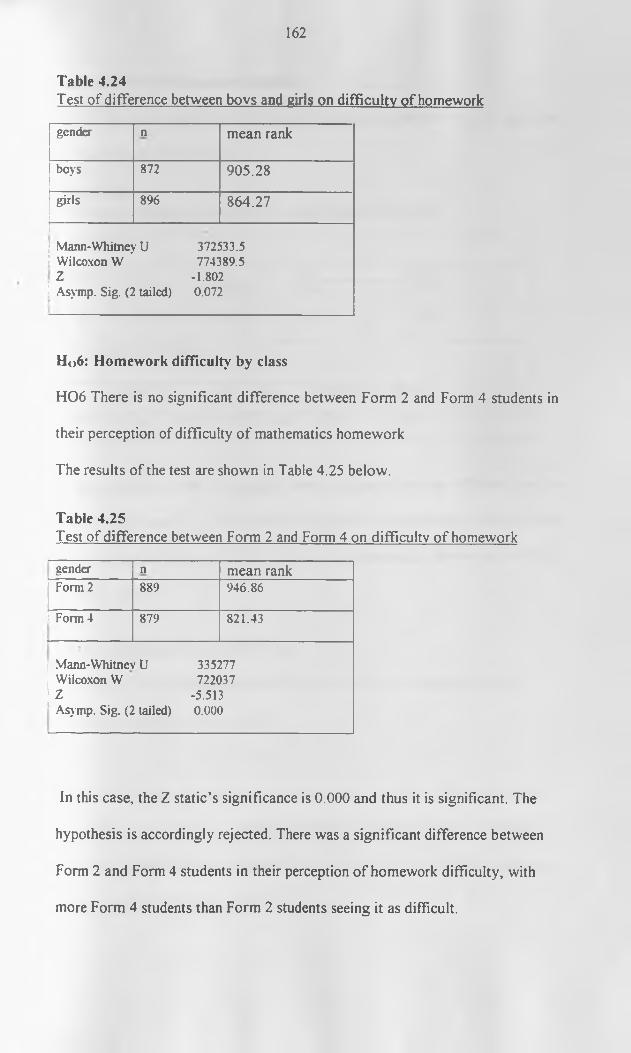
162
Table 4.24Test of difference between bovs and girls on difficulty of homeworkgender n mean rankboys 872 905.28girls 896 864.27
Mann-Whitney U 372533.5Wilcoxon W 774389.5Z -1.802Asymp. Sig. (2 tailed) 0.072
H o 6 : Homework difficulty by classH06 There is no significant difference between Form 2 and Form 4 students in their perception of difficulty o f mathematics homework The results of the test are shown in Table 4.25 below.
Table 4.25Test of difference between Form 2 and Form 4 on difficulty of homeworkgender n mean rankForm 2 889 946.86Form 4 879 821.43
Mann-Whitnev U 335277Wilcoxon W 722037Z -5.513Asymp. Sig. (2 tailed) 0.000
In this case, the Z static’s significance is 0.000 and thus it is significant. The hypothesis is accordingly rejected. There was a significant difference between Form 2 and Form 4 students in their perception o f homework difficulty, with more Form 4 students than Form 2 students seeing it as difficult.
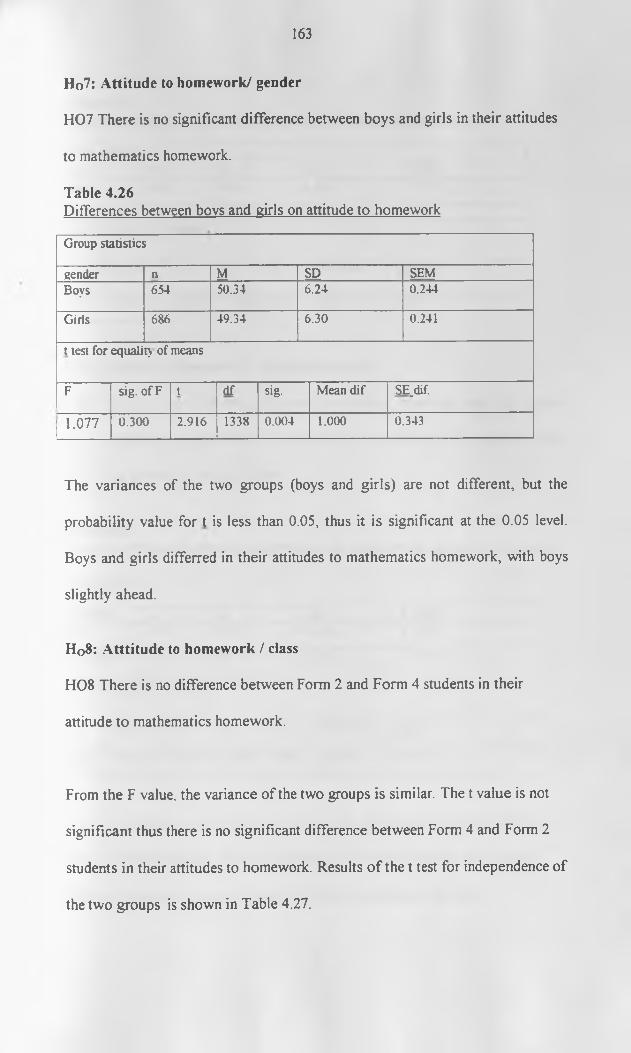
163
Ho7: Attitude to homework/ genderH07 There is no significant difference between boys and girls in their attitudes to mathematics homework.Table 4.26Differences between bovs and girls on attitude to homeworkGroup statisticsgender n M SD SEMBoys 654 50.34 6.24 0.244Girls 686 49.34 6.30 0.241
t test for equality of means
F sig. ofF t df sig. Mean dif SE_dif.
1.077 0.300 2.916 1338 0.004 1.000 0.343
The variances of the two groups (boys and girls) are not different, but the probability value for t is less than 0.05, thus it is significant at the 0.05 level. Boys and girls differred in their attitudes to mathematics homework, with boys slightly ahead.
H08: Atttitude to homework / classH08 There is no difference between Form 2 and Form 4 students in their attitude to mathematics homework.
From the F value, the variance of the two groups is similar. The t value is not significant thus there is no significant difference between Form 4 and Form 2 students in their attitudes to homework. Results o f the t test for independence of the two groups is shown in Table 4.27.
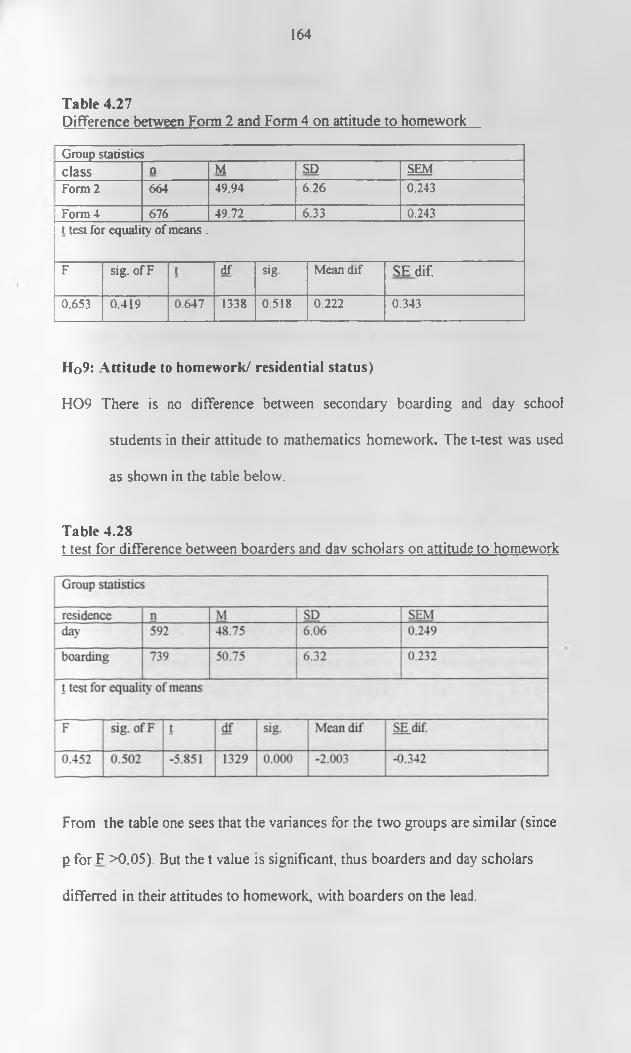
164
Table 4.27Difference between Form 2 and Form 4 on attitude to homeworkGroup statisticsclass n M SD SEMForm 2 664 49.94 6.26 0.243Form 4 676 49.72 6.33 0.243t test for equality of means .
F sig. of F t df sig Mean dif SEdif.0.653 0.419 0.647 1338 0.518 0.222 0.343
Ho9: Attitude to homework/ residential status)H09 There is no difference between secondary boarding and day school
students in their attitude to mathematics homework. The t-test was used as shown in the table below.
Table 4.28t test for difference between boarders and dav scholars on attitude to homework
From the table one sees that the variances for the two groups are similar (since P for F >0.05). But the t value is significant, thus boarders and day scholars differred in their attitudes to homework, with boarders on the lead.
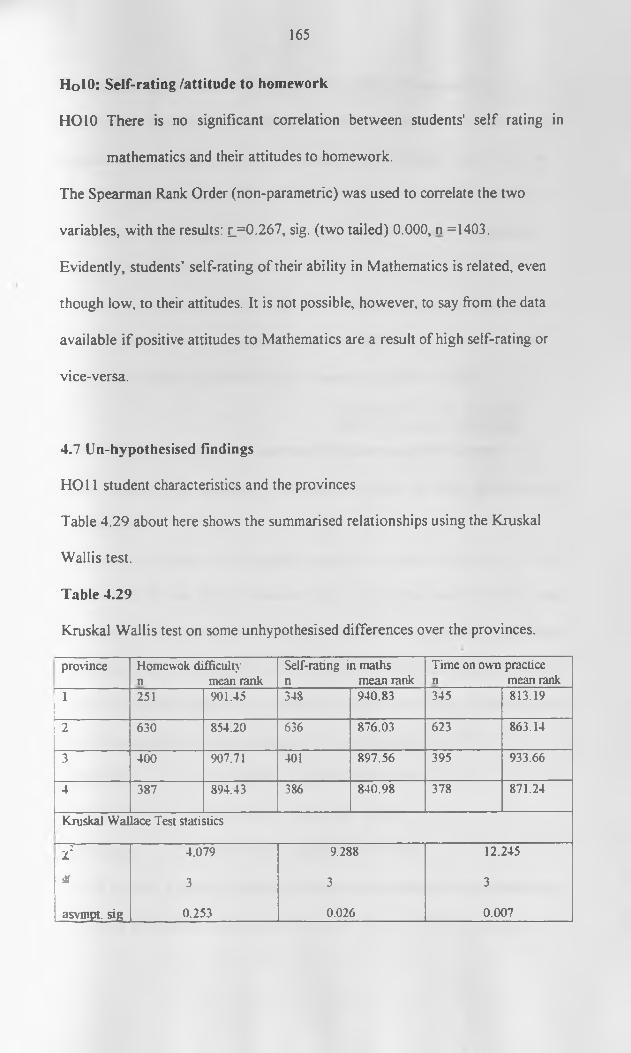
165
HolO: Self-rating /attitude to homework
HOIO There is no significant correlation between students' self rating in mathematics and their attitudes to homework.
The Spearman Rank Order (non-parametric) was used to correlate the two variables, with the results: l =0-267, sig. (two tailed) 0.000, n =1403.Evidently, students’ self-rating of their ability in Mathematics is related, even though low, to their attitudes. It is not possible, however, to say from the data available if positive attitudes to Mathematics are a result of high self-rating or vice-versa.
4.7 Un-hypothesised findingsHOI 1 student characteristics and the provincesTable 4.29 about here shows the summarised relationships using the Kruskal Wallis test.Table 4.29Kruskal Wallis test on some unhypothesised differences over the provinces.province Home wok difficulty
n mean rankSelf-rating in maths n mean rank
Time on own practice n mean rank
1 251 901.45 348 940.83 345 813.19
2 630 854.20 636 876.03 623 863.14
3 400 907.71 401 897.56 395 933.66
4 387 894.43 386 840.98 378 871.24
Kruskal Wallace Test statistics
l 2 4.079 9.288 12.245stf 3 3 3
asvmpt. sig 0.253 0.026 0.007
166
It would appear that students in the provinces differed by age and inachievement in mathematics. Students in different provinces may differ in agebecause o f the province’s culture that tends to take children to school early orlate, or it might be related to the problem of repetition in the primary classes.The Kruskal Walis test used is similar to the Mann-Whitney U test explainedearlier except that it can handle more than two variables.At the 0.05 level, students self-rating, and the relative amount students take inown mathematics practice appear to have been different over the provincesvisited. The perceived difficulty of homework, is, however similar.
U N IV E R S I T Y OF NA IROB I CAST AFRICANA COLLECTION
H012 Relationship between marking frequency and achievementHO 12 There is no significant relationship between marking frequency and achievement.To test this hypothesis the students rating on a scale of 1 (never) to 4 (all homework) of how often homework their was marked was correlated using Spearman’s rho with student achievement scores. The latter test was used due to reservations on the reported marked homework frequency discussed earlier. This test showed some low correlation between how often homework was marked, and achievement as measured by the following variables:Testscores rho = 0.107 sig 0.000, N=1605KCSE rho = 0.101 sig 0.004, N=827Self rating rho = 0.172 sig.0.000, N=1742As can be seen, it seems students’ achievement in mathematics is related to thefrequency of marking mathematics homework. Students’ self-rating seems
167
related with the frequency of marking homework. Students who thought they were good in mathematics seem to have had their work marked more often.
H013: Attitude to homework and achievementThere is no significant relationship between students’ attitude to mathematics homework and their achievement in mathematics.To test the hypothesis the Spearman’s rank order coefficient was calculated with the following results: attitude score with;Test scores r = 0.287, sig. 0.000, N=1231KCSE r= 0.300, sig. 0.000, N=641There was a significant low relationship between students’ attitude tohomework and achievement. The relationship was significant at the 0.05 level(and also at the 0.01 level).
4.9 Interviews and observationThe interviews were a secondary instrument aimed at getting a better picture of the schools and to clarify issues that might come up from the questionnaires.The principals and/or deputy principals in all 51 and 43 heads of mathematics department in schools were interviewed. The unstructured interview dwelt on homework and how it does, or may contribute to achievement of mathematics in the school. The discussion also included a comment by the heads of schools on the perceived reasons for poor performance in mathematics in their schools.
Observation was done in seventeen out of the twenty classrooms selected with a
168
view to obtaining data that would help understand pupils comments. Nine Form 2 classes and eight Form 4 classes were observed. The mean class sizes for Form 2 and 4 were 41.5 and 34.3 respectively. In Form 2 the range was 18 students (32 -40) while the range in Form 4 was 29 (15 - 44). When teachers mentioned large classes they may have meant classes with fifty or more students.
It was observed that in many cases (88%), the teachers used expository strategies to teach mathematics. In a majority of the cases (81%), the teacher would explain examples from the textbook as pupils listened and finally give some assignment on the material covered. Two teachers (12%) mentioned how the homework was to be done and when it was due. In other cases, it is thought, perhaps both the teacher and students knew implicitly when the homework was due. Homework was always given in the last two minutes of the lesson, or in two cases after the lesson bell had gone. The average time that homework took in the lesson ranged from 0 to 32 minutes. In the zero time case, no homework was discussed or assigned, while in the 32 minute case, there was checking if the home was done before the teacher discussed it on the chalkboard. The mean time spent on homework was 13 minutes in a lesson (32.5%).It was noted that only for three (18%) classes was the students checked regularly by the teacher. In other cases the teacher would read out the answers (more likely in a poor school) or discuss the homework on the chalkboard as students marked, or justchecked if it was done and went on with the lesson.
169
From the interviews with the school administrators, it was apparent that many principals of the secondary schools are more concerned with the relative performance of mathematics than with the raising absolute standards. In a majority o f schools (92%), there was a form of analysis of the KCSE examination and teachers were expected to explain the students performance in their subjects. This exerted some pressure o the teachers to work harder, but it may be discouraging to mathematics teachers whose subject was likely to be ranked lowest year in year o u t . The pressure was hard on the teacher especially around the time the KCSE results were announced, but eased away with time. In the better performing schools, teachers in casual conversations mentioned the pressure to deliver results as a limitation to good teaching in mathematics including homework.
Other than asking mathematics teachers to explain poor performance, most heads were apparently not sure of what to do to raise the achievement in mathematics or did not particularly care about such performance. Mathematics was most likely the subject that was most poorly performed in most schools. In the better performing schools, however, the performance of mathematics was comparable to the other subjects.
The following are the reasons principals advanced for the poor performance in Mathematics in secondary schools: students’ attitudes (49%), weak students (20%), poor teaching (16%) or the community attitude towards mathematics (6%), administration (6%) and subject difficulty (4%). According to heads of
170
department, attitudes towards mathematics (45.5%) and poor students (22.7%) were among the problems that led to poor performance in their schools. The teaching methods were also lamented on.
Principals who mentioned administration as a reason for poor performance in the school were talking of their predecessors, not o f themselves. However, the administration in the whole seemed helpless in implementing practical structures to help ameliorate the situation. More prep hours was mentioned as one way in which students were made to work harder. Working with parents to convince them to supervise their children more closely was another method floated on how schools are dealing with the problem of low performance in mathematics.
Four Heads of Mathematics department in day schools mentioned that their schools asked parents to encourage their students to do homework. The more common answer, though, was that the school conducted many (three to six in a term) Continuous Assessment Tests (CATs). Too many tests could take so much of the teacher’s time marking at the expense of helping deserving cases. Although teachers marked such tests some marks from such tests in some schools were found not to be entered in the school’s central mark book as long as an year later. This means that the tests could also have been a formality with little instructional value beyond labelling students as weak or strong in mathematics. The disposition, that concern towards students who are identified by the CATs as weak or strong, is more important than the CATs
171
themselves. Such feelings were echoed at S9.
It was noted that there is a trend in secondary schools of computerising student performance records. It is hoped that such an innovation trend can help provide timely information about students that need corrective action. Properly designed student management information systems may enable the school administration know what classes need attention, and the teacher to know what topics need to be re-taught, and where more homework needs to be assigned.
Only four principals reported to be checking if homework was marked themselves. They would occasionally collect a few students books at random to see whether such homework was checked. Some also asked for weekly reports from class teachers about their classes. The majority o f head teachers reported that they trusted their teachers to do their work well. Trusting teachers would work well in schools where a tradition of hard work is already well ingrained in the school, otherwise teachers might just teach ,as in appearing in a class and assigning homework. A student in one school remarked that there is no point of giving homework yet the teacher does not teach. In the bigger schools the Dean of Studies, Heads of Departments (HODs) and class teachers could supplement the head teachers efforts to ensure efficiency in mathematics homework.
It was observed that in the majority of schools there was drop in the mathematics KCSE mean score in 1999 compared with 1998 and other former years. When asked to comment on such drop the majority HODs of
172
mathematics, blamed the poor performance on students - that they were particularly poor, or that their attitudes were negative, that they had learnt wrong working methods from primary school or even that not any student could learn mathematics. In some schools, the researcher was contented to note that the HOD found the question difficult to answer and commented to the effect that they were also baffled by the performance o f their students. This meant that the students did not perform to their expectations. Some few HODs were, however, able to pinpoint the problem: that though the examination was manageable, the format of the exam 1999 was unusual with content usually in Paper 1 being tested in Paper 2. So apparently, students had not being drilled for such an eventuality! This might indicate that much of the mathematics teaching was directed towards the examinations, and not so much for understanding .
One also got the feeling that too much pressure was exerted on the students’ side to succeed. Most teachers wanted their students to excel in mathematics but few were willing to put the effort to guide their students, or knew what to do to achieve such success. (Such HOD’s and teachers constantly requested the researcher was to tell them the secret of success in mathematics). Students would thus be coerced by punishment, repetition o f classes, or even expulsion from the school. Such coercive techniques were not mentioned in the discussions with principals but came up in casual conversations with mathematics teachers in the course of discussions and interviews.
Properly designed homework may help in the gradual build up of skills, and in
173
the monitoring of students towards excellence. In the better performing schoolsthe HODs seemed to be conscious of the expectation that their students shouldperform well in mathematics, and designed strategies to move towards such agoal. One HOD of mathematics at school S54 whose students got several lA’grades in his class in a “poor’ school giving this personal testimony ;
Though l have been a mathematics teacher for the last fifteen years, l have only learnt to teach in the last five years or so. ... I now look back to see i f students understood rather than whether l was tired teaching. I mark pupils' homework frequently to see the problems they are encountering and help them out. I never let a student's performance in class influence m y view o f their ability..
One got a feeling that the school principal could do a lot more to raise theachievement in mathematics. One way would be through ensuring that there ismore accountability of the teachers and students in their use of time. In two ofthe leading schools in mathematics performance at KCSE, the researcher had toconvince the principal that the questionnaires and classroom observation wouldnot significantly interfere with the students use o f time. Some teachers alsoechoed this concern that it was the principal who set the pace, the expectationsin a school. Principals who are rarely in school cannot have the moral courageto insist that teachers be in the school or be accountable on their time in theschool.In one school, the researcher found some mathematics teachers playing darts. The researcher announced that he wanted to get some help. The Head of Department of mathematics said (in Kiswahili) as he continued to play his turn, “haina haja na mtu hii hesabu hapa”, (In this school nobody cares about mathematics). “We only teach it because it is our area of specialisation. If it
174
were made optional we would have two or three students.”
Head teachers can help improve mathematics performance and general performance by forming a work culture which encourages teachers to give a little time to their work. Perhaps such zeal is what helps heads with a missionary spirit convert weak schools into great ones (e g. Starehe Boys and Precious Blood Girls). Noisy staff rooms may be a disincentive, actually hindering teachers from giving that little more time their work, especially in marking mathematics homework. But this may be the subject of another study.
One Head of Mathematics Department at school S20 when asked why he thinkstheir school performed relatively well at K.CSE mathematics said:
l was ac — school (Szi) and we would work very hard but students were not performing. O ut results were never as good as in this place. I think it has to do with the school tradition . we found a tradition .You find yourself more comfortable by fitting into the work pattern.
The HOD, mathematics at school S9 repeated the same thing; “ I think this school is a very different system [from his previous teaching school]. I work much more. But more so, I believe it’s the spirit o f the school, the disposition of students and teachers towards success.” The Principal at S45 again echoed this saying “we have set a tradition in this school. Whoever comes in must toe the line. The thing is, when you come here you must fit in, otherwise you go. Different classes in a stream are taken by different teachers as a quality control check.” Such comment on the importance of ‘fitting in’ is also made by Griffin (1986) about Starehe school, and by the principal at school S48.
175
One may think that the principals who are high in ‘initiating structure’ are more likely to get better academic results than those high in ‘consideration’. Though this study is not well placed to make such a conclusion, it was apparent that the relative authority of the principal in relation to the teachers was likely to get more out of the mathematics teachers. In a number of staff rooms of schools visited, it was observed that there was a television set or a darts board which involved teachers to an extent of getting late for a class after a bell. Whereas it might be good to provide such amenities, they are likely to be counter productive to the academic good of the school. The researcher, however, also formed the opinion that some in some schools, things were too much centred on the principal. Such tight control may limit the creativity of the school system and impinge negatively in the overall academic achievement of the school, including mathematics.
The school principal with the support of the community can lead the way in teachers, and students developing, maintaining, a culture of, and expectation of, hard work and excellence. At school S9, the researcher was told of a culture of concern by the school for any student not performing to expectations. Such concern for individual students, and respect for honest work ethic can only be nurtured with the support and example (leadership) of the principal.
Two principals narrated how they changed their schools from low performing in mathematics to high achievement. Both said it was through encouraging a few selected mathematics teachers to encourage students through positive talk about
176
the importance of mathematics and through simpler assignments in which students got most or all of the problems right. Two heads of departments of mathematics in some two good performing schools added that in their schools they were doing more work (especially marking) than they used to in their previous schools. In the better performing schools it was reported that more was demanded of the teachers.
From the KCSE and test scores observed in schools, mathematics achievement was also observed to differ between classes in a school, showing how important the effort of the individual teacher is in mathematics. A Head of Department could set the pace as a model teacher, to show how daily homework can be used to lay a foundation for better future performance in mathematics, but teachers were still free to emulate such model or ignore it. Heads of Department of Mathematics were noted to be performing an important role in maintaining the standards in the examinations set and scored, maintaining a departmental mark book, but their effectiveness in promoting more efficient teaching largely depended on the support of their school (principal).
In many of the schools the situation in boarding schools is such that the students are left to do prep on their own or with one teacher on duty who sits in the staff- room. It seems Eshiwani’s (1983:27) comment about prep not being taken seriously was still valid . Prefects in a good school may control the students in not making noise in the classrooms to create environments for conducive study, but if a student was stuck in mathematics homework, there is no teacher
177
to consult. In two poorly performing boarding schools which didn’t have any teacher’s house, such problem was reported by the HODs mathematics that their students were left unsupervised and that nobody knew whether students did prep or not. In most schools teachers live outside the school, and are thus in a hurry to catch the next matatu or walk home after 4.00 p.m. In such circumstances teachers would not (and do not) carry a bag of exercise books home. Mathematics teaching is thus likely to suffer, depending so much as it does on marking and checking of students work.
Teachers who did not commute to their homes were reported to be more likely to be found in the staff-room over evenings and after classes working. Provision of teacher housing is likely to encourage mathematics teachers to put more time with their students. Six head teachers, though, mentioned that it was usual to find teachers in their school putting some extra time into their work, say, marking and planning for some future lesson.
Some teachers, with the support of their schools had joined local mathematical associations, which organised mathematics contests for students. This was likely to encourage students to put more time in mathematics. Unfortunately, this was only likely to benefit the better students who were already good in mathematics. Ways must be found to reach the majority of the students who are average or poor in mathematics.
178
CHAPTER 5:SUMMARY, CONCLUSION, AND RECOMMENDATIONS
5.0 IntroductionIn this final chapter of this study of mathematics homework practices in Kenyan secondary schools, we summarise the study, recapitulate its findings, and present our conclusions and recommendations arising there of. The results from the hypotheses are summarised first, and then other findings that helped to answer the research questions are reported.
5.1 SummaryHomework is a common phenomenon in many Kenyan secondary schools, defined as work that is assigned by the class teacher to be done outside the class time. The poor performance o f secondary school students in mathematics is a concern to many, (c .f . Daily Nation 1998, February 25:6 and Standard 1992,June 9:8). This is despite the fact that mathematics teaching in Kenya secondary schools is given almost five hours or 11.1% of instructional time in a week.Homework is part o f teacher’s strategies (Stem, 1995) which has an impact on learning outcomes in mathematics. Yet there has not been so much research on what is done, how it is done and how homework can be planned to meet the needs o f different pupils. This thesis was an attempt at a more detailed study to highlight the situation in Kenya.
This study had the following objectives: Identify the nature of mathematics homework given to secondary school students in Kenya; Investigate teachers’
179
perceptions on the value of homework; Find out the opinions of secondary school students regarding homework;Investigate the relationship between selected demographic, psychological and school variables in relation to homework and achievement in mathematics.
This research was designed as a cross sectional survey. It collated original information on homework in an effort to observe, identify and describe behaviours and teaching related to homework after Strang, (1975). A multistage random sample of 1783 secondary school students and 147 mathematics teachers was selected in four administrative provinces of Kenya namely; Central, Coast, Nairobi and Western. The students were selected from Form 2 and Form 4 classes in the secondary schools. Mathematics teachers o f Form 2 and Form 4 classes were selected from the schools selected. Questionnaires and achievement tests were the main instruments used to collect the data for the study. Interviews and classroom observation were also used to provide supplementary information, which was used to explain and validate the data obtained from the main instruments.
Descriptive statistics and inferential statistics were used to summarize and discuss the findings presented in the study.5.1 Summary of the hypothesised findings It was found that there is a negative correlation between time spent on mathematics homework and achievement in mathematics. The relationship was negative with the better students taking less time on mathematics homework
180
than the weaker ones. This perhaps occurred because the homework given was uniform for all students in a class. This, however, is inexpedient because poor students need to be encouraged through homework.
Time spent on mathematics homework was found not to differ by gender of the student but differed significantly between boarders and day scholars, and between Form 4 students and Form 2 students. The day scholars and the Form 4 students in each case estimated to take relatively more time on homework, this being related perhaps to the difficulty visa avis the help they got in overcoming such difficulty.There was no significant difference between perceived mathematics homework difficulty between boys and girls. It was found, however, that there was a significant difference between Form 4 and Form 2 students in their perception of mathematics homework difficulty, with the Form 4 students perceiving it as more difficult.
Boys and girls were found to differ on their attitudes to mathematics homework, with boys slightly ahead. Boarders and day scholars, too, seemed to differ on their attitudes to homework with boarders having a slightly higher mean score. This might be related to the students’ achievement in mathematics. The students self-rating of their own ability in mathematics was found to be significantly related to their attitude to homework. The self-rating seemed to be a malleable variable that may be related to the students’ environment.
181
The frequency of marking mathematics homework showed a very low but significant relationship with students achievement but due to the uncertainties ( earlier discussed) in the data to this item, it is difficult to be certain o f the relationship.
5.2 summary of other findingsMathematics homework was assigned and done in all the schools visited. It was also found that the term homework and assignment were being used interchangeably. One teacher explained that homework sounds like work to be done at home, so the term assignment is more appropriate in boarding schools where the students do not do the assigned work at home.
Mathematics homework was given almost daily (in every lesson by 96% of teachers), and is the same for all students in a class (100% of the teachers!) in the respective schools involved in the study. The mathematics homework assigned was practice exercises almost invariably sourced from students’ textbooks and, to a lesser extent past examination papers. Such homework was given at the end of the lesson, and revised or revisited at the beginning of a subsequent next lesson.
Students did not mind being assigned the same homework, in fact they thought that is the way things should be. The amount of the homework assigned, and whether it is marked or not, seemed to depend more on the initiative of an individual mathematics teacher than on the school. Overall, students were
182
agreed on the importance of homework in mathematics, but they were dissatisfied with the quantity of work given.
About 70% of the students gave difficulty and the amount of mathematics homework as reasons for non-completion of homework. So many extra comments were written at the end of the students’ questionnaire about too much homework and students receiving homework on a topic they hadn’t understood in class. In fact, a thread that seemed to run through out the study was a relationship between performance of mathematics homework and understanding (for example mathematics difficulty, teaching for understanding).
Ten percent of the students admitted to copying (cheating) in mathematics homework, especially when there was a threat o f punishment, or the homework was a lot. Students were fairly frank, for it was found that the percentages of students who mentioned copying as a strategy to beat completion of homework for those who gave their identities and for those who didn’t were comparable. The actual percentage is likely to be higher. Many teachers decried this habit, and gave it as a reason why they did not find it useful to mark pupils’ homework..Almost all the boarders did their homework in class while only 45% of the day scholars used the class to do assigned homework. More than a half o f the day scholars did their homework in the sitting room or bedroom with the attendant problems of poor lighting, inconvenient writing surfaces, and distractions from other family members.
183
Further, more than a half of the students preferred to do homework in the early morning. Slightly more boarders than day scholars, and more girls than boys did their homework in the morning. Day-scholar girls were particularly disadvantaged on room, and the help they could get from colleagues in the evenings. Some few students commented that they did their mathematics homework in the morning depending on how ready they felt (tired, or fresh) - some said they would finish it in the evenings to prevent them from dozing while some said they preferred the morning since they felt fresher then
On factors that motivated students to complete homework, it was found that more than half of the students who scored the top one third grades in K.CSE mathematics chose ‘love of mathematics’. This agrees with the findings about the relationship between attitudes in mathematics and achievement.
Facilities that limited students in doing homework were listed as textbooks, study guides and study space especially for day scholars. The meaning o f ‘study guide’ was not defined yet 40% of the respondents chose this option. Whatever students meant with this word, it shows that many students encountered difficulty in mathematics homework which, they believed, could be solved by a study guide.
A large group of students mentioned that they found negative comments arising from homework discouraging. About three-quarters of those who complained about the comment ‘poor’ or ‘weak’ (possibly qualified with ‘very’). Such
comments may have been given in good faith but students seemed to abhor the term in that it killed their morale to work any harder. Other comments that seemed to elicit strong pupil reactions were ‘wake up’ and ‘be serious’. Perhaps students hated such exhortations because they seemed addressed at the individual rather than on performance on the homework.
Students seemed to equate expected success to be commensurate with the effort put, but were disappointed when the teacher ‘refused’ to associate success with the quantity of work put in. Teachers seemed to value completion of homework (81% of teachers agreed students must complete homework regardless of difficulty) and correctness o f responses while students valued the effort they expended in mathematics homework regardless o f the correctness o f the answers arrived at. Unfortunately, teachers did not seem to be aware of this conflict. This may point to the need for teachers to understand students’ problems in doing assigned homework. Otherwise, through homework, mathematics teachers could inadvertently encourage undesirable behaviour such as cheating and irresponsibility.
U N IV E R S I T Y O F N A IRO B IEAST AFRlCANA COLLECTION
According to students the most popular methods o f marking are teacher commenting on difficult problems asked by students, teacher marking each pupils book and students marking their work in that order. About 70 % of the students mentioned they would like mathematics teachers to comment on difficult problems arising from homework while only 50% mentioned they
184

185
desired their books to be marked by their teacher. Further only about one third of the students ranked first the method o f teacher marking each pupils book.
A fraction of the students did not complete homework, a fact teachers seemed to be aware of. It was found that only 26% of the teachers reported that all their students finished assigned homework. That is, for 74% of the teachers, some students did not complete homework. Teachers knew that a fraction or all their students did not do or complete assigned homework, yet continued to give more homework. Most students reported that their teacher minded completion, yet did not still complete. Completion of homework was found to be related to how frequently it was marked. For non- completion, students were ‘forced to complete immediately’, ‘punished’, ‘sent out o f the lesson’, or ‘ignored’ in that order. Teachers’ and student responses to the question were similar except that teachers overstated ‘reprimand’ and understated ‘punishment’ in comparison to the students. Punishment for non-completion o f homework was more likely to be used on Form 2 students than on Form 4 students.
The majority of students opined that their mathematics textbooks should have answers. More Form 4 students than Form 2 students, and more boys than girls required textbooks to have answers. Students were more likely to put a premium on textbook answers if they used textbooks for their own practice. Where teachers marked pupils work often enough, students were also less likely to seethe need for textbook answers.
186
More than a half of the Form 4 students spent over one hour on homework assigned while more than a half of Form 2 students took up to an hour on assigned homework. This was attributed to the homework becoming more difficult or too much. About 35% and 45 % of Form 2 and Form 4 students respectively admitted to doing little or no mathematics work (homework or own practice). This seems to support KNEC ’s (1995) statement that many students seem to have dropped mathematics as a subject. The students who reported to doing no (or little) mathematics work were similar from the gender and residence stratification.
Homework in mathematics was found to take a significant proportion of lesson time, which was typically 40 minutes long. Homework was noted to take an average o f thirteen minutes (33%) of the mathematics lesson. In some classes, it would take even higher availing less time for the current lessons development. This way mathematics homework could even slow down instruction. Homework was given in the dying minutes of the lesson, and reviewed in the opening minutes of the subsequent lesson.
Self-rating o f ability in mathematics seemed to decrease from Form 2 to Form 4, with more of the latter rating themselves poor. The mean self-rating seemed to be irrespective of the students boarding status. It also seems that boarding and day school girls were more homogenous in their self-rating than boys. It is noted peculiar that more boarding than day scholar girls rated themselves poor.
187
Most students knew that they had to make an effort (hard work) to succeed in mathematics. Girls were more likely than boys to attribute success in mathematics to intelligence (stable cause). More Form 2 than Form 4 students attributed success in mathematics to effort (unstable cause). This was likely to affect their willingness to put effort in daily mathematics work (homework).
The worst thing about mathematics homework, according to students, was too much work and working alone, and interestingly being proved weak. It was found that boys were more likely than girls to complain about the worst thing about mathematics homework as ‘working alone' and proving them weak in mathematics. Form 4 girls reported an unusually low percentage for the problem of being proved weak by mathematics homework. Many students who answered a question on the most discouraging thing in mathematics homework, mentioned discouraging comments from teachers in marking their homework.5.3 ConclusionsIt was found that when homework was difficult, about three quarters of the students reported that they consulted their friends, and about one-fifth consulted the teacher. This indicates the importance of peers in the learning o f mathematics, a structure that should be strengthened deliberately. Some schools encouraged a group approach to practice in mathematics and this seemed to have a positive effect on the students’ attitude to homework. Friends of day scholars disperse after school and on weekends, and day scholars become disadvantaged in the extent to which they can consult friends in case ofdifficult homework.
188
Teachers should be consulted more often, but students complained that some mathematics teachers were unwilling, or were impatient in explaining difficult concepts to weak students. There were many comments to the effect that mathematics teachers should respect individual differences, and should be approachable.
From the many teachers’ comments, mathematics teachers seemed to have a general feeling that average and poor students do not put adequate effort (perceived them as lazy) while the average and poor students felt neglected at the expense of the better students. Teachers, as is natural, take credit for their effort in guiding the good students, while blaming the poor performers for lack of interest and for not putting adequate effort in mathematics work. The poor performers made more comments implying that they would perform better if teachers took more time removing obstacles and arranging conducive environments for them to learn mathematics. We must also recall the synergistic, two-way reinforcing, effect of teacher effort and student performance. Teachers are encouraged by pupil efforts in doing assigned mathematics homework while students are encouraged by the teacher effort in marking and correction of such work.
The researcher got a feeling that the mathematics teachers sampled perceived themselves as trained to teach bright students. Perhaps their perception of their role as teachers of mathematics needs to be brought into tune with the reality in the schools and the nature o f mathematics learning, and be advised on how to
189
pitch their teaching accordingly. This may be difficult since teachers have few excellent models to copy during their formative years. Their lecturers in the university are likely to use, as is usual, the lecture method, while their previous teachers and current senior teachers might be ingrained in old teaching habits, leaving student teachers of mathematics with few role models.
Mathematics performance in secondary schools sampled was found to be related to the general performance of the school. This indicates the importance of the quality of students in learning mathematics. It was noted that the very high achievers in the local day schools were likely to be some poor students who could not afford the fees for a boarding school to which they were initially invited. In Form 4, a high correlation between the schools’ mathematics score and the general mean scores was found. This means that to raise performance in mathematics we must raise the general performance of the school.
Incidentally, even though all mathematics and science teachers were given a monetary inducement of two annual increments over their salaries in 1998, such increments may not serve to motivate teachers beyond making them feel special. Mathematics teachers are not likely to work harder in a staff-room where no one else is working, or is busy playing darts , scrabble or watching a favourite T V programme. This has implications for the design of teacher workspaces, to ensure accountability and productivity of the teacher while in the school. Many o f the mathematics Heads of Department had a space that they could use alone or with members of the department, but it seems that space is a
190
problem in many schools. Noisy staff-rooms where many, say, fifteen teachers are pooled are not ideal for marking of homework, or other serious preparatory work. Even with the increments, one anticipates the difficulty of a teacher trying to mark in a staff room where unmotivated teachers of other subjects,(c.f. Kamau, 2002: 102) are shouting and sharing social experiences. The total quality approach (for the whole school) would be a better starting point.
This has implications for the leadership of the school. What are the school Principal’s main concerns for the school; public relations, physical development, economic viability, teachers’ welfare, or academic focus? Not that these objectives are mutually exclusive but they serve to point out that the school Principal needs to set the academic environment right for all teachers to work. If so much time is taken on mathematics homework that is just busy work, performance in other subjects could actually be affected, since pupils would not have enough time to study other subjects, and yet they would not pass in mathematics.
It was also noted that some of the better performing schools in mathematics had an inducement for teachers to work harder, possibly a tradition, or monetary. Perhaps teachers might put a little more effort in managing homework if they worked with smaller groups or if they got a monetary inducement. Parenthetically, the issue o f coaching, tuition is a very sensitive and controversial one in Kenya. Despite official statements that discouraged ‘tuition’, almost all schools visited (from interviews) had at least two extra
191
weeks o f ‘tuition’, especially for Forms 3 and 4 during school recesses, the extra cost which was met by parents. The explanation given was that time during school term was limited and students needed extra time to complete the 8-4-4 syllabus, including Mathematics.
Syllabi o f all subjects taught in a school cannot be equally lengthy, so coverage of the syllabus cannot be the only reason for calling back students during holidays to teach them all subjects. The extra holiday tuition might be tied to the pressure to excel in public examinations, and also on the fee paying ability of the students since most teachers would be unwilling to work during school holidays without a monetary inducement. This culture of parents paying something extra to teachers to teach their own students, the researcher is of the opinion, is counterproductive in the end, only serving to estrange teachers especially Mathematics’ ones from the ‘profession’ attitude - going an extra mile when it is deemed necessary to do so.
It was observed that the responses of day scholars and boarders were different. More than a half of them did homework in less than ideal situations, and were less likely to receive help from colleagues for reasons already discussed. Day scholar students mentioned many impediments to doing homework some very basic, but beyond their control. Yet knowing our Kenyan secondary school admission process, many of the day scholars are the students who may need more help in mathematics. Thus, the playing ground in terms of the opportunity
192
to learn, does not seem to be level for boarding and day school students, and this problem needs to be addressed.
Homework was reported to take a substantial proportion of lesson time, and this could slow instruction in mathematics. In a 13 week term (and seven mathematics lessons a week), 13 minutes lost in a lesson would add up to 13x7 x 13 minutes or 29 lessons (a month of instruction time lost in a three month term). This does not seem to support the OFSTED (1995) or ILEA (Hargreaves)(1984) reports that contended that homework has the value of cutting down on instructional time. The homework practices observed with a homework-check- review formula used in many schools may, in fact, increase instructional time.
It is unlikely that mathematics homework in the form reported in many schools in this study can contribute much to improving performance in mathematics. Mathematics teachers need to take time to address some of the points raised by their students and discussed in this study. This way they can design homework that is intended to achieve more specific objectives than just ‘practice’.
The homework pupils got was mostly ritualistic and did not appear to arise out of the need to achieve certain specific objectives, but was only vaguely assumed to result in more learning of mathematics. In many of the schools no teacher was available to supervise homework yet students were expected to do it everyday. On the worst thing about homework, a number of students remarked
to the effect that it is “ when l findthe m athematics homework hard, yec there
193
is nobody to help me”. The homework to many seemed to be failure prone, negatively reinforcing, only proving to the weak how poor they actually were through its difficulty or through teacher comments arising thereof. One Form 4 girl wrote the following:
m aths homework makes me sick. Each tim e l can't get m y sum s right l want to cry/ then l close my book and forget about it. I don 't hate maths. I don't know why l ju st can't g e t it right." (girl, 17 :4.-11)
Both teachers and students generally seem agreed that mathematics homeworkis important for various reasons such as feedback, practice, checkingunderstanding and developing independence. Students also do not seem to mindhomework that is given often. The only suggestions they made was thathomework be made more purposeful, the quantity be reduced and qualityimproved, and that teachers patiently go over content that homework revealedto be inadequately mastered. The researcher is o f the opinion that teachers onlyneed some reorientation to newer and productive methods of teachingmathematics especially on the issue of homework, and to sensitisation on howtheir students feel about homework. There is also a case of helping mathematicsteachers find more meaningfulness in their work. For example, only 9% of theteachers agreed that teaching mathematics was exciting to them, while 85% ofthem disagreed that they should check the homework they set. Ways must befound to address some of the teachers’ concerns too.
Difficulty of mathematics especially through homework can discourage students. Mathematics teachers should teach in a way that does not emphasise the difficulty of mathematics but its usefulness. The efficacy of such a practice
194
was mentioned by one HOD mathematics, now a Principal, (T3.02) who gave testimony of how they were able to transform the grades of mathematics from the lowest to the highest grades. Homework, especially, should emphasise the heuristics of problem solving and the importance of presentation. Secondary school mathematics teachers emphasised that the answer to a problem is not as important (and emphasised that it does not earn many marks) as the method of working out the problem, but this seemed to be checked only during examinations, and tests.Homework presents good opportunities for training students in desired methods, but this, the teacher can only do by becoming familiar with individual students’ work, as in checking homework. Students preferred that their mathematics solve the problems on the chalkboard to other methods of checking homework. This in the whole might mean that many students were used to not having their work marked or they did not care or desire for such marking. Or did they not desire individualised attention (remember they also generally did not want differentiated mathematics homework)? This finding seems to agree with Abidha’s (1996) finding that secondary school students seemed to prefer high structure in their learning environment. This finding, however, is surprising in that you would expect the students to want their books marked by the teacher. But as reported earlier, more students would rather the teacher solved the difficult problems arising from homework in class, a more impersonal (perhaps less threatening) method.Teachers did not seem to view non-completion o f homework, or copying of other students answers in order to complete as students did. Teachers viewed it
195
as deliberate in-subordination, or laziness while students gave other ‘valid’ reasons. Teachers and students were not agreed on the most important and worst thing about mathematics homework. Students reported the most important thing about homework to be feedback and learning to work mathematics alone. Teachers said that the most important thing was that it helps students practice concepts learned. The most popular student response on the worst thing about homework was that it took too much time, a complaint related to the amount of the homework, and the difficulty of working alone especially for day scholars. For teachers, the worst thing about homework was copying by students and that it was too much work for the teacher to mark. Teachers and students need to discuss on the why of homework before it is assigned.
Through homework mathematics, teachers can deliberately encourage (reinforce) their students to like mathematics, to put more time into it and perhaps improve in mathematics generally Quite a number of students in this study complained of discouraging remarks that emanated from the marking of mathematics homework. Such comments are likely to discourage than encourage pupils in mathematics.
Teachers have a gap to bridge in terms of accessibility by students in difficulty. If the pupils perceive a teacher harsh, they are unlikely to approach him(her) when they encounter difficulty in mathematics and homework. Students made many comments about how mathematics homework could be better organised, and how they could be taught mathematics better Many of the comments made were surprising for they sounded like they were from some Mathematics
196
Education College, showing, perhaps, that students have a feeling that mathematics could be taught better. This study concludes with a remark from one such student who wrote:
Teachers have a big bearing on a student's performance. Her predictions, her answers to student questions can either sow a negative or positive seed. Teachers should be particular on how they handle weak students in class. (Girl, 23:4-2).
5.4 Recommendations of the study1. There is urgent need to get a Homework Master in a school (or to recognise
the importance and function of) to monitor, co-ordinate the amount and quality of homework in a school between departments. Pupils who don’t finish their work could be referred to such a person. The guidance and counselling teacher or Director of Studies office could perform such a function. Such a teacher could walk around to ensure pupils are left with a teacher to guide them if necessary.
2. There should be community study centres for day scholars to mediate, and equalise the effects of the home. Rural electrification may help in such efforts. Such centres could stock some common books for mathematics. Members of the community could organise how to supervise such study. This could be done through community initiative. The day schools can lead in such activities by opening up their facilities to their students and community after official school hours.
3. Since mathematics homework is such an important aspect of mathematics teaching and learning, there is need to sensitise teachers about how students feel about homework. When teachers and students share the same value on for the importance of homework, and the limitations of both parties in
197
completing and marking homework, more is likely to be achieved. The researcher recognises the importance of initiatives such as SMASSE towards the improving performance in mathematics in the country.
4. The formation of a voluntary national association of Mathematics teachers to which teachers could be affiliated would help in improving the standards of mathematics teaching (including homework) in the country. Such an organisation could require continuing professional education. This in turn would get mathematics teachers to continue experiencing the thrills and frustration of doing mathematics. This would also provide teachers with a forum for sharing tried out models on desirable efficient practices in mathematics teaching. The author appreciates the role of the local mathematics associations at the district level in raising the standards of mathematics in schools.
5. It is suggested that more emphasis be put on suitable homework and remedial teaching models in training future mathematics teachers so that their learners would perceive them as more approachable and helpful.
6. There is need for schools to check the progress of their students in learning mathematics. .An enabling environment with an appropriate teaching load should be created where mathematics teachers can spend more o f their time on task, especially on marking pupils work towards remediation o f the learners experiencing difficulties.
5.5 Recommendations for Further Research• It is recognised that variables may be related directly or through an
intervening variable, and that relationships may not be so clear due to the
198
effect of confounding variables. There is need to conduct more studies especially on relationships suggested in this study. For example, on the frequency of assigning and marking homework; self concept /self rating in mathematics; teaching load and feedback strategies; and achievement in mathematics to be able to make more definite statements about variables that are associated and the mechanisms of such relationships.
• This study was based in the secondary school. There should be a comparable study to find out the organisation of mathematics homework in primary schools to see if practices are compatible with the secondary school. This would help mathematics teacher in secondary schools to build continuity with the primary school for the benefit of students
• More thorough studies on a few or one school may help us know the subtle points in homework management. The instruments should be improved on to fit a case study of one or a few schools o f known mathematics performance.
• There is need for studying the details of how CAT and own practice contribute to achievement in mathematics. Do CATs bridge the gaps that seem to be left by mathematics homework?
• The researcher got a feeling that the Principal has a big role to play in the academic culture of the school. How does a principal with Mathematics teaching background affect students’ interest and performance o f that subject in the school? What is the relationship between the leadership styles o f the principal and the relative performance o f the school?
199
BIBLIOGRAPHY
Abidha, N O. (1993). An Exploratory Study o f Secondary School Learning Styleswith Special Reference to Science Learning. Unpublished Doctoral Dissertation. Nairobi: Kenyatta University.
Adams, S. (1989). A Guide to creative tutoring. London: Kogan Page.Aiken, L. R. (1970). Attitudes toward mathematics. Review of Educational
Research. 40. 551-596.Andrews, K & Vernon, G. with Walton, M. (1996). Good Policy and Practice
for the After-school hours. London: Pitman Publishing.Antonen(1967). An examination into the stability o f mathematical attitude and
its relationship to mathematics achievement from elementary to secondary school level Ph D thesis. University of Minnesota.
Arends, R. I.. (1991). Learning to teach. 2nd Edition. New York: McGraw-Hill.
Arlin, M. (1984). Time, equality and mastery learning. Review of Educational Research. 54. 65- 86.
Ashworth, A. E. (1981). The teaching of mathematics. London: Hodderand Stoughton.
Askew, M. & Bliss, J (1995). Recent research in Mathematics Education 5-16. London: HMSO.
Aubrecht, J. D. (1986). High school students ratings of teachingeffectiveness compared with teacher self-ratings in Journal of Educational and Psychological Measurement 46. 415-423.
Austin, J D (1976). Do comments on mathematics homework affect student achievement9 School science and mathematics. 76, 159-164.
Austin, J.D (1978). Homework Research in Mathematics. School Science and Mathematics. 79, 115 - 122
Babbie, E. (1986). The practice of Social Research 4th Edition. Belmont, California: Wadsworth.
Badger, M.E. (1981). Why Aren't Girls Better at Maths9 Education Research Vol. 24(1).
200
Balian , E. S. (1982). How to design.analvze. and write doctoral research. Lanham Uni verity Press of America.
Bandura, A. (1977). Social learning theory. Englewood Cliffs, NJ: Prentice-HallBandura, A. (1986). Social foundations of thought and action. Englewood
Cliffs, NJ:Prentice-HallBanks, O. (1973). Success and failure in the secondary school. London:
Methuen.Becker, W. C„ Engelman S., & Thomas, D. R. (1975). DISTAR teaching 2:
Cognitive learning and instruction. Chicago: Science Research Associates
Bell. A.W., Costello, J., & Kuchemann. D.C. (1983) A Review of Research In Mathematical Education. Windsor, Berks: Nfer - Nelson.
Bell, F. H. (1978). Teaching and learning mathematics (in secondary schools). Dublique, Iowa: W.C. Brown.
Berliner (1978). Changing academic learning time: clinical interventions in four classrooms. Paper presented at the Annual Meeting of the American Educational Research Association, Toronto.
Bettleheim. B. (1961). The decision to fail. School Review. 69. 322- 412Bloom, B. S et. al. (1965). Taxonomy of educational objectives, the
classification of educational goals handbook 1. Cognitive domain. New York: David McKay.
Blumenfeld, S. L. (1973). How to Tutor. New York: Arlington House.Bond, G. W & Smith G. J. (1979). Homework in the Elementary School.
The National Elementary Principal. 45(3), 46 -50.Borg , W R & Gall, M.D (1989). Educational research: An introduction. (5th
Ed.). New York: Longman.Braun. C. (1976). Teacher expectation: sociopsychological dynamics. Review
of Educational Research. (46). pp. 185-213.Brophy, J. E. & Good, T.L. (1974). Teacher - student relationships: causes and
consequences. New York: Holt, Rinehart and Winston.Bruce, F (1986) Raising school quality in developing countries. (Discussion
paper, 2. Washington DC. World Bank).
201
Bull, C. R., (1996, November 2). “Maths syllabi need overhaul.” (Nation Education supplement). Daily Nation. Nairobi. p21, col. 2-5.
Butler, F. A. (1969). Homework, In H. N. Rivlin& H. Schueler, (Eds.), Encyclopaedia of modern Education. N Y: Kennikat Press.
Butter-Por, N. (1987). Underachievers in School: Issues and Intervention. Chichester: John Wiley.
Caillods, F and Postlethwaite, T. N. (1989). “Teaching/Learning Conditions in Developing Countries”. Prospects: Quarterly Review of Education. 19(2). Paris: UNESCO.
Callahan , W.J (1971). “Adolescent Attitudes Towards Mathematics”.Mathematics Teacher, Vol. 66. No.4. pp. 751-55.
Carroll J. B., (1963). “A model of Learning”. Teachers College Record (New York). (64),.723-33.
Chege, D. (1992. July 4). “Why catholic schools excel.” Daily Nation, p 14. Christensen, D J. (1968). “The Effect of Discontinued Grade Reporting on
Pupil Learning” The Arithmetic Teacher. No 13, 724 - 726 Cockcroft W.H (chairman) (1982). Mathematics counts: a report of the
commission of inquiry into the teaching o f mathematics in schools. London: HMSO.
Coleman. J.S (1961). The adolescent society. New York: Free Press of Glencoe. Coleman, J., Campbell, E., Hobson, C., McPartland, J., Mood, A., Weinfield,
F., & York, R. (1966). Equality of educational opportunity. Washington DC.: Department o f Health, Education and Welfare Office.
Comber, L. C & Keeves, J.P . (1973). Science education in nineteen countries. Stockholm: Amqvist & Wiksell.
Cooper, C. R , & Petrosky, A. (1976). “Secondary school students’ perception of math teachers and math classes.” Mathematics Teacher, 69(3).
Cooper, H. (1989). Homework. New York: Longman.Costello, J. (1991). Teaching mathematics 11-16. London: Routledge.Coulter, F. (1979). Homework: A Neglected Research Area. British
Educational Research Joumal.5.(l), 21-33
202
Court, D , & Ghai, D. (Eds). (1974). Education. Society and Development. London: Oxford University Press.
Covington, (1983). Motivated cognitions, In S. G. Paris, G. M. Olson and H.W Stevenson (Eds ). Learning and motivation in the classroom. Hillsdale, N.J: Lawrence Erbaum Associates.
Cox W.F and Dunn, T.G (1979). Mastery learning: a psychological trap? Educational Psvhologist. 14. 24-29.
Crawshaw. J., & Chambers, J. (1984). A Concise Course in ' A' Level Statistics with worked Examples. Cheltenham: Stanley Thornes.
Cullen, F. I ., Cullen J. B., Hayhow.V.L., & Ploufe. J. T (1975). The Effects of the use of grades as an incentive. Journal o f Education Research. 68. 277-279
Curriculum Review. (1995, January). “Parents Oppose Happy Teaching Method”. No.34. p4.
Dacey, J.S. (1976). New Wavs to Learn: The Psychology o f Education. Connecticut: Greylock Publishers.
Daily Nation. ( 1991, February 23). Where learning is in the girls' preciousblood. [Nation Education Supplement).Daily Nation. (Nairobi), p. 19
Daily Nation. (1998, February 25). Worrying trends in Nationalexaminations.[editoriaI]. Daily Nation. (Nairobi. Kenya), p.6
Denham. C. & Lieberman, A.(1980). Time to learn. Washington, D.C: National Institute of Education.
Doane, B.S. (1972). The effects of homework and locus o f Control on arithmetic skills and achievement in Fourth Grade students.Doctoral Dissertation. New York University.
Dunn, T.G (1979). Mastery learning: a psychological trap? Educational Psychologist. 14. 24-29.
Dweck, C. S. & Bush, E.(1976). Sex differences in Learned Helplessness 1. Developmental Psychology, 12(2). 147-156.
Dweck, C. S.. Bush, E., Davidson,W., Nelson, S., & Enna, B. (1981). Sex differences in Learned helplessness, II and III, Developmental Psychology, 14(3), 268-276.
203
Eggen, P. and Kauchak, D. (1997). Windows on classrooms. 3rd edition. Englewood Cliffs, NJ: Prentice-Hall.
Emmer, E. T., Evertson, C., Sanford, J., Clements, B. S., & Worsham, W.E. (1984) Classroom management for secondary school teachers. Englewood Cliffs, NJ. Prentice-Hall.
Emmerich , H. J. (1978). “The Influence of Peers On Choices Made ByAdolescents”. Journal of Youth And Adolescence. 7(21. Pp 175-180.
Ernest, T. (1989). Mathematics teaching: the state of the art. London: Palmer.Eshiwani, G. S. (1974). “Sex differences in the learning of Mathematics
among Kenya high school students.” Mathematics Education Research Report No. 3, University of Nairobi.
Eshiwani, G. S. (1981, June). Mathematics Education in Kenya since 1960:Ideas and realization. Proceedings of The First East African Symposium On Pure And Applied Mathematics And Mathematics Education. - Proceedings Section D - Mathematics Education. Nairobi, 8 -10 June.
Eshiwani, G. S. (1982). Science and mathematics education in Kenya: itsrelevance in learning and living. Nairobi: BERC, Kenyatta University.
Eshiwani, G. S. (1983). Factors influencing performance among primaryand secondary school pupils in western province o f Kenya. Nairobi: Bureau of Educational Research, Kenyatta University.
Eshiwani, G. (1987). “Tuition: The good and the bad”.Daily Nation, August 29.Fagerlind I. & Leal C. L. (1981). Mathematics in Portugal: the influence of the
school and the family environment on results in grade 7,8, and 9, University of Stockholm: Institute of International Education.
Fagerlind, I. & Saha. L. (19831 Education and national development: A comparative perspective. Pergemu press.
Fehlen, J.E (1973). A Study of selected variables associated with masterylearning in a college Mathematics course for prospective elementary
school teachers. Unpublished Doctoral Dissertation. University of Minnesota.
204
Fennema, E. (1981). The sex factor: real or not in Mathematics Education, in Fennema, (E d ). Mathematics Education research: Implications for the 80s. Washington D.C: Association for Supervision and Curriculum
Development.Fennema, E., Wolleat, P L., Pedro J D., & Becker A. D. (1981). Increasing
women’s participation in mathematics: an intervention study. Journal of Research in Mathematics Education. (12). Pp. 3-14
Fisher C, Berliner D C, (Eds.) (1985). Perspectives on instructional time. N.Y.: Longman.
Fisher C, Berliner D C, Filby N, Marliave R. Cahen L, and Dishaw M . (1980). Teaching behaviours, academic learning time and student achievement: An Overview in C. Denham, A. Lieberman (eds). Time to learn. Washington, DC.: National Institute o f Education, pp.7-32.
Fleischmann, J. R. (chairman) (1973). Report on the quality, cost and financing of elementary and secondary school education in New York.fFleischmann Report). New York: Viking press.
Freemont ,H (1975). “Diagnosis: an active approach.” The Mathematics Teacher 68 (4).
Fox, J. & Brody, L & Tobin, D (1981). Women and Mathematics. New York: John Hopkins University Press.
Galloway, D„ Leo, E., Rogers, C., & Armstrong, D. (1996). Maladaptivemotivational style: the role of domain specific task demand in English and Mathematics. British Journal of Education. 66. 197-207.
Garber, J. (19701. The Home Environment Review. Gainsville, Florida. Institute for the Development of Human Resources.
Giannotes, K.K (1989). Cumulative versus massed practice in algebra.No.AA18918211. University o f South Florida Dissertation Abstracts International, 1987 -1991.
Godia. George (1981). A comparative study o f the effects of achievement and changes in attitude toward mathematics and attrition rates of students enrolled in the Freshman Remedial Arithmetic Course under two different instructional approaches. Unpublished Doctoral
205
Dissertation. Ohio University.Goldstein, A. Does homework help? A review o f research. Elementary School
Journal. 60. 212-224.Good T. L. & Brophy, J. E. (1974). Teacher student relationships: causes and
consequences. New York: Holt, Rinehart and Winston.Good, T. L. & Brophy, J. E. (1987). Looking in Classrooms. (4th edition). New
York: Harper and Row.Grambs, J. D & Carr, J. C. (1979). Modem methods in secondary education.
New York: Holt, Rinehart and Winston.Gray, J H. (1974). Assessment as a source of Feedback to Teacher and Pupil
in C. R. Sutton, & J. T. Hayson, (Eds ). The Art of the Science Teacher. London: McGraw-Hill.
Graybill, L. (1975). Sex differences in problem solving Journal o f Research In Science Teaching. 12(4). 341-346 .
Griffin. G. (1996). School masterv: straight talk on boarding school management. Nairobi: Lectern Publications.
Gunga S. G (1998). Philosophy of mathematics and its pedagogicalimplications. Unpublished Doctoral dissertation. University of Nairobi.
Hackman, J R. & Oldham, G. R. (1976). Motivation through the design of work: a test of theory. Organizational Behaviour and Human Performance. 16, 250-276.
Haertel G. D, Walberg H. J, Junker L, Pascarella E. T (1981). Earlyadolescent sex differences in science learning: evidence from the National Association of Educational Progress. American Educational Research Journal. 18(3). 329 -341.
Haertel G.D, Walberg, H.J, Weinstein, T (1983). “ Psychological models of educational performance: A theoretical synthesis o f constructs."Review of Educational Research. 53(1), 75-91 .
Heinich. H„ Molenda, M„ Russell, J.D. (1990). Instructional media and the new technologies of instruction. 3rd Edition. New York: Macmillan.
Heyeman, S. P. & Loxely, W. A. (1982). Influences on Academic achievement across high and low income countries: A reanalysis of IEA data.
206
Sociology of Education. 55(1). 13-21.Howson A.G., & Kahane J. P. (eds.) (1986). School mathematics in the 1990’s
(ICMI study series) . Cambridge Press. International Commission of Mathematics Instruction
Hudson, J. A. (1965). A pilot study of the influence of home-works in Seventh Grade mathematics and attitude toward homework in Fayetteville Schools. Doctoral Dissertation, University of Arkansas. Ann Arbor Microfilms no 65- 8456.
Husen, T (1967). The international study of achievement in mathematics: a comparison of 12 countries. Stockholm: Almqvist and wiksell.
Husen, T., Saha, L. & Noonan, R. (1978). Teacher training and studentachievement in less developed countries. Washington, D C : World Bank.
ILEA. (1984). Improving secondary schools: Report of the committee on the curriculum and organisation of secondary schools. (Hargreaves Report, 1984). London: ILEA.
International Labour Office (1982). Paper qualification syndrome ( PQS) and unemployment of school leavers: a comparative sub-regional study. Addis-Ababa: Jobs and Skills Programme for Africa.
Ishiyama, I. F. & Chabassol, D J. (1985). Adolescents’ fear of socialconsequences of success as a function o f age and sex. Journal of Youth and Adolescence. 14(1). pp 37- 46.
Jaccard, J. (1983). Statistics for the behavioural sciences. Belmont, California: Wadsworth.
Jensen. K., Walker, S. (1989). Towards democratic schooling. Philadelphia: Open University Press.
Johnson, D A. (1957) Attitudes in the mathematics school. School Science and Mathematics, 2, 33-37.
Johnson , D A. & Rising G. R. (1972). Guidelines for teaching mathematics. (2nd ed ). Belmont, Calif.: Wadsworth.
Johnson, M. (1977). A Review of research methods in education. Chicago: Rand McNally.
207
Kamau , J. M. (2001). Determinants of learning achievement ineconomics in Kenyan secondary schools. Unpublished Doctoral Dissertation. University of Nairobi.
Karani, F. A., (1979). A study of the application of interaction analysis to the training o f pre-service teachers in Kenya. Unpublished Doctoral dissertation. University of Pittsburg.
Karugu, A M., (1978). The social origin of primary school student teachers in Kenya. Unpublished M.A. thesis. University of Nairobi.
Katz. D (1960). “The functional approach to the study of attitudes’. Public Opinion Quarterly, vol.24 pp. 163 -204.
Keeves. J.P.U994) National Examinations: design, procedures and reporting. Paris: UNESCO, International Institute for Educational Planning
Kenafric Industrial Services Ltd. (1991). Kenya's primary and secondary schools network. Nairobi: Choro Printers.
Kenya National Examination Council (2001). The Year 2000 KCSE examination candidates performance report. Nairobi, Kenya.
Kenya National Examination Council (2000). The Year 1999 KCSE examination candidates performance report. Nairobi, Kenya.
Kenya National Examination Council (1995). The Year 1993/1994 KCSE Mathematics report. . Nairobi, Kenya.
Kibanza, N. M. (1980). A study of some factors associated with performance in mathematics among F2 pupils in Kenya. Unpublished Master of Education. Thesis. Nairobi: Kenyatta University.
Kimamo C.K. (1996. October 28) Make mathematics easy to learn, (mailbox) Daily Nation October 28,1996. P7. Col 3-5.
Kimani, G. N (1991). A study of factors influencing achievement inMathematics among primary School in-service student teachers in Kenya. Unpublished Doctoral Dissertation. Nairobi: Kenyatta University.
Kirembu. J. K. (1991). A study of selected teacher factors related toperformance in Mathematics. Unpublished Master of Education thesis. Nairobi: Kenyatta University.
208
Klieband H. M. (1995). The persistence of drill and practice. In A.C. Omstein .Strategies for effective teaching. (2nd edition). Dubuque: Brown & Benchmark.
Kline, M. (1980) Why Johnnv can’t add: the failure of new maths. N.Y:St Martins Press.
Kranz, P.W, & Fishell, K (1976 ). The relationship between teachers’ perceptions of pupils and behaviours towards those pupils. Paper presented at the annual meeting of American Educational ResearchAssociation.
Kuku , A. O (1990). Mathematics. Science and African development.Nairobi: English Press.
Landa. L.N. (1974). Algorithmization in learning and instruction. Englewood Cliffs, N.J: Educational Technology Publications.
Leder, G. C., Gunstone, R. F. (1990). Perspectives on mathematics learning in International Journal of Educational research . Vol. 14 . No 2.
Lee. J., & Pruitt, K. W. (1979). Homework assignments: Classroom games or teaching tools? Clearing House. 53,(1). 31 -35.
Leinhardt, G„ Seewald A M., Engel, M. (1979) Learning what is taught: Sexdifferences in instruction. Journal of Educational Psychology, 71.432-39
Macbeath, J , & Turner, M. (1990). Learning out of school: Report of research study carried out at Jordanhill College. Glasgow: Jordanhill College
MalyamkonoT.L, Ishumi A.G. M, and Wells, S. J (1982). Higher education and development in East Africa: an East African universities project on the impact of overseas training on development. London : Heinemann Educational books
Manual for Jesuit High-School Administrators. (1957). (2nd edition). New York: Jesuit Educational Association.
Maundu, J. N. (1986). Student achievement in science and mathematics: A case study..Unpublished doctoral dissertation. Nairobi: Kenyatta University.
Marshall, P. M. (1983). Flomework and social facilitation theory in teachingelementary school mathematics. Ph.D dissertation, Stanford University.
209
Dissertation Abstracts International No. AA18314475.Mbatia, P. (1996). Provision of healthcare by the state in Kenya: a fragile state
Vs civil society. Unpublished doctoral dissertation. Indiana University.Mehrens W.A., & Lehman. I. J (1969). Standardized tests in education.
NewYork: Reinehart & Winston.Miruka. 0. (1991,October 19). Ending extra coaching is easier said than done.
(Nairobi! Daily Nation. p20.Moore, J F. (1984). Influence of locus of control and homework time for high
school seniors in remedial classes. Ph D dissertation, Duke University. Dissertation Abstracts International No. AA18513974.
Mosley, M.H & Smith, P J. (1982). What works in learning? Students provide the answers! Phi Delta Kappan. vol 64, No.4.
Moyana. R. (1991). Teaching English in Zimbabwean schools: The importance of preparation. Zimbabwe. Journal of Educational Research.Vol.3, No.3.
Mutunga, P. & Breakell, J. (1987) Mathematics Education. (Series on provision of Leadership of Leadership Training in Primary Teacher Education). Nairobi: Kenyatta University and University of London.
Muya, W. (1991, February 23). Why Alliance stays at the top. [EducationSupplement], Daily Nation. (Nairobi, Kenya). February 23, 1991. p. 18.
Muya, W (1996,October 12). Maths mass failure debacle. [Nation EducationSupplement]. Daily Nation. (Nairobi, Kenya). October 12, 1996. pp. 13. Col 1-6.
Mwangi, D. T (1986). Factors influencing performance and learning of Mathematics among secondary school students in Kenya. (KERA Report No.24). Nairobi: BERC, Kenyatta University.
Mwaniki, P M. (1994) An introduction to secondary school level mathematics: approach and correction symbols. Unpublished paper, Strathmore school, Nairobi.
210
Neale. D. C., Gill, N., & Tismer, W. (1979). Relationships between attitudes toward school subjects and school achievement. Journal o f Educational Research. (63). 232-237.
Nelson, R.R, Phelps, E.S. (1966). Investing in humans, technological diffusion and economic growth. The American Economic Review. 56, 69 - 95.
Nichter, R. (Ed ). (1984). A Study of UNESCO Science EducationImprovement Project in Africa: Project Problems. Science Education 68(4) pp. 381-386
Norusis, M. J. & SPSS Inc. (1990). SPSS Base system users guide. Chicago: SPSS Inc
Nvaga. G. M. (1997). Pupils performance and attitudes towards Art and Craft in Kenya’s 8-4-4 education system in Embu District.Unpublished doctoral dissertation. University of Nairobi.
OFSTED (1995). Homework report in primary and secondary schools.London : HMSO
Okinda, E. & Luciani, G.S. (1994) A Simplified guide on how to pass examinations. Nairobi: Worldlink Press.
Okumbe, J. 0. (1992). Levels of job satisfaction among graduate teachers in secondary schools in Siaya district and Kisumu town. Unpublished Doctoral dissertation. Nairobi: Kenyatta University.
Oliveira -Lima, L . de (1983) Teaching to learn. Prospects. 13(2). 145-158.Origa, J. G. 0. (2001). The impact of Constructivism on the learning of
geometry among girls in Kenyan secondary schools. Unpublished Ph. D thesis. University o f Nairobi
Otieno-Alego (1988). A Study of Junior Secondary School Pupils Competence In Some Selected Processes of Science. Unpublished Doctoral dissertation. Nairobi: Kenyatta University.
Ott, L. (1988). An introduction to statistical methods and data analysis. (3rd Edition).Boston: PWS-Kent.
Page, G. T., Thomas, J. B. (Eds.) (1979). International dictionary of Education.
211
London: Kogan Page.Patel, M. & Ayot. H. (1992) Instructional methods (General methods).
Nairobi: Educational Research and Publications Ltd.Pearson, P. D. & Tierney, R. (1983). In search o f a model of instructional
research in reading. In S.G. Paris , G.M. Olson and H.W. Stevenson (Eds ). Learning and motivation in the classroom. Hillsdale, N.J: Lawrence Erbaum Associates.
Pidgeon DA. (1967). Achievement in mathematics. Report of the First IE A Mathematics survey: achievement in mathematics. WindsonNFER
Postlethwaite T N (1967) School organisation and achievement: a study based on achievement in mathematics in twelve countries. Stockholm: Alqvist and Wiksell.
Prewit, K. (1975). Introductory Research Methods: East African applications. [Occsaional Paper No. 10], Nairobi: Institute for Development Studies, University of Nairobi.
Psacharopouios, G. & Loxely, W (1986). Diversified Secondary Schools. London: Oxford University Press.
Republic of Kenya. (1964). Kenya Education Report Part 2. Nairobi: Government Press
Republic of Kenya. (1976). Report of the National Committee on Educational Objectives. Nairobi: Government Press.
Republic of Kenya. (1984). National Development Plan, 1983-1988. Nairobi: Government Press.
Republic of Kenya. (1998). National Development Plan, 1997-2001. Nairobi: Government Press.
Republic of Kenya (1998). Statistical Abstracts. Nairobi: Central Bureau of Statistics.
Republic of Kenya. (2001). Statistical Abstracts. Nairobi: Central Bureau of Statistics.
Robitaile, D F & Donn, S. (1993). TIMMS: The third internationalMathematics and Science study. In M. Niss (Ed.). Investigations into assessment into mathematics education. Netherlands: Kluwer Academic
212
Rokeach ,Milton (1970). Beliefs, attitudes, and values: A Theory of Organisation And Change. San Francisco: Jossey-Bass.
Romiszowski, A.J., (1981). Designing instructional systems: Decision making course in curriculum development. London: Kogan Page.
Rono , R. C (1991). The effects of peer pressure on the educational achievement and occupational aspirations of Form 4 students in Kericho district. Unpublished Doctoral Dissertation. Nairobi: Kenyatta University.
Rosenshine, B. (1976). Recent research on teaching behaviours and student achievement. Journal of Teacher Education. 27. p 61 - 64
Rosenshine. B., Berliner, D C. (1978). Academic engaged time. British Journal of Teacher Education. 4 pp. 3 -1 6
Rosenthal ,R., Jacobson, L (1968). Pigmalion in the classroom. New York:HoltRowntree, D. (1982) Educational technology in curriculum development.
London: Harper and Row.Rutter. M. Maughan, B., Mortimore, P., Ouston, J (19791. Fifteen thousand
hours: secondary schools and their effect on children. London:Open Books.
Schiefelbein, E., & Simons, J. (1978). The determinants of school achievement: A review of research for developing countries. Ottawa, Canada: 1DRC
Schunk, D. (1987). Peer models and children’s behaviour change. Review of Educational Research 57. pp 149 - 174
Schunk, D. (1994, April). Goal and self evaluative influences during children’s mathematical skill acquisition. Paper presented at the Annual Meeting of the American Educational Research Association, New Orleans.
Scott-Hodgetts, R. (1986). Girls and Mathematics: the negative influences ofsuccess, In G.W Burton, Girls into maths can go. London:Holt, Rinehart &Winston.
Sears, J. (1966). Report o f the Workgroup on attitudinal and affective skills and Learning: Washington, D C: National Institute of Education.
Sells, L. W (1976). “The Mathematics filter and the education of women and minorities.” Paper Presented at the Annual Meeting of the American
213
Association for the Advancement of Science, Boston.Shiba, S. (1985). The excellent educational system for one and a half million
children. Journal of Programmed Learning and Educational Technology (PLETV 23.N0.4
Sidhu K. S. (1982). The teaching of mathematics. Revised edition. New Delhi: Sterling Publishers.
Skinner, B. F. (1961). Science and human behaviour. New York: Macmillan.Skinner, B.F. (1986). Programmed instruction. Phi Delta Kappa. 68. 103-110.Sifuna. D. N. (1989). Factors determining teaching effectiveness among
primary school teachers in Kenya. Unpublished doctoral Dissertation, University of Nairobi.
Simons. J. & Alexander, L. (1980). Factors which promote school achievement in developing countries. In Simons, J. (Ed.), The education dilema:
policy issues for developing countries in the 80s. Oxford: Pergamon.Simon , J. L 1978.Basic research methods in social sciences: The art of
empirical investigation 2nd Edition. New York: Random House.,,Smuthers, A. (1990). “A Teacher”. The Journal of Educational Administration
.Management and Policy. Vol.176. No. 15.Sommerset H.C.A (1969). Educational aspirations of fourth Form pupils in
Kenya. (IDS Discussion Paper no. 117.) in D Court and D Ghai (Eds.) (1974). Education and development: New perspectives from Kenya. Nairobi: Institute of Development Studies, University o f Nairobi
Spandano, J. W. (1996). Examining a homework model as a means ofunderstanding and responsibility in secondary mathematics education. Doctoral dissertation. University of Lowell. Dissertation Abstracts Interational No. AA19702162.
Stallings, J. & Kaskowitz, D. (1974). Follow through classroom observed. 1972-1974. (SRI Project, URU-7370). Stanford. Calif: Stanford Research Institute.
Standard (1992, June 9). Mathematics performance should be improved. The Standard. (Nairobi), p. 8
Stiggins, R. (1994). Student centred classroom assessment. Upper Saddle, N.J:
214
MerillStem, J. (1995). Learning to teach. London: David Foulton.Strang, R.S. (1968). Guided study and homework: What research savs to the
teacher. Washington, D C.: National Education Association.Suchman, S (1976). Quantitative studies in social relationships: applied
Sampling. New York Academic Press.Talton, L. E. & Simpson R. D. (1985). Relationship between peer influence
and individual attitudes toward Science among adolescent students. Science Education. 69(1). 19-24.
TenBrinkeD P. (19671. Homework: an experimental evaluation of the effect on achievement in Mathematics in Grade Seven and Eight. Doctoral dissertation, Univ. of Nebraska. University Microfilms No. 71-19521.
Thorndike. E. L (1927). The measurement o f intelligence. N Y: Columbia University, Teachers College Press.
Tsuma G.K.O (1996, October 19). Convene a national seminar to discuss mass failure. Daily nation October 19. pi 7, col 3-6
Tuckman. H. P. (1971). High school inputs and their contribution to school performance. The Human Resources Journal. Vol. 6. pp. 490 - 509.
Twoli, N. T. (1986). Sex differences in Science achievement among secondary school students in Kenya. Unpublished Doctoral Dissertation. Flinders University of South Australia.
Vaigo. A. C (1973,May 13). The Swedish experiment: What went wrong. Times Educational Supplement (London).
V ogel, M.P (sr.) (1998). School report for 1998 in Precious Blood secondary school. Secret of Success, [souvenir brochure],
Wahome, J. (1996, Nov 6) How to improve maths grades. (Mailbox) Daily Nation, November 6. P7 col 3-5.
Wall, W.D. (1987). Constructive education for adolescents. Paris: UNESCO and London: George G Harrap.
Weekly Review. (1984: February 10). Why the good results for Alliance. Weekly Review. (Nairobi: Kenya).
Weiner, B. (1977). A theory of motivation for some classroom experiences.
215
Journal of Educational Psychology 71. pp 3-25 Weisbrod, B. A (1970). Investment in human capital, in R.L Melvin and S.
Alan, (Eds ). Educational investment in urban society: Costs benefits and public policy New York: Teachers College Press, pp.71-88
Whitcraft , L. H (1980). Remedial work in high school mathematics.Mathematics Teacher. Vol. 73. No l
Willoughby, S. S (1985). Contemporary teaching of secondary school Mathematics. N.Y: John Wiley.
Whyte, J (1984). Encouraging girls into Science and Technology: SomeEuropean initiatives. (Science and Technology Document Series, No.7). Paris: UNESCO.
Wolfe, R G & Raphael, D. (1985). Reports o f homework assignment around the world: Results from the 2nd International Mathematics Study . Toronto, Canada: Ontario Institute for Studies in Education.
Youngman, M B. (1980). Some Determinants o f Early Secondary School Performance. British Journal of Educational Psychology. Vol. 50 pp.43-52.
Yunker, B (1970, May) The Powers of positive teaching. Family Circle. (6).
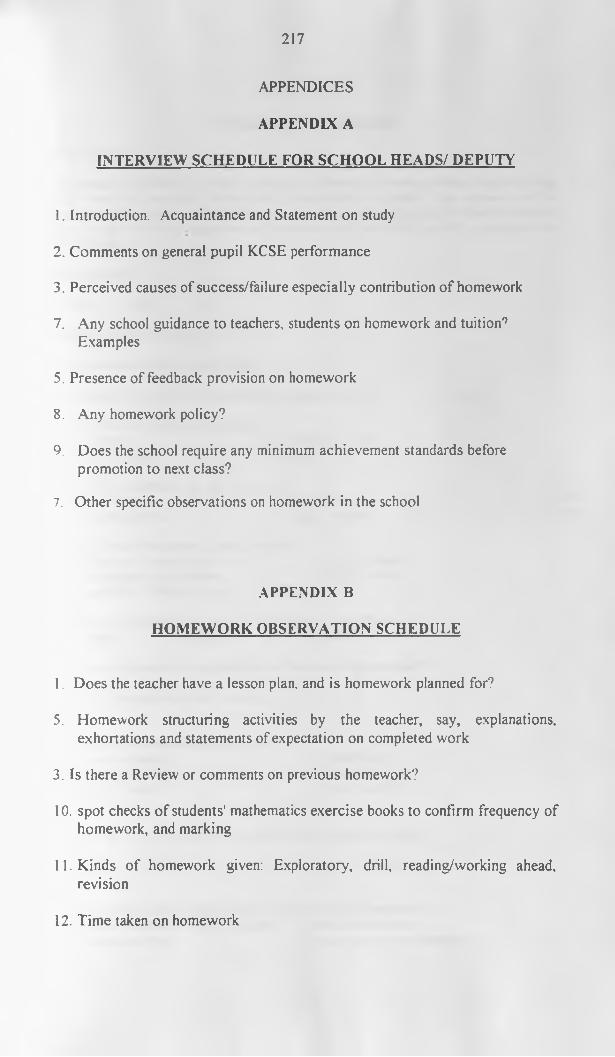
217
APPENDICES APPENDIX A
INTERVIEW SCHEDULE FOR SCHOOL HEADS/ DEPUTY
2.3.7.
5.8 .
9.
7.
1. Introduction. Acquaintance and Statement on studyComments on general pupil KCSE performancePerceived causes of success/failure especially contribution of homework
Any school guidance to teachers, students on homework and tuition9 Examples
Presence of feedback provision on homework Any homework policy?Does the school require any minimum achievement standards before promotion to next class?Other specific observations on homework in the school
APPENDIX BHOMEWORK OBSERVATION SCHEDULE
I. Does the teacher have a lesson plan, and is homework planned for?5. Homework structuring activities by the teacher, say, explanations,
exhortations and statements of expectation on completed work3. Is there a Review or comments on previous homework?10. spot checks of students' mathematics exercise books to confirm frequency of
homework, and markingII. Kinds of homework given: Exploratory, drill, reading/working ahead,
revision12. Time taken on homework
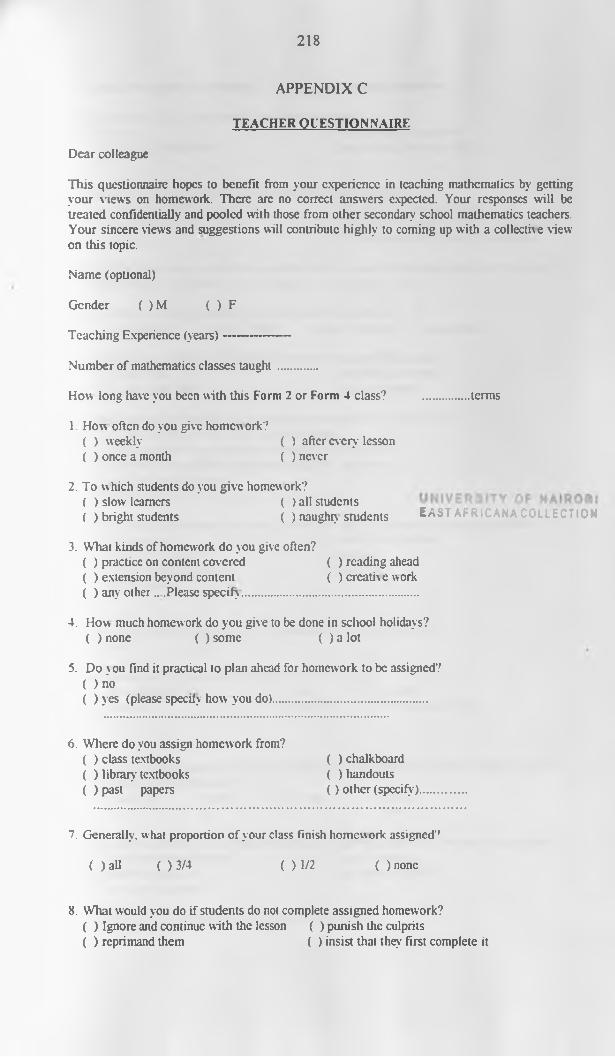
218
APPENDIX CTEACHER QUESTIONNAIRE
Dear colleagueThis questionnaire hopes to benefit from your experience in teaching mathematics by getting your views on homework. There are no correct answers expected. Your responses will be treated confidentially and pooled with those from other secondary school mathematics teachers. Your sincere views and suggestions will contribute highly to coming up with a collective view on this topic.Name (optional)Gender ( )M ( ) FTeaching Experience (years)----------------Number of mathematics classes taught .............How long have you been with this Form 2 or Form 4 class? ............... terms1 How often do you give homew ork?
( ) weekly ( ) after every lesson( ) once a month ( ) never
2. To w hich students do you give homework?( ) slow learners ( ) all students( ) bright students ( ) naughty students EAST AFRICANA COLLECTION
3. VVhat kinds of homework do you give often?( ) practice on content covered ( ) reading ahead( ) extension beyond content ( ) creative work( ) any other .. .Please specify..........................................................
4. How much homework do you give to be done in school holidays?( ) none ( ) some ( ) a lot
5. Do y ou find it practical to plan ahead for homework to be assigned?( ) no( ) yes (please specify how you do)..................................................
6. Where do you assign homework from?( ) class textbooks ( ) chalkboard( ) library textbooks ( ) handouts( ) past papers ( ) other (specify)
7. Generally, what proportion of your class finish homew ork assigned'’ ( ) all ( ) 3/4 ( ) 1/2 ( ) none
8. What would you do if students do not complete assigned homework?( ) Ignore and continue with the lesson ( ) punish the culprits( ) reprimand them ( ) insist that they first complete it
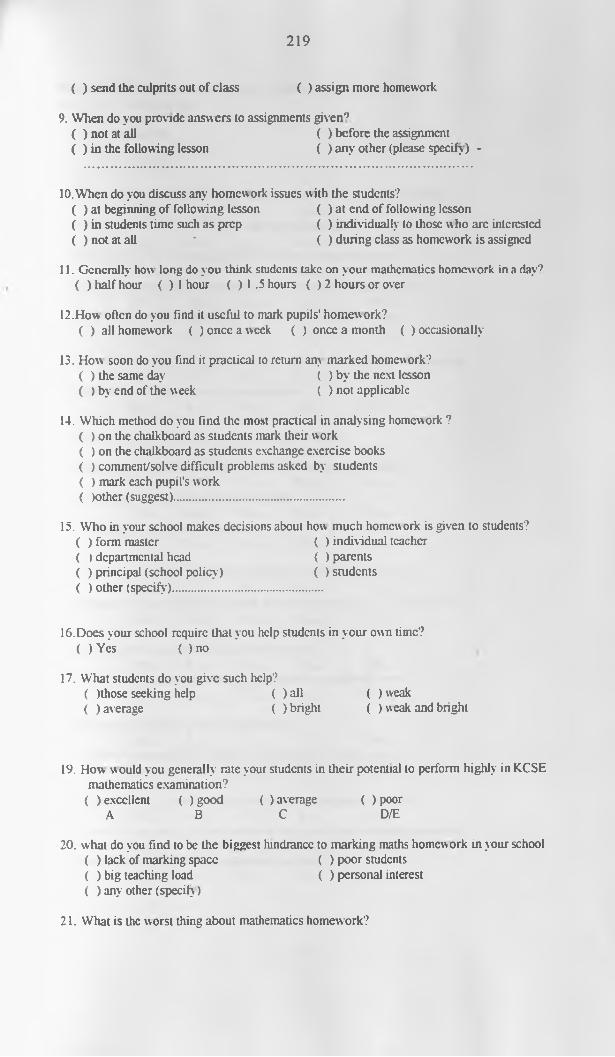
219
( ) send the culprits out of class ( ) assign more homework9. When do you provide answers to assignments given9
( ) not at all ( ) before the assignment( ) in the following lesson ( ) any other (please specify ) -
10. When do you discuss any homework issues with the students?( ) at beginning of following lesson ( ) at end of following lesson( ) in students time such as prep ( ) individually to those w ho arc interested( ) not at all * ( ) during class as homework is assigned
11. Generally how long do you think students take on your mathematics homework in a day9 ( ) half hour ( ) 1 hour ( ) 1 .5 hours ( ) 2 hours or over
12. How often do you find it useful to mark pupils' homework?( ) all homework ( ) once a week ( ) once a month ( ) occasionally
13. How soon do you find it practical to return any marked homework?( ) the same day ( ) by the next lesson( ) by end of the week ( ) not applicable
14. Which method do you find the most practical in analysing homework ?( ) on the chalkboard as students mark their work( ) on the chalkboard as students exchange exercise books ( ) comment/solve difficult problems asked by students ( ) mark each pupil's work ( )other (suggest).......................................................
15. Who in your school makes decisions about how much homework is given to students?( ) form master ( ) individual teacher( ) departmental head ( ) parents( ) principal (school policy) ( ) students( ) other (specify).................................................
16. Does your school require that you help students in your own time?( ) Yes ( ) no
17. What students do you give such help?( )those seeking help ( ) all ( ) weak( ) average ( ) bright ( ) weak and bright
19. How would you generally rate your students in their potential to perform highly in KCSEmathematics examination?
( ) excellent ( ) good ( ) average ( ) poor A B C D/E
20. what do you find to be the biggest hindrance to marking maths homework in your school( ) lack of marking space ( ) poor students( ) big teaching load ( ) personal interest( ) any other (specify)
21. What is the worst thing about mathematics homework?
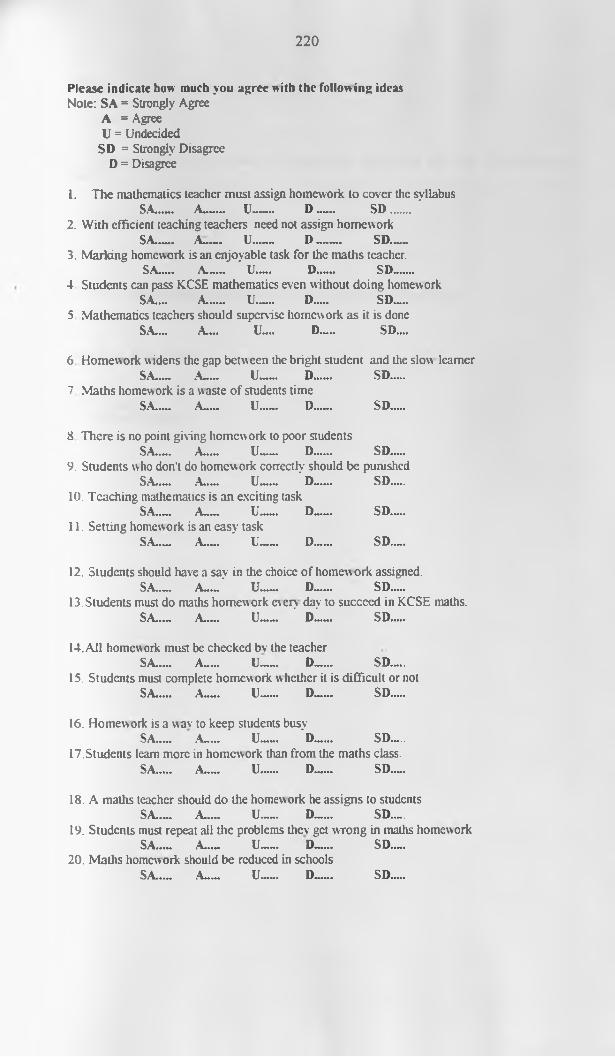
220
Please indicate how much you agree w ith the follow ing ideasNote: SA = Strongly Agree
A = Agree U = Undecided
SD = Strongly Disagree D = Disagree
1. The mathematics teacher must assign homework to cover the syllabusSA.__ A.___ U----- D ...... S D ......
2. With efficient teaching teachers need not assign homeworkSA.__ A...... U----- D ------ SD__
3. Marking homework is an enjoyable task for the maths teacher.SA..... A...... U..... D...... SD.......
4 Students can pass KCSE mathematics even without doing homeworkSA.... A...... U— D— SD
5 Mathematics teachers should supervise homework as it is doneSA.... A.... U™ D..... SD....
6 Homework widens the gap between the bright student and the slow learnerSA.™ A___ U__ D— SD.....
7 Maths homew ork is a w aste of students timeSA..... A...... U™.. D....... SD....
8 There is no point giving homework to poor studentsS A ..../ A___ U___ D..... SD....
9. Students who don't do homework correctly should be punishedSA..... A...... U...... D....... SD.....
10. Teaching mathematics is an exciting task SA™. A___ U— D— SD.....
11. Setting homework is an easy taskSA.™ A™. U___ D— SD.....
12. Students should have a say in the choice of homework assigned.SA™. A___ U__ D...... SD.—
13 . Students must do maths homework every day to succeed in KCSE maths. SA.™ A___ U__ D..... SD™.
14. All homework must be checked bv the teacherSA.™ A___ U.™. D...... SD.....
15. Students must complete homework whether it is difficult or notSA..... A___ U— D...... SD.....
16. Homework is a wav to keep students busySA.™ A___ U— D....... SD™.
17. Students leam more in homework than from the maths class.SA™. A...... U...... D....... SD....
18. A maths teacher should do the homework he assigns to studentsSA™. A___ U— D....... SD....
19. Students must repeat all the problems thev get wrong in maths homeworkSA..... A__ U— D...... SD.....
20. Maths homework should be reduced in schoolsSA..... A___ U— D....... SD....
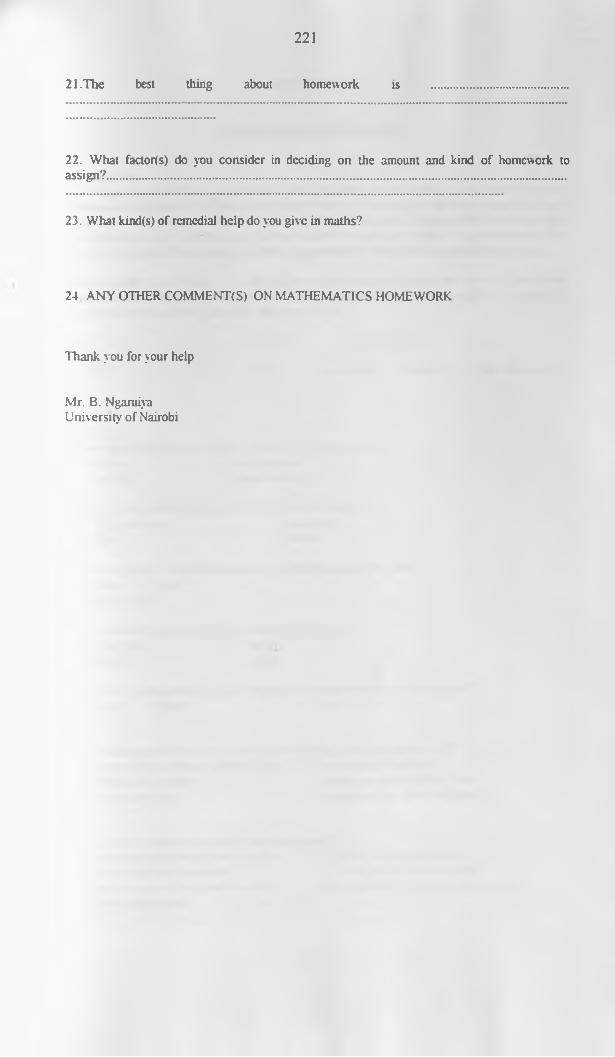
221
21. The best thing about homework is
22. What factors) do you consider in deciding on the amount and kind of homework toassign?......................................................................................................................................................
23. What kind(s) of remedial help do you give in maths?
24 ANY OTHER COMMENT(S) ON MATHEMATICS HOMEWORK.
Thank you for your help
Mr. B. Ngaruiya University of Nairobi
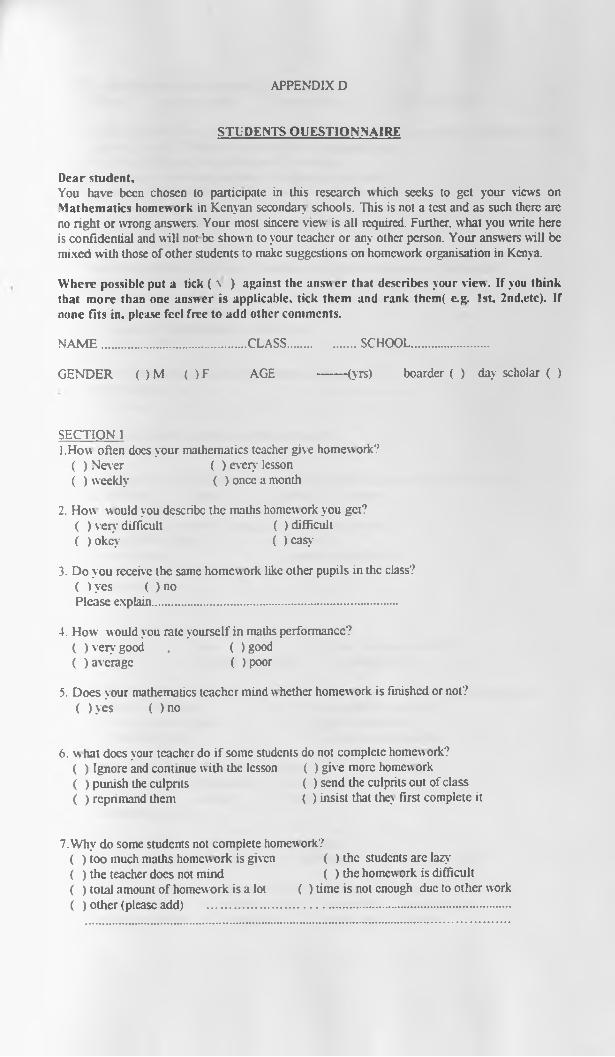
A PPE N D IX D
STUDENTS QUESTIONNAIRE
Dear student.You have been chosen to participate in this research which seeks to get your views on M athematics homework in Kenyan secondary schools. This is not a test and as such there arc no right or wrong answers. Your most sincere view is all required. Further, what you write here is confidential and will not be shown to your teacher or any other person. Your answers will be mixed with those of other students to make suggestions on homework organisation in Kenya.W here possible put a tick ( \ ) against the answer that describes your view. If you think that more than one answer is applicable, tick them and rank them( e.g. 1st, 2nd.etc). If none fits in. please feel free to add other comments.N A M E ...............................................CLASS...................... SCHOOL...........................GENDER ( ) M ( ) F AGE ------ -(yrs) boarder ( ) day scholar ( )
SECTION 11. How often docs your mathematics teacher give homework?
( ) Never ( ) every lesson( ) weekly ( ) once a month
2. How would you describe the maths homework you get?( ) very difficult ( ) difficult( ) okey ( ) easy
3. Do you receive the same homework like other pupils in the class?( )yes ( )noPlease explain................................................................................
4. How would you rate yourself in maths performance?( ) very good . ( ) good( ) average ( ) poor
5. Does your mathematics teacher mind whether homework is finished or not? ( )yes ( ) no
6. what does your teacher do if some students do not complete homew ork?( ) Ignore and continue with the lesson ( ) give more homew ork( ) punish the culprits ( ) send the culprits out of class( ) reprimand them ( ) insist that they first complete it
7. Why do some students not complete homework?( ) too much maths homework is given ( ) the students arc lazy( ) the teacher does not mind ( ) the homework is difficult( ) total amount of homework is a lot ( ) time is not enough due to other work ( ) other (please add) ...................................................................................................
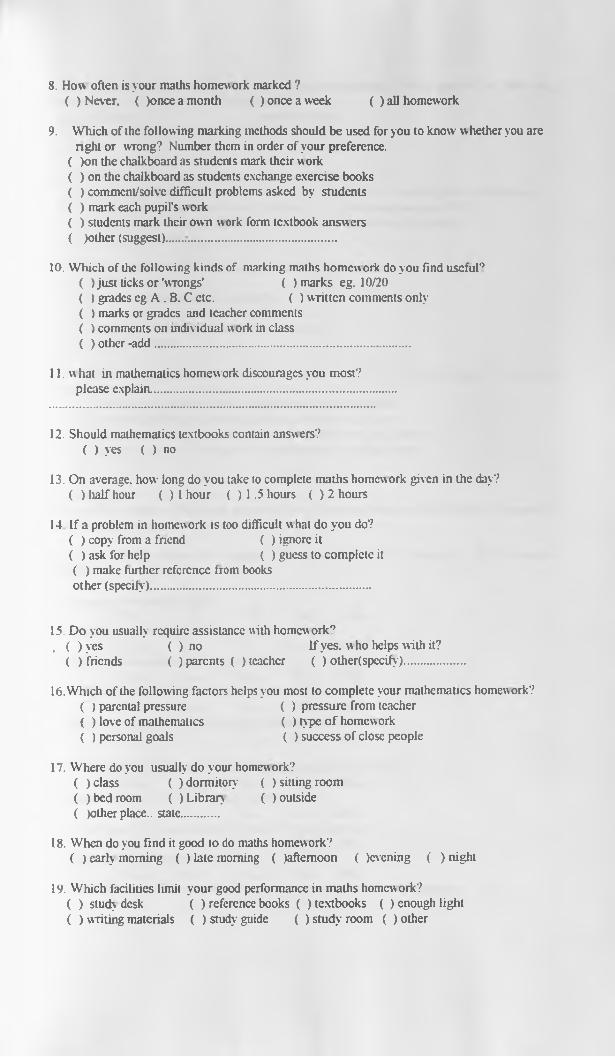
8. How often is your maths homework marked ?( ) Never, ( )once a month ( ) once a week ( ) all homework
9. Which of the following marking methods should be used for you to know w hether you are right or wrong? Number them in order of your preference.
( )on the chalkboard as students mark their work ( ) on the chalkboard as students exchange exercise books ( ) commcnt/solvc difficult problems asked by students ( ) mark each pupil's w ork( ) students mark their own work form textbook answers ( )other (suggest)..... ..................................................
10. Which of the following kinds of marking maths homew ork do you find useful"’( ) just ticks or'wTongs' ( ) marks eg. 10/20( ) grades eg A . B. C etc. ( ) wiittcn comments only( ) marks or grades and teacher comments ( ) comments on individual work in class ( ) other -add...................................................................................
11. w hat in mathematics homework discourages you most?please explaia...............................................................................
12. Should mathematics textbooks contain answers?( ) yes ( ) no
13. On average, how long do you take to complete maths homework given in the day? ( ) half hour ( ) 1 hour ( ) 1.5 hours ( ) 2 hours
14 If a problem in homework is too difficult w hat do you do?( ) copy from a friend ( ) ignore it( ) ask for help ( ) guess to complete it( ) make further reference from books other (specify)........................................................................
15. Do you usually require assistance with homew ork"’, ( ) yes ( ) no If yes. w ho helps with it?
( ) friends ( ) parents ( ) teacher ( ) other(speedy)....................16. Which of the following factors helps you most to complete your mathematics homework?
( ) parental pressure ( ) pressure from teacher( ) love of mathematics ( ) type o f homew ork( ) personal goals ( ) success of close people
17. Where do you usually do your homework?( ) class ( ) dormitory ( ) sitting room( ) bed room ( ) Library ( ) outside( )other place., state............
18. When do you find it good to do maths homework?( ) early morning ( ) late morning ( )aflemoon ( Jevcning ( ) night
19. Which facilities limit your good performance in maths homework?( ) study desk ( ) reference books ( ) textbooks ( ) enough light( ) writing materials ( ) study guide ( ) study room ( ) other
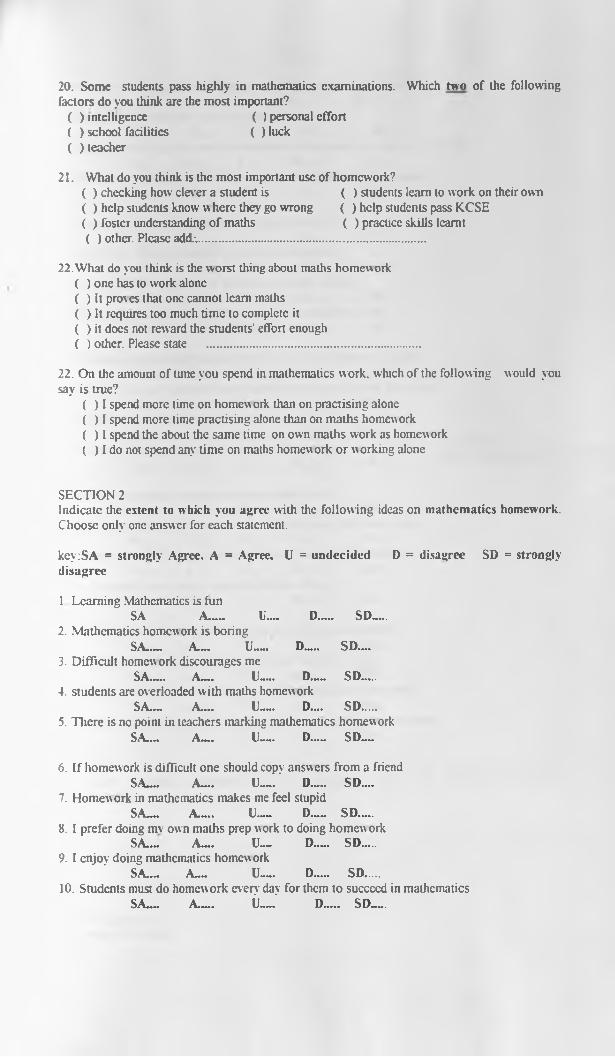
20. Some students pass highly in mathematics examinations. Which two of the following factors do you think are the most important?
( ) intelligence ( ) personal effort( ) school facilities ( ) luck( ) teacher
21. What do you think is the most important use of homework?( ) checking how clever a student is ( ) students learn to work on their own( ) help students know w here they go wTong ( ) help students pass K.CSE( ) foster understanding of maths ( ) practice skills learnt( ) other. Please add.-...........................................................................
22. What do you think is the worst thing about maths homework ( ) one has to work alone( ) It proves that one cannot learn maths ( ) It requires too much time to complete it ( ) it does not reward the students' effort enough ( ) other. Please state ......................................................................
22. On the amount of tune you spend in mathematics work, which of the following would you say is true?
( ) I spend more time on homew ork than on practising alone ( ) I spend more time practising alone than on maths homework ( ) I spend the about the same time on own maths work as homework ( ) I do not spend any time on maths homew ork or working alone
SECTION 2Indicate the extent to which you agree with the following ideas on mathematics homework. Choose only one answer for each statement.key:SA = strongly Agree, A = Agree, U = undecided D = disagree SD = strongly disagree1 Learning Mathematics is fun
SA A___ U— D..... SD—.2. Mathematics homework is boring
SA__ A™ U—. D.— SD....3. Difficult homework discourages me
SA..... A.... U_... D..... SD.....4. students are overloaded with maths homework
SA..- A.... U—. D.„. SD.....5. There is no point in teachers marking mathematics homework
SA.... A__ U—. D..... SD—6. If homework is difficult one should copy answ ers from a friend
SA— A.... U..... D..... SD—7. Homework in mathematics makes me feel stupid
SA— A—. U..... D..... SD.....8. I prefer doing mv own maths prep work to doing homew ork
SA— A— U— D— SD.....9. I enjoy doing mathematics homew ork
SA— A— U—. D SD 10. Students must do homework every day for them to succeed in mathematics
SA— A—. U—. D SD—.
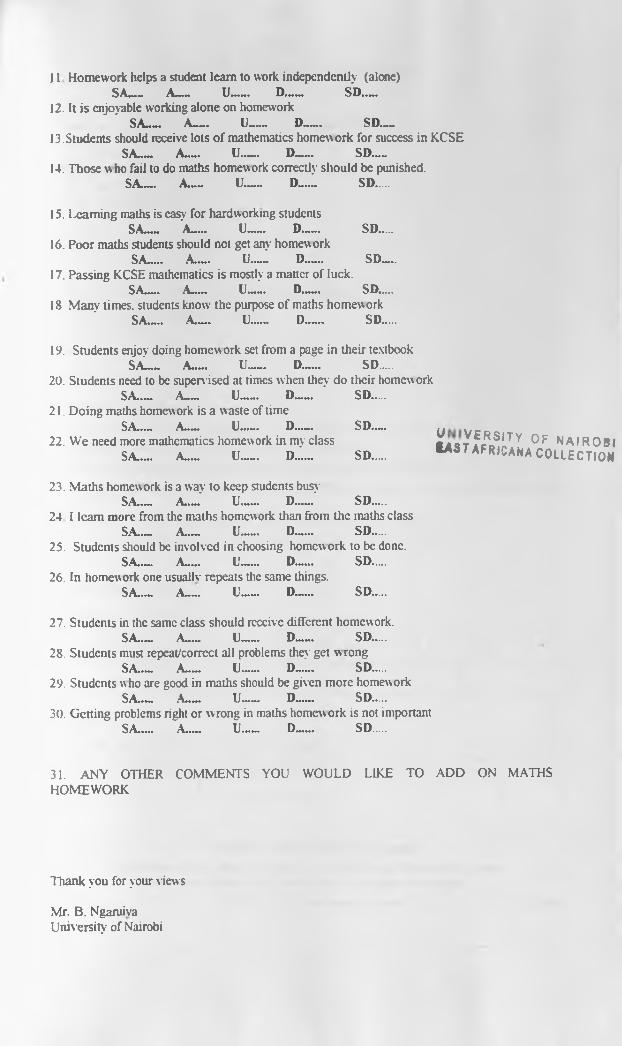
11 Homework helps a student leant to work independently (alone)SA A U___ D...... SD—
12. It is enjoyable working alone on homeworkSA__ A__ U___ D— SD___
13 . Students should receive lots of mathematics homework for success in KCSE SA A™. U...... D— SD.—
14. Those w ho fail to do maths homework correctly should be punished.SA A..... U— D...... SD
15. Learning maths is easy for hardworking studentsSA__ A..... U— D— SD.....
16. Poor maths students should not get any homew orkSA__ A..... U— D— SD™.
17. Passing KCSE mathematics is mostly a matter of luck.SA.__ A..... U....... D...... SD.....
18 Many times, students know' the purpose of maths homeworkSA__ A.— U— D— SD
19. Students enjoy doing homework set from a page in their textbookSA..... A..... U___ D...... SD.....
20. Students need to be supervised at times when they do their homeworkSA.™ A U___ D— . SD
21. Doing maths homew ork is a waste of timeSA..... A. U___ D...... SD.—
22. We need more mathematics homework in my classSA..... A.™ U— D...... SD.....
23. Maths homework is a way to keep students busySA.™ A.™ U— D....... SD....
24 I learn more from the maths homework than from the maths class SA.™ A.__ U___ D...... SD....
25. Students should be involved in choosing homework to be done.SA___ A™. U___ D...... SD.....
26. In homework one usuailv repeats the same things.SA.™ A___ U__ D— SD.....
27. Students in the same class should receive different homework.SA.™ A___ U— D— SD.....
28. Students must repeat/correct all problems they get w rongSA.™ A___ U— D....... SD....
29. Students who are good in maths should be given more homeworkSA A U— D— SD
30. Getting problems right or wrong in maths homework is not importantSA™. A___ U___ D— SD.....
31. ANY OTHER COMMENTS YOU WOULD LIKE TO ADD ON MATHS HOMEWORK
iufLVtlll 0F "A'KOBI •a s t a f r i c a n a c o i l e c t i o m
Thank you for your viewsMr. B. Ngaruiva University of Nairobi
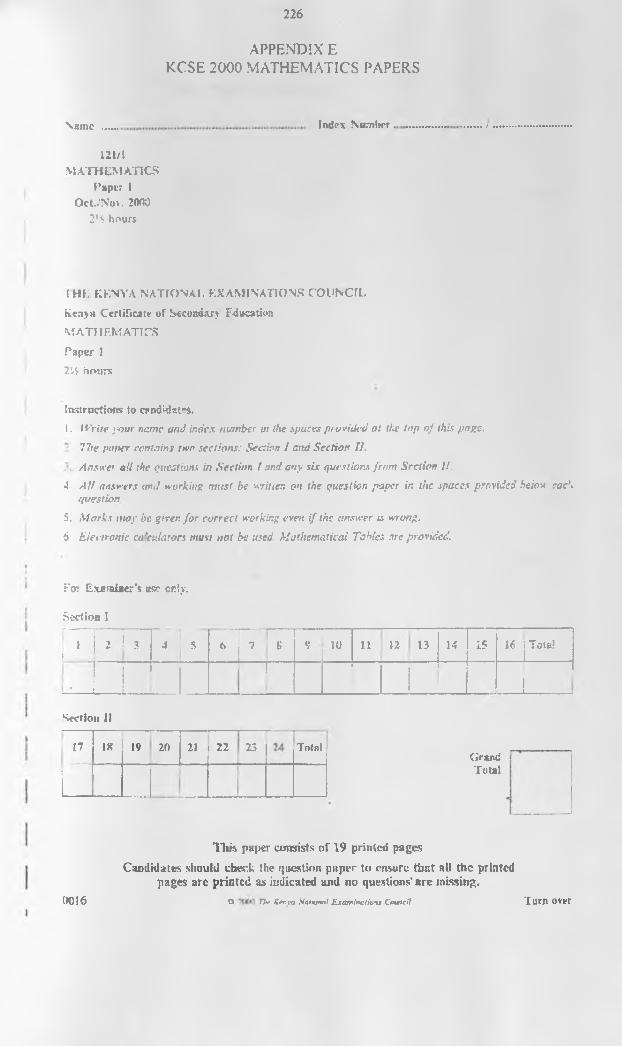
226
APPENDIX EKCSE 2000 MATHEMATICS PAPERS
Name __ Index NuhiIkt ................ .121/1
MATHEMATICS Paper I
Oct-'No». 2000 2,/: hours
I HE KENYA NATIONAL EXAMINATIONS COUNCIL Kenya Certificate of Secondary EducationMATHEMATICS Paper 17V, hours
Instructions to candidates.i . Write jiour name and index number ut the spaces provided a: the top of this page.
The patter contains two sections: Section / and Section II.Answe’ ail the questions in S'ectior. / and any six questions from Section II.
•I AU answers and working must be written on the question paper in the spaces provided beioa each question
5. Marks may be given for correct working even if the answer is wrong.6 b ic e ironic ca’cuiarors must not be used. Mathematical Tabic .: are provid ed .
To: Examiner's esc cr.iy. Section I
1 1 2 I 3•
4 s‘ j p 8 *; 10 u 12 13 14 15 16 : Total!
. 1 !!
_ J _______
(Irani!Total
Section II
*18 19 20 21 22
..13 Total
iThis paper consists of 19 printed pages
Candidates should check the question paper to ensure that nil the printed pages are printed as indicated and no questions' sre missing.
0016 O 77m Krrya Sat tonal Examine lions Council T u rn over
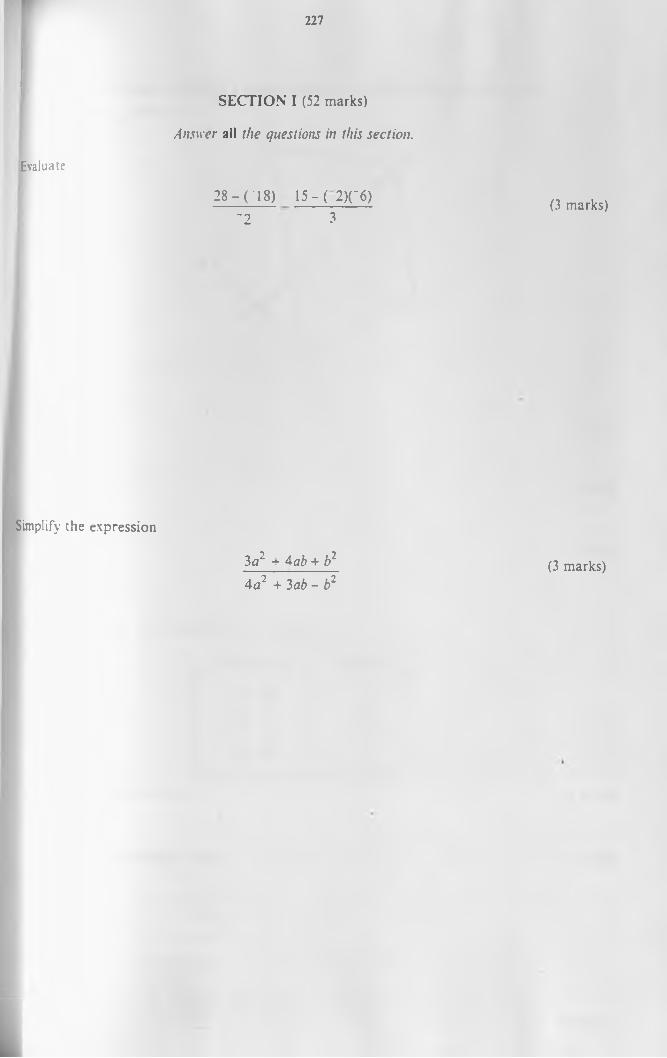
227
SECTION I (52 marks)A n sw er all th e qu estio n s in th is se c tio n .
Evaluate
28-("1 8) 15 - ( 2)(~6)"2 3 (3 marks)
Simplify the expression3a2 + 4 ab + b2 4 a 2 + la b - b2
(3 marks)
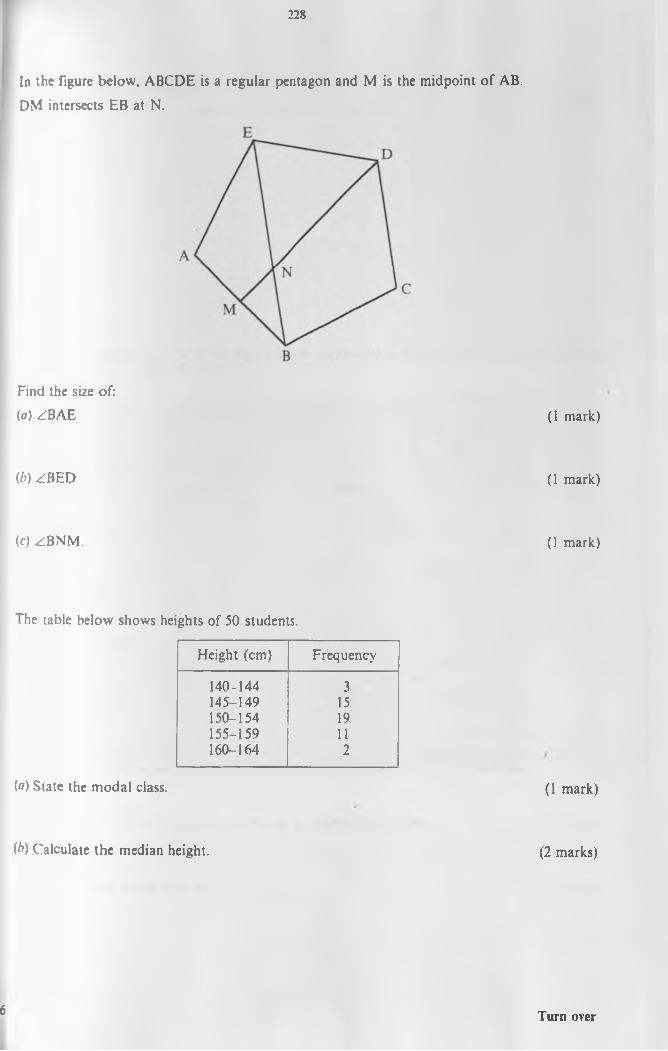
228
In the figure below, ABCDE is a regular pentagon and M is the midpoint of AB.DM intersects EB at N.
Find the size of: (a) ZBAE
(b) ZBED
(c) ZBNM.
The table below shows heights of 50 students.Height (cm) Frequency
140-144 3145-149 15150-154 19155-159 11160-164 2
(a) State the modal class.
(b) Calculate the median height.
(1 mark)
(1 mark)
(1 mark)
(1 mark)
(2 marks)
6 Turn over
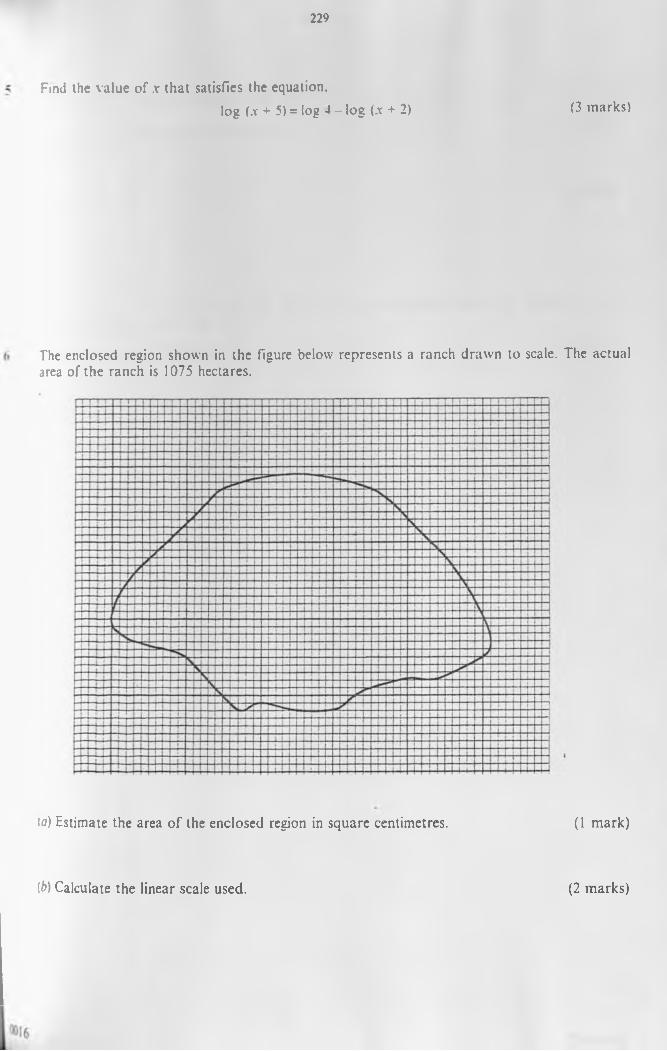
229
Find the value of x that satisfies the equation.log (.x + 5) = log 4 - log (.x + 2) (3 m ark s)
The enclosed region shown in the figure below represents a ranch drawn to scale. The actual area of the ranch is 1075 hectares.
(fl) Estimate the area of the enclosed region in square centimetres. (1 mark)
(b) Calculate the linear scale used. (2 marks)
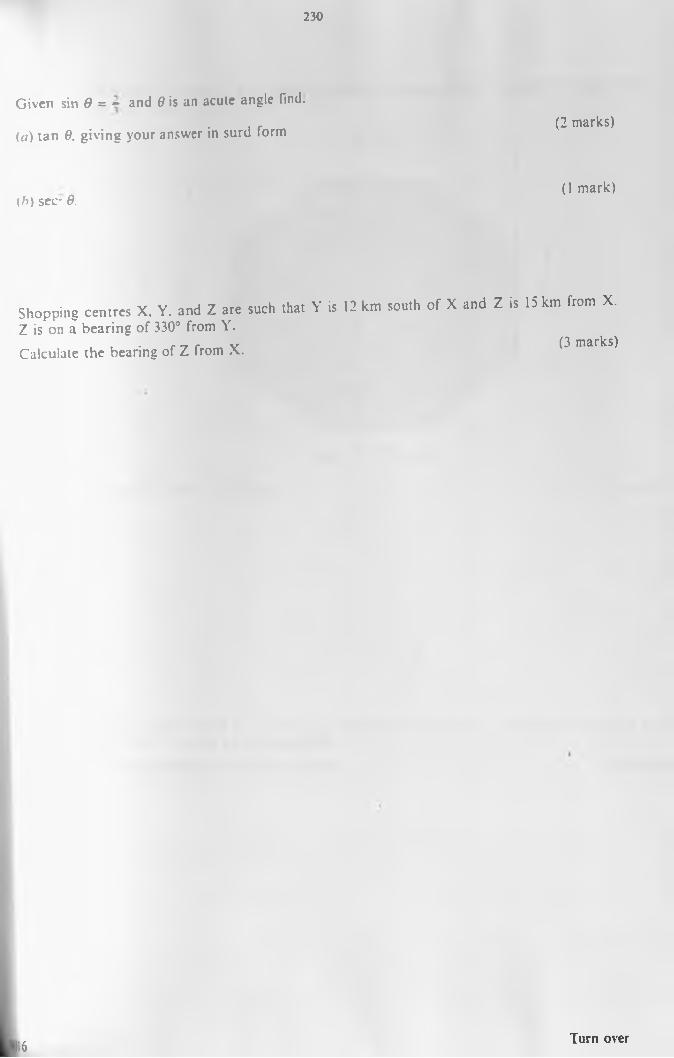
2 30
Given sin 0 = * and 6 is an acute angle find.(a) tan 6. giving your answer in surd form
</>) sec- 9.
Shopping centres X. Y. and Z are such that Y is 12 km south of X and Z Z is on a bearing of 330® from Y.Calculate the bearing of Z from X.
(2 marks)
(1 mark)
is 15 km from X.
(3 marks)
116 Turn over
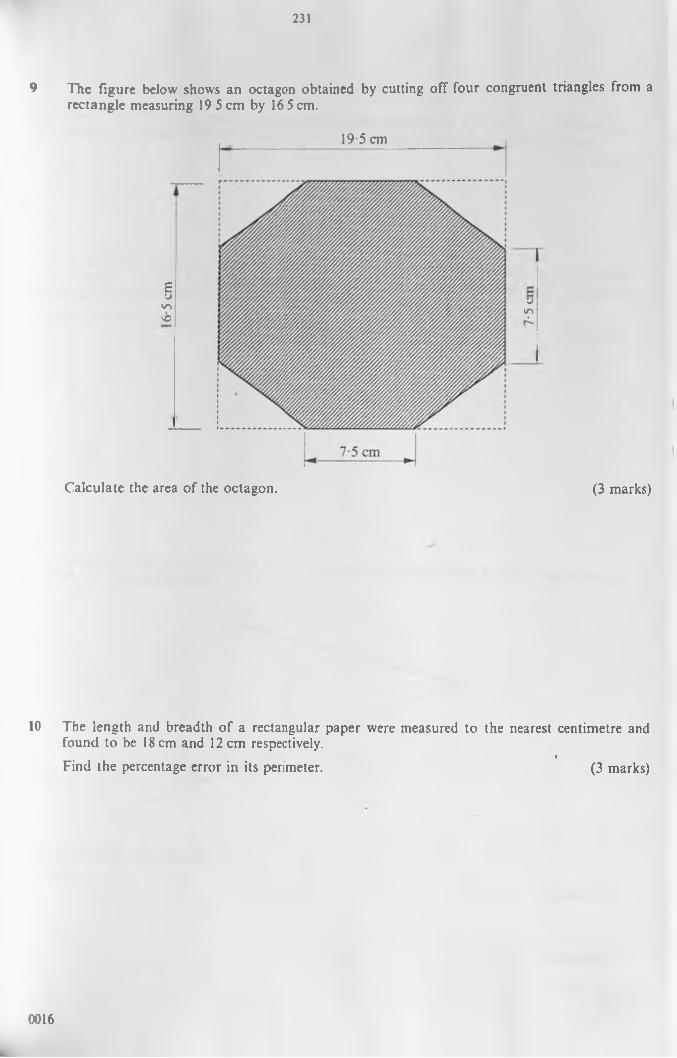
231
9 The figure below shows an octagon obtained by cutting ofT four congruent triangles from a rectangle measuring 19 5 cm by 16 5 cm.
19-5 cm
£UinsCoin
Calculate the area of the octagon. (3 marks)
10 The length and breadth of a rectangular paper were measured to the nearest centimetre and found to be 18 cm and 12 cm respectively. IFind the percentage error in its perimeter. (3 marks)
0016
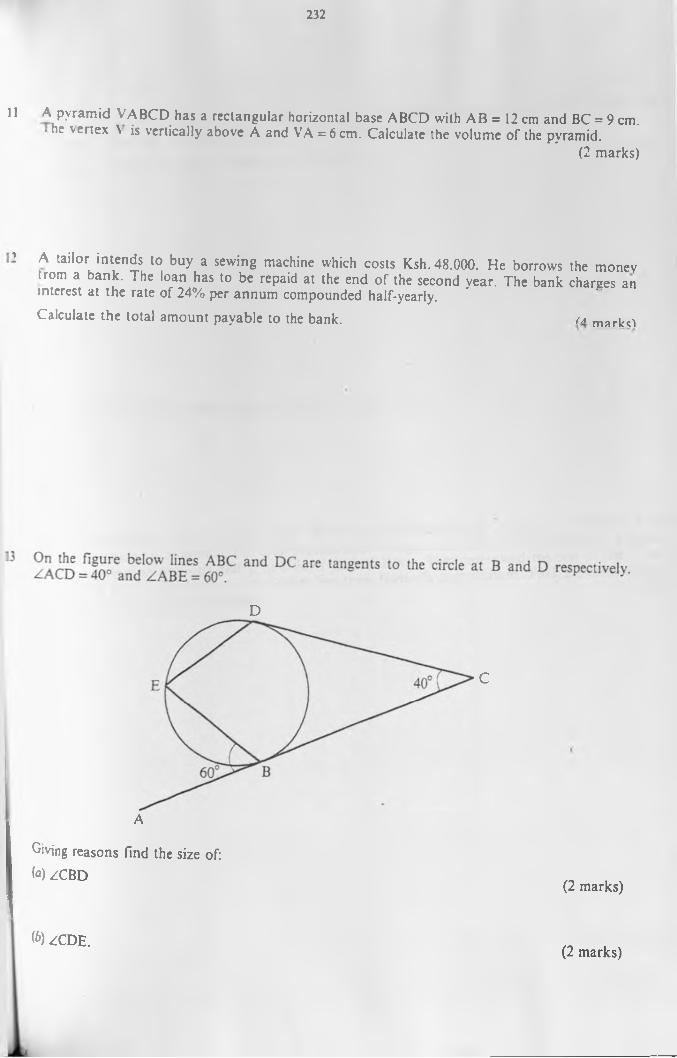
IJ232
11 A pyramid VABCD has a rectangular horizontal base A BCD with AB = 12 cm and BC = 9 cm. • he vertex \ is vertically above A and VA = 6 cm. Calculate the volume of the pyramid.
(2 marks)
A tailor intends to buy a sewing machine which costs Ksh. 48.000. He borrows the monev from a bank. The loan has to be repaid at the end of the second year. The bank charges an interest at the rate of 24% per annum compounded half-yearly.Calculate the total amount payable to the bank. <a marko
D
C
AGiving reasons find the size of: (a) ZCBD (2 marks)
ft) ZCDE. (2 marks)
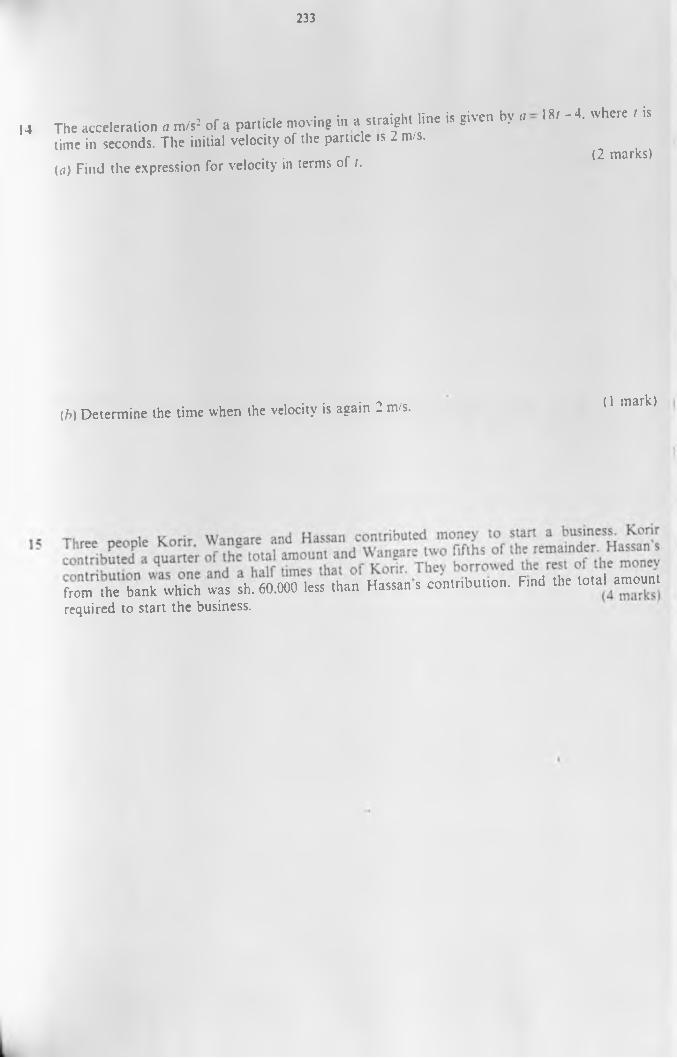
233
14 The acceleration a m/s2 of a particle moving in a straight line is given by a time in seconds. The initial velocity of the particle is 2 m/s.(a) Find the expression for velocity in terms of /.
18/ -4 . where / is
(2 marks)
(/>) Determine the time when the velocity is again 2 m/s. (1 mark)
fmtn'the'bank which was sh. 60.000 less than Hassans contribution. Find the totaUmount required to start the business.
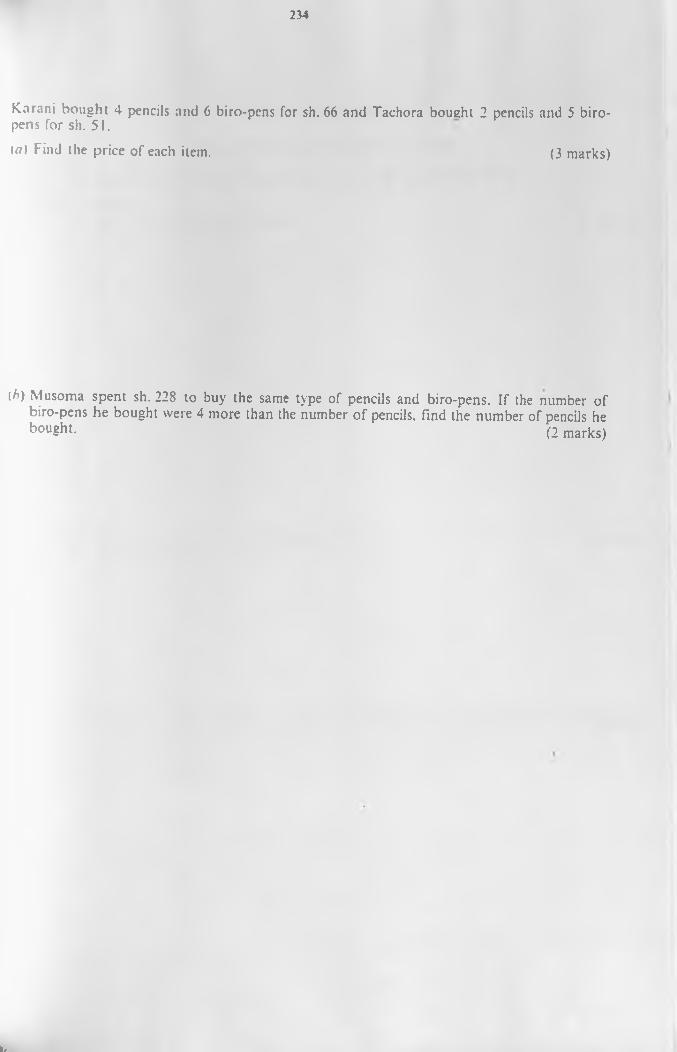
234
Karani bought 4 pencils and 6 biro-pens for sh. 66 and Tachora bought 2 pencils and 5 biro-pens for sh. 51.k/) Find the price of each item. (3 marks)
(A) Musoma spent sh. 228 to buy the same type of pencils and biro-pens. If the number of biro-pens he bought were 4 more than the number of pencils, find the number of pencils he bou?ht- (2 marks)
L,
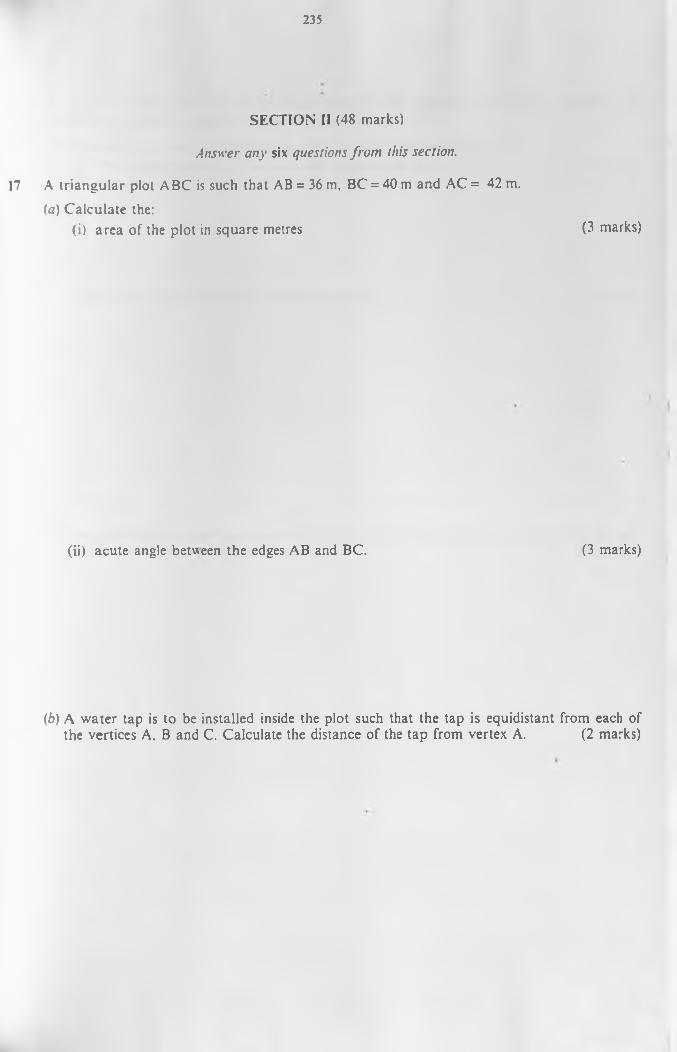
235
SECTION II (48 marks)Answer any six questions from this section.
17 A triangular plot ABC is such that AB = 36 m, BC = 40 m and AC = 42 m. (a) Calculate the:
(i) area of the plot in square metres
(ii) acute angle between the edges AB and BC.
(3 marks)
(3 marks)
(6) A water tap is to be installed inside the plot such that the tap is equidistant from each of the vertices A. B and C. Calculate the distance of the tap from vertex A. (2 marks)
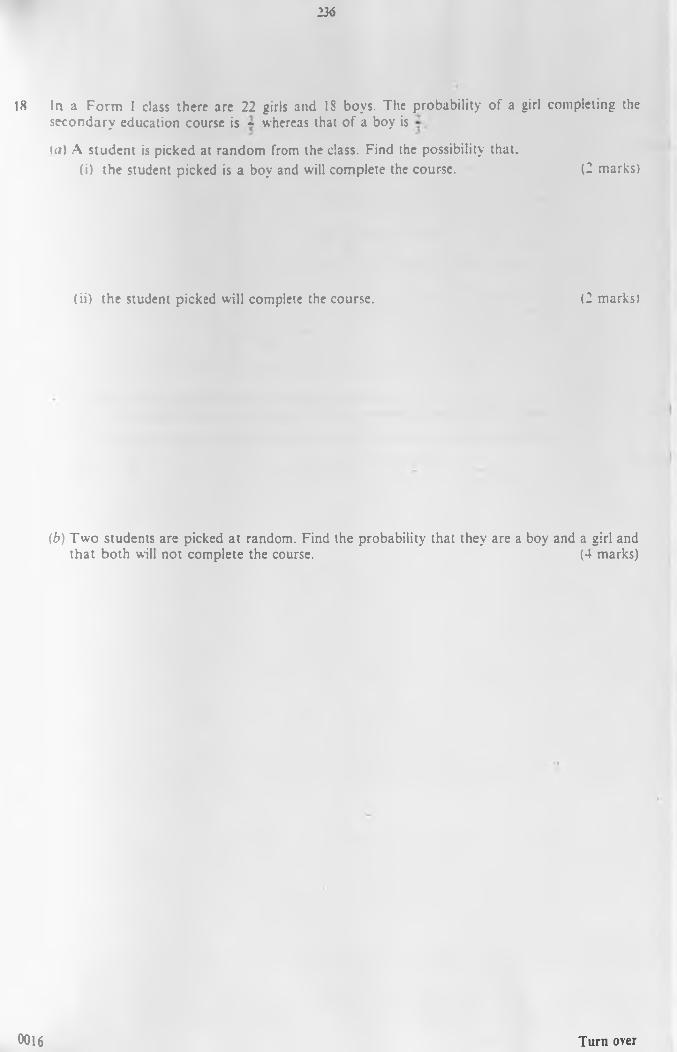
236
18 In a Form I class there are 22 girls and IS boys. The probability of a girl completing the secondary education course is ~ whereas that of a boy is<u) A student is picked at random from the class. Find the possibility that.
(i) the student picked is a boy and will complete the course. (2 marks)
(ii) the student picked will complete the course. (2 marks)
(b) Two students are picked at random. Find the probability that they are a boy and a girl and that both will not complete the course. (4 marks)
0016 T u r n over
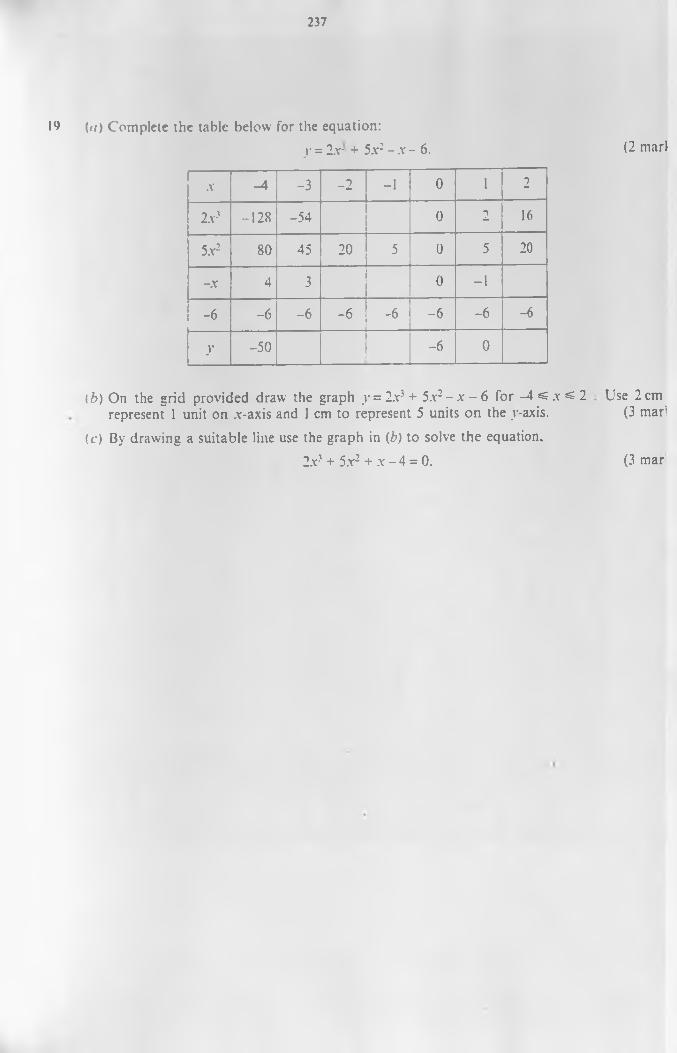
2 37
19 (</) Complete the table below for the equation:y = 2.x- + 5.x: - ,x - 6.
X -4 -3 _2 -1 0 1 22.x3 -128 -54 0 2 165.x2 80 45 20 5 0 5 20-.X 4 3 0 -1-6 -6 -6 -6 -6 -6 -6 -6y -50 -6 0
(b) On the grid provided draw the graph y = 2.x3 + 5.x2 - x - 6 for -4 =£ .x =£ 2 represent 1 unit on .x-axis and 1 cm to represent 5 units on the y-axis.
(c) By drawing a suitable line use the graph in (b) to solve the equation.2.x3 + 5.x2 + x - 4 = 0.
(2 marl
Use 2 cm (3 mari
(3 mar
238
0017
2 39
/Index Number121/2
THEM ATICS Paper 2
xt./Nov. 20002': hours
E KENYA NATIONAL EXAMINATIONS COUNCIL »va Certificate of Secondary EducationvTHEMATICSye t 2hours
rructions to candidates.■‘ Vrite y o u r n a m e a n d in d e x n u m b e r in th e spaces p ro v id e d a t th e top o f th is p a g e .T he pa per c o n ta in s tw o sec tio n s: S e c t io n I a n d S e c tio n II..Answer a ll th e q u e s tio n s in S e c t io n I a n d an y s ix q u es tio n s f r o m S e c tio n II.A l l answ ers a n d w o r k in g m u s t be w r itte n on the q u estio n p a p e r in th e sp a c e s p ro v id e d b e low ea chquestion.V arks m a y b e g iv e n f o r co rrec t w o rk in g even i f th e answ er is wrong.
E lectronic c a lc u la to r s m u s t n o t be used. M a th e m a tic a l T a b le s are p ro v id ed .
r Examiner's use only.ction I1 2 3 4 5 6 7 8 9 10 11 12 13 14 15 16 Total
_1
sxtion II
17 18 19 20 21 22 23 24 Total GrandTotal
This paper consists of 17 printed pages.Candidates should check the question paper to ensure that all the printed
pages are printed as indicated and no questions are missing.© 2000 The K enya N ational E xa m in a tion s Council T u r n o v e r
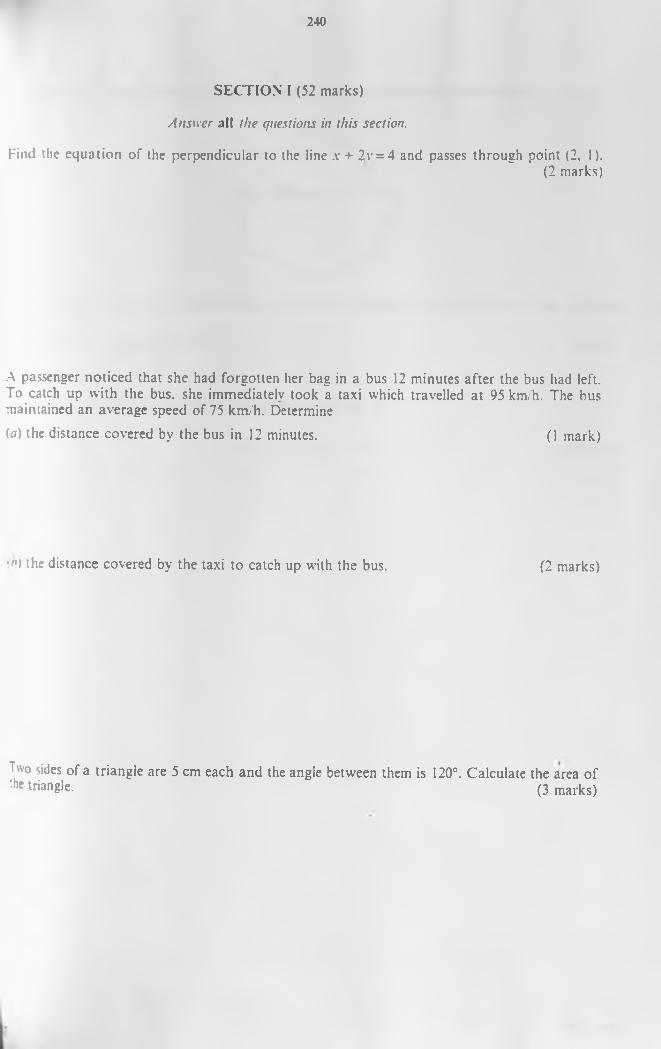
240
SECTION I (52 marks)Answer all the questions in this section.
Find the equation of the perpendicular to the line x + 2r = 4 and passes through point (2. I).(2 marks)
A passenger noticed that she had forgotten her bag in a bus 12 minutes after the bus had left. To catch up with the bus. she immediately took a taxi which travelled at 95 km/h. The bus maintained an average speed of 75 km/h. Determine(a) the distance covered by the bus in 12 minutes. (1 mark)
'n) the distance covered by the taxi to catch up with the bus. (2 marks)
Two sides of a triangle are 5 cm each and the angle between them is 120°. Calculate the area of :he triangle. (3 marks)
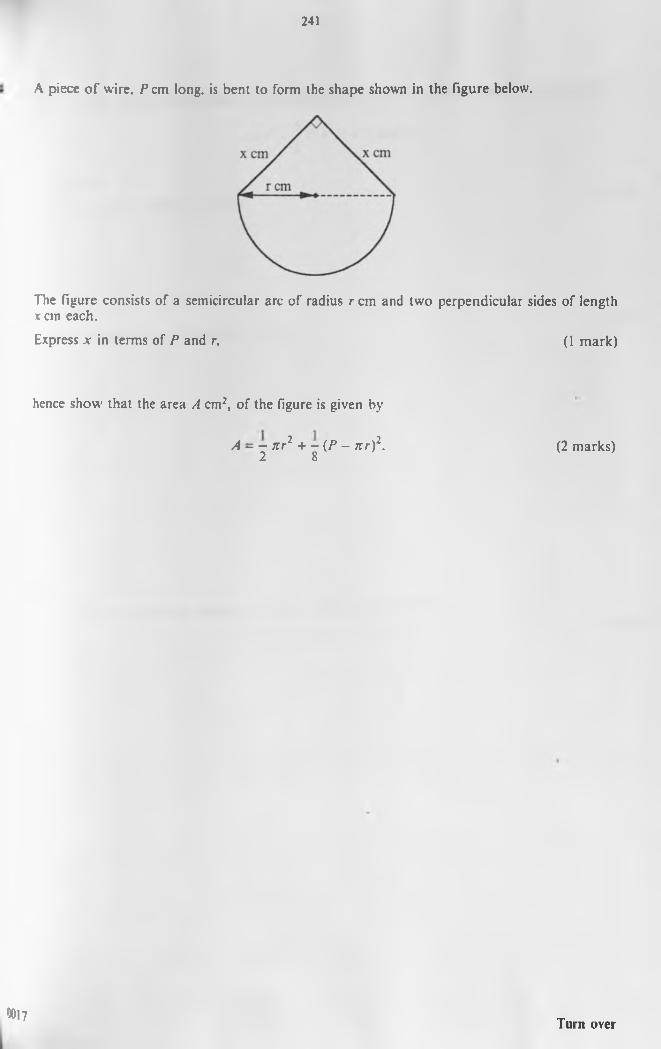
241
A piece o f wire. P cm long, is bent to form the shape shown in the figure below.
The figure consists of a semicircular arc of radius r cm and two perpendicular sides of lengthvein each.
Express x in terms of P and r. (1 mark)
hence show that the area A cm2, of the figure is given by
A - — n r 2 + - (P - n r )2. 2 8 (2 marks)
0017 T u r n o v e r
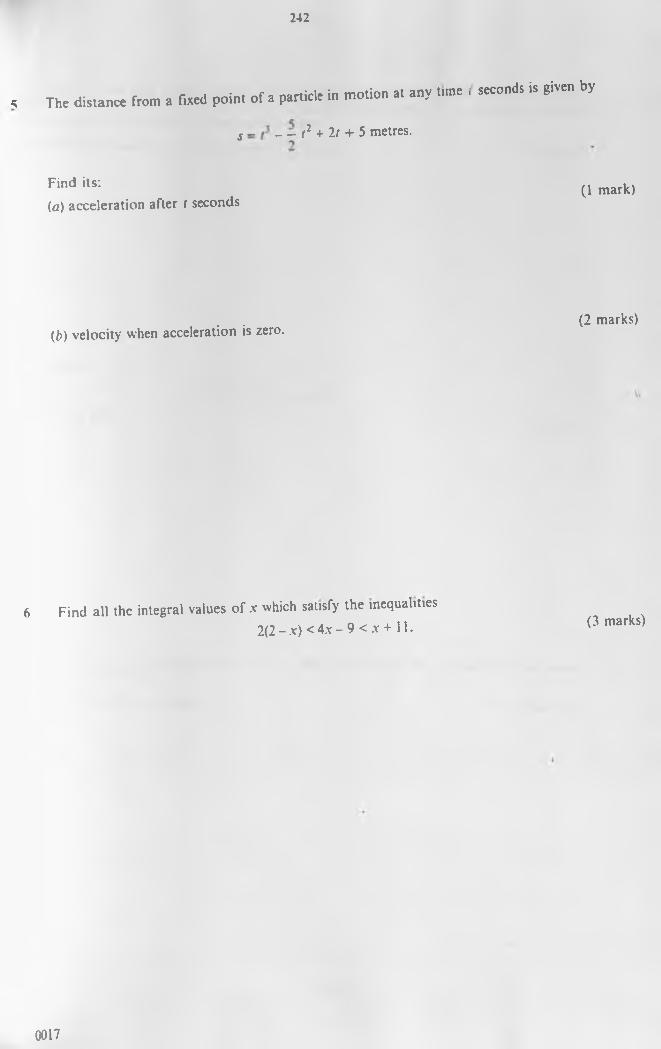
242
< The distance from a fixed point of a particle in motion at any time is - _ _ t1 + It + 5 metres.
Find its:(a) acceleration after f seconds
(b) velocity when acceleration is zero.
6 Find all the integral values of x which satisfy the inequalities2(2 - x) < 4x - 9 < x + 11.
seconds is given by
(1 mark)
(2 marks)
(3 marks)
0017
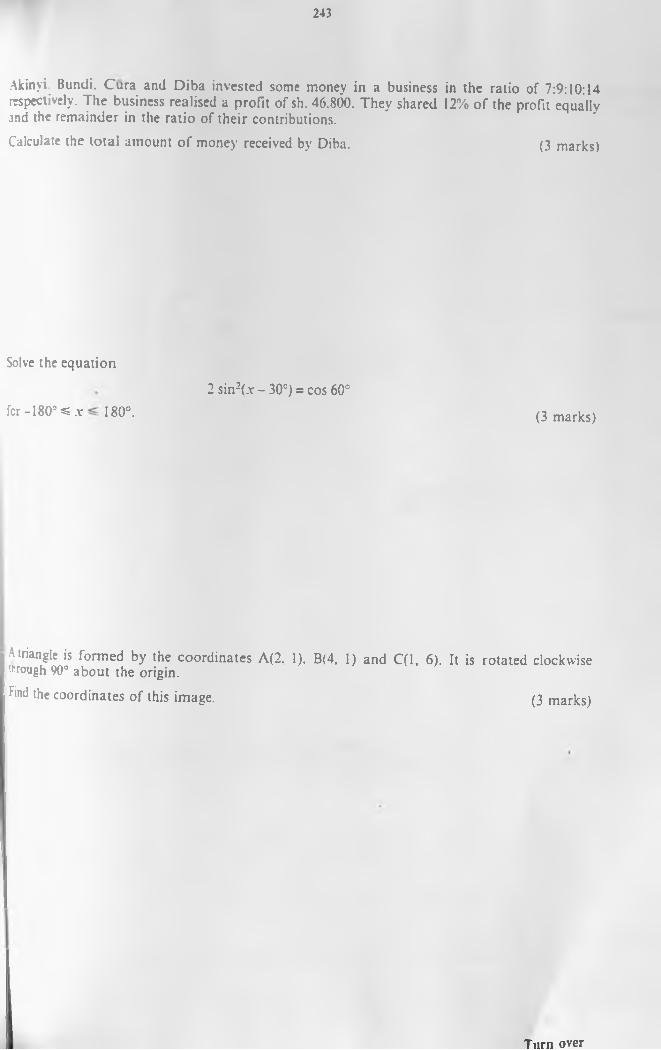
243
Akinyi. Bundi. Cura and Diba invested some money in a business respectively. The business realised a profit of sh. 46.800. They shared and the remainder in the ratio of their contributions.Calculate the total amount of money received by Diba.
Solve the equation
for -180° ^ .v 180°.2 sin2(.v - 30°) = cos 60°
A triangle is formed by the coordinates A(2, 1). B(4, 1) and C(l, 6). Trough 90° about the origin.Find the coordinates of this image.
in the ratio of 7:9:10:14 12% of the profit equally
(3 marks)
(3 marks)
It is rotated clockwise
(3 marks)
T u r n o v e r
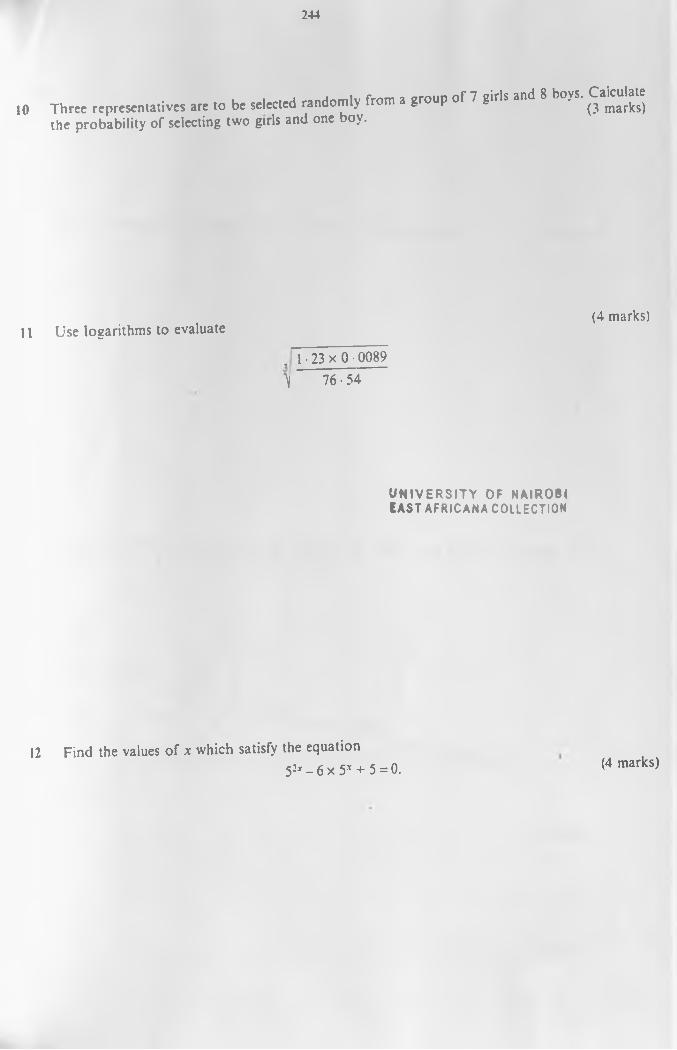
244
10 Three representatives are to be selected randomly from a group the probability of selecting two girls and one boy.
of 7 girls and 8 boys. Calculate (3 marks)
11 Use logarithms to evaluate, 1.23 x 0 ■ 0089 \ 76•54
(4 marks)
U N IV E R S I T Y OF NAIROBI EAST AFRICANA COLLECTION
12 Find the values of x which satisfy the equation52jt - 6 x 5T + 5 = 0. (4 marks)
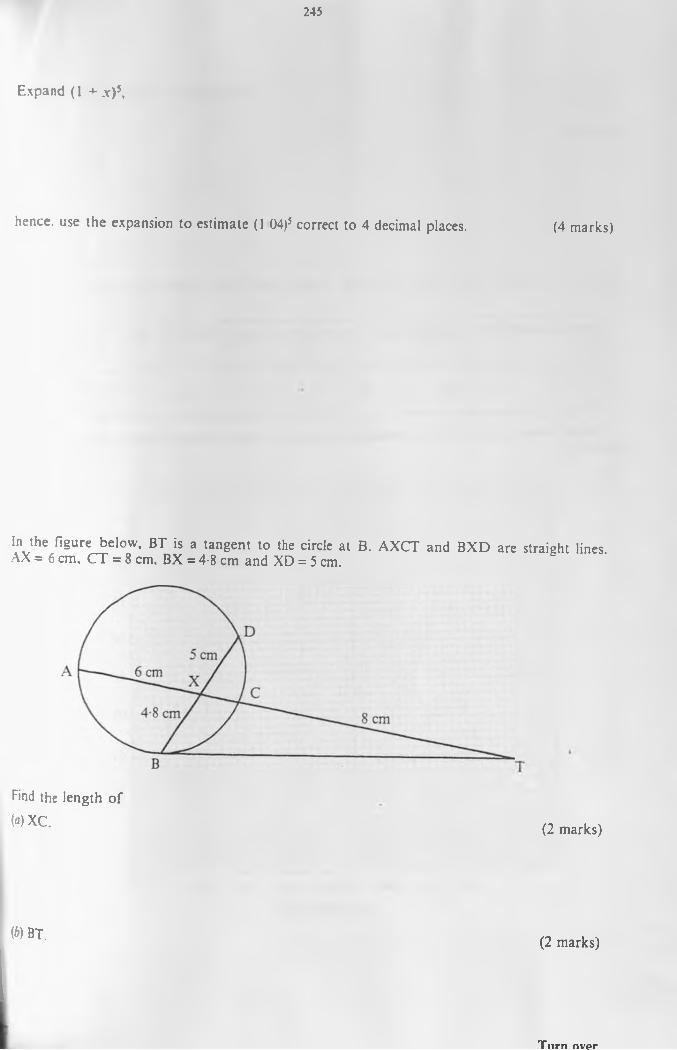
245
E xp and (I + .v)5,
hence, use the expansion to estimate (104)5 correct to 4 decimal places.
In the figure below. BT is a tangent to the circle at B. AXCT and BXD are AX = 6 cm. CT = 8 cm. BX = 4-8 cm and XD = 5 cm.
Find the length of(a)XC.
(b) BT.
(4 marks)
straight lines.
(2 marks)
(2 marks)
T u rn nvpr
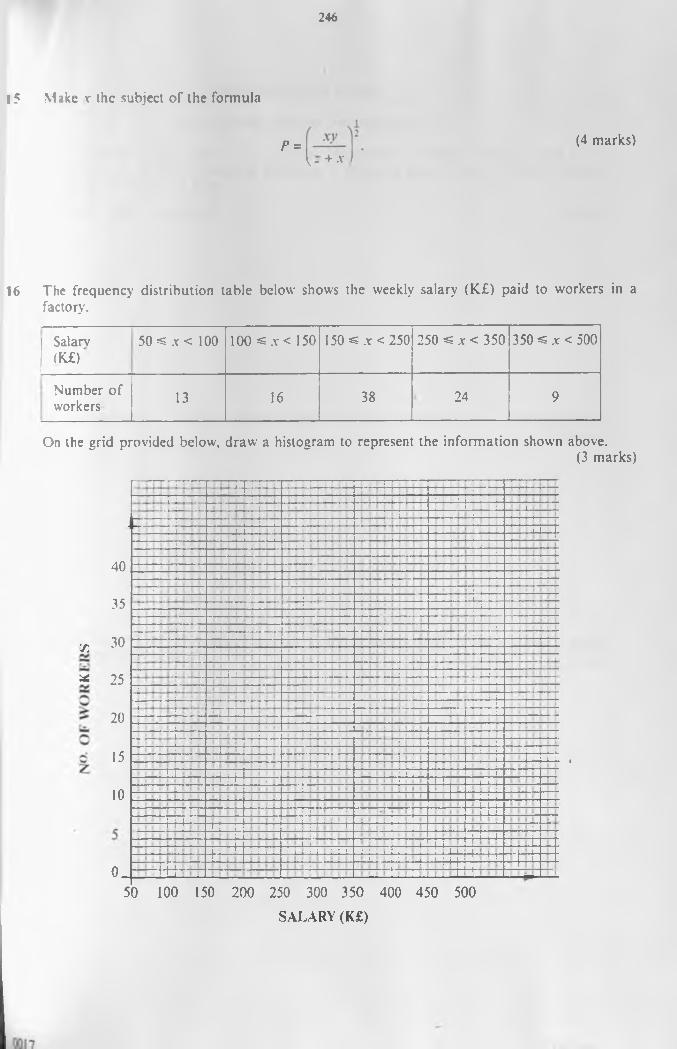
246
1 5 Make y the subject of the formula
P =\ - + -v
(4 marks)
16 The frequency distribution table below shows the weekly salary (K£) paid to workers in afactory.
Salarv(K£)
5 0 ^ ,y < 100 100«.v< 150 150 *£ .y < 250 250 ^ x < 350 350 ^ .y < 500
Number of workers 13 16 38 24 9
On the grid provided below, draw a histogram to represent the information show-n above.(3 marks)
=FH=
4035
-i.i.
• -
t H-i I . |
—
S) 30* 25
20
-l-L
l + t -u:
1510
—
I I—.—
44+—
0. 4444
T r r-H+
—
-TT—
.—
4
—
tT
-14- XL
—
44-_
i-.-U-i ■ , ; ..-1 i i I ! -
50 100 150 200 250 300 350 400 450 500SALARY (K£)
± R ± t .4-La4-U -
• ' • ~
-t-r
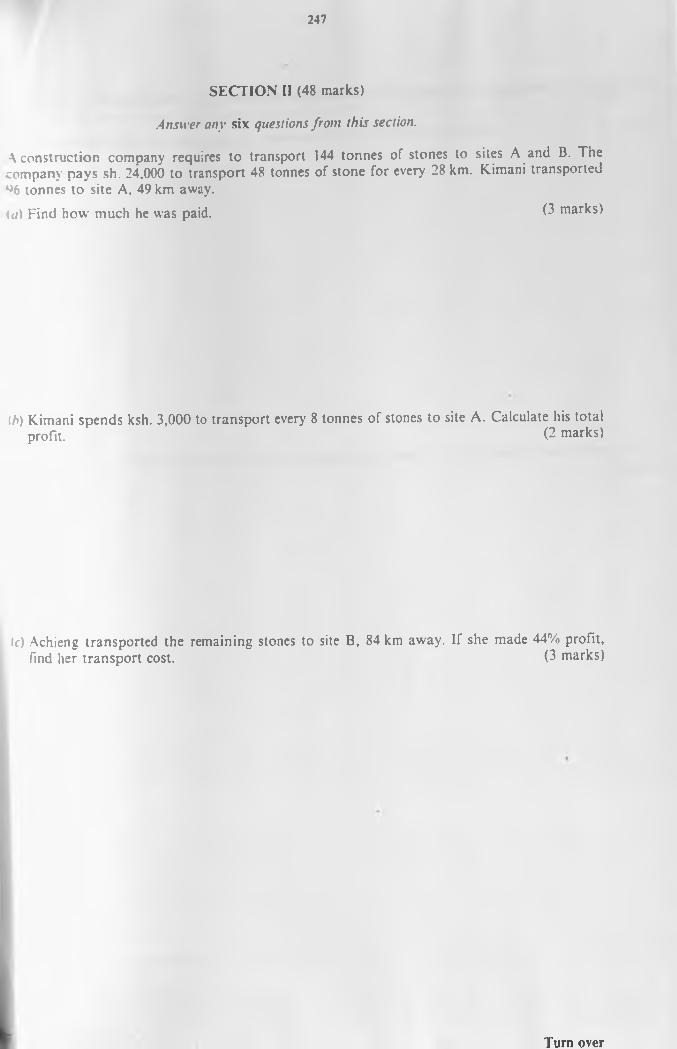
247
SECTION II (48 marks)Answer any six questions from this section.
\ construction company requires to transport 144 tonnes of stones to sites A and B. The company pays sh. 24,000 to transport 48 tonnes of stone for every 28 km. Kimani transported^6 tonnes to site A. 49 km away.tu) Find how much he was paid. (3 marks)
tb) Kimani spends ksh. 3,000 to transport every 8 tonnes of stones to site A. Calculate his total profit. (2 marks)
(c) Achieng transported the remaining stones to site B, 84 km away. If she made 44% profit, find her transport cost. (3 marks)
T u r n o v e r
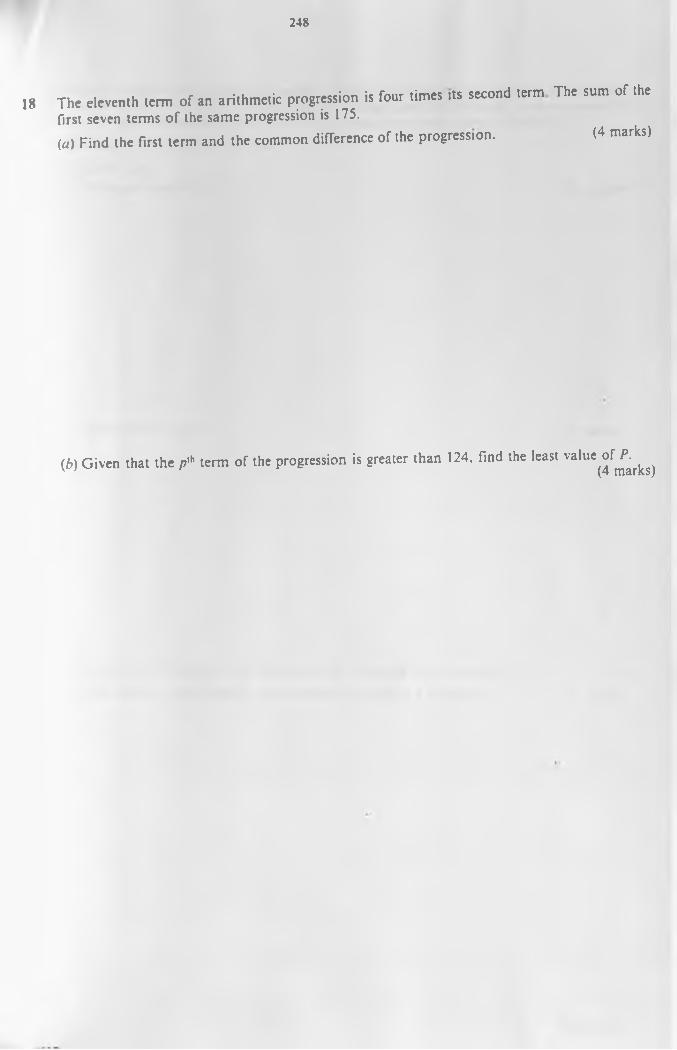
24 8
18 The eleventh term of an arithmetic progression is four times its second term first seven terms of the same progression is 175.(a) Find the first term and the common difference of the progression.
The sum of the
(4 marks)
(6) Given that the p'h term of the progression is greater than 124. find the least value of P.(4 marks)
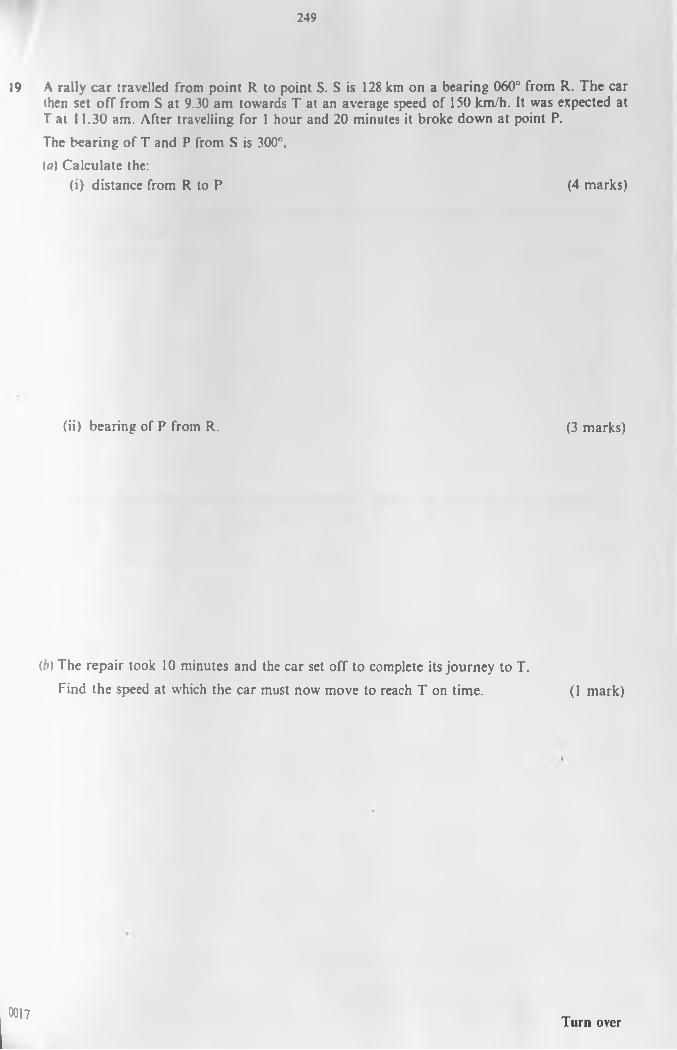
249
19 A rally car travelled from point R to point S. S is 128 km on a bearing 060° from R. The car then set off from S at 9.30 am towards T at an average speed of 150 km/h. It was expected at T at 11.30 am. After travelling for 1 hour and 20 minutes it broke down at point P.The bearing of T and P from S is 300°.(a) Calculate the:
(i) distance from R to P (4 marks)
(ii) bearing of P from R. (3 marks)
(b) The repair took 10 minutes and the car set off to complete its journey to T.Find the speed at which the car must now move to reach T on time. (1 mark)
0017 T u r n o v e r
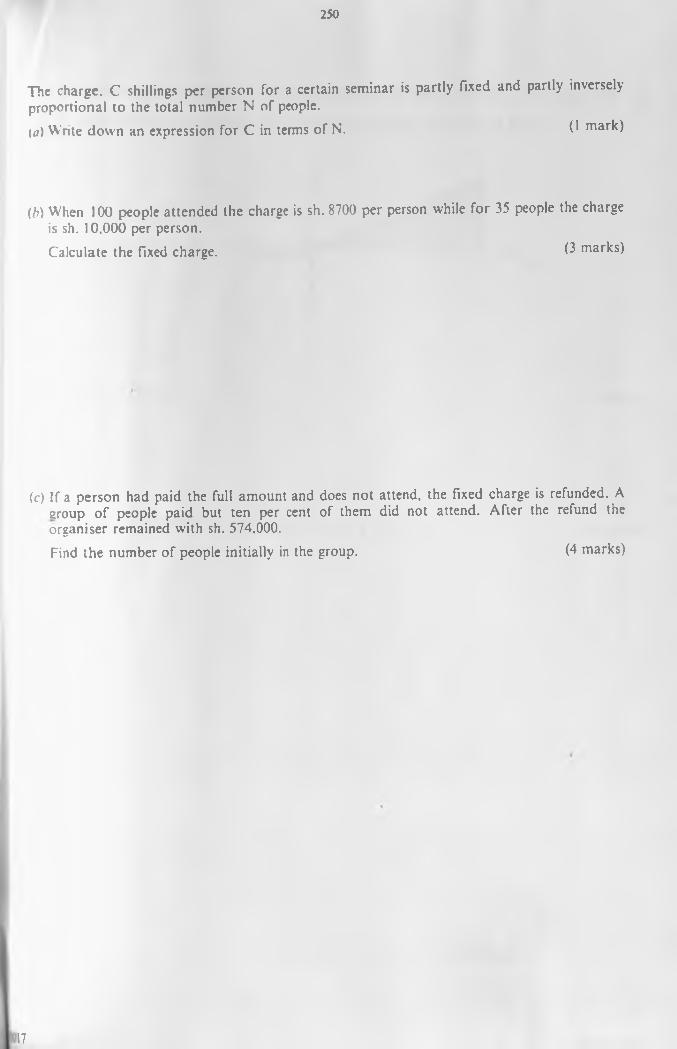
250
The charge. C shillings per person for a certain seminar is partly fixed and proportional to the total number N of people.{a) Write down an expression for C in terms of N.
partly inversely
(1 mark)
(b) When 100 people attended the charge is sh. 8700 per person while for 35 people the chargeis sh. 10.000 per person.Calculate the fixed charge. (3 marks)
(c) If a person had paid the full amount and does not attend, the fixed charge is refunded. A aroup of people paid but ten per cent of them did not attend. After the refund the organiser remained with sh. 574.000.Find the number of people initially in the group. (4 marks)
17
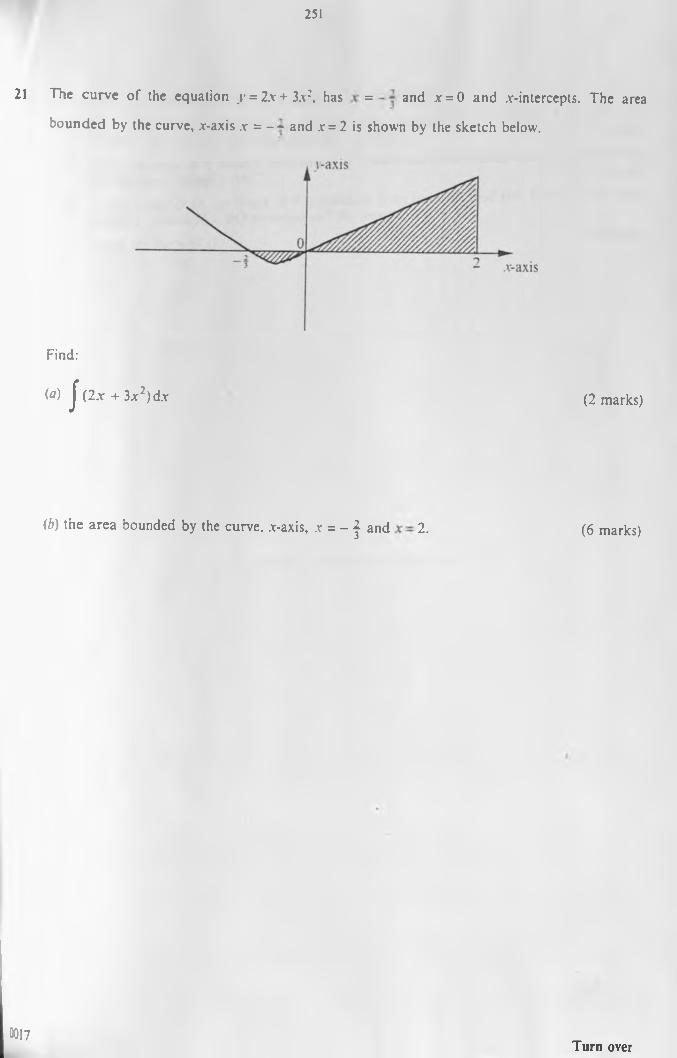
251
21 The curve of the equation >- = 2.v+3.\:, has = and x = 0 and .r-intercepts. The area bounded by the curve, .v-axis .r = - * and x = 2 is shown by the sketch below.
Find:
(a) j (2 x + 3 x 2)dx (2 marks)
(b) the area bounded by the curve, .t-axis, x = - j and 2. (6 marks)
0017T u r n o v e r
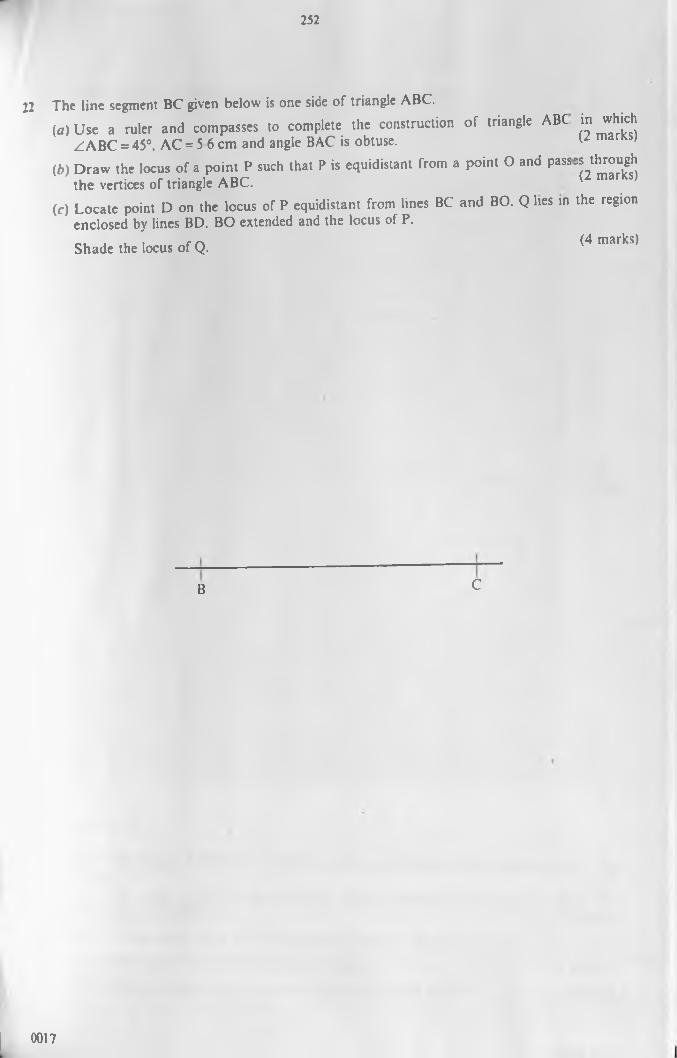
252
22 The line segment BC given below is one side of triangle ABC.(a) Use a ruler and compasses to complete the construction of triangle ABC
ZABC = 45°. AC = 5 6 cm and angle BAC is obtuse.(b) Draw the locus of a point P such that P is equidistant from a point O and pass
the vertices of triangle ABC.(c) Locate point D on the locus of P equidistant from lines BC and BO. Q lies in
enclosed by lines BD. BO extended and the locus of P.Shade the locus of Q.
B C
in which (2 marks)
:s through (2 marks)the region
(4 marks)
0017
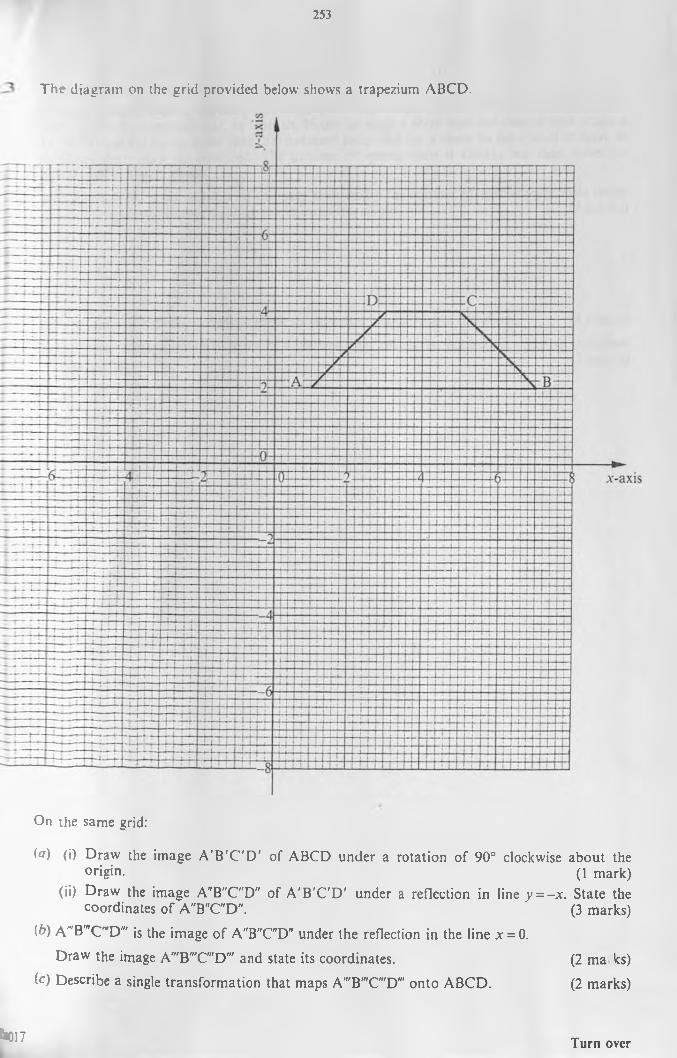
253
The diagram on the grid provided below shows a trapezium ABCD.
On the same grid:(a) (i) Draw the image A 'B 'C 'D ' of ABCD under a rotation of 90° clockwise about the
origin. (1 mark)(ii) Draw the image A"B"C"D" of A 'B 'C'D' under a reflection in line y = -x . State the
coordinates of A"B"C"D". (3 marks){b) A"B"’C"D'" is the image of A"B"C"D" under the reflection in the line x = 0.
Draw the image A'"B'"C'"D'" and state its coordinates. (2 ma ks)(c) Describe a single transformation that maps A'"B'"C"'D''' onto ABCD. (2 marks)
t«017 T u r n o v e r
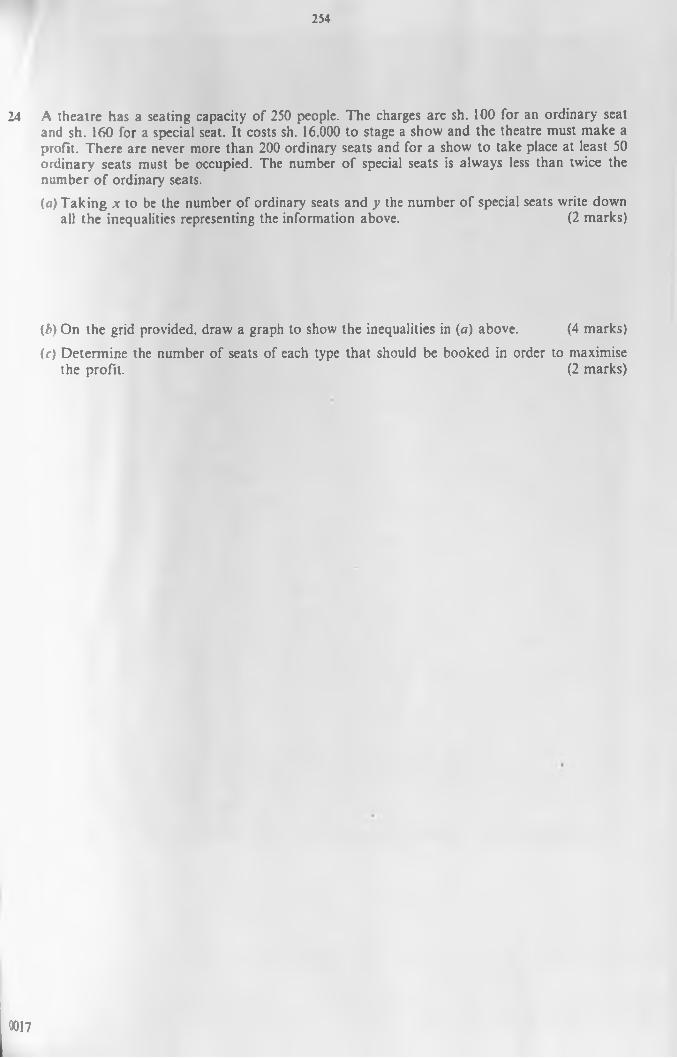
254
24 A theatre has a seating capacity of 250 people. The charges are sh. 100 for an ordinary seat and sh. 160 for a special seat. It costs sh. 16,000 to stage a show and the theatre must make a profit. There are never more than 200 ordinary seats and for a show to take place at least 50 ordinary seats must be occupied. The number of special seats is always less than twice the number of ordinary seats.(a) Taking x to be the number of ordinary seats and y the number of special seats write down
all the inequalities representing the information above. (2 marks)
(b) On the grid provided, draw a graph to show the inequalities in (a) above. (4 marks)(<•) Determine the number of seats of each type that should be booked in order to maximise
the profit. (2 marks)
0017
0017
CC7
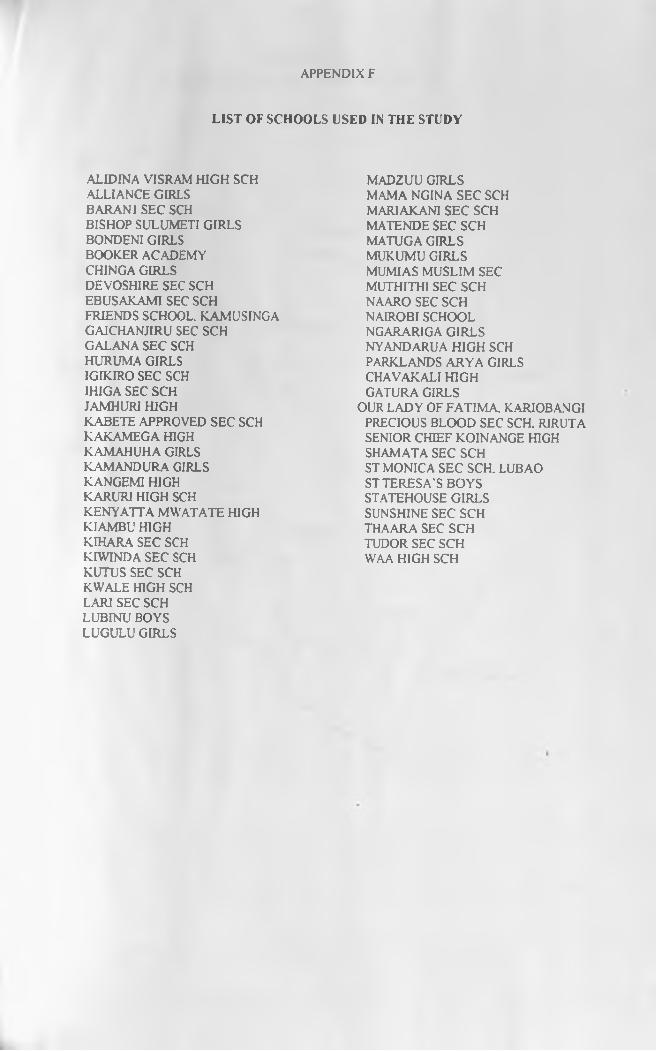
APPENDIX F
LIST OF SCHOOLS USED IN THE STUDY
ALIDINA VISRAM HIGH SCH.ALLIANCE GIRLSBARAN1 SEC SCHBISHOP SULUMETI GIRLSBONDENI GIRLSBOOKER ACADEMYCHINGA GIRLSDEVOSHIRE SEC SCHEBUSAKAMI SEC SCHFRIENDS SCHOOL. KAJMUSINGAGAICHANJIRU SEC SCHGALANA SEC SCHHURUMA GIRLSIGIKIRO SEC SCHIHIGA SEC SCHJAMHURI HIGHKABETE APPROVED SEC SCHKAKAMEGA HIGHKAMAHUHA GIRLSKAMANDURA GIRLSKANGEMI HIGHKARURI HIGH SCHKENYATTA MWATATE HIGHKIAMBU HIGHKIHARA SEC SCHKIWINDA SEC SCHKUTUS SEC SCHKWALE HIGH SCHLARI SEC SCHLUBINU BOYSLUGULU GIRLS
MADZUU GIRLS M.AMA NGINA SEC SCH MARIAKANI SEC SCH MATENDE SEC SCH MATUGA GIRLS MUKUMU GIRLS MUMIAS MUSLIM SEC MUTHITHI SEC SCH NAARO SEC SCH NAIROBI SCHOOL NGARARJGA GIRLS NYANDARUA HIGH SCH PARKLANDS ARYA GIRLS CHAVAKALI HIGH GATURA GIRLS
OUR LADY OF FATIMA. KARJOBANGI PRECIOUS BLOOD SEC SCH. RIRUTA SENIOR CHIEF KOINANGE HIGH SHAMATA SEC SCH ST MONICA SEC SCH. LUBAO ST TERESA'S BOYS STATEHOUSE GIRLS SUNSHINE SEC SCH THAARA SEC SCH TUDOR SEC SCH WAA HIGH SCH
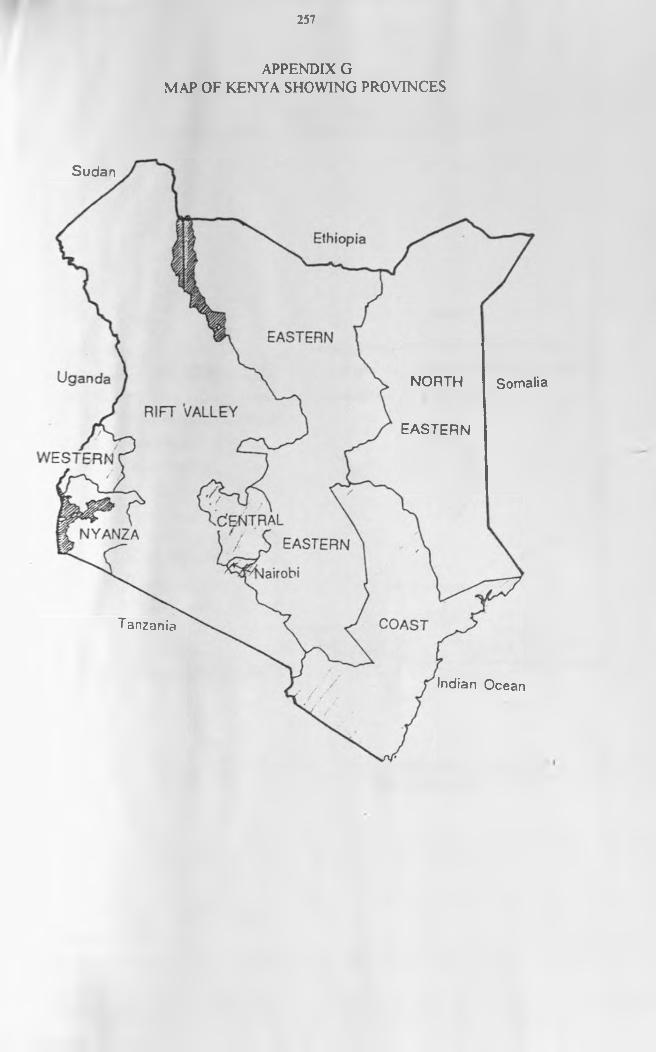
257
APPENDIX GMAP OF KENYA SHOWING PROVINCES
Ethiopia
EASTERN
r if t Va l l e y
WESTERN
.Ce n t r a lNYANZA
EASTERN
COAST
Sudan
SomaliaUganda NORTH
EASTERN
Tanzania
Indian Ocean
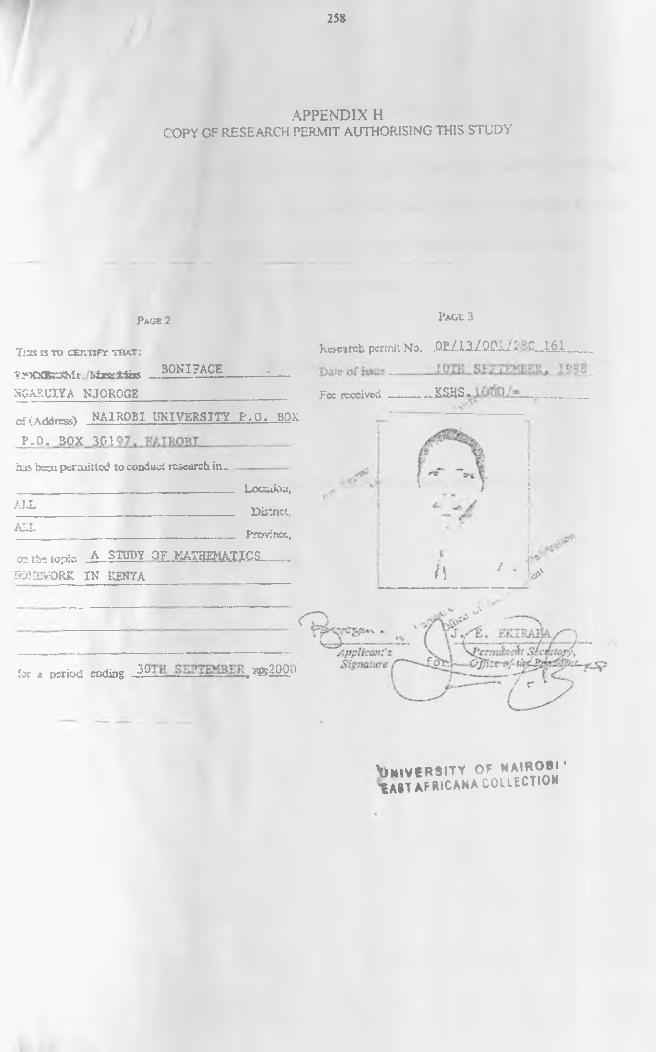
258
APPENDIX HCOPY CF RESEARCH PERMIT AUTHORISING THIS STUDY
P age 2
T in s IS TO CERTIFY THAT:
STJOfSEjOvIr. Lfzsriiijs HGARUIYA NJOROGF.
BONIFACE
of (Address) NAIROBI UNIVERSITY P .O . BOX F .O . 30X 301 '
has been permitted to conduct research in .
a llALL
Loccdou,District,
Province,CTtbc topic a STUDY OF MATHEMATICS.
SOlfEVORK IN KENYA
Page 3Research permit No. .QT-AlZ/Q-Qj-J+ ~'Q_161 „ _
Fee received_______XS.HS • ------ .------ _--
h / * 1+
for i period ending ^ 2 — 39f l 22. vl
V iM lVERS ITY OF NAIROBI * W AFR ICA * * COLLECTION
259
RAW STUDY DATA.
T he data obtained in this study was analysed using the SPSS statistical
package. The data was organised and analysed in three different file, one
each foT students; teachers and schools. The output of such a file is
voluminous and has thus been omitted.
Any enquiries on the study data may be addressed to the author a t the
following address:
D epartm ent of Educational Communication and Technology;
Faculty of Education
University of Nairobi
P.O. BO X 30197
NAIROBI