Embed Size (px)
Citation preview

Department of Economics School of Business, Economics and Law at University of Gothenburg Vasagatan 1, PO Box 640, SE 405 30 Göteborg, Sweden +46 31 786 0000, +46 31 786 1326 (fax) www.handels.gu.se [email protected]
WORKING PAPERS IN ECONOMICS
No 507
Unequal Property Rights:
A study of land right inequalities in Rwanda
by
Ann-Sofie Isaksson
June 2011
ISSN 1403-2473 (print)
ISSN 1403-2465 (online)

1
Unequal property rights: A study of land right inequalities in Rwanda
Ann-Sofie Isaksson∗
Abstract: The aim of the present paper is to examine the existence and patterns of systematic within-country inequalities in effective land rights in Rwanda. The results of empirical estimations drawing on data on the land tenure arrangements of over 5,000 Rwandan households indeed suggest systematic within-country inequalities in land rights, with households headed by women or young individuals, households that have been displaced due to conflict, and households in the Imidugudu village settlements reporting significantly weaker rights than their respective comparison groups. The observed inequalities are not only the result of variation in tenure arrangements, but also exist when comparing households cultivating plots under similar land tenure regimes. Finding within-country inequalities in effective property rights highlights the need to – unlike much of the quantitative literature in the field – carefully evaluate how property rights apply to different segments of a country’s population. For Rwanda, which is in the process of implementing an extensive land reform, this is especially relevant.
JEL classification: D02, K11, O12, O55, Q15, R14, R52 Keywords: property rights, land rights, inequality, Rwanda
1 Introduction
Having secure property rights is important for economic development. There is widespread consensus on this issue among economists, and by now there is a large literature suggesting that country differences in the extent of property rights protection can help explain cross-country variation in economic development (see e.g. Knack and Keefer, 1995; Hall and Jones, 1999; Acemoglu et al., 2001, 2002; and Rodrik et al., 2004).
While the economics literature on property rights institutions often focuses on property rights measured at the country level, a number of recent studies stress the existence of systematic within-country variation in effective property rights protection (Pande and Udry, 2006; Dercon and Ayalew, 2007; Goldstein and Udry, 2008; Isaksson, 2011b). A key argument is that in many developing countries, formal property law and customary property rights arrangements exist in parallel, resulting in property rights that are ambiguous and negotiable and thereby prone to inequalities based in status and resource differentials.
Systematic group inequalities in property rights protection – e.g. between rich and poor or men and women – thus risk reinforcing existing economic inequalities, and should have important consequences for how we measure property rights at the country level. Focusing on the operation of a specific property rights institution – land rights – in a specific country – Rwanda – the present paper explores the existence of within-country inequality in property rights protection.
Drawing on data on the land tenure arrangements of over 5,000 Rwandan households, the aim is to examine the existence and patterns of systematic within-country inequalities in effective land rights. I ask what, if any, the important dimensions of land right inequalities in Rwanda are, and if they originate in variation in tenure arrangements or if there are differences in effective land rights across households cultivating plots under similar de jure land tenure regimes. The results of the empirical estimations suggest systematic within-country inequalities in land rights, in particular between female- and male-headed households,
∗ Department of Economics, University of Gothenburg, Box 640, 405 30 Gothenburg, Sweden. E-mail: [email protected], Tel. +46-(0)31-7861249.

2
both when considering rights irrespective of land tenure arrangement and when comparing households cultivating plots under similar land tenure regimes.
Land rights are important – in terms of their general economic consequences, for developing countries in particular, and arguably especially so in Rwanda. Weak land rights deter investment, reduce the ability of borrowers to use land as collateral as well as inhibit land transactions meaning that potential gains from trade are lost. Also, with insecure land rights, the owner of a plot of land may feel the need to divert valuable resources like labour to guard the land (Besley and Ghatak, 2009). A growing micro literature finds empirical support for these linkages (see e.g. Besley, 1995; Field, 2005, 2007; Deininger et al., 2006; Dercon and Ayalew, 2007; Goldstein and Udry, 2008; Galiani and Schargrodsky, 2010). In a developing country context, land is a key asset for the rural poor, often constituting the primary source of their livelihood. Providing secure land rights could thus significantly increase the asset base of poor people, affecting their ability to produce for subsistence and for the market as well as their opportunities and incentives to invest (Deininger, 2003). In addition, insecure land rights, which give rise to overlapping claims to plots, is often cited as a source of conflict (Deininger et al., 2006).
For this reason, it is hard to overestimate the importance of land rights in the Rwandan context. Rwanda is one of the most densely populated countries in Africa, and the pressure on land has often been put forward as an important factor in the 1994 genocide (see e.g. André and Platteau, 1998; Kairaba, 2002; Musahara and Huggins, 2005; Vervimp, 2004; and Yanagizawa, 2006). Besides being a human tragedy, the civil war and genocide disrupted existing land occupancy patterns and created an urgent need for land reform. This reform process has now been initiated, with a new land law put forward and a process of land registration underway (more on this in Sections 2.2-2.3).
The present paper thus has valuable policy implications. For the Rwandan land reform process to promote equitable development, it is crucial that policy makers are aware of existing inequalities in terms of effective land rights. This should help guide the implementation process and provide a point of reference for future evaluation of the distributional effects of the reform. While there are some qualitative accounts related to land right inequalities in Rwanda (Rose, 2004, and Daley et al., 2010, on women’s land rights and Rose, 2005, on the land rights of orphans; see Section 2.3), I am not aware of any paper examining Rwandan land right inequalities quantitatively.
Moreover, finding within-country inequalities in effective property rights has important implications for research. In particular, it highlights the need for country-level measures of property rights to evaluate the property rights protection applying to different segments of a country’s population. It suggests that considering national de jure rights is not enough, and that assuming that the effective rights reported by one group apply to all is misleading. With respect to land, if there are inequalities not only in terms of the size of land holdings but also in terms of property rights to land, this constitutes an important inequality dimension that should not be overlooked when studying the effects of land tenure reform. A large qualitative literature discusses the comparative land rights of specific groups, such as women (see e.g. Lastarria-Cornhiel, 1997; Meinzen-Dick et al., 1997; Rose, 2004, and Daley et al., 2010). However, while a growing number of quantitative studies investigate the effects of within-country variation in land rights (see e.g. Besley, 1995; Field, 2005, 2007; Deininger et al., 2006; Dercon and Ayalew, 2007; Goldstein and Udry, 2008; Galiani and Schargrodsky, 2010), they do not focus on examining the pattern of systematic variation – i.e. the very inequalities – in land rights.

3
2 Land right inequalities Property rights can be defined as the institutional framework in place to protect the right of an owner of a good or asset to use it for consumption and income generation, to transfer it to another party, and to use it to contract with other parties (Besley and Ghatak, 2009). Correspondingly, property rights to land, or land rights, could be said to refer to the use, transfer and contracting rights with respect to the asset land. Land right inequalities, in turn, refer to systematic group inequalities in effective land rights (for a discussion of group inequalities, see Stewart, 2002). In this section I will first discuss the basic argument behind the hypothesised existence of land right inequalities and the treatment of land right inequalities in the literature. I will then provide some background information on Rwandan land use and land rights and discuss what land right inequality dimensions are relevant to consider in the Rwandan context.
2.1 Basic argument and treatment in the literature A key to understanding land right inequalities lies in the coexistence of formal and informal property rights institutions or, put differently, in the gap between de jure and de facto land rights. Whereas land laws may well be discriminatory – for instance, women’s ability to inherit land is restricted in many societies (Deininger et al., 2010) – inequalities in effective land rights could exist in spite of non-discriminatory land legislation. This is especially true in developing countries, where customary land arrangements often play an important role.
Arguably, the dual land system prevalent in many developing countries – with formal land law and customary land arrangements existing in parallel – gives rise to ambiguous and thus negotiable land rights. This in turn opens up for land right inequalities originating in – and potentially reinforcing – existing inequalities in resources and social status.
The household resource base affects the capacity to invest in land in order to get more secure property rights (e.g. by planting trees; see Besley, 1995), the means available to protect the land, who has the informational advantage in a land dispute, who can afford to go to court to settle disputes, and, if registering land is costly, who has the resources to go through with this process. Likewise, the social status of a household is likely to affect its bargaining power in land disputes; the cost of challenging the household’s land rights should presumably depend on its connections and status in the community (see e.g. Lastarria-Cornhiel, 1997, and Meinzen-Dick et al., 1997).
As noted, while a growing quantitative literature investigates the effects of within-country variation in land rights (see e.g. Besley, 1995; Field, 2005, 2007; Deininger et al., 2006; Dercon and Ayalew, 2007; Goldstein and Udry, 2008; Galiani and Schargrodsky, 2010), they do not focus on examining the very inequalities in rights over land. Nevertheless, studying the effects of variation in land rights at the micro level of course rests on the assumption that there is indeed variation in land rights across households or individuals within a country. In fact, all the above studies acknowledge (and take steps to deal with) that land rights are endogenous and based in factors such as wealth, connections and previous land investment.
Goldstein and Udry (2008) stress that land rights in Ghana are ambiguous and negotiable, that they vary across plots and individuals, and that they are closely linked to positions in local social/political hierarchies. In their own words, “tenure security is not a universal attribute of an individual. Rather, an individual’s security of tenure over a particular plot reflects that individual’s position within the local social and political hierarchy and the manner in which the plot was obtained” (Goldstein and Udry, 2008, p. 1009). They argue that whereas a cultivator’s rights over a plot are relatively secure while growing crops, when leaving the land fallow – a form of land investment to increase future yields – there is a risk of

4
losing the rights to the plot. Their empirical findings suggest that individuals who hold powerful positions in a local social or political hierarchy have more secure land rights and that as a consequence they fallow their land longer and thus get higher output. Their findings also demonstrate how these status-related land rights tend to work against women, who experience higher risks of losing their plots while leaving it fallow, and therefore fallow less and thus receive lower yields on their fields. Similarly, Pande and Udry (2006) stress the within-country heterogeneity of effective land rights, suggesting that there is a distribution of tenure security within a country, and Dercon and Ayalew (2007), who study the effects of land rights in Ethiopia, emphasise that land rights vary across households and over time, and depend on the economic, social and political position of the household.
Besley (1995) acknowledges that households in Ghana enjoy different rights on different plots of land and considers the effects of variation in land rights on field-specific investment. To deal with reverse causality from investment to land rights, he instruments for land rights, and his first-stage (2SLS) regressions – using land rights as dependent variable – reveal e.g. that the number of women in the household is negatively associated with rights. Similarly, studying the effects of land rights in Uganda, Deininger et al. (2006) instrument for land rights, and their first-stage regressions suggest a significant impact of how the field was acquired on land rights and indicate that female-headed households have weaker rights.1
Hence, while focusing on the effects of variation in land rights rather than on the variation per se, these studies clearly suggest that land right inequalities are present. Obviously, if the resource base, social status and connections of a household are factors that matter for its effective land rights, then we cannot consider property rights to land as something that is exogenously given by non-discriminatory formal legislation applying equally to all, meaning that exploring the dimensions of effective land right inequalities is warranted.
As we will see in the next section, Rwanda fits well with the description of a dual system for land rights, with both formal legislation and a strong influence of customary land arrangements. It remains to be seen whether this has translated into systematic inequalities in effective land rights.
2.2 Background on Rwandan land use and land rights Rwanda is one of the most densely populated countries in Africa, with over 90 percent of the active population supported by agriculture, the vast majority on subsistence scale (Kairaba, 2002). Naturally, this strains the country’s scarce land resources; the average land holding per household dropped from 2 hectares in 1960 to 0.7 in the early 1990s, and in 2001 almost 60 percent of the households cultivated less than 0.5 hectares (Musahara and Huggins, 2005). Given the pressure on land, having a well-functioning system for land rights is central.
While in the process of changing, Rwanda could be said to have a dual land right system (Kairaba, 2002; Republic of Rwanda, 2004b). First, customary rights are applicable to almost all rural land, traditionally involving successive father-to-son inheritance of smaller and smaller land parcels. Second, the statutory written law governs land in urban areas and some rural lands managed by churches and companies.2
1 Besley (1995) uses information on whether there is a transfer deed for the field, whether the household has ever litigated over its right to the field, how the field was acquired (purchased, allocated, appropriated, gifted, or inherited), how many years the field has been owned, and the number of trees existing at the time of acquisition to instrument for land rights. Deininger et al. (2006) use variables capturing modes of land acquisition as identifying instruments.
2 For an account of the historical – pre-colonial and colonial – evolution of land rights in Rwanda, see e.g. Kairaba (2002), Republic of Rwanda (2004b) Section, 2.1-2.2, and Rose (2004).

5
The high pressure on land, coupled with confusions and contradictions between written legislation and popular conceptions of customary land rights, means that land has often been a source of conflict. As noted, several studies point to land as an important factor in the 1994 genocide (see e.g. André and Platteau, 1998; Kairaba, 2002; Musahara and Huggins, 2005; Vervimp, 2004; and Yanagizawa, 2006). Clearly, the war and genocide amplified the Rwandan land use problem. The deaths of around one million people and the internal and external displacements of millions of others disrupted existing land occupancy patterns and gave rise to multiple claims to plots, in turn resulting in conflicts over land. Reportedly, around 80 percent of disputes taken up in province courts have to do with land (Global IDP project, 2005b). Against this background, it is not surprising that the consensus view is that reform is necessary (Hoyweghen, 1999; UNDAF, 2001; Musahara and Huggins, 2005; ICARRD, 2006; Wyss 2006).
Land reform has indeed been initiated; the new inheritance law of 1999 (Republic of Rwanda, 1999), the National Land Policy of 2004 (Republic of Rwanda, 2004b) and the Land Law of 2005 (Republic of Rwanda, 2005) together constitute a new body of land policy and law improving land rights for women (I will return to this in Section 2.3), promoting rational land use, and emphasising land registration (the formalisation of customary titles) and land consolidation.
Whereas commentators agree that land reform is necessary, there are also concerns that costs of information, land registration fees, demands for rational land use and land consolidation, etc. will enable actors with more resources to exploit the situation and acquire land from poor people with small landholdings under customary tenure arrangements (for a critical discussion of the new Land Law, see Kairaba, 2002; Musahara and Huggins, 2005; and Pottier, 2006). It is clear that land reform is a sensitive issue with extremely important distributional consequences.
While the new legislation has been put forward, the implementation process has only started – institutional change is a slow process, the existing customary system is firmly rooted, and it will take considerable time before the de jure rights translate into effective land rights applying to Rwandan land users. The results in the present paper are based on data from 2005/06, and will thus not capture the effects of the land reform. Rather, they will provide insights on systematic land right inequalities existing in the break between the old and the new system. As such, they could provide guidance relevant for the implementation of the land reform, as well as a point of reference for future evaluation of its distributional impact.
2.3 Land right inequalities: the Rwandan context The answer to the question of what land right inequality dimensions are relevant to consider of course depends on the context. In Rwanda, the answer is shaped by the tragic events of 1994. With the war and genocide and the turmoil that followed in mind, it is of interest to explore the comparative land right status of female-headed households, young household heads, conflict-induced migrants and households resettled in the Imidugudu village settlements.3
The civil war and genocide – which involved the deaths of around one million individuals and internal and external displacement of several millions – resulted in a sharp rise in the number of female- and child-headed households. During the genocide, men were disproportionately targeted, leaving Rwanda with a skewed demographic structure and vast numbers of widows and orphans. Today, women make up around 52% of the Rwandan
3 Considering the endogeneity of economic standing in this context – while income could presumably affect a household’s effective land rights, its land rights should of course also affect income – I do not explore variation in land rights across income segments.

6
population and head some 35% of all Rwandan households (Daley et al., 2010), and estimates (albeit varying) suggest that there are hundreds of thousands of orphans, many of whom have had to act as household heads (Rose, 2005).
Traditionally, the land rights of Rwandan women have been weak. According to custom, land ownership in Rwanda is the prerogative of men, with land being inherited from father to son (Republic of Rwanda, 2004b). Sons received land from their fathers when reaching maturity, usually at the time of marriage. Women, on the other hand, received only usufruct rights – from their father or some other male relative if they were unmarried and from their husbands if they were married (Rose, 2004, 2005). Even as a widow, a woman was only entitled usufruct rights over family land while waiting for her sons to reach maturity. And if her husband died before they had children, a woman could not claim any of her husband’s land unless she married one of his brothers, in which case the new husband became the owner of the land (Republic of Rwanda, 2004b).
However, several pieces of new legislation have now significantly improved the de jure land rights of Rwandan women (for a detailed account, see Rose, 2004, and Daley et al., 2010). The inheritance law put forward in 1999 specifies that all legitimate children shall inherit equally without any discrimination between males and females (Republic of Rwanda, 1999, Article 50). The National Land Policy of 2004 establishes that ‘all Rwandans enjoy the same rights of access to land without any discrimination whatsoever’ (Republic of Rwanda, 2004b, p. 23). Additionally, the Land Law of 2005 makes clear that ‘discrimination either based on sex or origin in matters relating to ownership or possession of rights over the land is prohibited’, and that ‘the wife and the husband have equal rights over the land’ (Republic of Rwanda, 2005, Article 4).
Although this new body of legislation constitutes a progressive first step towards strengthening women’s land rights, merely formulating policy documents and laws is not enough. Institutional change is a slow process, and a significant challenge remains at the level of implementation. The fieldwork of Daley et al. (2010), conducted in 2006, suggests an increased tendency of young women to receive some portion (albeit small and comparatively infertile) of their parents’ land at the time of its distribution within the family. However, their findings also indicate a limited awareness about the new body of land policy and law, as well as significant resistance to change due to deeply-ingrained cultural norms.4
Turning to the land rights of child-headed households, after 1994, many newly orphaned children returned to their communities to find that the land of their deceased parents had been taken over by others. As described in Rose (2005), the orphans faced barriers in terms of information, status, experience, and resources when defending their land claims, and the existing customary laws were ill-equipped to protect their interests. The land rights of orphans, particularly girls, were limited under customary law, and they needed guardians to represent their interests. In many cases, however, the close relatives who could have served as guardians had died during the war, and when relatives did in fact become guardians, it was not uncommon that they competed with the orphans for the scarce land rather than helped them to protect their land rights. Also, orphans’ land rights were reportedly not always respected by local authorities, who sometimes allocated their land to returning refugees (Rose,
Seemingly, the recent improvements in the de jure land rights of women have a long way to go before they translate into gender equality in actual land practices. With this ongoing process in mind, it seems highly relevant to quantitatively explore effective land right inequalities across female- and male-headed households.
4 In addition, there are remaining weaknesses in the law, e.g. with respect to women’s land rights in case of separation or divorce and the land rights of non-legally married women and ‘illegitimate children’ (Kairaba, 2002; Daley et al., 2010).

7
2005). Against this background, it seems relevant to consider the comparative land rights of households headed by young individuals.
With respect to the land rights of conflict-induced migrants, as noted, the civil war and genocide brought massive population displacements. The period after the genocide saw the return of millions of refugees – both those who had been refused entry to the country for decades (the so called old case-load, or OCL, refugees), those who fled the country during the genocide, and those who had been internally displaced during the same period.5
A final dimension of potential land right inequality in Rwanda concerns households resettled into the ‘Imidugudu’ village settlements. The 1996 villagisation policy, or Imidugudu, was initially designed to help resolve the housing shortage and address the problem of settlement and land use following the refugee inflows and the destruction of houses and infrastructure during the war and genocide. At the time of implementation, however, it was redefined as an ambitious development programme
Given the scale of the conflict-induced displacement, and the multiple claims to plots that this reportedly often resulted in (Musahara and Huggins, 2005), it seems highly relevant to explore possible land right inequalities across migrant and non-migrant groups.
6
establishing that all Rwandans living in scattered homesteads should be regrouped into village settlements (Global IDP Project, 2005a). The programme has faced substantial criticism (see the discussion in Isaksson, 2011a). Objections have not least concerned land allocation; there have been reports of forced relocations and of lack of compensation to people whose land was confiscated for the purpose of building Imidugudu sites, and it has been suggested that each Imidugudu household has been allocated too little land and that the new fields are located too far away from the farmers’ houses (UNDG, 2000; Human Rights Watch, 2001; Global IDP Project, 2005b). By 1999-2000, when the construction of new sites waned off, the policy had already affected nearly 20 percent of the population (Republic of Rwanda, 2004). Considering the wide coverage of the villagisation policy, and its important implications for land allocation, living in Imidugudu settlements seems to be an important dimension to consider when exploring potential land right inequalities in Rwanda.
3 Data and empirical strategy The aim of the present paper is to examine the existence and patterns of systematic land right inequalities in Rwanda. To this end, I use data on land tenure arrangements obtained from Rwanda’s 2005/06 EICV2 (Enquete Intégrale sur le Conditions de Vie des Ménages) household survey, yielding a sample of 5,279 rural households, and estimate the following benchmark OLS equation:
iriiii αR εδβ ++++= γHHCLAG . That is, the land rights of household i ( iR ) are taken to depend on household group affiliations ( iG ), household land assets ( iLA ), and household composition factors ( iHHC ), allowing for region fixed effects rγ . Being interested in systematic group inequalities in effective land rights, the key set of parameters is given by α . To explore whether land inequalities originate in systematic variation in tenure arrangements or whether there are differences in effective land rights across households cultivating plots under the same de jure 5 For an in-depth account of Rwandan displacement patterns, and of the history of the OCL and NCL refugee groups, see Global IDP project (2005a,b). 6 The hope was that settling people in clusters would facilitate the provision of basic services and infrastructure and help develop markets with opportunities for non-agricultural activity.
8
land tenure regimes, I alter the dependent variable in focus (see Section 3.1). To investigate the importance of cross-cutting inequalities, I also run estimations including interaction terms between the group affiliations in iG . Below I discuss the key variables included in the empirical analysis (for variable definitions and summary statistics, see Tables A1-A2).
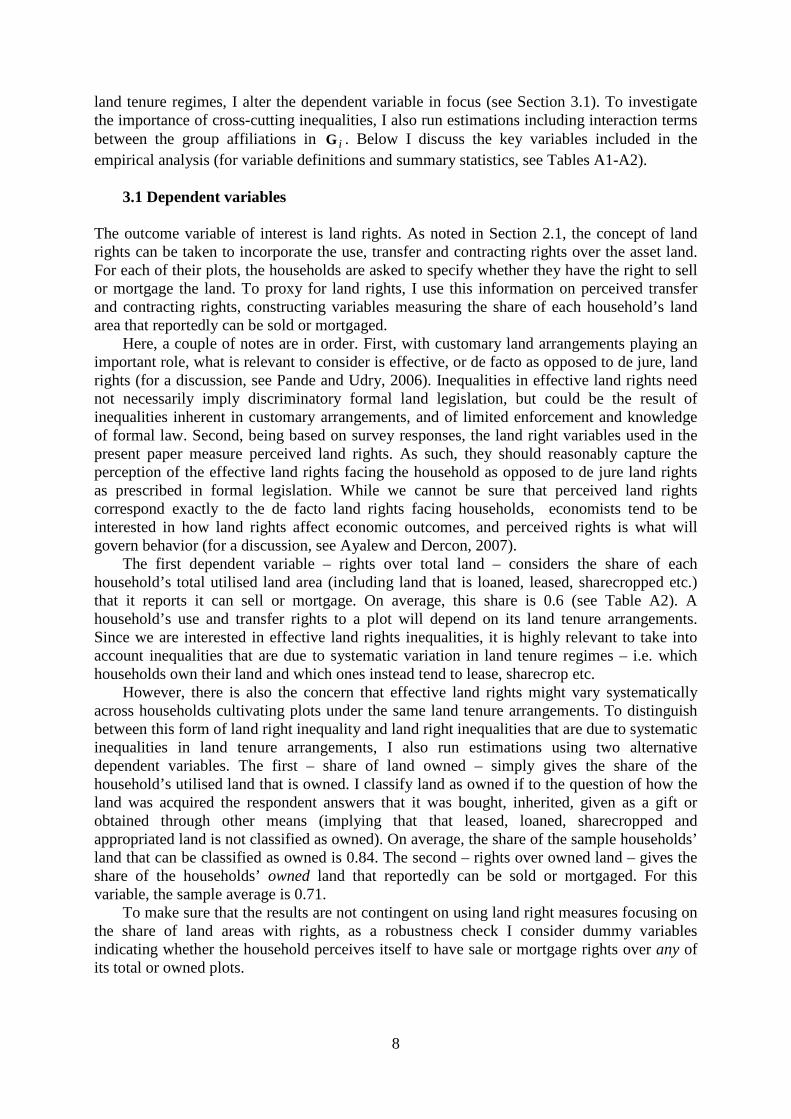
3.1 Dependent variables The outcome variable of interest is land rights. As noted in Section 2.1, the concept of land rights can be taken to incorporate the use, transfer and contracting rights over the asset land. For each of their plots, the households are asked to specify whether they have the right to sell or mortgage the land. To proxy for land rights, I use this information on perceived transfer and contracting rights, constructing variables measuring the share of each household’s land area that reportedly can be sold or mortgaged.
Here, a couple of notes are in order. First, with customary land arrangements playing an important role, what is relevant to consider is effective, or de facto as opposed to de jure, land rights (for a discussion, see Pande and Udry, 2006). Inequalities in effective land rights need not necessarily imply discriminatory formal land legislation, but could be the result of inequalities inherent in customary arrangements, and of limited enforcement and knowledge of formal law. Second, being based on survey responses, the land right variables used in the present paper measure perceived land rights. As such, they should reasonably capture the perception of the effective land rights facing the household as opposed to de jure land rights as prescribed in formal legislation. While we cannot be sure that perceived land rights correspond exactly to the de facto land rights facing households, economists tend to be interested in how land rights affect economic outcomes, and perceived rights is what will govern behavior (for a discussion, see Ayalew and Dercon, 2007).
The first dependent variable – rights over total land – considers the share of each household’s total utilised land area (including land that is loaned, leased, sharecropped etc.) that it reports it can sell or mortgage. On average, this share is 0.6 (see Table A2). A household’s use and transfer rights to a plot will depend on its land tenure arrangements. Since we are interested in effective land rights inequalities, it is highly relevant to take into account inequalities that are due to systematic variation in land tenure regimes – i.e. which households own their land and which ones instead tend to lease, sharecrop etc.
However, there is also the concern that effective land rights might vary systematically across households cultivating plots under the same land tenure arrangements. To distinguish between this form of land right inequality and land right inequalities that are due to systematic inequalities in land tenure arrangements, I also run estimations using two alternative dependent variables. The first – share of land owned – simply gives the share of the household’s utilised land that is owned. I classify land as owned if to the question of how the land was acquired the respondent answers that it was bought, inherited, given as a gift or obtained through other means (implying that that leased, loaned, sharecropped and appropriated land is not classified as owned). On average, the share of the sample households’ land that can be classified as owned is 0.84. The second – rights over owned land – gives the share of the households’ owned land that reportedly can be sold or mortgaged. For this variable, the sample average is 0.71.
To make sure that the results are not contingent on using land right measures focusing on the share of land areas with rights, as a robustness check I consider dummy variables indicating whether the household perceives itself to have sale or mortgage rights over any of its total or owned plots.

9
3.2 Explanatory variables The explanatory variables in focus are the potential land inequality dimensions discussed in Section 2.3, as captured by the group affiliation variables ( iG ) in the benchmark regression setup. Against the background of the war and genocide, I explore the comparative land right status of female-headed households, households with young household heads, conflict-induced migrant groups, and households resettled in the Imidugudu village settlements.
To capture female-headed households I use a dummy variable taking the value one if the reported household head is female (28 percent of our sample households).7 Unfortunately, the data contains no satisfactory information allowing us to capture the child-headed households produced by the war and genocide.8 We have information on the age of the household head, however, and can thus explore potential variation in effective land rights across household head age groups. I consider age in years (plus its square term) as well as age group dummies. 18 percent of our sample households are under the age of 30, which means that they were 18 our younger at the time of the genocide. To capture conflict-displaced households I use a dummy variable taking the value one if the household head reports to have been displaced due to conflict and to have arrived at the current region of residence between 1994 and 2000 (29 percent of the sample households).9
When examining the existence of land right inequalities along these dimensions, one has to consider that households have multiple group affiliations, which in terms of the concerned inequalities could be reinforcing or contradictory (for a discussion of the importance of considering intersectionality when studying group inequalities, see Anthias, 1998). Moreover, in many cases group overlaps are likely to be systematic – we know, for instance, that conflict returnees and female-headed households are over-represented in the Imidugudu settlements (Isaksson, 2011a). Against this background, when examining land right inequalities associated with one particular group dimension, it seems appropriate to condition on the other group affiliations deemed relevant, as well as to explore cross-cutting inequalities – i.e. whether intersecting group affiliations reinforce or offset each other in terms of land right inequalities. To approach the latter, I run estimations including interaction terms between the above group dimensions.
Second, to proxy for being an OCL refugee – a sub-group of the conflict displaced – I use a dummy variable taking the value one for households that have been conflict displaced (according to the above definition) and whose point of out-migration (proxied by the year the household head settled in the household’s current residence minus the number of years the household resided in the previous location) was before 1990. Five percent of the sample households belong to this group. Finally, I use a dummy variable indicating whether the household lives in an Imidugudu settlement. While 18 percent of the surveyed rural households report doing so, the great majority of households still live in isolated communities.
I control for household land assets, household composition variables, and regional variation. To find out whether land right inequalities constitute an inequality dimension that exists on top of inequalities in terms of the size and composition of household land holdings,10
7 While it would be interesting to consider potential variation in land rights between males and females within the household, the data unfortunately restricts us to considering variation across households.
or whether they simply pick up the latter, I control for the total size of household
8 The survey only asks respondents below the age of 20 about whether their parents are alive, and there is no information on when parents died. Respondents who were younger than 20 at the time of the survey (less than 1 percent of the household heads in the sample) were 8 years or younger at the time of the genocide. Hence, we cannot capture the group of somewhat older genocide orphans, who were presumably more likely to end up having to head a household. 9 Different cut-off dates are used as robustness checks, with no change in results. 10 Unfortunately, there is no good proxy for land quality in the data.

10
land holdings (in log hectares) and land fragmentation. With respect to the size of land holdings, households with large land assets are likely to be resource rich as well as comparatively powerful in local social and political hierarchies. In line with the discussion in Section 2.1, this should make them better able to defend their land rights, which presumably also makes them more confident in their rights to sell or mortgage their fields without being challenged.11
Turning to the household composition controls, I account for household size (number of household members) and age composition (the share of household members of working age), and for the household head being married or a widow/er. According to the discussion in Section 2.3, which suggests that men traditionally receive land from their fathers at the time of marriage and that women often lose their rights over the household land if their husbands die, marital status should affect land rights. Moreover, in line with the reasoning in Section 2.1, we cannot rule out that land rights depend on household size and age composition, via e.g. the household availability of guard labour. Table 1 shows that the family composition variables tend to vary systematically across our focus groups. In particular, female household heads are often unmarried or widows. With this in mind, we would like to know whether observed group inequalities are due to systematic group variation in family composition or whether they in fact persist when comparing, say, widowed female and male household heads.
With respect to land fragmentation, the traditional system of father-to-son land inheritance, i.e. dividing up the family land among the sons of the family, has contributed to increasingly fragmented landholdings (ICARRD, 2006). Besides supposedly affecting farm yields negatively, land fragmentation could have a negative effect on effective land rights since it makes supervision and protection of the land difficult (see Bizimana et al., 2004). To capture fragmented landholdings I use the Simpson index for farm fragmentation (see Table A1), which ranges from 0 to 1 and takes the value 0 when the farm consists of a single parcel and approaches 1 for farms split into many plots of equal size.
Finally, with respect to the regional controls, 11 region dummies12
or 440 cluster dummies are included to pick up potential regional variation in effective land rights resulting e.g. from differences in population density or land quality, in turn affecting the pressure on land. The regional controls allow us to explore whether the observed group variation in land rights is due to certain groups being overrepresented in certain areas of the country, or whether they also exist when comparing groups within regions or village clusters.
4 Results Looking at the group means in Table 1, we can see that while there is systematic variation across groups both in terms of reported land rights and in terms of land tenure arrangements, the two do not always go together in the expected way. Compared to male-headed households, female-headed households tend to have smaller landholdings, which to a greater extent have been inherited or received as a gift, and to a lesser extent have been purchased, or are leased or sharecropped. However, in spite of supposedly owning a larger share of their land, female-headed households to a lesser extent report to have the right to sell and mortgage it. The land rights of younger, as compared to older, household heads appear more in line with differences in tenure arrangements. Households with younger household heads do not only tend to have less land, they also tend to own less of their land – a small portion of it has been
11 There is an element of endogeneity involved here; households with better land rights might reap economic benefits enabling them to acquire more land. Nevertheless, it is interesting to explore to what extent land right inequalities remain when controlling for inequalities in terms of land holdings. 12The region dummies refer to the administrative structure which existed at the onset of the EICV data collection period and according to which Rwanda was divided into 12 (11 rural) provinces. Today, Rwanda is formally divided into the Northern, Eastern, Southern and Western provinces, plus the City of Kigali.

11
purchased and more of it is leased, loaned or sharecropped – implying that they also have less land with sale and mortgage rights. Although compared to their non-displaced and non-Imidugudu counterparts households that have been displaced due to conflict and households living in Imidugudu settlements tend to have land holdings of similar size and tend to own their land to similar extents, the latter groups have inherited less of their land and instead stand out by having received land as a gift or having acquired it through alternative means (e.g. appropriation and being allocated land by the government). They also report weaker rights over their land, both when considering the total area of utilised land and when focusing solely on the land they actually own.
However, while revealing some important patterns, comparing group means ignores the fact that households have multiple group affiliations, which in terms of effective land rights could be reinforcing or contradictory, and which are likely to overlap systematically. Hence, when examining land right inequalities associated with one particular group identification it is appropriate to condition on the other group affiliations that are deemed relevant.
Table 2 presents the results of regressions using the share of the households’ total land holdings (including land that is loaned, leased or sharecropped) that can be sold or mortgaged as dependent variable. As it turns out, conditioning on all group affiliations (Regression 1), the main pattern observed in Table 1 remains intact.
Most strikingly, the result that female-headed households have weaker land rights is consistent over all specifications. Controlling for the size and fragmentation of the households’ land holdings (Regression 3) does not change this picture. Neither does taking the fact that female household heads are often unmarried or widows into account. In fact, when controlling for household composition variables including marital status and being a widow/widower (Regression 4), the difference between female- and male-headed households, if anything, becomes more pronounced. If female-headed households are more prevalent in certain regions of the country (e.g. due to more genocide survivors settling in certain areas) and effective land rights vary across regions (e.g. due to regional differences in population density or land quality, in turn affecting the pressure on land) this could influence the estimate. However, when accounting for average land right differences across provinces (Regression 5) or village clusters (Regression 6), the gender gap is still there. Conditional on the full set of controls, the share of household land that can be sold or mortgaged is around 8 percentage points smaller for female- than for male-headed households.
The results still indicate that households with older household heads have better rights (the effect being slightly diminishing as evidenced by the negative, albeit very small, coefficient on the age square term). However, when conditioning for the household composition variables (Regression 4), the age of the household head no longer comes out with a statistically significant coefficient. Presumably, the observed age effect picked up differences in, say, marital status.
Also, when controlling for all group affiliations, then having been displaced due to conflict and living in Imidugudu settlements are both still negatively related to land rights. Controlling for if the household belongs to the sub-group of the conflict-displaced households known as the ‘old case-load’ refugees (Regression 2), it seems as though the conflict-displaced households with comparatively weak land rights are those who were displaced in connection to the genocide. Controlling for land assets (Regression 3) and household composition variables (Regression 4) does not change this picture. However, the observed group inequalities do not remain in the face of the regional controls (Regressions 5-6), seemingly suggesting that the weaker land rights observed for these groups are due to a common tendency for weaker rights in regions/villages where the concerned groups are over-represented. While their coefficients are not presented, it is interesting to note that the great

12
majority of the region/village dummies come out statistically significant, suggesting systematic regional variation in perceived land rights.13
As noted above, inequalities in rights over the total land utilised by the household, i.e. including land that is loaned, leased or sharecropped, should to a large extent depend on systematic variation in tenure arrangements. It is interesting to distinguish between this form of land right inequality and possible inequalities in effective land rights existing across households cultivating plots under similar land tenure arrangements.
The group means in Table 1 seemed to suggest that the variations in terms of land rights and of land ownership status do not always go together in the expected way. In particular, the comparison of means suggested that female-headed households own a larger share of their land than do male-headed households, yet nevertheless report weaker rights. And as it turns out, running regressions using the share of the households’ land holdings that can be classified as owned as dependent variable (Table 3), the observed inequalities in ownership shares do not follow the same pattern as inequalities in rights over total utilised land. Conditioning on all group affiliations (Table 3, Regression 1), the only inequality that is similar to what we observed for rights over total land is the positive age effect, which does not withstand the introduction of the household composition and regional controls (Regressions 4-6). There is no statistically significant difference between female- and male-headed households, and when including the full set of controls (Regression 6) the estimation actually suggests a greater ownership share among households that have recently been displaced due to conflict.
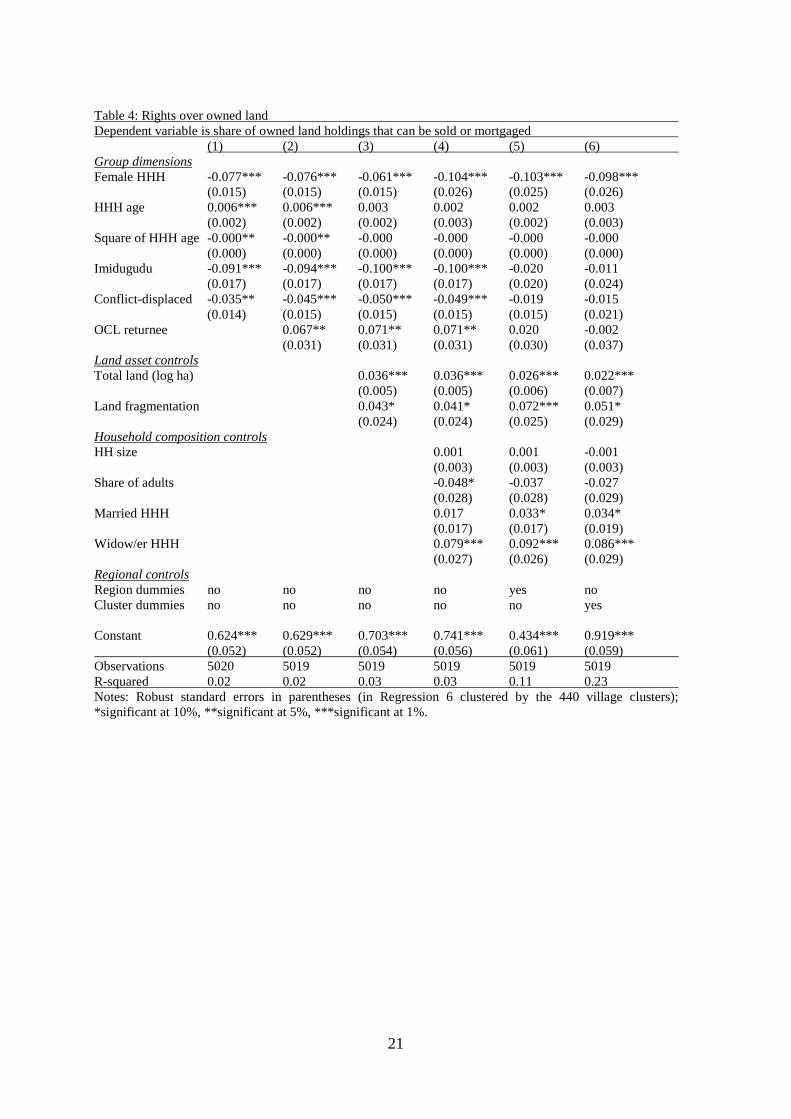
Considering regressions focusing on the rights over owned land (Table 4), however, the displayed group inequality patterns are very similar to those observed for rights over total land holdings. Households with older household heads still report stronger rights (now, the effect does not withstand the introduction of the land assets controls), and female-headed, Imidugudu and conflict-displaced households still report weaker rights. The only substantial difference is that the sub-group of the conflict-displaced households who have been out of the country for a longer period of time – the OCL returnees – actually report stronger rights on owned land. In line with this finding, it has been suggested that OCL returnees received better assistance in terms of land allocation during the resettlement process than did those who were displaced during the genocide (Musahara and Huggins, 2005; Wyss, 2006). Yet again, as for rights over total land, the observed group inequalities for the conflict-displaced households – OCL or otherwise – do not remain in the face of the regional controls (Regressions 5-6), which seemingly suggests that they have to do with the refugee groups resettling in regions that differ in terms of effective land rights. For instance, many OCL refugees settled in the relatively sparsely populated eastern part of the country (Takeuchi and Marara, 2007).
As noted, considering that households have multiple group affiliations – which might reinforce or offset each other in terms of land right inequalities – it is relevant to explore the impact of intersecting group connections. Table 5 presents the results of estimations including interaction terms between the key group dimensions, focusing on rights over total land (Panel A) and rights over owned land (Panel B). As it turns out, the evidence for group interaction effects is relatively limited. While there is some indication that female-headed households 13 Furthermore, with respect to the included land asset controls, we can note that households with larger and less fragmented land holdings tend to report stronger rights. This could reflect that more resource-rich households are better able to defend their land rights (or for that matter that households with better land rights reap economic benefits enabling them to acquire more and better quality land). As regards the household composition controls, household size and share of adults do not come out significantly related to land rights. On the other hand, being married and being a widow/er are both positively related to rights. The positive effect of being married should reflect the tradition to receive land when marrying (see the discussion in Section 2.3). Considering that we have an indicator capturing whether the household is headed by a female in the regression, the widow/er dummy presumably picks up the effect of being a widower rather than a widow.

13
living in the Imidugudu settlements have particularly weak rights over total land (seemingly, living in Imidugudu is only negatively related with rights among households headed by women), and that conflict-displaced households fare worse in terms of land rights if the household head is relatively old,14 the concerned interaction parameters are only weakly statistically significant. The interaction effect suggesting that Imidugudu households have weaker rights over total land if the household head is older is somewhat more stable,15
The results in Tables 2 and 4 suggested that Imidugudu households have the right to sell and mortgage a smaller share of their land, but that this difference has to do with Imidugudu households being overrepresented in regions with weaker rights. Comparing Imidugudu and non-Imidugudu households within regions we did not observe a difference in terms of land rights. However, according to the interaction term estimations in Table 5, which also control for regional variation, there is some indication that some groups of the Imidugudu households – namely those headed by women or older individuals – still fare comparatively worse in terms of land rights.
and this is also the only interaction effect that is statistically significant (albeit only at the 10 percent level) when focusing on rights over owned land.
Summing up the results so far, we can observe systematic inequalities in perceived land rights with respect to both the total land utilised by the households – which should presumably hinge on systematic variation in land tenure arrangements – and the land which can be classified as owned. In fact, there is more evidence of inequalities in rights than in ownership shares, and the two do not necessarily go hand in hand. In particular, while female-headed households do not differ significantly from male-headed households in terms of ownership shares, the result that they have weaker land rights is consistent over all specifications. While the evidence for group interaction effects is relatively limited, there is some indication that Imidugudu households headed by women or old individuals have particularly weak rights over their land. The next section explores the robustness of the main findings (the results are available upon request).
4.1 Further testing
In the benchmark estimations the key dependent variables focused on the share of a household’s total or owned land area that reportedly could be sold or mortgaged. To be sure that the results are not contingent on using land right measures focusing on the share of land area with rights – presumably it could be more important to have rights over a small but high quality plot than over a large but low quality parcel – I run (probit) estimations instead considering dummy variables indicating if the household perceives to have sale or mortgage rights over any of its total or owned plots. The observed group inequalities remain qualitatively the same.
Since we are interested in the extent to which land right inequalities are due to differences in land tenure arrangements and to what extent they persist when focusing on land cultivated under similar land tenure regimes, we have considered rights over total land as well as rights over land that can be classified as owned. However, the owned land has been acquired through different means, and previous studies have shown that mode of acquisition matters for effective land rights (Besley, 1995; and Deininger et al., 2006). To explore whether the
14 The effect of being conflict-displaced is only statistically significant (at the 10 percent level) if the household head is 65 or older. The age effect is neither statistically significant in the displaced group nor in the non-displaced group. 15 The effect of living in an Imidugudu settlement is statistically significant for households where the household head is 49 or older. The age effect is neither statistically significant among the Imidugudu nor among the non-Imidugudu households.
14
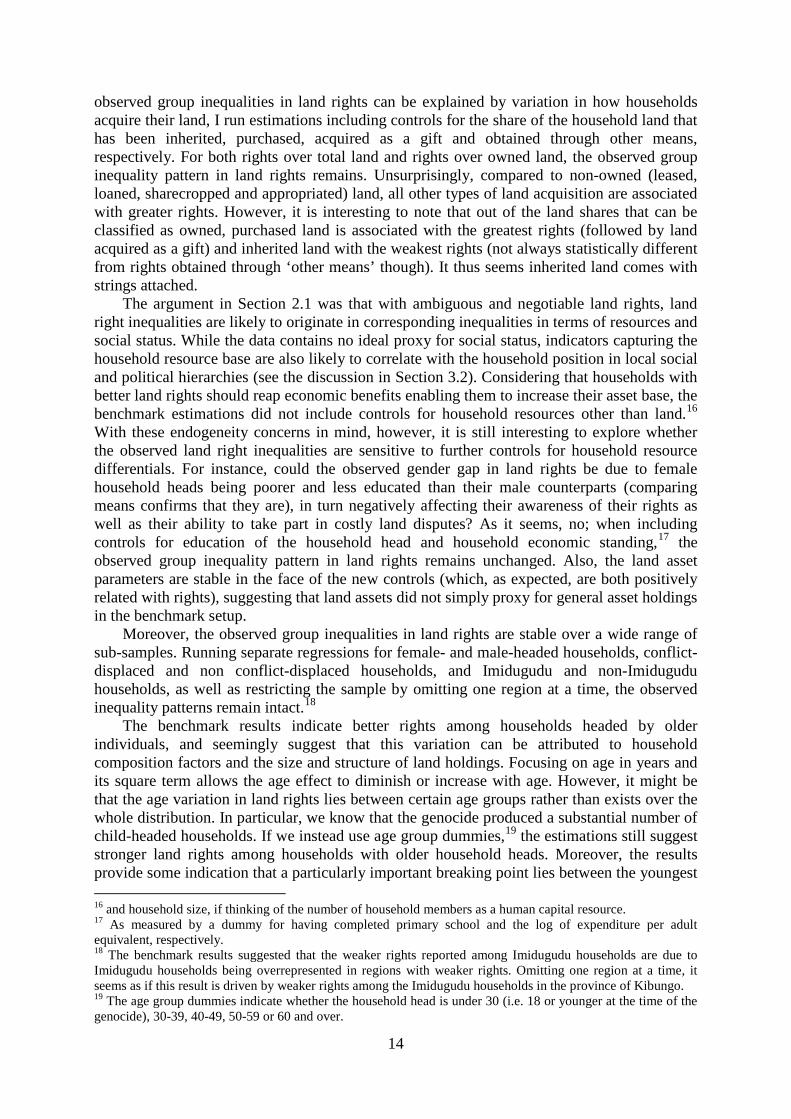
observed group inequalities in land rights can be explained by variation in how households acquire their land, I run estimations including controls for the share of the household land that has been inherited, purchased, acquired as a gift and obtained through other means, respectively. For both rights over total land and rights over owned land, the observed group inequality pattern in land rights remains. Unsurprisingly, compared to non-owned (leased, loaned, sharecropped and appropriated) land, all other types of land acquisition are associated with greater rights. However, it is interesting to note that out of the land shares that can be classified as owned, purchased land is associated with the greatest rights (followed by land acquired as a gift) and inherited land with the weakest rights (not always statistically different from rights obtained through ‘other means’ though). It thus seems inherited land comes with strings attached.
The argument in Section 2.1 was that with ambiguous and negotiable land rights, land right inequalities are likely to originate in corresponding inequalities in terms of resources and social status. While the data contains no ideal proxy for social status, indicators capturing the household resource base are also likely to correlate with the household position in local social and political hierarchies (see the discussion in Section 3.2). Considering that households with better land rights should reap economic benefits enabling them to increase their asset base, the benchmark estimations did not include controls for household resources other than land.16 With these endogeneity concerns in mind, however, it is still interesting to explore whether the observed land right inequalities are sensitive to further controls for household resource differentials. For instance, could the observed gender gap in land rights be due to female household heads being poorer and less educated than their male counterparts (comparing means confirms that they are), in turn negatively affecting their awareness of their rights as well as their ability to take part in costly land disputes? As it seems, no; when including controls for education of the household head and household economic standing,17
Moreover, the observed group inequalities in land rights are stable over a wide range of sub-samples. Running separate regressions for female- and male-headed households, conflict-displaced and non conflict-displaced households, and Imidugudu and non-Imidugudu households, as well as restricting the sample by omitting one region at a time, the observed inequality patterns remain intact.
the observed group inequality pattern in land rights remains unchanged. Also, the land asset parameters are stable in the face of the new controls (which, as expected, are both positively related with rights), suggesting that land assets did not simply proxy for general asset holdings in the benchmark setup.
18
The benchmark results indicate better rights among households headed by older individuals, and seemingly suggest that this variation can be attributed to household composition factors and the size and structure of land holdings. Focusing on age in years and its square term allows the age effect to diminish or increase with age. However, it might be that the age variation in land rights lies between certain age groups rather than exists over the whole distribution. In particular, we know that the genocide produced a substantial number of child-headed households. If we instead use age group dummies,
19
16 and household size, if thinking of the number of household members as a human capital resource.
the estimations still suggest stronger land rights among households with older household heads. Moreover, the results provide some indication that a particularly important breaking point lies between the youngest
17 As measured by a dummy for having completed primary school and the log of expenditure per adult equivalent, respectively. 18 The benchmark results suggested that the weaker rights reported among Imidugudu households are due to Imidugudu households being overrepresented in regions with weaker rights. Omitting one region at a time, it seems as if this result is driven by weaker rights among the Imidugudu households in the province of Kibungo. 19 The age group dummies indicate whether the household head is under 30 (i.e. 18 or younger at the time of the genocide), 30-39, 40-49, 50-59 or 60 and over.

15
age group and the rest, possibly capturing the vulnerability of the child-headed households produced by the genocide. For rights over total land, only the difference between the youngest group (those under 30, who were 18 or younger at the time of the genocide) and the oldest groups (those over 50) survive the inclusion of controls for regional variation, household composition and land assets. With respect to rights over owned land, the difference (which does not survive the inclusion of the above mentioned controls) lies between the youngest group and the rest, with no statistically significant variation in rights between the other age groups. Most stable, however, is the tendency for households with older household heads to own a larger share of their land,20
seemingly suggesting that the most important age variation in land rights emanates from differences in land tenure arrangements rather than from differences in rights over land cultivated under similar land tenure regimes.
5 Conclusions Motivated by the importance of property rights institutions for economic development and by the recent literature suggesting within-country variation in property rights, the present paper explored the existence and patterns of systematic within-country inequalities in effective land rights.
The basic argument behind the hypothesised land right inequalities is that the dual land system prevalent in many developing countries – with formal land law and customary land arrangements existing in parallel – gives land rights that are ambiguous and negotiable and thereby prone to inequalities based in status and resource differentials.
The results of empirical estimations drawing on data on the land tenure arrangements of over 5,000 Rwandan households indeed suggest systematic within-country inequalities in land rights, with households headed by women or young individuals and households that have been displaced due to conflict or that have resettled in the Imidugudu village settlements all reporting significantly weaker rights than their respective comparison groups. The weaker rights reported by young house hold heads seem to be driven by household composition factors and the size and structure of land holdings, and the weaker rights among Imidugudu and conflict-displaced households appear attributable to the concerned groups being over-represented in regions where land rights tend to be weaker. The weaker land rights observed for female- than for male-headed households, however, remain when accounting for region of residence, land assets and family composition. That the gender imbalance in land rights cannot be explained by observed household characteristics suggests that an unobserved factor – such as variation in social status – is at play.
The same inequality pattern emerges both when considering rights over the total land utilised by the households – including land that is leased or sharecropped – and when focusing solely on rights over land that can be classified as owned. Hence, the observed inequalities are not only the result of systematic variation in tenure arrangements, but also exist when comparing households cultivating plots under similar land tenure regimes.
Also, the identified inequality pattern is robust over a wide range of alternative specifications and sub-samples. It withstands using alternative land rights indicators as dependent variables, and remains intact when controlling for mode of land acquisition as well as for education and economic standing. In particular, the result that female-headed households report weaker rights is robust over all specifications.
So what lessons can we draw from this? The present study considers the operation of a specific property rights institution – land rights – in a specific country – Rwanda. And just as
20 There is a statistically significant difference between all age groups, even when controlling for regional variation, household composition and land assets.

16
the nature of property rights is likely to vary depending on which assets they concern, the prevalence and pattern of land right inequalities is likely to vary across contexts. However, while Rwanda is an individual case, and as such is characterised by particular circumstances, it undoubtedly shares its dual system for land rights with many developing countries. Moreover, the results of the present paper are clearly in line with the treatment of land rights as endogenous in the previously discussed studies of land rights in other African countries. Hence, the findings of this paper arguably shed light on conditions relevant for many developing countries where property rights are ambiguous and negotiable.
The results of the present paper indicate that unequal property rights to land constitute an important inequality dimension that exists on top of inequalities in terms of the size of land holdings. As such, they highlight the need to – unlike much of the quantitative literature in the field – carefully evaluate how property rights apply to different segments of the population in a country. Moreover, the findings point to the importance of considering effective land rights and, when evaluating land reform, of carefully monitoring the extent to which changes in de jure land legislation translate into de facto developments in the field. With respect to the Rwandan case, considering that the country is in the process of implementing an extensive land reform, it is crucial that policy makers are aware of existing inequalities in terms of effective land rights. With the legislative reform follows two major challenges – ensuring that the new law is enforced and that households are informed about its content. The results of the present paper can help guide this process, and provide a point of reference for future evaluation of the reform’s distributional effects.
References Acemoglu, D., Johnson, S., & Robinson, J. A. (2001) “The colonial origins of comparative development: an
empirical investigation”, American Economic Review, 91(5), 1369-1401. Acemoglu, D., Johnson, S., & Robinson, J. A. (2002) “Reversal of fortune: Geography and institutions in the
making of the modern world income distribution”, The Quarterly Journal of Economics, 117(4), 1231-1293.
André, C. and J-P Platteau (1998) “Land relations under unbearable stress: Rwanda caught in the Malthusian trap”, Journal of Economic Behaviour & Organization, vol. 34, pp. 1-47.
Anthias, F. (1998) “Rethinking social divisions: some notes towards a theoretical framework”, The Sociological Review, 46(3), pp. 505-535.
Besley, T. (1995) “Property rights and incentives: Theory and evidence from Ghana”, Journal of Political Economy, 103(5), pp. 903-937.
Besley, T. and M. Ghatak (2009) “Property rights and economic development”, Centre for Economic Policy Research Discussion Paper Series, no. 7243, Section 2.4.
Bizimana, C., W.L. Nieuwoudt and S.R.D. Ferrer (2004) “Farm size, land fragmentation and economic efficiency in southern Rwanda”, Agrekon, 43(2).
Daley, E., Dore-Weeks, R. and C. Umuhoza (2010) “Ahead of the game: land tenure reform in Rwanda and the process of securing women's land rights”, Journal of Eastern African Studies, 4(1), pp. 131-152.
Deininger, K. (2003) Land policies for growth and poverty reduction, Washington: World Bank and Oxford University Press.
Deininger, K., Ayalew, D. and T. Yamano (2006) “Legal knowledge and economic development: The case of land rights in Uganda”, World Bank Policy Research Working Paper no. 3868.
Deininger, K., Goyal, A. and H. Nagarajan (2010) “Inheritance Law Reform and Women's Access to Capital: Evidence from India's Hindu Succession Act”, Policy Research Working Paper no. 5338, The World Bank Development Research Group, Agriculture and Rural Development Team.
Dercon S. and D. Ayalew (2007) “Land Rights, Power and Trees in Rural Ethiopia”, CSAE WPS/2007-07. Field, E. (2005) “Property rights and investment in urban slums”, Journal of the European Economic
Association, 3(2-3), pp. 279-290 Field, E. (2007) “Entitled to work: Urban property rights and labor supply in Peru”, Quarterly Journal of
Economics, 122(4), pp. 1561-1602. Galiani, S. and E. Schargrodsky (2010) “Property rights for the poor: Effects of land titling”, Journal of Public
Economics, 94(9-10), pp. 700-729.

17
Global IDP project (2005a) “Ensuring durable solutions for Rwanda’s displaced people: a chapter closed too early”, Global IDP Project / Norwegian Refugee Council 08-07-2005, available at: www.idpproject.org
Global IDP project (2005b) “Profile of internal displacement: Rwanda”, Compilation of the information available in the Global IDP database / Norwegian Refugee Council, available at: http://www.idpproject.org
Goldstein, M. and C. Udry (2008) “The profits of power: Land rights and agricultural investment in Ghana”, The Journal of Political Economy, 116(6), pp. 981-1021.
Hall, R. E., & Jones, C. I. (1999) “Why do some countries produce so much more output per worker than others?”, The Quarterly Journal of Economics, 114(1), 83-116.
Hoyweghen, S. van (1999) “The urgency of land and agrarian reform in Rwanda”, African Affairs, vol. 98, pp. 353-372.
Human Rights Watch (2001) “Uprooting the rural poor in Rwanda”, Human Rights Watch Publications, available at: http://www.hrw.org/reports/2001/rwanda/
ICARRD (2006) “Implications of the ongoing land reform on sustainable rural development and poverty reduction in Rwanda”, Case study presented at the International Conference on Agrarian Reform and Rural Development (ICARRD), Porto Alegre 7-10 March 2006.
Isaksson, A. (2011a) “Manipulating the rural landscape: Villagisation and income generation in Rwanda”, mimeo, University of Gothenburg.
Isaksson, A. (2011b) “Social divisions and institutions: assessing institutional parameter variation”, Public Choice, 147(3), pp. 331-357.
Kairaba, A. (LandNet Rwanda/World Bank) (2002) “Rwanda country case study”, paper prepared for ‘Integrating land issues into poverty reduction strategies and the broader development agenda: a regional workshop on land issues in Africa and the Middle East’, Kampala, Uganda 29 April – 2 May 2002.
Knack, S. & Keefer, P. (1995) “Institutions and economic performance: Cross-country tests using alternative institutional measures”, Economics and Politics, 7(3), 207-227.
Lastarria-Cornhiel, S. (1997) “Impact of privatization on gender and property rights in Africa”, World Development, 25(8), pp. 1317-1333.
Meinzen-Dick, R. S., Brown, L. R., Feldstein, H. S. and A. R. Quisumbing (1997) “Gender, property rights and natural resources”, World Development, 25(8), pp. 1303-1315.
Musahara, H. and C. Huggins (2005) “Land reform, land-scarcity and post-conflict reconstruction: A case study of Rwanda”, pp 269-346 in From the ground up: Land-rights, conflict and peace in Sub-Saharan Africa, eds. C. Huggins and J. Clover, Pretoria and Cape Town: Institute of Security Studies.
Pande, R. and C. Udry (2006) “Institutions and development: A view from below”, in Blundell, R., Newey, W. K. and T. Persson (eds.) (2006) Advances in Economics and Econometrics: Theory and Applications, Ninth World Congress, vol. II, Econometric Society Monographs, Cambridge University Press.
Republic of Rwanda (1999) “Law No 22/99 of 12/11/1999 to Supplement Book One of the Civil Code and to Institute Part Five Regarding Matrimonial Regimes, Liberalities and Successions”, Ministry of Justice, Codes and Laws of Rwanda.
Republic of Rwanda (2004) “National human settlement policy in Rwanda”, Ministry of Infrastructure, Kigali. Republic of Rwanda (2004b) “National Land Policy”, Ministry of Lands, Environment, Forests, Water and Mines,
February 2004, Kigali. Republic of Rwanda (2005) “Organic Law No 08/2005 of 14/07/2005 Determining the use and management of
land in Rwanda”, July, 2005, Kigali. Rodrik, D., Subramanian, A., & Trebbi, F. (2004) “Institutions rule: The primacy of institutions over geography
and integration in economic development”, Journal of Economic Growth, 9, 131-165. Rose, L. L. (2004) “Women’s land access in post-conflict Rwanda: Bridging the gap between customary land
law and pending land legislation”, Texas Journal of Women and the Law, Vol. 13, pp. 197-250. Rose L. L. (2005) “Orphans’ land rights in post-war Rwanda: the problem of guardianship”, Development and
Change, 36(5), pp. 911-936. Stewart, F. (2002) “Horizontal inequalities: A neglected dimension of development”, WIDER Annual Lectures
5, UNU World Institute for Development Economics Research (UNU/WIDER). Takeuchi, M. and J. Marara (2007) “Regional differences regarding land tenancy in rural Rwanda, with special
reference to sharecropping in a coffee production area”, African Study Monographs, suppl. 35, pp. 111-138. UNDAF (2001) “Rwanda: United Nations Development Assistance Framework 2002-2006”, United Nations
Development Assistance Framework (UNDAF), Kigali, 2001. Verwimp, P. (2004) “An economic profile of peasant perpetrators of genocide: Micro-level evidence from
Rwanda”, Journal of Development Economics, vol. 77, pp. 297-323. Wyss, K. (2006) “A thousand hills for 9 million people. Land reform in Rwanda: Restoration of feudal order or
genuine transformation?”, Working Paper no. 1 2006, FAST Country Risk Profile Rwanda, Swiss Peace. Yanagizawa, D. (2006) “Malthus in Rwanda? Scarcity, survival and causes of the genocide”, Working Papers in
Economics no. 201, University of Gothenburg.

18
Figures and Tables Table 1: Group means
Female HHH Male HHH HHH age<30 HHH age>=30 Displaced Non-displaced Imidugudu Non-Imid.
Land rights
Rights over total land 0.57 0.61 0.54 0.62 0.57 0.61 0.54 0.62 Share of land owned 0.87 0.84 0.77 0.86 0.85† 0.84† 0.84† 0.84† Rights over owned land 0.66 0.73 0.69†† 0.72†† 0.68 0.73 0.63 0.73
Land assets
Total land area (ha) 0.71 0.88 0.60 0.88 0.86† 0.82† 0.88† 0.82† Land fragmentation 0.47 0.51 0.50† 0.50† 0.48 0.50 0.43 0.51 Share landless 0.01† 0.01† 0.02 0.01 0.01† 0.01† 0.01† 0.01†
Land acquisition
Share of land inherited 0.54 0.46 0.50† 0.48† 0.42 0.51 0.35 0.52 Share of land purchased 0.13 0.20 0.13 0.20 0.17†† 0.19†† 0.21 0.18 Share of land received as gift 0.13 0.12 0.11†† 0.13†† 0.15 0.11 0.16 0.11 Share of land loaned 0.04† 0.04† 0.07 0.04 0.04† 0.04† 0.05† 0.04† Share of land sharecropped 0.06 0.08 0.09 0.07 0.06 0.07 0.06†† 0.07†† Share of land leased 0.02 0.04 0.05 0.03 0.04†† 0.03†† 0.04† 0.03† Share obtained by alt. means 0.07† 0.06† 0.04 0.06 0.11 0.04 0.13 0.04
Household composition
Household size 4.14 5.37 3.53 5.36 5.10†† 4.99†† 5.03† 5.02† Share of working age adults 0.56 0.55 0.64 0.53 0.55† 0.55† 0.56† 0.55† Married HHH 0.02 0.74 0.52† 0.54† 0.52† 0.54† 0.51 0.54 Widow/er HHH 0.78 0.02 0.02 0.29 0.01† 0.01† 0.23† 0.24†
† indicates that the difference between the concerned groups is not statistically significant; †† indicates that the difference is statistically significant at the 10% level; all unmarked group differences are statistically significant at least at the 5% level.

19
Table 2: Rights over total utilised land
Dependent variable is share of total land holdings that can be sold or mortgaged
(1) (2) (3) (4) (5) (6)
Female HHH -0.062*** -0.062*** -0.047*** -0.087*** -0.083*** -0.080*** Group dimensions
(0.014) (0.014) (0.014) (0.024) (0.024) (0.024) HHH age 0.008*** 0.008*** 0.006*** 0.003 0.003 0.003 (0.002) (0.002) (0.002) (0.002) (0.002) (0.003) Square of HHH age -0.000*** -0.000*** -0.000* -0.000 -0.000 -0.000 (0.000) (0.000) (0.000) (0.000) (0.000) (0.000) Imidugudu -0.068*** -0.071*** -0.089*** -0.088*** -0.022 -0.003 (0.016) (0.016) (0.016) (0.016) (0.020) (0.024) Conflict-displaced -0.026* -0.034** -0.039*** -0.037*** -0.007 0.010 (0.013) (0.014) (0.014) (0.014) (0.015) (0.019) OCL returnee 0.049 0.034 0.036 0.001 0.011 (0.031) (0.030) (0.030) (0.029) (0.035)
Total land (log ha) 0.045*** 0.044*** 0.037*** 0.038*** Land asset controls
(0.005) (0.005) (0.005) (0.007) Land fragmentation -0.089*** -0.097*** -0.087*** -0.108*** (0.023) (0.023) (0.025) (0.029)
HH size 0.003 0.003 0.003 Household composition controls
(0.003) (0.003) (0.003) Share of adults -0.043 -0.027 -0.011 (0.027) (0.027) (0.028) Married HHH 0.053*** 0.069*** 0.061*** (0.017) (0.016) (0.019) Widow/er HHH 0.117*** 0.126*** 0.119*** (0.025) (0.025) (0.027)
Region dummies no no no no yes no Regional controls
Cluster dummies no no no no no yes Constant 0.406*** 0.409*** 0.562*** 0.606*** 0.337*** 0.745*** Observations 5187 5186 5186 5186 5186 5186
(0.050) (0.050) (0.052) (0.054) (0.058) (0.056)
Notes: Robust standard errors in parentheses (in Regression 6 clustered by the 440 village clusters); *significant at 10%, **significant at 5%, ***significant at 1%.
R-squared 0.02 0.02 0.03 0.04 0.09 0.21

20
Table 3: Share of household land that is owned
Dependent variable is share of the household’s total land holdings that can be classified as owned
(1) (2) (3) (4) (5) (6)
Female HHH 0.004 0.004 0.006 -0.010 -0.008 -0.010 Group dimensions
(0.008) (0.008) (0.008) (0.016) (0.016) (0.016) HHH age 0.005*** 0.005*** 0.005*** 0.002* 0.002* 0.002 (0.001) (0.001) (0.001) (0.001) (0.001) (0.002) Square of HHH age -0.000* -0.000* -0.000* -0.000 -0.000 -0.000 (0.000) (0.000) (0.000) (0.000) (0.000) (0.000) Imidugudu -0.000 0.000 -0.019* -0.018* -0.009 0.008 (0.010) (0.010) (0.010) (0.010) (0.013) (0.016) Conflict-displaced 0.008 0.010 0.009 0.011 0.015* 0.027*** (0.008) (0.009) (0.008) (0.008) (0.009) (0.010) OCL returnee -0.013 -0.039** -0.038** -0.029 0.003 (0.019) (0.019) (0.019) (0.019) (0.021)
Total land (log ha) 0.023*** 0.021*** 0.023*** 0.027*** Land asset controls
(0.003) (0.003) (0.004) (0.004) Land fragmentation -0.177*** -0.184*** -0.209*** -0.210*** (0.013) (0.013) (0.015) (0.019)
HH size 0.002 0.003 0.004** Household composition controls
(0.002) (0.002) (0.002) Share of adults -0.001 0.009 0.017 (0.015) (0.015) (0.017) Married HHH 0.048*** 0.049*** 0.037*** (0.011) (0.011) (0.012) Widow/er HHH 0.077*** 0.076*** 0.073*** (0.017) (0.017) (0.018)
Region dummies no no no no yes no Regional controls
Cluster dummies no no no no no yes Constant 0.658*** 0.657*** 0.788*** 0.803*** 0.782*** 0.779*** Observations 5206 5205 5205 5205 5205 5205
(0.032) (0.032) (0.033) (0.034) (0.037) (0.035)
Notes: Robust standard errors in parentheses (in Regression 6 clustered by the 440 village clusters); *significant at 10%, **significant at 5%, ***significant at 1%.
R-squared 0.03 0.03 0.07 0.08 0.10 0.22
21
Table 4: Rights over owned land
Dependent variable is share of owned land holdings that can be sold or mortgaged
(1) (2) (3) (4) (5) (6)
Female HHH -0.077*** -0.076*** -0.061*** -0.104*** -0.103*** -0.098*** Group dimensions
(0.015) (0.015) (0.015) (0.026) (0.025) (0.026) HHH age 0.006*** 0.006*** 0.003 0.002 0.002 0.003 (0.002) (0.002) (0.002) (0.003) (0.002) (0.003) Square of HHH age -0.000** -0.000** -0.000 -0.000 -0.000 -0.000 (0.000) (0.000) (0.000) (0.000) (0.000) (0.000) Imidugudu -0.091*** -0.094*** -0.100*** -0.100*** -0.020 -0.011 (0.017) (0.017) (0.017) (0.017) (0.020) (0.024) Conflict-displaced -0.035** -0.045*** -0.050*** -0.049*** -0.019 -0.015 (0.014) (0.015) (0.015) (0.015) (0.015) (0.021) OCL returnee 0.067** 0.071** 0.071** 0.020 -0.002 (0.031) (0.031) (0.031) (0.030) (0.037)
Total land (log ha) 0.036*** 0.036*** 0.026*** 0.022*** Land asset controls
(0.005) (0.005) (0.006) (0.007) Land fragmentation 0.043* 0.041* 0.072*** 0.051* (0.024) (0.024) (0.025) (0.029)
HH size 0.001 0.001 -0.001 Household composition controls
(0.003) (0.003) (0.003) Share of adults -0.048* -0.037 -0.027 (0.028) (0.028) (0.029) Married HHH 0.017 0.033* 0.034* (0.017) (0.017) (0.019) Widow/er HHH 0.079*** 0.092*** 0.086*** (0.027) (0.026) (0.029)
Region dummies no no no no yes no Regional controls
Cluster dummies no no no no no yes Constant 0.624*** 0.629*** 0.703*** 0.741*** 0.434*** 0.919*** Observations 5020 5019 5019 5019 5019 5019
(0.052) (0.052) (0.054) (0.056) (0.061) (0.059)
Notes: Robust standard errors in parentheses (in Regression 6 clustered by the 440 village clusters); *significant at 10%, **significant at 5%, ***significant at 1%.
R-squared 0.02 0.02 0.03 0.03 0.11 0.23

22
Table 5: Estimations including group interaction terms
Panel A: Dependent variable is rights over total land
Female HHH -0.061 -0.074*** -0.070*** -0.084*** -0.083*** -0.083*** (1) (2) (3) (4) (5) (6)
(0.049) (0.025) (0.025) (0.024) (0.024) (0.024) HHH age 0.003 0.003 0.003 0.004 0.004 0.003 (0.002) (0.002) (0.002) (0.002) (0.002) (0.002) Imidugudu -0.021 -0.021 -0.002 -0.021 0.093* -0.019 (0.020) (0.020) (0.022) (0.020) (0.049) (0.023) Conflict-displaced -0.007 0.001 -0.007 0.059 -0.008 -0.005 (0.015) (0.017) (0.015) (0.041) (0.015) (0.016) FemaleHHH*HHHage -0.001 (0.001) FemaleHHH*confl.disp. -0.029 (0.029) FemaleHHH*Imidug. -0.066* (0.034) HHHage*confl.displ. -0.002* (0.001) HHHage*Imidugudu -0.003** (0.001) Confl.displ.*Imidugudu -0.007 (0.031)
Panel B: Dependent variable is rights over owned land
Female HHH -0.091* -0.096*** -0.094*** -0.103*** -0.102*** -0.102*** (1) (2) (3) (4) (5) (6)
(0.051) (0.026) (0.026) (0.025) (0.025) (0.025) HHH age 0.002 0.002 0.002 0.003 0.003 0.002 (0.002) (0.002) (0.002) (0.002) (0.002) (0.002) Imidugudu -0.020 -0.019 -0.007 -0.020 0.062 -0.008 (0.020) (0.020) (0.022) (0.020) (0.050) (0.023) Conflict displaced -0.019 -0.013 -0.018 0.018 -0.019 -0.011 (0.015) (0.017) (0.015) (0.042) (0.015) (0.017) FemaleHHH*HHHage -0.000 (0.001) FemaleHHH*confl.disp. -0.020 (0.030) FemaleHHH*Imidug. -0.042 (0.035) HHHage*confl.displ. -0.001 (0.001) HHHage*Imidugudu -0.002* (0.001) Confl.displ.*Imidugudu -0.031 Notes: Robust standard errors in parentheses; *significant at 10%, **significant at 5%, ***significant at 1%; On top of the presented variables, all estimations include the controls included in Regression 5 in Tables 2-4, i.e. the square of HHH age, OCL returnee, total land (log ha), land fragmentation, HH size, share of adults, married HHH, widow/er HHH, and region dummies; The estimations in Panel A have 5,186 observations and an R-square of 0.09-0.10; The estimations in Panel B have 5,019 observations and an R-square of 0.11.
(0.033)

23
APPENDIX
Table A1: Variable definitions
Rights over total land: For each of their plots, the household is asked to specify whether they have the right to sell or mortgage the land. This variable gives the share of the household’s total land area (including land that is loaned, leased, sharecropped and appropriated) that reportedly can be sold or mortgaged.
Dependent variables
Share of land owned: The share of the household’s total land area that has been bought, inherited, received as a gift or obtained through ‘other’ means (meaning that leased, loaned, sharecropped and appropriated land is not classified as owned).
Rights over owned land: The share of the household’s owned land (see the above definition) that can be sold or mortgaged.
Female HHH: Dummy taking the value 1 if the head of household is female Group dimensions
HHH age: The household head age in years Square of HHH age: The square term of the household head age in years Imidugudu: Dummy taking the value 1 if household reports to live in an Imidugudu settlement. Conflict displaced: Dummy variable taking the value one if the respondent has been displaced due to conflict
and arrived to the current region of residence between 1994 and 2000. OCL: Households who have been conflict-displaced (see criteria above) and whose point of out-migration
(proxied by the year the household settled in their current residence minus the time resided in their previous residence) was before 1990.
Total land (ha): Total land area (in hectares) utilised by the household (i.e. including plots that are owned as well as those that are loaned, leased or sharecropped).
Land assets
Total land (log ha): log of total land in hectares (see above). Land fragmentation: Simpson index for farm fragmentation, calculated (based on total land area) as 1 minus the
ratio of the sum of squared parcel areas to the squared area of the total farm. Increasing in fragmentation – taking the value 0 when the farm consists of a single parcel and approaching 1 for farms split into numerous plots of equal size.
Land acquisition variables
Share of land inherited: Inherited land area / total land area
(Based on the question: How did you obtain the plot or if not yours, what arrangement is there for cultivating?)
Share of land purchased: Purchased land area / total land area Share of land received as a gift: Land area received as a gift / total land area Share of land loaned: Loaned land area / total land area Share of land sharecropped: Sharecropped land area / total land area Share of land leased: Leased land area / total land area Share of land obtained by alternative means: ‘Alternative’ land area / total land area, where ‘alternative’ refers to
the response categories ‘other’ and ‘appropriation’.
HH size: The number of household members Household controls
Share of adults: Share of household members that are of working age (15-64) Married HHH: Dummy taking the value 1 if the household head is married Widow/er HHH: Dummy taking the value 1 if the household head is a widow/widower
Province dummies: 11 rural province dummies Regional controls
Cluster dummies: 440 rural cluster dummies Interaction terms: Multiplicative terms between the group dimension variables

24
Table A2: Summary statistics
Variable Observations Mean Std. Dev. Min Max
Land rights
Rights over total land 5188 0.60 0.43 0 1 Share of land owned 5207 0.84 0.27 0 1 Rights over owned land 5021 0.71 0.43 0 1
Group dimensions
Female HHH 5279 0.28 0.45 0 1 HHH age 5279 44.81 15.43 15 98 HHH age<30 5279 0.18 0.39 0 1 Conflict-displaced 5277 0.29 0.45 0 1 OCL refugee 5276 0.05 0.21 0 1 Imidugudu 5278 0.18 0.39 0 1
Land assets
Total land (hectares) 5276 0.83 1.44 0 49.51 Total land (log hectares) 5209 -0.87 1.23 -6.50 3.90 Land fragmentation 5209 0.50 0.27 0 0.92 Landless 5276 0.01 0.11 0 1
Land acquisition
Share of land inherited 5207 0.49 0.42 0 1 Share of land purchased 5207 0.18 0.31 0 1 Share of land received as gift 5207 0.12 0.28 0 1 Share of land loaned 5207 0.04 0.16 0 1 Share of land sharecropped 5207 0.07 0.18 0 1 Share of land leased 5207 0.03 0.13 0 1 Share obtained by alt. means 5207 0.06 0.21 0 1
Household composition
HH size 5279 5.02 2.25 1 16 Share of adults 5279 0.55 0.24 0 1 Married HHH 5279 0.54 0.50 0 1 Widow/er HHH 5279 0.24 0.43 0 1