Embed Size (px)
Citation preview

Bucknell UniversityBucknell Digital Commons
Master’s Theses Student Theses
2011
A Study of Alumni Engagement and ItsRelationship to Giving BehaviorsShelby RadcliffeBucknell University
Follow this and additional works at: https://digitalcommons.bucknell.edu/masters_theses
Part of the Education Commons
This Masters Thesis is brought to you for free and open access by the Student Theses at Bucknell Digital Commons. It has been accepted for inclusion inMaster’s Theses by an authorized administrator of Bucknell Digital Commons. For more information, please contact [email protected].
Recommended CitationRadcliffe, Shelby, "A Study of Alumni Engagement and Its Relationship to Giving Behaviors" (2011). Master’s Theses. 2.https://digitalcommons.bucknell.edu/masters_theses/2

I, Shelby Kloures Radcliffe, do grant permission for my thesis to be copied.


A STUDY OF ALUMNI ENGAGEMENT AND
ITS RELATIONSHIP TO GIVING BEHAVIORS
by
Shelby Kloures Radcliffe
A Thesis
Presented to the Faculty of Bucknell University
In Partial Fulfillment of the Requirements for the Degree of Master of Sciences in Education
Approved: __________________________
Candice Stefanou, Thesis Adviser
___________________________
Lynn M. Hoffman, Department Chairperson
April 22, 2011

ii
Acknowledgments
Advisors
For his passionate commitment to the Bucknell College Student Personnel program, his
support of my non‐traditional graduate education plan, and his boundless energy for
students and the work, I thank Professor Joseph Murray.
For her amazing work in the classroom, her patience with me as an occasionally
frustrated graduate student, and her phenomenal example as a scholar, I thank
Professor Sue Ellen Henry.
For her service as my thesis advisor, her incredible support, her genuine interest in my
research and my field, and her respect for my past and my present, I thank Professor
Candice Stefanou.
Colleagues
For introducing me to statistics and their importance to my work as a fund raiser, I can
never thank Lawrence Henze and Peter Wylie enough. For their willingness to educate
a Luddite and for their patience with my curiosity, I thank Lawrence, Peter, Josh
Birkholz, and John Sammis.
For their professional support, leadership by example, coaching, and on some occasions,
persistent encouragement, I thank Sam Lundquist, Scott Rosevear, and Carl Moyer.

iii
For their hard work on the engagement score project, their curiosity, and their
dedication to clean and useful data I thank Gretchen Corl, Bryan Koch, Barb Hartman,
and Doug LeBlanc. For their tremendous assistance in my professional life which
allowed me to spend energy and time on my educational goals, I thank Karen Holstead,
Sue Strada, and Patty Driver. For their support of my leadership and my educational
goals, I thank Barb Hartman, Cindy Janesch, and the whole campaign administration
team.
Family
For the gifts of confidence, intellectual curiosity, passion for education, and humor, I
thank my parents.
For the gifts of support, friendship, loyalty, and play, I thank Scott, Marcy, Phoebe, and
Charlotte; Matt, Maureen, Andrew and Spencer.
Friends
For his belief in my intelligence, his example of intellectual curiosity, and his passion for
education and exploration, I thank Evan McClintock. Eighteen years of conversation
about educational theory, philosophy, and practice provided a wonderful foundation for
my formal graduate education.

iv
For fried catfish and mashed potatoes, chicken fricassee and asparagus risotto,
chocolate stout cake and nutmeg cookies ‐ for all of the ways he fed me while I read and
wrote; I thank Don Rea.
For their patience with my absence and distraction, I thank all of my friends, too many
to name, but each of them important. They were willing to accept and love me when I
was available and to support me and cheer me on when I was not.
And most of all, for their unwavering confidence in my ability to finish and succeed, for
the many hours of study dates, for their patient advice, encouragement, and interest in
my work and my life, I can never thank Coralynn Davis, Jennifer Lasshan, Molly
Pavlechko, Barbara Schmertz, and Virginia Zimmerman enough. You are amazing
women who inspire me every day.

v
Table of Contents
Acknowledgments ii
List of Tables viii
List of Figures x
Abstract xi
Chapter 1 2
Introduction 2
Chapter 2 8
Literature Review 8
Alumni Giving and Fund Raising Practices 9
Alumni Giving and the External Environment 10
Alumni Giving and Institutional Characteristics 11
Alumni Giving and Individual Characteristics 12
Attitudinal and Behavior Characteristics of Donors 17
Theoretical Foundations 20
Chapter 3 24
Methodology 24
Designing the Engagement Score 24

vi
The Engagement Score Formula 31
Analysis 35
Chapter Four 38
Results 38
Defining the Population 38
Research Question 1 40
Research Question 2 51
Chapter Five 60
Discussion 60
Research Question One 61
Research Question Two 64
Study Limitations 68
Appendices 75
Appendix A: Sample Policy Capturing Profile 75
Appendix B: Inter‐rater reliability analysis 76
Appendix C: Preliminary Engagement Score Formula 77
Appendix D: Final Engagement Score Formula 78
Appendix E: The Valley Recency, Frequency, Monetary (RFM) Score 79

vii
References 81

viii
List of Tables
Table 1 Variables used in the policy capturing exercise 28
Table 2 Additional variables considered after the policy capturing exercise 32
Table 3 Recency variables added to the analysis 33
Table 4 Additional variables utilized in study 34
Table 5 Population Size, Mean, and Standard Deviation of Population Groups 39
Table 6 The mean engagement scores for men and women in all three populations 41
Table 7 The mean engagement scores for Greek and independent alumni 42
Table 8 The mean engagement scores for athlete and non‐athlete and independent
alumni 43
Table 9 Population, mean engagement scores, and standard deviations for alumni based
on college. 44
Table 10 Mean engagement scores by college of graduation for mature and young
populations 45
Table 11 Mean engagement scores by degree type 46
Table 12 Mean engagement scores by degree type for mature and
young populations 47
Table 13 Mean engagement scores by generation 49
Table 14 Mean engagement for alumni based on decade of graduation 50
Table 15 Correlation between engagement score and donor status
for each population group 51
ix
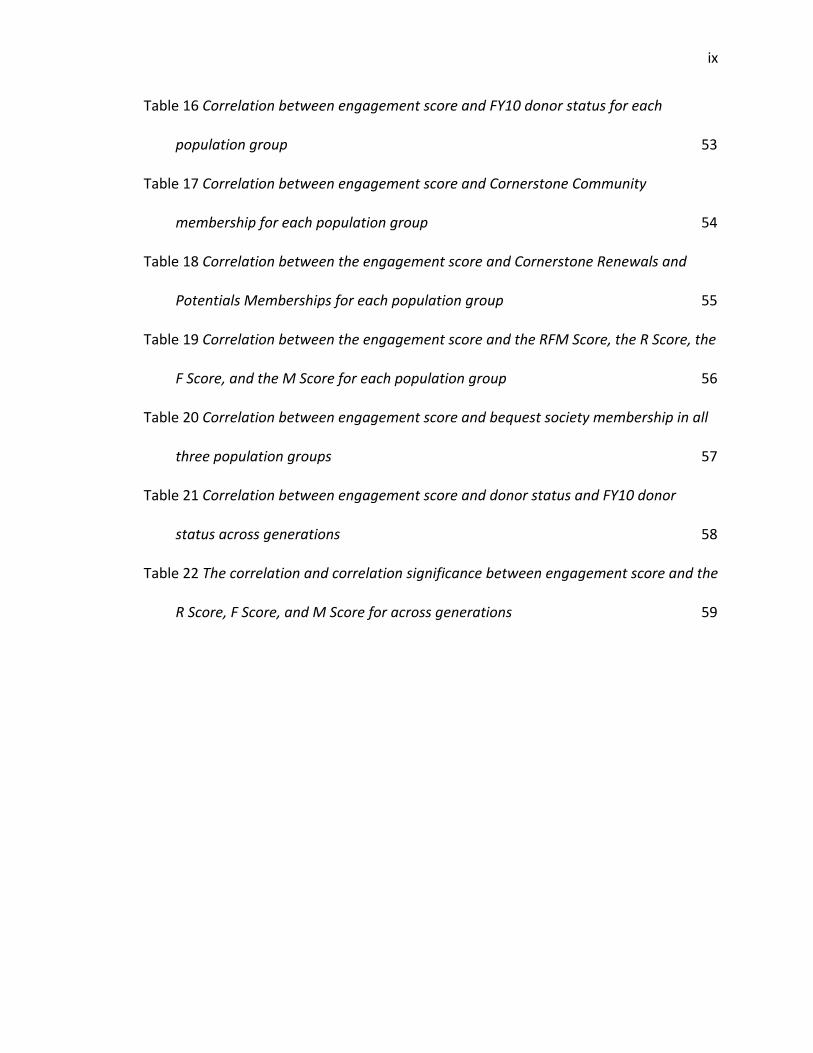
Table 16 Correlation between engagement score and FY10 donor status for each
population group 53
Table 17 Correlation between engagement score and Cornerstone Community
membership for each population group 54
Table 18 Correlation between the engagement score and Cornerstone Renewals and
Potentials Memberships for each population group 55
Table 19 Correlation between the engagement score and the RFM Score, the R Score, the
F Score, and the M Score for each population group 56
Table 20 Correlation between engagement score and bequest society membership in all
three population groups 57
Table 21 Correlation between engagement score and donor status and FY10 donor
status across generations 58
Table 22 The correlation and correlation significance between engagement score and the
R Score, F Score, and M Score for across generations 59

x
List of Figures
Figure 1. RFM Score across engagement cohorts. 66
Figure 2. Mean adjusted lifetime giving by engagement score cohort. 67

xi
Abstract
This paper examines the relationship between alumni engagement and two categories
of variables, alumni characteristics and alumni giving behavior. The Valley University
engagement score was developed using the entire alumni population and information
available from the institutional database. The study found that, with the exception of
generation, there was no difference in engagement scores based on alumni
characteristics. The study also found that the engagement score has a positive
correlation to a variety of giving behaviors, including donor status, recent donor status,
annual giving behavior (RFM), and adjusted lifetime giving.

1
To give away money… is an easy matter and in any man's power.
But to decide to whom to give it, and how large and when, and for what purpose and
how, is neither in every man's power‐nor an easy matter…Hence it is that such
excellence herein is rare and praiseworthy and noble."
Aristotle

2
Chapter 1
Introduction
Philanthropy is big business in the United States. According to Giving USA 2010
(Giving USA, 2010), total charitable giving in the US exceeded 303 billion dollars in 2009.
Over $40 billion of this total was given to educational organizations, including colleges
and universities. While these numbers seem impressive, they represent a sharp decline
from previous years; 8.6% less than 2007 totals even when adjusted for inflation (Giving
USA, 2010, p. 20). The uncertain economy is certainly partly to blame. But competition
from other charities and changing attitudes about higher education most likely also
contribute significantly to this trend.
Since 1961, when the earliest research into higher education philanthropy was
conducted (Taylor & Martin, 1995), researchers have attempted to identify the keys to
successful fund raising programs. From qualitative case studies to quantitative analyses
of institutional, constituent, and donor data, studies have consistently attempted to
identify the common characteristics of successful fund raising programs to inform
practitioners about best practices. Indeed, Harrison (1995) found that the more schools
spend on fund raising, the more money they raise. But if it were that easy, colleges and
universities would simply apply greater and greater resources to the fund raising
enterprise.
3
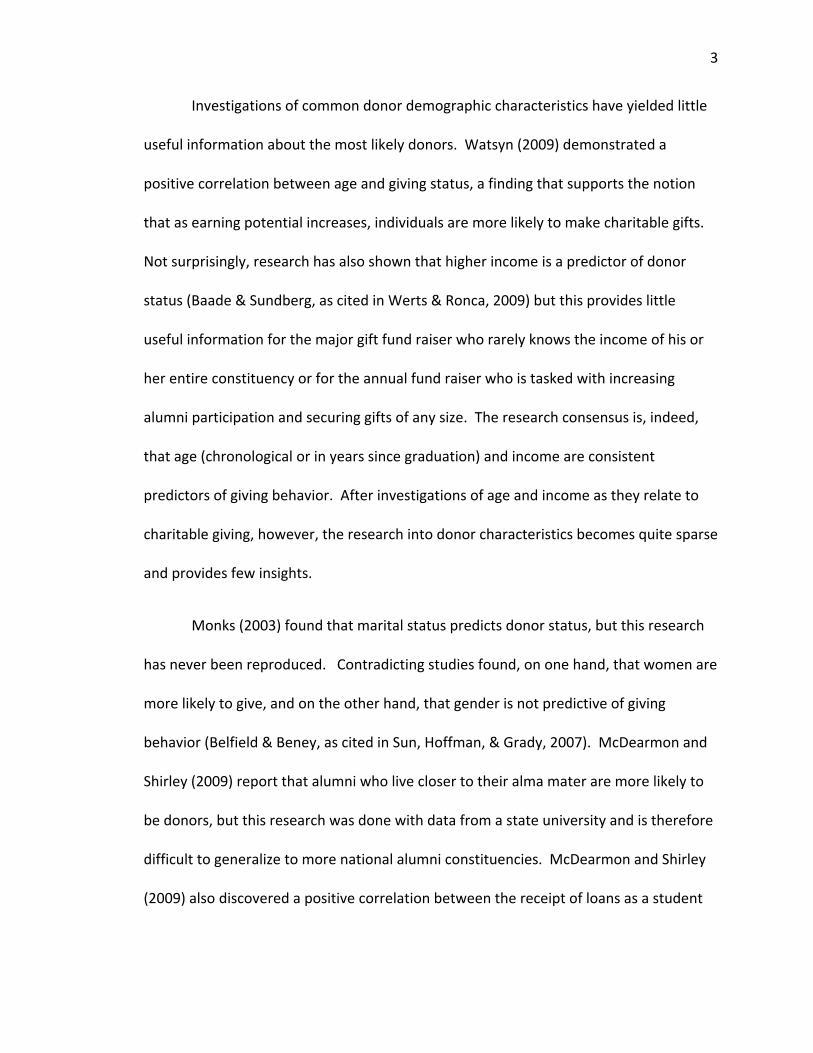
Investigations of common donor demographic characteristics have yielded little
useful information about the most likely donors. Watsyn (2009) demonstrated a
positive correlation between age and giving status, a finding that supports the notion
that as earning potential increases, individuals are more likely to make charitable gifts.
Not surprisingly, research has also shown that higher income is a predictor of donor
status (Baade & Sundberg, as cited in Werts & Ronca, 2009) but this provides little
useful information for the major gift fund raiser who rarely knows the income of his or
her entire constituency or for the annual fund raiser who is tasked with increasing
alumni participation and securing gifts of any size. The research consensus is, indeed,
that age (chronological or in years since graduation) and income are consistent
predictors of giving behavior. After investigations of age and income as they relate to
charitable giving, however, the research into donor characteristics becomes quite sparse
and provides few insights.
Monks (2003) found that marital status predicts donor status, but this research
has never been reproduced. Contradicting studies found, on one hand, that women are
more likely to give, and on the other hand, that gender is not predictive of giving
behavior (Belfield & Beney, as cited in Sun, Hoffman, & Grady, 2007). McDearmon and
Shirley (2009) report that alumni who live closer to their alma mater are more likely to
be donors, but this research was done with data from a state university and is therefore
difficult to generalize to more national alumni constituencies. McDearmon and Shirley
(2009) also discovered a positive correlation between the receipt of loans as a student
4
and donor status, but Monks (2003) found the opposite. Quite simply, in many cases
the research into alumni traits as they relate to donor status contradicts itself. In
addition, studies which support or dispute correlations between alumni traits and donor
behavior have been conducted with data from single institutions and have never been
reproduced, making generalization difficult.
Investigations into alumni attitudes and how they relate to giving behavior have
been more promising. The concept of alumni engagement, or how well connected
alumni are to their alma mater, has been of interest to researchers and practitioners
alike. Clotfelter (2003), Gaier (2005), Hoyt (2004), and Monks (2003), among others,
demonstrated that engaged students are more likely to be engaged alumni. Other
studies have found that engaged alumni are more likely to be donors (Weerts & Ronca,
2009; Hunter, Jones, & Boger, 1999; Coltfelter, 2002; Gallo & Hubshman, 2003; Hoyt,
2004; Taylor & Martin, 1995). The research clearly establishes that among attitudinal
variables, satisfaction with the student experience is by far the strongest predictor of
alumni giving behavior. Few development and alumni relations programs can
dramatically impact the student experience, however, especially for alumni who
graduated long ago. These programs can directly impact the alumni experience though,
and in doing so, influence a significant predictor of alumni giving.
The consensus on the importance of alumni engagement produces a real need
for college and university advancement offices to study and understand alumni

5
engagement. The body of research on this topic is problematic for practitioners for
several reasons. First, very little of the research is widely available; in most cases it was
conducted by practitioner‐students who never published their findings. Second, little, if
any, of the research on alumni engagement is generalizable. It has been conducted on
one school at a time with a unique methodology and limited data sets. Finally, almost
all of the research on alumni engagement and giving has been based on self‐reported
attitudinal behavior, limiting sample sizes and introducing response biases.
Without an industry‐wide tool for measuring alumni engagement with the
behavioral data that colleges and universities already collect and maintain, there has
been no way for advancement offices to easily and consistently quantify their work or to
study the relationship between engagement and giving at their institutions. This thesis
describes such an effort at Valley University, a private liberal arts college in the Mid‐
Atlantic region of the United States.
In 2010, Valley University advancement staff worked with private consultants to
develop an alumni engagement score which was then applied to the entire alumni
database. This study then explored (a) whether there were categorical differences
among alumni by engagement score cohorts and (b) whether there were relationships
between the engagement score and several types of giving behavior. It is the first
known study which does not rely on survey data to explore this connection, making it a

6
valuable step in the development of an industry‐wide methodology for alumni
engagement.
Specifically, the study attempted to answer two questions. First, are there
statistically significant and practically meaningful differences between Valley alumni
who are highly engaged and alumni who are not? Second, is there a relationship
between Valley alumni engagement and their giving behavior, and if so, what kind?
What the study revealed was rather simple but also quite profound. With the exception
of age and generation, there were no significant or meaningful differences in the
demographics of Valley alumni across the range of engagement scores. In addition,
there most certainly is a relationship between Valley alumni engagement and their
giving behavior, and a positive one at that. On one hand, the findings refute
professional intuition. The categories professionals rely on to group and understand
their constituents are not as useful as expected. On the other hand, the findings
support the belief that engagement and giving are related, a belief that provides a
foundation for the continued investment in and expansion of alumni programming.
Chapter two of this thesis will provide an overview of the literature on higher
education philanthropy. The review is organized into four main categories: research on
alumni giving and fund raising practices, research on alumni giving and the external
environment, research on alumni giving and institutional characteristics, and finally,
research on alumni giving and individual characteristics. The literature in this last

7
category is examined in greater detail, partly because it is more abundant and also
because it is most relevant to this study.
Chapter three of this thesis will provide an outline of the methodology used in
the development of the Valley University alumni engagement score as well as the
methodology of the analysis conducted for this study. Chapter four and five of this
thesis presents the results and discussion with an emphasis on how this study
contributes to the academic exploration of philanthropy in higher education and how
the outcomes of the study can be useful to Valley University advancement practitioners.
8
Chapter 2
Literature Review
In almost every dissertation and article on higher education philanthropy,
authors begin with the story of higher education philanthropy in general. National
support of higher education is diminishing, more and more charities are competing for
the philanthropic dollar, expectations for what colleges and universities deliver are
increasing, and costs are spiraling out of control making access a significant issue.
Whether one studies a large public university or a small private college, there is
unanimous agreement among researchers that the need for private funding in higher
education is steadily, if not exponentially, increasing and that the primary cohort of
private donors is individuals already affiliated with the institution – the alumni.
The earliest academic examination of donors and non‐donors was a study of
Alfred University alumni conducted by O'Conner in 1961 (Taylor & Martin, 1995). Early
research on alumni giving was conducted largely by economists and sociologists and
published rarely in peer‐reviewed journals. For decades, most of this research was done
as part of dissertation work and as a result, it remains difficult to access. As graduate
programs in higher education and philanthropy have become more common, however,
so too has research begun to originate from within the discipline of philanthropy studies
and higher education fund raising. In addition, the creation of the first peer‐reviewed

9
journal in higher education advancement, the International Journal of Educational
Advancement, and the establishment of research grants and awards from professional
associations like the Council for the Advancement and Support of Education (CASE) and
the Association of Professional Researchers in Advancement (APRA) have facilitated a
significant increase in research activity and availability.
Weerts (2007) found that research on alumni giving focuses on four areas:
research into individual donor characteristics, fund raising practices, the external
environment, and institutional characteristics. This literature review will summarize the
research in each of these areas with special attention to the category of individual donor
characteristics. In addition, this review will provide a brief summary of the theoretical
frames common in the literature.
Alumni Giving and Fund Raising Practices
Fund raising practices are frequently presented in case study articles and
professional association magazines; theoretically grounded research on fund raising
practices is far less common. Harrison (1995) compared the cost of fund raising for
three years at seventeen schools with a special eye toward institutional characteristics.
The goal of the analysis was to estimate the proportion of alumni who donate based on
institutional investment in the fund raising enterprise. The study utilized CASE
expenditures data during three fiscal years and analyzed the relationships between
giving data, fund raising expenditures, and institutional traits. A factor analysis was

10
utilized to cluster an abundance of variables to a few broad variable sets. A logit
regression was employed to predict the percentage of alumni donors at each institution
given the institutional traits. The study showed that expenditures on alumni activities
have the greatest significance in comparing fund raising success. Most of the literature
focuses on researching donor or institutional characteristics when in fact, this study
suggests that college relations investments are a more significant factor in fund raising
success.
According to Drezner (2009), "the vast majority of the philanthropic literature is
based on large‐scale quantitative surveys and does not focus on how individuals are
encouraged" to give (p. 152). While practitioners consistently claim certain practices
are more (or less) effective, the truth is that there is a very small amount of research on
fund raising practices.
Alumni Giving and the External Environment
The study of the external environment has focused on two areas. First, how
does tax law affect donor behavior and second, how does the economy affect donor
behavior? Since tax deductions for charitable gifts lower the cost of giving, one would
expect donors residing in deduction states to be more likely to give and to give in
greater amounts than otherwise similar donors in non‐deduction states. Early research
by Taussig, Schwartz, and Feldstein in fact concluded that charitable contributions
increase significantly with deductibility (as cited in Leslie and Ramey, 1988).

11
Feldstein concluded that “voluntary support of institutions of higher education
by individuals was concentrated in the upper income classes and the over time these
donors were very sensitive to changes in the price of giving resulting from variations in
marginal tax rates” (as cited in Leslie & Ramey, 1998, p. 118). More recently Holmes
(2009) found that alumni living in states with lower tax deductions give less, a
counterintuitive finding. As income increases, however, this effect reverses confirming
Holmes' hypothesis that the deductibility of charitable gifts is primarily relevant for
those individuals wealthy enough to itemize their taxes and claim such deductions.
Business conditions impact corporate and individual donors differently. In a
study of philanthropy and business conditions between 1948 and 1968, Leslie found
that corporate giving was positively impacted by good economic conditions, donations
from individuals increased most during weak economies which created periods of
organizational need (as cited in Leslie & Ramey, 1998). According to Patrick M. Rooney,
the executive director of the Center on Philanthropy at Indiana University, the direct
correlation between the economy and corporate giving remains. In an interview with
Philanthropy Journal, Rooney stated that corporate giving is “in large part…driven by
changes in corporate profits and overall economic activity" (Boney, 2008, p. 1).
Alumni Giving and Institutional Characteristics
The study of institutional characteristics typically utilizes data from Giving USA
and the Voluntary Survey of Education (VSE). Giving USA is an annual publication from

12
the Giving USA Foundation on data and trends about charitable giving in the United
States. Giving USA has been published since 1956 and is one of the richest sources for
longitudinal data about philanthropy trends in the country. The Council for Aid to
Education (CAE) conducts an annual survey of higher educational institutions which
gathers data on institutional characteristics, donor characteristics, and gift
characteristics. Data from this survey is made available by subscription and is widely
used by authors of college ranking articles and books. Research shows that the type of
school (private vs. public), the size of school (small, medium, and large), and the scope
of the fund raising operation (in human and financial resources) all affect fund raising
outcomes (Leslie & Ramey, 1998). Research supports the notion that spending more
money on fund raising results in increased fund raising results (Harrison, 1995), though
no attempts have yet been made to compare fund raising expenditures and outcomes at
institutions of similar size and prospect pools.
Alumni Giving and Individual Characteristics
For the purposes of this research, the most relevant literature is that on the
study of individual donor characteristics. To date there have been two main categories
of research into higher education donor characteristics. First, there is a body of
research into the demographic characteristics of donors. These studies, primarily
conducted at large, state university by graduate students, attempt to identify
characteristics which distinguish donors from non‐donors or small donors from large
donors. Results from these studies are sometimes contradictory and rarely are studies

13
conducted at more than one institution. As such there has been little consensus in the
literature about the common demographic characteristics of donors. Second, there is
another body of research into the behaviors, attitudes, and beliefs of donors vs. non‐
donors. These studies are based on survey data and analyze self‐reported information
from alumni in combination with institutionally‐collected giving data. Consistently these
studies find that there are several behaviors and attitudes which are predictive of donor
behavior.
Demographic Characteristics of Donors
Age. Hoyt (2004) and Leslie and Ramey (1998) found that age was a significant
predictor of donor status in that older alumni were more likely to be donors. Watsyn
(2009) identified a number of additional studies which proved the same positive
correlation between age and giving status (Bristol, Jr., 1990; Clotfelter, 2001; Conner
2005; Grant & Lindauer, 1986; Harrison, Mitchell, & Peterson, 1995; Koole as cited in
Wastyn, 2009; and Quicley, Bingham, & Murray as cited in Wastyn, 2009). Van Syke and
Brooks found that age was the most consistent variable affecting giving (as cited in
Baldwin, 2008). Similarly, Sun, Hoffman, and Grady (2007) found several studies which
found that time since graduation a significant predictor of giving. These studies are
confirmed by the findings of McAlexander and Koenig (2001). Bruggink and Siddiqui
found that for donors, a one year increase in age increased gift size by 5% (as cited in
McDearmon & Shirley, 2009). As more and more college students are of non‐traditional
age, this research question can better evaluate correlation between years as an

14
alumnus vs. years of age. Bristol (1990), Wunnava (as cited in Wastyn, 2009), and
Okunade (as cited in Sun et al., 1997) report that while age is a positive predictor of
giving, the growth of alumni donations declines after age 52.
Income. There is some consensus that age may be a proxy for income as a
predictor of donor status. While research has not determined the amount of
overlapping correlation between age and income, it is true that the majority, if not all,
of the research into demographic characteristics of alumni focused on a general student
body which would be mostly comprised of traditional aged students. Some researchers
have pointed out that studying years from graduation instead of age would help to
distinguish the roles of the two variables more clearly. Regardless, it is clear that higher
income is a predictor of donor status (Baade & Sundberg as cited in Weerts & Ronca,
2009; Belfield & Beney as cited in Weerts & Ronca, 2009; Brittingham & Pezzullo, 1990;
Bruggink & Siddiqui as cited in Wastyn, 2009; Coltfelter, 2001; Koole as cited in Wastyn,
2009; Monks, 2003; Leslie & Ramey, 1988; Lindhal & Winship as cited in Wastyn, 2009;
Olsen, Smith, & Wunnava as cited in Weerts & Ronca, 2009; Schmidt, 2001; Thomas &
Smarts as cited in Weerts & Ronca, 2009; and Tsao & Coll as cited in Wastyn 2009).
Hernandez‐Murillo and Roisman (as cited in Baldwin, 2008) report the claim that
"income is by far the most important predictor of giving behavior" (p. 35). There are
few dissenting voices to this assertion. Watsyn (2009) reported two studies which
found that income did not predict donor status (as income increased, individuals were

15
no more or less likely to be donors), but that higher income did correlate to higher gift
sizes (Schervish & Van Horn, as cited in Watsyn, 2009).
Other Demographic Characteristics. Beyond age and income, there is little depth
in the research of other alumni demographic characteristics and how they correlate to
giving behavior. Two studies have found that females have a higher propensity to give
then males (Belfield & Beney, as cited in Sun et al., 2007; Van Slyke & Brooks, as cited in
Baldwin, 2008), but in most studies where gender is considered it is not found to have a
correlation to giving behavior. Belfield and Beney (as cited in Sun et al., 2007) and
Monks (2003) also found that marital status is a predictor of donor status. Family ties to
the alma mater (relatives and/or children who attended) appear to predict donor status
(Okunade & Berl as cited in Weerts & Ronca, 2009; Wunnava & Lauze, 2001) but very
little of the literature studies this characteristic. Two studies found that distance from
the alma mater was statistically significant (Bruggink & Siddiqui, as cited in Sun, et al.,
2007; McDearmon & Shirley, 2009) and that alumni who lived closer to their alma mater
were more likely to be donors. These studies; however, were conducted on state school
alumni populations and should not be considered generalizable to schools which have
more nationally distributed student populations.
Several researchers have explored the link between receipt of financial aid as a
student and alumni donor status. McDearmon and Shirley (2009) found that receiving
loans was not predictive of donor status but that more alumni who graduated without

16
institutional loans made gifts. Marr et al. (as cited in McDearmon & Shirley, 2009) and
Monks (2003) found that receiving student loans had a negative correlation with donor
status but that the receipt of need‐based grants increased the probability of giving.
Hoyt (2004) reported that alumni in donor groups were much more likely to have
received a scholarship of $1,000 or more.
Demographic Characteristics and Status as Occasional vs. Consistent Donors.
While most research in this category focuses on identifying demographic
predictors of donor status, Wunnava and Lauze (2000) investigated the difference
between occasional donors and consistent donors. In keeping with fund raising
practice, this research differentiated between consistent donors who often fall into the
LYBUNT (Last Year But Not This) category and occasional donors who often fall into the
SYBUNT (Some Years But Not This) category. The research did identify differences in
residence, some of which were unexpected. According to their research, half of
occasional donors live in states with institutional alumni chapters compared to only 20%
of consistent donors, the opposite of what was expected. The study also investigated
the donor life cycle. For the vast majority of donors, once giving begins it increases for a
period of years, then plateaus, then decreases, then ends. This is commonly referred to
as the donor life cycle. Occasional donors, who may be less motivated to give, were
found to have a shorter life cycle than consistent donors, a much more intuitive result.
Being an alumnus of a Greek‐letter organization was a significant predictor of occasional
donors but had no predictive quality for consistent donors.

17
Attitudinal and Behavior Characteristics of Donors
Researchers have evaluated student behaviors and attitudes and how these
relate to giving intentions as well as alumni behaviors and attitudes and how these
relate to giving intentions and behaviors. This research is typically conducted by
analyzing data which is gathered from surveys paired with institutional data
(demographic and giving). Attitudes and behaviors evaluated by researchers in survey
tools have consistently assessed (a) feelings about the undergraduate experience, (b)
feelings about the alma mater's reputation, and (c) involvement with alma mater
activities as an alumnus.
Research consistently shows that engaged college students are more likely to
become engaged college alumni and that alumni engagement is a predictor of alumni
giving (Caboni, 2003; Clotfelter, 2003; Gaier, 2005; Gallo & Hubschman, 2003; Hoyt,
2004; McAlexander & Koenig, 2001; Monks, 2003; Sun et al., 2007; Wastyn, 2009;
Weerts, 2007; Weerts & Ronca, 2007). Almost exclusively, the studies which report
these outcomes are based on alumni surveys which gather self‐reported attitudinal
behavior about the college experience, current activity with the college, and current
beliefs about the college and giving. More recent studies of alumni giving claim that the
beliefs and attitudes of current alumni are far more helpful to practitioners than
demographic predictors (Hunter, Jones & Boger, 1999).

18
Alumni Reports of Student Experience. Early studies of donor attitudes and self‐
reported behaviors and their correlation with giving behavior found that “financial
contributions made by alumni are socially motivated and related to involvement in
social groups and alumni associations" (Allen, as cited in Hunter et al., 1999, p. 529).
Indeed, many studies found strong connections between the self‐reported student
experience and alumni involvement and/or giving level. Pearson (1999) reported that
Stanford Alumni are more likely to give if they are satisfied with their student
experience and/or are engaged as alumni. In a study of alumni who were donors,
Weerts and Ronca (2009) found that a high level of student engagement was predictive
of alumnus volunteer activity.
In some cases, research showed that alumni who report positive feelings about
their college experience were more likely to be involved with their alma maters (more
broadly than as volunteers) and that their emotional attachment to the university is a
significant predictor of giving (Gaier, 2005; Gallo & Hubschman, 2003; Harrison, 1995;
Sun et al., 2007). In one of the few studies on multiple institutions, Monks found that
the most significant determinant of alumni giving level was satisfaction with the
undergraduate experience (Monks, 2002). This finding was supported by Coltfelter
(2003) and McDearmon and Shirley (2009), who reported that donations are highly
correlated to satisfaction with the college experience. While alumni giving rates do not
"adequately measure graduates' satisfaction with educational experience" (Brant &

19
Regan, 2002, p. 24), research clearly demonstrates that satisfaction with the college
experience plays a significant role in alumni giving.
Alumni Engagement. Whether engagement comes in the form of participating in
social alumni groups (Allen as cited in Hunter, Jones, & Boger, 1999), reading alumni
publications (Werts & Ronca, 2009), visiting campus (Shadoian, as cited in Sun et al.,
2007), attending events (Hunter et al., 1999; Netzer, Latin, & Srinivasan, 2008), or
serving in a formal volunteer role (Van Slyke & Brooks, as cited in Baldwin, 2008),
researchers agree that alumni who are engaged with the institution are more likely to
give (Brittingham & Pezzullo, 1990; Coltfelter, 2003; Gallo & Hubschman, 2003;
Heckman & Guskey, 1998; Hoyt, 2004; Hunter et al., 1999; Miracle, as cited in Weerts &
Ronca, 2009; Oglesby, as cited in Sun et al., 2007; Taylor & Martin, 1995). Wastyn (2009)
reported that in his unpublished dissertation, Conner (2005) found no difference in the
level of alumni involvement between donors and non‐donors, this being the one
dissenting voice in the literature. Hunter et al. found that the best predictors are
attachment to the school and participation in alumni events (1999). In addition, Korvas
found that the longer the engagement continues, the more developed the relationship
between alumnus and alma mater, the more generous alumni are over time (as cited in
Weerts & Ronca, 2009).
Many studies have shown that alumnus involvement with the alma mater was a
significant variable in alumni giving (Brittingham & Pezzullo, 1990; Gallo & Hubschman,

20
2003; Heckman & Guskey, 1998; Hoyt, 2004; McDearmon & Shirley, 2009; Sun et al.,
2007; Weerts & Ronca, 2009). Schmidt (2001) found "no conflicting findings to suggest
that emotional attachment to the institution is not a determining factor in donor status
or donor level” (p. 23). Hoyt (2004) suggested that alumni "who have greater
involvement in alumni activities…are more likely to perceive a college need for
donations [and] as a result, these alumni are more likely to donate (p. 19)."
Proxy Data for Attachment. Since alumni survey results can only be collected on
a portion of the alumni population and almost always come with a response bias (those
alumni who are more engaged may be more likely to respond to surveys), some
researchers have attempted to find proxy variables for attachment. Tom and Elmer
(1994) found that alumni who owned insignia goods were more willing to give. Heuston
(1992) suggests that attendance at reunions and other university functions is a proxy for
emotional investment.
Theoretical Foundations
Students of philanthropy have attempted to identify a theoretical foundation for
the study of charitable giving but there is little consensus in the literature. Common
frameworks cited in the literature include economic and sociological frameworks. One
economic theory which can be applied to philanthropy is utility theory, based on the
assumptions that people prefer outcomes which maximize the utility of their actions
and that people behave independently and rationally based on complete information. A

21
commonly referenced sociological framework is altruism, often cited by researchers of
philanthropy as a "primary motive for why individuals make [charitable] donations"
(Mann, 2007). Altruism suggests that charitable persons give to non‐profit
organizations due to an obligation to provide collective goods and services to society.
The idea that donors derive utility from providing service to recipients or a public
benefit through charity (Keating, Pitts, & Appel, as cited in Weerts & Ronca, 2009) is
sometimes referred to as 'impure altruism.' This combination of the economic and
altruism perspectives has become more popular in recent research. Most researchers,
however, agree with Hunter et al. (1999) who stated that there are "more promising
models of individual behavior as donors depart from models of pure altruism in favor of
exchange models” (p. 531). Social exchange theory focuses on the human interaction
during the social exchange, in the case of philanthropy during the act of gift making and
receiving (Sun et al., 2007).
Equity Theory posits that "society rewards individuals for equity in their
interactions with others" (Sun et al., 2007, p. 310). The theory suggests that imbalance
in relationships causes stress and, accordingly, philanthropic acts are attempts on the
part of the donor to balance the abundance in their lives by distributing wealth to
organizations or people who are less fortunate.
Researchers who base their work on Expectancy Theory discuss donor awareness
of need and efficacy. They posit that people give based on whether they feel that the

22
organization needs their support and whether their gift will make a difference to the
organization (Vroom, as cited in Werts & Ronca, 2009). This same argument is utilized
by researchers who discuss Utility Theory because those alumni who feel that the
institution needs their support may derive more utility (satisfaction) from giving and
thus may make a larger gift than those not holding this belief (Werts & Ronca, 2009).
Utility Maximization Theory, in fact, focuses on the intangible rewards of giving
(such as a boost in self‐esteem from affiliation or increased happiness from renewing
the connection with alma mater). Yoo and Harrison found that intangible rewards of
giving increased levels of alumni gifts, suggesting that utility maximization relates to
giving levels (as cited in Weerts & Ronca, 2009). "Whether it relates to tax advantages,
a desire to improve society, the potential to reap intangible rewards, or an ability to
foster positive social interactions, each of these motivations for giving relate to
maximizing one's satisfaction" (Weerts & Ronca, 2009, p. 98).
Social exchange theory suggests that an individual's decision to give is not pure
altruism, but part of an exchange cycle. The donor makes a gift and in return receives
emotional benefits such as positive feelings, connection, access, and even influence.
Sun et al. (2007) explain that an "exchange occurs only when both parties in the
exchange find their rewards attractive" (p. 310). Recently, social exchange theory has
emerged as the favorite of practitioners and a commonly cited theory in peer‐reviewed
academic research as well.

23
In her doctoral dissertation, Karen Meshad Baldwin (2008) defines the six major
categories of donor motivation found in the literature: "religious, spiritual, or
philosophical beliefs; guilt; recognition or ego; obligation; satisfaction or joy; and belief
in the mission or cause" (p. 35). Some researchers look to economic frameworks to
understand philanthropic behavior while others suggest that social and psychological
motivations play a powerful role, but in the end, "philanthropy cannot be viewed in the
context of a single field or discipline" (Mann, 2007, p. 36). Instead, Mann (2007)
suggests that philanthropy is “embedded throughout many traditional scholarly areas,
including organizational behavior, sociology, economics, consumer behavior, and
marketing and sales" (p. 36).

24
Chapter 3
Methodology
This study explored the connection between several demographic characteristics
of Valley University (hereafter referred to as “Valley”) alumni and their engagement
with the university as alumni (hereafter called “alumni engagement”) as well as the
correlation between alumni engagement and alumni giving behavior. Specifically, the
study attempted to answer these research questions:
R1: Are there statistically significant and practically meaningful differences between
Valley alumni who are highly engaged and alumni who are not engaged?
R2: Is there a relationship between Valley alumni engagement and their giving behavior,
and if so, what kind of relationship?
Designing the Engagement Score
In the fall of 2010, Valley University hired higher education statistical consultants
to develop an alumni engagement score. Alumni engagement is a term used in
university advancement offices to describe the way alumni are, or are not, connected to
their alma maters. There is no industry‐wide definition of alumni engagement. The
term can be used to describe attitudes, such as how alumni self‐report feelings of
emotional attachment to their alma mater, or behaviors, such as how many events an

25
alumnus attends or what volunteer roles an alumnus has, or a combination of both. At
Valley, alumni engagement is used to describe quantifiable behaviors which
demonstrate connection to the University.
Valley University alumni relations staff members were consulted as experts
during the score development process. A policy capturing technique was used to rate
every living, degreed alumnus for his or her level of engagement with Valley University,
thus creating a unique engagement score for each. Policy capturing is a statistical
method used to convert professional assessment into a numerical formula which can
reproduce that assessment. According to Kline and Sulsky (1995), the goal of the policy
capturing approach is to “understand an individual's decision making ‘policy’ by
observing the relationships between the decision cues given to the individual (e.g., GPA,
GRE scores), and the final decision made by the individual (e.g., probability of accepting
the student into graduate school) and then modeling that relationship using an
idiographic multiple regression analysis (i.e., regression analysis carried out for a single
individual). The results of the analysis provide a description of how the individual
decision‐maker weights the various cues to arrive at his or her decision” (Kline & Sulsky,
1995, p. 394).
The goal, in this case, was to develop a numerical formula which would
reproduce the collective staff’s assessment of low to high engagement based primarily
on documentation of alumni behavior, as opposed to alumni self‐reported behavior.

26
The first part of the process involved identifying available variables on alumni
behavior and evaluating the variable data sets. It is important to note that giving
behavior variables were not used in the policy capturing exercise. This intentional
omission was significant for several reasons. First, it was extremely important to the
alumni relations professionals that the engagement score could be a tool to measure
their effectiveness in building relationships, not in raising money. Second, it was critical
to the analysis of correlation between engagement behavior and giving that the
engagement score be based on variables that would not serve as proxies for, or
references to, giving behavior. Finally, while few colleges and universities have
developed engagement scores using institutionally owned data rather than survey data,
no published studies were identified that excluded giving variables from their scores,
making this research especially unique.
When evaluating variables for inclusion, the consultants and University staff
considered the following: Is this piece of data available on all alumni and for what
period of time? Is the data accurate? Is the data serving as a proxy for giving behavior?
Data points which were not available across the entire population and data sets which
were questioned for accuracy were excluded from the analysis.
An example of a data set that was considered but rejected for inclusion in the list
of variables is Club Tier. Valley University has a tiered Alumni Club program, where Tier

27
One Clubs are very active and provide a robust event calendar, Tier Two Clubs are less
active with a more limited event calendar, and Tier Three Clubs are very small and may
not even have one event per year. Analysis of this data showed that the tier system was
constantly changing and therefore the current status of an alumnus’ Alumni Club Tier
may have changed very recently. Consultants and university staff agreed that this data
set was too problematic for inclusion as a variable.
Another data set that was considered for inclusion but then rejected was student
activity data. While Valley University had very good data on student participation in
varsity athletics and social Greek organizations for the alumni population, efforts to
track other student activities have been much more recent. Data on student activities
such as admissions tour guides, orientation leaders, student calling program callers,
homecoming hosts and hostesses, and reunion ambassadors was available
inconsistently at best, and not‐at‐all, at worst. Again, consultants and university staff
agreed that this data set was too problematic for inclusion as a variable.
A final example of data that was considered for inclusion but then rejected was
bequest society membership. While it is true that alumni who have recorded bequest
intentions which support the university are likely to be engaged alumni, this variable
clearly served as a proxy for donor status and was therefore rejected for inclusion as a
variable for the policy capturing exercise. Table 1 provides the final list of the variables
which were used in the policy capturing exercise.

28
Table 1 Variables used in the policy capturing exercise
ID Number
Unique identifier for the alumnus in the Valley University alumni database
Class Year
For alumni, “preferred” class year, which is the graduating class with which the alumnus identifies most strongly. This is used most frequently for alumni who left Valley University during a war and then returned later to complete their degree. Most of these alumni prefer to be identified with the class year they were planning to graduate when they matriculated, not the class year they actually graduated.
Number of Relatives The number of relatives listed in the constituent’s database record who also have a Valley University record. This can include Valley University parents who are not alumni, Valley University parents who are alumni, spouses/partners who are alumni, children who are alumni, and other relatives who are alumni.
Valley Spouse Indicates constituents whose current spouse/partner also attended Valley University
Valley Parent Indicates constituents who have at least one parent (living or deceased) who attended Valley
Non‐Valley Child Indicates constituents who have reported at least one child who did not attend or has not yet attended Valley
E‐Mailable Indicates constituents who have provided an e‐mail address
Business Phone Indicates constituents who have a business phone listed in the alumni database
Solicitable Indicates constituents who have contact information in the alumni database and have not requested “no solicitation”

29
Online Alumni Community
Indicates constituents who are registered in the online‐alumni community
Affinity Group Indicates that the constituent is a member of an Alumni Relations & Career Development Center Affinity Group
Event Count The number of the alumni database events that the constituent has attended. Data for this field exists from 1995‐present.
Reunion Attendance Count
The number of Reunions that the constituent has attended within years for which the data is available electronically (1996, 1997, 2000‐2010)
Year Most Recent Reunion Attended
If the constituent has attended Reunion, the most recent year in which this attendance occurred
Years of Volunteering The total number of years in which the constituent has a volunteer role listed in the alumni database
Volunteer Activity Count The number of formal volunteer roles in which the alumnus has served
Internship/Externship Indicates constituents who offered to host an internship/externship
Mentoring Indicates constituents who have registered a willingness to mentor a student
Number of Contacts The number of contacts in the constituent’s record with the contact type of personal visit, campus visit, contact copy, cancelled visit, event, e‐mail/letter, gift/pledge RGP transaction posted, phone call, presidential response draft, presidential survey response, student calling comment, and/or televisit
Campus Visit Indicates constituents who have a recorded campus visit in the alumni database; Campus Visits are all‐day on‐campus visits customized for constituents who often include class observation and/or presentation, meetings with faculty

30
and/or administrators, presentations to the Valley Community, and participation in major campus events
The second part of the process involved creating a profile report that included all
of the selected variables in an accessible format. A sample profile is included in
Appendix A. The entire alumni relations team gathered for a one hour profile review and
rating session. During this session, each rater reviewed a set of 100 profiles and was
asked to grade each profile using a 13 point scale (F, D‐, D, D+, C, and so on) for
engagement level, where an F was the lowest engagement grade and an A+ was the
highest engagement grade. The raters were unaware of this, but in each set of 100
profiles, 75 were unique (profiles 1‐75) and 25 were duplicates (76‐100) to allow for the
evaluation of intra‐rater reliability. Raters were told to complete the profile review and
rating process without too much analysis, but instead to rely on their professional
opinion. Raters were also told to work alone and to avoid looking at colleagues’ ratings
or sharing notes or observations.
An analysis of intra‐rater reliability was performed by computing the Pearson’s
Product Moment Correlation Coefficient between each rater’s grading of the first 25
profiles and the last 25 profiles, which were duplicates. These correlations are listed in
Appendix B. The correlations ranged from r = .276 to r = .913. Low intra‐rater reliability
indicated that a rater was significantly inconsistent in rating the same exact data from
one moment to the next. This suggested that the rater did not have a clear definition in
his/her own mind for low to high alumni engagement, which is necessary for the policy

31
capturing exercise to create a consistent and valid predictor equation. University staff
and the consultants agreed to eliminate all raters with an inter‐rater correlation
coefficient below .40. This eliminated one rater from the remainder of the analysis and
resulted in a mean inter‐rater reliability coefficient of .762.
Two steps were taken to evaluate inter‐rater reliability. First, the Pearson’s
Product Moment Correlation Coefficient was calculated for the raters’ scores on each of
the 75 unique profiles resulting in an r value range between .559 and .903, with a mean
inter‐rater reliability coefficient of .781. Second, a correlation matrix showed the inter‐
rater r values. An inter‐rater reliability of .70 or above provides a reasonable estimate
of engagement that is locally defined, and showed that the analysis will be built upon
trustworthy ratings.
The Engagement Score Formula
The intra‐rater and inter‐rater analysis provided sufficient confidence to the
investigator and the statistical consultants that proceeding with the policy capturing
technique was feasible. At this point, the consultants collapsed the ratings of all 23
raters for each profile. Multiple regression analysis resulted in a formula which could
generate an outcome variable Y which had a very strong correlation to the collapsed
rater grades (r = .0787). All of the variables were used in the formula, in spite of the fact
that the correlation for three of them was not significant at the .05 level (Number of
Valley Relatives, Willing to Mentor, and Non‐Valley Child) which resulted in an r2 value
32
of 62.3% and an adjusted r2 value of 61.9%. The formula created a predicted Y
(engagement score) with the highest possible correlation to the actual Y (the collapsed
engagement rating from the policy capturing exercise). This was done to minimize the
difference between the actual rating and the predicted rating. This preliminary
engagement score formula is provided in Appendix C.
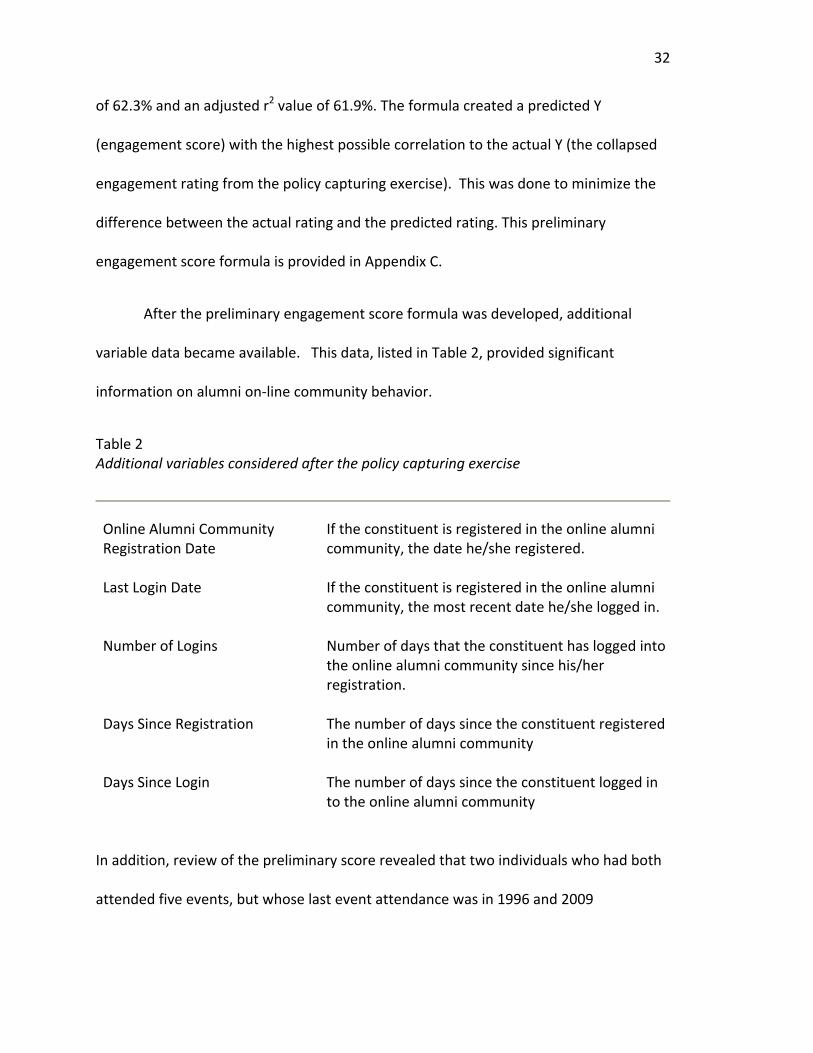
After the preliminary engagement score formula was developed, additional
variable data became available. This data, listed in Table 2, provided significant
information on alumni on‐line community behavior.
Table 2 Additional variables considered after the policy capturing exercise
Online Alumni Community Registration Date
If the constituent is registered in the online alumni community, the date he/she registered.
Last Login Date If the constituent is registered in the online alumni community, the most recent date he/she logged in.
Number of Logins Number of days that the constituent has logged into the online alumni community since his/her registration.
Days Since Registration The number of days since the constituent registered in the online alumni community
Days Since Login The number of days since the constituent logged in to the online alumni community
In addition, review of the preliminary score revealed that two individuals who had both
attended five events, but whose last event attendance was in 1996 and 2009

33
respectively would, with all other variables being equal, receive the same engagement
score. The same was true for service as a volunteer. To address this, two additional
data points listed in Table 3 were added to the analysis.
Table 3 Recency variables added to the analysis
Latest Year Event Attend If the constituent has attended any events which are recorded in the alumni database event (including Reunion), the most recent year in which this attendance occurred.
Year of Most Recent Volunteering
If the constituent has volunteered for a formal volunteer role, the most recent year in which this volunteering occurred.
Rather than repeat the policy capturing exercise, the consultants built a
regression model where the dependent variable was the preliminary engagement score
and the independent variables were the new variables described above. Then the
predicted values from this regression model were added to the preliminary engagement
score to provide "extra credit" for those alumni who showed additional engagement
behavior. In point of fact, the new scores increased the apparent engagement of some
alumni, decreased the apparent engagement of others, and left some unchanged. As a
result of the additional analysis, the final engagement score formula was developed.
This formula is provided in Appendix D. Using this formula, an engagement score was
created for each alumnus in the advancement database.

34
Once the engagement score was entered into the advancement database, a
dataset was developed for the study. This data set included all of the variables used in
the score as well as additional demographic, activity, and giving behavior variables.
These additional variables are listed in Table 4.
Table 4 Additional variables utilized in study
Gender Male or Female
Greek If the constituent was a member of a fraternity or sorority as an undergraduate at Valley.
Varsity Sports If the constituent was a member of a varsity athletic team as an undergraduate at Valley.
Class Year Decade Class year transformed into class year decades. Classes between 1920‐1929 became 1920, between 1930‐1939 became 1930, etc.
Generation Birth date transformed into generations (Greatest, Silent, Baby Boom, Generation X, Millennial).
College College which awarded the undergraduate degree(s): College of Engineering, College of Arts & Sciences, or both
Degree Type Degree type awarded: BS, BA, or BSBA
Donor Indicator Indicates individuals who have made at least one gift to Valley
FY10 Donor Indicator Indicates individuals who made at least one gift to Valley in FY10

35
Cornerstone Community Indicates individuals who are members of the Cornerstone Community in FY11 (gifts to Valley in FY11, FY10, and FY09)
Cornerstone Renewals Indicates individuals who were members of the Cornerstone Community in FY10, but not yet in FY11 (gifts to Valley in FY10, FY09, and FY08)
Cornerstone Prospects Indicates individuals who have two years of consecutive giving and will be members of the Cornerstone Community if they make a gift in FY11 (gifts to Valley in FY10 and FY09, but not in FY08 and not yet in FY11)
Last Gift Date This is the date of the most recent gift or pledge payment made by the constituent.
Lifetime Giving All multiple credit, memo credit, and match projections associated with a donor.
Adjusted Lifetime Giving Lifetime giving divided by the number of years since graduation
RFM Score Recency, Frequency, and Monetary Score; the formula for this score is in Appendix E.
R Score The recency portion of the RFM score
F Score The frequency portion of the RFM score
M Score The monetary portion of the RFM score
Bequest Society Indicator Indicates constituents who have indicated that they have Valley in their estate plans
Analysis
Due to the fact that some of that data which was used in the policy capturing
exercise was only available from 1995 forward, the distribution of the alumni
engagement score was studied for three populations: the entire alumni population, the

36
mature alumni population (with graduation years prior to 1995) and the young alumni
population (with graduation years from 1995 forward). An independent t‐test was run
on these populations to determine if there was significant variance. These populations
were utilized during much of the remaining analysis for research question one.
Descriptive statistics were used to investigate the mean of the dependent
variable, engagement score, for the independent categorical variables of men/women,
Greek/independent, varsity athlete/non‐athlete, college, degree type, and generation.
For the variables of men/women, Greek independent, and varsity athlete/non‐
athlete, an independent t‐test was run to evaluate whether or not there were
statistically significant differences between the mean engagement scores. When
statistically significant differences were found, a Cohen’s d value was calculated to
determine if the statistical difference was also meaningful. For the variables of college,
degree type, and generation, an analysis of variance (ANOVA) was run to evaluate
whether or not there were statistically significant differences between the mean
engagement scores. When a statistically significant difference was identified, posthoc
testing (Tukey’s) was conducted to identify where the significant differences existed.
Then, a Cohen’s d value was calculated to determine if that difference was also
meaningful.
To investigate the relationship between the alumni engagement score variable
and the giving variables of donor status, FY10 donor status, Cornerstone Community

37
status, Cornerstone Renewal status, Cornerstone prospect status, Bequest Society
membership, RFM score, R score, F score, and M score, correlation coefficients were
calculated .

38
Chapter Four
Results
Defining the Population
An alumni engagement score was calculated for all living (as of January 1, 2011),
degreed alumni and the resulting data set contained 39,861 records. The engagement
score is a number which represents a practitioner’s assessment of how involved an
alumnus is with Valley based on his or her activities since graduation, such as
volunteering, event attendance, and participation in the online alumni community. The
engagement scores range in value from 0.0 to 13.0. The distribution of the engagement
score met the assumptions of normality. The mean engagement score for the entire
population is 7.18, the median engagement score is 7.0, and the mode engagement
score is 5.0. The engagement score for the whole alumni population has a standard
deviation of 2.86.
A review of the data set utilized to build the score revealed that, while Valley
University has a very strong data set on alumni behaviors in comparison to most
colleges and universities, the data set remains significantly limited. Information on
event attendance and volunteer activities is far more robust from 1995 forward.
Therefore, an alumnus who graduated in 1960 and attended his fifth and 10th reunions
would not have these events reflected in his engagement score. Alternately, an
39
alumnus who graduated in 1998 and attended his fifth and 10th reunions would have
these events reflected in his engagement score.
When alumni who graduated in 1995 or later are considered, the population size
is reduced to 13,495, still a substantial research population. The distribution of the
engagement score for this population also meets the assumptions of normality. Among
this younger population, the mean engagement score is 7.811, the median engagement
score is 8.0, and the mode is 5.0. The engagement score of the young alumni
population has a standard deviation of 2.55.
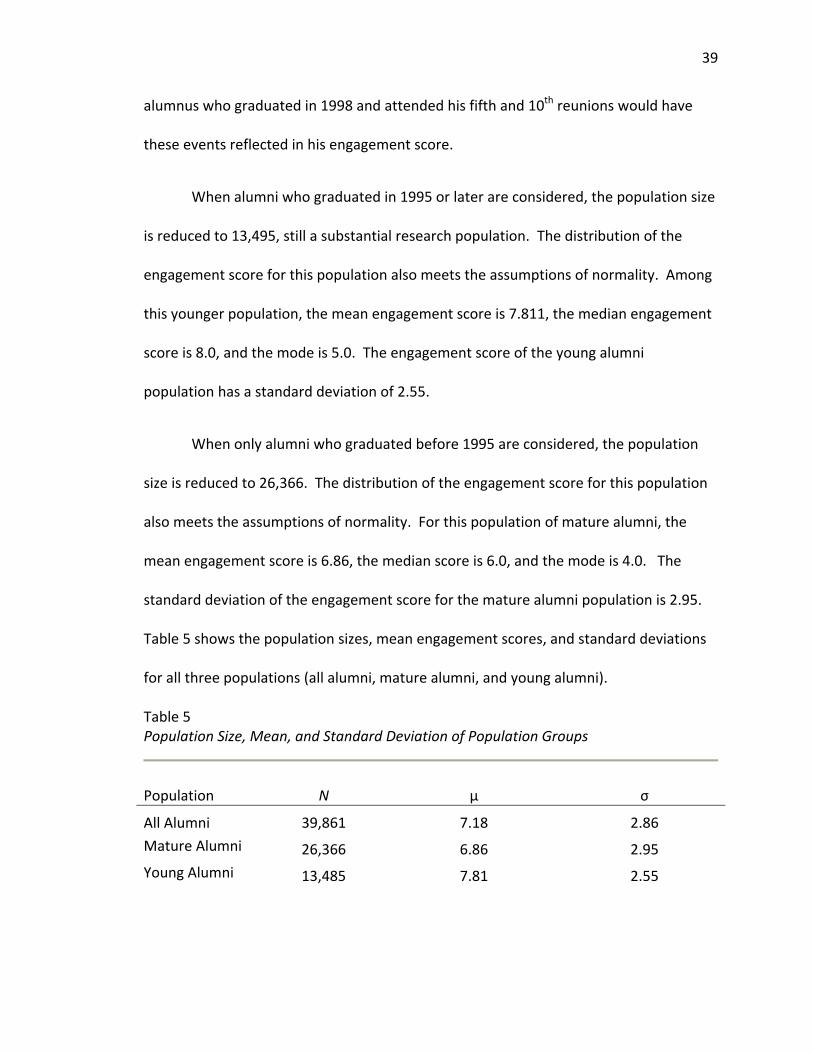
When only alumni who graduated before 1995 are considered, the population
size is reduced to 26,366. The distribution of the engagement score for this population
also meets the assumptions of normality. For this population of mature alumni, the
mean engagement score is 6.86, the median score is 6.0, and the mode is 4.0. The
standard deviation of the engagement score for the mature alumni population is 2.95.
Table 5 shows the population sizes, mean engagement scores, and standard deviations
for all three populations (all alumni, mature alumni, and young alumni).
Table 5 Population Size, Mean, and Standard Deviation of Population Groups
Population N µ σ
All Alumni 39,861 7.18 2.86
Mature Alumni 26,366 6.86 2.95
Young Alumni 13,485 7.81 2.55

40
An independent t‐test showed that there was a statistically significant difference
between the mean engagement scores of mature and young alumni groups (t39859 = ‐
33.40, p < 0.01) with young alumni having higher engagement scores (µ = 7.81: σ = 2.55)
than the mature alumni (µ = 6.86: σ = 2.95). This difference, however, is not a
meaningful one (d = 0.4261).
Research Question 1
Are there statistically significant and practically meaningful differences in engagement
levels among significant cohorts of alumni?
To answer the first research question, an analysis of engagement score on the basis of
gender, student activity participation (social Greek organizations and varsity athletics),
college, degree type, and generation was conducted.
Gender. Among the all population groups (all, mature, and young alumni)
women have a higher mean engagement score than men. In the total alumni
population, the difference between the engagement scores of men (µ = 7.18: σ = 2.86)
and women (µ = 7.81: σ = 2.55) was statistically significant (t38327 = ‐15.195, p = .00)
but not meaningful (d = 0.1531). In the mature alumni population, the difference
between the engagement scores of men (µ = 6.86; σ = 2.95) and women (µ = 7.0: σ =
2.97) was also statistically significant (t26364 = ‐6.777, p = .00) but not meaningful (d =
0.0478). In the young alumni population, the difference between the engagement

41
scores of men (µ = 7.5: σ = 2.48) and women (µ = 8.12: σ = 2.58) was also statistically
significant (t13484 = ‐14.227, p = .00) but not meaningful (d = 0.35). Table 6 shows the
population sizes, engagement score means, and standard deviations for males and
females by each population group (all alumni, mature alumni, and young alumni).
Table 6 Mean engagement scores for men and women in all three populations
Total N
Male Female
Population Engagement Score
Population Engagement Score
% N µ σ % N µ σ
All Alumni
39,861 54.5% 21,705 7.18 2.86 45.5% 18,156 7.81 2.55
Mature Alumni
26,366 56.9% 15,001 6.86 2.95 43.1% 11,365 7.00 2.97
Young Alumni
13,495 49.6% 6,704 7.50 2.48 50.3% 6,791 8.12 2.58
Greek Life. Among all of the population groups, Greek alumni have a higher mean
engagement score than Independent alumni. In the entire alumni population, the
difference between the engagement scores of Greek (µ = 7.5: σ = 2.91) and independent
(µ = 6.71: σ = 2.70) alumni was statistically significant (t35904 =‐27.378, p = .00), but not
meaningful (d = 0.3458). In the mature alumni population, the difference between the
engagement scores of Greek (µ = 7.17: σ = 3.01) and independent (µ = 6.37: σ = 2.79)
alumni was statistically significant (t23124 = ‐22.101, p = .00) but not meaningful (d =

42
0.3212). In the young alumni population, the difference between the engagement
scores of Greek (µ = 8.15: σ = 2.59) and independent (µ = 7.34: σ = 2.41) alumni was
statistically significant (t12663 = ‐18.783, p = .00) but not meaningful (d = 0.4133). Table 7
shows the population sizes, the mean engagement scores, and the standard deviations
for Greek and independent alumni in all three populations (all alumni, mature alumni,
and young alumni).
Table 7 Mean engagement scores for Greek and independent alumni
Greek Independent
Population Engagement
Score Population
Engagement
Score
% N µ σ % N µ σ
All Alumni 60.0% 23,909 7.50 2.91 40% 15,952 6.71 2.70
Mature
Alumni 61.0% 16,075 7.17 3.01 39.0% 10,291 6.37 2.79
Young
Alumni 58.1% 7,834 8.15 2.59 41.9% 5,661 7.34 2.41
Varsity Athletics. In the whole alumni population, alumni who were varsity
athletes as undergraduates have a higher engagement score (µ = 7.3092, σ = 2.99508)
than non‐athletes (µ = 6.7256, σ = 2.92059). This is also true for the mature alumni
population, where the varsity athletes (µ = 7.31: σ = 3.0) have a higher engagement
score than non‐athletes (µ = 6.73: σ = 2.92). In the whole alumni population, the

43
difference between the engagement scores of athlete and non‐athlete alumni was
statistically significant (t39859 = ‐12.609, p = .00) but not meaningful (d = 0.1986). In the
mature alumni population, the difference between the engagement scores of athlete
and non‐athlete alumni was statistically significant (t9732 = ‐13.380, p = .00) but not
meaningful (d = 0.1986). In the young population, the difference between the
engagement scores of athlete (µ = 7.81: σ = 2.51) and non‐athlete (µ = 7.81: σ = 2.58)
alumni was not statistically significant (t6845 = 0.171, p > .864). Table 8 shows the
populations, mean engagement scores, and standard deviations of athletes vs. non‐
athletes for all three population groups (all alumni, mature alumni, and young alumni).
Table 8 Mean engagement scores for athlete and non‐athlete and independent alumni
Varsity Athletes Non‐Athletes
Population Engagement Score Population Engagement Score
% N µ σ % N µ σ
All Alumni 24.5% 9,764 7.50 2.83 75.5% 30,097 7.08 2.86
Mature Alumni
23.0% 6,052 7.31 3.00 77.0% 20,314 6.73 2.92
Young Alumni
27.5% 3,712 7.81 2.51 72.3% 9,783 7.81 2.58

44
College. Mean engagement scores of alumni with degrees from the college of
engineering (µ = 7.14: σ = 2.84) are not different from those of alumni with degrees
from the college of arts & sciences (µ = 7.20: σ = 2.86), nor are they different from
alumni with degrees from both colleges (µ = 7.41: σ = 2.87). An ANOVA revealed that
the differences between the mean engagement scores among these population groups
(alumni with degrees from the college of engineering, the college or arts & sciences, or
both) are not significant (F(3, 39748) = 3.114, p = .025). Table 9 shows the populations,
mean engagement scores, and standard deviations for alumni based on college.
Table 9 Population, mean engagement scores, and standard deviations for alumni based on college.
College N µ σ
All Alumni 39,752 7.12 2.85
College of Engineering 10,987 7.14 2.84
College of Arts & Sciences 27,916 7.20 2.86
Both Colleges 839 7.41 2.87
An ANOVA found that there is a statistically significant difference in the mean
engagement scores between alumni from the various college groups among the mature
alumni population (F(3, 26254) = 7.963, p = .00). Tukey’s post‐hoc test showed that there
is a pairwise difference between all college pairs. Among mature alumni, alumni who
graduated with degrees from both colleges (the BSBA) have higher engagement scores

45
(µ = 7.25; σ = 2.90) than those with degrees from the college of arts & sciences (µ =
6.90; σ = 2.96), who have higher engagement scores than those with degrees from the
college of engineering (µ = 6.76; σ = 2.91). These differences, however, are not
meaningful (d = .12). A second ANOVA found that there is no statistically significant
difference in the mean engagement scores between alumni from the various colleges
among the young alumni population (F(3, 13490) = 3.681, p = .012).
Table 10 shows the populations, mean engagement scores, and standard deviations of
alumni by college of graduation for the mature and young alumni populations.
Table 10 Mean engagement scores by college of graduation for mature and young populations
Mature Alumni Young Alumni
Population Engagement
Score Population
Engagement Score
% N µ σ % N µ σ
College of Engineering 65.3% 7,173 6.76 2.91 34.7% 3,814 7.86 2.55
College of Arts
& Sciences 65.8% 18,371 6.90 2.96 34.2% 9,545 7.78 2.55
Both Colleges 84.3% 707 7.25 2.90 15.7% 132 8.30 2.54

46
Degree Type. When degree type is considered, alumni who graduated with a BS
have a higher engagement score (µ = 7.33; σ = 2.92) than alumni who graduated with a
BA (µ = 7.11; σ = 2.83). An ANOVA revealed that the differences between these means
is significant (F(3, 39748) = 18.974, p =.00). Tukey’s post‐hoc test showed that the only
pairwise difference is between alumni with BS and alumni with a BA. This difference,
however, is not meaningful (d = .08). Table 11 shows the population, mean engagement
scores, and standard deviations for all alumni with each degree type, while Table 12
shows the population, mean engagements scores, and standard deviations for young
and mature alumni with each degree type.
Table 11 Mean engagement scores by degree type
College N µ σ
All Alumni 39,752 7.12 2.85
BS 13,235 7.33 2.92
BA 25,674 7.11 2.83
BSBA 833 7.39 2.86

47
Table 12 Mean engagement scores by degree type for mature and young populations
Mature Alumni Young Alumni
Population Engagement
Score Population
Engagement
Score
% N µ Σ % N µ σ
All Alumni 66.1% 26,258 6.87 2.95 33.9% 13,494 7.81 2.55
BS 63.1% 8,353 6.89 3.00 36.9% 4,882 8.08 2.60
BA 67.0% 17,191 6.84 2.92 33.0% 8,483 7.66 2.51
BSBA 85.0% 707 7.25 2.90 15.0% 126 8.19 2.53
Generation. Because higher education advancement practitioners often develop
programming around generations and life‐cycle stages, it was important to explore how
the engagement score did or did not vary by the actual ages of the constituents in the
population. To do this, alumni birthdates were used to group the population by
generations. Generations were defined as follows:
Generation 1 (N = 785) The Greatest Generation includes individuals born between January 1, 1901 and December 31, 1924.
Generation 2 (N= 6,563) The Silent Generation includes individuals born between January 1, 1925 and December 31, 1945.
Generation 3 (N = 12,528) The Baby Boom Generation includes individuals born between January 1, 1946 and December 31, 1964.

48
Generation 4 (N = 14,815) Generation X includes individuals born between January 1, 1965 and December 31, 1982.
Generation 5 (N = 4842) The Millennial Generation includes individuals born between January 1, 1983 and December 31, 2000.
Older generations of alumni have lower mean engagement scores than younger
generations. An ANOVA showed a statistically significant difference in the mean
engagement scores across generation groups (F(4,29528) = 820.547, p = .00). Tukey’s post‐
hoc test showed that there was a statistically significant pairwise difference between all
generation pairs but that none of these differences are meaningful. Members of the
Greatest generation have significantly lower engagement scores than members of the
Silent Generation (d = .43), who have significantly lower engagement score than
members of the Baby Boom Generation (d = .45), who have significantly lower
engagement scores than members of Generation X (d = .18), who have significantly
lower engagement scores than members of the Millennial Generation (d = .20). The
reader is referred to Table 13 for the means and standard deviations for each group.

49
Table 13 Mean engagement scores by generation
Generation N µ σ
All Alumni 39533 7.20 2.85
Greatest Generation 785 4.71 2.47
Silent Generation 6563 5.85 2.66
Baby Boom Generation 12528 7.14 2.93
Generation X 14815 7.65 2.81
Millennial Generation 4842 8.19 2.13
Class Year Decades. Another way to consider the distribution of alumni across
the entire population is by decade of graduation. For the purpose of this analysis,
alumni from the classes of 1910‐1919 are in the 1910 decade, from the classes of 1920‐
1929 are in the 1920 decade, and so on. The greater number of alumni in more recent
decades is primarily due to two factors. First, class sizes at Valley have increased
steadily over time, producing more graduates per class and therefore more graduates
per decade. Second, the decease rate for older classes is significantly higher than it is
for younger classes, so a greater percentage of alumni in those younger classes are still
living. Table 14 shows the populations, mean engagement scores, and standard
deviations of alumni groups by decade of graduation.

50
Table 14 Mean engagement for alumni based on decade of graduation
Decade of Graduation N µ σ
All Alumni 39859 7.1819 2.85543
1930s 113 3.8319 2.12091
1940s 1194 4.8199 2.37236
1950s 2811 5.8538 2.72871
1960s 4479 6.0587 2.66817
1970s 6244 6.8909 2.86502
1980s 7462 7.6146 2.95935
1990s 8158 7.5134 2.81761
2000s 8531 8.0346 2.49226
2010s 867 7.8443 1.76310
With only a few exceptions, the mean engagement score increases as graduation
decade becomes more recent. An ANOVA showed a statistically significant difference in
the mean engagement scores across graduation decade groups (F(8, 39,848) = 468.593, p <
.01). Tukey’s post‐hoc analysis showed that there was a statistically significant pairwise
difference between almost all decade of graduation pairs.

51
Research Question 2
Is there a relationship between Valley alumni engagement and their giving behavior, and
if so, what kind of relationship?
Donor Status. The most basic way to evaluate donor behavior is to consider
whether people have or have not made at least one charitable gift to a non‐profit
organization. Practitioners utilize the terms “donor” and “non‐donor” (or “never‐
donor”) to describe this behavior. Alumni with higher engagement scores are more
likely to be donors than non‐donors (r= .20, p = .00). While this correlation is moderate,
it gets stronger when the population with the best available engagement behavior data
set (the young alumni population) is considered. Table 15 shows the correlation
coefficient and significance for the correlation between engagement score and donor
status for each population group.
Table 15 Correlation between engagement score and donor status for each population group
Population ρ p
All Alumni .200 .00
Mature Alumni .236 .00
Young Alumni .294 .00

52
The correlation between the engagement score and donor status is still moderate, but
stronger among mature alumni (r = .236; p = .00) and strongest among young alumni (r =
.294, p = .00).
FY10 Donor Status. While donor status is a useful tool to study an entire
population and an inclination to give at the most basic level, the fact that someone
made a gift once in his/her entire life does not provide much information for
practitioners about current fund raising goals and projections. Giving in the past year,
called “FY10 donor status” can be a more useful variable to consider. The correlation
between engagement score and donor‐status becomes stronger when only recent fiscal
year donor status is considered. Specifically, the engagement score is positively
correlated to FY10 donor status, more so for the mature alumni population (r = .331; p =
.00) than either the whole alumni population (r = .302; p = .00) or the young alumni
population (r = .302; p =.00). Table 16 shows the correlation coefficient and significance
for the correlation between the engagement score and FY10 donor status for each
population group.

53
Table 16 Correlation between engagement score and FY10 donor status for each population group
Population Ρ p
All Alumni .302 .00
Mature Alumni .331 .00
Young Alumni .302 .00
The correlation between the engagement score and FY10 donor status is
stronger in all three population groups than the correlation between the engagement
score and donor status.
Cornerstone Community. Valley University created a recognition society called
the “Cornerstone Community” to honor donors who make gifts every year. Specifically,
the Cornerstone Community is a group of donors who have made gifts in all three of the
past three fiscal years. For this data set, Cornerstone Community members have (as of
January 1, 2011), made gifts in FY11, FY10, and FY09. Table 17 shows the correlation
coefficient and significance for the correlation between the engagement score and
membership in the Cornerstone Community for each population group.

54
Table 17
Correlation between engagement score and Cornerstone Community membership for
each population group
Population ρ p
All Alumni .153 .00
Mature Alumni .181 .00
Young Alumni .185 .00
The correlation between engagement score and current Cornerstone Community status
is strongest for young alumni (r = .185; p = .00), less strong for mature alumni (r = .181;
p = .00), and weakest for the alumni population as a whole (r = .153; p = .00). The
correlation between engagement score and current cornerstone status for FY11 is
statistically significant in all three population groups, but very weak and not meaningful.
Cornerstone Renewals are defined as individuals with giving in FY10, FY09, and
FY08, but no giving yet in FY11 (as of the date of reporting). Cornerstone Potentials are
defined as individuals with giving in FY10 and FY09, but no giving yet in FY11 (also as the
date of reporting). Table 18 shows the correlation coefficient and significance for the
correlation between the engagement score and membership in the Cornerstone
Renewals group as well as membership in the Cornerstone Potentials group, for each
population group.

55
Table 18 Correlation between the engagement score and Cornerstone Renewals and Potentials Memberships for each population group
Population Cornerstone Renewals Cornerstone Potentials
Ρ p ρ p
All Alumni .177 .00 .069 .00
Mature Alumni .193 .00 .063 .00
Young Alumni .190 .00 .076 .00
The correlation between the engagement scores and individuals who were members of
the Cornerstone Community last year (r = .193 for mature alumni, r = .190 for young
alumni, and r= .177 for all alumni; in each case p = .00) is the strongest among the
Cornerstone Community variables, but it is still weak and not meaningful.
RFM Score. The Recency, Frequency, Monetary (RFM) score is another common
way that fund raisers describe donor behavior. Individuals with no RFM score have not
made a gift in the past 15 fiscal years. Individuals with a low score have made at least
one gift, but are not frequent, recent, or large donors. Individuals with higher scores are
more frequent, more recent, and larger donors. The score, which ranges from 0‐15, is
useful for segmenting a donor population for the purposes of program planning and
research. Fund raising practice begins with securing the first gift from a donor (i.e.
donor vs. non‐donor status). However, without recent, frequent, and larger gifts, the

56
return on investment of a fund raising program would be quite low. Table 19 shows the
correlation coefficient and the significance for the correlation between the engagement
score and the RFM score, as well as for the correlation between the engagement score
and each element of the RFM score (the R score, the F score, and the M score).
Table 19 Correlation between the engagement score and the RFM Score, the R Score, the F Score, and the M Score for each population group
Population RFM Score R Score F Score M Score
ρ p ρ p ρ p ρ p
All Alumni .367 .00 .358 .00 .312 .00 .334 .00
Mature Alumni .454 .00 .400 .00 .417 .00 .437 .00
Young Alumni .366 .00 .370 .00 .321 .00 .287 .00
For the whole alumni population, the total RFM score has a stronger correlation
(r= .367; p = .00) to the engagement score than any of the individual scores (R, F, or M),
but not dramatically. This trend is also true for the mature alumni population, but not
for the young alumni population, where the correlation between the engagement score
and the R score is strongest of the four correlations (r = .370; p = .00). When only the
individual elements of the RFM score are considered for the whole alumni population,
the Recency score (r = .350; p = .00) has the strongest correlation to the engagement
score, then the Monetary score (r = .334; p = .00), and then the Frequency score (r =

57
.312; p = .00). The reader is referred to Table Fourteen for the correlations coefficients
for each group.
Bequest Society. Members of the Valley University Bequest Society are alumni
who have made provisions for charitable donations to Valley University in their estate
plans and have documented these provisions with the University. There is a very weak
positive correlation between the alumni engagement score and bequest society
membership (r= .105, p = .00). Table 20 shows the correlation coefficient and
significance for the correlation between the engagement score and bequest society
membership in all three population groups.
Table 20 Correlation between engagement score and bequest society membership in all three population groups
Giving and Generations. In general, the positive correlation between the engagement
score and the two basic giving variables (donor status and FY10 donor status) becomes
stronger as the younger generations are considered. This trend begins to reverse for
Population ρ p
All Alumni .105 .00
Mature Alumni .138 .00
Young Alumni .022 .01

58
the youngest, the Millennial Generation. Table 21 provides the correlation coefficient
and significance between the engagement score and donor status and FY10 donor
status for all alumni and alumni by generation.
Table 21 Correlation between engagement score and donor status and FY10 donor status across generations
Population Donor Status FY10 Donor
ρ p ρ p
All Alumni .200 .00 .302 .00
Greatest Generation .208 .00 .226 .00
Silent Generation .233 .00 .374 .00
Baby Boom Generation .274 .00 .386 .00
Generation X .311 .00 .328 .00
Millennial Generation .311 .00 .249 .00
Table 22 summarizes the correlations between the Engagement Score and the
RFM score, the R score, the F, score and the M score for the entire alumni population
and the generational cohorts. Of these relationships, the correlation between the
engagement score and the M score for the greatest generation is the strongest (r= .607,
p = .00).

59
Table 22 The correlation and correlation significance between engagement score and the R Score, F Score, and M Score for across generations
Population RFM Score R Score F Score M Score
ρ p ρ p ρ p ρ p
All Alumni .367 .00 .358 .00 .312 .00 .334 .00
Greatest Generation .480 .00 .354 .00 .399 .00 .607 .00
Silent Generation .512 .00 .443 .00 .474 .00 .539 .00
Baby Boom
Generation .498 .00 .445 .00 .463 .00 .463 .00
Generation X .438 .00 .433 .00 .403 .00 .360 .00
Millennial Generation .343 .00 .327 .00 .354 .00 .304 .00
For the older generations (the Greatest Generation and the Silent Generation), the
strongest correlation is with the M Score. For the middle generations (the Baby Boom
Generation and Generation X) the strongest correlation is with the overall RFM score.
For the youngest generation (the Millennial Generation), the strongest correlation is
with the F score (r = .354; p = .00)

60
Chapter Five
Discussion
Fund raisers and administrators in higher education make a many assumptions
about alumni, their cohorts, and their behaviors. These assumptions, based on
professional intuition and anecdotal evidence, are useful because they help
professionals to define and understand target audiences for engagement and
solicitation activity. The desire to group alumni to better understand, and possibly
predict, their behavior is natural for professionals who need to design programs which
resonate with thousands, and in some cases hundreds of thousands, of alumni.
Professional intuition about alumni and their wants and needs has been the primary
driver of program development at Valley University since the advancement program
there began. For decades, professional intuition has helped colleges and universities
gradually, and sometimes dramatically, increase their fund raising revenues. It is just
this kind of intuition; however, that may keep university advancement offices from
competing with far more sophisticated national and international charities which are
now building far more sophisticated and well‐informed membership and development
enterprises.
Higher education gifting has never experienced as competitive a philanthropic
environment as it does today. Once the leaders in non‐profit fund raising, academic
fund raising programs are being challenged, and in many cases surpassed, by national
and international non‐profit organizations, hospitals, and community foundations. As

61
the vice president of advancement at Valley University says, professional intuition is not
enough when “some other charity is sitting in your donor’s office today.” While the
technology to store and study constituent data has existed for some time, the
increasingly competitive philanthropic environment has created a demand for a more
analytical approach to the administration of a fund raising program.
The struggling economy has resulted in the tightest higher education budgets,
especially among private schools, for decades. This, in combination with the growing
availability of data and a new interest in data mining and analysis, has resulted in peak
interest in research on constituents’ behaviors from social science researchers and
advancement professionals alike.
Research Question One
Are there statistically significant and practically meaningful differences between
Valley alumni who are highly engaged and alumni who are not engaged?
One of the primary benefits of a study like this one is that a simple, but
important, re‐calibration of the constituency profile can occur. When asked to discuss
their instincts about the outcomes of the research in this study, Valley University alumni
relations professionals unanimously predicted that there would be significant
differences in the engagement levels of alumni based on the categorical variables
studied. Contrary to the intuition of the Valley University alumni relations professionals,
however, this research demonstrated that there is no statistical or meaningful
difference in alumni engagement scores for all but one of the categorical variables

62
studied. With the exception of generation, there were no differences in mean
engagement scores for men vs. women, Greek alumni vs. independents, varsity athlete
alumni vs. non‐athletes, graduates of the college of engineering vs. the college of arts
and sciences, or graduates with BS degrees vs. BA degrees. While this was clearly
counterintuitive for these alumni officers, it is not that surprising when individual alumni
are considered.
Any experienced alumni relationship manager will tell you that each alumnus has
a unique story about his or her connection to alma mater. Some alumni will certainly
cite a coach who pushed them or a friend who became a spouse. Just as many alumni,
however, will recall a professor who kept them from dropping out or a leadership
experience in a small student organization was the key to their “Valley experience.”
That professor is long retired and that club may not even exist today, but for that
alumnus these connections had the power to transform the undergraduate experience
and to create a foundation for engagement as an alumnus.
Historical data on professor‐student relationships and co‐curricular club
membership is difficult, if not impossible, to come by. Even when it is available, when
40,000 records are considered it can be difficult to find trends, or to identify cohorts to
consider in an attempt to make meaning out of an overwhelming amount of data. As a
result, advancement professionals often use obvious groups to segment the alumni
population into manageable subgroups; they can be guilty of making assumptions about
these groups (all men, all athletes, all engineers, etc.) because no data is available to

63
prevent them from doing so. This finding, however, suggests that advancement
professionals should avoid making assumptions about groups and their behaviors or
they risk making resource investments which are unnecessary at best, and
counterproductive at worst. This finding also suggests that collecting and studying even
the most basic categorical variables on constituents can have tremendous value.
While this study explored the categorical variables of gender, college of
graduation, degree type, generation, and two co‐curricular activities (Greek
organizations and athletics), earlier research identified links between additional
variables and giving, suggesting that more analysis of the potential link between these
variables and engagement could be instructive. An investigation of alumni engagement
and overall student engagement, distance of residence from alma mater, receipt of
financial aid as an undergraduate (in grants and/or loans), ethnicity, religion, and/or the
pursuit of an advanced degree could provide additional opportunities to either dispel
myths or confirm suspected truths.
In addition, further exploration of whether (and if so, how) engagement differs
among populations when multiple categorical variables are considered could be very
useful for planning, and even possibly, predictive purposes. While this research answers
the question of whether men are more engaged than women (or visa versa), it does not
answer questions about whether male athletes are more engaged than female athletes,
whether male Greek organization members who are also athletes and received financial
aid are more or less engaged than their female counterparts and so on. Truly, a variable

64
list of this size and a data set this large can provide years of interesting questions to
pursue.
Research Question Two
Is there a relationship between Valley alumni engagement and their giving
behavior, and if so, what kind of relationship?
Advancement professionals know that engagement leads to giving because their
professional experience and intuition tells them it is true. College and university
presidents and finance directors know this too, or alumni offices and programs would
not exist. The premise of this study, however, is that intuition cannot always be trusted.
While the need for professional intuition in a relationship business will never go away, it
is important for advancement professionals, and the universities that fund advancement
programs, to make information based programmatic decisions. As alumni demand for
services increases at a faster pace, sometimes more often than alumni gifts in number
or dollars, it becomes harder and harder to justify the investment in alumni
programming when budgets are tight and board members are nervous about the
economy.
Research consistently shows that the student experience is the single largest
predictor of alumni giving. But advancement offices have little power to affect the
student experience in significant ways. Research has demonstrated links between
alumni engagement and giving behavior as well, but extant studies rely on self‐reported
information gathered via surveys, which is problematic due to limited response rates

65
and response biases. In addition, the literature does not include studies which have
been reproduced at multiple institutions or studies which include data from multiple
universities in their samples. As such, it has become increasingly important for
professionals in educational advancement to study the impact of engagement activities
on giving behavior at their own institutions.
This study demonstrated that, at least for Valley University alumni, alumni
engagement is positively correlated to giving behavior. Specifically, engagement is
correlated to donor status, recent donor status (previous fiscal year), a donor’s gift
recency, gift frequency, and adjusted lifetime giving, as well as a constituent’s
membership in repeat giving societies and bequest societies.
The correlation between alumni engagement and two types of giving behavior is
particularly important: universities need alumni who will both make regular gifts of any
size (high RFM scores) and alumni who will make larger gifts (high adjusted lifetime
giving). First, universities need annual donations, small and large, to support
operations. At Valley, the ideal annual donor is described with the RFM score and the
RFM score is positively correlated to giving. In fact, when alumni are divided into four
quartiles of engagement levels (none, low, medium, and high), there is a significant
difference between the mean RFM scores for each group and, as one might expect, the
mean RFM scores go up as engagement increases.
To place the alumni population in cohorts for use by practitioners, the
population was divided into quartiles by engagement score. The bottom quartile (with

66
engagement scores ranging from 0 to 4) has been named the no‐engagement cohort.
The middle two quartiles (with engagement scores ranging from 5 to 6, and 7 to 8) have
been named the low engagement cohort and the medium engagement cohort. The top
quartile (with engagement scores ranging from 9 to 13) has been named the high
engagement cohort. Figure 1 shows the mean RFM score among the four engagement
cohorts.
Figure 1. RFM Score across engagement cohorts.
Second, universities need individuals who will make their alma mater a
philanthropic priority to support institutional stability and expansion (endowment and
capital gifts). Over a lifetime, alumni may give regularly in small amounts, but they will,
hopefully, also give occasional significant gifts to support programs and projects in
which they believe. Understanding how engagement impacts an institution is not just

67
about one fiscal year or the annual fund; it is also about understanding the lifetime
value of an alumnus, or in fact, of the whole alumni body.
This research showed that there is a significant positive statistical correlation
between alumni engagement and lifetime giving. When lifetime giving is adjusted for
years since graduation, this levels the playing field between younger and older alumni.
And while the difference between the first three levels of engagement (none, low, and
medium) is not significant, the difference between all three of the lower levels and the
highest level of engagement is significant. Figure 2 shows the mean adjusted lifetime
giving by engagement score cohort.
Figure 2. Mean adjusted lifetime giving by engagement score cohort.
This finding confirms the practitioner’s institution and may allay university
trustees concerns about the return on investment in alumni programming. While this
research does not suggest causality, it is clear that the most engaged constituents are

68
also the constituents who have supported Valley with the most substantial monetary
contributions. More research is, perhaps, warranted to determine which elements of
engagement mean most to potential donors.
Study Limitations
Engagement Score Development. There were some limitations in the
development of the engagement score. First, the data used for the policy capturing
exercises and the subsequent development of the score was incomplete. Event
attendance data was limited before 1995. In addition, data on alumni interaction with
their online community became available only after the policy capturing rating exercise
occurred. While these gaps in data did not prevent the engagement score from being
useful to Valley University practitioners, the gaps do limit the accuracy of the scores as
they are applied to the alumni body for the study. Second, the university staff and
consultants who developed the engagement score utilized somewhat lenient standards
for intra‐rater reliability during the policy capturing process, rejecting only those raters
with an intra‐rater correlation below .40. It is possible that a higher standard during this
stage of the process may have yielded a stronger engagement score.
Finally, the type of volunteer activity was not considered during the
development of the score. With the current engagement score formula, two alumni
with three volunteer roles each (and all other data being equal) would receive the same
engagement score, even if one was a board chair, a campus speaker, and an event host
while the other had interviewed one student for admissions, offered to serve as a career

69
mentor, and been a class notes editor thirty years ago. While it is possible that the
volunteer variables used (number of volunteer roles, most recent year of volunteering)
were sufficient, a weighted analysis of volunteer roles prior to the policy capturing
exercise may have further informed the development of the score.
Data Quality. Data quality is always a limitation in research when alumni
records are concerned. First, access to electronic records for the lifetime of currently
living alumni is unheard of. Valley University implemented its first data base (Fund
Raising Information System, or FRIS) in the late 1980s. The primary focus of data
gathering and maintenance at this time was contact information (correct addresses and
phone numbers) and giving information. When the Valley University advancement
office converted to the Benefactor database in 1995, more attention was paid to
gathering volunteer information, event information for reunion and significant off‐
campus events, and historical information for some volunteer roles, which was entered
on all living graduates. It wasn’t until 2005, however, when Banner Advancement was
implemented at Valley, that the collection of event data became a priority. While the
data set for this study was large and well populated in comparison with data sets from
similar institutions, these data limitations still have an impact on this study.
Second, several conditions of the data gathering process may have limiting
effects on data accuracy. Until very recently (with the onset of online event
registration), event attendance at Valley has been captured using sign‐in sheets at event
registration tables. The rush of attendees at a registration table and the importance of

70
providing a personal experience rather than a clinical one create many scenarios where
event attendee lists are considered to be “mostly accurate” by the employees working
the event. In some cases, name tags are used to determine who attended but the
possibility that some attendees did not register in advance and still others did not
collect their name tags leaves room for errors. Second, until recently student activity
information was gathered from yearbooks rather than administrative records.
Historically students have been able to select what activities were listed in year books
and so this information can be less than precise. More recently a senior‐class survey has
been used to capture student activities but this data‐capturing technique still relies on
self‐reported information. Valley University is currently discussing the implementation
of a co‐curricular transcript, which would dramatically improve records on student
activities. However, the data set for this research is limited by these data‐capturing
techniques.
Generalizability. A final, but important, limitation to this study is its lack of
generalizability. As is so often the case in higher education philanthropy research, this
study utilized data from one university. While the population was large, it is impossible
to generalize the results of this study to other colleges and universities. Because the
study uses data that many institutions will already have, however, a duplication of this
study would be fairly simple to implement and unlikely to cost a great deal in terms of
human or capital resources. Ideally, future research would include a similar analysis

71
with data from multiple institutions, including institutions with a variety of profiles
(private, public, large, small, etc.).
Implications for Future Research
When this research is considered in the context of the discipline, it provides
several new ways of thinking about alumni engagement. First, the policy capturing
technique provides a map for other institutions to use when developing new scores of
alumni behaviors. Second, the research was based on a score built from data which was
available for all living alumni at Valley University, eliminating limited response rates and
survey bias and facilitating the reproduction of this research at other institutions with
limited investment. Third, unlike engagement scores at other institution, the Valley
engagement score purposefully didn’t include giving variables which enabled the
analysis of the correlation between engagement and giving behaviors.
The Valley University data set now available for study is significant and could be
explored extensively. While this study explored some alumni characteristics (such as age
and gender), there are many more to consider, including ethnicity, state of residence,
GPA, Presidency during undergraduate years, housing type, marital status, etc. Any trait
that a university may gather on its constituents could be studied as it relates to alumni
engagement. In addition, a more refined exploration of characteristics and elements of
engagement could reveal interesting information. While the engagement levels of
males and females overall were not different, are women more likely than men to
attend events while men are more likely than women to volunteer to mentor? Are

72
younger alumni more likely to engage electronically with Valley than older alumni? An
almost endless amount of assumptions practitioners continue to make could be tested
with this approach.
In addition, the relationship between engagement and giving could be explored
in much greater depth. Are some types of engagement opportunities more strongly
correlated to giving behavior, or is some combination of engagement opportunities the
most effective for building a donor population? When evaluating donors with a similar
capacity to give (a known level of wealth), how does engagement correlate to giving?
Perhaps the most popular use of this kind of research is to conduct a multiple regression
analysis to develop a predictive model. A model which could identify individuals who
are most likely to be donors can help advancement practitioners to focus resources and
develop programs.
The next investigation recommended by this researcher, however, is a study of
student engagement data (available through the National Survey of Student
Engagement, NSSE) in combination with this data. Since the literature clearly shows
that student engagement is a significant factor in alumni engagement and giving, it
would be useful to Valley University to append its own NSSE data to the alumni data file
compiled here. While it would only be available for fairly recent graduating classes, an
exploratory study of this combined data set could provide tremendous insights into
philanthropic education and programming for current and recent students.

73
Conclusion
Every dollar an organization spends raising money is a dollar that could be used
to serve that organization’s mission. Ideally, donors are ready and willing to give to
charities in which they believe so the cost of raising funds should be low. The reality
however, is that organizations often spend significant resources on the fund raising
enterprise. Even when organizations carefully monitor the cost per dollar raised, once
institutional activities which support fund raising but are not exactly fund raising (such
as communications, or alumni relations) are considered, evaluating the return on
investment in programming can become extremely complex or impossible. After
conducting the most comprehensive reviews of the research in educational
philanthropy, Brittingham and Pezzullo (1990) remind practitioners and researchers
alike: “increased spending is not the same as wisely increased spending and little
research is available for guidance on how to spend well.” While Valley University has
much data which remains to be studied, this research provides Valley University
practitioners with a much needed tool to help Valley administrators understand alumni
engagement and its relationship to fund raising outcomes.
Fund raising is, and always will be, a relationship business. For decades, alumni
relations practitioners relied on that assumption and alumni demand for services to
justify their expanding programs. But as constituencies grow in size and staff sizes do
not expand in synch, organizations must prioritize relationship building activity and
focus on that which is most likely to yield results. Twenty‐first century donors demand

74
accountability and efficiency from the charities they support, and as such, organizations
must design their advancement programs as strategically as possible.
The good news for practitioners at Valley University is that alumni engagement is
clearly linked to alumni giving. This information helps alumni leadership support their
case for human resources and budget dollars. This information also, however, provides
a foundation for more critical analysis of how resources are invested and provides a
much‐needed tool for institutional leadership to evaluate effectiveness across the entire
advancement spectrum. The more alumni relations professionals embrace the metric
of engagement as a meaningful tool and not just a measure applied by outsiders, the
more they can create, expand, or eliminate programs according to the institutions
needs.

75
Appendices
Appendix A: Sample Policy Capturing Profile
A+ A A‐ B+ B B‐ C+ C C‐ D+ D D‐ F
Class Year1993 North East, MD ID: 10301912 Cultivation Campus Visit, most recent: Personal Visit, most recent: Total contacts: Career Sponsorship & Activity Affinity Group Member? Internship/Externship Sponsor? Volunteer Activity Current: Former: Bison Gathering Host Bucknell Club Committee CDC Bison Connect CDC Education Progra Class Committee Member Engineering Career Development Engineering College Volunteer Potential Engineering Volunteer Reunion Program 15th Year Years of Volunteering:
1/10/2008 17 No Yes None 11
Event Attendance Reunions Attended Most Recent Reunion Travel Program Participant? Event Attendance List 01 Alum Assoc. Bd. Mt. 03 Alum Assoc. Bd. Mt. 08 Reunion 09 Reunion 10 CDC Externship Sponsor Baltimore Dinner 99 Baltimore Pres. Reception Career Networking 2007 Christy Mathewson Cmte. Reunion 2003 Bucknell Family Bucknell spouse/partner? Parents who are BU? Children who are BU? Number of BU Family, Total Online Alumni Community Registered? Willing to mentor? Information Sharing Provided business phone Provided job title? Provided employer name? Can we mail? Can we e‐mail? Can we call?
3 2009 No Yes No No 1 Yes Yes Yes Yes Yes Yes Yes No

76
Appendix B: Inter‐rater reliability analysis
Rater r
1 0.913 2 0.761 3 0.866 4 0.879 5 0.640 6 0.593 7 0.827 8 0.836 9 0.877 10 0.590 11 0.701 12 0.879 13 0.422 14 0.666 15 0.826 16 0.276 17 0.825 18 0.721 19 0.764 20 0.598 21 0.830 22 0.846 23 0.844 24 0.814

77
Appendix C: Preliminary Engagement Score Formula
Preliminary Engagement Score = ‐48.8621 + 0.020392(Class Year) + 0.286144 (Years of
Volunteerism) ‐ 0.027223(Number of BU Relatives) + 0.101067( Total # of Contacts) ‐
1.27237( Reunion Attendance Count) + 0.636134(BUSpouse is Y) + 0.57730( BU Parent is
Y) + 0.417938(E‐mailable is Y) + 0.449451(BusPhone is Y) + 0.730474(Solicit is Y) +
1.08138(Internship is Y) + 0.621475(Reg in BLink is Y) ‐ 0.248253( Willing to Mentor is Y)
+ 0.094949(Most Recent Reunion Attended Revised) ‐ 178.413( Most Recent Reunion
Attended Present) ‐ 2.82007(Most Recent Campus Visit Present) + 0.230621 (Non BU
Child is Y) + 2.11409(Affinity Group is Y) + 0.167151( Events Count) ‐ 0.325073(Activities
Count)

78
Appendix D: Final Engagement Score Formula
Final Engagement Score = ‐48.8621 + 0.020392(Class Year) + 0.286144 (Years of
Volunteerism) ‐ 0.027223(Number of BU Relatives) + 0.101067( Total # of Contacts) ‐
1.27237( Reunion Attendance Count) + 0.636134(BUSpouse is Y) + 0.57730( BU Parent is
Y) + 0.417938(E‐mailable is Y) + 0.449451(BusPhone is Y) + 0.730474(Solicit is Y) +
1.08138(Internship is Y) + 0.621475(Reg in BLink is Y) ‐ 0.248253( Willing to Mentor is Y)
+ 0.094949(Most Recent Reunion Attended Revised) ‐ 178.413( Most Recent Reunion
Attended Present) ‐ 2.82007(Most Recent Campus Visit Present) + 0.230621 (Non BU
Child is Y) + 2.11409(Affinity Group is Y) + 0.167151( Events Count) ‐ 0.325073(Activities
Count) +2.47682 + 0.011887(Frequency of Login) ‐ 0.00035536(Reg Date in Days) +
0.00010245(Last Login in Days) ‐ 4.00120(Last Login Present) + 14.6156(Registration
Date Present) ‐ 272.903(Latest Yr Volunteering Present) ‐ 182.488(Latest Yr Event
Attended Present) + 0.136867(Latest Yr Volunteering Revised) + 0.091583(Latest Yr
Event Attended Revised)

79
Appendix E: The Valley Recency, Frequency, Monetary (RFM) Score
The RFM score is a numerical representation of the past 15 fiscal years of a constituent's
giving history. Gifts and pledge payments are considered, and the score is based on a
formula (below) which allocates points for (a) how recently someone has given, (b) how
frequently someone gives, and (c) how much someone gives. The score is calculated at
the end of each fiscal year and updated in each constituent record. Scores can be
utilized in parts (the frequency score alone, for example) or in sum.
Recency
If the constituent's most recent gift/pledge payment was in fiscal year X, then he/she gets Y points.
X Y
2010 5
2009 4
2007‐2008 3
1992‐2006 2
1996‐1991 1
1995 or Prior, or No Giving 0

80
Frequency
If the constituent has made a gift/pledge payment in X out of 15 years, then he/she gets Y points.
X Y
14‐15 years 5
11‐13 years 4
5‐10 years 3
2‐4 years 2
1 year 1
0 years 0
Monetary
If the constituent has at least one year of giving (including gifts and pledge payments) at the X level in the past 15 years then he/she gets Y points.
X Y
$2,500+ 5
$1,000‐$2,499 4
$500‐$999 3
$100‐$499 2
$1‐$99 1
0 0

81
References
Baldwin, K. M. (2008). How reciprocity influences alumni giving: A qualitative study
(unpublished doctoral dissertation). University of Alabama, Tuscaloosa, AL
Boney, R. (2008, September). Corporate donors adjust to economic slump. Philanthropy
Journal. Retrieved from http://www.philanthropyjournal.org/
Brant, K. E., & and Regan, P. J. (2002, February). The spectrum of alumni involvement.
CASE Currents, 28(2), 22‐28.
Bristol, R. B., Jr. (1990). The life cycle of alumni donations. The Review of Higher
Education, 13(4), pp. 503‐517.
Bristol, R. J. (1991‐1992). How much will alumni give in the future? Planning for Higher
Education, 20(2), pp. 1‐12.
Brittingham, B.E. and Pezzullo, T. R. (1990). The campus green: Fund raising in higher
education ASHE‐ERIC higher education report no. 1. (pp. 503‐518). Washington DC:
The George Washington University School of Education and Human Development.
Clotfelter, C. T. (2001). Who are the alumni donors: Giving by two generations of alumni
from selective colleges. Nonprofit Management and Leadership, 12(2), pp. 119‐138.

82
Clotfelter, C. T. (2003). Alumni giving to elite private colleges and universities. Economics
of Education Review, 22, pp. 109‐120.
Conner, D. K. (2005). Factors that affect alumni giving at a southeastern comprehensive
university (unpublished doctoral dissertation). Clemson University, Clemson, SC.
Drezner, N. D. (2009). Why give? exploring social exchange and organizational
identification theories in the promotion of philanthropic behaviors of african‐
american millenials at private HBUCs. International Journal of Educational
Advancement, 9(3), pp. 147‐165.
Gaier, S. (2005). Alumni satisfaction with their undergraduate experience and the
impact on alumni giving and participation. International Journal of Educational
Advancement, 5(4), pp. 278‐288.
Gallo, P. J., & Hubschman, B. (2003, April). The relationships between alumni
participation and motivation on financial giving. Paper presented at the Annual
Meeting of the American Educational Research Association, Chicago, IL.
Giving USA Foundation, 2010 Executive Summary (2010). Giving USA 2010: The Annual
Report on Philanthropy for the Year 2009. Retrieved from
http://www.givingusa.org

83
Grant, J.H. and Lindauer, D.L. (1986). The economics of charity life‐cycle patterns of
alumni contributions. Eastern Economic Journal, 12(2), pp. 129‐141.
Harrison, W. B. (1995). College relations and fund raising expenditures: Influencing the
probability of alumni giving to higher education. Economics of Education Review,
14(1), 73‐84.
Harrison, W. B., Mitchell, S. K., & and Peterson, S. P. (1995).
Alumni donations and colleges' development expenditures: Does spending matter?
The American Journal of Economics and Sociology, 54, pp. 397‐412.
Heckman, R., & Guskey, A. (1998). The relationship between alumni and university:
Toward a theory of discretionary collaborative behavior. Journal of Marketing
Theory and Practice, 6(2), pp. 97‐112.
Holmes, J. (2009). Prestige, charitable deductions and other determinants of alumni
giving: Evidence from a highly selective liberal arts college. Economics of Education
Review, 28(1), pp. 18‐28.
Hoyt, J. E. (2004). Understanding alumni giving: Theory and predictors of donor status.
Unpublished manuscript.
Hueston, F. R. (1992). Predicting alumni giving: A donor analysis test. Fund Raising
Management, 23(5), pp. 18‐22.

84
Hunter, C. S. (1997). A study of the relationships between alumni giving and selected
characteristics of alumni donors of Livingstone College (unpublished doctoral
dissertation). Fayetteville State University, Fayetteville, NC
Hunter, C. S., Jones, E. B., & and Boger, C. (1999). A study of the relationship between
alumni giving and selected characteristics of alumni donors of livingston college,
NC. Journal of Black Studies, 29(4), pp. 523‐539.
James, R. N. (2008). Distinctive characteristics of educational donors. International
Journal of Educational Advancement, 8(1), pp. 3‐10.
Kline, T. J. B., & Sulsky, L. M. (1995). A policy capturing approach to individual decision
making: A demonstration using professors' judgements of the acceptability of
psychology graduate school applicants. Canadian Journal of Behavioural Science,
27(4), pp. 393‐404.
Leslie, L. L., & Ramey, G. (1988). Donor behavior and voluntary support for higher
education institutions. The Journal of Higher Education, 59(2), pp. 115‐132.
Mann, T. (2007). College fund raising using theoretical perspectives to understand donor
motives. International Journal of Educational Advancement, 7(1), pp. 35‐45.

85
McAlexander, J. H., & Koenig, H. F. (2001). University experiences, the student‐college
relationship, and alumni support. Journal of Marketing for Higher Education, 10(3),
pp. 21‐43.
McDearmon, J. T., & Shirley, K. (2009). Characteristics and institutional factors related to
young alumni donors and non‐donors. International Journal of Educational
Advancement, 9(2), pp. 83‐95.
Minniear, C. R. (2006). Donor motivations in higher education: The impact of incentives,
involvement and opportunity on alumni giving (unpublished doctoral dissertation).
University of Louisville, Louisville, KY
Monks, J. (2003). Patterns of giving to one's alma mater among young graduates from
selective institutions. Economics of Education Review, 22
Netzer, O., Lattin, J. M., & and Srinivasan, V. (2008). A hidden markov model of
customer relationship dynamics. Marketing Science, 27(2), pp. 121‐130.
Pearson, J. (1999). Comprehensive research on alumni relationships: Four years of
market research at Stanford University. New Directions for Institutional Research,
26(1), pp. 5‐25.

86
Schmidt, J. C. (2001). Mining philanthropic data: Models for predicting alumni//US giving
at a medium‐sized public master's university (unpublished doctoral dissertation),
University of Minnesota, Minneapolis, MN
Shim, J. M. (2001). Relationship of selected alumnae characteristics to alumnae financial
support at a women's college (unpublished doctoral dissertation), University of
Florida, Gainesville, FL
Sun, X., Hoffman, S. C., & and Grady, M. L. (2007). A multivariate causal model of alumni
giving: Implications for alumni fundraisers. International Journal of Educational
Advancement, 7(4), pp. 307‐332.
Taylor, Alton L. and Martin, Joseph C. Jr. (1995). Characteristics of alumni donors and
nondonors at a research I, public university. Research in Higher Education, 36(3),
pp. 283‐302.
Tom, G., & Elmer, L. (1994). Alumni willingness to give and contribution behavior.
Journal of Services Marketing, 8(2), pp. 57‐62.
Walton, A., Gassman, M., & Legemann, E. C. (2008). Philanthropy, volunteerism &
fundraising in higher education. Boston, MA: Pearson Custom Publishing.

87
Wannuva, P. V., & Lauze, M. A. (2001). Alumni giving at a small liberal arts college:
Evidence from consistent and occasional donors. Economics of Education Review,
20, pp. 533‐543.
Wastyn, M. L. (2009). Why alumni don't give: A qualitative study of what motivates non‐
donors to higher education. International Journal of Educational Advancement,
9(2), pp. 96‐108.
Weerts, D. J. (2007). Toward an engagement model of institutional advancement at
public colleges and universities. International Journal of Educational Advancement,
7(2), pp. 79 ‐103.
Weerts, D. J., & and Ronca, J. M. Profiles of supportive alumni: Donors, volunteers, and
those who "do it all". International Journal of Educational Advancement, 7(3), pp.
20‐34.
Weerts, D. J., & and Ronca, J. M. (2009). Using classification trees to predict alumni
giving for higher education. Education Economics, 17(1), pp. 95‐122