Embed Size (px)
Citation preview

The International Journal of Indian Psychology ISSN 2348-5396 (e) | ISSN: 2349-3429 (p) Volume 4, Issue 1, No. 77, DIP: 18.01.068/20160401 ISBN: 978-1-365-51571-2 http://www.ijip.in | October-December, 2016
© 2016 R Parmar, S Makvana; licensee IJIP. This is an Open Access Research distributed under the terms of the Creative Commons Attribution License (http://creativecommons.org/licenses/by/2.0), which permits unrestricted use, distribution, and reproduction in any Medium, provided the original work is properly cited.
A Study of Adjustment, Life Style and Life Satisfaction of Educated
Unemployed Youth
Mr. Rajendrakumar Muljibhai Parmar1*, Prof. Suresh M. Makvana2
ABSTRACT The main aim of the present study is to find out difference in level of adjustment, life style and life satisfaction of educated unemployed people. Second purpose is to find out difference in level of adjustment, life style and life satisfaction of with male and female people. Third aim is to find out difference in level of adjustment, life style and life satisfaction among rural and urban people. Forth intended is to find out difference in level of adjustment, life style and life satisfaction among different ages of people. Fifth purpose is to find out difference in level of adjustment, life style and life satisfaction of with its interaction effect on male and female, rural and urban and different ages of people. The sample for the study comprised of 480 randomly selected out of 500 samples. The Adjustment Neurotism Dimensional Inventory, The questionnaire developed by R N Singh and Mahesh Bhargava. This inventory consists 105 items in three response alternatives and measures seven dimensions—Self-Esteem-Self Inferiority, Happiness-Depression, calmness-anxiety, neutrality obsessiveness, independence-dependence, feeling of being healthy-hypochondria sis, innocence-guilt feeling. It can be used on both the sexes from age group 17 to 60 years. Norms are available in form of Mean & S.D. and Stenine Norms and life satisfaction questionnaire developed by Q G Alam& R Shrivastva. It contains 69 Yes/No type items which yield a total score covering six areas — health, personal, economic, marital, social and job, Standardized on 875 adults aging between 18 to 40 years. Life Style Scale developed by S. K. Bawa and S. Kaur, the scale consists 60 items into 6 Dimension like Health Conscious Life Style, Academic Oriented Life Style, Career Oriented Life Style, Socially Oriented Life Style, Trend Seeking Life Style, and Family Oriented Life Style. Data analysis of questionnaire and demographic details were subjected through SPSS for t test, Interaction Effect and Correlation.
Keywords: Educated Unemployed Youth, Adjustment, Life Style and Life Satisfaction
1 PhD Scholar, Department of Psychology, Sardar Patel University, Vallabh Vidya Nagar, Anand, India 2 Professor and Head, Department of Psychology, Sardar Patel University, Vallabh Vidya Nagar, Anand, India *Responding Author

A Study of Adjustment, Life Style and Life Satisfaction of Educated Unemployed Youth
© The International Journal of Indian Psychology, ISSN 2348-5396 (e)| ISSN: 2349-3429 (p) | 57
Mani is Unique and Excellence Creation of Nature. Nature has Gifted Intelligent, Thinking and Feeling to Mankind. If the Intimation between Nature and Mankind, Most of Today’s Problems Become Light but Unfortunately Today’s Man is Constantly Going Away From the Nature. The Reason being the Constantly Increasing Needs and Confecting attempt to fulfill these Needs; Every Men in the Presents Competitive age is involved in the Ambition to get more and more than others. Consequently the incomplete expectation cause to mental problems, beside the most important matter is the striking desire to make adjustment with environment, the perfect adjustment with environment indicators the height of happiness. To make life meaningful, the individual has to make constant attempt to make in every field of life and in every stage of life. In making continuous attempt to adjust in the constantly changing environment, the individual has changed him or herself, after change in his or her environment. Adjusted persona possessed balanced personality and good mental health and then they feel satisfied with life. There have been several studies in past that have paid attention on unemployment in various concepts and in various perspectives in abroad and in India but researchers laid vary little focus on psychological perspectives of unemployment. The fundamental assumption is that, there are unemployed people facing psychological problems like adjustment, life style, and decrease life satisfaction level of unemployed people. Now, capacity to tolerate these psychological problems from person to person is vary but till they have to face them because they are unemployed. Here, in this research main focus given to age and gender and location of Gujarat state’s some cities. Unemployment Almost every day we read in newspapers about Youth/farmers committing suicide due to a high level of indebtedness, lack of job/farm and unemployment. There was a very touching story about a young man who lost his job due to the global meltdown. He did not have the heart to tell his family, friends or neighbours about the sad development. He would therefore, leave his home every day at the normal time in the morning with his brief case, spend the day in a garden and return in the evening. There are an increasing number of young patients visiting psychiatrists for clinical depression caused by unemployment. In recent times, many college graduates have volunteered to work absolutely free in private companies. Their objective, in an absence of a paying job, it is to get some experience and add to their resumes so that when opportunities of paying jobs arise, they have a better chance than others. There is basic Psychological Impact on Unemployment Youth unemployment is an area of very serious concern in India. There is some Psychological Impact on Unemployment, Adjustment, Anger, Anxiety, Avoid Social Participation, Blaming

A Study of Adjustment, Life Style and Life Satisfaction of Educated Unemployed Youth
© The International Journal of Indian Psychology, ISSN 2348-5396 (e)| ISSN: 2349-3429 (p) | 58
Themselves, and Cardiovascular Decease Increase, Crime Rate Increasing, Depression, Effect on Health, Emotional Problem, Decrease Family Support, Guilt Feeling, Helplessness and Isolation from the Society, Lack of Self Esteem and Confidence, Less Interesting, Life Satisfaction Level Decrease, Loss of Enthusiasm and Willpower Issues, Loss of Identity, Loss of Skill, Mental Health Problem, Positive Attitude decrease, Relationship Problem with others, Sleep Disorder, Smoking Behaviour Increase, Social Support decrease, Stress, Suicides, Tension and etc. Adjustment Adjustment is a continuous process of action in the life of a human being or an organism with a definite purpose of meeting the needs of the self the needs of the environment and the needs of the culture or society the ultimate and of the process of action of the adjustment is successful survival. The end result may be survival or extermination a continuous close watch on the life of an organism or a human being may bring out many happy and unhappy events which are based upon the struggle for successful survival. Man is an interdependent creature, always expecting the help and the cooperation from other human beings and the culture or society in which he livers, for the fulfilment of his basic needs and also maker’s inevitable demands from them. Laurence Shaffer “Adjustment is the process by which a living organism maintains balance between his needs and the circumstances that influence the satisfaction of his needs” Adjustment as a major importance for psychologists, teachers and parents; to analyses the process we should study the development of an individual longitudinally from his birth onwards. The child, at the time of his birth, is absolutely dependent on other for the satisfaction of this need, but gradually with the age he learns to control his needs. His adjustment largely depends on his interaction with the external environment in which he lives. When the child is here, the world, for him, is a big buzzing, blooming confusion. He cannot differentiate among the various objects of his environment but as he matures he comes to learn to articulate the details of his environment through the process of sensation, perception and conception. The child in his infancy can respond and think about only concrete objects of his environment. The process of abstraction comes afterwards. The young children lack the capacity of self-control of the instinctive impulses. Anything which appears to their senses bright they try to take hold of it. Their development is purely on instinctive level. The nature of adjective process is decided by a number of factors, particularly, internal needs and external demands of the child. Life satisfaction Life satisfaction is a multi-dimensional concept. As noted above, the notion of quality of life and the consideration of several areas of life broaden the narrower focus on income and material conditions which prevails in other approaches. Multi-dimensionality not only requires the description of several life domains, but emphasizes the interplay between domains as this contributes to quality of life.

A Study of Adjustment, Life Style and Life Satisfaction of Educated Unemployed Youth
© The International Journal of Indian Psychology, ISSN 2348-5396 (e)| ISSN: 2349-3429 (p) | 59
Quality of life satisfaction is measured by objective as well as subjective indicators. Subjective and attitudinal perceptions are of particular relevance in identifying individual goals and orientations. Individual perceptions and evaluations are most valuable when these subjective evaluations are linked to objective living conditions. Applying both ways of measuring quality of life gives a more complete picture. Conceptualizing Lifestyle Psychology There are people who strictly deprive themselves of each and every eatable, drinkable, and smokable which has in any way acquired a shady reputation. They pay this price for health. And health is all they get for it. -Mark Twain At the end of this chapter you will: have a working definition of lifestyle diseases and lifestyle behaviours:- • Understand the development of a lifestyle model of disease • Be aware of the problems with measuring lifestyle behaviours • Recognize the multiple influences on lifestyle choice. The decision to write a text on lifestyle psychology reflects an appreciation of the importance of the government and policy makers’ use of the term lifestyle to refer to diseases where behaviour plays a part in the a ethology of the condition. In a speech in 2006, the then prime minister of Great Britain, Tony Blair, called for ‘lifestyle change’ to relieve the pressure on the National Health Service. The prime minister suggested that ‘failure to address bad lifestyles was putting an “increasing strain” on the health service’. The centrality of the message, the role of lifestyle in health, and the role of psychology in promoting and improving lifestyle will form the focus of this text. RESEARCH METHODOLOGY Problem statement: “A study of Adjustment, Life Style, and Life Satisfaction among Educated Unemployed Youth” The Importance for the present study Through this study researcher want to know about how many people facing problem of unemployment and what they are in front of them during unemployment condition. What kind of struggle they have to do get employment, what kind of psychological problems they faced, like for example adjustment, anger, anxiety, depressions, emotional problems, crime rate increasing, mental health problems, stress, suicides, blaming themselves, cardiovascular decease increasing, family support decreasing, isolation from the society, life satisfaction, loss of identity, loss of skills, relationship maintain problems, decrease social support, smoking behaviour increasing etc., all kind of problem faced by unemployment people.

A Study of Adjustment, Life Style and Life Satisfaction of Educated Unemployed Youth
© The International Journal of Indian Psychology, ISSN 2348-5396 (e)| ISSN: 2349-3429 (p) | 60
This study helps to systematize employment in rural and rural area. The problem of unemployment among the educated is not a new one. Present study help to know how and what kind of changes an unemployed person has made so that they can get easily employment. There is a considerable proof that suicidal tendencies are seen more in unemployed people so that what psychologist, sociologist and economist helps to reduce the suicidal tendency. There are an increasing number of young patients visiting psychiatrists for clinical depression caused by unemployment so how psychologist, sociologist, and economist facilitate unemployed people so that we can decrease psychological problem in unemployed youth. There have been several studies in past that have paid attention on unemployment in various concepts and in various perspectives in abroad but researchers laid vary little focus on psychological perspectives of unemployment. Objectives of Research 1. To study of Adjustment, Life satisfaction and Life Style of male and female people. 2. To study of Adjustment, Life satisfaction and Life Style of among rural and urban people. 3. To study of Adjustment, Life satisfaction and Life Style of among different ages of people. 4. To study interaction effect of Adjustment, Life satisfaction and Life Style among Gender,
Live in Area and among different age’s people. Variable
Sr. No Name of Variable Nature of Variable
Levels of Variable Level of Name of Variable
1 Types of Gender Independent Variables 2 Male
Female
2 Age Independent Variables 3
18 to 25 Year 26 to 33 Year 34 and Above
3 Live in Area Independent Variables 2 Urban
Rural
4 Adjustment Dependent Variables 7 Scores of Various Levels of
Adjustment
5 Life Style Dependent Variables 6 Scores of Various Levels of
Life Style
6 Life Satisfaction Dependent Variables 6 Scores of Various Levels of
Life Satisfaction Control Variable: Note that in an experiment there may be many additional variables beyond the manipulated independent variable and the measured dependent variables. It is critical in experiments that these variables do not vary and hence bias or otherwise distort the results. There is a struggle between controls vs. authenticity in managing this.
A Study of Adjustment, Life Style and Life Satisfaction of Educated Unemployed Youth
© The International Journal of Indian Psychology, ISSN 2348-5396 (e)| ISSN: 2349-3429 (p) | 61
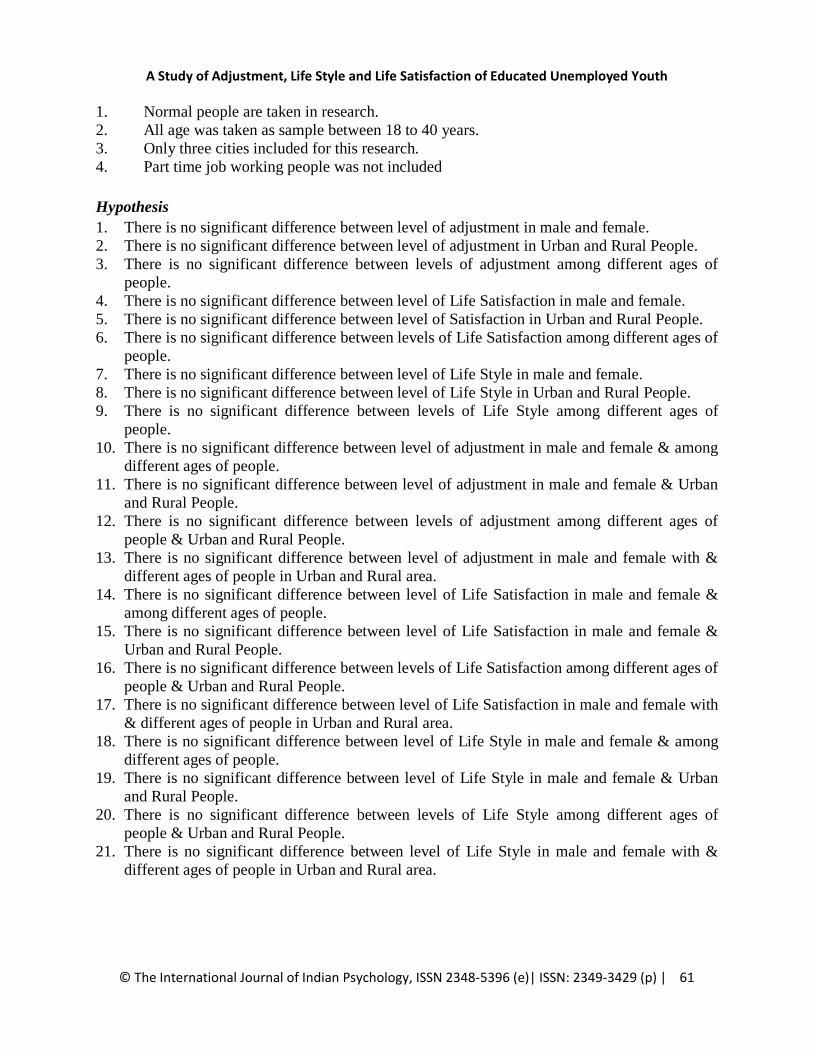
1. Normal people are taken in research. 2. All age was taken as sample between 18 to 40 years. 3. Only three cities included for this research. 4. Part time job working people was not included Hypothesis 1. There is no significant difference between level of adjustment in male and female. 2. There is no significant difference between level of adjustment in Urban and Rural People. 3. There is no significant difference between levels of adjustment among different ages of
people. 4. There is no significant difference between level of Life Satisfaction in male and female. 5. There is no significant difference between level of Satisfaction in Urban and Rural People. 6. There is no significant difference between levels of Life Satisfaction among different ages of
people. 7. There is no significant difference between level of Life Style in male and female. 8. There is no significant difference between level of Life Style in Urban and Rural People. 9. There is no significant difference between levels of Life Style among different ages of
people. 10. There is no significant difference between level of adjustment in male and female & among
different ages of people. 11. There is no significant difference between level of adjustment in male and female & Urban
and Rural People. 12. There is no significant difference between levels of adjustment among different ages of
people & Urban and Rural People. 13. There is no significant difference between level of adjustment in male and female with &
different ages of people in Urban and Rural area. 14. There is no significant difference between level of Life Satisfaction in male and female &
among different ages of people. 15. There is no significant difference between level of Life Satisfaction in male and female &
Urban and Rural People. 16. There is no significant difference between levels of Life Satisfaction among different ages of
people & Urban and Rural People. 17. There is no significant difference between level of Life Satisfaction in male and female with
& different ages of people in Urban and Rural area. 18. There is no significant difference between level of Life Style in male and female & among
different ages of people. 19. There is no significant difference between level of Life Style in male and female & Urban
and Rural People. 20. There is no significant difference between levels of Life Style among different ages of
people & Urban and Rural People. 21. There is no significant difference between level of Life Style in male and female with &
different ages of people in Urban and Rural area.

A Study of Adjustment, Life Style and Life Satisfaction of Educated Unemployed Youth
© The International Journal of Indian Psychology, ISSN 2348-5396 (e)| ISSN: 2349-3429 (p) | 62
Population & Sample of the study The researcher was collected data from the Vadodara, Ahmadabad, Anand cities of Gujarat state. Data was collected from the Employment Exchange, face to face meet to the subject, NGO, recruitment fair, ITI Job Fair, etc. Places. For these researches 480 youths of above mention cities were chosen, who’s age between 18 years to 40 years was taken and the sample was randomly selected, which are educated unemployed. The data was collected personally. The sample was drawn from three categories. 1:- Male & Female, 2:- Urban and Rural Area and, 3:- Age differences Among Unemployed. Research Tools Personal Data Sheet To obtain the personal details of the subjects, researcher had prepared personal data sheet. The data sheet includes the information about name of the subject, age, sex, types of family, marital status, total income, time of unemployment, religious, total family members, job, caste, educational qualification, contact number and many information was ask. Adjustment Neurotism Dimensional Inventory The questionnaire developed by R N Singh and Mahesh Bhargava. This inventory consists 105 items in three response alternatives and measures seven dimensions—self-esteem-self inferiority, happiness-depression, calmness-anxiety, neutrality obsessiveness, independence-dependence, feeling of being healthy-hypochondriasis, innocence-guilt feeling. It can be used on both the sexes from age group 17 to 60 years. Norms are available in form of Mean & S.D. and Stenine Norms. 1. Self-esteem-self inferiority, 2. Happiness -depression, 3. Calmness - anxiety, 4. Naturality obsessiveness, 5. Independence -dependence, 6. Feeling of being healthy- Hypochondria 7. Innocence-guilt feeling. Life Satisfaction Scale, The questionnaire developed by Q G Alam& R Shrivastva. It contains 69 Yes/No type items which yield a total score covering six areas — health, personal, economic, marital, social and job. Standardized on 875 adults aging between 18 to 40 years 1. Health Satisfaction 2. Personal Satisfaction 3. Economic Satisfaction 4. Marital Satisfaction 5. Social Satisfaction 6. Job Satisfaction

A Study of Adjustment, Life Style and Life Satisfaction of Educated Unemployed Youth
© The International Journal of Indian Psychology, ISSN 2348-5396 (e)| ISSN: 2349-3429 (p) | 63
Life style Scale Life Style Scale developed by S. K. Bawa and S. Kaur, the scale consists 60 items into 6 Dimension like 1. Health Conscious Life Style, 2. Academic Oriented Life Style, 3. Career Oriented Life Style, 4. Socially Oriented Life Style, 5. Trend Seeking Life Style, 6. Family Oriented Life Style. Procedure of Data Collection Data collection is a term used to describe a process of preparing and collecting data - for example as part of a process improvement or similar project. The purpose of data collection is to obtain information to keep on record, to make decisions about important issues, to pass information on to others. Primarily, data is collected to provide information regarding a specific topic. The researcher was collected data from the Vadodara, Ahmadabad, Anand cities of Gujarat state. Data was collected from the Employment Exchange, face to face meet to the subject, NGO, recruitment fair, ITI Job Fair, etc. Places. For these researches 480 youths of above mention cities were chosen, whose age between 18 years to 40 years was taken and the sample was randomly selected, which are educated unemployed. The data was collected personally. The sample was drawn from three categories. 1:- Male & Female, 2:- Urban and Rural Area and, 3:- Age differences Among Unemployed. Research Design 2X2X3 Factorial Designs
Gender Male Female Total
Live In Area Urban Rural Urban Rural
Age
18 to 25 Year 40 40 40 40 160 26 to 33 Year 40 40 40 40 160
34 And Above Year 40 40 40 40 160 Total 120 120 120 120 480
Statistical analysis The Obtained data of 480 subjects were analysed with adequate statistical methods of ANOVA, And in order to examine significant differences between two specific mean of sub groups of variable the result obtained through such statistical analysis have been presented in details in the main body of the thesis. Qualitative Analysis: - which included descriptive statistics, frequency distribution, and ratio analysis of the response given by the sample.

A Study of Adjustment, Life Style and Life Satisfaction of Educated Unemployed Youth
© The International Journal of Indian Psychology, ISSN 2348-5396 (e)| ISSN: 2349-3429 (p) | 64
RESULT AND DISCUSSION OF ADJUSTMENT Table No – 1 Showing Result of ANOVA on Adjustment of Various Group
Tests of Between-Subjects Effects
Source Type III Sum of Squares Df Mean
Square F Sig. Significant
Gender 1326.792 1 1326.792 3.219 .073 0.05 Age 315.453 2 157.727 .383 .682 NS
LiveinArea 3688.025 1 3688.025 8.948 .003 0.05 Gender * Age 1556.553 2 778.277 1.888 .153 NS
Gender * Live in Area 284.333 1 284.333 .690 .407 NS Age * Live in Area 2005.764 2 1002.882 2.433 .089 NS
Gender * Age * Live in Area 1876.490 2 938.245 2.276 .104 NS Error 190838.244 463 412.178 TSS 201782.349 474
Table No – 2 Showing Mean Score of Adjustment of Gender
Gender Dependent Variable Gender Mean N
Adjustment Female 214.450 240 Male 217.794 240
Table No – 3 Showing Mean Score of Adjustment of Age
Age Dependent Variable Age Mean N
Adjustment 18 to 25 Year 215.806 160 26 to 33 Year 215.319 160 34 and Above 217.241 160
Table No – 4 Showing Mean Score of Adjustment of Live in Area
Live in Area Dependent Variable Live in Area Mean N
Adjustment Urban 218.909 240 Rural 213.335 240
Table No – 5 Showing Mean Score of Adjustment of Gender and Age
Gender * Age Dependent Variable Gender Age Mean N
Adjustment
Female 18 to 25 Year 216.476 80 26 to 33 Year 213.387 80 34 and Above 213.487 80
Male 18 to 25 Year 215.136 80 26 to 33 Year 217.250 80 34 and Above 220.995 80

A Study of Adjustment, Life Style and Life Satisfaction of Educated Unemployed Youth
© The International Journal of Indian Psychology, ISSN 2348-5396 (e)| ISSN: 2349-3429 (p) | 65
Table No – 6 Showing Mean Score of Adjustment of Gender and Live in Area Gender * Live in Area
Dependent Variable Gender Live in Area Mean N
Adjustment Female Urban 216.463 120
Rural 212.437 120
Male Urban 221.355 120 Rural 214.232 120
Table No – 7 Showing Mean Score of Adjustment of Age and Live in Area
Age * Live in Area Dependent Variable Age Live in Area Mean N
Adjustment
18 to 25 Year Urban 219.688 80 Rural 211.924 80
26 to 33 Year Urban 219.895 80 Rural 210.742 80
34 and Above Urban 217.145 80 Rural 217.337 80
Table No – 8 Showing Mean Score of Adjustment of Gender, Age and Live in Area
Gender * Age * Live in Area Dependent Variable Gender Age Live in Area Mean N
Adjustment
Female
18 to 25 Year Urban 220.000 40 Rural 212.951 40
26 to 33 Year Urban 219.390 40 Rural 207.385 40
34 and Above Urban 210.000 40 Rural 216.974 40
Male
18 to 25 Year Urban 219.375 40 Rural 210.897 40
26 to 33 Year Urban 220.400 40 Rural 214.100 40
34 and Above Urban 224.289 40 Rural 217.700 40
Table No 1 Shows The Result of ANOVA on Adjustment of Various Groups of Gender Shows That F Ratio for Types of Gender on Adjustment is 3.219 which is Significant at 0.05 Level; therefore Null Hypothesis is Rejected that is There Is No Significant Difference between Level of Adjustment in Male and Female. It Means Significant Differences is Existed Between Male and Female in Adjustment during the Unemployed Condition. By the Same Point of View Table No – 2Shows that the mean Scores of Adjustment of Male is 214.450 and mean Scores of Adjustment of Female is 217.794. It is Clearly Said that Significant Difference Were between Adjustment of Male and female in Unemployment Condition. Here we can Say that Male Have
A Study of Adjustment, Life Style and Life Satisfaction of Educated Unemployed Youth
© The International Journal of Indian Psychology, ISSN 2348-5396 (e)| ISSN: 2349-3429 (p) | 66
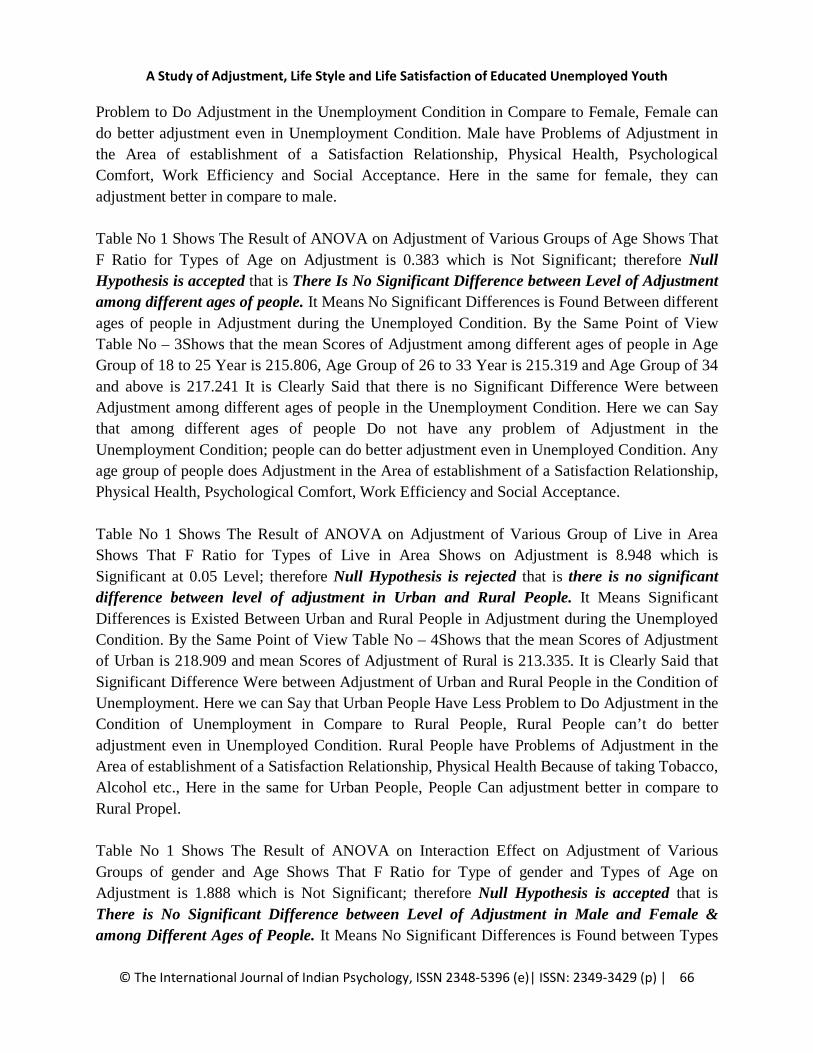
Problem to Do Adjustment in the Unemployment Condition in Compare to Female, Female can do better adjustment even in Unemployment Condition. Male have Problems of Adjustment in the Area of establishment of a Satisfaction Relationship, Physical Health, Psychological Comfort, Work Efficiency and Social Acceptance. Here in the same for female, they can adjustment better in compare to male. Table No 1 Shows The Result of ANOVA on Adjustment of Various Groups of Age Shows That F Ratio for Types of Age on Adjustment is 0.383 which is Not Significant; therefore Null Hypothesis is accepted that is There Is No Significant Difference between Level of Adjustment among different ages of people. It Means No Significant Differences is Found Between different ages of people in Adjustment during the Unemployed Condition. By the Same Point of View Table No – 3Shows that the mean Scores of Adjustment among different ages of people in Age Group of 18 to 25 Year is 215.806, Age Group of 26 to 33 Year is 215.319 and Age Group of 34 and above is 217.241 It is Clearly Said that there is no Significant Difference Were between Adjustment among different ages of people in the Unemployment Condition. Here we can Say that among different ages of people Do not have any problem of Adjustment in the Unemployment Condition; people can do better adjustment even in Unemployed Condition. Any age group of people does Adjustment in the Area of establishment of a Satisfaction Relationship, Physical Health, Psychological Comfort, Work Efficiency and Social Acceptance. Table No 1 Shows The Result of ANOVA on Adjustment of Various Group of Live in Area Shows That F Ratio for Types of Live in Area Shows on Adjustment is 8.948 which is Significant at 0.05 Level; therefore Null Hypothesis is rejected that is there is no significant difference between level of adjustment in Urban and Rural People. It Means Significant Differences is Existed Between Urban and Rural People in Adjustment during the Unemployed Condition. By the Same Point of View Table No – 4Shows that the mean Scores of Adjustment of Urban is 218.909 and mean Scores of Adjustment of Rural is 213.335. It is Clearly Said that Significant Difference Were between Adjustment of Urban and Rural People in the Condition of Unemployment. Here we can Say that Urban People Have Less Problem to Do Adjustment in the Condition of Unemployment in Compare to Rural People, Rural People can’t do better adjustment even in Unemployed Condition. Rural People have Problems of Adjustment in the Area of establishment of a Satisfaction Relationship, Physical Health Because of taking Tobacco, Alcohol etc., Here in the same for Urban People, People Can adjustment better in compare to Rural Propel. Table No 1 Shows The Result of ANOVA on Interaction Effect on Adjustment of Various Groups of gender and Age Shows That F Ratio for Type of gender and Types of Age on Adjustment is 1.888 which is Not Significant; therefore Null Hypothesis is accepted that is There is No Significant Difference between Level of Adjustment in Male and Female & among Different Ages of People. It Means No Significant Differences is Found between Types

A Study of Adjustment, Life Style and Life Satisfaction of Educated Unemployed Youth
© The International Journal of Indian Psychology, ISSN 2348-5396 (e)| ISSN: 2349-3429 (p) | 67
of gender and different ages of people in Adjustment during the Unemployed Condition. By the Same Point of View Table No – 5Shows that the mean Scores of Adjustment among types of gender and different ages of people; Female Age Group of 18 to 25 Year is 216.476, Age Group of 26 to 33 Year is 213.387 and Age Group of 34 and above is 213.487, for male Age Group of 18 to 25 Year is 215.136, Age Group of 26 to 33 Year is 217.250 and Age Group of 34 and above is 220.995, It is Clearly Said that there is no Significant Difference Were between Adjustment among Types of Gender and different ages of people in the Unemployed Condition. Here we can Say that among Types of Gender And different ages of people Do not have any problem of Adjustment in the Unemployed Condition; People can do better adjustment even in Unemployed Condition. Types of gender and any age group of people do better Adjustment in the Area of establishment of a Satisfaction Relationship, Physical Health, Psychological Comfort, Work Efficiency and Social Acceptance. Table No 1 Shows The Result of ANOVA on Interaction Effect on Adjustment of Various Groups of gender and Types of Live in Area Shows That F Ratio for Type of gender and Types of Live in Area on Adjustment is 0.690 which is Not Significant; therefore Null Hypothesis is accepted that is There is no significant difference between level of adjustment in male and female & Urban and Rural People. It Means No Significant Differences is Found between Types of gender and different Types of Live in Area people in Adjustment during the Unemployed Condition. By the Same Point of View Table No – 6Shows that the mean Scores of Adjustment among types of gender and different Types of Live in Area of people; Female who live in Urban area is 216.463, Female who live in Rural area is 212.437, Male who live in Urban area is 221.355, Male who live in Rural area is 214.232; It is Clearly Said that there is no Significant Difference Were between Adjustment among Types of Gender and Types of Live in Area of people in the Unemployed Condition. Here we can Say that among Types of Gender and different Types of Live in Area people do not have any problem of Adjustment in the Unemployed Condition, People can do better adjustment even in Unemployed Condition. Types of gender and Types of Live in Area people do better Adjustment in the Area of establishment of a Satisfaction Relationship, Physical Health, Psychological Comfort, Work Efficiency and Social Acceptance. Table No 1 Shows The Result of ANOVA on Interaction Effect on Adjustment of Various Groups of Ages and Types of Live in Area Shows That F Ratio for Type of Ages and Types of Live in Area on Adjustment is 2.433 which is Not Significant; therefore Null Hypothesis is accepted that is There is no significant difference between levels of adjustment among different ages of people & Urban and Rural People..It Means No Significant Differences is Found between Types of Different Ages and different Types of Live in Area people in Adjustment during the Unemployed Condition. By the Same Point of View Table No – 7Shows that the mean Scores of Adjustment among types of Ages and different Types of Live in Area of people; Age Group of 18 to 25 Year is who live in Urban area is 219.688, Age Group of 18 to 25

A Study of Adjustment, Life Style and Life Satisfaction of Educated Unemployed Youth
© The International Journal of Indian Psychology, ISSN 2348-5396 (e)| ISSN: 2349-3429 (p) | 68
Year is who live in Rural area is 211.924, Age Group of 26 to 33 Year is who live in Urban area is 219.895, Age Group of 26 to 33 Year is who live in Rural area is 210.742, Age Group of 34 and Above Year is who live in Urban area is 217.145, Age Group of 34 and Above is who live in Rural area is 217.337; It is Clearly Said that there is no Significant Difference Were between Adjustment among Types of Ages and Types of Live in Area of people in the Unemployed Condition. Here we can Say that among Types of Ages and different Types of Live in Area people Do not have any problem of Adjustment in the Unemployed Condition; People can do better adjustment even in Unemployed Condition. Types of Ages and Types of Live in Area people do better Adjustment in the Area of establishment of a Satisfaction Relationship, Physical Health, Psychological Comfort, Work Efficiency and Social Acceptance. Table No 1 Shows The Result of ANOVA on Interaction Effect on Adjustment of Various Groups of Types of Gender, Different Ages Groups and Types of Live in Area Shows That F Ratio for Types of Gender, Type of Ages and Types of Live in Area on Adjustment is 2.276 which is Not Significant; therefore Null Hypothesis is accepted that is There is no significant difference between level of adjustment in male and female with & different ages of people in urban and rural area. It Means No Significant Differences is Found between Types of Gender, Types of Different Ages and different Types of Live in Area people in Adjustment during the Unemployed Condition. By the Same Point of View Table No – 8Shows that the mean Scores of Adjustment among Types of Gender, types of Ages and different Types of Live in Area of people; Female Age Group of 18 to 25 Year is who live in Urban area is 220.000, Age Group of 18 to 25 Year is who live in Rural area is 212.951, Female Age Group of 26 to 33 Year is who live in Urban area is 219.390, Age Group of 26 to 33 Year is who live in Rural area is 207.385, Age Group of 34 and Above Year is who live in Urban area is 210.000, Age Group of 34 and Above is who live in Rural area is 216.974; Male Age Group of 18 to 25 Year is who live in Urban area is 219.375, Age Group of 18 to 25 Year is who live in Rural area is 210.897, Male Age Group of 26 to 33 Year is who live in Urban area is 220.400, Age Group of 26 to 33 Year is who live in Rural area is 214.100, Age Group of 34 and Above Year is who live in Urban area is 224.289, Age Group of 34 and Above is who live in in Rural area is 217.700; It is Clearly Said that there is no Significant Difference Were between Adjustment among Different gender, Types of Ages and Types of Live in Area of people in the Unemployed Condition. Here we can Say that among Different Gender, Types of Ages and different Types of Live in Area people Do not have any problem of Adjustment in the Unemployed Condition, People can do better adjustment even in Unemployed Condition. Different gender, Types of Ages and Types of Live in Area people do better Adjustment in the Area of establishment of a Satisfaction Relationship, Physical Health, Psychological Comfort, Work Efficiency and Social Acceptance.
A Study of Adjustment, Life Style and Life Satisfaction of Educated Unemployed Youth
© The International Journal of Indian Psychology, ISSN 2348-5396 (e)| ISSN: 2349-3429 (p) | 69
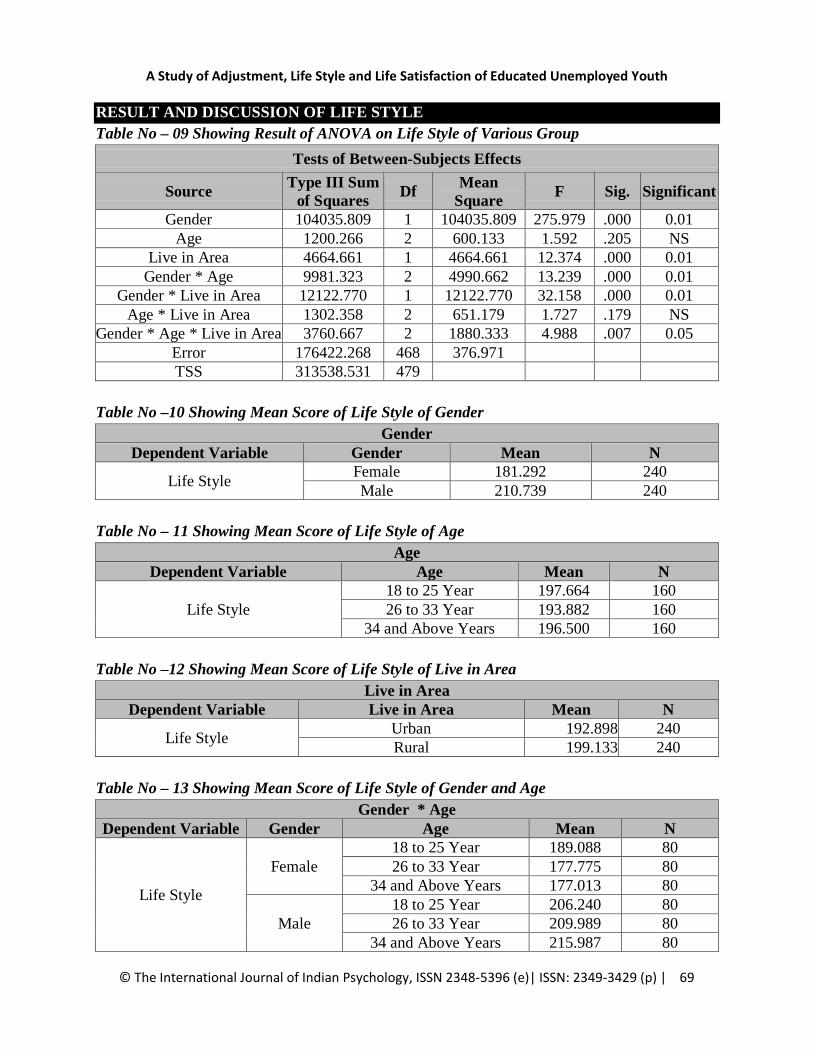
RESULT AND DISCUSSION OF LIFE STYLE Table No – 09 Showing Result of ANOVA on Life Style of Various Group
Tests of Between-Subjects Effects
Source Type III Sum of Squares Df Mean
Square F Sig. Significant
Gender 104035.809 1 104035.809 275.979 .000 0.01 Age 1200.266 2 600.133 1.592 .205 NS
Live in Area 4664.661 1 4664.661 12.374 .000 0.01 Gender * Age 9981.323 2 4990.662 13.239 .000 0.01
Gender * Live in Area 12122.770 1 12122.770 32.158 .000 0.01 Age * Live in Area 1302.358 2 651.179 1.727 .179 NS
Gender * Age * Live in Area 3760.667 2 1880.333 4.988 .007 0.05 Error 176422.268 468 376.971 TSS 313538.531 479
Table No –10 Showing Mean Score of Life Style of Gender
Gender Dependent Variable Gender Mean N
Life Style Female 181.292 240 Male 210.739 240
Table No – 11 Showing Mean Score of Life Style of Age
Age Dependent Variable Age Mean N
Life Style 18 to 25 Year 197.664 160 26 to 33 Year 193.882 160
34 and Above Years 196.500 160 Table No –12 Showing Mean Score of Life Style of Live in Area
Live in Area Dependent Variable Live in Area Mean N
Life Style Urban 192.898 240 Rural 199.133 240
Table No – 13 Showing Mean Score of Life Style of Gender and Age
Gender * Age Dependent Variable Gender Age Mean N
Life Style
Female 18 to 25 Year 189.088 80 26 to 33 Year 177.775 80
34 and Above Years 177.013 80
Male 18 to 25 Year 206.240 80 26 to 33 Year 209.989 80
34 and Above Years 215.987 80

A Study of Adjustment, Life Style and Life Satisfaction of Educated Unemployed Youth
© The International Journal of Indian Psychology, ISSN 2348-5396 (e)| ISSN: 2349-3429 (p) | 70
Table No –14 Showing Mean Score of Life Style of Gender and Live in Area Gender * Live in Area
Dependent Variable Gender Live in Area Mean N
Life Style Female Urban 183.200 120
Rural 179.383 120
Male Urban 202.595 120 Rural 218.883 120
Table No – 15 Showing Mean Score of Life Style of Age and Live in Area
Age * Live in Area Dependent Variable Age Live in Area Mean N
Life Style
18 to 25 Year Urban 192.342 80 Rural 202.986 80
26 to 33 Year Urban 191.213 80 Rural 196.551 80
34 and Above Years Urban 195.138 80 Rural 197.862 80
Table No –16 Showing Mean Score of Life Style of Gender, Age and Live in Area
Gender * Age * Live in Area Dependent Variable Gender Age Live in Area Mean N
Life Style
Female
18 to 25 Year Urban 191.325 40 Rural 186.850 40
26 to 33 Year Urban 181.500 40 Rural 174.050 40
34 and Above Years Urban 176.775 40 Rural 177.250 40
Male
18 to 25 Year Urban 193.359 40 Rural 219.122 40
26 to 33 Year Urban 200.927 40 Rural 219.051 40
34 and Above Years Urban 213.500 40 Rural 218.475 40
Table No 9 Shows The Result of ANOVA on Life Style of Various Groups of Gender Shows That F Ratio for Types of Gender on Life Style is 275.979which is Significant at 0.01 Level; therefore Null Hypothesis is rejected that is There Is No Significant Difference between Level of Life Style in Male and Female. It Means Significant Differences is Found Between Male and Female in Life Style during the Unemployed Condition. By the Same Point of View Table No – 10 Shows that the mean Scores of Life Style of Male is 210.739and mean Scores of Life Style of Female is 181.292. It is Clearly Indicate that Significant Difference Were between Life Style of

A Study of Adjustment, Life Style and Life Satisfaction of Educated Unemployed Youth
© The International Journal of Indian Psychology, ISSN 2348-5396 (e)| ISSN: 2349-3429 (p) | 71
Male and Female is Differences in Unemployed Condition. Here we can Say that Male Have Problem of Life Style in the Unemployed Condition in Compare to Female, Female can Adjust Life Style even in Unemployed Condition. Male have Problems of Life Style in the Area of Establishment of a Satisfaction Relationship, Physical Health, Psychological Comfort, Work Efficiency and Social Acceptance. Here in the same for Female but they can Maintain Life Style in compare to male. Table No 9 Shows The Result of ANOVA on Life Style of Various Groups of Age Shows That F Ratio for Types of Age on Life Style is 1.592 which is Not Significant; therefore Null Hypothesis is accepted that is There Is No Significant Difference between Level of Life Style among different ages of people. It Means No Significant Differences is Found Between different ages of people in Life Style during the Unemployed Condition. By the Same Point of View Table No –11 Shows that the mean Scores of Life Style among different ages of people in Age Group of 18 to 25 Year is 197.664, Age Group of 26 to 33 Year is 193.882 and Age Group of 34 and Above Years is 196.500It is Clearly indicate that there is no Significant Difference Were between Life Style among different ages of people in Unemployed Condition. Here we can Say that among different ages of people do not have any problem of Life Style in Unemployed Condition. Any age groups of people can Maintain Life Style even in Unemployed Condition. Any age group of people sustains their Life Style in the Area of establishment of a Satisfaction Relationship, Physical Health, Psychological Comfort, Work Efficiency and Social Acceptance. Table No 9 Shows The Result of ANOVA on Life Style of Various Group of Live in Area Shows That F Ratio for Types of Live in Area Shows on Life Style is 12.374which is Significant at 0.01 Level; therefore Null Hypothesis is rejected that is there is no significant difference between level of Life Style in Urban and Rural People. It Means Significant Differences is Existed Between Urban and Rural People in Life Style during the Unemployed Condition. By the Same Point of View Table No – 12 Shows that the mean Scores of Life Style of Urban is 192.898 and mean Scores of Life Style of Rural is 199.133. It is Clearly Indicate that Significant Difference Were between Life Style of Urban and Rural People is Differences in Unemployed Condition. Here we can Say that Urban People Have Less Problem to Maintain Life Style in Unemployed Condition in Compare to Rural People, Rural People can’t sustain Life Style even in Unemployed Condition. Rural People have Problems of Life Style in the Area of establishment of a Satisfaction Relationship, Physical Health Because of taking Tobacco, Alcohol etc.; here in the same for Urban People but they can sustain Life Style in compare to Rural Propel. Table No 9 Shows The Result of ANOVA on Interaction Effect on Life Style of Various Groups of Gender and Age Shows That F Ratio for Type of gender and Types of Age on Life Style is 13.239which is Significant at 0.01 Level; therefore Null Hypothesis is Rejected that is There is No Significant Difference between Level of Life Style in Male and Female & among Different Ages of People. It Means Significant Differences is Found between Types of gender and

A Study of Adjustment, Life Style and Life Satisfaction of Educated Unemployed Youth
© The International Journal of Indian Psychology, ISSN 2348-5396 (e)| ISSN: 2349-3429 (p) | 72
different ages of people in Life Style during the Unemployed Condition. By the Same Point of View Table No –13 Shows that the mean Scores of Life Style among types of gender and different ages of people; Female Age Group of 18 to 25 Year is 189.088, Female Age Group of 26 to 33 Year is 177.775 and Female Age Group of 34 and Above Years is 177.013, for male Age Group of 18 to 25 Year is 206.240, Male Age Group of 26 to 33 Year is 209.989and Male Age Group of 34 and Above Years is 215.987, It is Clearly Indicate that there is Significant Difference Were between Life Style among Types of Gender and Different Ages of People in Unemployed Condition. Here we can Say that among Types of Gender and different ages of people have problem of Life Style in the Condition of Unemployment any gender and any age group of people, People can’t maintain Life Style even in Unemployment Condition. Types of gender and any age group of people do not maintain Life Style in the Area of establishment of a Satisfaction Relationship, Physical Health, Psychological Comfort, Work Efficiency and Social Acceptance. Table No 9 Shows The Result of ANOVA on Interaction Effect on Life Style of Various Groups of gender and Types of Live in Area Shows That F Ratio for Type of gender and Types of Live in Area on Life Style is 32.158which is Significant at 0.01 Level; therefore Null Hypothesis is Rejected that is There is no significant difference between level of Life Style in male and female & Urban and Rural People. It Means Significant Differences is Found between Types of gender and different Types of Live in Area people in Life Style during the Unemployed Condition. By the Same Point of View Table No –14 Shows that the mean Scores of Life Style among types of gender and different Types of Live in Area of people; Female who live in Urban area is 183.200, Female who live in Rural area is 179.383, Male who live in Urban area is 202.595, Male who live in Rural area is 218.883; It is Clearly indicate that there is Significant Difference Were between Life Style among Types of Gender and Types of Live in Area of people in Unemployed Condition. Here we can Say that among Types of Gender and different Types of Live in Area people do not have any problem of Life Style in Unemployed Condition, People maintain or have better Life Style even in Unemployment Condition. Types of gender and Types of Live in Area people do better Life Style in the Area of establishment of a Satisfaction Relationship, Physical Health, Psychological Comfort, Work Efficiency and Social Acceptance. Table No 9 Shows The Result of ANOVA on Interaction Effect on Life Style of Various Groups of Ages and Types of Live in Area Shows That F Ratio for Type of Ages and Types of Live in Area on Life Style is 1.727which is Not Significant; therefore Null Hypothesis is Accepted that is There is no significant difference between levels of Life Style among different ages of people & Urban and Rural People. It Means Significant Differences is Not Found between Types of Different Ages and different Types of Live in Area people in Life Style during the Unemployed Condition. By the Same Point of View Table No –15 Shows that the mean Scores of Life Style among types of Ages and different Types of Live in Area of people; Age Group of 18 to 25 Year

A Study of Adjustment, Life Style and Life Satisfaction of Educated Unemployed Youth
© The International Journal of Indian Psychology, ISSN 2348-5396 (e)| ISSN: 2349-3429 (p) | 73
is who live in Urban area is 192.342, Age Group of 18 to 25 Year is who live in Rural area is 202.986, Age Group of 26 to 33 Year is who live in Urban area is 191.213, Age Group of 26 to 33 Year is who live in Rural area is 196.551, Age Group of 34 and Above Years is who live in Urban area is 195.138, Age Group of 34 and Above Years is who live in Rural area is 197.862; It is Clearly indicate that there is No Significant Difference Were between Life Style among Types of Ages and Types of Live in Area of people in Unemployed Condition. Here we can Say that among Types of Ages and different Types of Live in Area people have problem of Life Style in Unemployed Condition, People cannot maintain Life Style even in Unemployed Condition. Types of Ages and Types of Live in Area people cannot maintain Life Style in the Area of establishment of a Satisfaction Relationship, Physical Health, Psychological Comfort, Work Efficiency and Social Acceptance. Table No 9 Shows The Result of ANOVA on Interaction Effect on Life Style of Various Groups of Types of Gender, Different Ages Groups and Types of Live in Area Shows That F Ratio for Types of Gender, Type of Ages and Types of Live in Area on Life Style is 4.988which is Significant at 0.05 Level; therefore Null Hypothesis is Rejected that is There is no significant difference between level of Life Style in male and female with & different ages of people in urban and rural area. It Means Significant Differences is Found between Types of Gender, Types of Different Ages and different Types of Live in Area people in Life Style during the Unemployed Condition. By the Same Point of View Table No – 16 Shows that the mean Scores of Life Style among Types of Gender, types of Ages and different Types of Live in Area of people; Female Age Group of 18 to 25 Year is who live in Urban area is 191.325, Female Age Group of 18 to 25 Year is who live in Rural area is 186.850, Female Age Group of 26 to 33 Year is who live in Urban area is 181.500, Female Age Group of 26 to 33 Year is who live in Rural area is 174.050, Female Age Group of 34 and Above Years is who live in Urban area is 176.775, Female Age Group of 34 and Above Years is who live in Rural area is 177.250; Male Age Group of 18 to 25 Year is who live in Urban area is 193.359, Male Age Group of 18 to 25 Year is who live in Rural area is 219.122, Male Age Group of 26 to 33 Year is who live in Urban area is 200.927, Male Age Group of 26 to 33 Year is who live in Rural area is 219.051, Male Age Group of 34 and Above Years Year is who live in Urban area is 213.500, Male Age Group of 34 and Above Years is who live in Rural area is 218.475; It is Clearly Indicate that there is Significant Difference Were between Life Style among Different gender, Types of Ages and Types of Live in Area of people in Unemployed Condition. Here we can Say that among Different Gender, Types of Ages and different Types of Live in Area people have problem of Life Style in Unemployed Condition, People cannot maintain Life Style even in Unemployment Condition.

A Study of Adjustment, Life Style and Life Satisfaction of Educated Unemployed Youth
© The International Journal of Indian Psychology, ISSN 2348-5396 (e)| ISSN: 2349-3429 (p) | 74
RESULT AND DISCUSSION OF LIFE SATISFACTION Table No –17 Showing Result of ANOVA on Life Satisfaction of Various Group
Tests of Between-Subjects Effects
Source Type III Sum of Squares Df Mean Square F Sig. Significant
Gender 1441.227 1 1441.227 61.037 .000 0.01 Age 35.704 2 17.852 .756 .470 NS
Live in Area 31.770 1 31.770 1.345 .247 NS Gender * Age 211.897 2 105.948 4.487 .012 0.05
Gender * Live in Area 33.499 1 33.499 1.419 .234 NS Age * Live in Area 7.143 2 3.571 .151 .860 NS
Gender * Age * Live in Area 3.428 2 1.714 .073 .930 NS Error 10932.577 463 23.612 TSS 12695.318 474
Table No – 18 Showing Mean Score of Life Satisfaction of Gender
Gender Dependent Variable Gender Mean N
Life Satisfaction Female 97.017 240 Male 93.532 240
Table No –19 Showing Mean Score of Life Satisfaction of Age
Age Dependent Variable Age Mean N
Life Satisfaction 18 to 25 Year 95.425 160 26 to 33 Year 95.509 160 34 and Above 94.889 160
Table No – 20 Showing Mean Score of Life Satisfaction of Live in Area
Live in Area Dependent Variable Live in Area Mean N
Life Satisfaction Urban 95.533 240 Rural 95.016 240
Table No – 21 Showing Mean Score of Life Satisfaction of Gender and Age
Gender * Age Dependent Variable Gender Age Mean N
Life Satisfaction
Female 18 to 25 Year 96.351 80
26 to 33 Year 97.244 80 34 and Above 97.456 80
Male 18 to 25 Year 94.499 80 26 to 33 Year 93.775 80 34 and Above 92.322 80

A Study of Adjustment, Life Style and Life Satisfaction of Educated Unemployed Youth
© The International Journal of Indian Psychology, ISSN 2348-5396 (e)| ISSN: 2349-3429 (p) | 75
Table No – 22 Showing Mean Score of Life Satisfaction of Gender and Live in Area Gender * Live in Area
Dependent Variable Gender Live in Area Mean N
Life Satisfaction Female Urban 97.010 120
Rural 97.024 120
Male Urban 94.057 120 Rural 93.008 120
Table No –23 Showing Mean Score of Life Satisfaction of Age and Live in Area
Age * Live in Area Dependent Variable Age Live in Area Mean N
Life Satisfaction
18 to 25 Year Urban 95.828 80 Rural 95.023 80
26 to 33 Year Urban 95.613 80 Rural 95.406 80
34 and Above Urban 95.160 80 Rural 94.619 80
Table No –24 Showing Mean Score of Life Satisfaction of Gender, Age and Live in Area
Gender * Age * Live in Area Dependent Variable Gender Age Live in Area Mean N
Life Satisfaction
Female
18 to 25 Year Urban 96.605 40 Rural 96.098 40
26 to 33 Year Urban 97.000 40 Rural 97.487 40
34 and Above Urban 97.425 40 Rural 97.487 40
Male
18 to 25 Year Urban 95.050 40 Rural 93.949 40
26 to 33 Year Urban 94.225 40 Rural 93.325 40
34 and Above Urban 92.895 40 Rural 91.750 40
Table No 17 Shows The Result of ANOVA on Life Satisfaction of Various Groups of Gender Shows That F Ratio for Types of Gender on Life Satisfaction is 61.037 which is Significant at 0.01 Level; therefore Null Hypothesis is rejected that is There Is No Significant Difference between Level of Life Satisfaction in Male and Female. It Means Significant Differences is Existed Between Male and Female in Life Satisfaction during the Unemployed Condition. By the Same Point of View Table No – 18 Shows that the mean Scores of Life Satisfaction of Male is 97.017 and mean Scores of Life Satisfaction of Female is 93.532. It is Clearly Indicate that Significant Difference Were between Life Satisfaction of Male and Female is Differences in Unemployed Condition. Here we can Say that Male Have Problem of Life Satisfaction in

A Study of Adjustment, Life Style and Life Satisfaction of Educated Unemployed Youth
© The International Journal of Indian Psychology, ISSN 2348-5396 (e)| ISSN: 2349-3429 (p) | 76
Unemployed Condition in Compare to Female, Female are Satisfied with life even in Unemployed Condition. Male have Problems of Life Satisfaction in the Area of Establishment of a Satisfaction Relationship, Physical Health, Psychological Comfort, Work Efficiency and Social Acceptance. Here in the same for Female but they can Maintain Life Satisfaction in compare to male. Table No 17 Shows The Result of ANOVA on Life Satisfaction of Various Groups of Age Shows That F Ratio for Types of Age on Life Satisfaction is 0.756 which is Not Significant; therefore Null Hypothesis is accepted that is There Is No Significant Difference between Level of Life Satisfaction among different ages of people. It Means No Significant Differences is Found Between different ages of people in Life Satisfaction during the Unemployed Condition. By the Same Point of View Table No – 19Shows that the mean Scores of Life Satisfaction among different ages of people in Age Group of 18 to 25 Year is 95.425, Age Group of 26 to 33 Year is 95.509 and Age Group of 34 and above is 94.889 It is Clearly Indicate that there is no Significant Difference Were between Life Satisfaction among different ages of people in Unemployed Condition. Here we can Say that among different ages of people do not have any problem of Life Satisfaction in the Unemployed Condition. Any age group of people sustains their Life Satisfaction in the Area of establishment of a Satisfaction Relationship, Physical Health, Psychological Comfort, Work Efficiency and Social Acceptance. Table No 17 Shows The Result of ANOVA on Life Satisfaction of Various Group of Live in Area Shows That F Ratio for Types of Live in Area Shows on Life Satisfaction is 1.345 which is not Significant; therefore Null Hypothesis is accepted that is there is no significant difference between level of Life Satisfaction in Urban and Rural People. It means no Significant Differences is existed between Urban and Rural People in Life Satisfaction during the Unemployed Condition. By the Same Point of View Table No – 20 Shows that the mean Scores of Life Satisfaction of Urban is 95.533 and mean Scores of Life Satisfaction of Rural is 95.016. It is Clearly Indicate that there is no Significant Difference Were between Life Satisfaction of Urban and Rural People is not Differences in Unemployed Condition. Here we can Say that Urban People and rural people Have Less Problem to Maintain Life Satisfaction in Unemployed Condition, urban and Rural People don’t have Problems of Life Satisfaction in the Area of establishment of a Satisfaction Relationship, Physical Health, etc. Table No 17 Shows The Result of ANOVA on Interaction Effect on Life Satisfaction of Various Groups of Gender and Age Shows That F Ratio for Type of gender and Types of Age on Life Satisfaction is 4.487which is Significant at 0.05 Level; therefore Null Hypothesis is Rejected that is There is No Significant Difference between Level of Life Satisfaction in Male and Female & among Different Ages of People. It Means Significant Differences is Found between Types of gender and different ages of people in Life Satisfaction during the Unemployed Condition. By the Same Point of View Table No – 21 Shows that the mean Scores of Life

A Study of Adjustment, Life Style and Life Satisfaction of Educated Unemployed Youth
© The International Journal of Indian Psychology, ISSN 2348-5396 (e)| ISSN: 2349-3429 (p) | 77
Satisfaction among types of gender and different ages of people; Female Age Group of 18 to 25 Year is 96.351, Female Age Group of 26 to 33 Year is 97.244 and Female Age Group of 34 and above is 97.456, for male Age Group of 18 to 25 Year is 94.499, male Age Group of 26 to 33 Year is 93.775 and male Age Group of 34 and above is 92.322, It is Clearly Indicate that there is Significant Difference Were between Life Satisfaction among Types of Gender and different ages of people in Unemployed Condition. Here we can Say that among Types of Gender and different ages of people have problem of Life Satisfaction in Unemployed Condition, People can’t maintain Life Satisfaction even in Unemployed Condition. Types of gender and any age group of people do not maintain Life Satisfaction in the Area of establishment of a Satisfaction Relationship, Physical Health, Psychological Comfort, Work Efficiency and Social Acceptance. Table No 17 Shows The Result of ANOVA on Interaction Effect on Life Satisfaction of Various Groups of gender and Types of Live in Area Shows That F Ratio for Type of gender and Types of Live in Area on Life Satisfaction is 1.419 which is Not Significant; therefore Null Hypothesis is accepted that is There is no significant difference between level of Life Satisfaction in male and female & Urban and Rural People. It Means No Significant Differences is Found between Types of gender and different Types of Live in Area people in Life Satisfaction during the Unemployed Condition. By the Same Point of View Table No – 22Shows that the mean Scores of Life Satisfaction among types of gender and different Types of Live in Area of people; Female who live in Urban area is 97.010, Female who live in Rural area is 97.024, Male who live in Urban area is 94.057, Male who live in Rural area is 93.008; It is Clearly Indicate that there is no Significant Difference Were between Life Satisfaction among Types of Gender and Types of Live in Area of people in Unemployed Condition. Here we can Say that among Types of Gender and different Types of Live in Area people do not have any problem of Life Satisfaction in Unemployed Condition. Types of gender and Types of Live in Area people Sustained Life Satisfaction in the Area of establishment of a Satisfaction Relationship, Physical Health, Psychological Comfort, Work Efficiency and Social Acceptance. Table No 17 Shows The Result of ANOVA on Interaction Effect on Life Satisfaction of Various Groups of Ages and Types of Live in Area Shows That F Ratio for Type of Ages and Types of Live in Area on Life Satisfaction is 0.151 which is not Significant; therefore Null Hypothesis is accepted that is There is no significant difference between levels of Life Satisfaction among different ages of people & Urban and Rural People. It means there is no Significant Differences found between Types of Different Ages and different Types of Live in Area people in Life Satisfaction during the Unemployed Condition. By the Same Point of View Table No – 23 Shows that the mean Scores of Life Satisfaction among types of Ages and different Types of Live in Area of people; Age Group of 18 to 25 Year is who live in Urban area is 95.828, Age Group of 18 to 25 Year is who live in Rural area is 95.023, Age Group of 26 to 33 Year is who live in Urban area is 95.613, Age Group of 25 to 33 Year is who live in Rural area is 95.406, Age Group of 34 and Above Year is who live in Urban area is 95.160, Age Group of 34 and Above is who live in Rural area is 94.619; It is Clearly Indicate that there no Significant

A Study of Adjustment, Life Style and Life Satisfaction of Educated Unemployed Youth
© The International Journal of Indian Psychology, ISSN 2348-5396 (e)| ISSN: 2349-3429 (p) | 78
Difference Were between Life Satisfaction among Types of Ages and Types of Live in Area of people in Unemployed Condition. Here we can Say that among Types of Ages and different Types of Live in Area people do not have problem of Life Satisfaction in the Unemployed Condition, People can maintain Life Satisfaction even in Unemployed Condition. Types of Ages and Types of Live in Area people cannot maintain Life Satisfaction in the Area of establishment of a Satisfaction Relationship, Physical Health, Psychological Comfort, Work Efficiency and Social Acceptance. Table No 17 Shows The Result of ANOVA on Interaction Effect on Life Satisfaction of Various Groups of Types of Gender, Different Ages Groups and Types of Live in Area Shows That F Ratio for Types of Gender, Type of Ages and Types of Live in Area on Life Satisfaction is 0.073which is not Significant; therefore Null Hypothesis is Accepted that is There is no significant difference between level of Life Satisfaction in male and female with different ages of people in urban and rural area. It means there is no Significant Differences is found between Types of Gender, Types of Different Ages and different Types of Live in Area people in Life Satisfaction during the Unemployed Condition. By the Same Point of View Table No – 24 Shows that the mean Scores of Life Satisfaction among Types of Gender, types of Ages and different Types of Live in Area of people; Female Age Group of 18 to 25 Year is who live in Urban area is 96.605, Female Age Group of 18 to 25 Year is who live in Rural area is 96.098, Female Age Group of 26 to 33 Year is who live in Urban area is 97.000, Female Age Group of 26 to 33 Year is who live in Rural area is 97.487, Female Age Group of 34 and Above Year is who live in Urban area is 97.425, Female Age Group of 34 and Above is who live in Rural area is 97.487; Male Age Group of 18 to 25 Year is who live in Urban area is 95.050, Male Age Group of 18 to 25 Year is who live in Rural area is 93.949, Male Age Group of 26 to 33 Year is who live in Urban area is 94.225, Male Age Group of 26 to 33 Year is who live in Rural area is 93.325, Male Age Group of 34 and Above Year is who live in Urban area is 92.895, Male Age Group of 34 and Above is who live in Rural area is 91.750; It is Clearly Indicate that there is no Significant Difference Were between Life Satisfaction among Different Gender, Types of Ages and Types of Live in Area of people in Unemployed Condition. Here we can Say that among Different Gender, Types of Ages and different Types of Live in Area people have no problem of Life Satisfaction in Unemployed Condition, People cannot maintain Life Satisfaction even in Unemployed Condition. Different gender, Types of Ages and Types of Live in Area people cannot maintain Life Satisfaction in the Area of establishment of a Satisfaction Relationship, Physical Health, Psychological Comfort, Work Efficiency and Social Acceptance. CONCLUSION Summary and conclusion is very important in any research report of any study. But in the whole study, the last chapter is the most important part. The summary of the study is helpful in studying of the research, a very important in the short time of the research value of

A Study of Adjustment, Life Style and Life Satisfaction of Educated Unemployed Youth
© The International Journal of Indian Psychology, ISSN 2348-5396 (e)| ISSN: 2349-3429 (p) | 79
researcher. It is a tradition that a short glimpse of beginning to end is given in report of the study. Thus, this chapter is as important as other chapters. Adjustment 1. There is Significant Differences is found between Male and Female in Adjustment during
the Unemployed Condition. Here, Male Have Problem to Adjustment in Unemployed Condition in Compare to Female, Female Could Maintains Adjustment Even in Unemployment Condition.
2. There is No Significant Differences is found between Different Ages of people in Adjustment during the Unemployed Condition. Here Researcher Indicate that among Different Ages of People Do Not have any problem of Adjustment in the Unemployment Condition; people Could Sustained adjustment even in Unemployed Condition.
3. There is Significant Differences is found between Urban and Rural People in Adjustment during the Unemployed Condition. Here, Researcher Indicate that Urban People Have Less Problem to Do Adjustment in Unemployment Condition in Compare to Rural People, Rural People can’t do better adjustment even in Unemployed Condition.
4. There is No Significant Differences is found between Types of gender and different ages of people in Adjustment during the Unemployed Condition. Here, Researcher Indicate that Types of Gender And different Ages of People Do not have any problem of Adjustment in the Unemployed Condition; People can do better adjustment even in Unemployed Condition.
5. There is No Significant Differences is found between Types of gender and different Types of Live in Area people in Adjustment during the Unemployed Condition. Here, Researcher Indicate that Types of Gender and Different Types of Live in Area people Do Not Have Any Problem of Adjustment in the Unemployed Condition, People Could Do Better Adjustment Even in Unemployed Condition.
6. There is No Significant Differences is found between Types of Different Ages and different Types of Live in Area people in Adjustment during the Unemployed Condition. Here, Researcher Indicate that Types of Ages and different Types of Live in Area People Do Not Have Any Problem of Adjustment in the Unemployed Condition; People Could Do Better Adjustment Even in Unemployed Condition.
7. There is No Significant Differences is found between Types of Gender, Types of Different Ages and different Types of Live in Area people in Adjustment during the Unemployed Condition. Here, Researcher Indicate that Types of Gender, Types of Ages and different Types of Live in Area people Do Not Have Any Problem of Adjustment in the Unemployed Condition, People Could better adjustment even in Unemployed Condition.
Life Style 8. There is Significant Differences is found Between Male and Female in Life Style during
the Unemployed Condition. Here, Researcher Indicate that Male Have Problem of Life Style in the Unemployed Condition in Compare to Female, Female can Adjust Life Style even in Unemployed Condition.
9. There is No Significant Differences is Found Between different ages of people in Life Style during the Unemployed Condition. Here Researcher Indicate that Different Ages of

A Study of Adjustment, Life Style and Life Satisfaction of Educated Unemployed Youth
© The International Journal of Indian Psychology, ISSN 2348-5396 (e)| ISSN: 2349-3429 (p) | 80
People Do Not Have Any Problem of Life Style in Unemployed Condition; Any age groups of people can Maintain Life Style even in Unemployed Condition.
10. There is Significant Differences is Found between Urban and Rural People in Life Style during the Unemployed Condition. Here, Researcher Indicate that Urban People Have Less Problem to Maintain Life Style in Unemployed Condition in Compare to Rural People, Rural People can’t sustain Life Style even in Unemployed Condition.
11. There is Significant Differences is Found between Types of gender and different ages of people in Life Style during the Unemployed Condition. Here, Researcher Indicate that Types of Gender and different ages of people have problem of Life Style in the Condition of Unemployment any gender and any age group of people, People can’t maintain Life Style even in Unemployment Condition.
12. There is Significant Differences is found between Types of gender and different Types of Live in Area people in Life Style during the Unemployed Condition. Here, Researcher Indicate that among Types of Gender and different Types of Live in Area people have problem of Life Style in Unemployed Condition, People maintain Life Style even in Unemployment Condition.
13. There is No Significant Differences is Found between Types of Different Ages and different Types of Live in Area people in Life Style during the Unemployed Condition. Here, Researcher Indicate that among Types of Ages and different Types of Live in Area people have problem of Life Style in Unemployed Condition, People cannot maintain Life Style even in Unemployed Condition.
14. There is Significant Differences is Found between Types of Gender, Types of Different Ages and different Types of Live in Area people in Life Style during the Unemployed Condition. Here, Researcher Indicate that Types of Gender, Types of Ages and different Types of Live in Area people have problem of Life Style in Unemployed Condition, People cannot maintain Life Style even in Unemployment Condition.
Life Satisfaction 15. There is Significant Differences is Found between Male and Female in Life Satisfaction
during the Unemployed Condition. Here, Researcher Indicate that Male Have Problem of Life Satisfaction in Unemployed Condition in Compare to Female, Female are Satisfied with life even in Unemployed Condition.
16. There is No Significant Differences is Found Between different ages of people in Life Satisfaction during the Unemployed Condition. Here, Researcher Indicate that among different ages of people do not have any problem of Life Satisfaction in the Unemployed Condition.
17. There is No Significant Differences is Found between Urban and Rural People in Life Satisfaction during the Unemployed Condition. Here, Researcher Indicate that Urban People and rural people Have Less Problem to Maintain Life Satisfaction in Unemployed Condition,
18. There is Significant Differences is Found between Types of gender and different ages of people in Life Satisfaction during the Unemployed Condition. Here, Researcher Indicate that among Types of Gender and different ages of people have problem of Life Satisfaction in Unemployed Condition, People can’t maintain Life Satisfaction even in Unemployed Condition.
19. There is No Significant Differences is found between Types of gender and different Types of Live in Area people in Life Satisfaction during the Unemployed Condition. Here,

A Study of Adjustment, Life Style and Life Satisfaction of Educated Unemployed Youth
© The International Journal of Indian Psychology, ISSN 2348-5396 (e)| ISSN: 2349-3429 (p) | 81
Researcher Indicate that among Types of Gender and different Types of Live in Area people do not have any problem of Life Satisfaction in Unemployed Condition.
20. There is No Significant Differences found between Types of Different Ages and different Types of Live in Area people in Life Satisfaction during the Unemployed Condition. Here, Researcher Indicate that among Types of Ages and different Types of Live in Area people do not have problem of Life Satisfaction in the Unemployed Condition; People can maintain Life Satisfaction even in Unemployed Condition.
21. There is No Significant Differences is found between Types of Gender, Types of Different Ages and different Types of Live in Area people in Life Satisfaction during the Unemployed Condition. Here, Researcher Indicate that among Different Gender, Types of Ages and different Types of Live in Area people has no problem of Life Satisfaction in Unemployed Condition, People cannot maintain Life Satisfaction even in Unemployed Condition.
SUGGESTION As far as the present study is concerned, the findings have been summarized as above, with all the limitations of time, tools and sample available. The researcher admits that, much can be improved and still more can be added. However, instead of going in to ideal conditions and all-round improvements, the investigator would restrict him to the few suggestions for follow-up work. 1. The Study Can Be conducted from the point of view of Caste, Religious and etc. of
Variable with Gender, Live in Area and Ages. 2. The Study Can Be conduct According to the Family Income and social economic status
wise with above Variable with Gender, Live in Area and Ages. 3. The Study Can Be conducted from the point of view of social status and prestige of family
wise with above Variable with Gender, Live in Area and Ages. 4. The Study Can Be conducted from the point of view of Educational Qualification with
above Variable with Gender, Live in Area and Ages. 5. The Study Can Be conducted from the point of view of Marital Status with above Variable
with Gender, Live in Area and Ages. 6. The Study Can Be conducted from the point of view of Time Duration of Unemployment
with above Variable of Gender, Live in Area and Ages. 7. The Study Can Be conducted from the point of view of Monthly Income and Family
Expenditure in Month wise with above Variable of Gender, Live in Area and Ages. LIMITATION OF THE STUDY The abroad aim of any research is to make generalizations from the findings related to the sample and to apply these generalizations to the population or universe from which the sample is randomly drawn. This requires computation of parameters with appropriate statistical techniques. However, such aim of generalization in any research work has its own limitations by the statistics used and the procedure for selection of sample as well as sampling errors. For the present research the researcher has taken all the possible care and precautions to make most
A Study of Adjustment, Life Style and Life Satisfaction of Educated Unemployed Youth
© The International Journal of Indian Psychology, ISSN 2348-5396 (e)| ISSN: 2349-3429 (p) | 82
adequate statistical analysis and most representatives ‘selection of sample through randomization. Any way still at the same time the investigator is fully conscious of the limitations of the study, they are as under: 1. Part time job working people was not included. 2. All age was take as sample between 20 to 40 years. 3. Data Analysis was done by analysis of variance and correlation only. 4. Only Vadodara, Anand and Ahmedabad cities included for this research. 5. In Present Research Monthly Income and Family Expenditure was not considered as
independent variable. 6. Sample of the present research was not so large so result of the study research cannot be
generalized. 7. The Study was not considered as point of view of Caste, Religious and etc. of Variable
with Gender, Live in Area and Ages. 8. The Study was not considered as point of view of Time Duration of Unemployment with
above Variable of Gender, Live in Area and Ages. 9. To reach conclusive decision, the study may be reported with a few more aspects. 10. The Study was not considered as point of view of, Family Income and social economic
status, Educational Qualification and Family Social Status and Prestige of Family wise with above Variable with Gender, Live in Area and Ages.
11. The sample is selected from available Unemployment Centre and Interview Held in the industry.
IMPLICATION OF THE RESEARCH After the completed research every researcher found something in the study. This findings help to society or particular group of the people to improve in person or society. Here in the research researcher found that Significant Differences is existed between Male and Female in Adjustment during the Unemployed Condition, Here the male and female has to try to adjustment in each and every aspect of life during the unemployment condition, so that the restlessness can decrease up to certain level. Further thing are that to be Significant Differences is existed between Urban and Rural People in Adjustment during the Unemployed Condition, as said above in implication that Urban and Rural people get training for getting employment so that the adjustment level with every part life can make possible. Further implication of the study is that Significant Differences is existed between Male and Female in Life Style during the Unemployed Condition; definitely changes comes in life style during the unemployment but here at least the people has to take care about saving when they are earning or any other family member/s are earning so that when unemployment condition arise the life style can maintain. Further implication of the study is that Significant Differences is existed between Urban and Rural People in Life Style during the Unemployed Condition, in the urban area there are in family member/s or couple mostly in the 21st century both are earning so that the life style can be manage, but in the village there are only male are most of earning so that the expense of the family is not divided in to the family member that why the life style is

A Study of Adjustment, Life Style and Life Satisfaction of Educated Unemployed Youth
© The International Journal of Indian Psychology, ISSN 2348-5396 (e)| ISSN: 2349-3429 (p) | 83
changes. Further implication of the study is that Significant Differences is found between Types of Gender and Different Ages of People in Life Style during the Unemployed Condition. Further implication of the study is that Significant Differences is found between Types of Different Ages and different Types of Live in Area people in Life Style during the Unemployed Condition. Absolutely in the male and female life style has been change when they are unemployed and same for urban and rural people so that in the Indian concept people must have saving this saving can helpful them in the condition of unemployment. Further implication of the study is that Significant Differences is found between Types of Gender, Types of Different Ages and different Types of Live in Area people in Life Style during the Unemployed Condition; as researcher found in this research people must have an alternative way for earning so that they can survive easily in compare to depend upon only job. Furthermore to implication of the study is that Significant Differences is existed between Male and Female in Life Satisfaction during the Unemployed Condition. Definitely the life satisfaction level decrease when person are unemployed so that at this time person has to be maintain their personality, aggression level, anxiety level, emotion, isolation from the society, relationship maintain problems etc. so that Life satisfaction level can be uphold. There are an increasing number of young patients visiting psychiatrists for clinical depression caused by unemployment so this situation can be decrease. Further effect of the study is that Significant Differences is found between Types of gender and different ages of people in Life Satisfaction during the Unemployed Condition. In the male and female there are absolutely the differences come in the life satisfaction level because of employment; when person are unemployed than definitely life satisfaction level decrease, so that people has to earn and save some amount of money which can be used in the unemployment condition, and the level of life satisfaction level can be maintained. These are some of implication can be maintain and balance in the society so that these Adjustment, Life Style and Life Satisfaction level can be uphold, problems like adjustment, anger, anxiety, depressions, emotional problems, crime rate increasing, mental health problems, stress, suicides, blaming themselves, cardiovascular decease increasing, family support decreasing, isolation etc. can be decreased. Acknowledgments The author appreciates all those who participated in the study and helped to facilitate the research process. Conflict of Interests The author declared no conflict of interests.

A Study of Adjustment, Life Style and Life Satisfaction of Educated Unemployed Youth
© The International Journal of Indian Psychology, ISSN 2348-5396 (e)| ISSN: 2349-3429 (p) | 84
REFERENCES Arun Kumar Singh (1993). Tests, Measurement and Research Methods in Behavioural Science,
1st reprint 1993, Tata McGraw Hill Publishing Company Limited 4/12, Asaf Ali Road New Delhi-110002.
B. A. Parikh. Industrial Psychology, University GranthNirman board Ahmadabad Gujarat, India. C. B. Memoria& S. V. Ganekar, (2005). Personnel Management, text and cases, 25th edit. 2005,
Himalaya publishing house “Ramndoot”, Dr. Bhaleraomarg, gorgon, Mumbai-400004. Cathrynheyman (2016) ) revisited from [Sep. 8 2016]
cathrynheyman.com/pdfs/Life%20Satisfaction%20Survey.pdf Chest Journal (2016) revisited from [Sep. 8 2016]
chestjournal.chestpubs.org/content/101/1/26.full.pdf Dr. Garima Gupta &A N Sinha (2014) “Marital Adjustment and Psychological Well-Being
Differences in Working and Non-Working Female” The International Journal of Indian Psychology, Volume: 01, Issue: 03, ISSN 2348-5396, Page No- 61 to 72
Dr. Krishna J. Vaghela (2014) “A Comparative study of Marital Adjustment among Employed and Unemployed Married Women of Urban and Rural Area” The International Journal of Indian Psychology, ISSN 2348-5396, Volume 2, Issue 1, No-3, Oct to Dec 2014, Page No-35 to 40
Dr. ManjuKhokhar and Dr. Vibha Nagar (2014) “A Comparative study of Mental Health among Employed and Unemployed Young Technical Personnel” The International Journal of Indian Psychology, ISSN 2348-5396, Volume 2, Issue 1, No-02, Oct to Dec 2014, Page No - 13 to 16
Dr. S. M. Makvana (2007) “To Study the Role of Perceived Organizational Health in the Relationship of Work Involvement and Job Satisfaction in Different Organizations” Ph.D. Thesis, Department of Psychology, Sardar Patel University, Vallabh Vidha Nagar, Anand
Dr. S. M. Makvana (2014) “Marital Adjustment among Serving and Non-Serving Married Couples” The International Journal of Indian Psychology: Volume: 01, Issue: 03, ISSN 2348-5396, Page No- 6 to 14
Dr. Shashi Kala Singh (2014) “Life Satisfaction and Stress Level among Working and Non-Working Women” The International Journal of Indian Psychology: Volume: 01, Issue: 04 No.1, ISSN 2348-5396, July-September 2014, Page No - 115 to 122
Hiral Y Suthar and Dr. M. G Mansuri (2016) “Anxiety among Male and Female of High and Low Socio-Economic Status” The International Journal of Indian Psychology, ISSN 2348-5396 (e), ISSN: 2349-3429 (p) Volume 3, Issue 3, No.2, Page No - 06 to 08
J.P. Guildford (1965). Fundamental Statistics in Psychology and Education, 4th edit. 1965 McGraw Hill Books Company, New York.
Jain Ashika and Dr. S. M. Kanji (2015) “Mental Health of Employed and Unemployed People in Ahmedabad” The International Journal of Indian Psychology ISSN 2348-5396, Volume 2, Issue 3, No-1, April to June 2015, Page No-157 to 161
A Study of Adjustment, Life Style and Life Satisfaction of Educated Unemployed Youth
© The International Journal of Indian Psychology, ISSN 2348-5396 (e)| ISSN: 2349-3429 (p) | 85
K. Aswathapa (2007). Organizational Behavior, Text and Cases and Games, 7th revised edit. 2007, Himalaya publishing house “Ramndoot”, Dr. Bhaleraomarg, gorgon, Mumbai-400004.
KachchhiParvati (2014) “Adjustment Problem among working women and non-working women” The International Journal of Indian Psychology: Volume: 01, Issue: 03, ISSN 2348-5396, Page No- 138 to 140
KiranbenVaghela (2014) “Mental Health of Working and Non-Working Women in Ahmadabad” The International Journal of Indian Psychology, ISSN 2348-5396, Volume 2, Issue 1, Page No- 11 to 16
KiranbenVaghela (2014) “Mental Health of Working and Non-Working Women in Ahmadabad” The International Journal of Indian Psychology, ISSN 2348-5396, Volume 1, Issue 4, Page No - 53 to 58
MuddanagoudaPatil (2016) “Stress Level of Working and Non-Working Women” The International Journal of Indian Psychology, ISSN 2348-5396 (e), ISSN: 2349-3429 (p); Volume 3, Issue 2, No.4, Page No - 32 to 37
Mukesh Bhatt (2009). A Study of Life Satisfaction among Teachers and Engineers. Department of Psychology, Sardar Patel University, V V Nagar, anand Gujarat, India.
P. Subharao (2008). Personnel and Human Resource Management, text & cases, 2nd edit. 2008, Himalaya publishing house “Ramndoot”, Dr. Bhaleraomarg, gorgon, Mumbai-400004.
Psychservices.Psychiatryonline (2016) revisited from [Sep. 8 2016] psychservices.psychiatryonline.org/cgi/reprint/61/3/314.pdf
Schultz. P. Duane & Schultz. Ellen Sydney (2002). Psychology & Work Today, Sixth Edition, Mac Millan Publishing Company, New York, Pg 271-289.
ShodhGanga (2016) revisited from [Sep. 8 2016] shodhganga.inflibnet.ac.in Sonalba G Parmar (2014) “Mental Health and Marital Adjustment among Working and Non-
Working Women” The International Journal of Indian Psychology: Volume: 01, Issue: 04, ISSN 2348-5396, Page No- 64 to 69
Stephen P Robbins (2008). Organizational Behaviour, 13th edit. 2008 Prentice-hall of India private limited, New Delhi-110001.
Sunil Jadva and Dr. PankajSuvera (2014) “The Psychological Wellbeing among Hindu and Muslim Educated Unemployed People” The International Journal of Indian Psychology: Volume: 02, Issue: 02, February 2014, Page No - 01 to 08
Wikipedia (2016) revisited from [Sep. 8 2016] en.wikipedia.org/wiki/Employment
Yagnik L. R, Dhila B D, Chothani K. B., (2004), Research Methodology Akshar Publication Raipur Ahmadabad.
How to cite this article: R Parmar, S Makvana (2016), A study of Adjustment, Life Style and Life Satisfaction of Educated Unemployed Youth, International Journal of Indian Psychology, Volume 3, Issue 4, No. 77, ISSN:2348-5396 (e), ISSN:2349-3429 (p), DIP:18.01.068/20160304, ISBN: 978-1-365-51571-2