Embed Size (px)
Citation preview

The 2019th of Doctoral Thesis
A Study of a Credibility Assessment Method by Integrating Multiple Data
Sources
Ken HONDA Graduate School of Global Media, Komazawa University, Japan
Student No. 717201 Supervisor: Professor Naofumi Yoshida
Abstract. I herein introduce a study of a credibility assessment method by integrating multiple data sources to evaluate veracity of information on World Wide Web and social networking platforms. The credibility assessment technology is mainly using natural language processing or machine learning. In this method, I use the external and reliable information resources to derive credibility of information. To classify information veracity as true or false is difficult. Therefore, I consider that comparing target information with primary resources and sensor data to derive objectivity is effective for assessing information credibility. This method derives objectivity by matching with primary resources by natural language processing and integrating sensor data. This method is consisted two components. First, this method compares target information with multiple and reliable information resources to derive how match reliable resources offer same information as target information. Second, the method matching target information with sensor data includes temporal and spatial data. Finally, in this method, these two data are integrated to derive objectivity. In this paper, I show the credibility assessment model using objectivity by natural language processing and sensor data. This paper shows the feasibility and usefulness of the method through experiments. From the result of several experiments, an effectiveness of my method and concept is proved.
Keywords. Information Credibility, Credibility Assessment, Data Integration, Sensor Data, Objectivity, Rumor and Fake News

2
Index
1. Introduction 4 1.1. Research of Rumors 1.2. The Mechanism of Rumor 1.3. Classification of the Rumors 1.4. Credibility Assessment Techniques 1.5. Related Work 1.5. Proposal
2. A Concept of the Credibility Assessment Method by Integrating Multiple Data Sources 15 2.1. Model of Credibility Assessment
2.2. The Credibility Assessment System 2.3. Experiments 2.4. Consideration and Discussion
3. An Evaluation Model of the Credibility Assessment System 24 3.1. Evaluation of the Credibility Assessment System 3.2. Consideration and Discussion
4. A Sensor Selection and Learning Method for Credibility Assessment Using Sensor Data 27 4.1. An Overview of the Sensor Selection and Learning Method
4.2. An Operation Process of the Sensor Selection and Learning Method
4.3. The Details of the Sensor Selection
4.4. Experiments of the Sensor Selection

3
4.5. Consideration and Discussion
5. A Matrix Node Graph Data Structure and Its Application for Credibility Assessment with Temporal Transition of Intention 37 5.1. Two Meanings of Information
5.2. The Matrix Node Graph Data Structure
5.3. A Generation Method of the Matrix Node Graph
5.4. A Calculation Method of the Distance of the Matrix Node Graph
5.5. An Architecture of the Credibility Assessment System with the Matrix Node
Graph
5.6. Experiments
5.7. Consideration and Discussion
6. Conclusion 50 6.1. Summary
6.2. Future Work
§ Acknowledgement
§ Reference
§ Reference (Author Related)
§ Publications

4
1. Introduction
Owing to the progress being made in information technology and social media, almost anyone with online access can retrieve even the most obscure information, if it has been digitized. The availability of digital information has burgeoned thanks to the expanding World Wide Web (WWW, web), digitalization and digitalization efforts, and the growing popularity of social networking platforms. However, not all data are equal: coexisting online with readily accessible and irrefutable facts and figures is a vast profusion of misinformation, disinformation, rumor and fake news. The plethora of conflicting contradictory, inconsistent, and unsubstantiated information can make it difficult to differentiate what is real from what is not. There is a serious problem. In 2018, two people in Mexico were killed because of a rumor [90] when an unsubstantiated story about child abductions and organ trafficking spread through the social networking services (SNSs); two men who had been taken to jail for minor offenses unrelated in any way to the rumor were nonetheless burned to death by a mob who believed the rumors and did not even try to verify the truth. Thus, ambiguous, dubious, and even deliberately false information is easily spread when the collective agitation is increasing [75]. Similar rumors and fake news stories that spread across Facebook and WhatsApp (owned by Facebook) have incited fatal violence recently in India, Myanmar, and Sri Lanka: in June 2018, two men were beaten to death in the Indian state of Assam by a mob fueled by a similar rumor. Clearly, credibility assessment techniques are required to secure information authenticity. Certain situations are known to exacerbate collective agitation, such as times of political uncertainty and natural disasters. Since the latter occur frequently in Japan, I initially developed a An Implementation Method of Credibility Calculation System for Emergency such as Natural Disasters [98] that could calculate information’s degree of information credibility by comparing multiple primary resources and integrating sensor data. The original system could derive the objectivity of a piece of information that is, whether the sources were influenced by personal feelings or fact or a rumor. For the original credibility assessment technique, I focused on the particular domain of natural disasters. However, the rumor problem is pervasive, arising not only in emergencies, but in everyday web information curating services, including cooking recipes [94] and medical information [96]. Hence, this paper describes the credibility assessment techniques irrespective of information context.
1.1. Research on Rumors
Studying rumors and developing credibility assessments are complicated because they involve multiple domains and disciplines. Figure 1.1 shows an overview of some of the domains in the credibility assessment field, and in the following sections, I briefly explain their role in the history of credibility research.

5
Figure 1.1. An overview of the research field of credibility assessment.
Research on rumors is traditional in the fields of psychology, sociology, and journalism, although their methods and focuses differ, as is suggested by the bubbles at the bottom of Figure 1.1. This is the base knowledge of credibility assessment. Early research on credibility assessment mainly related to a war, racism, disasters, and other big issues and events, when rumors more often spread by word of mouth, and problems in communication and information transmission [23, 29, 62, 75, 78, 84], and it focused on the problem related to clarify mechanisms or characteristic and considered some solutions. The days when communication was largely restricted to face-to-face conversations, printed letters, newspapers, radio, and telegraph transmission are long past; rumor research today necessarily includes rumors promulgated by mass electronic media, and is a key part of social informatics, which is the study of tools for information sharing and communication in cultural and institutional contexts. For example, it seeks to clarify how people send information and get information on online and computer credibility in general [18, 19, 68]. Furthermore, information credibility is discussed as the context of the trust management [27, 72] as a kind of risk management on the internet or cloud environment. This paper discusses trust management as using one (of a combination) of four techniques: policy, recommendation, reputation, and prediction [72]. All four techniques are important for any field of information science, but key in the study of credibility assessment. Recently, there have been some attempts to verify the credibility of information by using information technology quantitatively that is, using information science focusing on four domains: databases, social computing, sensor networks and image processing (Figure 1.2).
The Research of Rumor
Information Science
Psychology�The Psychology of Rumor�The Disaster Psychology�The Cognitive Psychology
Sociology�The Mechanism of Rumor�The Tendency of Rumor�The Structure of Trust
Risk Management�The Trust Management
Journalism�The Fact Check
Risk Management�The Trust Management
Credibility Assessment�Detection�Tracking�Classification
Socio Informatics�Credibility in Computer�Rumor in Social Network

6
Figure 1.2. An overview of credibility assessment techniques in information science.
Actually, computer science, information science, and credibility assessment techniques are more complicated, and these are intricately intertwined; figure1.2 has been simplified to make it easy to understand the credibility assessment field, which includes the four fields of computer science techniques shown as the main focuses for credibility assessment. With the rapid growth of social network platforms, the credibility assessment field has become more active. In 2016, the phrase “fake news” became mainstream in the run-up to the 2016 US presidential election [31]. Its repeated use and exponential increase in the phenomenon itself have triggered an increase in interest in credibility assessment and “fake news” [4, 32, 69, 45]. Credibility assessment requires understanding the base knowledge from not only the information science perspective but from the psychological and sociological perspectives. Credibility assessment is required for a multifaceted knowledge of media, and it has become an increasingly important research theme in the global media, including such electronic media domains as communication, information transmission, and information science.
1.2. The Mechanism of Rumor
This section describes the characteristics of rumor and its problems. Studies on information credibility abound, focusing on rumor and fake news in the fields of human communication from the perspectives of psychology and sociology [57, 74, 84]. These includes some definitions of rumor and its mechanisms. The psychological definition of the rumor put forth by G. W. Allport and Leo Postman (1952) follows: “A rumor, as we shall use the term, is a specific (or topical) proposition for belief, passed along from person to person, unusually by word of mouth without secure standards of evidence being present” [29]. They also formulated the mechanism of spreading a rumor as follows “R = i * a,” which posits that the degree to
Information Science
Credibility Assessment Techniques
Sensor Network�Sensor Data�Activity Recognition�Social Sensor �Machine Learning�Geographic
Social Computing�Language Processing�Social Data Analysis�Machine Learning
Image Processing�Machine Learning�Deep Learning�Deep Fake
Database�Information Retrieval�Data Collection�Machine Learning�Data Structure for Rumor
7
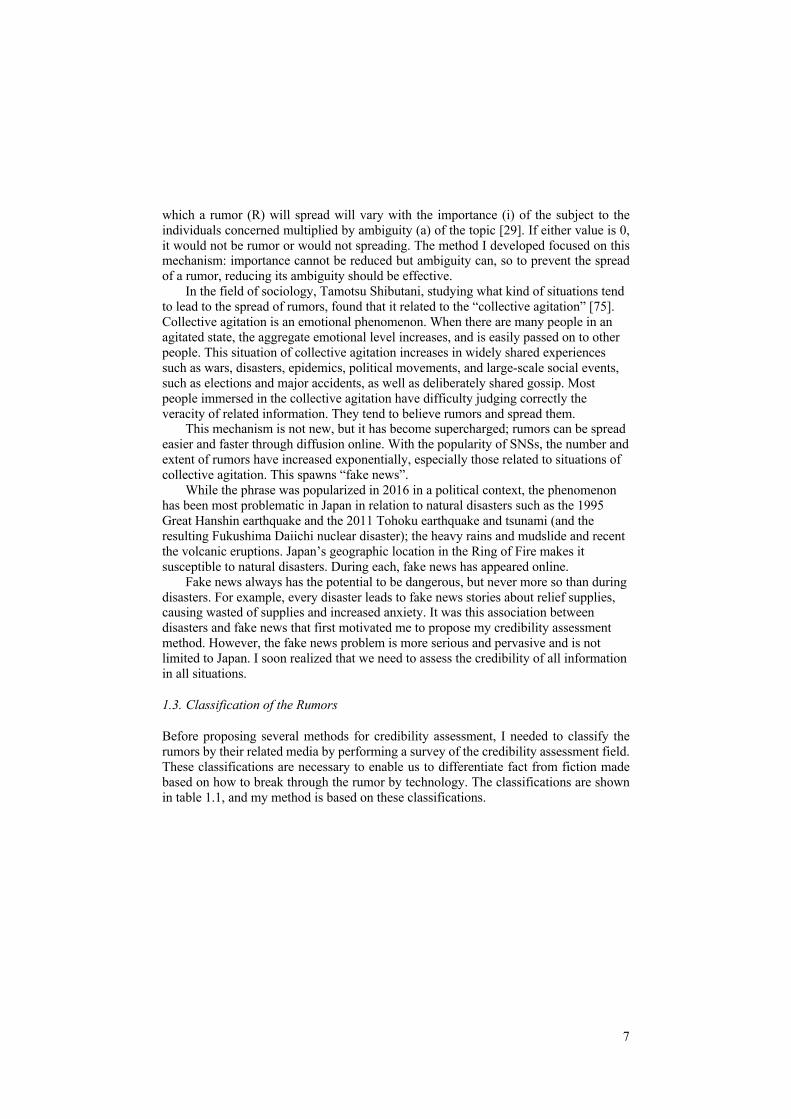
which a rumor (R) will spread will vary with the importance (i) of the subject to the individuals concerned multiplied by ambiguity (a) of the topic [29]. If either value is 0, it would not be rumor or would not spreading. The method I developed focused on this mechanism: importance cannot be reduced but ambiguity can, so to prevent the spread of a rumor, reducing its ambiguity should be effective. In the field of sociology, Tamotsu Shibutani, studying what kind of situations tend to lead to the spread of rumors, found that it related to the “collective agitation” [75]. Collective agitation is an emotional phenomenon. When there are many people in an agitated state, the aggregate emotional level increases, and is easily passed on to other people. This situation of collective agitation increases in widely shared experiences such as wars, disasters, epidemics, political movements, and large-scale social events, such as elections and major accidents, as well as deliberately shared gossip. Most people immersed in the collective agitation have difficulty judging correctly the veracity of related information. They tend to believe rumors and spread them. This mechanism is not new, but it has become supercharged; rumors can be spread easier and faster through diffusion online. With the popularity of SNSs, the number and extent of rumors have increased exponentially, especially those related to situations of collective agitation. This spawns “fake news”. While the phrase was popularized in 2016 in a political context, the phenomenon has been most problematic in Japan in relation to natural disasters such as the 1995 Great Hanshin earthquake and the 2011 Tohoku earthquake and tsunami (and the resulting Fukushima Daiichi nuclear disaster); the heavy rains and mudslide and recent the volcanic eruptions. Japan’s geographic location in the Ring of Fire makes it susceptible to natural disasters. During each, fake news has appeared online. Fake news always has the potential to be dangerous, but never more so than during disasters. For example, every disaster leads to fake news stories about relief supplies, causing wasted of supplies and increased anxiety. It was this association between disasters and fake news that first motivated me to propose my credibility assessment method. However, the fake news problem is more serious and pervasive and is not limited to Japan. I soon realized that we need to assess the credibility of all information in all situations.
1.3. Classification of the Rumors
Before proposing several methods for credibility assessment, I needed to classify the rumors by their related media by performing a survey of the credibility assessment field. These classifications are necessary to enable us to differentiate fact from fiction made based on how to break through the rumor by technology. The classifications are shown in table 1.1, and my method is based on these classifications.

8
Table 1.1. Classification of rumors by type and assessment method.
The Type of Rumor Description
1 Text Processing Type These rumors can be assessed by comparing with primary resources through text processing.
2 Image Processing Type
These rumors are image-based (doctored photos, real photos incorrectly associated with inappropriate events or circumstance,
etc. and must be assessed by evaluating the images and their sourcing or processing.
3 Sensor Using Type
These rumors concern real-world events that can be observe by quantitative, empirical evidence sensors, such as the details of disasters, weather, similar occurrence, and can be assessed by
referring to sensor data.
4 Impossible Type These rumors are about opinions, predictions, or hearsay; it is impossible to assess their credibility.
As shown in this table, I created four classifications or types of rumors. Rumor Type 1. The first one is the text processing type; the credibility of this type of rumor can be assessed by only language processing. Examples of this type of rumor would be, “The credit association is in danger of going bankrupt,” “Iwate prefecture accepts supplies from individuals,” and “Asian restaurant using human labor is closed” are exist. These are all actual rumor. However, these rumors can assess by comparing with primary resources through text processing. Rumor Type 2. Next is the image processing type of rumor. For example, the information might communicate that “because of the earthquake, a lion escaped from the zoo” and show an image in which a lion walks through a town. However, the same image might include foreign text even though it purports to be about Japan. This type of rumor must be assessed by analyzing the image for inappropriate sourcing or attribution (real photo, wrong place or time) or doctoring (content manipulation through digital retouching with a program like “PhotoShop”). Rumor Type 3. Third is the sensor using type. Some real-life examples include “poisonous gas escaped,” “poisonous rain fell,” and “a fire occurred in the nuclear power plant.” The credibility of these bits of information can be assessed by comparing them with recorded sensor data, when it exists. Rumor Type 4. The fourth type of rumor is impossible to assess for credibility because, it is subjective, invented, imagined, hearsay, or otherwise not quantifiable, such as individual’s opinion or a prediction of future. Examples might be, “a massive earthquake will occur three hours later” or “my grandson died during the demonstration.” These are too specific and too individual to be easy assessed for credibility. Credibility assessment techniques must change depending on these types of rumor being evaluated. In this proposal, my method addresses Types 1 and 3. These rumor classification were used to determine the best approach to rumor assessment using technology.

9
1.4. Credibility Assessment Techniques
Any system used to assess credibility is called a “credibility classification system” [14]. However, I call my method a “credibility assessment system” because it does more than just classify rumors. According to Zubiaga, Aker, Bontcheva, Likiata, and Procter (2018), a credibility classification system consists of four components [14]. The first is the rumor detection. Rumor-detection techniques are concerned with how to distinguish rumors from facts, how to find rumors, and how to detect some events in the physical world through software. The second component is the rumor tracking. Rumors are always changing and spreading; stopping the spread of rumors requires tracking techniques to monitor how a rumor is spreading and changing. The third component is rumor stance classification. After detection and tracking comes the credibility assessment would be processed; the rumor stance classification technique is intended to classify the attribution of the rumors (i.e., original rumor, supporting rumor information, and denials). The last component is the rumor veracity classification. This technique directly verifies the veracity of information and lets people penetrate rumors. Figure 1.2 shows the four components of the credibility classification system and the credibility assessment flow.
Figure 1.3. Four components of the rumor classification system.
These four components are individual techniques. However, to establish the rumor classification requires a system that integrates all four. Among these, my method contributes to rumor tracking and veracity classification and uses general classifications in credibility assessment. Furthermore, my method also covers data integration as a means of credibility assessment.
The Rumor Detection
The Rumor Tracking
The Rumor Stance Classification
The Rumor Veracity Classification

10
1.5. Related Work
This section describes previous related work and the state of the art of the credibility assessment technology. Nowadays, the main focus of information-credibility studies is on social networking platforms due to the unprecedented extent to which they have changed human communication. This has been true across the spectrum of disciplines. General analytical studies. In information science, analytical studies on information credibility remain a common topic in credibility assessment. For example, Zubiaga et al. [14, 15] tried to clarify the meaning of credibility and understand why people spread rumors. They produced a general survey of credibility studies and credibility assessment techniques [14] and analyzed social media users to develop a credibility assessment system using machine learning [15], proposing a methodology to collect, identify, and annotate rumors after analyzing 330 rumor datasets. Boididou, Papadopoulos, Kompatsiaris, Schifferes, and Newman (2014) surveyed challenges of credibility assessment techniques [20]. Maddock et al. (2015) analyzed four types of rumors to clarify the origin, changes over time, and relationship among different types of rumor behavior [38]. Metzger et al. (2007, 2013, 2016) investigated about cognitive heuristics and literacy field in credibility assessment [48, 49, 50], and they also investigated the potentially dubious nature of online information and the ability of college students to evaluate it [49, 71]. In the paper [56], the method that evaluate social media information is proposed. Diakopoulos, Choudhury, and Naaman (2012) proposed a method based on the context of the journalism for evaluating social media information [56]. Fogg et al. (1999, 2002) examined the credibility of computers and the elements of that credibility [18, 19, 68]. Specific-platform studies. In addition to those studies, which were the analytical studies of information credibility in general information science, there have been analyses of credibility on specific platforms such as micro blogs. Kang (2010) and Uchino (2013) both provided analytical research on credibility and communication in micro blogs [51, 77]. Flanagin and Metzger (2007) analyzed web credibility by focusing on the user attribution and site features to clarify the relationship between these two elements [7]. Babaker and Moy (2016) discussed how to apply existing technology in fact checking [46]. Kasperson et al. (1988) developed a conceptual framework for risk analysis relative to information transmission [61]. Kwak, Lee, Park, and Moon (2010), explored whether Twitter was a social network or news media [32]. Finally, Dang et al. (2016) collected the activity and post data from SNSs to examine the tendency of rumors to spread; they also developed an analytical, visual framework of rumor spreading [2, 3]. These are the analytical studies of information credibility. They established the fundamental knowledge of information credibility research in the information science field. Dataset studies. The important challenges in this field have been how to collect and how to make datasets. To illustrate the importance of evaluating the production of data, Driscoll and Walker (2014) proposed an evaluation method that clarified how the data were collected, stored, cleaned, and analyzed as an evaluation method for data collection and preprocessing [42]. Other studies have provided insights into efficient rumor datasets [47, 80, 81]. Dia and Becker (2016) generated a training corpus for stance classification using machine learning [47], while Quazvinian, Rosengren, Radev, and Mei (2011) and Ferreia and Vlachos (2016) made large-scale dataseta of microblog and digital journalism [80, 81]. Finally, the PHEME project (2018) made rumor and non-rumor datasets from various cases [93].
11
Linguistic studies. Wawer, Nielek, and Wierzbicki (2014) and Chua and Banerjee (2016) focused on the linguistic features, with the former [12] approaching information credibility by text mining and the latter [13] analyzing the text to verify relevance of linguistic features in evaluating the veracity of information based. Technical machine-learning studies. There are technical studies of credibility assessment. Balcerzak, Jaworski, and Wierzbicki (2014) proposed an expansion of the PageRank algorithm called the TextRank algorithm for analyzing Web information credibility using natural language processing (NLP) [16]. Lukasik et al. (2016) developed an automated, supervised classifier that used multitask learning to classify rumors by using the Gaussian process [52]. Finally, Gencheva, Nakov, Marquez, Barron-Cedeno, and Koychev (2017) created a new corpus of political debates, training machine learning models to predict which claims should be prioritized for fact checking [59]. Other studies have examined rumor stance classification using deep learning. Kochikina, Liakata, and Augenstein used an LSTM-based sequential model to classify Twitter posts; long short-term memory (LSTM) is an artificial recurrent neural network (RNN) architecture used in the field of deep learning [26]. Chen, Liu, and Kao (2017) classified rumors by applying a convolutional neural network [82]. Thus, credibility assessment techniques have employed machine learning and deep learning algorithms. Assessment technique studies. Regardless of methodology, credibility assessment techniques include some essential elements, and these have been the focus of numerous studies. For example, there have been a number of studies on rumor detection, the first step of credibility assessment techniques. As representative, Ma, Gao, and Wong (2017, 2018) used tree-structured neural network models for automatic rumor detection [36, 37]. Joshi and Bilare (2017) used event-based rumor detection to identify rumors associated with real-world events spread through social networking service [8]. (Note: in the credibility assessment field, social media or microblog usually indicates Facebook or Twitter.) Hamiian and Diab (2015) also clarified rumors on social media using rumor dataset [63]. Yang, Yu, Liu, and Yang (2012) applied a rumor-detection method previously used on Twitter to China’s on SNS, Weibo, applying existing techniques for different social media [28]. Cai, Wu, Lv (2014) also analyzed text data on Weibo. They provide a data-collection method and analyzing method of text and user attribution through clustering [30]. Mizumo et al. (2015) evaluated Japan’s disaster-information-analysis system DISAANA, propping the attribution of sender information in microblogs to identify which users tend to spread misinformation or disinformation [35]. Zhao, Resnick, and Mei (2015) focused on a topic of specific posts and its time series change [89]. Stance-classification studies. The rumor classification includes two types of classification, stance classification and the veracity classification. There have been studies on both. Aker, Derczynski, and Bontcheva (2017) classified Twitter data automatically by using three classifiers (decision tree, random forest, and instance-based) using a k-nearest neighbors (k-NN), non-parametric method used for classification and regression [1]. Umejima, Miyabe, Aramaki, and Nadamoto (2011) focused on sender’s attributions, analyzing Twitter information and their relation to the sender [11]. To perform stance verification, Patra, Das, and Bandyopadhyay (2016) used a support vector machine (SVM), a supervised machine learning model with an associated learning algorithm [17]. Other stance classification studies include those by Flanagin and Metzger (2008), Du, Xu, He, and Gui (2017), and Lukasik, Cohn, and Bontcheva (2015) [6, 34, 54]

12
Veracity-assessment studies. Other studies have focused on veracity classification techniques [5, 44, 70, 86, 87]. For example, Gupta, Kumaraguru, Castillo, and Meier (2014) proposed a real time web-based credibility assessment system they called TweetCred that calculate a credibility score for Twitter data by using SVM [5]. It applied to web users. Yamamoto and Tanaka (2010) proposed a model for analyzing the credibility of web information using data pairing to evaluate supportive data [87]. I have mentioned only the representative credibility studies and have greatly simplified them for this paper. They nearly all include several elements and are complicated, and explaining them fully would require significant space without necessarily adding anything substantive that will not be touched on elsewhere in this paper. Those I have chosen to include were selected to highlight only main purpose of each. However, in developing my own approach, I considered all their findings and implications.
1.6. Proposal
If the intension is to identify and counter rumors and ensure reliability of information, it is necessary to consider how to incorporate the mechanisms of rumor generation and dissemination into the credibility assessment system. As I hinted earlier, I focused on ambiguity in rumors. It is difficult to judge information in binary fashion—that is, as being a rumor or not—since most rumors contain some element of truth or else they do not convince believers and gain traction. A credibility assessment system should not adjudge the veracity of information. Rather, it should provide a basis for the information to be judged as rumor or non-rumor. That is, it should provide objectivity. In this context, objectivity is the degree to which a subject of the rumor is removed from the source of particular information [24, 39]. To stop the spread of rumor, clarifying objectivity is effective in the information-gathering process. However, the wider a rumor has spread, the more plausibility is perceived. Therefore, if there are multiple repetitions of the same information it does not mean that it have a high level of objectivity. It is important to compare particular pieces of information with primary resources. Furthermore, comparing that information with sensor data (when possible) is critical for securing objectivity. Using multiple data sources helps clarify objectivity. To assess information credibility, I propose A Credibility Assessment Method by Integrating Multiple Data Sources. The essence of this method is using multiple data sources to derive objectivity when the system assesses credibility. This method compares target information (the information to be assessed for credibility) with primary resources and sensor data. After these comparisons, the assessed value is integrated to determine overall credibility and ensure objectivity. Figure 1.4 provides an illustration of the conceptual summary of my method. The base concept of this method is assessing credibility through collective intelligence [39]. I use objectivity to indicate credibility based on collective intelligence.

13
Figure 1.4. A credibility assessment method using integrating multiple data sources.
Although the term itself is an oversimplication of the process, reasoning is how this method derives the objectivity, and this must be incorporated information retrieval systems or social networking platforms because the people who need to verify the credibility of information will usually not do so if this requires much effort. People who spread rumors do not try to verify the information’s credibility first. Therefore, this method should be incorporated into existing technology so that all users are somehow required to assess the credibility before sharing. The primary contribution herein is the proposal of a new method for information retrieval and credibility assessment that integrated multiple data sources. It is directly related to my previous work, including An Implementation Method of Credibility Calculation System for Emergency Such as Natural Disasters [98]. This new proposal A credibility Assessment Method by Integrating Multiple Data Sources includes one evaluation model and two methods. The evaluation model originally was proposed in my article An Evaluation Model of Credibility Calculation System for Natural Disasters [99], a general evaluation model of a credibility assessment system. One of the methods was first discussed in my paper A Sensor Selection and Learning Method for Credibility Assessment Using Sensor Data [100], which described how to select sensor data from the web. The second method I first discussed in my paper A Matrix Node Graph Data Structure and Its Application for Credibility Assessment with Temporal Transition of Intention [101], and main method of deriving objectivity. Figure 1.5 shows the scope that my method covers. These are the language processing with new data structure for rumor, sensor data and its integration method, and general evaluation model of credibility assessment techniques.
World Wide Web
Social Network Platform
Sensor DataPrimary Resources
TargetInformation
World Wide Web
RSS Open Sensor
Integrate
Objectivity
Credibility Assessment System
Query
Answer

14
Figure 1.5. Scope covered by my method.
The novelty of my method is two-fold. First, this method can be realized by the reasoning to determine the credibility of information and is thus important for the credibility assessment techniques because information credibility is a problem of the human perception [68]; that is, it is impossible to decide information credibility using only 0 or 1, since many rumors contain a kernel of truth. It is necessary to derive objectivity using reasoning to determine how much credibility the target information has. Secondly, this method can derive objectivity by using and integrating multiple data sources: more sources, each compared and assessed, helps explain the credibility.
Credibility Assessment Techniques
Sensor Network・Sensor Data [100]・Activity Recognition・Social Sensor ・Machine Learning・Geographic
Social Computing・Language Processing [101]・Social Data Analysis・Machine Learning
Image Processing・Machine Learning・Deep Learning・Deep Fake
Database・Information Retrieval・Data Collection・Machine Learning・Data Structure for Rumor [101]
Evaluation Model [99]

15
2. A Concept of the Credibility Assessment Method by Integrating Multiple Data Sources
In this section, I introduce the concept of the Credibility Assessment Method by Integrating Multiple Data. This is the general method for information retrieval system, SNS and the credibility classification system. This concept is based on An Implementation Method of Credibility Calculation System for Emergency such as Natural Disasters [98]. Figure2.1 shows the concept of the Credibility Assessment Method.
Figure 2.1. The concept of the credibility assessment method.
In this method, I use multiple data sources. There are two types of data sources are used. First one is primary resources. Primary resources are reliable information resources. For example, the press agency and the ministry. These organization has information that is collected by coverage as primary resources. However, primary resources are always not secure reliability. Therefore, it is important to collect data from various organizations. Second one is the sensor data. Data sources should be kept the diversity. The primary resources can be used for assessment in text data by NLP. The sensor data would be used to get physical data by real world. Integrating these two data sources, the credibility assessment system can derive objectivity more precisely. The credibility assessment flow is explained by the concept of credibility assessment method (Figure 2.1). When the target information is inputted to the system, the target information is compared with data sources such as primary resources and sensor data. In advance, the system collected primary resources from Rich Site Summary (RSS) and sensor data from open data. These data are stored to the database in the system. Then, the target information is compared to primary resource and sensor data. The method of comparing with primary resources is applied by NLP. On the other hand, the method comparing sensor data depends on what sensor data used. Finally, the
Target Information
Credibility Assessment System
Spread with Plausibility
Fact
Rumor
InformationTarget Information( Fact or Rumor )
Primary Resources
Sensor Data
Objectivity

16
system calculates how data sources matching with the target information and outputs the result.
2.1. Model of Credibility Assessment
In this section, I will introduce the calculation model of the Credibility Assessment Method by Integrating Multiple Data Sources. To assess credibility, there are two phases of calculations to derive objectivity. First is the matching with the primary resources by NLP. Second is the matching with the sensor data. In this model, the credibility (C, Credibility) is calculated from deriving objectivity of primary resources (Op, Objectivity p) and integrating objectivity of sensor data (Os, Objectivity s). The system output the result of multiply Op by Os as C. However, Os is not always integrated. A sensor is referred when the trigger words in dictionary includes in the target information. This formula is the definition of the model of the credibility assessment.
𝐶 = #𝑂𝑝
𝑂𝑝 × 𝑂𝑠(𝑤ℎ𝑒𝑟𝑒𝑡𝑟𝑖𝑔𝑔𝑒𝑟 = 1)
(1) Op is the objectivity that is derived by NLP. Which NLP method to use is arbitrary. This formula is the general model of integrating data sources. It needs to calculate Op and Os. I will show the definition of calculating Op.
𝑂𝑝 =3 𝑓(𝑚)!
"$%
(2) The matching function f(m) is applied to primary resources in the database. The matching function m is also chosen arbitrary. This formula is applied to phase one that matching with primary resources. As the example, I show the simple function as the matching function of primary resources.
𝑚 =𝑚!
𝑙"# × 𝑙$#
(3)
The matching value of target information with primary resources is calculated by this formula. The matching word (mw) is divided by multiplied value of word count of primary resources (lp, length of primary) by word count of target information (lti, length of target). These are the definition of deriving objectivity from primary resources. Then, if sensor data is not required, only this calculation would be applied. The situation which sensor data is not needed is when the target information does not include the word that stored trigger word in dictionary. Or when a sensor does not observe any events. Next is the definition of deriving objectivity from integrating sensor data. To integrate sensor data to Op, I need to calculate Os. The objectivity value that derived

17
from sensor data is 0 or 1. The value shows only the sensor was actuated or not. Furthermore, Os includes temporal and spatial information. The temporal information (St, sensor timestamp) is when the sensor observed the event. The spatial information (Sl, sensor location) is where the sensor observed the event.
𝑂𝑠 ∋ (𝑆! , 𝑆") (4)
The temporal information St supports event occurrence when the event occurrence time by target information (Et, event time) is within a threshold (time) as comparting with the actual event occurrence time (Rt, real time).
𝑆𝑡 = #1(𝑤ℎ𝑒𝑟𝑒|𝐸& − 𝑅𝑡| ≦ 𝑡𝑖𝑚𝑒0(𝑜𝑡ℎ𝑒𝑟𝑤𝑖𝑠𝑒)
(5) Same as the temporal information, the spatial information Sl supports event occurrence the event occurrence location by target information (El, event location) is within a threshold as comparing with the actual event occurrence location (Rl, real location). When the El falls between the actual event occurrence location Rl and an arbitrary distance (range) as a threshold, the value of sensor data is integrated. In this formula, the distance between El and Rl are shown as D (distance).
𝑆' =#1(𝑤ℎ𝑒𝑟𝑒𝐷 ≦ 𝑟𝑎𝑛𝑔𝑒)
0(𝑜𝑡ℎ𝑒𝑟𝑤𝑖𝑠𝑒)
(6)
Only when the temporal and spatial information is matched, the value of sensor data (Os) would be 1. The sensor value is always integrated as 0 or 1 because it is assumed that there are sensors that does not observe temporal or spatial information depending on the types of sensor. When the sensor data is required to credibility assessment, sensor data is referred, and Op would be multiplied by the sensor value as 0 or 1.
2.2. The Credibility Assessment System
To show the usage of the credibility assessment model by integrating multiple data sources, I implement the prototype of the credibility assessment system. And I show the procedure of credibility assessment by following steps. Figure2.2 shows the procedural of credibility assessment. These processes are applied by based on the model that is proposed in previous section.

18
Figure 2.2. Procedural of credibility assessment.
Step1. Data Collection: First of all, the system collects two types of data. First one is data from primary resources. Second one is sensor data from open data. As a primary resource, the system collects RSS data of news. It includes the headline, main text, timestamp and location. Not only one resource, but also several resources of news to secure objectivity. As a sensor data, the system collects the disaster sensor, the weather sensor, some smart sensor in traffic information and social sensor that can get event information from SNS. Step2. Preprocessing and input: Next step, the target information is inputted. It includes the main text, timestamp and location. Then, preprocessing is applied to the main text of the target information. The preprocessing is the normalization, the text cleaning and easy context analysis. When preprocessing is applied, if the text is future tense or hearsay form, credibility assessment process would be quit. Because the credibility of these form is obviously low. Step3. Compare with data sources: Then, the system derive objectivity by comparing primary resources. Then, the target information requires the sensor data, the value of sensor is integrated. My method is about integration method. Therefore, the matching method with primary resource by NLP can be changed arbitrary. In current implementation, the system evaluates whether the target information include matching word with primary resources. Then, if the target information includes the trigger word of sensor, the system would refer sensor data. The system has the dictionary that stores the trigger word of sensor. For example, if the target information includes “intensity”, this word is related to earthquake. The system refers the earthquake sensor. When the sensor data would be integrated, temporal and spatial information of sensor is also integrated. Then the value of matching with primary resources is multiplied the value of sensor as 1 or 0. Therefore, the value of matching with primary resources would be objectivity. If the sensor would not observe event in spite of the sensor data is needed, 0 multiplied for the matching value with primary resources. And if the temporal and spatial information would not match with timestamp and location of the target information, it also multiplied 0 for the result. Step4. Assess Credibility: Based on the calculation model, the system processes credibility assessment. Final credibility is outputted from 0 to 1. The more the value will close to 1, the more credibility is high. This value is the credibility of the target information. Then the credibility means whether how degree of objectivity is in the target information. The important point of this value is that this value is outputted just as an indicator of the objectivity. It is not judging whether the target information is true or false. When the system outputs the final credibility, the system also outputs actual data of high matching to give opportunity of information gathering for users.
Primary Resources
Sensor Data
Credibility Assessment System
Step1. Data collection from WWW. Step2. Preprocessing the text and input the target information.
Step3. Compare with data spurces.
Step4. Assess Credibility (Objectivity).

19
2.3. Experiments
In this section, I show the feasibility and usage of the credibility assessment system through experiments. And I evaluate the effectiveness of my method. In these experiments, I use the prototype system for experiments. Then, I will introduce about the environment of experiments. As the dataset of primary resources, the system collects the disaster information from Japan meteorological agency, the headline of news agency and the headline of Yahoo! News. These data are stored in the database in the system in advance. As the sensor data, the system collects [92], and the weather data from OpenWeatherMap. These two sensors are used for the indicator of the events such as earthquake or flood. However, these sensors do not have temporal and spatial information, therefore, I use only temporal-spatial data from Japan meteorological agency as sensor. It because temporal-spatial data cannot be obtained from above sensors due to the characteristic of the sensor. And the dataset of the target information is here. Actually, all dataset is Japanese.
Table 2.1. The list of the target information
1 Group of thieves are haunt. 2 A fire broke out in Tokyo. 3 The earthquake that seismic intensity 5 is occurred. 4 Heavy rain occurred near Setagaya city.
The target information no.1 is the rumor. No.2 has one high matching data with primary resources. And No.3 and No.4 have several matching data with primary resources. Experiment 1. Derive objectivity by Language Processing: In the experiment1, I verify whether the system can match the target information with primary resources. And whether the system can derive objectivity by matching with primary resources. In this experiment, sensor data is not referred and integrated. In experiment1 I use the target information no.1 and no.2. First time, in the experiment 1-1, the target information no.1 is inputted. The result of first experiment is shown in table 2.2.

20
Table 2.2. The result of experiment 1-1.
Target Information Primary Resources Matching
Value Sensor Data Ratio
Group of thieves are haunt.
Viennese Authorities said, “There are danger of attack in European capital for the new year”.
0 - 0
The prime minister of Japan played golf for the first time in three months.
0 - 0
National high school rugby tournament opened. 0.0008 - 0.0008
An apartment fire broke out in Tokyo. One man died. 0 - 0
Pope urged abolition of death penalty. 0 - 0
A tunnel fire occurred in Hakodate. Operational suspension continues.
0 - 0
In table 2.2, the “Target Information” is the inputted data. The “Primary Resources” is the collected data in database from headline of primary resources. The “Matching Value” is the value that derived only language processing. The “Sensor Data” is the value that collect from any sensors. When some events observed by sensor, it indicates 1 and when some events are not observed, it indicates 0. However, in this experiment, sensor is not referred. And the “Ratio” is the objectivity. It is integrated “Matching Value” and “Sensor Data”. Therefore, it means the final credibility of information. By this table, the target information is not matched with primary resources in database. Therefore, the ratio is low. Only when postpositional particle match, the ratio would be a little bit high. Secondly, the target information no.2 is inputted. Table 2.3 shows the result of second experiment.

21
Table 2.3. The result of experiment 1-2.
Target Information Primary Resources Matching
Value Sensor Data Ratio
A fire broke out in Tokyo.
Viennese Authorities said, “There are danger of attack in European capital for the new year”.
0.00138 - 0.00138
The prime minister of Japan played golf for the first time in three months.
0 - 0
National high school rugby tournament opened. 0 - 0
An apartment fire broke out in Tokyo. One man died. 0.00476 - 0.00476
Pope urged abolition of death penalty. 0.00033 - 0.00033
A tunnel fire occurred in Hakodate. Operational suspension continues.
0.00142 - 0.00142
The target information no.2 has any matching information. Therefore, there are some high matching values in table 2.3. This target information is about fire. Therefore, same topic primary resources get higher matching value. In this experiment1, I could verify whether the target information could match with primary resources by language processing. Experiment 2. Integrating sensor data: In experiment2, in addition to primary resources, the sensor data is integrated. In current, two sensors are connected to the system. They are the earthquake sensor and the weather sensor. If the target information includes the earthquake trigger word that stored the dictionary in the system, the system refers the earthquake sensor. If the target information includes the weather trigger word, the system refers the weather sensor. In this time, huge earthquake and any damage from flood is not occurred, I set threshold low. The system get value from earthquake sensor when the earthquake sensor observe intensity 1. And the system get value from weather sensor when it observed cloudy. In same, the threshold of timestamp is set to an error of 3 days. First experiment is used the target information no.3. This experiment is about the earthquake sensor. In this time, the timestamp of the target information is set as “2015-12-24”. The spatial data is processed by language processing. The result of experiment 2-1 is shown in table 2.4.

22
Table 2.4. The result of experiment2-1.
Target Information Primary Resources Matching
Value Sensor Data Ratio
2015-12-24 The earthquake occurred at Miyagi prefecture. The intensity is 5.
2015-12-24 17:13 The earthquake occurred at Miyagi prefecture. The intensity 1.
0.00093 1 0.00093
2015-12-22 21:35 The earthquake occurred at Nagano prefecture. The intensity 1.
0.00091 0 0
2015-12-22 20:12 The earthquake occurred at Iwate prefecture. The intensity 3.
0.00087 0 0
2015-12-22 07:40 The earthquake occurred at Ibaraki prefecture. The intensity 2.
0.00091 0 0
2015-12-18 01:06 The earthquake occurred at Hokkaido prefecture. The intensity 1.
0.00089 0 0
2015-12-17 18:11 The earthquake occurred at Miyagi prefecture. The intensity 2.
0.00085 0 0
In this result, the target information and all primary resources have the same word “intensity”. Therefore, all matching value is similar degree. However, by integrating sensor data, it indicates precise result. The top one in the table, it matched the sensor data. And others are not match the sensor data due to the temporal-spatial data. Only the top one could calculate credibility. Next is the experiment 2-2. This experiment is about weather. The input is the target information no.4. Table 2.4 show the result of the experiment 2-2.
23
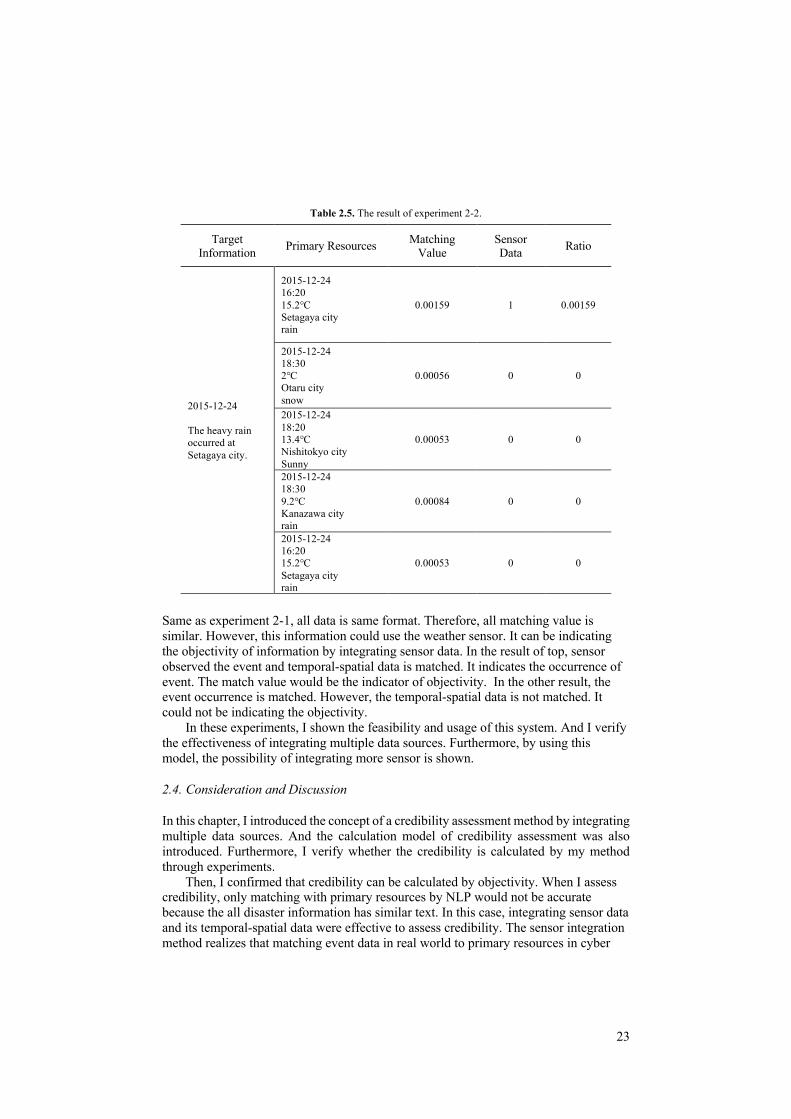
Table 2.5. The result of experiment 2-2.
Target Information Primary Resources Matching
Value Sensor Data Ratio
2015-12-24 The heavy rain occurred at Setagaya city.
2015-12-24 16:20 15.2℃ Setagaya city rain
0.00159 1 0.00159
2015-12-24 18:30 2℃ Otaru city snow
0.00056 0 0
2015-12-24 18:20 13.4℃ Nishitokyo city Sunny
0.00053 0 0
2015-12-24 18:30 9.2℃ Kanazawa city rain
0.00084 0 0
2015-12-24 16:20 15.2℃ Setagaya city rain
0.00053 0 0
Same as experiment 2-1, all data is same format. Therefore, all matching value is similar. However, this information could use the weather sensor. It can be indicating the objectivity of information by integrating sensor data. In the result of top, sensor observed the event and temporal-spatial data is matched. It indicates the occurrence of event. The match value would be the indicator of objectivity. In the other result, the event occurrence is matched. However, the temporal-spatial data is not matched. It could not be indicating the objectivity. In these experiments, I shown the feasibility and usage of this system. And I verify the effectiveness of integrating multiple data sources. Furthermore, by using this model, the possibility of integrating more sensor is shown.
2.4. Consideration and Discussion
In this chapter, I introduced the concept of a credibility assessment method by integrating multiple data sources. And the calculation model of credibility assessment was also introduced. Furthermore, I verify whether the credibility is calculated by my method through experiments. Then, I confirmed that credibility can be calculated by objectivity. When I assess credibility, only matching with primary resources by NLP would not be accurate because the all disaster information has similar text. In this case, integrating sensor data and its temporal-spatial data were effective to assess credibility. The sensor integration method realizes that matching event data in real world to primary resources in cyber

24
space. That is the reason why effective to integrate multiple data sources. This method can complete previous credibility classification method by using language processing. Furthermore, if the corrective information such as “The information A huge earthquake is occurred in Tokyo is incorrect” is inputted, the system outputs high credibility when “A huge earthquake is occurred in Tokyo” because these two inputs include same word due to language matching. Then, this problem is solved by integrating multiple data sources represented sensor data. Integrating sensor data is important for aggregating various data sources and assessing credibility that cannot assess credibility by only language processing. By several experiments, I confirmed feasibility of the credibility assessment system by integrating multiple data sources. And I could show the usage of the credibility assessment method and assessment model.
3. An Evaluation Model of the Credibility Assessment System
In this section, I introduce an evaluation model of the credibility assessment system. This evaluation model is based on precision and recall. This model is proposed in my previous work in paper [99]. However, in the field of the credibility assessment or fake news, the aspect of precision and recall is different from any other field such as information retrieval. Then, I introduced An Evaluation Model of Credibility Calculation System for Natural Disasters [99]. The main contribution of this model is to give new aspects for the evaluation in the field of the credibility assessment. Originally, in the field of information retrieval, the harmonic mean (F-measure) is derived from precision and recall. Figure 3.1 shows the data classification in precision and recall. Normally, the balance of precision and recall is important.
Figure 3.1. The data classification in precision and recall.
However, in the field of the credibility assessment I need to focus on precision. This is because, an accuracy is the most important for the credibility assessment system even if
True Positive
True Negative
False Negative
False Positive
Collected Data
Derived Data

25
not all information is extracted. In this model, precision shows how much correct data is extracted from all correct data in the database. In this field, the system should extract only true positive.
3.1. An Evaluation of the Credibility Assessment System
Same as previous experiment, I use the prototype system of credibility assessment system. And experimental environment is also same. The system collects 155 data from primary resources. And same sensor data is used. These are the earthquake sensor [92] and weather sensor from Metrological agency in Japan [91]. In this time, I input 6 target information for the system. Table 3.1shows the all target information. These data are also Japanese in actually.
Table 3.1. The target information.
Earthquake Related Data Weather Related Data
1 The earthquake occurred in Tokyo. The intensity 5. 4 Heavy rain occurred in Tokyo.
2 Huge Tsunami occurred in Tohoku region by the earthquake. 5 The torrential rain is occurred in Kanto
region and Tohoku region.
3 Huge aftershock is occurred in Kumamoto prefecture. The intensity 6. 6 The river is flood in Kinugawa river.
This six-target information has five correct data in primary resources for each. If the target information is inputted, the system has to derive only the correct data (True Positive). The correct data for each target information is shown in table 3.2.

26
Table 3.2. The correct data.
1
2011-03-11 The earthquake occurred in Tokyo. An intensity is 5.
The blackout occurred due to the earthquake in Tokyo.
Huge earthquake is observed in Kanto region.
Difficulty of return home is occurred due to disaster in Tokyo.
Huge earthquake which intensity 5 is observed in Tokyo.
2
2011-03-11 The earthquake occurred in Miyagi prefecture. An intensity is 7.
A large Tsunami warning issued in the coastal area in Miyagi prefecture.
A fire due to Tsunami is occurred in Ishinomaki city and Kesennuma city.
The huge earthquake is occurred in Tohoku region. An intensity is 7.
Miyagi prefecture. A Tsunami warning issued in coastal area.
3
2016-04-14 The earthquake occurred in Kumamoto prefecture. An intensity is 7.
An aftershock is observed in Kumamoto prefecture. An intensity is 6.
Strong shaking is continuing around Kyushu region.
The huge earthquake which intensity 7 is occurred in Kumamoto.
The strong shaking is observed in Kumamoto.
4
2015-12-24 15.2℃ Setagaya city Rainy
2015-12-24 15.2℃ Nishitokyo city Rainy
Torrential rain in Tokyo.
Heavy rain occurred in Tokyo.
Observe strong shaking in various place in Tokyo.
5
2015-12-24 15.2℃ Kanto region Rainy
2015-12-24 15.2℃ Northern Kanto region Rainy
Typhoon no.18 approaches Kanto region.
A heavy rain warning was issued throughout the Kanto region.
Torrential rains occur in various places in Kanto region.
6
2015-12-24 15.2℃ Ibaraki prefecture rainy
Kinugawa river flooded in Moriya city, Ibaraki prefecture.
A heavy rain warning was issued throughout the Ibaraki prefecture.
Rivers increase in Ibaraki prefecture.
An embankment broke down in Kinugawa river.
These data are actual data that is retrieved when disasters occurred. The data no.1 and no.2 are retrieved when the great East earthquake is occurred. The data no.1 is about Tokyo, no.2 is about Miyagi prefecture. And the data no.3 is about Kumamoto earthquake. The data no.4, no.5 and no.6 are about the heavy rain disaster in Kanto and Tohoku region. The data no.4 is about Tokyo, no.5 is about region and no.6 is about Ibaraki prefecture. If the target information (table 3.1) is inputted, these correct data (table3.2) that correspond to each number should be outputted. The table 3.3 shows the result of experiment using these datasets.
27
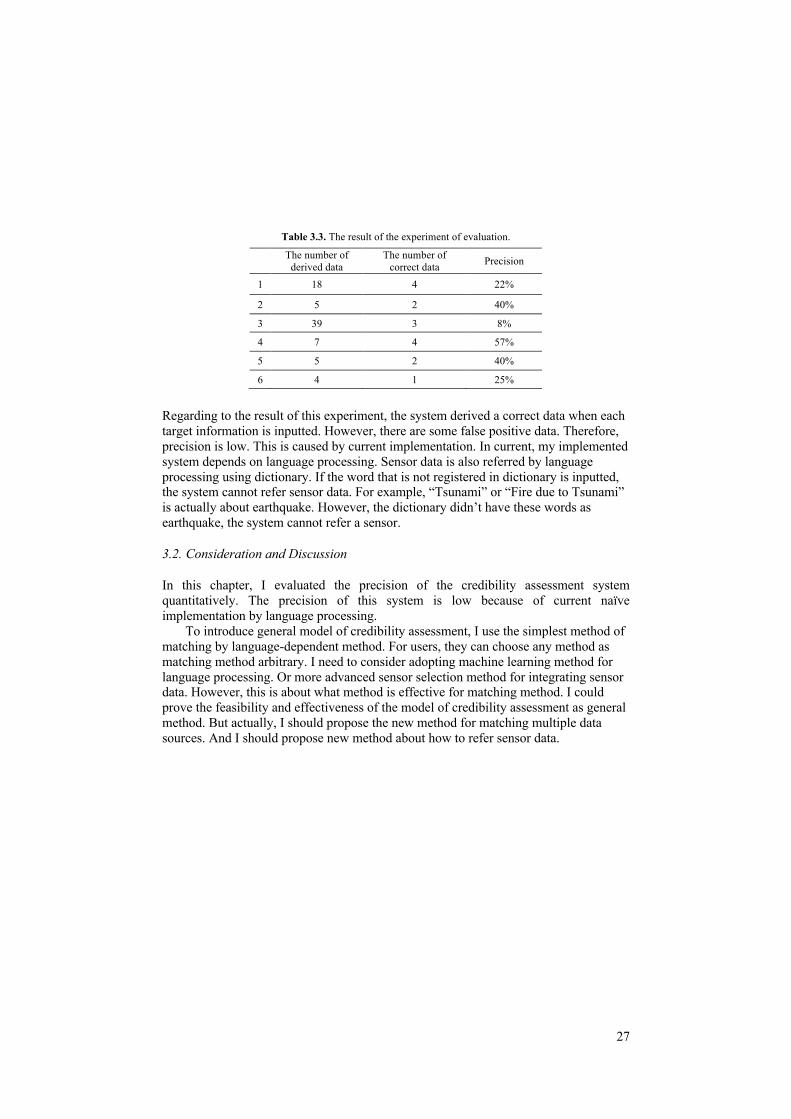
Table 3.3. The result of the experiment of evaluation.
The number of derived data
The number of correct data Precision
1 18 4 22%
2 5 2 40%
3 39 3 8%
4 7 4 57%
5 5 2 40%
6 4 1 25%
Regarding to the result of this experiment, the system derived a correct data when each target information is inputted. However, there are some false positive data. Therefore, precision is low. This is caused by current implementation. In current, my implemented system depends on language processing. Sensor data is also referred by language processing using dictionary. If the word that is not registered in dictionary is inputted, the system cannot refer sensor data. For example, “Tsunami” or “Fire due to Tsunami” is actually about earthquake. However, the dictionary didn’t have these words as earthquake, the system cannot refer a sensor.
3.2. Consideration and Discussion
In this chapter, I evaluated the precision of the credibility assessment system quantitatively. The precision of this system is low because of current naïve implementation by language processing. To introduce general model of credibility assessment, I use the simplest method of matching by language-dependent method. For users, they can choose any method as matching method arbitrary. I need to consider adopting machine learning method for language processing. Or more advanced sensor selection method for integrating sensor data. However, this is about what method is effective for matching method. I could prove the feasibility and effectiveness of the model of credibility assessment as general method. But actually, I should propose the new method for matching multiple data sources. And I should propose new method about how to refer sensor data.

28
4. A Sensor Selection and Learning Method for Credibility Assessment Using Sensor Data
I herein introduce a sensor selection and learning method for credibility assessment using sensor data. It is proposed in my paper [100]. As I mentioned, to assess credibility, integrating sensor data is effective for deriving objectivity. However, if incorrect sensors are selected or if the necessary sensors are not referred, it implies that the credibility of the credibility assessment system is uncertain. The importance of sensor network credibility is discussed in the paper [33]. In this chapter, I introduce the new method about how to select sensor for credibility assessment system. In this method, several discriminators select sensor through weighting. Additionally, the result of sensor selection is feedbacked to discriminators to learn whether the decision of each discriminator is correct or incorrect. The primary contribution of this method is the proposal of a method of sensor selection from several sensors that is opened on WWW by weighting from discriminators. Furthermore, these discriminators can learn whether their decision is correct from feedback of the selection result. Novelty of this method is two-fold. First, this method can use for any system that integrate several sensors from WWW such as social sensor system. This method realizes the way to select appropriate sensor data from meta sensor database. The sensor database is discussed in the paper [43], [58] and [76]. Second, this method can improve accuracy of itself automatically. It secures the precision of the method. I show the feasibility, usage and application for credibility assessment system is shown through experiments.
4.1. An Overview of the Sensor Selection and Learning Method
This method is incorporated into the credibility assessment system. In this method, the appropriate sensor is automatically selected from meta sensor database by discriminators. Then, the result of selection is feedbacked to discriminator. The overview of this method is shown in Figure 4.1.

29
Figure 4.1. The overview of the sensor selection and learning method.
Each discriminator selects sensors by weighting from meta sensor database. Discriminators are some algorithm or method such as NLP, machine learning and deep learning. It can be selected by users arbitrary. The meta sensor database have several sensors that is corrected from WWW as open data. Discriminators weight sensors by keywords that is included in the target information. For example, if the target information includes “earthquake”, discriminators should weight and select earthquake sensor. If the target information includes “heavy rain”, discriminators should weight and select weather sensor. This method is about how to select sensors from meta sensor data. And how to improve the accuracy automatically. This method is incorporated for any system that uses several sensor data. In this time, I incorporate this method into the credibility assessment system. When the credibility assessment system calculates credibility of information, if the system requires sensor data, the sensor selection method is called, and this method is performed. The method selects appropriate sensor and return the sensor ID for the credibility assessment system.
Meta Sensor Database
Earthquake Sensors Weather Sensors Other Sensors
Credibility Assessment System
Discriminator Discriminator Discriminator
Sensors Selection and Learning Method
Select Select
Output Sensor IDQuery
Feedback

30
4.2. An Operation Process of the Sensor Selection and Learning Method
The operation process of this method is introduced following steps. Figure 4.2 shows the operation process of this method.
Figure 4.2. The operation process of the sensor selection and learning method.
When the target information is inputted to the credibility assessment system, the system performed language preprocessing for the target information. Then, the sensor selection and learning method is performed. Step1. Weighting (Voting): The target information is transferred to each discriminators (dn). According to the keywords (e.g. earthquake, rain, flood), discriminators weight the sensors (Sn). The weight (Rn) has been decided (e.g. 100) in advance. In Figure 4.2, all discriminators have 100 weight (Rn = 100). Then discriminators allocate the weight for each sensor. Finally, discriminators select the sensor that has highest weight value. If there are same weight sensors, the discriminator selects several sensors. And if discriminators don’t allocate weight for sensors, the discriminator selects no sensor. That implies that the discriminator judge sensors are not required in this assessment. Weighting is a voting. Each discriminator votes their weight for each sensor depends on their algorithm. Step2. Selection (Majority Decision): After weighting, selection is performed. In other words, this selection is a majority decision by each discriminator. According to this majority decision, sensors are reduced to one or a few sensors. This is a final sensor that is returned to the credibility assessment system. Only sensor ID is returned. In Figure 4.2, the discriminator 1 (d1) allocates 50 weights (R1) for sensor 1 (S1). And S1 has the highest weight among voting by d1. It means d1 votes to S1 as appropriate
Credibility Assessment System
Target Information
Preprocessing
Step1. Weighting
S1 S2 S3 Sn...
d2d1 d3 dn...
R1 = 100 R2 R3 Rn
Step2. Selection
S1 S2 S3
d2d1 d3
R2 R3R1
50 50 50
S1
Sensoe ID
Step3. Feedback the Result of Selection

31
sensor. Each discriminator selects sensors according to their algorithm. And there are several different sensors that selected from each discriminator. The d1 selects S1, the d2
also selects S1 and the d3 selects S3 sensor. In this time, S1 sensor is selected by majority decision. It is possible to output several sensor ID when same sensor number of sensors is selected by majority decision. Step3. Feedback: Finally, the result of the sensor selection is feedbacked to the discriminators. A discriminator that selects different sensor from the final output is decreased the initial value of weights. Then, this decreased value is the decided by weight value that allocated to wrong sensor. It maintained, and when the next selection is processed, the initial value of weights is becoming lower. In regard to the discriminator that already decreased the initial weights, when it selects a correct sensor, the initial weights are increased by the correct weighting value. In this method, the weight represents the “Reliability”. The majority decision by several discriminators can increase the objectivity. Furthermore, by feedbacking the result of the sensor selection, the discriminators can learn their decision. It affects next sensor selection. This model is simulated the mechanism of increase and decrease of reliability or trust in the real world [78]. The reliability of misjudged discriminator is decreased. And discriminators can recover its reliability by repeating correct judgement.
4.3. The Details of Sensor Selection
In this section, the details of sensor selection are shown. I show how to weight to sensors discriminators, are how to select sensors, and how to feedback the result for discriminators. Table 4.1 shows the weighting. It includes discriminators (dn), its initial weights (Rn), and sensors (Sn). The sensor selection is processed by three steps. Those are weighting, selection and feedback.
Table 4.1. Weighting by discriminators.
d1
(R1 = 100)
d2
(R2 = 100)
d3
(R3 = 100)
S1 50 50 25
S2 25 30 25
S3 25 20 50
In table 4.1, discriminators (dn) have a weight (Rn). The initial value of weights is 100. Each number in cells show the weights that are allocated from each discriminator for sensors (Sn). For example, d1 allocates 50 weights for S1, 25 weights for S2, and 25 weights for S3. It means d1 selects S1 sensor. Same as d1, d2 and d3 allocate their weights for sensors. And all discriminators select the sensor which has the heaviest weight. In this table, d2 selects S1, d3 selects S3. Subsequently, if discriminators allocate same weights for two or more sensors, discriminators select multiple sensors. Further, if discriminators allocate for “no sensors”, discriminators don’t select any sensors. This is the weighting. It means the voting.

32
Next step is the selection. Table 4.2 is added total weight to table 4.1. It means the majority decision by all discriminators. First, I focus on the S1 and its total weights.
Table 4.2. Selection.
d1
(R1 = 100)
d2
(R2 = 100)
d3
(R3 = 100)
Total
Weight
S1 50 50 25 100
S2 25 30 25 0
S3 25 20 50 50
The total weight of S1 is 100. The discriminator d3 allocates 25 weights for S1. However, d3 allocates heaviest weight value for S3 sensor. It means d3 selects S3 sensor. According to this result of weighting, the total weight is reflected only the value of sensor that is selected finally. Then, the total value of S1 is 100. And S2 is not selected by any discriminators. The allocated value of S2 is not added to total weight of S2. The S3 sensor is selected by only d3. Finally, the majority decision is processed by only S1 and S3 sensors. In this table, comparing to S1 and S3, only S1 is heaviest sensor. Therefore, final output sensor is S1 sensor. Final step is feedback. According to the result of the majority decision, d3 has been misjudged. This result is feedbacked for d3. The initial weights (reliability) is reduced. The initial weights of d3 were 100. In this time, d3 selects S3 sensor with 50 weights. Therefore, the weight value of d3 is subtracted by 50. In the next sensor selection, the weights of d3 would be start from 50 (R3 = 50). However, if d3 selects correct sensor by majority decision, the weight of d3 is recovered. For example, if d3 selects correct sensor with 25 weights. The initial weights of d3 would be 75 (R3 = 75). In this model, the weights of each discriminator imply the reliability of discriminators. This value has a low limit and an upper limit to avoid impairing the objectivity. If weights become less than 0, the discriminator is not able to recover their reliability. This is because, 0 weights mean that the discriminator cannot participates the voting and the majority decision. Meanwhile, if the weights don’t have upper limit, a particular discriminator would have the authority. By these reasons, I set the low limit is 1 and the upper limit is 100.
4.4. Experiments of the Sensor Selection
In this section, I show the practicability and feasibility of the sensor selection method through experiments by using prototype system. I verify whether the system can select sensors by my method. And whether the system can learn the result of the sensor selection by feedback. For experiments, I prepared two types of discriminators. Discriminator 1 is the word matching discriminator that contains the keyword dictionary about natural disasters. It allocates its weights depends on pattern matching. Discriminator 2 is also word matching discriminator. It has different dictionary. The dictionary is a thesaurus dictionary in addition to a normal dictionary. And the earthquake sensor and weather

33
sensor is connected to the system. If sensor is not required, discriminators weights for “no sensor”. Experiment 1. Weighting and Selection: Firstly, I verify whether the system can select the appropriate sensor when the target information is inputted. Table 4.3 shows the target information as a dataset.
Table 4.3. The target information as a dataset.
Input ID Target Information Sensors
A 1 Warning was announced.
Earthquake / Weather sensor 2 Break out has occurred due to a disaster.
B 1 Huge earthquake occurred in Tokyo.
Earthquake sensor 2 The epicenter is Tokyo bay area.
C 1 The damage spread by river flood.
Weather sensor 2 The danger land slide by heavy rain.
D 1 The credit association is danger.
No sensor 2 Iwate prefecture accepts supply from individuals.
These information were the retrieved data when the huge earthquake in Japan [22, 57, 97]. In this table, input ID A-1 and A-2 are about a disaster. It is not about particular disaster. Therefore, this information needs to refer earthquake sensor and weather sensor both. Same as input ID A, each target information has a correct sensor. Only input ID D-1 and D-2 should select “No sensor”. These information would be inputted and I verify whether discriminators can select the correct sensor by the sensor selection method. Table 4.4 shows the result of this experiment.

34
Table 4.4. The result of the experiment 1.
Input ID d1 (R (Weight))
d2 (R)
Final Output (R)
A
1 Earthquake / Weather (50, 50)
Earthquake / Weather (50, 50)
Earthquake / Weather (100, 100)
2 Earthquake / Weather (50, 50)
Earthquake / Weather (50, 50)
Earthquake / Weather (100, 100)
B
1 Earthquake (100)
Earthquake (100)
Earthquake (200)
2 No sensor (100)
Earthquake (100)
Earthquake (100)
C
1 Weather (100)
Weather (100)
Weather (200)
2 Weather (100)
Weather (100)
Weather (200)
D
1 No sensor (100)
No sensor (100)
No sensor (200)
2 No sensor (100)
No sensor (100)
No sensor (200)
First, I consider about A-1 and A-2. Both discriminators (d1, d2) allocate weights for earthquake sensor and weather sensor as same value. This is the correct output. This information needs to refer two sensors. Subsequently, the final output is also the correct sensor. When input ID B, C and D are inputted, discriminators and final output are correct. The d1 discriminator has a dictionary that includes a disaster keyword. And d2 discriminator has a thesaurus in addition to dictionary. If the target information includes keywords about disaster, both discriminators could select correct sensor. In addition, if the target information does not include disaster keyword, two discriminators select “No sensor”. When the previous sensor selection which is not use the sensor selection method, only pattern matching by language processing is adopted and the dictionary is small. Therefore, if the target information doesn’t include disaster keyword that includes in dictionary, sensors were not referred. However, adopting this method, the problem is improved. Furthermore, focus on B-2, d1 and d2 discriminators select different sensor. This is caused by a difference of dictionary. In dictionary of d1, the word “epicenter” is not included. Hence, d1 could not select sensors. The discriminator d1 selects “No sensor”. However, d2 contains the thesaurus. This thesaurus includes the word “seismic center”. It is a synonym of “epicenter”. The d2 could select correct output. In final output of B-2, “No sensor” and earthquake sensor have same weights. However, in final output, a sensor has priority. Therefore, final output of B-2 is earthquake sensor. Experiment 2. Feedback: In this experiment, I verify whether discriminators could learn the result of selection from feedback when discriminators have been misjudged. And I verify whether the initial weights value of discriminators is reduced.

35
When the target information that has two meanings i.e. either earthquake or weather (e.g., “disaster”) is inputted, this system selects two sensors. In this experiment, I would input the word “disaster” and its synonym word “sorrow”. The word “sorrow” is not relevant to a sensor. Therefore, when “disaster” is inputted, the system should output earthquake and weather sensor. And when “sorrow” is inputted, the system should output “No sensor” (table 4.5).
Table 4.5. Input words and correct output.
Input Word Correct Output
1 Disaster Earthquake / Weather sensor
2 Sorrow No sensor
When the word “disaster” is inputted, d1 and d2 should output two sensors. When the word “sorrow” is inputted, d1 and d2 should output “No sensor”. Table 4.6 shows the result when each input word is inputted.
Table 4.6. The result when each input word is inputted.
Input Words d1
(R1 = 100)
d2
(R2 = 100)
Final Output
(R)
1 Disaster Earthquake / Weather
(50, 50)
Earthquake / Weather
(50, 50)
Earthquake / Weather
(100, 100)
2 Sorrow No sensor
(100)
Earthquake / Weather
(50, 50)
No sensor
(100)
When input 1 “disaster” is inputted, both discriminators could output correct sensor. However, input 2 is inputted, d2 has been misjudged. The final output is “No sensor”. Therefore, both discriminators should select “No sensor”. The d1 selects correct output. The d2 selects wrong output. It’s caused by the thesaurus of d2. The word sorrow is synonym of “disaster”. Hence, d2 selects sensors. Because of weights of each selection, the final output is correct. The choice of d1 (“No sensor”) has heaviest weights than the choice of d2 (“Earthquake / Weather”). Therefore, the effectiveness of the sensor selection method is proved. However, the discriminator d2 should learn the result of selection. I should verify whether the weights of d2 is changed by feedback. Table 4.7 shows the result of experiment 2. From table 4.6, input 1 and input 2 is one set. This set of data would input to the system thrice. It means the correct and incorrect data as one set is inputted three times.

36
Table 4.7. The result of experiment 2.
Input Initial Weights of d2 (R2) Before Input Allocated R2
Initial Weights of d2 (R2) After Input
1
Correct 100 Earthquake / Weather
(50, 50) 100
Incorrect 100 50, 50 50
2 Correct 50 25, 25 75
Incorrect 75 37.5, 37.5 37.5
3
Correct 37.5 18.75, 18.75 56.25
Incorrect 56.25 28.125, 28.125 28.125
First, R2 (initial weights of d2) is 100. And the upper limit of the weights is 100. This initial weight is maximum. In the first set of input, R2 is not changed because of the weights limit. When the incorrect data is inputted, d2 should select “No sensor”. However, d2 selects sensors. According to this result and its feedback, R2 (the weights of d2) is reduced. Then, the reduced value is same as allocated value of d2. Only one of the wrong allocated value is reduced from R2 (50). The initial weights (R2) become 50. Next, in the second input, d2 selects correct output. Same as incorrect pattern, the initial weights would be changed. The initial weights become 75. Similarly, this process is repeated. I could verify the initial weights is changed. It means that the reliability of discriminator could be change by feedback of the result. Through this experiment, I could verify whether, the reliability mechanism could be simulated by using the sensor selection method. Experiment 3. Quantitative Evaluation: Finally, I evaluate the precision of the sensor selection method based on the method that proposed in chapter 3. In the sensor selection method, multiple discriminators are integrated several techniques in hybrid. In this time, I verify how the number of discriminators is related to precision. In the current implementation, d1 (pattern matching with dictionary) and d2 (pattern matching with thesaurus) are integrated. In this experiment, the difference between when using each discriminator individually and when using discriminators by integrated is verified. The input data is shown in table 4.8.

37
Table 4.8. The target information to an evaluation.
Input ID Target Information Sensors
A
1 Evacuation announcement in Iwate prefecture.
Earthquake / Weather sensor 2 Special precaution in Ibaraki prefecture.
3 Difficulty to go home by disaster in Tokyo.
B
1 Tsunami fire occurred in Kesennuma city.
Earthquake sensor 2 Completely destroyed by strong earthquake.
3 Railway has stopped by strong impact.
C
1 The river rises in Kinugawa.
Weather sensor 2 Bank is broken in Kinugawa river.
3 Typhoon no.18 is approaching.
This experiment verified whether the system can output the correct sensors when the target information is inputted. According to this experiment, the precision is derived and shown in Figure 4.3.
Figure 4.3. The precision of the sensor selection method.
When using each discriminator individually, the precision is 82%. When using each discriminator integratory, the precision is 88%. According to this result, the precision is better when discriminators are integrated. In this dataset, there is no difference between d1 and d2. The discriminator d1 could not select a sensor when the target information that is not included in a dictionary is inputted. This problem is caused by the scalability of the dictionary. However, when d2 that has a thesaurus can derive synonym. It complements d1 discriminator. Even if unrelated words are inputted, d2 selects a sensor because the word is related to the word in the thesaurus. According to this experiment,
0
10
20
30
40
50
6070
80
90
100
d1 d2 d1, d2
79
80
81
82
83
84
85
86
87
88
89
d1 d2 d1, d2

38
the effectiveness and feasibility of the sensor selection method is shown. I also evaluate the precision of the method.
4.5. Consideration and Discussion
The sensor selection method was proposed as a general method for data integration. In this method, meta sensor database that is integrated multiple sensor is constructed. Then the sensor selection method is used to decided which sensor should be selected from meta sensor database. In this paper, this method was used for the credibility assessment system using sensor data. I showed the effectiveness and application of this method through experiments. Through several experiment, I confirm that an appropriate sensor can be selected by several sensors by weighting from several discriminators. This process is a voting. The final output sensor is decided by majority decision. These method was designed based on the mechanism of a reliability. Adopting several discriminators that each discriminator has techniques could provide objectivity. This is an important essence of my concept. And I confirm that a reliability could be affected to discriminators by feedback. This method is proposed based on reliability mechanism. Therefore, the sensor selection method could be applied not only the credibility assessment system but also another system.

39
5. A Matrix Node Graph Data Structure and Its Application for Credibility Assessment with Temporal Transition of Intention
In previous section, I introduced how to integrate sensors and select a few. This is one of element of A Credibility Assessment Method by Integrating Multiple Data Sources. this method is about a sensor data integration. However, this method has one more elements. That is the matching with primary resources. In this section, I introduce a Matrix Node Graph Data Structure and Its Application for Credibility Assessment with Temporal Transition of Intention [101]. It’s not new matching method with primary resources. To derive objectivity, I need to propose a new method not only matching with primary resources but for a new way to select sensor that is specialized in credibility assessment. Information that is disseminated on WWW has two meanings. Those are the “apparent meaning” and the “implicit intention”. The “implicit intention” is defined as a purpose of information dissemination. However, it could be recognized by only examining text. Especially in the case of fake news, intention is artfully hidden. And the intention would change in the process of the information spreading. The recognition of the intention of information and tracing its temporal transition are effective to assess the credibility of information. Kwon, Cha, Jung (2017) also discussed about a temporal transition of rumors [66]. There is a relationship between rumors and its temporal transition. The matrix node graph data structure is a graph structure that has a matrix as a node. In this section, I propose a method to recognize and classify the intention of information by use of an intention matrix while following the temporal transition of intention using a graph structure. By using this data structure, the intention and temporal transition of intention of particular information can be derived. The feasibility and usefulness of this structure is shown through experiments. And an application for credibility assessment is also introduced.
5.1. Two Meanings of Information
As I mentioned, a disseminated information has two meanings. The apparent meaning is a meaning that can be seen from the text simply. The implicit intention is a meaning that is hidden from the text. An intention express why information sender offers the information i.e., a motivation (Figure5.1).
Figure 5.1. Two meanings of information.
Apparent Meaning Implicit Intention
Information

40
In 2016, a huge earthquake was occurred in Kumamoto prefecture in Japan. Subsequently, the information stating “A lion escapes from a zoo due to the earthquake” was spread through SNS. This information is a fake news. Superficially, this information was sent to alert people in a disaster. In actually, the sender sent this information for fun [95]. This is an example of the difference between apparent meaning and implicit intention. And this information continued changing in the process of spreading with plausibility. The people who spread this information believed this rumor and they just wanted to alert people. The intention was changed from fun to obligation (Figure5.2).
Figure 5.2. Temporal transition of intention.
This example is necessary to classify and recognize intention of information and to trace the temporal transition of intention. The paper [21, 53, 65, 79] also focused on temporal features. Thus, I propose the matrix graph data structure and its application for credibility assessment to accommodate the above situations.
5.2. The Matrix Node Graph Data Structure
The matrix node graph data structure is a graph structure that has a matrix as a node. Figure 5.3 shows the matrix node graph data structure.
Implicit Intention: Obligation
Implicit Intention: Fun
Apparent Meaning: Alert people of an incident in disaster
A lion escapes from a zoo due to the earthquake.
Information

41
Figure 5.3. The matrix node graph.
To show the application for credibility assessment, I implemented the credibility assessment system with the matrix node graph based on the characteristic of rumor that is mentioned below. There are three types of information on WWW: facts, rumors and uncertain information. I defined the rumor as being low-quality information which includes misinformation, disinformation, and fake news. If people can distinguish the information as fact or rumor, there is no problem. I need an approach to deal with the unknown truth information. Figure 5.4 shows how to deal with the rumor by the credibility assessment system that is implemented with the matrix node graph.
Figure 5.4. The credibility assessment system with the matrix node graph.
m1,1 m1,2 m1,3 ���m1,nm2,1 m2,2 m2,3 ���m2,nm3,1 m3,2 m3,3 ���m3,n� � �� � �� � �� � �� � �� � �mn,1 mn,2 mn,3 ���mn,n
m1,1 m1,2 m1,3 ���m1,nm2,1 m2,2 m2,3 ���m2,nm3,1 m3,2 m3,3 ���m3,n� � �� � �� � �� � �� � �� � �mn,1 mn,2 mn,3 ���mn,n
m1,1 m1,2 m1,3 ���m1,nm2,1 m2,2 m2,3 ���m2,nm3,1 m3,2 m3,3 ���m3,n� � �� � �� � �� � �� � �� � �mn,1 mn,2 mn,3 ���mn,n
m1,1 m1,2 m1,3 ���m1,nm2,1 m2,2 m2,3 ���m2,nm3,1 m3,2 m3,3 ���m3,n� � �� � �� � �� � �� � �� � �mn,1 mn,2 mn,3 ���mn,n
m1,1 m1,2 m1,3 ���m1,nm2,1 m2,2 m2,3 ���m2,nm3,1 m3,2 m3,3 ���m3,n� � �� � �� � �� � �� � �� � �mn,1 mn,2 mn,3 ���mn,n
m1,1 m1,2 m1,3 ���m1,nm2,1 m2,2 m2,3 ���m2,nm3,1 m3,2 m3,3 ���m3,n� � �� � �� � �� � �� � �� � �mn,1 mn,2 mn,3 ���mn,n
m1,1 m1,2 m1,3 ���m1,nm2,1 m2,2 m2,3 ���m2,nm3,1 m3,2 m3,3 ���m3,n� � �� � �� � �� � �� � �� � �mn,1 mn,2 mn,3 ���mn,n
m1,1 m1,2 m1,3 ���m1,nm2,1 m2,2 m2,3 ���m2,nm3,1 m3,2 m3,3 ���m3,n� � �� � �� � �� � �� � �� � �mn,1 mn,2 mn,3 ���mn,n
Credibility Assessment System
Spread with Plausibility
Fact
Rumor
InformationTarget Information( Fact or Rumor )
Matrix Node Graph of Past Rumor
Target
Generate Matrix Node GraphCalculate the Similarity
Output Similarity and Matrix Node Graph
Similarity --%

42
In advance, I collect rumor information and the similar or co-occurrence information. The more the information is spreads and increases, the more plausibility is granted. All information that is collected in the credibility assessment system is classified into the intention matrix. The system sorts the matrix by timestamp to generate graph. This is the matrix node graph. The matrix node graph is stored to the database in the system. These processes are applied to the target information. Finally, the system calculates the distance of two matrix node graphs to assess similarity. My motivation is to reduce rumors and help information retrieval. The important point is to extend the criteria used by people to judge the degree of credibility of information. Recently, the problem of rumors is expanding and becoming artful. The information retrieval system needs a new mechanism that can counter to the rumor. I call this credibility assessment system. The matrix node graph data structure can be incorporated to a credibility assessment system and any other information retrieval system. This data structure is proposed for not only simple matching with primary resources, but more to deal with complicate information such as intention of information sender. The primary contribution of this data structure is the proposal of a new data structure for credibility assessment and information retrieval field. The novelty of this structure is two-fold. First, this structure can be treated as a matrix, table and its temporal transition. It can be used for classification with time. Furthermore, it can be realized to classify the intention of information and to trace the change of the intention. Secondly, the data structure could follow calculating between several matrix node graphs and can compare how the information changes. These features show that the data structure can clarify the similarity between the past rumor dataset and the target information.
5.3. A Generation Method of the Matrix Node Graph
I now show the detail of a generation method of the matrix node graph. The superiority of this data structure is that allows treatment of the classification problem with temporal transition at the same time. Especially in the field of credibility assessment, it is essential to provide classification capability such as the rumor stance classification and rumor veracity classification. This section introduces a generation method of the matrix node graph. Figure 5.5 shows the generation process of the matrix node graph.
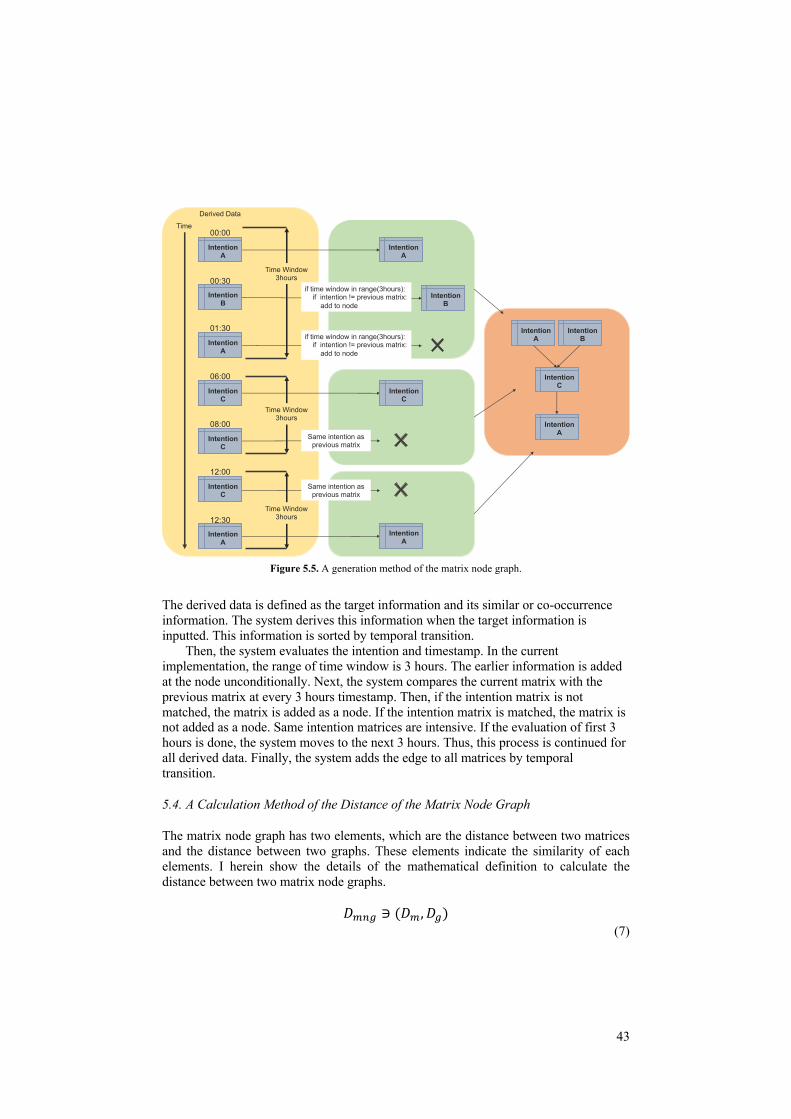
43
Figure 5.5. A generation method of the matrix node graph.
The derived data is defined as the target information and its similar or co-occurrence information. The system derives this information when the target information is inputted. This information is sorted by temporal transition. Then, the system evaluates the intention and timestamp. In the current implementation, the range of time window is 3 hours. The earlier information is added at the node unconditionally. Next, the system compares the current matrix with the previous matrix at every 3 hours timestamp. Then, if the intention matrix is not matched, the matrix is added as a node. If the intention matrix is matched, the matrix is not added as a node. Same intention matrices are intensive. If the evaluation of first 3 hours is done, the system moves to the next 3 hours. Thus, this process is continued for all derived data. Finally, the system adds the edge to all matrices by temporal transition.
5.4. A Calculation Method of the Distance of the Matrix Node Graph
The matrix node graph has two elements, which are the distance between two matrices and the distance between two graphs. These elements indicate the similarity of each elements. I herein show the details of the mathematical definition to calculate the distance between two matrix node graphs.
𝐷%&' ∋ (𝐷%, 𝐷') (7)
IntentionA
IntentionB
IntentionA
00:00
IntentionB
00:30
IntentionA
01:30
IntentionC
06:00
IntentionC
08:00
IntentionC
12:00
IntentionA
12:30
Derived Data
Time
Time Window3hours
Time Window3hours
Time Window3hours
if time window in range(3hours):if intention != previous matrix:
add to node
if time window in range(3hours):if intention != previous matrix:
add to node
IntentionC
Same intention as previous matrix
Same intention as previous matrix
IntentionA
IntentionA
IntentionB
IntentionC
IntentionA

44
In formula 7, Dmng is the distance of two matrix node graphs. It has Dm and Dg. The Dm is the distance between matrix nodes. And the Dg is the distance between graphs. The closer the distance between two matrices or graphs, the more the value approaches to 0. The Dm is calculated by formula 8.
𝐷( = 3 (𝑚%" −𝑚)"))*!"
"$*##
𝑤ℎ𝑒𝑟𝑒(𝑒%%, … , 𝑒(+) ∈ 𝑀(𝑚%, 𝑚)) (8)
In formula 8, the Dm is the distance between two matrices. The m1 and the m2 are matrices that have multiple cells. Then, the residual sum of square is calculated by the distance between matrices. For multiple matrices in the graph, this calculation is processed by brute-force to the first stage and the final stage in the graph. The first stage and final stage of the graph is important stage. Because the first stage of the graph shows the initial intention of the rumor. And the final stage shows how the intention changes. Finally, the average of all distance is the similarity of the matrices. Next, the Dg is calculated as
𝐷, =𝑚𝑖𝑛
(𝑒%, … , 𝑒!) ∈ 𝐺(𝑔%, 𝑔))3𝑐(𝑒")!
"$%
(9)
Formula 9 applies the Graph Edit Distance (GED) [9]. The Dg is the distance between two graphs. The G is the graphs that have the g1 and the g2. Each graph has multiple elements. The cost function c represents the cost of each graph edit operation e. The e includes node and edge insertion, deletion and substitution. The Dmng consists of the distance between two matrices and two graphs. One matrix node graph shows how the intention of information changes with temporal transition. By performing the calculation between two matrix node graphs possible, the trend of the rumor can be calculated.
5.5. An Architecture of the Credibility Assessment System with the Matrix Node Graph
In this section, I show the details of the credibility assessment system and introduce an application of the matrix node graph. I show the credibility assessment system that is implemented with the matrix node graph. To show the usage of the matrix node graph, I implemented the credibility assessment system consisting of three elements: the intention classification as a matrix, generation of the graph, and calculation of the distance between multiple matrix node graphs. Figure 5.6 shows the procedure of the credibility assessment system.

45
Figure 5.6. A procedure of credibility assessment with the matrix node graph.
A credibility assessment consists of several processes, as described by the following steps. Step1. Preprocessing and Data Collection: First, the target information (t) is inputted to the system. Then, the system performs natural language preprocessing on the target information, cleaning and normalizing it. Subsequently, the system performs context analysis. If the target information were indirect, future tense, or opinion, the credibility assessment would not be performed. And the co-occurrence information of the target is derived from the rumor or fake news information that is widely spread on the WWW. If there is no co- occurrence information, the information has no influence. Step2. Classify the Target Information to Intention Matrix: Next, the system classifies the target information to the intention matrix. The intention matrix is the table that has a “category” and an “intention” axis. A category defines the apparent meaning. An intention is the implicit intention of the information sender. Table 5.1 shows the intention matrix.
Credibility Assessment System
t
Target Information
t1
t2
tn
t
Step2. Classify to the intention matrix.
t
t1
t2
tn
Step1. Preprocessing and collect co-occurrence
information.
tn
t
t1 t2
Step3. Re-order by the timestamp.
tn
t
t1 t2Intention: Anxiety (0.5%)
Fun (0.5%)Similarity: 0.5%
Step5. Output the intention and the similarity.
tn
t
t1 t2
Step4. Calculate distance with past dataset.

46
Table 5.1. The intention matrix.
Anxiety Agitation Publicity Fun Desire Admire Obligation Politics
Disaster 0 0 0 0 0 0 0 0
Accident 0 0 0 0 0 0 0 0
Terrorism 0 0 0 0 0 0 0 0
Medical 0 0 0 0 0 0 0 0
Society 0 0 0 0 0 0 0 0
Politics 0 0 0 0 0 0 0 0
I create this table based on a research of sociology and psychology work [29, 75, 78], [84]. The target information is classified for this table by natural language processing. In the current implementation, the system has the dictionary that stores the synonym and co-occurrence words. The target information is selected by pattern matching with the dictionary. When the result of pattern matching is multiple values, the intention matrix is classified to multiple values by language processing. In this matrix, the whole value is normalized to be 1. Figure 5.7 shows the example using Table 5.1 when the category is “Disaster” and the intention are “Anxiety” and “Obligation”. And the matrix is simplified to use as a data structure.
Figure 5.7. An example of intention matrix.
Finally, all the co-occurrence information is also classified to the intention matrix in the above form to calculate in the credibility assessment system. To use the intention matrix, the credibility assessment system can recognize the category and intention of the target information. Step3. Re-order based on the Temporal Transition: In this step, the system gets the temporal transition from all information such as the target information and co-occurrence information. This information is already classified to intention matrix. These matrices have each timestamp. The system sorts according to the timestamp. It can trace the intention and its temporal transition. This step actually generates the matrix node graph which has a matrix as a node. Figure 5.8 shows an example of the matrix node graph. When multiple matrices that are derived at the same time have the same value, these matrices will be integrated. The matrix node graph consists of several intention matrices that are derived from particular information and its co-occurrence information.
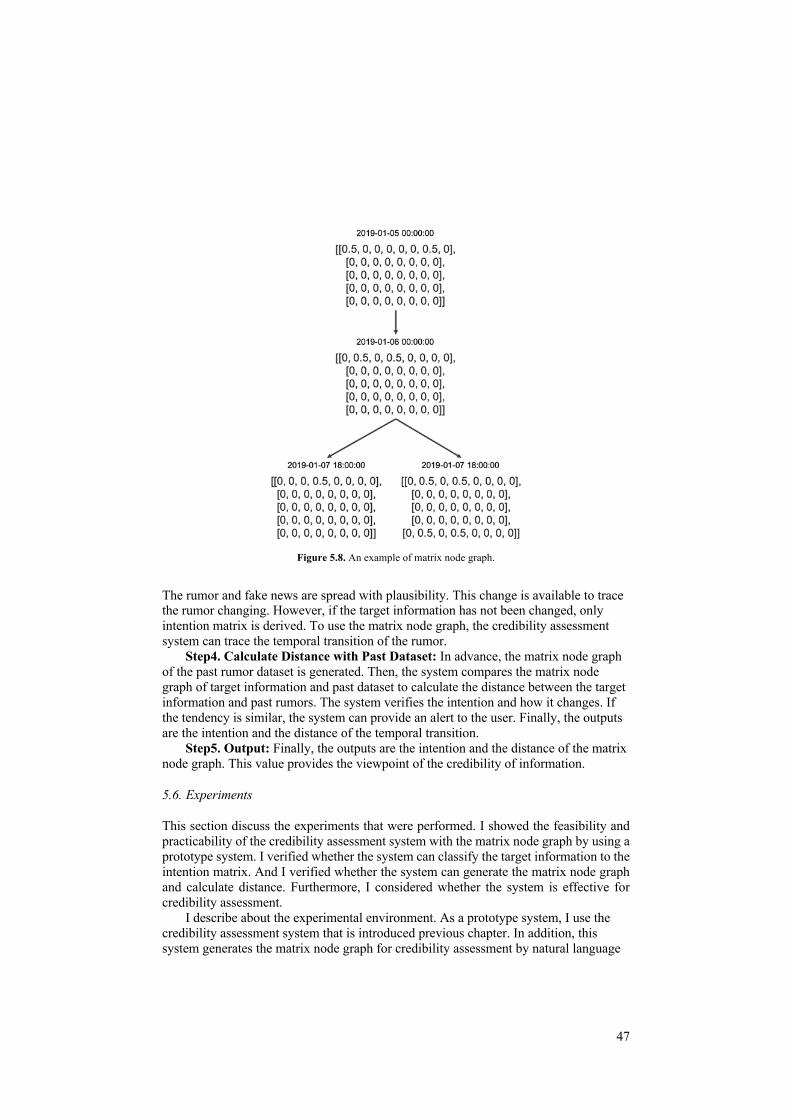
47
Figure 5.8. An example of matrix node graph.
The rumor and fake news are spread with plausibility. This change is available to trace the rumor changing. However, if the target information has not been changed, only intention matrix is derived. To use the matrix node graph, the credibility assessment system can trace the temporal transition of the rumor. Step4. Calculate Distance with Past Dataset: In advance, the matrix node graph of the past rumor dataset is generated. Then, the system compares the matrix node graph of target information and past dataset to calculate the distance between the target information and past rumors. The system verifies the intention and how it changes. If the tendency is similar, the system can provide an alert to the user. Finally, the outputs are the intention and the distance of the temporal transition. Step5. Output: Finally, the outputs are the intention and the distance of the matrix node graph. This value provides the viewpoint of the credibility of information.
5.6. Experiments
This section discuss the experiments that were performed. I showed the feasibility and practicability of the credibility assessment system with the matrix node graph by using a prototype system. I verified whether the system can classify the target information to the intention matrix. And I verified whether the system can generate the matrix node graph and calculate distance. Furthermore, I considered whether the system is effective for credibility assessment. I describe about the experimental environment. As a prototype system, I use the credibility assessment system that is introduced previous chapter. In addition, this system generates the matrix node graph for credibility assessment by natural language

48
processing. As a dataset, I used the rumor and non-rumor dataset from the PHEME project [93]. This dataset contains 5,808 collections of SNS rumors and non-rumors posted during breaking news. These datasets are about five breaking news stories. Experiment 1. Generate the Matrix Node Graph: In this experiment, I verify two points. One is whether the system can classify the intention of the target information and co-occurrence information for the intention matrix. The other is whether the system can generate the matrix node graph from each matrix. As a dataset, I use only rumor data of the breaking news from PHEME dataset (Table 5.2).
Table 5.2. The rumor dataset.
ID Topic Number of Rumors Target Information Number of Co-
occurrence Information
1 German Wings Crash 239 Breaking: German media site says
germanwings co-pilot was a terrorist. 27
2 Ottawa Shooting 469
Ottawa police says they are dealing with multiple suspects, can’t confirm
whether all have guns but are confirming multiple suspects.
15
3 Sydney Siege 523 Up to 50 people being held hostage in Sydney. 10
This dataset includes some inappropriate expressions. Therefore, I modified the express. For example, in ID1, there are the word means “Terrorist”. In actually, this was a different word that has the same meaning as “Terrorist”. It cannot use in this paper. In this table, “Topic” is the theme of the rumors. The ID1 is about “German Wings Crash” accident in 2015. The ID2 is about “Ottawa Shooting” at Parliament Hill in Ottawa in 2014. The ID3 is about “Sydney Siege” crisis in 2014. And the “Number of Rumors” is how many rumors are included in the dataset. The target information is the input data for the system. Finally, the “Number of Co-occurrence Information” is the data that is derived data when the target information is inputted. This number is the similar or co-occurrence data with the target information from all rumors. Figure 5.9 shows the output matrix node graph when the target information of ID1 is inputted. The actual data is more complicated when I plot by a script. Then I visualize the data manually. In this figure, the intention and its temporal transition is visualized. And this graph has four stages. There are eight nodes and ten edges.

49
Figure 5.9. The matrix node graph of dataset ID1.
From this matrix node graph, I confirmed that the intention and its temporal transition about the dataset ID1 were derived. At the first stage, three types of rumors occurred. Referring to table 5.1, the left matrix on stage 1 is categorized for “Terrorism” and intention is “Agitation”, “Desire” and “Obligation”. The category is an apparent meaning. Actually, the topic of this target information looks like “Terrorism”. This difference causes the rumor. Therefore, to recognize implicit intention is important. The “Agitation” is the largest value. It means that this information has some possibility of granting plausibility of agitation with any intention. And the center matrix is same category and stronger “Agitation”. The right matrix has the “Agitation” and the “Desire”. The intention matrix is changing in process of spreading from stage one to stage two and three. In stage four, the intention is convergence for two matrices. Both matrices have strong “Agitation”. Overall, this information has the intention that is to agitate people. Likewise, I input ID2 and ID3. Figure 5.10 shows the matrix node graph of the target information ID2. This data has only two stages because of the time window.

50
Figure 5.10. The matrix node graph of dataset ID2.
However, this matrix node graph has many more edge than ID1. From this matrix node graph, there is a variety of information that has different intentions occurring in the same time window. Figure 5.11 shows the matrix node graph of the target information ID3.
Figure 5.11. The matrix node graph of dataset ID3.
This data has only three nodes and two edges. This target information has 10 co-occurrence information; however, it converges to 2 stages and 3 types of rumor. All matrices have the same intention but different values for each. This means that implicit intention is the same. However, the degree of the intention is different. The large value means stronger intention. By this experiment, I could confirm that the system could generate the matrix node graph when the target information was inputted. The intention is recognized by classification of the intention matrix and the degree of its value. The temporal transition is also derived by this data structure.

51
Experiment 2. Calculate the Distance of the Matrix Node Graph: In experiment two, I verify whether the system calculates the distance between two matrix node graphs of the target information. I verify how much distance exists between ID1 and ID2, ID1 and ID3, ID2 and ID3. This value is calculated based on the formulas (8) and (9). Table 5.3 shows the result of the experiment 2.
Table 5.3. The result of experiment 2.
Comparing Set Distance Between Matrices Distance Between Graphs
ID1 & ID2 1.05042 9
ID1 & ID3 0.78108 13
ID2 & ID3 0.3695 14
According to this result, the distance between two matrices and the two graphs are calculated. These two distances indicate the similarity of the matrix node graph. This result shows that ID2 and ID3 have the most similar intention matrix. However, these two graphs are not the most similar. On the contrary, ID1 and ID2 have the most similar graphs and intention is not the most similar. It means that ID2 and ID3 have similar intention but the tendency of spread is not similar. ID1 and ID2 are similar tendency of spread but the intention is not similar. By this experiment, I could confirm that the system can calculate the distance between two matrices and the distance between two graphs.
5.7. Consideration and Discussion
In these experiments, I verified the feasibility and practicability of the matrix node graph. To show the usage of the matrix node graph data structure, I implemented the credibility assessment system with this data structure. In the first experiment, I confirmed that the system could generate the matrix node graph. The matrix node graph is generated in each dataset based on the generation method of Figure 5.5. At this time, I defined the time window to 3 hours. If the time window changed, the structure of the matrix node graph would be change. Therefore, I need to consider how to define the time window. To use the matrix node graph, I can visualize the temporal transition of the intention. Especially with the first stage and final stage of the matrix node graph, I can find how different the intention or how convergent the intention. In the second experiment, I confirm the system could calculate the distance between two matrices and two graphs. These values indicate the similarity of the two graphs. In this time, to calculate the similarity of two matrix node graphs, I calculate distance between matrices and graphs. These two values show the similarity of the two matrix node graphs. However I need to consider this calculation model. For example, I assumed the correlations of matrices and graphs are easier to express the result. In this section, I introduced the matrix node graph data structure and its application to the credibility assessment system with temporal transition of intention. This data structure can recognize the intention of the information provider and can trace temporal transition of the intention. It can be applied to a classification problem with time series

52
change. And the characteristic of this data structure is that it can be realized to reasoning the result of the system by indicating the temporal transition and its intention changing. There were some challenges to derive objectivity. One of them is what are an appropriate methods or algorithms to derive objectivity. Another one is how to find rumor and how to trace its temporal transition. To solve these problems, I proposed new data structure.
6. Conclusion
People who want to verify the credibility of information can always check its veracity. They do not need the credibility assessment. However, people who believe rumor or spread rumor never check the veracity. This is the most difficult problem in credibility assessment field. Therefore, I need a new credibility calculation system to integrate with existing and legacy information retrieval systems to show objectivity to users forcibly. Uncertain information problems are the communication field problem. It is difficult to recognize whether the information is rumor or not. Therefore, it is necessary to derive objectivity and forcibly show to people what the degree the objectivity is.
6.1. Summary
My proposal is general concept of a credibility assessment. It is consisted by several essential methods. One of them is the matching with primary resources by language processing. Second one is to integrate sensor data. There is no specialized method to evaluate credibility assessment system. Then, I proposed an evaluation model of credibility assessment system. However, what kind of methods for the matching with primary resources by language processing and integrating sensor data depend on the choice of users. Therefore, I proposed new methods that were specialized for deriving objectivity by language processing and integrating sensor data. Those are the sensor selection and the matrix node graph data structure.

53
Figure 6.1. The construction of my method.
Figure 6.1 shows the construction of my method. This is A Credibility Assessment Method by Integrating Multiple Data Sources.
6.2. Future Work
For future work, I have the following challenges to solve. First one is the output method. As mentioned before, people who believe rumor or spread rumor never use a credibility assessment system. How to let non-technical users use the credibility assessment system should be considered. It is necessary to integrate a credibility assessment system for an information retrieval system. Or I need to consider implementing a new information retrieval system with the credibility assessment method that I proposed. The ideal shape is to integrate a credibility assessment system with all existing information systems or social networking platforms. Therefore, I consider the integration method of a credibility assessment method to software engineering [102]. I need to establish an integration method of credibility assessment system for all information systems easily Second one is about a sensor data and activity recognition. For deriving objectivity, detection and connection of some events in real world. In addition to online data, physical data that can observe by sensor is needed. To use the physical data more effective, social sensor and activity recognition are required. A social sensor is not physical sensor. It is usage of data from social network platform. This technique tries to detect some event from SNS as a sensor [10, 41, 55, 64, 73]. A social sensor can detect some events such as earthquake [60] and train status [67]. And an activity recognition aims to provide accurate and opportune information on people’s activity by leveraging sensory data in today’s sensory rich environment. These situation-based methods are proposed not only credibility assessment field [83]. The goal of activity recognition is to understand and predict activity in real world [88]. This kind of research can be observed disasters, transportation and some events by human activity data from smart devices [40]. This technique is necessary to credibility assessment using sensor data. Third one is the credibility assessment method for image processing as well as language processing. Artificial Intelligence (AI) technology such as machine learning
Concept: Credibility Assessment Method by Integrating Multiple Data Sources
Language Processing Sensor Data
Evaluation Model
The Matrix Node Graph
The Sensor Selection Method

54
or deep learning begun to advance in the field of the credibility assessment. It accelerates the speed of increasing the rumor. In this field, the battle between the side that creates rumor and the side that sees through rumor would begin. Recently, the Deep Fake has emerged, and it has become hot topic on credibility assessment field [25], [85]. This technology generates fake images and fake videos. Due to the Deep Fake, there is possibility to lose values of images and videos as evidence. We need to counter this situation. Finally, data collection is also a big challenge. To develop the credibility assessment techniques, I need a large volume of dataset of rumor. It is difficult challenge because the rumor is recognized after the situation has converged. And social data is dirty. The data has various types such as colloquial form. There are some researches to make database of rumor [42, 47, 80, 81]. I need to continue to try to make rumor dataset as open data. The field of a credibility assessment would be a big topic of computer science. I need to establish the fundamental technology of the credibility assessment.
Acknowledgement
I am grateful to Professor Akira Hattori and Assistant Professor Naoki Ishibashi for having a very useful discussion. And I appreciate for Professor En Ko and Professor Yoko Kagami for great advice. I would like to thank to Professor Naofumi Yoshida for great support for proceed all my work.
References
[1] A. Aker, L. Derczynski, K. Bontcheva, Simple Open Stance Classification for Rumour Analysis, arXiv: 1708.05286v1 [cs.CL], 17 Aug 2017.
[2] A. Dang, A. Moh’d, E. Milios, R. Minghim, What is in a Rumor: Combined Visual Analysis if Rumor Flow and User Activity, Comput. Graph. Int., XXXIII, 2016.
[3] A. Dang, M. Smit, A. Moh’d, R. Minghim, E. Milios, Toward understanding how users respond to rumours in social media In Proceedings of the 2016 IEEE/ACM International Conference on Advances in Social Networks Analysis and Mining (ASONAM’16). IEEE, 777–784.
[4] A.E. Marwick, Why Do People Share Fake News: A Sociotechnical Model of Media Effects, GEORGETOWN LAW TECHNOLOGY REVIEW Vol 2.2, p474-512, 2018.
[5] A. Gupta, P. Kumaraguru, C. Castillo, P. Meier, TweetCred: A Real-time Web-based System for Assessing Credibiity of Content on Twitter, arXiv:1405.5490v1 [cs.CR], 21 May 2014.
[6] A.J Flanagin, M.J Metzger, The Credibility of volunteered geographic information, GeoJournal. 72:137-148, Published online, 2008.
[7] A.J Flanagin, M.J Metzger, The Role of Site Features, User Attributes, and Information Verification Behaviors on the Perceived Credibility of Web-based Information, New Media Society 2007; 9; 319, DOI: 10.1177/1461444807075015, Los Angeles, London, New Delhi and Singapore, 2007.
[8] A. Joshi, D.S. Bhilare, Event Based Rumor Detection on Social Media for Digital Forensics and Information Security, International Journal on Recent and Innovation Trends in Computing and Communication, Volume: 5 Issue: 6, June 2017.
[9] A. Sanfeliu, K.S. Fu, A Distance Measure Between Attributed Relational Graphs for Pattern Recognition, IEEE Transaction on Systems, Man and Cybernetics, Vol. SMC-13, No3, 1983.
[10] A. Sheth, Citizen Sensing, Social Signals, and Enriching Human Experience, IEEE Internet Computing Magazine, vol.13, no.4, pp.80–85, 2009.
[11] A.Umejima, M. Miyabe, E. Aramaki, A. Nadamoto, Tendency of Rumor and Correction Re-tweet on the Twitter during Disasters, IPSJ SIG Technology Repor, vol.2011-DBS-152, No.4, vol.2011-IFAT-103, No.4 Information Processing Society of Japan, 2011.

55
[12] A. Wawer, R. Nielek, A. Wierzbicki, Predicting Webpage Credibility using Linguistic Features, Proceedings of the 23rd International Conference on World Wide Web, Pages 1135-1140, 2014.
[13] A.Y.K. Chua, S. Banerjee, Linguistic Predictors of RumorVeracity on the Internet, Proceedings of the International MultiConference of Engineers and Computer Scientists 2016 Vol I, IMECS 2016, Hong Kong, March 16 - 18, 2016.
[14] A. Zubiaga, A. Aker, K. Bontcheva, M. Liakata, R. Procter, Detection and Resolution of Rumours in Social Media: A Survey, ACM Computing Surveys vol.51, No.2, Article 32, 2018.
[15] A. Zubiaga, M. Liakata, R. Procter, G. W. S. Hoi, P. Tolmle, Analysing How People Orient to and Spread Rumours in Social Media by Looking at Conversational Threads, PLoS ONE (2016) 11(3), 10.1371/journal.pone.0150989(DOI), 2016.
[16] B. Balcerzak, W. Jaworski, A. Wierzbicki, Application of TextRank Algorithm for Credibility Assessment, ACM International Joint Conference on Web Intelligence (WI) and Intelligent Agent Technologies (IAT), 2014.
[17] B. G. Patra, D. Das, S. Bandyopadhyay, JU NLP at SemEval-2016 Task 6- Detecting Stance in Tweets using Support Vector Machines, SemEval 2016 - 10th International Workshop on Semantic Evaluation, Proceedings (2016) 440-444, 2016.
[18] B.J. Fogg, H. Tseng, The Elementsof Computer Credibility, CHI ‘99 Pittsburgh PA USA, ACM 1999 0-201-48559-1/99/05, 1999.
[19] B.J. Fogg, L. Marable, J. Stanford, E.R. Tauber, How Do People Evaluate a Web Site’s Credibility? Results from Large Study, Persuasive Technology Lab Stanford University, October. 29, 2002.
[20] C. Boididou, S. Papadopoulos, Y. Kompatsiaris, S. Schifferes, N. Newman, Challenges of Computational Verification in Social Multimedia, International World Wide Web Conference Committee (IW3C2), WWW’14 Companion, April 7–11, 2014, Seoul, Korea. ACM 978-1-4503-2745-9/14/04, 2014.
[21] C. Castillo, M. Mendoza, B. Poblete, Predicting Information Credibility in Time-Sensitive Social Media, Internet Research Vol. 23 No. 5, 2013, pp. 560-588, DOI 10.1108/IntR-05-2012-0095, 2013.
[22] C. Ogiue, Inspect: Rumors in the Great East Earthquake (Japanese), Kobunsha Co., Ltd., 2011. [23] C. Pornpitakpan, The persuasiveness of source credibility: A critical review of five decades' evidence,
Journal of Applied Social Psychology, 34(2):243-281, 2004. [24] D. Davidson, Subjective, Intersubjective, Objective, Oxford University Press Inc, New York, 2007. [25] D. Guera, E.J. Delp, Deepfake Video Detection Using Recurrent Neural Networks,1 5th IEEE
International Conference on Advanced Video and Signal Based Surveillance (AVSS), 2018. [26] E. Kochikina, M. Liakata, I. Augenstein, Turing ad SemiEval-2017 Task 8: Sequential Approach to
Rumour Stance Classification with Branch-LSTM, Proceedings of the 11th International Workshop on Semantic Evaluations (SemEval-2017), pages 475–480, Vancouver, Canada, August 3 - 4, 2017.
[27] E. Koutorouli, A. Tsalgatidou, Reputation Systems Evaluation Survey, ACM Computing Surveys, Vol. 48, No. 3, Article 35, Publication date: December 2015.
[28] F. Yang, X. Yu, Y. Liu, M. Yang, Automatic Detection of Rumor on Sina Weibo, Proceedings of the ACM SIGKDD International Conference on Knowledge Discovery and Data Mining (2012), 10.1145/2350190.2350203(DOI), 2012.
[29] G.W. Allport, L. Postman, The Psychology of Rumor, Henry Holt and Company, New York, 1947. [30] G. Cai, H. Wu, R. Lv, Rumors Detection in Chinese via Crowd Responses, In Proceedings of the E/ACM
International Conference on Advances in Social Networks Analysis and Mining (ASONAM’14). IEEE, 912–917, 2014.
[31] H. Allcott, M. Gentzkow, Social Media and Fake News in the 2016 Election, Journal of Economic Perspectives, Volume 31, Number 2, Pages 211–236, Spring 2017.
[32] H. Kwak, C. Lee, H. Park, S. Moon, What is Twitter: a Social Network or a News Media, Proceedings of the 19th International Conference on World Wide Web, WWW '10, 591-600, 10.1145/1772690.1772751(DOI), 2010.
[33] H.S. Lim, Y.S. Moon, E. Bertino, Provenance-based Trustworthiness Assessment in Sensor Networks, ACM,Very Large Data Base Endowment (VLDB), DMSN’10, Singapore, September 13, 2010.
[34] J. Du, R. Xu, Y. He, L. Gui, Stance Classification with Target-Specific Neural Attention Networks, Proceedings of the Twenty-Sixth International Joint Conference on Artificial Intelligence (IJCAI-17), 3988-3994, 2017.
[35] J. Mizuno, C. Kruengkrai, K, Ohtake, C. Hashimoto, K. Torisawa, J. Kloetzer, Performance Evaluation of Disaster Information Analysis System DISAANA and its Question Answering Mode (in Japanese), IPSJ SIG Technical Report vol.2015-MBL-76No, 14 vol.2015-CDS-14 (2015), NO.14.
[36] J. Ma, W. Gao, K.F. Wong, Rumor Detection on Twitter with Tree-structured Recursive Neural Networks, Proceedings of the 56th Annual Meeting of the Association for Computational Linguistics (Long Papers), pages 1980–1989, Melbourne, Australia, July 15 - 20, 2018.

56
[37] J. Ma, W. Gao, K.F. Wong, Detect Rumors in Microblog Posts Using Propagation Structure via Kernel Learning, ACL 2017 - 55th Annual Meeting of the Association for Computational Linguistics, Proceedings of the Conference (Long Papers) (2017) 1 708-717, 10.18653/v1/P17-1066(DOI), 2017.
[38] J. Maddock, K. Starbird, H. Ai-Hassani, D.E. Sandval, M. Orand, R.M. Mason, Characterizing Online Rumoring Behavior Using Multi-Dimensional Signatures, CSCW 2015 - Proceedings of the 2015 ACM International Conference on Computer-Supported Cooperative Work and Social Computing (2015) 228-241, 10.1145/2675133.2675280(DOI), 2015.
[39] J. Surowiecki, The Wisdom of Crowds. Anchor 2009. [40] J.W. Lockhart, T. Pulickal, G.M. Weiss, Applications of mobile activity recognition. In Proceedings of
the 2012 ACM Conference on Ubiquitous Computing (UbiComp’12). ACM, New York, NY, 1054–1058, 2012.
[41] J. Zhao, S. Liu, Y. Liu, Towards Event Detection and Summarization on Microblogging Platforms, Advanced Science and Technology Letters Vol.123 (CST 2016), pp.206-210 http://dx.doi.org/10.14257/astl.2016.123.38, 2016.
[42] K. Driscoll, S. Walker, Working Within Black Box: Transparency in the Collection and Production of Big Twitter Data, International Journal of Communication 8, 1745-1764, 2014.
[43] K. Kumagai, T. Uchibayashi, T. Abe, T, Suganuma, A Method of Weather Prediction on Local Area Using Sensor Data for Advanced Town Management, IPSJ SIG Technical Report, Vol.2016-IS-138, No.10, 2016.
[44] L. Derczynski, K. Bontcheva, M. Liakata, R. Procter, G. Hoi, A. Zubiaga, SemEval-2017 Task 8: RumourEval: Determining Rumour Veracity and Support for Rumours, arXiv: 1704.05972v1 [cs.CL], 20 Apr, 2017.
[45] M. Baum, F. Menczer, G. Pennycook, S.A. Sloman, The Science of Fake News, Article in Science, VOL.359 ISSUE 6380, DOI: 10.1126/science.aao2998, 8 MARCH 2018.
[46] M. Babakar, W. Moy, The State of Automated Factchecking: How to Make Factchecking Dramatically More Effective with Technology I Have Now, Full Fact, August 2016.
[47] M. Dias, K. Becker, INF-UFRGS-OPINION-MINING at SemEval-2016 Task 6- Automatic Generation of a Training Corpus for Unsupervised Identification of Stance in Tweets, SemEval 2016 - 10th International Workshop on Semantic Evaluation, Proceedings (2016) 378-383, 2016.
[48] M.J. Metzger, A.J. Flanagin, Credibility and Trust of Information in Online Environments: The Use of Cognitive Heuristics, Journal of Pragmatics 59 (2013) 210—220, ELSEVIER, 2013.
[49] M.J. Metzger, A.J. Flanagin, L, Zwarun, College student Web use, perceprions of information credibility, and verification behavior, Computers & Education 41 (2003) 271–290, 2013.
[50] M.J. Metzger, Making Sense of Credibility on the Web: Models for Evaluating Online Information and Recommendations for Future Research, JOURNAL OF THE AMERICAN SOCIETY FOR INFORMATION SCIENCE AND TECHNOLOGY, 58(13):2078–2091, 2007.
[51] M. Kang, Measuring Social Media Credibility: A Study on a Measure of Blog Credibility, Institute for Public Relations, 2010.
[52] M. Lukasik, K. Bontcheva, T. Cohn, A. Zubiaga, M. Liakata, R. Procter, Gaussian Processes for Rumour Stance Classification in Social Media, ACM Transactions on Information Systems (2019) 37(2), 10.1145/3295823(DOI), 2019.
[53] M. Lukasik, P. Srijith, D. Vu, K. Bontcheva, A. Zubiaga, T. Cohn, Hawkes Processes for Continuous Time Sequence Classification- an Application to Rumour Stance Classification in Twitter, 54th Annual Meeting of the Association for Computational Linguistics, ACL 2016 - Short Papers (2016) 393-398, 2016.
[54] M. Lukasik, T. Cohn, K. Bontcheva, Classifying Tweet Level Judgements of Rumours in Social Media, Conference Proceedings - EMNLP 2015: Conference on Empirical Methods in Natural Language Processing (2015) 2590-2595, 2015.
[55] M. Nagarajan, K. Gomadam, A.P. Sheth, A. Ranabahu, R. Mutharaju, and A. Jadhav, Spatiotemporal- Thematic Analysis of Citizen Sensor Data: Challenges and Experiences, Proc. 10th International Conference on Web Information Systems Engineering, pp.539–553, 2009.
[56] N. Diakopoulos, M.D. Choudhury, M. Naaman, Finding and Assessing Social Media Information Sources in the Context of Journalilsm, ACM 978-1-4503-1015-4/12/05, CHI’12, Austin, Texas, USA, May 5–10, 2012.
[57] N. Sekiya, Reputation Damage: Thinking about its Mechanism (in Japanese), Kobunsha Inc., 2011. [58] N. Yoshida, M. Tanaka, S. Wada, Development of the Zoo Animal Husbandly Management System with
Sensor Data, IPSJ SIG Technical Report, Vol. 2014-IS-130 No.8, 2014. [59] P. Gencheva, P. Nakov, L. Marquez, A. Barron-Cedeno, I. Koychev, A Context-Aware Approach for
Detecting Worth-Checking Claims in Political Debates, nternational Conference Recent Advances in Natural Language Processing, RANLP (2017) 2017-September 267-276, 10.26615/978-954-452-049-6-037(DOI), 2017.

57
[60] P.S Earle, D.C. Bowden, M. Guy, Twitter Earthquake Monitoring in a Social World, ANNALS OF GEOPHYSICS, 54, 6, 2011; doi: 10.4401/ag-5364, October 14, 2011.
[61] R.E. Kasperson, O. Renn, P. Slovic, H.S. Brown, J. Emel, R. Goble, J.X. Kasperson, S. Ratick, The Social Amplification of Risk: A Conceptual Framework, Risk Analysis (1988) 8(2) 177-187, 1988.
[62] R. Solnit, A Paradise Built in Hell: The Extraordinary Communities that Arise in Disaster, Penguin Books, 2010.
[63] S. Hamiian, M. Diab, Rumor Detection and Classification for Twitter Data, SOTICS 2015: The Fifth International Conference on Social Media Technologies, Communication, and Informatics, 2015.
[64] S. Hattori, Spatio-Temporal Propagation for Web Sensors, Proceedings of the International Conference on Computer Science, Computer Engineering, and Social Media, Thessaloniki, Greece, 2014.
[65] S. Kwon, M. Cha, Modeling Busrty Temporal Pattern of Rumors, Proceedings of the Eighth International AAAI Conference on Weblogs and Social Media, Association for the Advancement of Artificial Intelligence, 2014.
[66] S. Kwon, M. Cha, K. Jung, Rumor Detection over Varying Time Windows, PLoS ONE (2017) 12(1), 10.1371/journal.pone.0168344(DOI), 2017.
[67] S. Nagano, K. Ueno, K. Cho, Development of a System Detecting Train Status Information from Social Sensors, IEICE Journal D, Vol. J96–D No. 10 pp. 2262–2273, 2013.
[68] S. Tseng, B.J. Fogg, Credibility and Computing Technology, Communications of ACM vol. 42 (1999), No.5, ACM.
[69] S. Vosoughi, D. Roy, S. Aral, The Spread of True and False News Online, Science 09, Vol. 359, Issue 6380, pp. 1146-1151, 10.1126/science.aap9559 (DOI), Mar 2018.
[70] S. Vosoughi, M. Mohsenvand, D. Roy, Rumor Gauge: Predicting the Veracity of Rumors on Twitter, ACM Transactions on Knowledge Discovery from Data (2017) 11(4), 10.1145/3070644(DOI), 2017.
[71] S. Young, B. Hilligoss, College Student’s Credibility Judgments in the Information-Seeking Process, MA. 49-72, The MIT press, 2008.
[72] T. Noor, Q. Sheng, S. Zeadally, J. Yu, Trust Management of Services in Cloud Environments: Obstacles and Solutions, ACM Comput. Surv.46, 1, Article12 ACM, 2013.
[73] T. Sakaki, Y. Matsuo, Twitter as a Social Sensor: Can Social Sensors Exceed Phsical Sensors, JSAI Journal vol.27, no.1, pp.67–74, 2012.
[74] T. Sato, Rumors and Information: Collection of Rumor Research (in Japanese), Shibundo Inc, 1999. [75] T. Shibutani, IMPROVISED NEWS: A Sociological Study of Rumor, Tokyo Sogensha Co., Ltd., 1966. [76] T. Tanaka, T. Nakao, T. Ogawa, M. Tsukamoto, S. Hishio, A Design of a Data Collection and
Management System for Large Scale Ubiquitous Sensor Networks, IPSJ Journal Database, Vol.46, No.SIG 5 (TOD 25), Mar. 2005.
[77] T. Uchino, Reliability assessment and analysis in the informal retweet of Twitter, Iwate Prefecture University Faculty of Software and Information Science, 2013.
[78] T. Yamagishi, Reliability Structure (in Japanese), Tokyo University Publication, 1998. [79] V. Fresno, A. Zubiaga, H. Ji, R. Martinez, Exploiting Geolocation, User and Temporal Information for
Monitoring Natural Hazards on Twitter, Proces. Leng. Nat. 54 (2015), 85–92, 2015. [80] V. Quazvinian, E. Rosengren, D. Radev, Q. Mei, Rumor has it: Identifying Misinformation in Microblogs,
Proceedings of the 2011 Conference on Empirical Methods in Natural Language Processing, pages 1589–1599, Edinburgh, Scotland, UK, July 27–31, 2011.
[81] W. Ferreia, A. Vlachos, Emergent: a novel data-set for stance classification, proceedings of the 2016 conference of the North American Chapter of the Association for Computational Linguistics: Human Language Technologies (2016), pp.1163-1168.
[82] Y.C. Chen, Z.Y. Liu, H.Y. Kao, IKM at SemEval-2017 Task 8: Convolutional Neural Networks for Stance Detection and Rumor Verification, Proceedings of the 11th International Workshop on Semantic Evaluations (SemEval-2017), pages 465–469, Vancouver, Canada, August 3 - 4, 2017.
[83] Y. Hasegawa, M. Oguchi, An Access Control Method which depends on the Situation based on a Judgment of Emergency. DEIM Forum, 2013.
[84] Y. Kawakami, Propagation of Rumors: Social Psychology of Information Propagation (in Japanese), Science Inc., 1997.
[85] Y. Li, S. Lyu, Exposing DeepFake Videos by Detecting Face Warping Artifacts, Computer Vision and Pattern Recognition (cs.CV), CVPRW, 2019.
[86] Y. Yamamoto, K. Tanaka, Enhancing Credibility Judgement of Web Search Result, ACM978-1-4503-0267-8/11/05, CHI 2011, Vancouver, BC, Canada, May 7-12, 2011.
[87] Y. Yamamoto, K. Tanaka, Modelling and Measuring Web Information Credibility by Analyzing Support Relation between Data-pairs, Database vol.3 (2010), No.2, pp. 61-79, Information Processing Society of Japan.
[88] Z.S. Abdallah, M.M. Gaber, B. Srinivasan, S. Krishnaswamy, Activity Recognition with Evolving Data Streams: A Review, ACM Computing Surveys, Vol. 51, No. 4, Article 71. Publication date: July 2018.

58
[89] Z. Zhao, P. Resnick, Q. Mei, Enquiring Minds- Early Detection of Rumors in Social Media from Enquiry Posts, Proceedings of the 24th International Conference on World Wide Web, pp.1395-1405, 2015.
[90] BBC News, burned to death because of a rumour on Whatsapp, https://www.bbc.com/news/world-latin-america-46145986, refer: 2018.
[91] Metrological Agency in Japan, http://www.jma.go.jp/jma/index.html, refer: 2018. [92] National Research Institute for Earth Science and Disaster Resilience, http://www.bosai.go.jp/e/, refer:
2015. [93] PHEME, Datasets of Rumours and non-Rumours,
https://figshare.com/articles/PHEME_dataset_of_rumours_and_non-rumours/4010619, refer: 2018. [94] Sankei News, Honey Recipe, https://www.sankei.com/life/news/170418/lif1704180014-n2.html, refer:
2017. [95] Sankei News, Lion Rumor, https://www.sankei.com/west/news/160720/wst1607200109-n1.html, refer:
2016. [96] Toyo Keizai Online, WELQ problem, https://toyokeizai.net/articles/-/149965, refer: 2016. [97] Yahoo! Japan, Disaster Prevention with Big Data, https://fukko.yahoo.co.jp/bigdata/, refer: 2019.
References (Author Related)
[98] K. Honda, N. Ishibashi, N. Yoshida, An Implementation Method of Credibility Calculation System for Emergency such as Natural Disasters. Communications in Computer and Information Science 637, New Trends in Databases and Information Systems (2016), Proceedings, Springer, pp.193-201.
[99] K. Honda, N. Yoshida, An Evaluation Model of Credibility Calculation System for Natural Disasters, Information Modelling and Knowledge Bases XXIX vol. 301 Frontiers in Artificial Intelligence and Applications (2017), IOS Press, pp. 429-440, 10.3233/978-1-61499-834-1-429(DOI).
[100] K. Honda, N. Yoshida, A Sensor Selection and Learning Method for Credibility Assessment Using Sensor Data, Information Modelling and Knowledge Bases XXX vol. 302 Frontiers in Artificial Intelligence and Applications (2018), IOS Press, pp.400-414, 10.3233/978-1-61499-933-1-400(DOI).
[101] K. Honda, N. Yoshida, A Matrix Node Graph Data Structure and Its Application for Credibility Assessment with Temporal Transition of Intention, Information Modelling and Knowledge Bases XXXXI vol. 303 Frontiers in Artificial Intelligence and Applications (2019), IOS Press, (preparing for publication).
[102] K. Flykt, K. Honda, A. Dahanayake, N. Yoshida, A Sensor Data Integration Method and Its Implementation by Software Engineering, WebDB Forum 2019, Poster Session P-35, Tokyo, Japan, 8-9, 2019.
Publications
Journals K. Honda, N. Yoshida, A Matrix Node Graph Data Structure and Its Application for Credibility Assessment with Temporal Transition of Intention, Information Modelling and Knowledge Bases ⅩⅩⅩI, Vol.303, Frontiers in Artificial Intelligence and Applications, IOS Press, (preparing for publication). K. Honda, N. Yoshida, A Sensor Selection and Learning Method for Credibility Assessment Using Sensor Data, Information Modelling and Knowledge Bases ⅩⅩⅩ, Vol.302, Frontiers in Artificial Intelligence and Applications, IOS Press, pp.400-414, 10.3233/978-1-61499-933-1-400(DOI). K. Honda, N. Yoshida, An Evaluation Model of Credibility Calculation System for Natural Disasters, Information Modelling and Knowledge Bases ⅩⅩⅠⅩ, Vol.301, Frontiers in Artificial Intelligence and Applications, IOS Press, pp.429-440, 10.3233/978-1-61499-834-1-429(DOI).
International Conferences K. Honda, N. Yoshida, A Matrix Node Graph Data Structure and Its Application for Credibility Assessment with Temporal Transition of Intention, The 29th International Conference on Information Modelling and Knowledge Bases (EJC2019), Lappeenranta, Finland, June 3-7, 2019.

59
K. Honda, N. Yoshida, A Sensor Selection and Learning Method for Credibility Assessment Using Sensor Data, The 28th International Conference on Information Modelling and Knowledge Bases (EJC2018), Riga,Latvia,June 4-8, 2018. K. Honda, N. Yoshida, An Evaluation Model of Credibility Calculation System for Natural Disasters, The 27th International Conference on Information Modelling and Knowledge Bases (EJC2017), Krabi,Thailand,June 5-9, 2017. K. Honda, N. Ishibashi, N. Yoshida, An Implementation Method of Credibility Calculation System for Emergency such as Natural Disasters, 20th East-European Conference on Advances in Databases and Information Systems (ADBIS2016), workshop: DCSA – Data Centered Smart Applications, (Communications in Computer and Information Science 637, New Trends in Databases and Information Systems, ADBIS 2016 Short Papers and Workshops, BigDap, DCSA, DC, Prague, Czech Republic, August 28-31, 2016 Proceedings, Springer), pp.193-201,2016.
Conferences (Japan) K. Flykt, K. Honda, A. Dahanayake, N. Yoshida, A Sensor Data Integration Method and Its Implementation by Software Engineering, WebDB Forum 2019, Poster Session P-35, Tokyo, Japan, 8-9, 2019.
本多 賢, 吉田 尚史, センサーデータを用いた信憑性評価を対象としたセンサー選択及び学習方式, 第10回データ工学と情報マネジメントに関するフォーラム (第 16回日本データベース学会年次大会),福井,2018年 3月 4日~3月 6日,2018. 本多 賢, 吉田 尚史, 自然災害などの緊急時における情報の信憑性計測システムの実現方式, 第 8回データ工学と情報マネジメントに関するフォーラム (第 14 回日本データベース学会年次大会),福岡,2016年 2月 29日~3月 2日,2016.