Embed Size (px)
Citation preview

A STUDY INTO THE SKIDDING RESISTANCE OF ROADS IN THE PROVINCE OF KWA-ZULU NATAL – STATUS QUO AND PROPOSALS FOR FURTHER INVESTIGATION
Simon TetleyDirector, ARRB Systems Africa

TOPICS
• Factors Influencing Skid Resistance• Methods for Measuring Skid Resistance • Typical Skid Resistance Requirements• Selection of Test Sites• Results of Investigation• Summary of Test Results• Conclusions and Recommendations

SOME ACCIDENT STATISTICS IN SOUTH AFRICA
• Nearly 135 000 road crash fatalities during the past 10 years, • An average of a +/‐ 40 deaths per day. • Latest SANRAL statistics HDM4 fatality cost is R1,000,000 =
cost to economy of around R 14.6 Billion per year • Enough to reseal around 5,000 kilometres of road

FACTORS INFLUENCING SKID RESISTANCE
• Micro‐texture – surface texture of the aggregate
• Influences wet and dry skid resistance at all speeds but predominates at low speeds
* May vary from 48 to 51 depending upon traffic volume (AADT)

FACTORS INFLUENCING SKID RESISTANCE
Macro‐texture – depends on shape & size of aggregate on the surface
• Has more influence on wet and dry skid resistance at higher speeds
• High macro‐texture improves the water drainage capacity, enabling the tyre to remove water, thus improving skid resistance.

METHODS USED FOR MEASURING SKID RESISTANCE
British Pendulum Tester – primarily measures micro‐texture; it measures the effect that micro‐texture has on skid resistance at low vehicle speeds.
• Used for past 50 years to obtain BPT friction coefficient
• Same device is used to obtain PSV • Not suitable for continuous measurement of
skid resistance on a network level• Suited for:
‐ forensic exercise ‐ skid resistance measurement in isolated
areas‐ reference instrument. Testing is carried out after wetting the surface

METHODS OF MEASURING SKID RESISTANCEMETHODS OF MEASURING SKID RESISTANCE
Fixed Slip Device (e.g. AFST)
• The trailer is towed behind a vehicle with a water delivery system
• A water film of 1,0 mm used
• The data is collected on a laptop PC in the towing vehicle
• More suited to measurement of skid resistance on airport runways and at a project level investigation than entire road networks
METHODS USED FOR MEASURING SKID RESISTANCE

METHODS OF MEASURING SKID RESISTANCEMETHODS OF MEASURING SKID RESISTANCE
Sideways force measuring equipment• Integrated device, includes capability of
carrying out:‐ Rut depth measurement‐ Surface texture measurement‐ Roughness (IRI)‐ Geometry (slope, crossfall, gradient‐ Asset inventory imaging‐ GPS and distance‐ Friction measurement in both
wheel paths• The large 12KL tank enables 150 km friction
measurement in both wheel paths• Especially suited for assessment of full‐length
road networks
METHODS USED FOR MEASURING SKID RESISTANCE

METHODS OF MEASURING SKID RESISTANCEMETHODS OF MEASURING SKID RESISTANCE
Texture depth measurements ‐ using a high‐speed contactless laser profilometer
• The profile, which is a two‐dimensional representation of the surface, is generated by a number of lasers
• Calculates the Mean Profile Depth (MPD) and Mean Texture Depth (MTD), which is the average value of the profile depth over a predefined distance called the baseline.
METHODS USED TO MEASURING SKID RESISTANCE

METHODS OF MEASURING SKID RESISTANCEMETHODS OF MEASURING SKID RESISTANCE
Texture depth measurements ‐ Sand patch using the SANS 3001‐BT11: 2012 • A known volume of standard sand or glass
beads is poured in a cone shape onto the surface of the road
• It is then spread outwards in a circular shape until the tips of the stones are just visible and an even surface is obtained
• The diameter of the circular shape is measured and the Mean Texture Depth (MTD) is calculated.
METHODS USED FOR MEASURING SKID RESISTANCE

SITE CATEGORY SFC50 GN Dual carriageway 0.35 0.41 Single carriageway 0.40 0.47 Dual/single carriage with minor junctions & approaches to & across major junctions
0.45 0.53
Approaches to pedestrian crossings & other high risk situations
0.50 0.59
Roundabouts 0.45 0.53 Gradients 5 to 10% longer than 50m 0.45 0.53 Gradients >10% and longer than 50m 0.50 0.59 Bends radius < 500m, dual carriageway 0.45 0.53 Bends radius < 500m, single carriageway 0.50 0.59
TYPICAL SKID RESISTANCE REQUIREMENTS
Typical site categories & investigatory levels (UK standard HD 28/04)

TYPICAL SKID RESISTANCE REQUIREMENTS
Typical levels of risk & sideways force coefficients (NZTA T10 Specification)
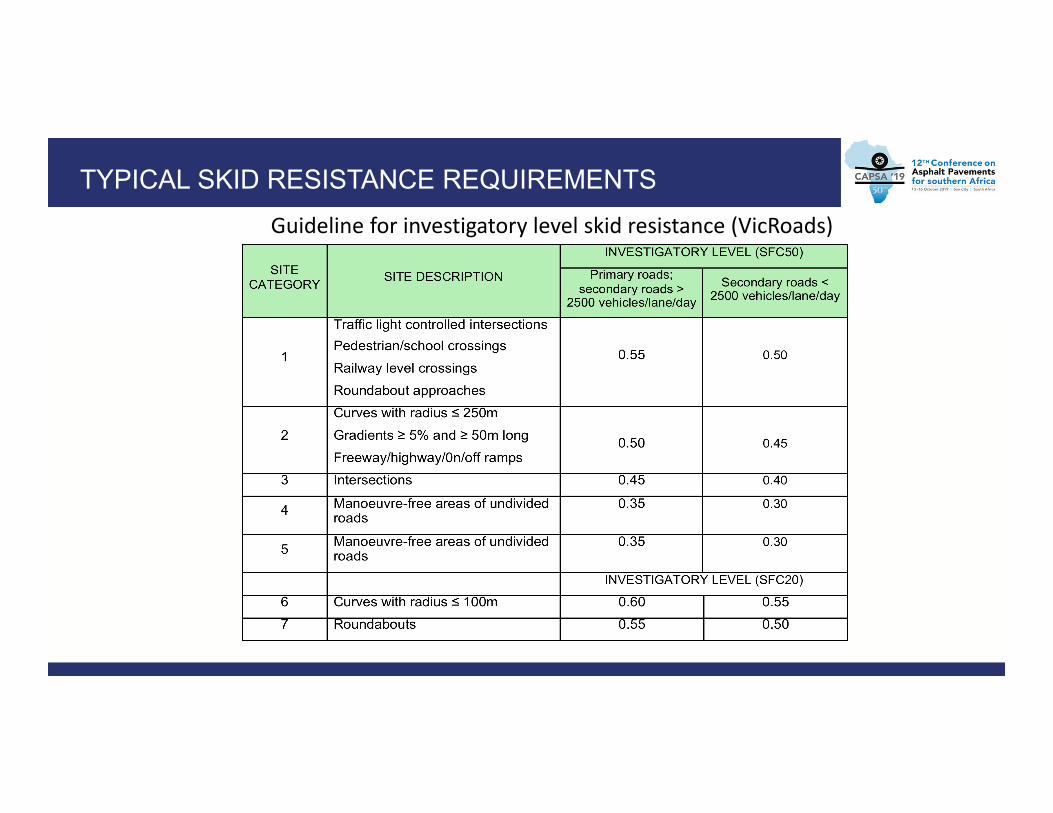
TYPICAL SKID RESISTANCE REQUIREMENTS Guideline for investigatory level skid resistance (VicRoads)

TYPICAL SKID RESISTANCE REQUIREMENTS
Whilst there is a fair amount of agreement between the various investigatory level requirements, it is necessary to take into account a number of factors to decide on the most appropriate levels for a particular country or region, such as basing them on zones of similar skid resistance demand, which is influenced by:
• average annual rainfall• population density• topography• traffic• climate/seasonal rainfall

TYPICAL SKID RESISTANCE REQUIREMENTS
COTO “Guidelines for Network Level Measurement of Skid Resistance and Texture” First Draft Version 0.0, December 2008
NOTE: Specific requirements for skid resistance are not prescribed in the COTO guidelines however reference is made to the site categories and investigatory levels described in UK Standard HD28/04.
There is the opportunity to build on these guidelinesto cater for South African conditions and hopefullyreduce our road accidents!

SELECTION OF TEST SITES
The selection of test sites was based on testing various kinds of surfacing, including:
• Chip seal surface treatments
• Asphalt (continuous graded, stone mastic asphalt, and ultra‐thin friction course)
• Jointed concrete pavement
Also on:• Age of the respective pavement since construction
• Different traffic volumes

RESULTS OF INVESTIGATION
Chip Seal Surfacing – Double Chip Seal
The relatively higher level of skid resistance on Road B could be due to the film ofbitumen on the aggregate having been removed by the passing traffic whereas it isstill present on Road A.

RESULTS OF INVESTIGATION
Continuously Graded Asphalt Surfacing
On Road C testing was also carried out on an area where smoothening of thesurface was visually evident. In this case a significantly lower MTD of 0.16 mm anda lower BPN value of 31 was achieved, it is therefore evident that the low texturedepth has contributed to a lower BPN.

Stone Mastic Asphalt (SMA) Surfacing
SMA surfaced roads have performed well in terms of friction. The lower ASFT friction values onthe more recently paved carriageway G1 could possibly be ascribed to the smoother surfacecaused by bitumen still coating the aggregate on the surface.
RESULTS OF INVESTIGATION

Ultra‐thin Friction Course (UTFC) Surfacing
Road I is performing well in terms of both texture and skid resistance, after approximately 4years under heavy traffic.Road J is also performing well, soon after the construction of the surfacing. It is possible thatskid resistance could still improve further, once micro‐texture is improved by tyres abrading thebinder on the aggregates’ surface.
RESULTS OF INVESTIGATION

Concrete Pavements
Based on these results the performance of these roads, in terms of textureand friction, particularly of Road L, is remarkably good considering their age.
RESULTS OF INVESTIGATION

SUMMARY : TESTS ON ROADS IN RURAL AREAS
ROAD SURFACE TYPE
ASFT MEAN
BPN PER SITE HD28/04 ViCRoads NZTA T10
A Double seal 0.50 55 0.40 0.50 0.50 B Double seal 0.75 66 0.40 0.50 0.50
C AC 0,50 65 0.40 0.50 0.50
D AC 0,75 44 0.40 0.50 0.50
E AC 0,68 50 0.40 0.50 0.50
ROAD SURFACE TYPE
ASFT MEAN
BPN PER SITE
HD28/04 VicRoads NZTA T10
K1 Concrete 0.57
N/A
0.35 0,50 0.50 K2 Concrete 0.58 0.35 0,50 0.50 L1 Concrete 0.72 0.35 0,50 0.50 L2 Concrete 0.74 0.35 0,50 0.50 K1 Concrete 0.57 0.35 0,50 0.50

ROAD SURFACE TYPE
ASFT MEAN
BPN PER SITE
HD28/04 ViCRoads NZTA T10
F SMA 0.73 56 0.45 0,55 0.55 G1 SMA 0.59
N/A 0.35 0,50 0.50
G2 SMA 0.73 0.35 0,50 0.50 H SMA 0.67 0.50 0,55 0.55 I1 UTFC 0.77
N/A
0.45 0,50 0.55 I2 UTFC 0.78 0.45 0,50 0.55 J1 UTFC 0.88 0.35 0,50 0.50 J2 UTFC 0.70 0.35 0,50 0.50
SUMMARY : TESTS ON ROADS IN URBAN AREAS

CORRELATION OF MPD AND ASFT FRICTION VALUES

LITERATURE STUDY
• Approximately 20% of all road accidents occurred during wet weather ‐ skid resistance of wet pavements has a major influence on the occurrence of wet‐weather accidents.
• The implementation of the International Friction Index (IFI) has been found problematic.
• The EC funded TYROSAFE project concluded that it would be difficult to achieve a common scale that accommodates all devices in all conditions and still obtain sufficient accuracy.
• Further work is being carried out to develop a European Standard for the assessment of skid resistance.
• Correlation between different types of skid testing devices was found to be poor in both PIARC and HERMES studies.
• Based on this Austroads concludes that each jurisdiction should carefully choose their most appropriate testing device and then retain its use over a long period.

CONCLUSIONS & RECOMMENDATIONS
• At present skid resistance measurement on a network basis is included as a non‐mandatory parameter in Road Asset Managements Systems.
• The importance of monitoring skid resistance as a way of reducing accidents, especially during wet weather, is obvious.
• Worthwhile extending this limited investigation to cover other surface types, road categories and other provinces in the country. Monitor the test sections at regular intervals eg, February; May; August; November?
• Clear lack of correlation between MPD and the friction values – a road’s skid resistance cannot be judged on texture measurements and may not even be indicative.
• Recommend that local conditions including seasonal effects such as local rain patterns, thunder storms, cold fronts, and drizzle, be included in the investigation.
• Develop local investigatory limits. Use Austroads or UK limits in meantime?