Embed Size (px)
Citation preview
A Structural and Spectroscopic Investigation of Hydrous
and Anhydrous Rare Earth Phosphates
A Thesis Submitted to the College of
Graduate and Postdoctoral Studies
In Partial Fulfillment of the Requirements
For the Degree of Doctor of Philosophy
In the Department of Chemistry
University of Saskatchewan
Saskatoon
By
Mohamed Ruwaid Rafiuddin
Copyright Mohamed Ruwaid Rafiuddin, December 2017. All rights reserved.

i
PERMISSION TO USE
In presenting this thesis/dissertation in partial fulfillment of the requirements for a Postgraduate
degree from the University of Saskatchewan, I agree that the Libraries of this University may
make it freely available for inspection. I further agree that permission for copying of this
thesis/dissertation in any manner, in whole or in part, for scholarly purposes may be granted by
the professor or professors who supervised my thesis/dissertation work or, in their absence, by
the Head of the Department or the Dean of the College in which my thesis work was done. It is
understood that any copying or publication or use of this thesis/dissertation or parts thereof for
financial gain shall not be allowed without my written permission. It is also understood that due
recognition shall be given to me and to the University of Saskatchewan in any scholarly use
which may be made of any material in my thesis/dissertation.
Requests for permission to copy or to make other uses of materials in this thesis/dissertation in
whole or part should be addressed to:
Head of the Department of Chemistry
University of Saskatchewan
Saskatoon, Saskatchewan S7N 5C9
Canada
OR
Dean
College of Graduate and Postdoctoral Studies
University of Saskatchewan
116 Thorvaldson Building, 110 Science Place
Saskatoon, Saskatchewan S7N 5C9
Canada
ii
ABSTRACT
Nuclear power plants provide clean energy for generating electricity via neutron induced fission
reactions of nuclear fuels and at the end of this energy generation process, radioactive waste is
produced. Currently, the waste is chemically incorporated into a glass matrix and the resulting
wasteform is destined for storage in geological repositories. Glass based wasteforms, however,
might corrode under repository conditions and could potentially release radionuclides to the
biosphere. Hence, crystalline wasteforms were proposed as an alternative to glass based
wasteforms and among the many materials studied, materials adopting the monazite- (REPO4;
RE = La to Gd) and xenotime- (RE’PO4; RE’ = Tb to Lu and Y) type structures were suggested
as a potential wasteform. Both monazite and xenotime are naturally abundant rare-earth minerals
containing significant amounts of U and Th and have remained stable on a geological time-scale.
Hydrous rare-earth phosphates adopting the rhabdophane-type structure (REPO4.nH2O; RE = La
to Dy) also exist in nature and are present on the surface of anhydrous rare-earth minerals (e.g.,
monazite). The hydrous phase may act as a secondary barrier by preventing the release of
actinides from reaching the biosphere. This thesis aims to provide an atomic level understanding
of hydrous and anhydrous rare-earth phosphates using X-ray based diffraction and spectroscopic
techniques.
A comprehensive account of the rich structural chemistry of rare-earth phosphates are
provided in Chapters 2 and 3 using X-ray diffraction (XRD) and X-ray absorption near-edge
spectroscopy (XANES). Crystalline materials containing radioactive wastes are prone to undergo
radiation-induced structural damage and, in Chapter 4, radiation damage studies on monazite-
and xenotime-type materials were conducted by simulating radiation damage events using high-
energy ion implantation. The results from this study depict the ability of these materials to
recover from the structural damage inflicted by high energy ion-implantation. In Chapter 5, the
chemical durability of rare-earth phosphates was studied by investigating leaching behaviour of
these materials in deionized water. Preliminary results suggest a faster leaching of hydrous rare-
earth phosphates when compared to their anhydrous counterparts. The information presented in
this thesis will contribute to the growing body of work on crystalline wasteforms for nuclear
waste immobilization.

iii
ACKNOWLEDGEMENTS
I would first like to thank my mom who has played a big part in my life for shaping me into the
person I am today. Mom – your love and support has kept me going even on the toughest days of
my life and words can’t express how grateful I am for all that you have done for me. Next, I
would like to thank my Dad for being selfless and for instilling the value of hard-work early on
in my life. I also wanted to thank my sister and other members of my extended family for their
support throughout my life. Finally, I would like to thank my cousin brothers (Dr. Abdul Rumaiz
and Mohammed Nooman) for encouraging me to pursue a Ph.D. in Chemistry as well as for
guiding and supporting me in both personal and academic life. Rumaiz – you have been
instrumental in my academic career and for this, I am indebted to you forever.
I would like to extend my heartfelt gratitude to my advisor, Dr. Andrew P. Grosvenor, for
all his support and guidance throughout my Ph.D. program. Andrew, I consider myself to be
fortunate to have you as my Ph.D. advisor and I would like to thank you for patiently answering
my questions as well as for providing instant and valuable feedback to my manuscripts, reports,
and thesis. I also wanted to thank you for granting academic freedom as well as for making sure
that I don’t digress from my Ph.D. research objectives. Next, I wanted to thank the members of
my Advisory Committee (Drs. Timothy Kelly, Stephen Urquhart, and Yuanming Pan) for their
support and valuable suggestions during my Ph.D. program. I would like to thank the current and
past members of the Grosvenor group for their help and support during my Ph.D. I would
especially like to thank Drs. Esther Rani Aluri, John Hayes, James Walker, Peter Blanchard, and
Vince for their help with XANES data collection which was presented in Chapters 2 – 5 of this
thesis. I would like to acknowledge Eric Mueller for his contribution to the work presented in
Chapter 2. I also wanted to thank Dr. Ester Rani Aluri for her help with the micro-XRD
experiments presented in Chapter 4 of this thesis. Finally, I would like to thank my friends in
Saskatoon for making my stay in Canada, a memorable one.
I also wanted to acknowledge the help I received from the beamline scientists at the
Canadian Light Source and Advanced Photon Source with regard to XAS data collection. Dr.
Yongfeng Hu, Dr. Qunfeng Xiao, and Ms. Aimee Maclennan from the SXRMB beamline at the
CLS are thanked for their help with XANES and glancing angle XANES experiments which was
iv
presented in Chapters 2 – 5 of this thesis. Dr. Lucia Zuin from the VLS-PGM beamline is
thanked for her help with XANES experiments presented in Chapters 2 – 5 of this thesis. Dr.
Tom Regier from the SGM beamline at the CLS is thanked for his help with the XANES
experiments presented in Chapter 2 of this thesis. Drs. Zou Finfrock, Matthew Ward, and Robert
Gordon from the 20 BM beamline at CLS@APS are thanked for their help with the XANES
experiments presented in Chapter 3 and 5 of this thesis. Drs. George Sterbinsky and Tianpin Wu
from the 9 BM beamline at the APS are thanked for their help with XANES experiments
presented in Chapter 5 of this thesis. Dr. Dimitre Karpuzov from the Alberta Centre for Surface
Engineering and Science, University of Alberta, is thanked for collecting the XPS spectra
presented in Chapter 2 of this thesis. Mr. Jack Hendriks from Interface Science Western,
University of Western Ontario is thanked for carrying out the ion-implantation studies which was
presented in Chapter 4 of this thesis. Mr. Jianzhong Fan from the Department of Geological
Sciences, University of Saskatchewan is thanked for collecting ICP-MS data presented in
Chapter 5 of this thesis. Dr. Robert Scott from the Department of Chemistry, University of
Saskatchewan is thanked for allowing me to use his TGA instrument to collect TGA data
presented in Chapter 3 of this thesis. Dr. Atal Shivhare and Mr. Sudheesh Kumar Veeranmaril
are thanked for collecting the TGA data presented in Chapter 3 of this thesis. I also would like to
thank Ms. Leah Hildebrandt (Graduate Secretary, Department of Chemistry - University of
Saskatchewan) for keeping me apprised of the various deadlines as well as for scheduling my
Ph.D. candidacy exams and committee meetings.
The funding agencies are being thanked for providing the funds for the research projects
presented in this thesis. I would like to thank University of Saskatchewan for the financial
support. The research presented in this thesis was funded by the Natural Sciences and
Engineering Council (NSERC) of Canada through a discovery grant awarded to Prof. Andrew P.
Grosvenor. The Canadian Foundation for Innovation is thanked for providing funds to purchase
the PANalytical Empyrean powder X-ray diffractometer that was used for obtaining XRD data
presented in Chapters 2 - 5 of this thesis. Access to Sector 20 beamline was obtained through
CLS-APS partnership agreement. Sector 20 operations are supported by the US department of
Energy and the Canadian Light Source. The research work presented in this thesis used resources
of the Advanced Photon Source, an Office of Science User Facility operated for the US
department of Energy (DOE) Office of Science by Argonne National Laboratory, and was

v
supported by the US DOE under Contract No. DE-AC02-06CH11357, and the Canadian Light
Source and its funding partners. The CLS is supported by NSERC, the National Research
Council of Canada, the Canadian Institutes of Health Research, Western Economic
Diversification Canada, University of Saskatchewan, and the Government of Saskatchewan.

vi
Contents
PERMISSION TO USE i
ABSTRACT ii
ACKNOWLEDGEMENTS iii
LIST OF TABLES xi
LIST OF FIGURES xii
LIST OF ABBREVIATIONS xvi
1 INTRODUCTION 1
1.1 Introduction ........................................................................................................................... 1
1.2 Nuclear Energy...................................................................................................................... 3
1.2.1 Nuclear Fuel Cycle: Open Cycle vs Closed Cycle ........................................................ 4
1.2.2 Strategies for High-Level Waste (HLW) Disposal ....................................................... 8
1.3 Nuclear Wasteforms ............................................................................................................ 11
1.3.1 Glass Wasteforms ........................................................................................................ 12
1.3.2 Crystalline Wasteforms ............................................................................................... 13
1.4 Radiation Effects in Nuclear Wasteforms ......................................................................... 14
1.4.1 Internal Irradiation ....................................................................................................... 17
1.4.2 External Irradiation ...................................................................................................... 17

vii
1.5 Rare-Earth Phosphate Based Wasteforms ........................................................................... 20
1.5.1 Crystal Structures of Monazite and Xenotime ............................................................ 22
1.5.2 Crystal Structure of Rhabdophane............................................................................... 23
1.6 Experimental Techniques .................................................................................................... 25
1.6.1 X-ray Absorption Spectroscopy (XAS)....................................................................... 26
1.6.2 X-ray Photoelectron Spectroscopy .............................................................................. 38
1.7 Thesis Objectives ................................................................................................................ 43
2 AN X-RAY SPECTROSCOPIC STUDY OF THE ELECTRONIC
STRUCTURE OF MONAZITE- AND XENOTIME-TYPE RARE-EARTH
PHOSPHATES 46
2.1 Introduction ......................................................................................................................... 46
2.2 Experimental ....................................................................................................................... 48
2.2.1 Synthesis and powder XRD......................................................................................... 48
2.2.2 XANES ........................................................................................................................ 49
2.2.3 XPS .............................................................................................................................. 50
2.2.4 Electronic Structure Calculations ................................................................................ 51
2.3 Results and Discussion ........................................................................................................ 52
2.3.1 Structure ...................................................................................................................... 52
2.3.2 P K-edge XANES ........................................................................................................ 56
2.3.3 P L2,3-edge XANES ..................................................................................................... 63

viii
2.3.4 Sm M5-, Ho M5-, Sm L3-, and Ho L3-edge XANES ................................................... 65
2.3.5 P 2p, O 1s, and La 3d XPS .......................................................................................... 70
2.4 Conclusion .......................................................................................................................... 72
3 A STRUCTURAL INVESTIGATION OF HYDROUS AND ANHYDROUS
RARE-EARTH PHOSPHATES 73
3.1 Introduction ......................................................................................................................... 73
3.2 Experimental ....................................................................................................................... 75
3.2.1 Synthesis and Powder XRD ........................................................................................ 75
3.2.2 Thermogravimetric analysis (TGA) ............................................................................ 76
3.2.3 XANES ........................................................................................................................ 77
3.3 Results and Discussion ........................................................................................................ 78
3.3.1 TGA and Powder XRD ............................................................................................... 78
3.3.2 XANES ........................................................................................................................ 86
3.4. Conclusion ....................................................................................................................... 104
4 PROBING THE EFFECT OF RADIATION DAMAGE ON THE STRUCTURE
OF RARE-EARTH PHOSPHATES 105
4.1 Introduction ....................................................................................................................... 105
4.2 Experimental Section ........................................................................................................ 109
4.2.1 Synthesis and Powder XRD ...................................................................................... 109
4.2.2 Ion Beam Implantation .............................................................................................. 110

ix
4.2.3. Micro-X-ray diffraction (µ-XRD) ............................................................................ 111
4.2.4. XANES ..................................................................................................................... 113
4.3. Results and discussion ..................................................................................................... 115
4.3.1. Bulk and micro X-ray diffraction ............................................................................. 115
4.3.2. P K-edge GA-XANES: Ion implanted La1-xYbxPO4 ................................................ 119
4.3.3. P K-edge GA-XANES: Thermal annealing of ion implanted La1-xYbxPO4............ 126
4.3.4 P L2,3-edge XANES ................................................................................................... 128
4.3.5. La L3-edge XANES .................................................................................................. 129
4.4. Conclusion ....................................................................................................................... 133
5 A SHORT TERM INVESTIGATION OF THE CHEMICAL DURABILITY OF
HYDROUS AND ANHYDROUS RARE-EARTH PHOSPHATES 134
5.1 Introduction ....................................................................................................................... 134
5.2. Experimental .................................................................................................................... 136
5.2.1. Synthesis ................................................................................................................... 136
5.2.2. Leaching Test ........................................................................................................... 138
5.2.3. Powder XRD ............................................................................................................ 141
5.2.4 XANES ...................................................................................................................... 142
5.3 Results and Discussion ...................................................................................................... 144
5.3.1. Powder XRD: Before Leaching................................................................................ 144
5.3.2. ICP-MS: Leaching behaviour of REPO4 and REPO4.H2O ...................................... 146
x
5.3.3. Powder XRD: Effect of leaching on the long-range structure ................................. 151
5.3.4. XANES: Effect of leaching on the local structure ................................................... 151
5.4 Conclusion ........................................................................................................................ 158
6 CONCLUSIONS AND FUTURE WORK 159
6.1. Conclusions and Significance .......................................................................................... 159
6.2. Future Work ..................................................................................................................... 164
REFERENCES 168
Appendix A SUPPORTING TABLES AND FIGURES FOR CHAPTER 2 190
Appendix B SUPPORTING TABLES AND FIGURES FOR CHAPTER 3 197
Appendix C SUPPORTING TABLES AND FIGURES FOR CHAPTER 4 202
xi
LIST OF TABLES
Table 2-1 Unit cell parameters from monazite and xenotime compounds .................................... 54
Table 2-2 Unit cell parameters from La1-xYbxPO4 ........................................................................ 56
Table 2-3 Linear Combination Fitting results for the P K-edge spectra of La1-xYbxPO4 .............. 63
Table 3-1 Lattice Constants and Rietveld Refinement Results for DyPO4.H2O ........................... 81
Table 3-2 Lattice Constants from As-Synthesized Rhabdophane-Type REPO4.H2O Materials ... 83
Table 3-3 Lattice Constants from As-Synthesized and Annealed Xenotime-Type YbPO4.H2O .. 87
Table 4-1 Calculated Electronic and Nuclear Stopping Powers for La1-xYbxPO4 ....................... 112
Table 4-2 Calculated X-ray attenuation depths and the corresponding glancing angles for the P
K- and La L3-edge GA-XANES spectra. ..................................................................................... 114
Table 4-3 Full width at half-maximum (FWHM) values of the (0 2 -1) [monazite] and (0 2 0)
[xenotime] diffraction peaks from the damaged and as-synthesized La1-xYbxPO4 materials ...... 118
Table 5-1 Calculated total surface area (SA) of YbPO4, LaPO4, and GdPO4.H2O materials ...... 138
Table 5-2 Schedule for ICP-MS data collection .......................................................................... 140
Table 5-3 Lattice constants and average crystallite sizes of LaPO4, YbPO4, and GdPO4.H2O ... 145
Table A-1 Unit cell parameters of Sm1-xHoxPO4 ......................................................................... 191
Table A-2 Unit cell parameters of La1-xYxPO4 ............................................................................ 192
Table A-3 Linear combination fitting results for the Sm1-xHoxPO4 P K-edge XANES spectra .. 193
Table B-1 Lattice constants from as-synthesized rhabdophane-type Gd1-xDyxPO4.H2O (0 < x < 1)
materials ....................................................................................................................................... 198
Table C-1 Rietveld refinement results from La1-xYbxPO4 (x = 0, 0.3, 0.7, 1.0) .......................... 203
xii
LIST OF FIGURES
Figure 1.1 A schematic flow chart of the open and closed nuclear fuel cycle. ............................... 5
Figure 1.2 A schematic layout of the Tandetron Accelerator facility located at Interface Science
Western (ISW), Western University, Canada. ............................................................................... 19
Figure 1.3 Crystal structures of CePO4 (Monazite-type) and YPO4 (Xenotime-type) .................. 24
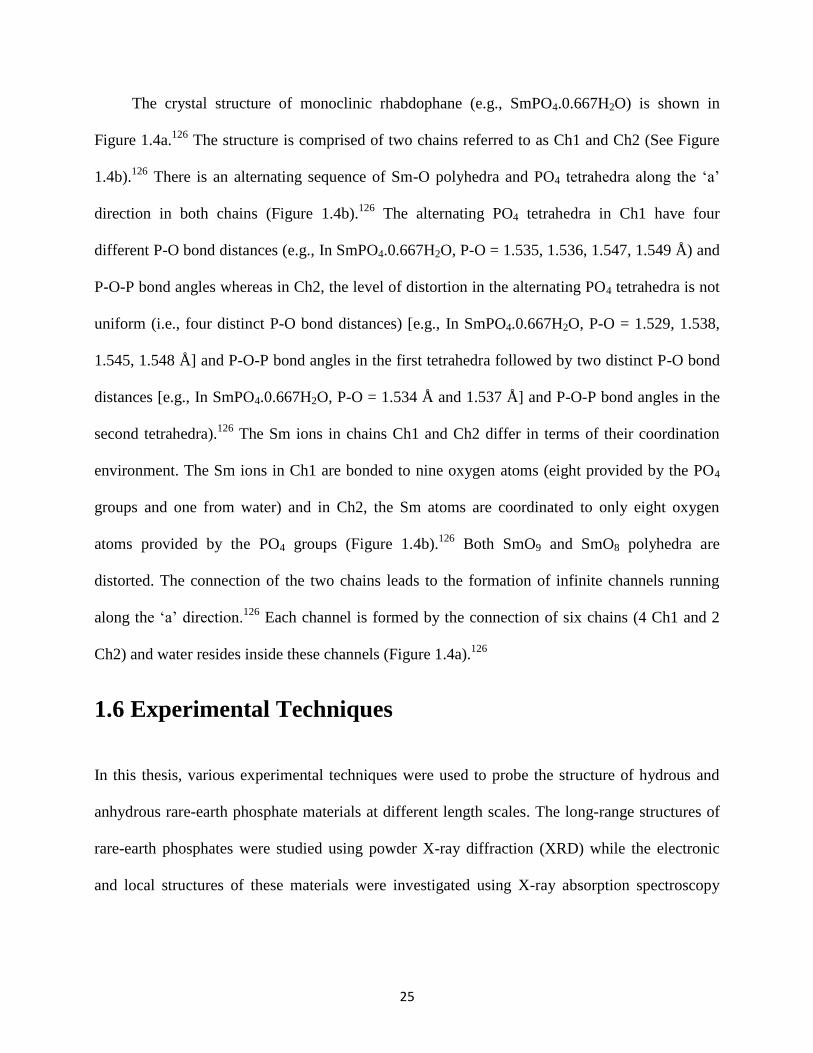
Figure 1.4 Crystal structure of SmPO4.0.667H2O (rhabdophane-type; Space group: C2) ............ 24
Figure 1.5 A representative P K-edge XAS spectra from DyPO4. ................................................ 28
Figure 1.6 A schematic representation of the electronic transitions associated with K-, L1-, L2,3-
and M5- absorption edges and Sm L1-edge XANES spectra are shown. ....................................... 30
Figure 1.7 A schematic layout of a synchrotron radiation facility. ............................................... 33
Figure 1.8 A basic layout of the XAS experimental setup. ........................................................... 36
Figure 1.9 A schematic of the experimental setup for conducting glancing angle XAS
experiments (GA-XAS). ................................................................................................................ 39
Figure 1.10 Survey scan and high-resolution P 2p XPS spectrum from LaPO4. ........................... 42
Figure 2.1 Powder XRD patterns from LaPO4 and YPO4 compounds. ......................................... 53
Figure 2.2 Refined powder XRD patterns from La0.8Yb0.2PO4 and La0.5Yb0.5PO4. ..................... 55
Figure 2.3 P K-edge XANES spectra from REPO4 (RE = La, Yb, Y) and P 3p partial DOS from
LaPO4 and YPO4. ........................................................................................................................... 58
Figure 2.4 P K-edge XANES spectra from La1-xYbxPO4 and Sm1-xHoxPO4. ................................ 61
Figure 2.5 LCF fits of the P K-edge spectra from the La1-xYbxPO4 series. ................................... 62
xiii
Figure 2.6 P L2,3-edge spectra from REPO4 (RE = La, Y) and partial DOS of P 3s and P 3d
conduction states from YPO4. ........................................................................................................ 64
Figure 2.7 P L2,3-edge spectra from La1-xYbxPO4 series................................................................ 66
Figure 2.8 Sm M5-edge and Ho M5-edge XANES spectra from Sm1-xHoxPO4 series. ................. 67
Figure 2.9 Sm L3- and Ho L3-edge XANES spectra from Sm1-xHoxPO4 series ............................ 69
Figure 2.10 P 2p, O 1s, and La 3d5/2 XPS spectra from La1-xYbxPO4 and YPO4. ......................... 71
Figure 3.1 Rietveld refined powder XRD patterns from rhabdophane-type DyPO4.H2O using the
hexagonal and monoclinic structural models. ................................................................................ 80
Figure 3.2 Powder XRD patterns from the rhabdophane-type REPO4.H2O (RE = La, Nd, Sm,
Gd, Dy) and Gd1-xDyxPO4.H2O materials. ..................................................................................... 82
Figure 3.3 Powder XRD patterns from DyPO4.H2O annealed at different temperatures. ............. 84
Figure 3.4 Powder XRD patterns of YbPO4.H2O (xenotime-type) annealed at different
temperatures. .................................................................................................................................. 87
Figure 3.5 P K-edge XANES spectra from Gd1-xDyxPO4.H2O materials. ..................................... 89
Figure 3.6 P K-edge XANES spectra from the GdPO4.H2O material annealed at different
temperatures and P K-edge XANES spectra from GdPO4 (monazite-type), GdPO4.H2O
(rhabdophane-type), and DyPO4 (xenotime-type) materials. ........................................................ 91
Figure 3.7 P K-edge XANES spectra from YbPO4.H2O annealed at different temperatures. ....... 94
Figure 3.8 P L2,3-edge XANES spectra from DyPO4.H2O annealed at different temperatures. .... 97
Figure 3.9 Sm L3-edge XANES spectra from SmPO4.H2O annealed at different temperatures. .. 99
xiv
Figure 3.10 RE (RE = Sm, Gd, Dy) L1-edge XANES spectra from REPO4.H2O (RE = Sm, Gd,
Dy) annealed at different temperatures. ....................................................................................... 100
Figure 3.11 Yb L1-edge XANES spectra from as-synthesized and annealed YbPO4.H2O. ........ 103
Figure 4.1 Ion-implantation depth profile of La0.7Yb0.3PO4. ....................................................... 112
Figure 4.2 µ-XRD patterns from La1-xYbxPO4 materials implanted with different doses of Au-
ions (1x10¹⁴
, 5x10¹⁴
, and 1x10¹⁵
ions/cm2). ................................................................................ 116
Figure 4.3 P K-edge GA-XANES spectra from ion-implanted LaPO4. ...................................... 120
Figure 4.4 P K-edge GA-XANES spectra from ion-implanted YbPO4. ...................................... 122
Figure 4.5 P K-edge GA-XANES spectra from ion-implanted La0.7Yb0.3PO4. ........................... 124
Figure 4.6 P K-edge GA-XANES spectra from ion-implanted La0.3Yb0.7PO4. ........................... 125
Figure 4.7 P K-edge GA-XANES spectra from ion-implanted La1-xYbxPO4 materials annealed at
300° and 900° C. .......................................................................................................................... 127
Figure 4.8 P L2,3-edge XANES spectra from ion-implanted La1-xYbxPO4 materials. ................. 130
Figure 4.9 P L2,3-edge XANES spectra from ion-implanted La1-xYbxPO4 materials annealed at
300° or 900° C. ............................................................................................................................ 131
Figure 4.10 La L3-edge GA-XANES spectra from ion-implanted La1-xYbxPO4. ........................ 132
Figure 5.1 Powder XRD patterns of LaPO4, YbPO4, and GdPO4.H2O materials collected before
leaching. ....................................................................................................................................... 145
Figure 5.2 The concentration of RE (RE = La, Yb, Gd) and P ions in leachate solutions
withdrawn from vessels containing LaPO4, YbPO4, and GdPO4.H2O materials. ........................ 147

xv
Figure 5.3 Normalized leach rates of LaPO4, YbPO4, and GdPO4.H2O versus time. ................. 150
Figure 5.4 Powder XRD patterns of LaPO4, YbPO4, and GdPO4.H2O materials obtained before
and after leaching. ........................................................................................................................ 152
Figure 5.5 P K-edge XANES spectra of LaPO4, YbPO4, and GdPO4.H2O materials obtained
before and after leaching .............................................................................................................. 154
Figure 5.6 P L2,3-edge XANES spectra of LaPO4, YbPO4, and GdPO4.H2O materials obtained
before and after leaching. ............................................................................................................. 156
Figure 5.7 RE L1-edge XANES spectra of LaPO4, YbPO4, and GdPO4.H2O materials obtained
before and after leaching. ............................................................................................................. 157
Figure A.1 LCF fits of the P K-edge spectra from Sm1-xHoxPO4 series. ..................................... 194
Figure A.2 Sm N4,5-edge XANES spectra from SmPO4 and Sm2O3. .......................................... 195
Figure A.3 P L2,3-edge XANES spectra from La1-xYxPO4 series. ............................................... 196
Figure B.1 TGA plots from rhabdophane-type DyPO4.H2O and xenotime-type YbPO4.H2O
materials. ...................................................................................................................................... 199
Figure B.2 Powder XRD patterns from LaPO4.H2O, SmPO4.H2O, and GdPO4.H2O annealed to
different temperatures. ................................................................................................................. 200
Figure B.3 RE (RE = Gd, Dy) L3-edge XANES spectra from REPO4.H2O (RE = Gd, Dy)
annealed at different temperatures. .............................................................................................. 201
Figure C.1 Ion-implantation depth and vacancy profiles of La1-xYbxPO4.. ................................. 204

xvi
LIST OF ABBREVIATIONS
α Helium ion
β Electron
µ Absorption Coefficient
σ Mass Absorption Cross-Section
ρ Density
ϕ Work Function
λ Wavelength
d Particle diameter
D Crystallite Size
I0 Intensity of Incident X-rays
It Intensity of transmitted X-rays
l Orbital Quantum Number
n Principal Quantum Number
t Sample Thickness
APS Advanced Photon Source
AVM Atelier de Vitrification de Marcoule
BE Binding Energy
BM Bending Magnet
BET Brunauer-Emmett-Teller

xvii
CLS Canadian Light Source
DAC Diamond Anvil Cell
DOS Density of States
ENSP Electronic to Nuclear Stopping Power
EXAFS Extended X-ray Absorption Fine Structure
FWHM Full Width at Half Maxima
GA Glancing Angle
GeV Giga Electron Volt
GPa Giga Pascal
HREE Heavy Rare-Earth Elements
HWR Heavy Water Reactor
HDPE High Density Polyethylene
HLW High Level Waste
IAEA International Atomic Energy Agency Test
ICP-MS Inductively Coupled Plasma – Mass Spectrometry
IR Infrared Radiation
ISW Interface Science Western
KE Kinetic Energy
LCF Linear Combination Fitting
LINAC Linear Accelerator
LREE Light Rare-Earth Elements
xviii
LWR Light Water Reactor
MCC Materials Characterization Centre Test
MOX Mixed Oxide Nuclear Fuel
PCT Product Consistency Test
PFY Partial Fluorescent Yield
PUREX Plutonium Uranium Recovery Extraction
RE Rare-Earth
RF Radio Frequency
SA Surface Area
SGM Spherical Grating Monochromator
SNF Spent Nuclear Fuel
SPFT Single Pass Flow Through Test
SRIM Stopping and Range of Ions in Matter
SXRMB Soft X-ray Microcharacterization Beamline
SYNROC Synthetic Rock
TEM Transmission Electron Microscopy
TEY Total Electron Yield
TGA Thermogravimetric Analysis
TB-LMTO-ASA Tight Binding – Linear Muffin Tin Orbital Model – Atomic Spheres
Approximation
VESTA Visualization for Electronic and Structural Analysis
xix
VLS-PGM Variable Line Spacing – Plane Grating Monochromator
VUV Vacuum Ultraviolet
UHV Ultra-High Vacuum
XAS X-ray Absorption Spectroscopy
XANES X-ray Absorption Near-Edge Spectroscopy
XPS X-ray Photoelectron Spectroscopy
XRD X-ray Diffraction
WS Wigner-Seitz
1
Chapter 1
INTRODUCTION
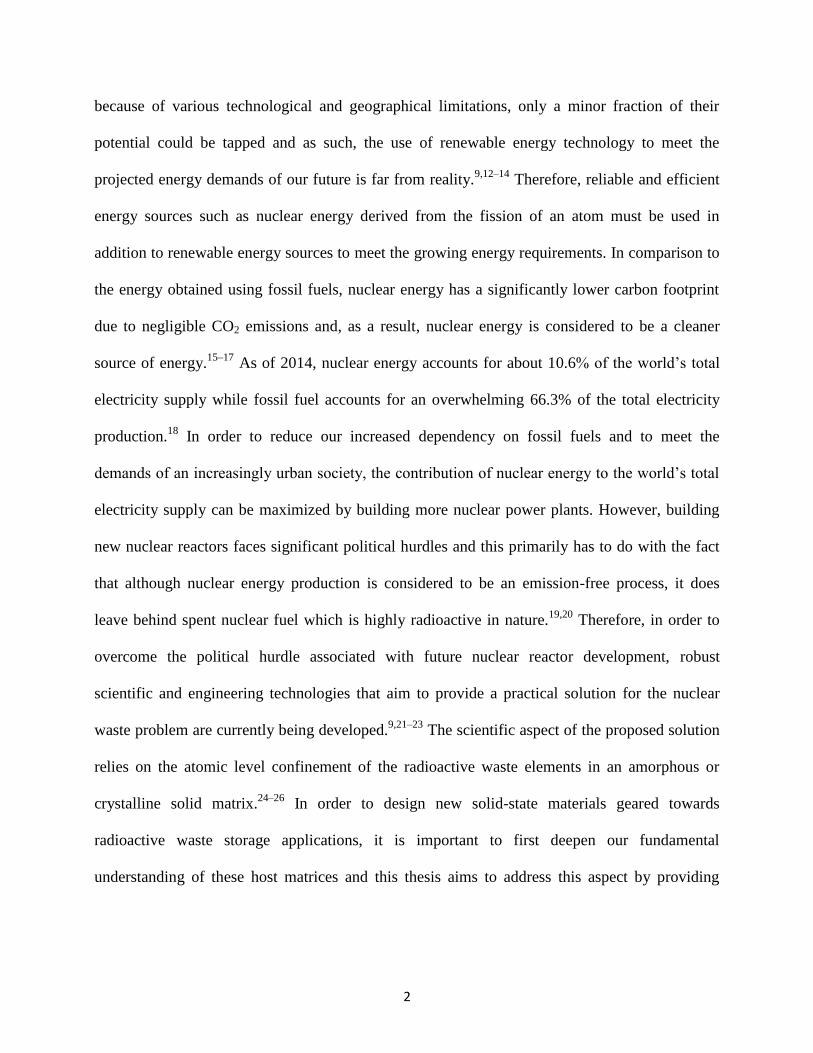
1.1 Introduction
Since the dawn of the 21st century, the world has been witnessing a tremendous increase in
energy demands fueled mainly by the growing population and rapid urbanization of the world.1–3
The energy requirements of our modern society in the present day scenario have been largely met
using a combination of fossil fuel based energy sources such as coal, oil, and natural gas.2,4
With
the world population estimated to reach around 9.7 billion by the year 2050, the global demand
for energy will continue to skyrocket and since fossil fuels are non-renewable sources of energy,
the continual use of fossil fuels for meeting these energy demands will pose an imminent risk of
exhaustion of the world’s fossil fuel supply.2,4,5
However, the biggest concern revolving around
the burning of fossil fuel for energy generation is the emission of large amounts of CO2 into the
atmosphere which has now been established to be a major driving force for global climate
change.6,7
In light of these issues, a sustainable future could be envisioned by switching to
environmental friendly alternate energy sources to meet our current and future energy demands.8,9
Renewable energy sources (e.g., wind, solar, hydrothermal, geothermal etc.) could possibly
solve the looming energy crisis of our world and help ensure a sustainable future.8,10,11
However,
2
because of various technological and geographical limitations, only a minor fraction of their
potential could be tapped and as such, the use of renewable energy technology to meet the
projected energy demands of our future is far from reality.9,12–14
Therefore, reliable and efficient
energy sources such as nuclear energy derived from the fission of an atom must be used in
addition to renewable energy sources to meet the growing energy requirements. In comparison to
the energy obtained using fossil fuels, nuclear energy has a significantly lower carbon footprint
due to negligible CO2 emissions and, as a result, nuclear energy is considered to be a cleaner
source of energy.15–17
As of 2014, nuclear energy accounts for about 10.6% of the world’s total
electricity supply while fossil fuel accounts for an overwhelming 66.3% of the total electricity
production.18
In order to reduce our increased dependency on fossil fuels and to meet the
demands of an increasingly urban society, the contribution of nuclear energy to the world’s total
electricity supply can be maximized by building more nuclear power plants. However, building
new nuclear reactors faces significant political hurdles and this primarily has to do with the fact
that although nuclear energy production is considered to be an emission-free process, it does
leave behind spent nuclear fuel which is highly radioactive in nature.19,20
Therefore, in order to
overcome the political hurdle associated with future nuclear reactor development, robust
scientific and engineering technologies that aim to provide a practical solution for the nuclear
waste problem are currently being developed.9,21–23
The scientific aspect of the proposed solution
relies on the atomic level confinement of the radioactive waste elements in an amorphous or
crystalline solid matrix.24–26
In order to design new solid-state materials geared towards
radioactive waste storage applications, it is important to first deepen our fundamental
understanding of these host matrices and this thesis aims to address this aspect by providing
3
detailed insight into the structure of crystalline solids proposed for nuclear waste sequestration
applications using X-ray based diffraction and spectroscopic techniques.
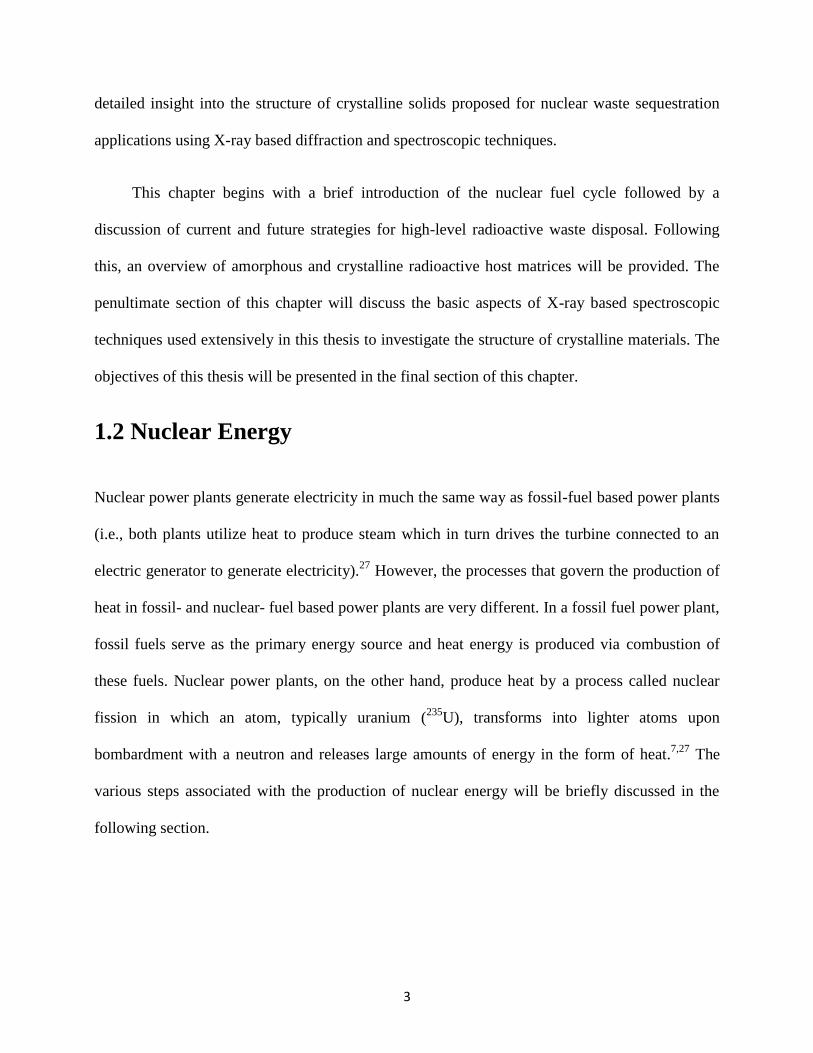
This chapter begins with a brief introduction of the nuclear fuel cycle followed by a
discussion of current and future strategies for high-level radioactive waste disposal. Following
this, an overview of amorphous and crystalline radioactive host matrices will be provided. The
penultimate section of this chapter will discuss the basic aspects of X-ray based spectroscopic
techniques used extensively in this thesis to investigate the structure of crystalline materials. The
objectives of this thesis will be presented in the final section of this chapter.
1.2 Nuclear Energy
Nuclear power plants generate electricity in much the same way as fossil-fuel based power plants
(i.e., both plants utilize heat to produce steam which in turn drives the turbine connected to an
electric generator to generate electricity).27
However, the processes that govern the production of
heat in fossil- and nuclear- fuel based power plants are very different. In a fossil fuel power plant,
fossil fuels serve as the primary energy source and heat energy is produced via combustion of
these fuels. Nuclear power plants, on the other hand, produce heat by a process called nuclear
fission in which an atom, typically uranium (235
U), transforms into lighter atoms upon
bombardment with a neutron and releases large amounts of energy in the form of heat.7,27
The
various steps associated with the production of nuclear energy will be briefly discussed in the
following section.
4
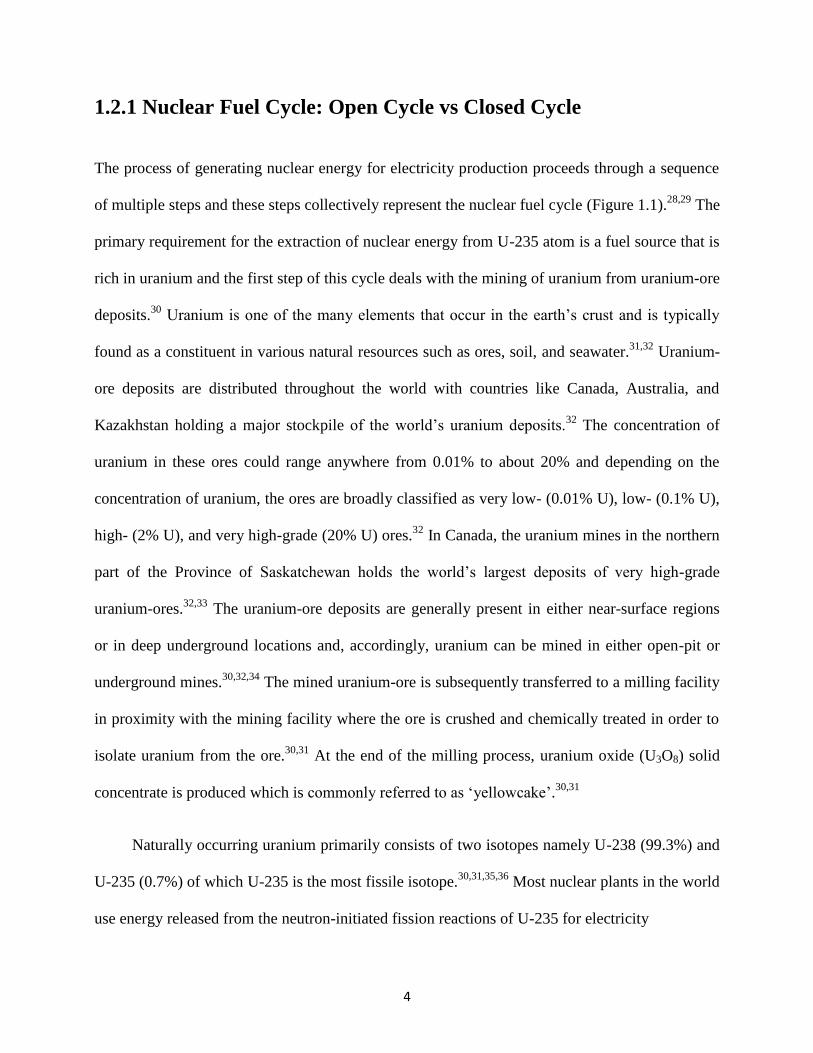
1.2.1 Nuclear Fuel Cycle: Open Cycle vs Closed Cycle
The process of generating nuclear energy for electricity production proceeds through a sequence
of multiple steps and these steps collectively represent the nuclear fuel cycle (Figure 1.1).28,29
The
primary requirement for the extraction of nuclear energy from U-235 atom is a fuel source that is
rich in uranium and the first step of this cycle deals with the mining of uranium from uranium-ore
deposits.30
Uranium is one of the many elements that occur in the earth’s crust and is typically
found as a constituent in various natural resources such as ores, soil, and seawater.31,32
Uranium-
ore deposits are distributed throughout the world with countries like Canada, Australia, and
Kazakhstan holding a major stockpile of the world’s uranium deposits.32
The concentration of
uranium in these ores could range anywhere from 0.01% to about 20% and depending on the
concentration of uranium, the ores are broadly classified as very low- (0.01% U), low- (0.1% U),
high- (2% U), and very high-grade (20% U) ores.32
In Canada, the uranium mines in the northern
part of the Province of Saskatchewan holds the world’s largest deposits of very high-grade
uranium-ores.32,33
The uranium-ore deposits are generally present in either near-surface regions
or in deep underground locations and, accordingly, uranium can be mined in either open-pit or
underground mines.30,32,34
The mined uranium-ore is subsequently transferred to a milling facility
in proximity with the mining facility where the ore is crushed and chemically treated in order to
isolate uranium from the ore.30,31
At the end of the milling process, uranium oxide (U3O8) solid
concentrate is produced which is commonly referred to as ‘yellowcake’.30,31
Naturally occurring uranium primarily consists of two isotopes namely U-238 (99.3%) and
U-235 (0.7%) of which U-235 is the most fissile isotope.30,31,35,36
Most nuclear plants in the world
use energy released from the neutron-initiated fission reactions of U-235 for electricity
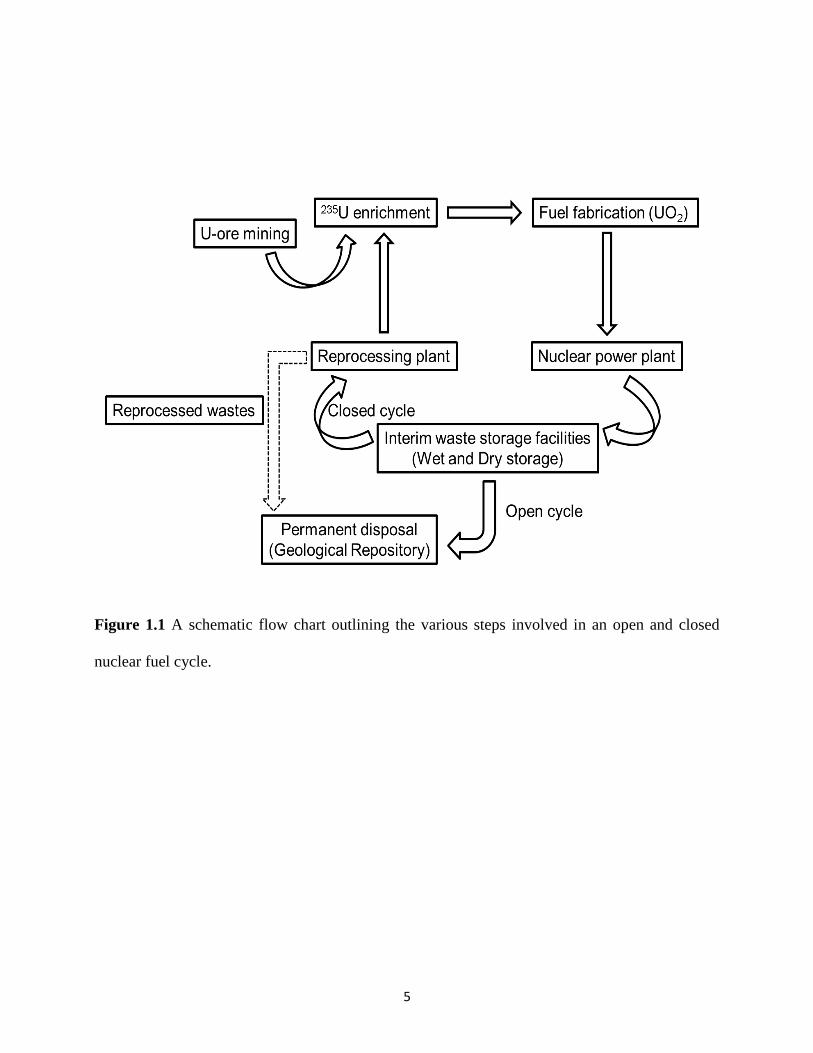
5
Figure 1.1 A schematic flow chart outlining the various steps involved in an open and closed
nuclear fuel cycle.
6
generation purposes and require about 3-5% of U-235 in the nuclear fuel.30,31
For this reason, the
third step of the nuclear fuel cycle involves the enrichment of U-235 in which the concentration
of fissile U-235 will be increased.31
Since the enrichment step requires gaseous uranium samples,
the U3O8 obtained from the milling facility is first converted into uranium hexafluoride (UF6) gas
using either a dry or wet process.30,31,35
In the dry process, the U3O8 is purified via heating at high
temperatures followed by reduction of calcined U3O8 to UO2.30,31,35
In the wet process, the U3O8
is dissolved in concentrated nitric acid and the resulting uranyl nitrate solution
(UO2(NO3)2.6H2O) is calcined to produce UO3 powder and this, in turn, is reduced to UO2.30,31,35
The UO2 obtained via dry or wet process is reacted with hydrogen fluoride (HF) to form UF4,
which, in turn, is treated with gaseous fluorine (F2) to produce UF6.30,31,35
The UF6 gas is
enriched with U-235 using either a gas diffusion or gas centrifuge method.30,31,35
Both of these
methods separate the isotopes of uranium by taking advantage of the different mass of U-238 and
U-235 atoms. The enriched UF6 gas is stored within a cylinder and is shipped to a nuclear fuel
fabrication facility wherein UF6 is chemically transformed to uranium dioxide (UO2) powders.31
This step constitutes the fourth step of fuel cycle and here, pellets of UO2 are prepared by
pressing the powders of UO2 at high pressures followed by annealing at high temperatures.30,31
The pellets are packed inside metal tubes made of zirconium alloys and sealed.30,31
The individual
metal tubes hosting these fuel pellets are called fuel rods and several fuel rods form a fuel
assembly when packed together.31
In the penultimate step of the fuel cycle, the fuel assembly arrives at a nuclear power plant
and is employed within a nuclear reactor. Despite the different types of reactors that currently
exist in the world, the basic components of a nuclear reactor still remains the same. A nuclear
reactor generally consists of a fuel assembly, moderator, coolant, control rods, pressure vessel,
7
and steam generator.29
The pressure vessel houses the reactor core which consists of a fuel
assembly, moderator, and coolant.31
The neutron-initiated fission reactions occurring at the
reactor core, in addition to releasing energy, also emit high energy neutrons which initiate further
fission of U-235 atoms eventually setting off a chain reaction. The function of a moderator is to
sustain this chain reaction by slowing down the fast-moving neutrons.31
Nuclear reactors, based
on the type of moderator used, are classified into light water reactors (LWRs) and heavy water
reactors (HWRs). In a light water reactor, H2O serves as a moderator whereas in a heavy water
reactor D2O is used as the moderator. Control rods typically made of a neutron absorbing
material (e.g., B, Cd, Hf) are also used to control the reaction rate of the fission process.31
The
role of a coolant is to transfer the heat generated from fission of U-235 atom to the steam
generator where steam is produced and is used to drive the turbines used to produce electricity.31
In LWRs and HWRs, H2O and D2O serve as both the coolant and moderator.31
The nuclear fuel
stays in the reactor for a specified time period (e.g., ~ 1 – 3 years) and every year the used fuel is
partially replaced with new fuel.
At the end of the fuel service period, the spent nuclear fuel (SNF) rods, which are
extremely hot and radioactive, are removed from the reactor core and placed in a water pool
located adjacent to the nuclear reactor in order to reduce the radioactivity and heat levels.37
The
spent fuel contains U-238 and U-235 radionuclides along with plutonium and other fission
products formed as a result of fission of U-235 and much of the radioactivity in the used fuel
originates mainly from the fission products.38
The spent fuel remains under water for a minimum
of one year and is either transferred to a dry storage facility wherein the spent fuel assembly is
placed in specially designed casks or to a reprocessing facility where the uranium and plutonium
are recovered from the used fuel for further use in reactors.39
In the former case, the fuel cycle is
8
said to be an open cycle and the spent fuel assembly awaits disposal in geological repositories.37
In the latter case, the fuel cycle is called a closed cycle and the recovered uranium can either be
converted to UO2 fuel or can be mixed with plutonium to create a mixed oxide (MOX) nuclear
fuel.31,37,38
The reprocessing of spent nuclear fuel also produces high-level radioactive waste
elements (i.e., the radioactive elements have a very long half-life), which are comprised of
actinides and other fission products.40
1.2.2 Strategies for High-Level Waste (HLW) Disposal
The global inventory of high level waste (HLW) originating from nuclear power plant is
continually increasing and appropriate measures need to be taken to safely isolate the HLW from
the biosphere.41
The HLWs originating from open- and closed- fuel cycles are currently stored at
interim storage facilities.42
The proposed strategy for completely isolating the wastes from the
biosphere is to permanently dispose the HLWs in geologically stable underground locations.43
A
brief description of different steps involved in the nuclear waste management is presented below.
1.2.2.1 Interim Storage facilities
The first step towards the disposal of HLW is the storage of spent fuel assemblies in interim
storage facilities.42,44
Initially, the used fuel is removed from the reactor and transferred to a wet
storage facility where the used fuel is placed under water (~ 20 - 40 feet deep) in a specially
designed pool called a spent fuel storage pool.42
The walls and floors of these pools are made of
reinforced concrete and are also lined with stainless steel to prevent the water from seeping
through the concrete layer.39,42
The water serves to cool down the hot spent fuel rods and also to
act as a shield against the radiation emanating from these rods.44
The spent nuclear fuel remains
in this wet storage facility for a designated time (e.g., 1 - 10 years), after which, the spent fuel

9
assembly is withdrawn from the storage pool and transferred to a dry storage facility.45
Here, the
spent fuel assembly is placed inside a steel canister encased within concrete casks.42
In dry cask
storage, the spent fuel assemblies are surrounded by inert gas to prevent the elements present in
the used fuel from potential oxidation.39,42
The dry casks holding the spent fuel are either placed
vertically on a concrete pad or horizontally in a concrete bunker.42
Both the dry and wet storage
facilities are monitored regularly to prevent the occurrence of any untoward incidents.42
1.2.2.2 HLW Vitrification
In the case of a closed fuel cycle, the spent fuel is withdrawn from the storage pool and
transferred to a reprocessing facility where uranium and plutonium are recovered from the spent
fuel by a process called PUREX (Plutonium Uranium Recovery Extraction).46,47
In the PUREX
process, the spent fuel rods are initially shredded and dissolved in concentrated nitric acid
followed by separation of uranium and plutonium by solvent extraction techniques.46–48
The
resultant solution after isolation of uranium and plutonium now contains highly radioactive
fission products (e.g., Cs and Sr) and minor actinides (e.g., Np, Am, and Cm).47–49
The liquid
wastes are conditioned by incorporating the waste elements in a borosilicate glass matrix through
a process called vitrification.49–52
In this process, the liquid wastes are initially calcined to
produce dry powder which is then mixed with glass forming additives in a crucible and heated to
~1050°C.51
The powder comprising HLW reacts with the molten glass and the resulting hot melt
is poured into a steel canister and is allowed to cool.51
After the cooling stage, HLW glass is
obtained in which the radioactive elements are present within the glass matrix.51
Due to the high
level of radioactivity of this waste, the steel canister holding the vitrified HLW glass is stored in
an interim storage facility and is passively cooled in order to prevent the heat due to radioactive

10
decay from inducing a glass transition (i.e., transition of glass into viscous state at high
temperatures) in the vitrified HLW glass.51
1.2.2.3 Geological Disposal
The proposed solution for the permanent disposal of HLW is to store the radioactive wastes in
multiple containers and place them in deep geological repositories (>300 m below
ground).22,23,48,53–55
The geological disposal method relies on a multiple-barrier concept in which
both engineering and natural barriers prevent/delay the radioactive wastes from reaching the
biosphere via groundwater migration.22,23,48,53–55
There are three engineering barriers and they are
as follows:22,23,48,53–55
1. HLW Glass and/or spent fuel rods represent the first barrier for the outward movement of
radionuclides.
2. The second barrier is the container itself that holds the vitrified waste or spent fuel. The
container typically made of stainless steel or corrosion-resistant alloys, prevents the groundwater
from reaching the radioactive wastes.
3. The canister which contains HLW glass and/or spent fuel rods are sealed and placed in a
geological repository. In order to fill the void between the canister and the geological repository,
as well as to restrict the movement of groundwater, a backfill or overpack material (e.g., clay) is
used and this material represents the third barrier.
The natural barrier, which consists of crystalline rock that surrounds the backfill material,
will eventually slow-down the groundwater movement.22,23,54,55
In the event of radionuclide
release from the container, the rocks and backfill materials tend to decrease the rate of movement
11
of radionuclides both physically and chemically for longer periods of time.22,23,54,55
Should the
radionuclides reach the biosphere after having been stored for long periods of time, the
radioactivity levels of the wastes are expected to be similar to the natural background
radiation.22,23,54,55
Geological repositories are currently viewed by many to be one of the safest
methods for the long-term storage of HLW and yet despite this view, no operational geological
repositories exist in the world for the disposal of HLW.23,56
Some countries, however, are in the
process of obtaining approval from their respective governments for the construction of
geological repositories.23,56
Recently, the Finnish government has granted approval for the
construction of geological repositories for HLW storage and is expected to be operational in the
year 2020.23,56,57
1.3 Nuclear Wasteforms
For safety concerns and ease of transportation, the liquid HLW arising from the SNF
reprocessing facility is converted into a solid wasteform via chemical incorporation of HLW into
a durable solid host matrix.50,58
Solid matrices hosting these radioactive wastes are called nuclear
wasteforms and they could be either amorphous or crystalline or a combination of both.25,52,58–61
Crystalline and glass based nuclear wasteforms are usually synthesized by heating a mixture
comprising of nuclear wastes and starting precursors at high temperatures. Both, amorphous and
crystalline host matrices have their own advantages and disadvantages as a wasteform and, in the
following sections, a brief discussion of glass- and crystalline- based wasteforms will be
presented with a major focus being given to crystalline-based wasteforms.
12
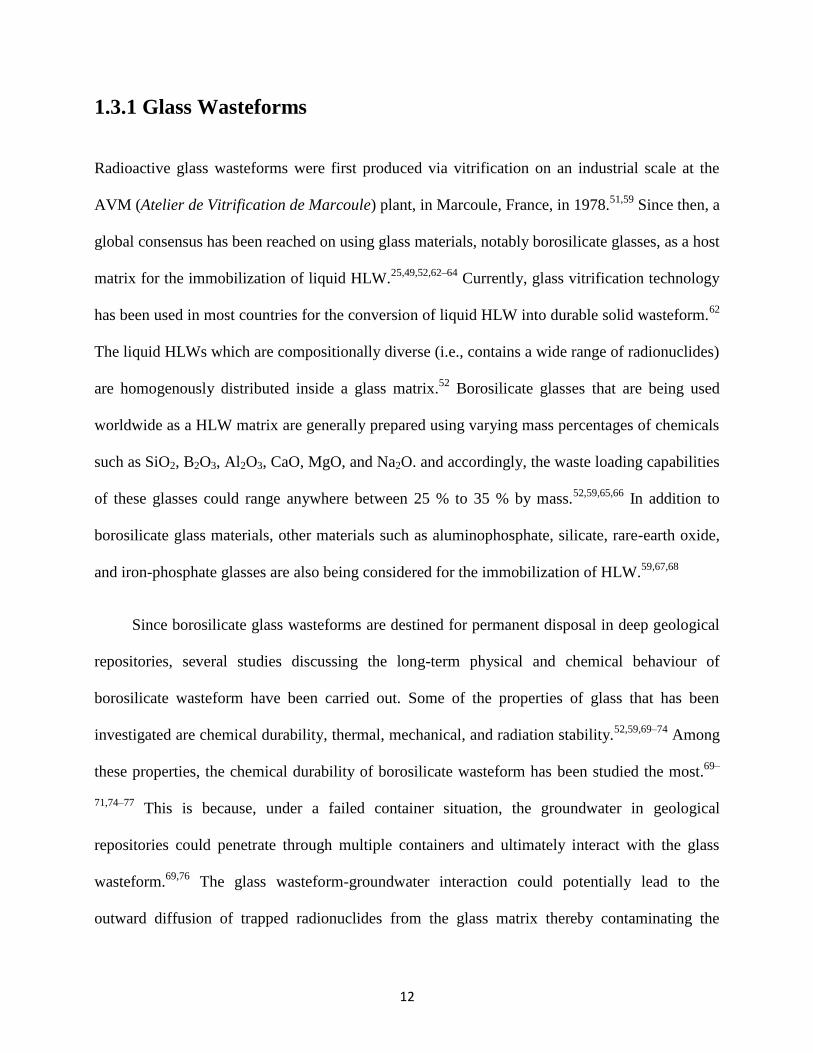
1.3.1 Glass Wasteforms
Radioactive glass wasteforms were first produced via vitrification on an industrial scale at the
AVM (Atelier de Vitrification de Marcoule) plant, in Marcoule, France, in 1978.51,59
Since then, a
global consensus has been reached on using glass materials, notably borosilicate glasses, as a host
matrix for the immobilization of liquid HLW.25,49,52,62–64
Currently, glass vitrification technology
has been used in most countries for the conversion of liquid HLW into durable solid wasteform.62
The liquid HLWs which are compositionally diverse (i.e., contains a wide range of radionuclides)
are homogenously distributed inside a glass matrix.52
Borosilicate glasses that are being used
worldwide as a HLW matrix are generally prepared using varying mass percentages of chemicals
such as SiO2, B2O3, Al2O3, CaO, MgO, and Na2O. and accordingly, the waste loading capabilities
of these glasses could range anywhere between 25 % to 35 % by mass.52,59,65,66
In addition to
borosilicate glass materials, other materials such as aluminophosphate, silicate, rare-earth oxide,
and iron-phosphate glasses are also being considered for the immobilization of HLW.59,67,68
Since borosilicate glass wasteforms are destined for permanent disposal in deep geological
repositories, several studies discussing the long-term physical and chemical behaviour of
borosilicate wasteform have been carried out. Some of the properties of glass that has been
investigated are chemical durability, thermal, mechanical, and radiation stability.52,59,69–74
Among
these properties, the chemical durability of borosilicate wasteform has been studied the most.69–
71,74–77 This is because, under a failed container situation, the groundwater in geological
repositories could penetrate through multiple containers and ultimately interact with the glass
wasteform.69,76
The glass wasteform-groundwater interaction could potentially lead to the
outward diffusion of trapped radionuclides from the glass matrix thereby contaminating the

13
groundwater.69,76
In order to address the issue of chemical durability, second-generation
wasteforms such as crystalline wasteforms are currently being developed and tested for HLW
immobilization applications.78
1.3.2 Crystalline Wasteforms
Naturally occurring crystalline minerals containing radionuclides are known to be on Earth for
millions of years and have been exposed to extreme environmental conditions.21,79
Some of the
natural minerals have endured these extreme conditions and remained structurally stable on a
geological timescale.21,79
This observation has inspired scientists to propose synthetic analogue of
these crystalline minerals for HLW immobilization applications.50,79,80
Crystalline materials,
unlike their amorphous counterparts (e.g., glass), are thermodynamically stable and therefore
should possess greater structural stability and chemical durability over long periods of time
required for HLW storage.78,81,82
In a crystalline wasteform, the radionuclides occupy specific
atomic sites of the host matrix and become a part of the crystal structure.50,78
Since the atomic
sites in a crystal structure have specific size, charge, and bonding requirements, the crystalline
host matrix imposes restriction on the type of radioactive element that can be incorporated into
the crystal structure.50,78
As a result, different crystalline materials are being developed or
proposed to host specific type of radioactive elements (e.g., fission products, minor actinides)
that are present in liquid HLWs.50,78
In 1953, Hatch first proposed the idea of incorporating radionuclides in crystalline clays
and since then, various single- and multi-phase crystalline ceramics have been proposed as a host
matrix for immobilization of HLW.80
Among the various crystalline wasteforms that have been
studied, multiphase wasteforms called SYNROC (synthetic rock) developed by Ringwood and
14
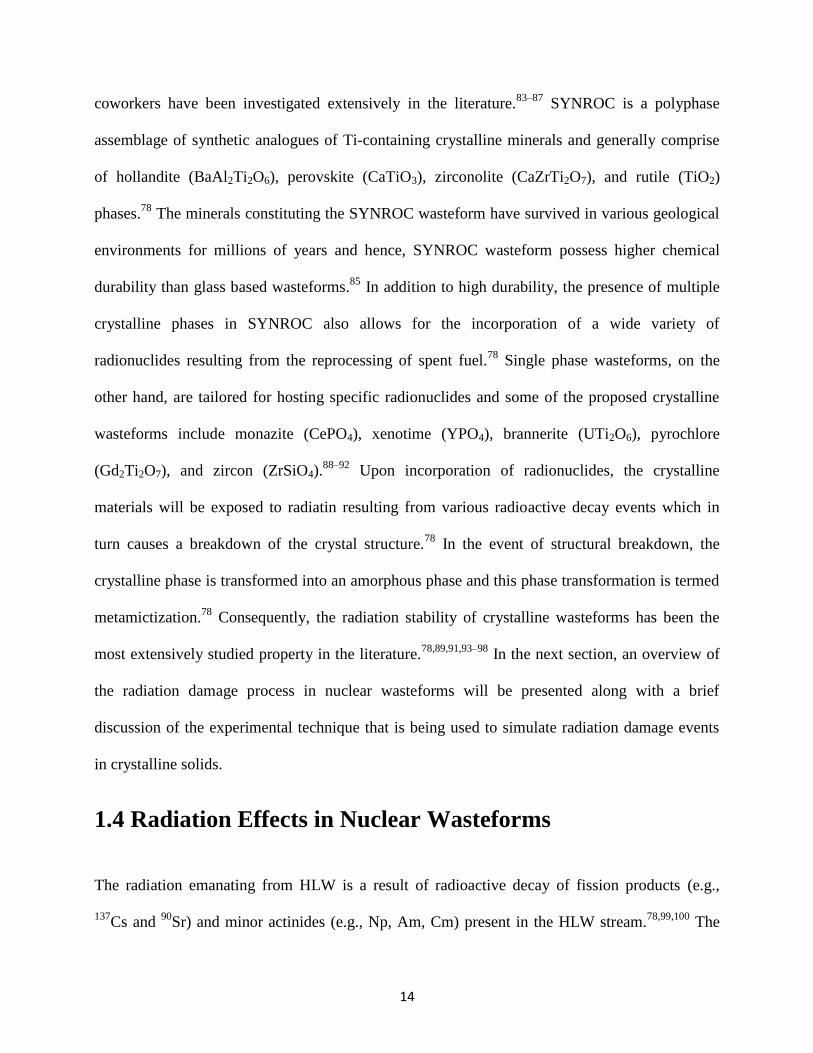
coworkers have been investigated extensively in the literature.83–87
SYNROC is a polyphase
assemblage of synthetic analogues of Ti-containing crystalline minerals and generally comprise
of hollandite (BaAl2Ti2O6), perovskite (CaTiO3), zirconolite (CaZrTi2O7), and rutile (TiO2)
phases.78
The minerals constituting the SYNROC wasteform have survived in various geological
environments for millions of years and hence, SYNROC wasteform possess higher chemical
durability than glass based wasteforms.85
In addition to high durability, the presence of multiple
crystalline phases in SYNROC also allows for the incorporation of a wide variety of
radionuclides resulting from the reprocessing of spent fuel.78
Single phase wasteforms, on the
other hand, are tailored for hosting specific radionuclides and some of the proposed crystalline
wasteforms include monazite (CePO4), xenotime (YPO4), brannerite (UTi2O6), pyrochlore
(Gd2Ti2O7), and zircon (ZrSiO4).88–92
Upon incorporation of radionuclides, the crystalline
materials will be exposed to radiatin resulting from various radioactive decay events which in
turn causes a breakdown of the crystal structure.78
In the event of structural breakdown, the
crystalline phase is transformed into an amorphous phase and this phase transformation is termed
metamictization.78
Consequently, the radiation stability of crystalline wasteforms has been the
most extensively studied property in the literature.78,89,91,93–98
In the next section, an overview of
the radiation damage process in nuclear wasteforms will be presented along with a brief
discussion of the experimental technique that is being used to simulate radiation damage events
in crystalline solids.
1.4 Radiation Effects in Nuclear Wasteforms
The radiation emanating from HLW is a result of radioactive decay of fission products (e.g.,
137Cs and
90Sr) and minor actinides (e.g., Np, Am, Cm) present in the HLW stream.
78,99,100 The

15
fission products decay via emission of β (e-) particles and in this process a low-energy recoil
nuclei, also called daughter products, are produced.78,99
The minor actinides, on the other hand,
decay by producing energetic α (He2+
) particles and high-energy recoil nuclei.78,99
The fission
products and minor actinides have shorter and longer half-lives, respectively.78,99,101
As a result,
for the first ~500 years of HLW storage, the radiation will predominantly arise from the β-decay
of fission products after which the radiation will arise primarily from the α-decay of
actinides.50,78,99
When these radionuclides are atomically confined within a solid matrix, the
radioactive decay products dissipate their energy into the host matrix via ionization and elastic
collision events.78,99,102
In the case of an ionization event, the energies of the decay products are
used to excite and remove electrons from the atoms in the solid whereas in an elastic collision
event, the energies are transferred to atoms present in the host matrix.78,99,102
Both ionization and
elastic collision events affect the structures and properties of nuclear wastefoms.78,99–101
Among the decay products, α- and β- particles lose energy mainly by ionization processes
while the recoil nuclei resulting from α- and β- decay events transfer energy to atoms primarily
via an elastic collision process.78,99
The decay products resulting from β-decay do not possess
enough energy (e.g., energy of β-particle ~ 0.5 MeV) to initiate atomic displacements in the host
matrix.78,99
As a result, β-decay events do not cause significant damage to the structure of a
nuclear wasteform.78,99
However, the α-decay event which produces high energy α-particles (4.5
to 5.8 MeV) and α-recoil atoms (70 to 100 keV) brings about the most structural damage in
wasteforms.78,99,103
During an α-decay event, an α-particle can travel over a range of 16 – 22 µm
and loses the majority of its energy to inducing ionization events.78,99
A portion of the energy of
an α-particle is also used to produce a few hundred atomic displacements along its path with
greater displacements occurring at the end of the particle trajectory.78,99
The heavier α-recoil
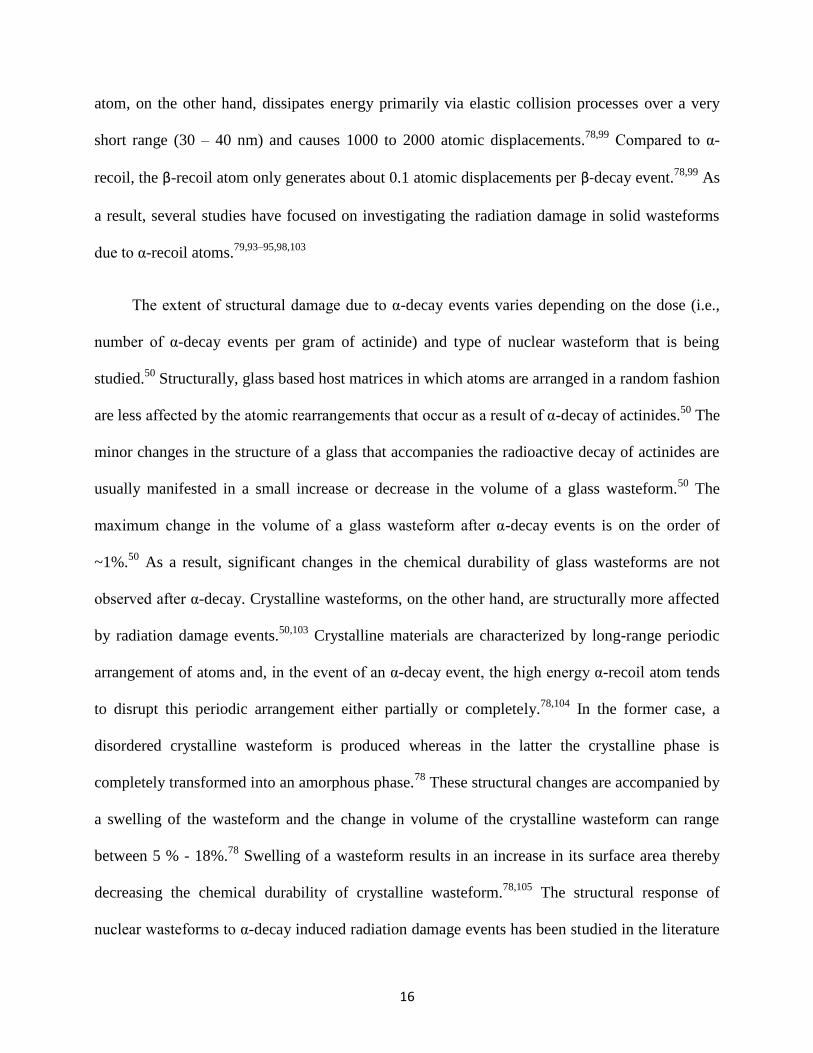
16
atom, on the other hand, dissipates energy primarily via elastic collision processes over a very
short range (30 – 40 nm) and causes 1000 to 2000 atomic displacements.78,99
Compared to α-
recoil, the β-recoil atom only generates about 0.1 atomic displacements per β-decay event.78,99
As
a result, several studies have focused on investigating the radiation damage in solid wasteforms
due to α-recoil atoms.79,93–95,98,103
The extent of structural damage due to α-decay events varies depending on the dose (i.e.,
number of α-decay events per gram of actinide) and type of nuclear wasteform that is being
studied.50
Structurally, glass based host matrices in which atoms are arranged in a random fashion
are less affected by the atomic rearrangements that occur as a result of α-decay of actinides.50
The
minor changes in the structure of a glass that accompanies the radioactive decay of actinides are
usually manifested in a small increase or decrease in the volume of a glass wasteform.50
The
maximum change in the volume of a glass wasteform after α-decay events is on the order of
~1%.50
As a result, significant changes in the chemical durability of glass wasteforms are not
observed after α-decay. Crystalline wasteforms, on the other hand, are structurally more affected
by radiation damage events.50,103
Crystalline materials are characterized by long-range periodic
arrangement of atoms and, in the event of an α-decay event, the high energy α-recoil atom tends
to disrupt this periodic arrangement either partially or completely.78,104
In the former case, a
disordered crystalline wasteform is produced whereas in the latter the crystalline phase is
completely transformed into an amorphous phase.78
These structural changes are accompanied by
a swelling of the wasteform and the change in volume of the crystalline wasteform can range
between 5 % - 18%.78
Swelling of a wasteform results in an increase in its surface area thereby
decreasing the chemical durability of crystalline wasteform.78,105
The structural response of
nuclear wasteforms to α-decay induced radiation damage events has been studied in the literature
17
either via incorporation of actinides in a wasteform (internal irradiation) and/or through
simulation of damage by implanting high energy charged particles in a wasteform (external
rradiation).78,95,106
A short account of internal and external irradiation methods is provided in the
following section.
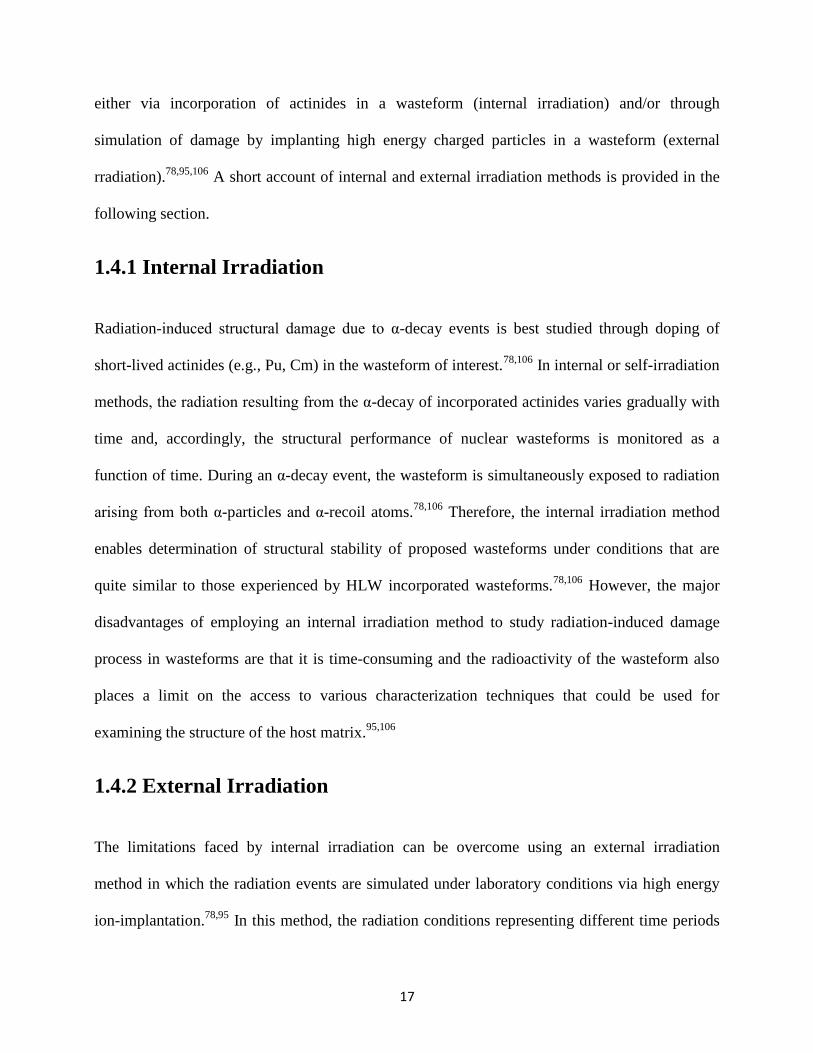
1.4.1 Internal Irradiation
Radiation-induced structural damage due to α-decay events is best studied through doping of
short-lived actinides (e.g., Pu, Cm) in the wasteform of interest.78,106
In internal or self-irradiation
methods, the radiation resulting from the α-decay of incorporated actinides varies gradually with
time and, accordingly, the structural performance of nuclear wasteforms is monitored as a
function of time. During an α-decay event, the wasteform is simultaneously exposed to radiation
arising from both α-particles and α-recoil atoms.78,106
Therefore, the internal irradiation method
enables determination of structural stability of proposed wasteforms under conditions that are
quite similar to those experienced by HLW incorporated wasteforms.78,106
However, the major
disadvantages of employing an internal irradiation method to study radiation-induced damage
process in wasteforms are that it is time-consuming and the radioactivity of the wasteform also
places a limit on the access to various characterization techniques that could be used for
examining the structure of the host matrix.95,106
1.4.2 External Irradiation
The limitations faced by internal irradiation can be overcome using an external irradiation
method in which the radiation events are simulated under laboratory conditions via high energy
ion-implantation.78,95
In this method, the radiation conditions representing different time periods
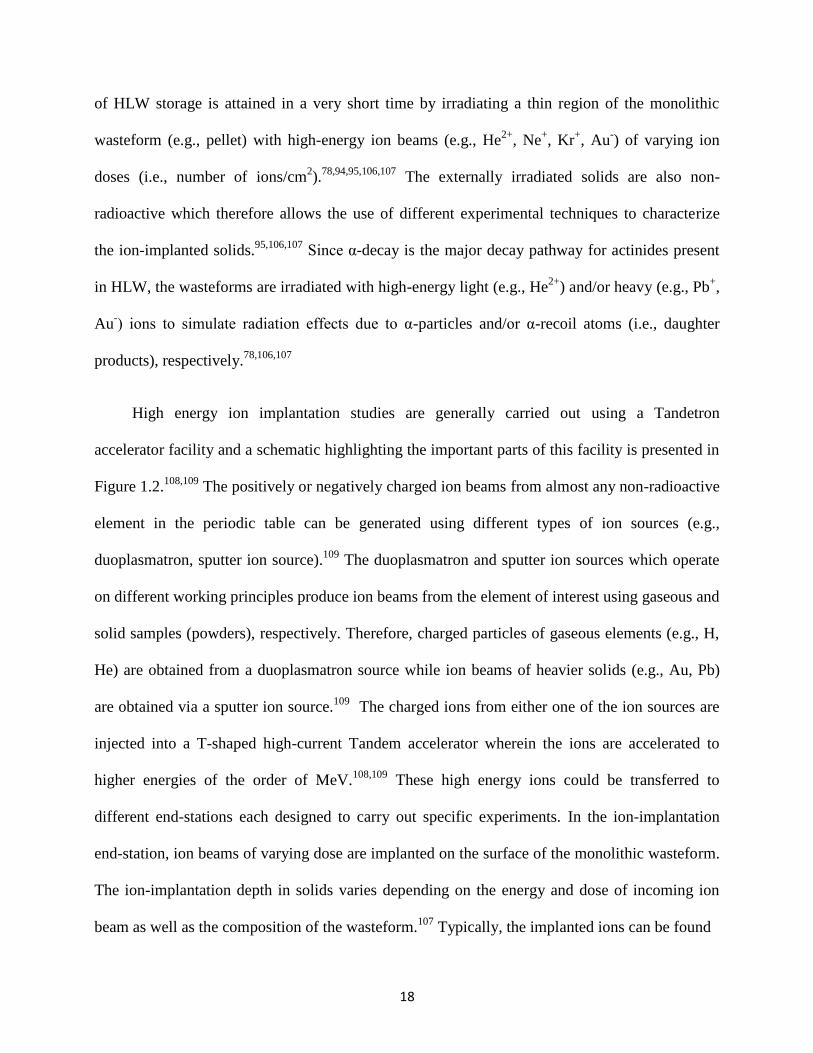
18
of HLW storage is attained in a very short time by irradiating a thin region of the monolithic
wasteform (e.g., pellet) with high-energy ion beams (e.g., He2+
, Ne+, Kr
+, Au
-) of varying ion
doses (i.e., number of ions/cm2).
78,94,95,106,107 The externally irradiated solids are also non-
radioactive which therefore allows the use of different experimental techniques to characterize
the ion-implanted solids.95,106,107
Since α-decay is the major decay pathway for actinides present
in HLW, the wasteforms are irradiated with high-energy light (e.g., He2+
) and/or heavy (e.g., Pb+,
Au-) ions to simulate radiation effects due to α-particles and/or α-recoil atoms (i.e., daughter
products), respectively.78,106,107
High energy ion implantation studies are generally carried out using a Tandetron
accelerator facility and a schematic highlighting the important parts of this facility is presented in
Figure 1.2.108,109
The positively or negatively charged ion beams from almost any non-radioactive
element in the periodic table can be generated using different types of ion sources (e.g.,
duoplasmatron, sputter ion source).109
The duoplasmatron and sputter ion sources which operate
on different working principles produce ion beams from the element of interest using gaseous and
solid samples (powders), respectively. Therefore, charged particles of gaseous elements (e.g., H,
He) are obtained from a duoplasmatron source while ion beams of heavier solids (e.g., Au, Pb)
are obtained via a sputter ion source.109
The charged ions from either one of the ion sources are
injected into a T-shaped high-current Tandem accelerator wherein the ions are accelerated to
higher energies of the order of MeV.108,109
These high energy ions could be transferred to
different end-stations each designed to carry out specific experiments. In the ion-implantation
end-station, ion beams of varying dose are implanted on the surface of the monolithic wasteform.
The ion-implantation depth in solids varies depending on the energy and dose of incoming ion
beam as well as the composition of the wasteform.107
Typically, the implanted ions can be found
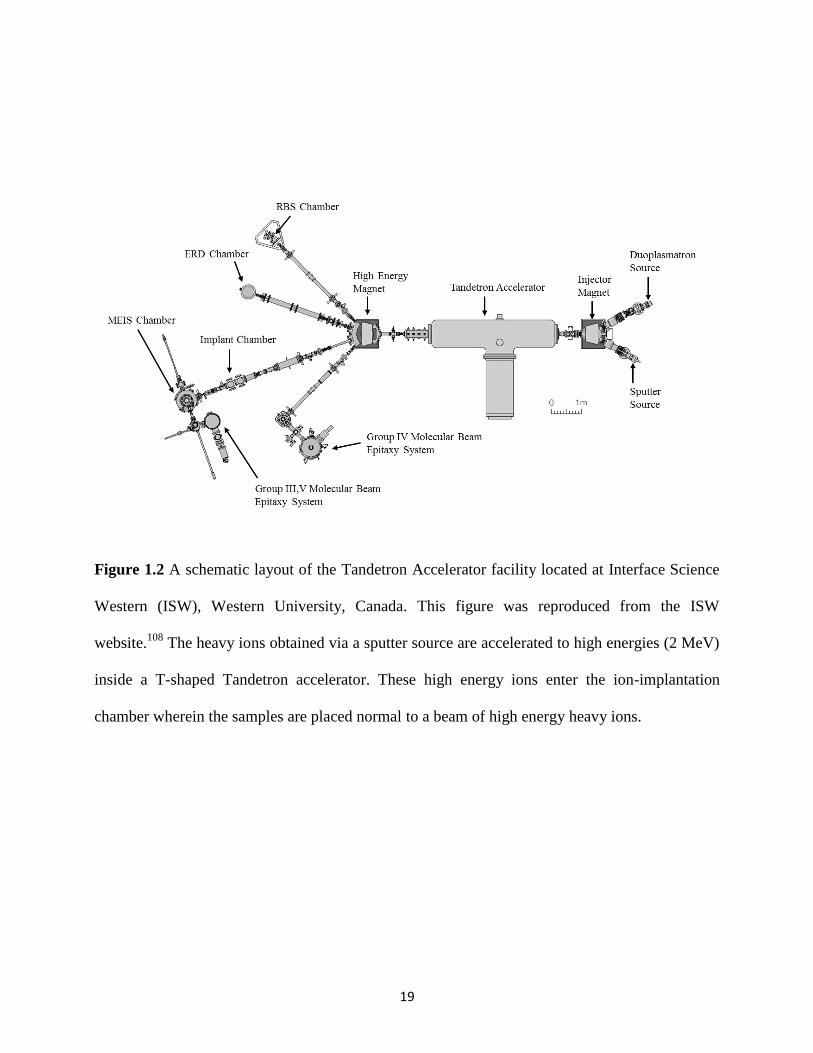
19
Figure 1.2 A schematic layout of the Tandetron Accelerator facility located at Interface Science
Western (ISW), Western University, Canada. This figure was reproduced from the ISW
website.108
The heavy ions obtained via a sputter source are accelerated to high energies (2 MeV)
inside a T-shaped Tandetron accelerator. These high energy ions enter the ion-implantation
chamber wherein the samples are placed normal to a beam of high energy heavy ions.

20
in the nanometre regime of the solid and various characterization techniques can be used to study
the ion-implanted solids.107
1.5 Rare-Earth Phosphate Based Wasteforms
In the search for a suitable crystalline wasteform, synthetic analogues of some of the naturally
occurring rare-earth phosphate minerals have been identified as a potential host matrix for HLW
storage.60,81,100
The rare-earth phosphate minerals are both compositionally and structurally
diverse and can be found in nature as monazite [(Ce,La,Nd,Th,U)PO4], xenotime
[(Y,HREE,U,Th)PO4; HREE – heavy rare-earth elements], fluorapatite [(Ca,Ce)5(PO4)3F],
vitusite [Na3(Ce,La,Nd)(PO4)2], rhabdophane [(Ce,La)PO4.H2O], and brockite
[(Ca,Th,Ce)PO4.H2O].110
Of the various rare-earth phosphate minerals that exist in nature, the
monazite and xenotime minerals contain the highest weight percent of rare-earth elements and
these minerals are used commercially for the extraction of rare-earth elements.111,112
Monazite
and xenotime are abundant rare-earth minerals that exist as an accessory phase in rocks such as
granitoids, rhyolites, and gneisses.110–113
The mineral monazite is also found in alluvial deposits
and beach sands as a result of the weathering of rocks.110,113
In addition to accommodating rare-
earth elements, the monazite and xenotime minerals also contain varying amounts of radioactive
elements such as thorium and uranium which makes these minerals slightly radioactive.114–116
Due to the presence of thorium and uranium, these minerals have been exposed to radiation
events over geological time scales and yet the monazite mineral, in particular, is never found
completely in a metamict state (i.e., amorphous).117–120
This observation suggests that these
minerals are structurally resistant to radiation damage events.121
However, radiation studies on
synthetic and natural monazite samples have shown that these minerals are easily damaged by

21
radiation events but could also recover from structural damage upon annealing at lower
temperatures.122–124
Unlike the monazite mineral, radiation studies of xenotime minerals are not
well documented in the literature. Monazite and xenotime minerals are also highly insoluble and
possess high chemical durability in aqueous environments and this is demonstrated by the fact
that the monazite minerals are still present in beach sands and placer deposits wherein the
minerals are frequently exposed to aqueous conditions.113
Based on this mineralogical evidence,
synthetic analogues of monazite and xenotime minerals are being proposed as potential host
candidates for nuclear waste sequestration applications.88,121,125
Another important mineral that is chemically related to monazite is the rhabdophane
mineral.126,127
Rhabdophane is a naturally occurring hydrous rare-earth phosphate mineral
(REPO4.nH2O; RE = La to Dy) that is formed during the aqueous alteration of monazite minerals
and could play a role in controlling the solubility of actinides.128–130
A few studies have shown
the formation of rhabdophane on the surface of synthetic phosphate ceramics as a result of
chemical alteration of the latter and have proposed that the rhabdophane material could act as a
protective barrier by either delaying or stopping the release of actinides to the environment.126,128–
134 In terms of structural stability, the rhabdophane phase is considered to be metastable and can
undergo structural transformations to the monazite- or xenotime- type structure at higher
temperatures.126
It is for this reason that the synthetic analogues of the rhabdophane mineral have
not received attention as a nuclear wasteform in the literature. Nevertheless, a detailed
investigation of the structure and properties of rhabdophane-type materials is required in order to
assess the long term chemical performance of monazite wasteforms in geological repository
based conditions.127
22
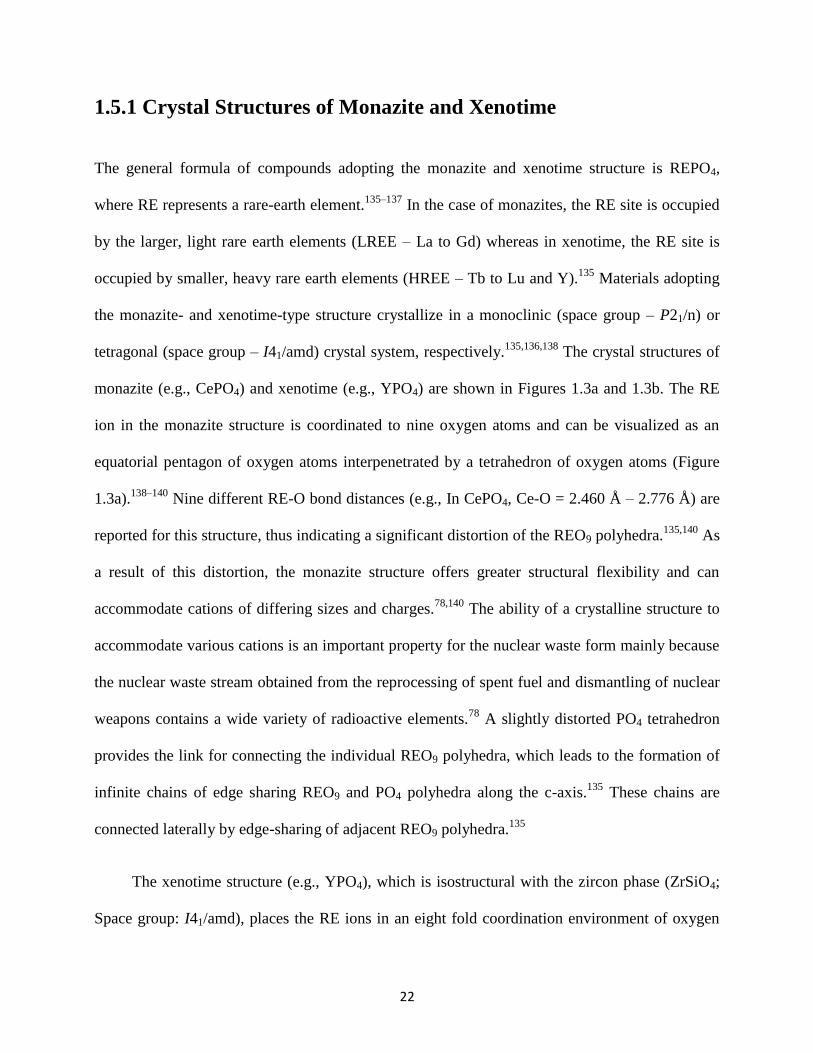
1.5.1 Crystal Structures of Monazite and Xenotime
The general formula of compounds adopting the monazite and xenotime structure is REPO4,
where RE represents a rare-earth element.135–137
In the case of monazites, the RE site is occupied
by the larger, light rare earth elements (LREE – La to Gd) whereas in xenotime, the RE site is
occupied by smaller, heavy rare earth elements (HREE – Tb to Lu and Y).135
Materials adopting
the monazite- and xenotime-type structure crystallize in a monoclinic (space group – P21/n) or
tetragonal (space group – I41/amd) crystal system, respectively.135,136,138
The crystal structures of
monazite (e.g., CePO4) and xenotime (e.g., YPO4) are shown in Figures 1.3a and 1.3b. The RE
ion in the monazite structure is coordinated to nine oxygen atoms and can be visualized as an
equatorial pentagon of oxygen atoms interpenetrated by a tetrahedron of oxygen atoms (Figure
1.3a).138–140
Nine different RE-O bond distances (e.g., In CePO4, Ce-O = 2.460 Å – 2.776 Å) are
reported for this structure, thus indicating a significant distortion of the REO9 polyhedra.135,140
As
a result of this distortion, the monazite structure offers greater structural flexibility and can
accommodate cations of differing sizes and charges.78,140
The ability of a crystalline structure to
accommodate various cations is an important property for the nuclear waste form mainly because
the nuclear waste stream obtained from the reprocessing of spent fuel and dismantling of nuclear
weapons contains a wide variety of radioactive elements.78
A slightly distorted PO4 tetrahedron
provides the link for connecting the individual REO9 polyhedra, which leads to the formation of
infinite chains of edge sharing REO9 and PO4 polyhedra along the c-axis.135
These chains are
connected laterally by edge-sharing of adjacent REO9 polyhedra.135
The xenotime structure (e.g., YPO4), which is isostructural with the zircon phase (ZrSiO4;
Space group: I41/amd), places the RE ions in an eight fold coordination environment of oxygen
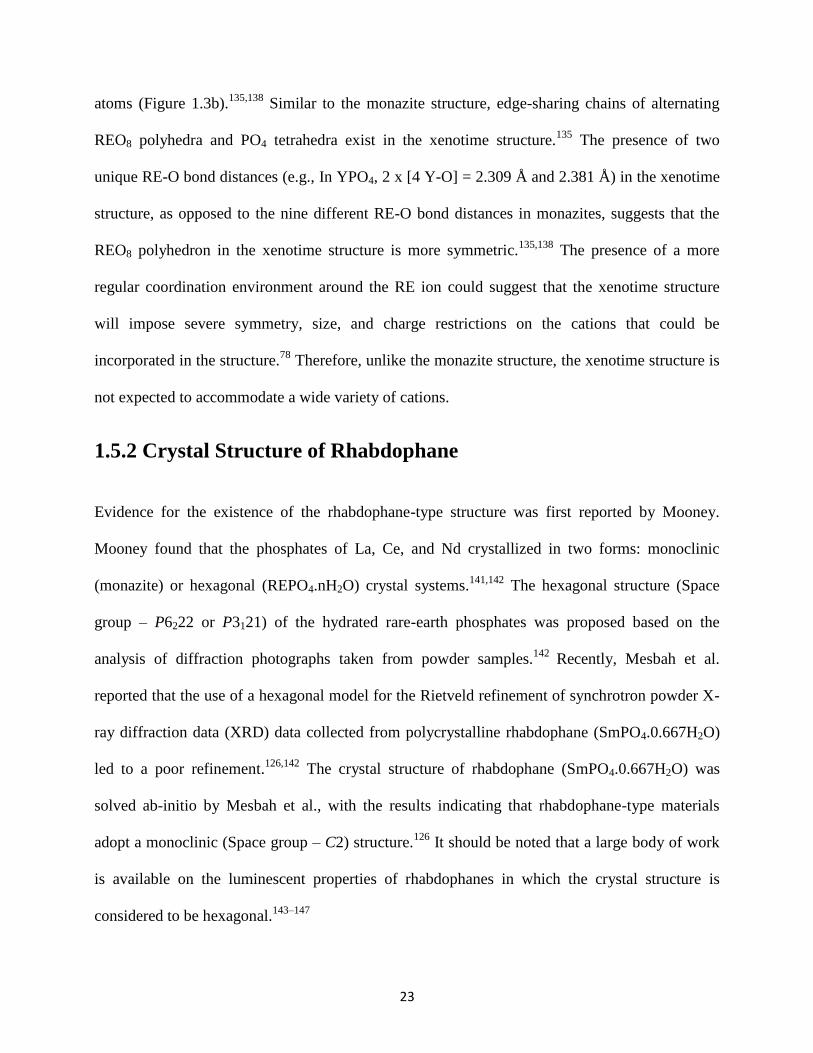
23
atoms (Figure 1.3b).135,138
Similar to the monazite structure, edge-sharing chains of alternating
REO8 polyhedra and PO4 tetrahedra exist in the xenotime structure.135
The presence of two
unique RE-O bond distances (e.g., In YPO4, 2 x [4 Y-O] = 2.309 Å and 2.381 Å) in the xenotime
structure, as opposed to the nine different RE-O bond distances in monazites, suggests that the
REO8 polyhedron in the xenotime structure is more symmetric.135,138
The presence of a more
regular coordination environment around the RE ion could suggest that the xenotime structure
will impose severe symmetry, size, and charge restrictions on the cations that could be
incorporated in the structure.78
Therefore, unlike the monazite structure, the xenotime structure is
not expected to accommodate a wide variety of cations.
1.5.2 Crystal Structure of Rhabdophane
Evidence for the existence of the rhabdophane-type structure was first reported by Mooney.
Mooney found that the phosphates of La, Ce, and Nd crystallized in two forms: monoclinic
(monazite) or hexagonal (REPO4.nH2O) crystal systems.141,142
The hexagonal structure (Space
group – P6222 or P3121) of the hydrated rare-earth phosphates was proposed based on the
analysis of diffraction photographs taken from powder samples.142
Recently, Mesbah et al.
reported that the use of a hexagonal model for the Rietveld refinement of synchrotron powder X-
ray diffraction data (XRD) data collected from polycrystalline rhabdophane (SmPO4.0.667H2O)
led to a poor refinement.126,142
The crystal structure of rhabdophane (SmPO4.0.667H2O) was
solved ab-initio by Mesbah et al., with the results indicating that rhabdophane-type materials
adopt a monoclinic (Space group – C2) structure.126
It should be noted that a large body of work
is available on the luminescent properties of rhabdophanes in which the crystal structure is
considered to be hexagonal.143–147

24
Figure 1.3 Crystal structures of (a) CePO4 (Monazite-type; Space group: P21/n) and (b) YPO4
(Xenotime-type; Space group: I41/amd). The crystal structures were generated using the VESTA
(Visualization for Electronic and Structural Analysis) software program.148
Figure 1.4 (a) Crystal structure of SmPO4.0.667H2O (rhabdophane-type; Space group: C2). (b)
Ball and stick representation of the alternate arrangement of Sm and P atoms in chains 1 (Ch1)
and 2 (Ch2). The crystal structure was generated using the VESTA software program.148
25
The crystal structure of monoclinic rhabdophane (e.g., SmPO4.0.667H2O) is shown in
Figure 1.4a.126
The structure is comprised of two chains referred to as Ch1 and Ch2 (See Figure
1.4b).126
There is an alternating sequence of Sm-O polyhedra and PO4 tetrahedra along the ‘a’
direction in both chains (Figure 1.4b).126
The alternating PO4 tetrahedra in Ch1 have four
different P-O bond distances (e.g., In SmPO4.0.667H2O, P-O = 1.535, 1.536, 1.547, 1.549 Å) and
P-O-P bond angles whereas in Ch2, the level of distortion in the alternating PO4 tetrahedra is not
uniform (i.e., four distinct P-O bond distances) [e.g., In SmPO4.0.667H2O, P-O = 1.529, 1.538,
1.545, 1.548 Å] and P-O-P bond angles in the first tetrahedra followed by two distinct P-O bond
distances [e.g., In SmPO4.0.667H2O, P-O = 1.534 Å and 1.537 Å] and P-O-P bond angles in the
second tetrahedra).126
The Sm ions in chains Ch1 and Ch2 differ in terms of their coordination
environment. The Sm ions in Ch1 are bonded to nine oxygen atoms (eight provided by the PO4
groups and one from water) and in Ch2, the Sm atoms are coordinated to only eight oxygen
atoms provided by the PO4 groups (Figure 1.4b).126
Both SmO9 and SmO8 polyhedra are
distorted. The connection of the two chains leads to the formation of infinite channels running
along the ‘a’ direction.126
Each channel is formed by the connection of six chains (4 Ch1 and 2
Ch2) and water resides inside these channels (Figure 1.4a).126
1.6 Experimental Techniques
In this thesis, various experimental techniques were used to probe the structure of hydrous and
anhydrous rare-earth phosphate materials at different length scales. The long-range structures of
rare-earth phosphates were studied using powder X-ray diffraction (XRD) while the electronic
and local structures of these materials were investigated using X-ray absorption spectroscopy

26
(XAS) and X-ray photoelectron spectroscopy (XPS). A brief overview of these techniques is
presented in the subsequent sections, with an emphasis given to XAS.
1.6.1 X-ray Absorption Spectroscopy (XAS)
XAS is widely used as a local structural characterization technique in various branches of science
such as environmental, material, physical, chemical, and biological sciences.149–153
The versatility
of this technique stems from its ability to provide element-specific local structural information of
a wide range of materials which includes, but is not limited to, crystalline, amorphous, and highly
disordered materials.149–151,153,154
The interaction of X-rays with matter can be described
mathematically using the Beer-Lambert law (Equation 1.1).152,155,156
𝐼𝑡 = 𝐼0𝑒−𝜇𝑡 (1.1)
In Equation 1.1, I0 represents the intensity of the incoming X-ray beam, It is the intensity of the
transmitted X-ray beam, µ is the linear absorption coefficient, and t is the thickness of the
sample.152,155,156
According to Equation 1.1, the X-rays of intensity I0 become attenuated as they
pass through the sample and this attenuation in X-ray intensity is a combined result of the
absorption of X-rays by the core-electrons of the element of interest as well as the thickness of
the sample. The X-ray absorption events are described quantitatively using the linear absorption
coefficient term (µ in cm-1
) which is defined as the product of mass absorption cross-section (σ in
cm2/g or barns/atom) and density (ρ in g/cm
3) of the sample.
155 The absorption cross-section (σ)
signifies the probability of X-ray absorption by the sample.155
Both, µ and σ are dependent on the
type of element that is being studied and varies as a function of the X-ray photon energy.152,155

27
The electrons that are present in various electronic levels of the atom have characteristic
well-defined binding energies and X-ray absorption by a sample occurs when the energy of the
incoming X-rays is tuned to match the binding energy of electron in the respective core-
electronic level.152
Upon absorption of X-rays, the core-electrons in the element of interest are
excited into unoccupied conduction states located above the Fermi level.152,157
The resulting core-
hole is stabilized via a decay process in which the electrons present in a higher energy state is
used to fill the vacancy in the lower energy state created by the electronic excitation process.152
The relaxation of a core-hole can occur via two decay pathways namely fluorescence and
electron emission (Auger electrons).152
In the fluorescence pathway, an X-ray fluorescent photon
with energy corresponding to the energy difference between the two electronic states is emitted
whereas in the other decay pathway the excess energy is used to eject an electron from the
atom.152
The absorption of X-rays by atoms is accompanied by large changes in the absorption
coefficient and in XAS, the absorption coefficient of the desired element is measured at X-ray
energies below and above the binding energy of the electron.154,156,158
The plot of µ (linear
absorption coefficient) versus X-ray energy constitutes an XAS spectrum and a representative P
K-edge XAS spectra is presented in Figure 1.5. As the energy of the X-rays approaches the
binding energy of an electron in the element of interest, an abrupt increase in the mass absorption
cross section occurs and this is reflected in the XAS spectra by the appearance of sharp
absorption edges (See Figure 1.5).154
These absorption edges are named after the electronic shells
(e.g., K, L, M shells etc.) from which the electrons are excited.158
Therefore, a K-absorption edge,
for example, indicates the excitation of electrons in the K shell (Principal quantum number, n =
1) into unoccupied conduction states. The energies of various absorption edges are unique for
each element and, as a result, the XAS technique offers element-specific structural
information.156
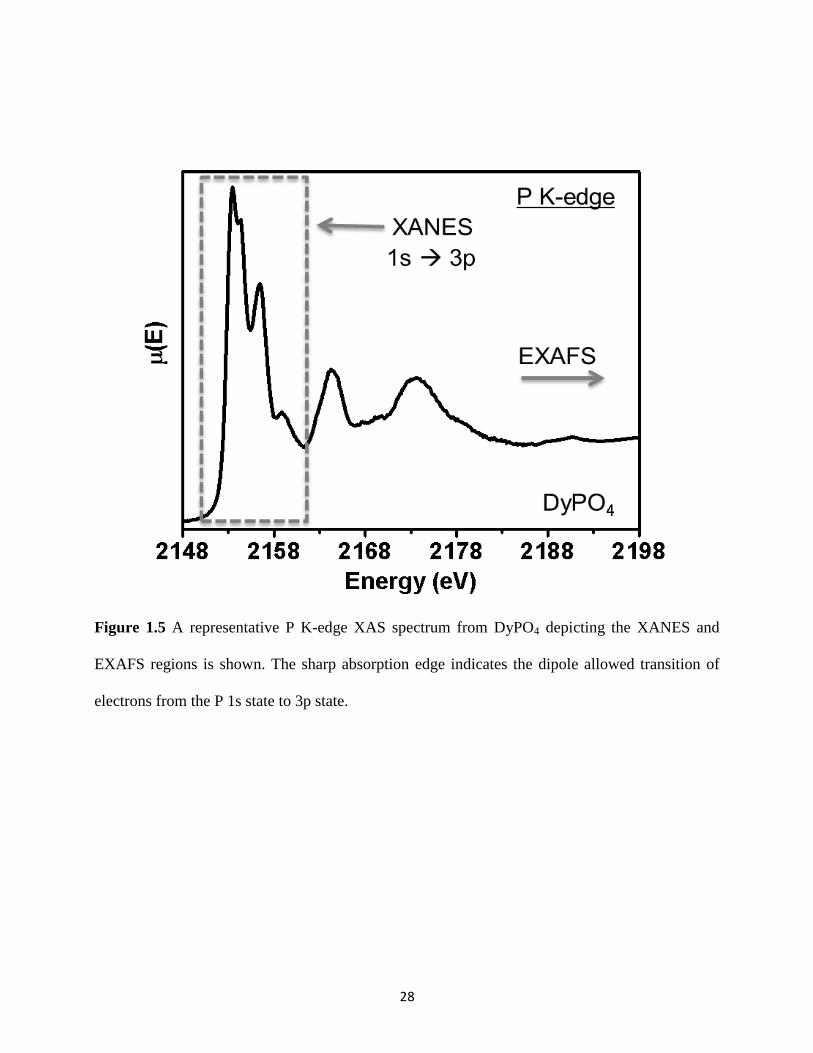
28
Figure 1.5 A representative P K-edge XAS spectrum from DyPO4 depicting the XANES and
EXAFS regions is shown. The sharp absorption edge indicates the dipole allowed transition of
electrons from the P 1s state to 3p state.
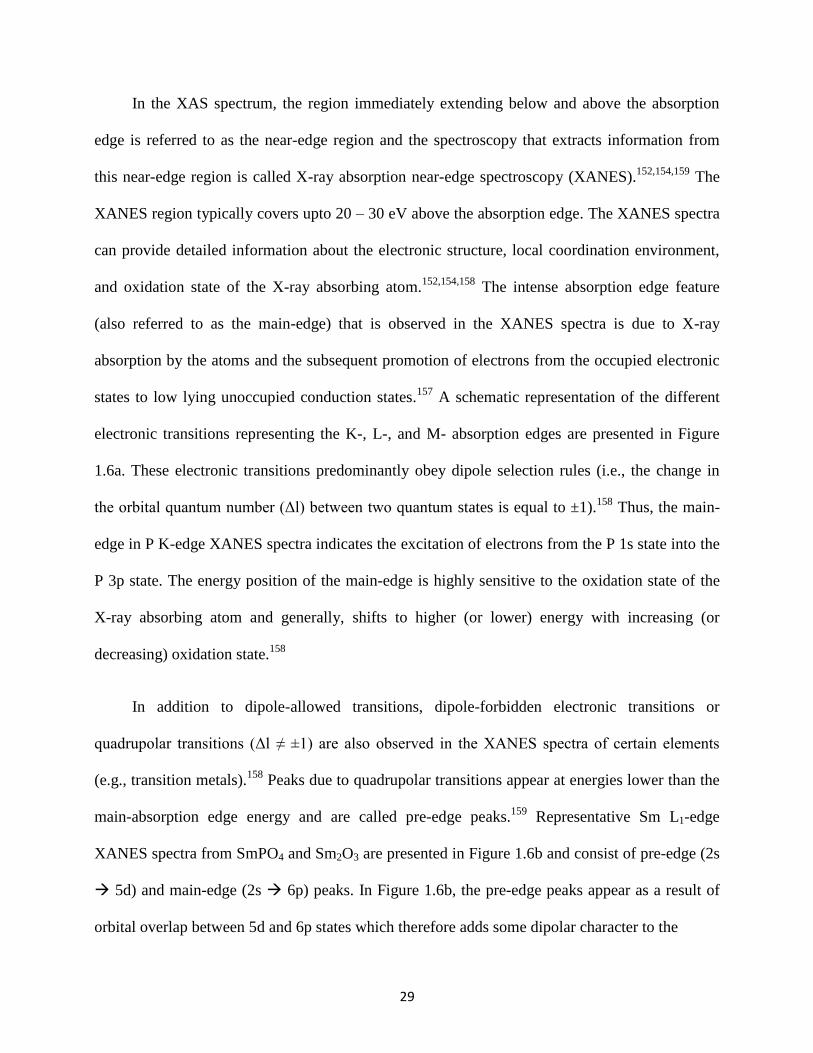
29
In the XAS spectrum, the region immediately extending below and above the absorption
edge is referred to as the near-edge region and the spectroscopy that extracts information from
this near-edge region is called X-ray absorption near-edge spectroscopy (XANES).152,154,159
The
XANES region typically covers upto 20 – 30 eV above the absorption edge. The XANES spectra
can provide detailed information about the electronic structure, local coordination environment,
and oxidation state of the X-ray absorbing atom.152,154,158
The intense absorption edge feature
(also referred to as the main-edge) that is observed in the XANES spectra is due to X-ray
absorption by the atoms and the subsequent promotion of electrons from the occupied electronic
states to low lying unoccupied conduction states.157
A schematic representation of the different
electronic transitions representing the K-, L-, and M- absorption edges are presented in Figure
1.6a. These electronic transitions predominantly obey dipole selection rules (i.e., the change in
the orbital quantum number (Δl) between two quantum states is equal to ±1).158
Thus, the main-
edge in P K-edge XANES spectra indicates the excitation of electrons from the P 1s state into the
P 3p state. The energy position of the main-edge is highly sensitive to the oxidation state of the
X-ray absorbing atom and generally, shifts to higher (or lower) energy with increasing (or
decreasing) oxidation state.158
In addition to dipole-allowed transitions, dipole-forbidden electronic transitions or
quadrupolar transitions (Δl ≠ ±1) are also observed in the XANES spectra of certain elements
(e.g., transition metals).158
Peaks due to quadrupolar transitions appear at energies lower than the
main-absorption edge energy and are called pre-edge peaks.159
Representative Sm L1-edge
XANES spectra from SmPO4 and Sm2O3 are presented in Figure 1.6b and consist of pre-edge (2s
5d) and main-edge (2s 6p) peaks. In Figure 1.6b, the pre-edge peaks appear as a result of
orbital overlap between 5d and 6p states which therefore adds some dipolar character to the
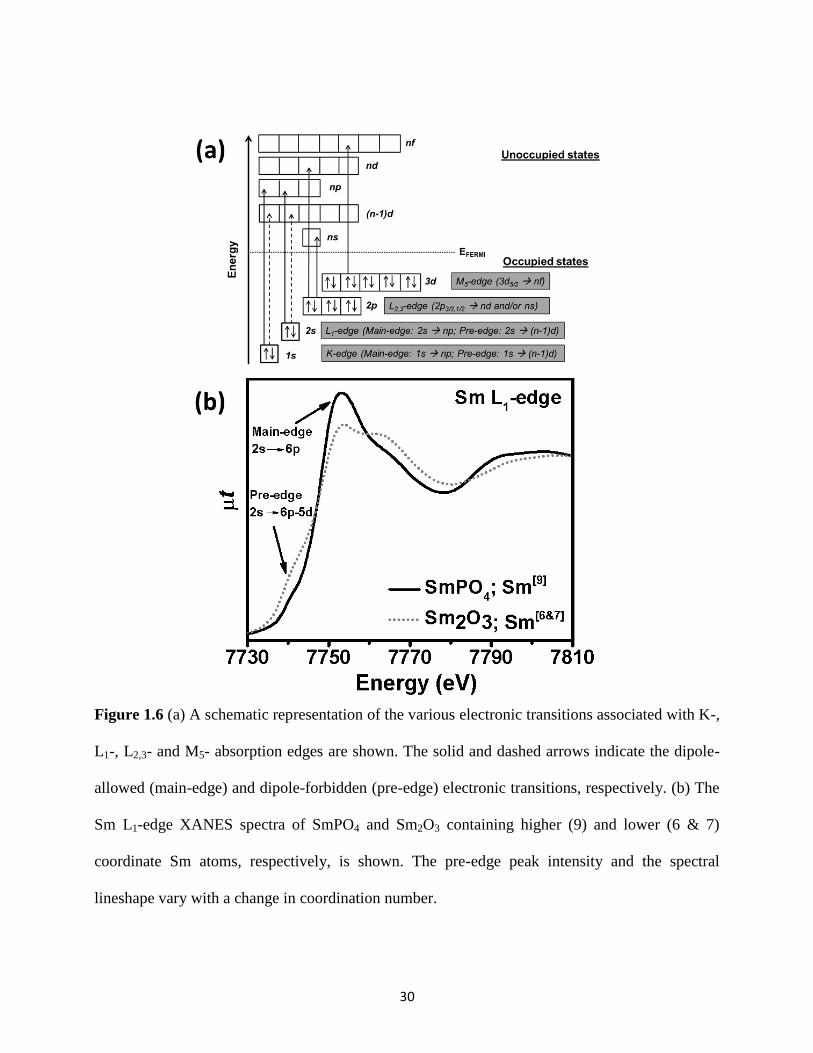
30
Figure 1.6 (a) A schematic representation of the various electronic transitions associated with K-,
L1-, L2,3- and M5- absorption edges are shown. The solid and dashed arrows indicate the dipole-
allowed (main-edge) and dipole-forbidden (pre-edge) electronic transitions, respectively. (b) The
Sm L1-edge XANES spectra of SmPO4 and Sm2O3 containing higher (9) and lower (6 & 7)
coordinate Sm atoms, respectively, is shown. The pre-edge peak intensity and the spectral
lineshape vary with a change in coordination number.
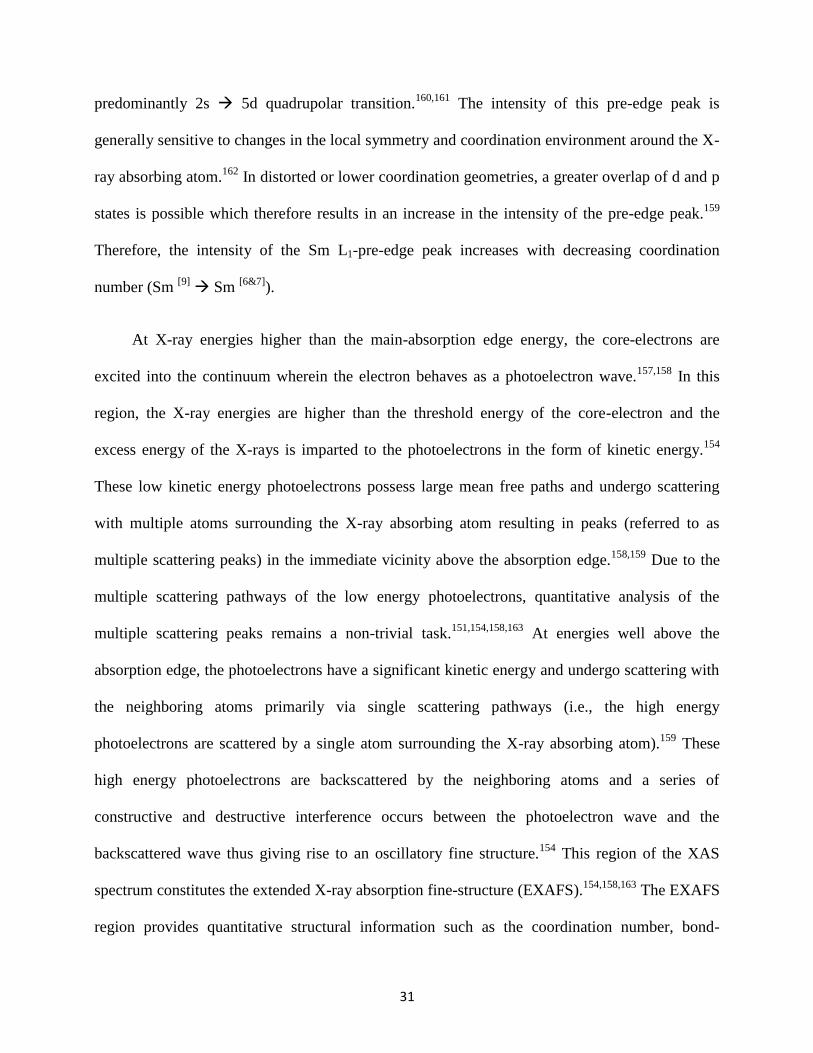
31
predominantly 2s 5d quadrupolar transition.160,161
The intensity of this pre-edge peak is
generally sensitive to changes in the local symmetry and coordination environment around the X-
ray absorbing atom.162
In distorted or lower coordination geometries, a greater overlap of d and p
states is possible which therefore results in an increase in the intensity of the pre-edge peak.159
Therefore, the intensity of the Sm L1-pre-edge peak increases with decreasing coordination
number (Sm [9]
Sm [6&7]
).
At X-ray energies higher than the main-absorption edge energy, the core-electrons are
excited into the continuum wherein the electron behaves as a photoelectron wave.157,158
In this
region, the X-ray energies are higher than the threshold energy of the core-electron and the
excess energy of the X-rays is imparted to the photoelectrons in the form of kinetic energy.154
These low kinetic energy photoelectrons possess large mean free paths and undergo scattering
with multiple atoms surrounding the X-ray absorbing atom resulting in peaks (referred to as
multiple scattering peaks) in the immediate vicinity above the absorption edge.158,159
Due to the
multiple scattering pathways of the low energy photoelectrons, quantitative analysis of the
multiple scattering peaks remains a non-trivial task.151,154,158,163
At energies well above the
absorption edge, the photoelectrons have a significant kinetic energy and undergo scattering with
the neighboring atoms primarily via single scattering pathways (i.e., the high energy
photoelectrons are scattered by a single atom surrounding the X-ray absorbing atom).159
These
high energy photoelectrons are backscattered by the neighboring atoms and a series of
constructive and destructive interference occurs between the photoelectron wave and the
backscattered wave thus giving rise to an oscillatory fine structure.154
This region of the XAS
spectrum constitutes the extended X-ray absorption fine-structure (EXAFS).154,158,163
The EXAFS
region provides quantitative structural information such as the coordination number, bond-
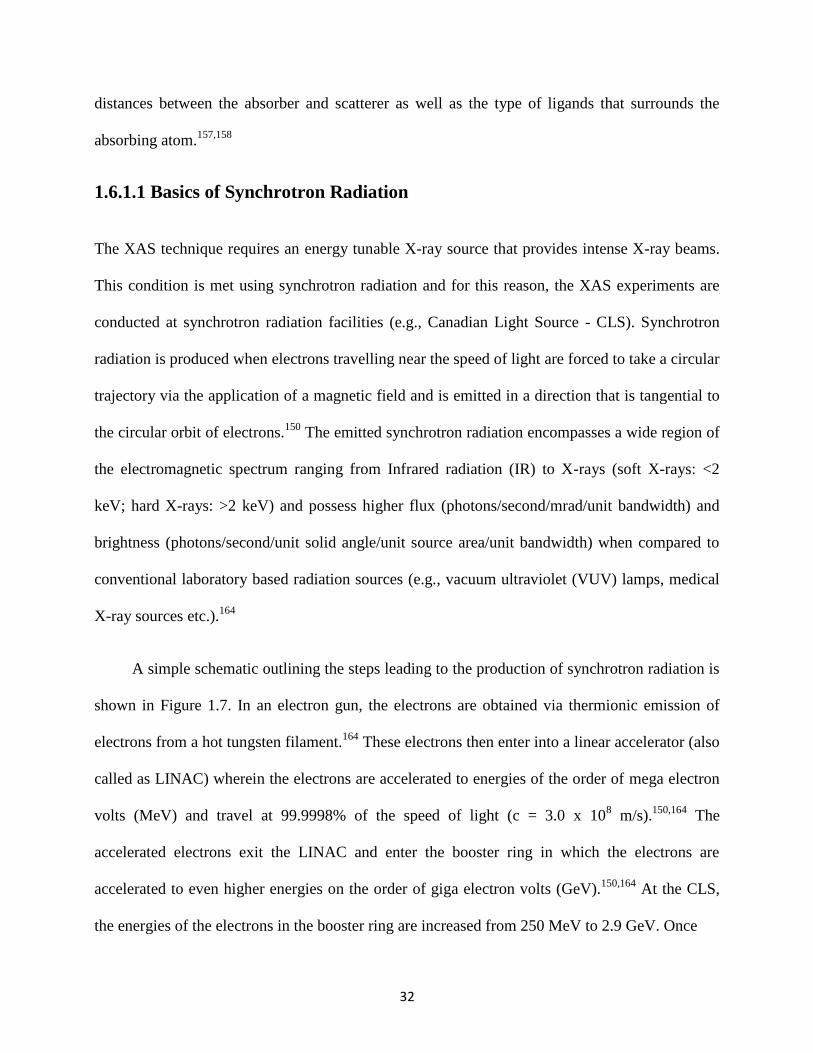
32
distances between the absorber and scatterer as well as the type of ligands that surrounds the
absorbing atom.157,158
1.6.1.1 Basics of Synchrotron Radiation
The XAS technique requires an energy tunable X-ray source that provides intense X-ray beams.
This condition is met using synchrotron radiation and for this reason, the XAS experiments are
conducted at synchrotron radiation facilities (e.g., Canadian Light Source - CLS). Synchrotron
radiation is produced when electrons travelling near the speed of light are forced to take a circular
trajectory via the application of a magnetic field and is emitted in a direction that is tangential to
the circular orbit of electrons.150
The emitted synchrotron radiation encompasses a wide region of
the electromagnetic spectrum ranging from Infrared radiation (IR) to X-rays (soft X-rays: <2
keV; hard X-rays: >2 keV) and possess higher flux (photons/second/mrad/unit bandwidth) and
brightness (photons/second/unit solid angle/unit source area/unit bandwidth) when compared to
conventional laboratory based radiation sources (e.g., vacuum ultraviolet (VUV) lamps, medical
X-ray sources etc.).164
A simple schematic outlining the steps leading to the production of synchrotron radiation is
shown in Figure 1.7. In an electron gun, the electrons are obtained via thermionic emission of
electrons from a hot tungsten filament.164
These electrons then enter into a linear accelerator (also
called as LINAC) wherein the electrons are accelerated to energies of the order of mega electron
volts (MeV) and travel at 99.9998% of the speed of light (c = 3.0 x 10⁸ m/s).
150,164 The
accelerated electrons exit the LINAC and enter the booster ring in which the electrons are
accelerated to even higher energies on the order of giga electron volts (GeV).150,164
At the CLS,
the energies of the electrons in the booster ring are increased from 250 MeV to 2.9 GeV. Once
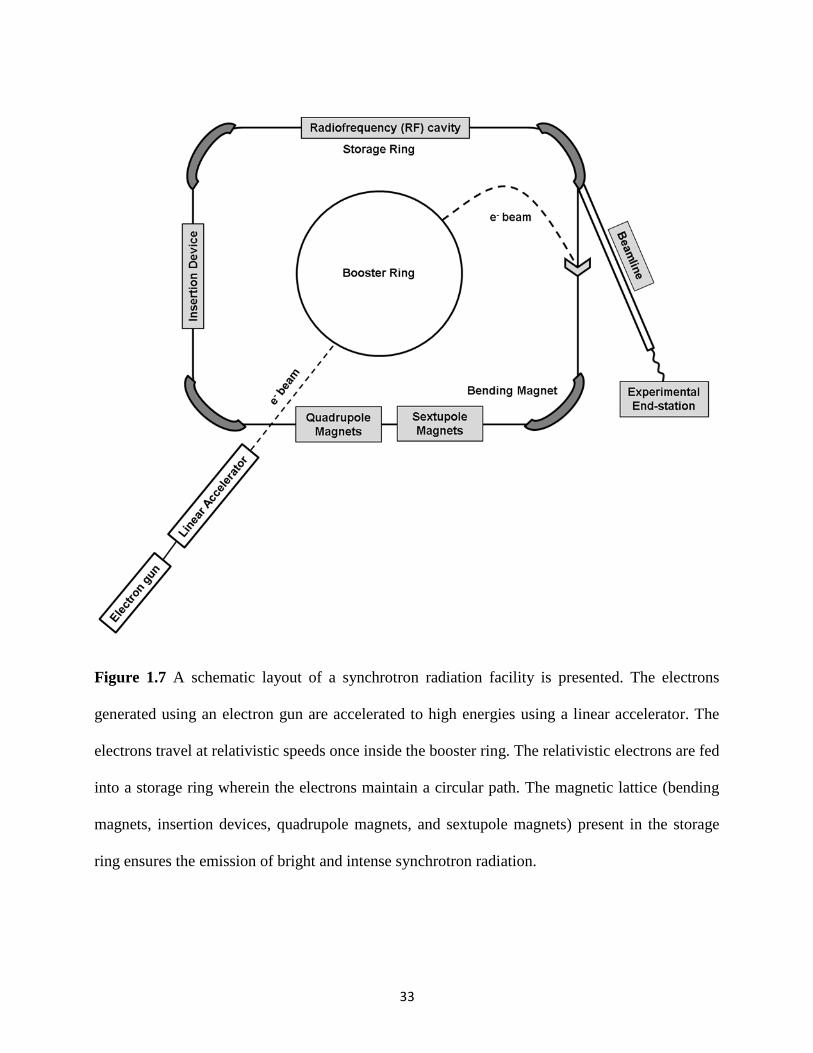
33
Figure 1.7 A schematic layout of a synchrotron radiation facility is presented. The electrons
generated using an electron gun are accelerated to high energies using a linear accelerator. The
electrons travel at relativistic speeds once inside the booster ring. The relativistic electrons are fed
into a storage ring wherein the electrons maintain a circular path. The magnetic lattice (bending
magnets, insertion devices, quadrupole magnets, and sextupole magnets) present in the storage
ring ensures the emission of bright and intense synchrotron radiation.
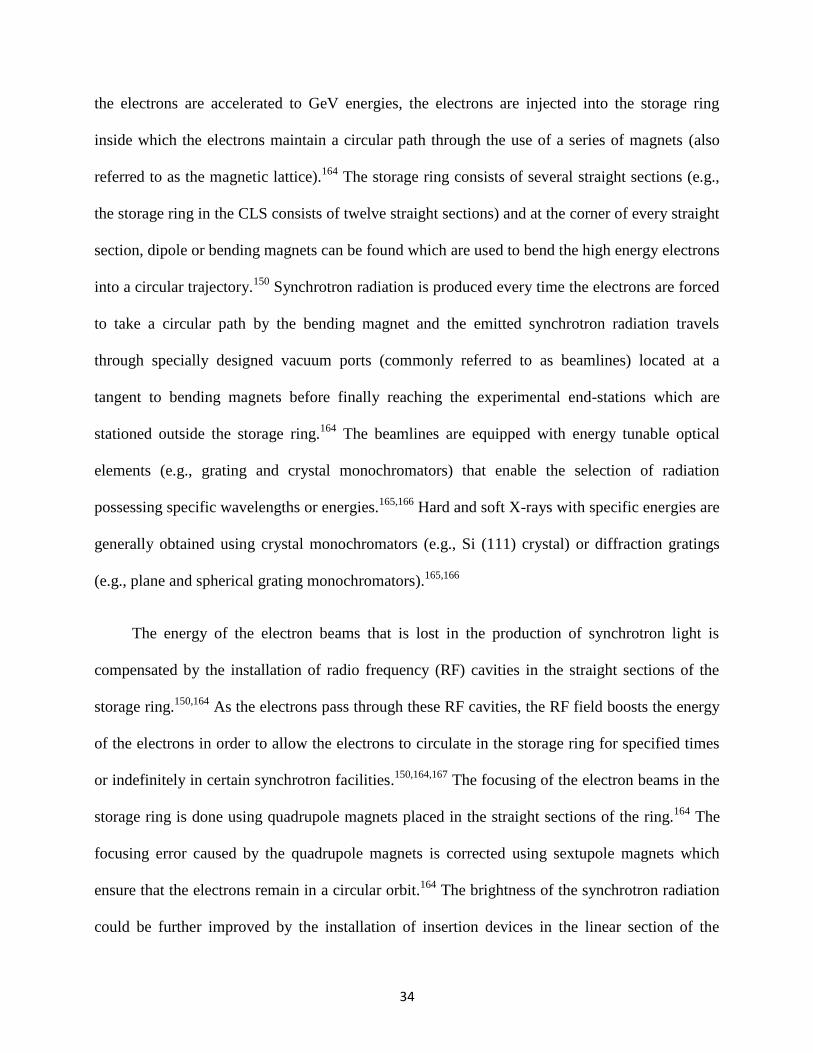
34
the electrons are accelerated to GeV energies, the electrons are injected into the storage ring
inside which the electrons maintain a circular path through the use of a series of magnets (also
referred to as the magnetic lattice).164
The storage ring consists of several straight sections (e.g.,
the storage ring in the CLS consists of twelve straight sections) and at the corner of every straight
section, dipole or bending magnets can be found which are used to bend the high energy electrons
into a circular trajectory.150
Synchrotron radiation is produced every time the electrons are forced
to take a circular path by the bending magnet and the emitted synchrotron radiation travels
through specially designed vacuum ports (commonly referred to as beamlines) located at a
tangent to bending magnets before finally reaching the experimental end-stations which are
stationed outside the storage ring.164
The beamlines are equipped with energy tunable optical
elements (e.g., grating and crystal monochromators) that enable the selection of radiation
possessing specific wavelengths or energies.165,166
Hard and soft X-rays with specific energies are
generally obtained using crystal monochromators (e.g., Si (111) crystal) or diffraction gratings
(e.g., plane and spherical grating monochromators).165,166
The energy of the electron beams that is lost in the production of synchrotron light is
compensated by the installation of radio frequency (RF) cavities in the straight sections of the
storage ring.150,164
As the electrons pass through these RF cavities, the RF field boosts the energy
of the electrons in order to allow the electrons to circulate in the storage ring for specified times
or indefinitely in certain synchrotron facilities.150,164,167
The focusing of the electron beams in the
storage ring is done using quadrupole magnets placed in the straight sections of the ring.164
The
focusing error caused by the quadrupole magnets is corrected using sextupole magnets which
ensure that the electrons remain in a circular orbit.164
The brightness of the synchrotron radiation
could be further improved by the installation of insertion devices in the linear section of the

35
ring.164
Insertion devices consist of a periodic array of magnets of alternating poles and when
electrons pass through these regions, the alternating magnetic fields causes the electrons to
oscillate in a direction perpendicular to the direction of their motion thereby resulting in the
emission of intense and bright synchrotron radiation.150,164,167
1.6.1.2 XAS Experimental Setup
In XAS, the measurement of absorption of X-rays by the sample is performed using multiple
detection modes namely transmission, fluorescence, and electron yield.154,159,168
The transmission
mode, as the name implies, measures the intensity of the X-rays transmitted by the sample and
the absorption of X-rays by the sample (µt) is determined using Equation 1.2.
µ𝑡 = ln (𝐼𝑂
𝐼𝑡) (1.2)
In Equation 1.2, I0 and It refers to the intensity of incident and transmitted X-rays,
respectively. A basic layout of the experimental setup required for conducting transmission
experiments is presented in Figure 1.8. X-rays with specific energies obtained using a
monochromator are passed through an ionization chamber (I0) filled with inert gases (e.g., N2, Ar,
He, Kr) wherein the X-rays will ionize these gases and the intensity of the incident X-ray beam
(I0) is determined by measuring the ionization current.152
The X-rays, after passing through the
first ionization chamber, are now incident on the sample and X-ray absorption by the sample
occurs when the energy of the X-rays is at or above the absorption edge of the element of interest.
The transmitted X-rays pass through another ionization chamber wherein the intensity of the
transmitted X-rays (It) is determined.152
For calibration purposes, XAS spectra are also collected
from calibration standards placed between the transmission (It) and reference (IRef) ionization

36
Figure 1.8 A basic layout of the XAS experimental setup. I0, It, and IRef represent the ionization,
transmission, and reference ionization chambers, respectively. Depending on the energy of the X-
rays and the detection mode used, the XAS experiments can be conducted in either ambient or
ultra-high vacuum (UHV) conditions.
37
chambers. For thick samples (e.g., > 1 µm), transmission experiments can be performed only
using hard X-rays.159
The high energy of the hard X-rays allows for an easy penetration of X-rays
through the sample. Because of the high energy of the X-rays, hard X-ray transmission
experiments do not require ultra-high vacuum conditions (UHV) and are generally conducted
under ambient conditions. For thin samples (e.g., few nm), transmission experiments can be
performed using both soft- and hard- X-rays. The transmission mode is also the preferred
detection mode for samples having high concentrations of the element of interest.152
XAS spectra are also obtained using indirect methods of detection in which the decay
products (fluorescence, photoelectrons, Auger electrons, and secondary electrons) resulting from
the core-hole relaxation process are measured.152,154
The linear relationship between the decay
products and absorption cross sections allows for the measurement of XAS spectra in
fluorescence and total electron yield (TEY) modes.159
The fluorescence mode of detection is
highly preferred for samples having lower concentrations of the element of interest.152
As a
result, the fluorescence detection mode is most widely used in the study of biological and
environmental samples in which the concentrations of the element of interest are usually low. For
hard X-ray measurements, fluorescence and transmission data can be collected simultaneously
under ambient conditions by placing the fluorescent detector perpendicular to the sample.152
However, for soft X-ray absorption spectroscopy (e.g., P K-edge), the fluorescence data needs to
be collected under UHV conditions.159
This is because at lower X-ray energies, a fluorescent
photon loses the majority of its energy via interactions with air molecules. Measurement of the
absorption spectra using the TEY mode can be done only under UHV conditions. The XAS
spectra obtained using TEY mode are surface sensitive since the electron attenuation lengths in
38
solids are much lower when compared to the attenuation lengths of X-ray fluorescent
photons.154,159,168
1.6.1.3 Glancing Angle XAS
XAS is inherently a bulk-sensitive characterization technique because of the high penetrating
power of X-rays into matter.158
As mentioned in the previous section, local structural information
could be obtained from the surface of the material via collection of XAS spectra in TEY mode.
However, using the TEY mode of detection would require the samples to be conducting.
Therefore, for thick (e.g., pellets) and non-conducting samples, it is possible to obtain surface
specific local structural information through the collection of XAS spectra in a glancing (or
grazing) angle (GA) mode.151,154,169
A schematic of the glancing angle XAS (GA-XAS)
experimental setup is shown in Figure 1.9. In the glancing angle mode, the X-rays are incident on
the surface of a material (e.g., pellet) at an angle ‘θ’ that is just above the critical angle for total
external reflection.154,169
With this experimental setup, the probing depth of the X-rays into matter
decreases thereby rendering the GA-XAS spectra surface sensitive.154
With regard to the modes
of detection, GA-XAS spectra could be obtained using fluorescence and TEY modes. It is also
possible to obtain local structural information from different depths of the material by varying the
angle ‘θ’ between the incoming X-ray beam and the sample.154
The GA-XAS technique is useful
for studying materials in which the surface composition of the material is different from the bulk
composition of the material.162
1.6.2 X-ray Photoelectron Spectroscopy
X-ray photoelectron spectroscopy (XPS) is a technique used in determining elemental
composition, as well as in revealing the chemical environment of the respective element found in
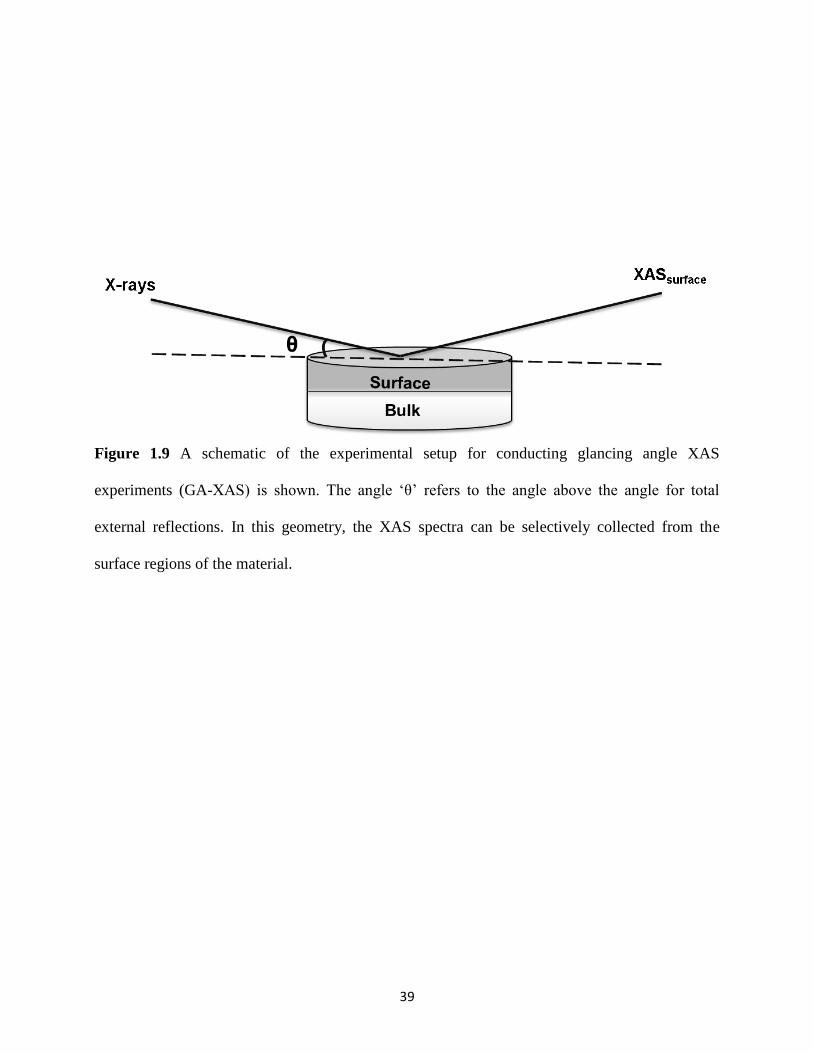
39
Figure 1.9 A schematic of the experimental setup for conducting glancing angle XAS
experiments (GA-XAS) is shown. The angle ‘θ’ refers to the angle above the angle for total
external reflections. In this geometry, the XAS spectra can be selectively collected from the
surface regions of the material.

40
the top ≤10 nm of the surface of a solid.170–173
The principle of this technique stems from the
theory of the photoelectric effect proposed by Einstein which states that when a material is
irradiated with a photon of energy greater than the binding energy of the core electron in the
solid, electrons are ejected with a kinetic energy (KE) that is dependent on the incident energy of
the photon (hυ), binding energy (BE) of the electron, and the work function of the sample
(Φsample).170
The expression that relates these terms is given in Equation 1.3.
𝐵𝐸 = ℎυ − KE − Φ𝑠𝑎𝑚𝑝𝑙𝑒 (1.3)
Measurement of the binding energy of electrons in a solid requires referencing of the
energy levels (i.e., Fermi and vacuum energy levels are chosen as the reference levels in the
solid).170,171
The concept of binding energy and work function are defined with respect to these
two energy levels. The energy required to remove the electron from the core level to the Fermi
level is called the binding energy.170,171
The work function refers to the removal of electrons from
the Fermi level to the vacuum level which is located away from the surface at an infinite distance
where the electron is completely free from the attractive potential of the surface and exists as a
free electron.170,171
The work function of the sample (Φsample) is sample dependent.170
In XPS, the
Fermi energy levels of the sample and spectrometer are aligned to the same energy and, as a
result, the work function is modified and the new work function is given in Eq. 1.4.
Φ = (Φ𝑠𝑝𝑒𝑐𝑡𝑟𝑜𝑚𝑒𝑡𝑒𝑟 + Φ𝑠𝑎𝑚𝑝𝑙𝑒) − Φ𝑠𝑎𝑚𝑝𝑙𝑒 = Φ𝑠𝑝𝑒𝑐𝑡𝑟𝑜𝑚𝑒𝑡𝑒𝑟 (1.4)
The value of Φspectrometer can be found using calibration standards (e.g., Au, Ag, and Cu)
possessing well-known binding energies.170
As a result, the expression for determining the
binding energy can be simplified and is provided in Eq. 1.5.
41
𝐵𝐸 = ℎυ − KE (1.5)
There are many sources of X-ray radiation but the most commonly employed ones are
laboratory based X-ray sources (Al Kα, Mg Kα) and X-ray radiation emitted from synchrotron
radiation sources.171
It is the KE that is being measured by this technique and ultra-high vacuum
(UHV) conditions are required so that the photoelectron does not encounter any air molecules on
its way to the detector.170
There are two types of energy scales used in a XPS experiment, namely
the BE and KE scales.170
In order to compare the spectra obtained using different sources of
incident radiation, the BE scale is used as the observed photoelectron line energies are
independent of the energy of the incident radiation used.170
In the case of electrically conducting
solids, the Fermi levels of the sample and the spectrometer align with each other and because the
sample is electrically grounded to the spectrometer there is no development of positive charge on
the surface of sample.170
When the sample is insulating, alignment of the fermi levels of the
sample and the spectrometer is not possible. Further, insulating samples cannot be electrically
grounded and positive charges accumulate on the surface of the sample during the course of
electron emission.170
This kind of surface charging constantly shifts the binding energy scale
during electron emission. Surface charging effects can be overcome using charge neutralizer
which delivers low-energy electrons to the surface of the sample.170
In a typical XPS experiment,
a survey spectrum is collected from the sample over a wide energy range with a moderate step
size to determine the elements present on the surface of the sample.170
This is followed by
collecting high energy resolution XPS spectra from the element of interest.170
Representative
examples of a survey scan XPS spectrum and a high-resolution P 2p XPS spectrum from LaPO4
are shown in Figure 1.10.
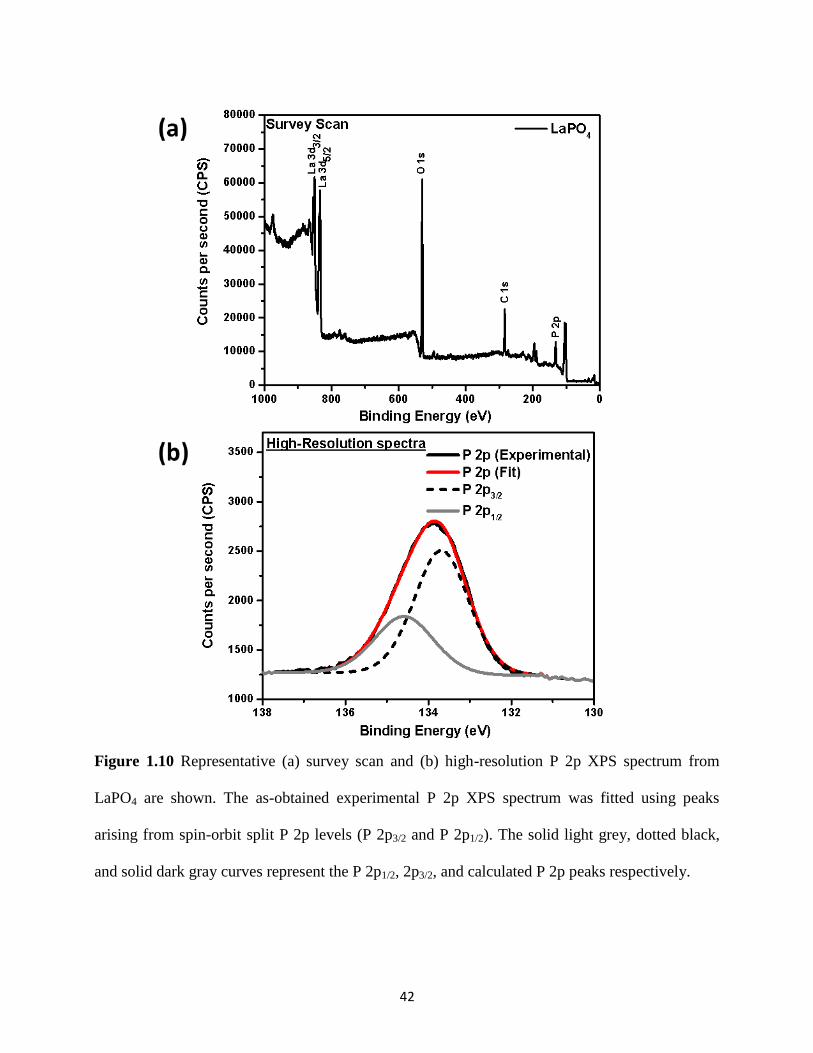
42
Figure 1.10 Representative (a) survey scan and (b) high-resolution P 2p XPS spectrum from
LaPO4 are shown. The as-obtained experimental P 2p XPS spectrum was fitted using peaks
arising from spin-orbit split P 2p levels (P 2p3/2 and P 2p1/2). The solid light grey, dotted black,
and solid dark gray curves represent the P 2p1/2, 2p3/2, and calculated P 2p peaks respectively.
43
1.7 Thesis Objectives
The first step towards the design of durable crystalline wasteforms is to gain a better
understanding of the structures of proposed candidate materials at different length scales and this
thesis aims to do so by providing a comprehensive structural description of monazite-, xenotime,
and rhabdophane-type materials. The work presented in thesis deals with the fundamental
structural investigations of these materials as well as investigating the structural response of these
materials to conditions (e.g., radiation and leaching conditions) representing those experienced by
a nuclear wasteform. Structural insights into these materials were obtained through the use of X-
ray based diffraction and spectroscopic techniques.
The first objective of this thesis was to carry out a structural investigation of rare-earth
phosphates adopting the monazite-, xenotime-, and rhabdophane-type structures and this work is
presented in Chapters 2 and 3. The primary objective of the study presented in Chapter 2 was to
determine how the electronic structure of materials adopting monazite- and xenotime-type
structures varies as a function of composition and crystal structure. In order to meet this
objective, the RE1-xRExPO4 (RE = La, Sm; RE’ = Yb, Y, Ho) materials were synthesized in the
entire compositional range via conventional solid-state methods and the electronic structure of
these materials was studied using X-ray spectroscopic techniques (XANES and XPS) and partial
density of states (DOS) calculations. The influence of crystal structure and composition on the
XANES and XPS spectra was investigated in this study through the collection and analysis of
XANES (P K-, P L2,3-, RE L1, and RE M4,5- edges) and XPS (P 2p, La 3d, and O 1s) spectra.
Following this study, a thorough investigation of the long-range and local structures of hydrous
rare-earth phosphate materials adopting the rhabdophane- and xenotime-type structures was
carried out and the results obtained from this study are presented in Chapter 3. One of the
44
objectives of this study was to determine the crystal structure of rhabdophane-type materials and
this objective was met by performing a Rietveld refinement of the powder XRD data of one of
the materials adopting the rhabdophane-type structure. Another objective of this study was to
determine the effect of annealing temperature on the long-range and local structure of hydrous
rare-earth phosphate materials. To meet this objective, the as-synthesized hydrous rare-earth
phosphate materials were annealed at various temperatures and the structural characterization of
these materials were performed using powder XRD and XANES.
Following the structural investigation of hydrous and anhydrous rare-earth phosphate
materials, the next objective of this thesis was to understand how these materials respond to
radiation and leaching effects experienced by actinide containing wasteforms and nuclear
wasteforms stored in geological repositories, respectively. In Chapter 4, the effect of radiation on
the structure of monazite- and xenotime-type rare-earth phosphates was studied. The major
objective of this study included the simulation of radiation damage and characterization of the
surface of the materials using glancing angle XANES. The radiation studies were carried out
using an external irradiation method in which the high energy α-recoil atom resulting from the
decay of radioactive elements was simulated via high energy Au- ion implantation of crystalline
solids. In this study, the sintered pellets of monazite- and xenotime-type materials were
bombarded with high energy Au- ions and the resulting ion-implanted materials were
characterized using glancing angle XANES and micro-XRD. This is the first study to utilize
glancing angle XANES to study the structure of ion-implanted monazite- and xenotime-type rare-
earth phosphates. The final objective of this thesis was to determine the chemical durability of
hydrous and anhydrous rare-earth phosphate materials and this work is presented in Chapter 5.
The major objective of this study was to compare the short-term dissolution behaviour of these
45
materials in deionized water. This objective was achieved by conducting leaching tests on
powdered samples of materials adopting monazite-, xenotime-, and rhabdophane-type structures.
The leaching tests were carried out in high density polyethylene (HDPE) containers filled with
varying volumes of deionized water. Aliquots of water were withdrawn from the containers at
regular intervals of time and were analyzed for rare-earth and P ions using Inductively Coupled
Plasma – Mass Spectrometry (ICP-MS). Another objective of this study was to determine the
structural response of these materials to leaching and this objective was met by determining the
structure of these materials before and after exposure to water using powder XRD and XANES.
46
Chapter 2
AN X-RAY SPECTROSCOPIC STUDY OF THE
ELECTRONIC STRUCTURE OF MONAZITE- AND
XENOTIME-TYPE RARE-EARTH PHOSPHATES1
2.1 Introduction
Rare-earth phosphates adopting the monazite- (REPO4; RE = La to Gd) and xenotime- (RE’PO4;
RE’ = Tb to Lu & Y) type structures have been proposed as potential candidates for the
sequestration of radioactive high level waste (HLW) arising from the reprocessing of spent
nuclear fuel (SNF) and dismantlement of nuclear weapons.88,121,125
Both, monazite and xenotime
are naturally occurring rare-earth phosphate minerals which, depending on temperature and
pressure, can coexist together in various igneous and metamorphic rocks.174,175
The crystal
structures of CePO4 (monazite-type; Space group: P21/n) and YPO4 (xenotime-type; Space
group: I41/amd) are shown in Figure 1.3 and the description of these structures was provided in
Section 1.5.1.135,136,138
The cerium ion in CePO4 (monazite) is coordinated to nine oxygen atoms
1 Reproduced in part with permission from M. R. Rafiuddin, E. Mueller, A. P. Grosvenor, Journal of Physical
Chemistry C (2014) 118 18000 – 18009. Copyright 2014 American Chemical Society

47
and the resulting CeO9 polyhedra are connected to each other via an intervening PO4 tetrahedron
thereby leading to the formation of infinite chains of edge sharing CeO9 and PO4 polyhedra along
the c-axis (Figure 1.3a).135,140
In YPO4 (xenotime), the yttrium ions are bonded to eight oxygen
atoms and similar to the monazite structure, edge-sharing chains of YO8 and PO4 polyhedra are
also present in the xenotime structure (Figure 1.3b).135,138
Studying synthesized solid solutions of monazite and xenotime can help develop a better
understanding of the coexistence of these minerals in natural samples.174,176,177
The variation in
the crystal structure of these compounds places a limit on the solubility of monazite in xenotime,
and vice versa, which results in a structural boundary between the two phases.174,176,177
Studies of
solid solutions of NdxY1-xPO4, LaxY1-xPO4, SmxY1-xPO4 and NdxYb1-xPO4 have revealed the
compositional and temperature dependence of the structural boundary existing between the
monazite and xenotime phases.176
It is known that monazite compounds exhibit a resistance to
radiation induced structural damage; however, the effect of substitution of the rare-earth element
on the radiation resistance of xenotime has not been investigated. Further, the electronic structure
of both monazite and xenotime materials remains unexplored.
In this study, solid solutions of monazite- and xenotime- type compounds (La1-xYbxPO4,
La1-xYxPO4, and Sm1-xHoxPO4) have been synthesized and characterized by powder X-ray
diffraction (XRD), X-ray absorption near-edge spectroscopy (XANES), and X-ray photoelectron
spectroscopy (XPS). A phase analysis of the synthesized materials was performed by
examination of powder XRD patterns. XANES was used to examine the electronic structure of
the solid solutions, as this technique is sensitive to changes in the local coordination environment,
the oxidation state, and the bonding environment of the absorbing atom.152,154,158
P K-, P L2,3-,
Sm M5-, Ho M5-, Sm L3-, and Ho L3- edge XANES spectra have been collected from these solid
48
solutions and are reported here. Density of states calculations (DOS) were performed for LaPO4
and YPO4 to aid in the interpretation of P K- and P L2,3- edge XANES spectra. XPS was also
used to investigate these systems by collection of RE 3d, P 2p, and O 1s spectra. The focus of this
study has been to establish XANES and XPS as tools for distinguishing compounds that adopt
the monazite or xenotime structure in natural and synthesized samples.
2.2 Experimental
2.2.1 Synthesis and powder XRD
Solid solutions of La1-xYbxPO4, La1-xYxPO4, and Sm1-xHoxPO4 (0 ≤ x ≤ 1) were synthesized by
conventional solid state methods.25
Stoichiometric amounts of La2O3 (Alfa Aesar; 99.99%),
Yb2O3 (Alfa Aesar; 99.9%), Y2O3 (Alfa Aesar; 99.99%), Sm2O3 (Alfa Aesar; 99.9%), Ho2O3
(Alfa Aesar; 99.9%), and NH4H2PO4 (Alfa Aesar; 99.995%) were mixed together and placed in
an alumina crucible. The crucibles were first heated in air at 1100-1200ºC for 2 days to facilitate
the decomposition of NH4H2PO4 before being quench cooled in air. The resulting mixtures were
ground, pressed into pellets at 6 MPa, and heated again in air at 1100-1200ºC for a period of 6-12
days before being quench cooled in air. All materials were reground and repelleted at 2-3 day
intervals. The annealing temperature used depended on the composition of the materials. The
phase purity and composition of the synthesized materials was determined by powder X-ray
diffraction using a PANalytical Empyrean system and either Co Kα1,2 or Cu Kα1,2 X-ray sources.
Powder XRD patterns were collected at room temperature in the 2θ range of 10-80° and the
lattice parameters and composition were determined using the HighScore Plus software
package.178
The composition of the solid solutions was determined by a simple refinement of the
powder XRD patterns using the rare-earth phosphate end members as model compounds. During
49
this refinement, the atomic positions were held constant but the scale factors, zero shift, lattice
parameters, lineshape parameters, and percent contribution of each phase were allowed to vary.
The refinement procedure was performed using the HighScore Plus software package.178
2.2.2 XANES
2.2.2.1 P K-, Sm L3-, and Ho L3-edge XANES
The P K-edge XANES spectra from La1-xYbxPO4, La1-xYxPO4, and Sm1-xHoxPO4 were collected
using the Soft X-ray Microcharacterization Beamline (SXRMB; 06B1-1) located at the Canadian
Light Source (CLS).179
Sm L3- and Ho L3- edge XANES spectra were also collected from the
Sm1-xHoxPO4 series. Finely ground samples were mounted on carbon tape and the spectra were
measured in vacuum. P K-edge spectra were collected in partial fluorescent yield (PFY) mode
with a step size of 0.15 eV through the absorption edge. A Si (111) double crystal
monochromator was used and the spectral resolution was 0.2 eV at 2145.5 eV (P K-edge). The
Sm L3- and Ho L3- edge spectra were collected using total electron yield (TEY) mode with a step
size of 0.15 eV through the absorption edge, as Sm and Ho spectra collected in PFY mode were
influenced by absorption effects. The P K-edge XANES spectra were calibrated by collecting the
spectrum from red P (Alfa Aesar ; 99%) with the maximum in the first derivative of the P K-edge
set to 2145.5 eV.180
Sm L3- and Ho L3- edge XANES spectra were calibrated against the
spectrum from Fe metal by setting the maximum in the first derivative of the Fe K-edge to 7112
eV.180
A linear combination fitting (LCF) of the P K-edge spectra was carried out to determine
the relative percent of the monazite and xenotime structures that was found in each member of
the solid solutions examined. All XANES spectra discussed here were analyzed using the Athena
software program.181

50
2.2.2.2 P L2,3-edge XANES
The P L2,3-edge XANES spectra from La1-xYbxPO4, Sm1-xHoxPO4, and La1-xYxPO4 were
collected using the Variable Line Spacing-Plane Grating Monochromator (VLS-PGM; 11ID-2)
beamline located at the CLS.182
A high energy grating monochromator was used to collect the P
L2,3-edge spectra and the spectral resolution was 0.01 eV at 130 eV (P L3-edge). The samples
were ground to a fine powder and mounted on carbon tape before being placed in the vacuum
chamber. The spectra were collected in total fluorescence yield (TFY) mode using a step size of
0.05 eV through the absorption edge. The P L2,3-edge spectra were calibrated using red P, with
the P L2,3-edge absorption energy set to 130 eV.
2.2.2.3 Sm M5- and Ho M5-edge XANES
The Sm M5- and Ho M5- edge XANES spectra were collected at the CLS using the Spherical
Grating Monochromator (SGM; 11ID-1) beamline.183
Finely ground samples were mounted on
carbon tape and inserted into the vacuum chamber. Both the Sm M5- and Ho M5-edge XANES
spectra were collected in TEY mode with a step size of 0.1 eV through the absorption edge. The
Sm M5- edge XANES spectra were calibrated using a zinc metal standard with the L3- edge
energy set to 1021.8 eV, and the Ho M5- edge spectra were calibrated using a Cu metal standard
with the L3-edge set to 932.7 eV.180
2.2.3 XPS
XPS spectra were collected using a Kratos AXIS Ultra spectrometer and a monochromatic Al Kα
X-ray source. The instrumental resolution is 0.4 eV and a X-ray spot size of 700 x 400 µm2 was
used to collect the spectra. The samples were finely ground, pressed into In foil, and then
mounted on an electrically grounded sample holder. A charge neutralizer was used during the

51
collection of XPS spectra to overcome charging effects. High resolution P 2p, O 1s, and La 3d
XPS spectra from La1-xYbxPO4 and YPO4 were collected using a step size of 0.05 eV/step, a pass
energy of 20 eV, and a collection time of 180 s per sweep. The collected XPS spectra were
calibrated by setting the C 1s core-line spectrum arising from adventitious carbon to 284.8 eV. A
Shirley-type function was used to remove the spectral background and the spectra were fitted
using component peaks with a Gaussian (70%) and Lorentzian (30%) line profile.184
The XPS
spectra were analysed using the CasaXPS software program.185
2.2.4 Electronic Structure Calculations
Electronic structure calculations for the ternary monazite (LaPO4) and xenotime (YPO4)
compounds were performed using a self-consistent tight-binding linear muffin tin orbital model
with the atomic spheres approximation (TB-LMTO-ASA) to assist in the interpretation of P K-
and P L2,3- edge XANES spectra.186
Overlapping Wigner-Seitz (WS) spheres are centered at each
atom and the potential around these spheres is spherically symmetric in the TB-LMTO-ASA
calculation. The partial Density of States (DOS) calculations were performed using the
previously reported crystal structures for these materials and the lattice constants determined in
this present study (see Section 2.3.1). The Brillouin zone integration was performed over a total
of 512 k-points using a tetrahedron method.187
The partial DOS for the P 3s, P 3p, P 3d, O 1s, O
2p, La 6s, La 6p, La 5d, La 4f, Y 5s, Y 5p, and Y 4d orbitals in these materials were calculated.
The partial DOS from materials containing a partially filled 4f orbital could not be calculated
adequately using the TB-LMTO-ASA package.
It should be noted that the TB-LMTO-ASA code provides only a ground state solution for
these materials, as it does not account for final state relaxation effects. Nevertheless, direct
comparison between the calculated partial DOS and experimental XANES spectra is still possible

52
for these and other compounds when the spectra are (primarily) affected by ground-state
effects.188
TB-LMTO-ASA calculations are relatively quick and straight-forward to perform
unlike other packages (e.g., Feff) that consider both ground-state and final-state relaxation effects
and require more computational rigour.189
However, Feff calculations are necessary to simulate
XANES spectra that are strongly affected by final-state relaxation effects.189
2.3 Results and Discussion
2.3.1 Structure
Compounds adopting the monazite- type structure crystallize in a monoclinic unit cell (P21/n)
which is of a lower symmetry when compared to the tetragonal unit cell of the xenotime- type
structure (I41/amd).135,190
As a result, the powder XRD patterns from monazite-type compounds
contain a larger number of diffraction peaks than the powder XRD patterns from xenotime-type
compounds (Figure 2.1). All of the synthesized ternary monazite compounds (LaPO4 and
SmPO4) were deemed to be phase pure. Small amounts of rare-earth oxides and some unknown
phases were identified in the powder XRD patterns of ternary xenotime compounds (HoPO4,
YPO4, and YbPO4); however, these impurity phases do not alter the interpretation of the
phosphorus XANES and XPS spectra. The lattice constants of the synthesized ternary monazite
and xenotime compounds are presented in Table 2-1.
Solid solutions of La1-xYbxPO4, La1-xYxPO4, and Sm1-xHoxPO4 were synthesized to study
the structural boundary (miscibility gap) that exists between the monazite and xenotime
phases.176
Depending on the value of ‘x’, the compounds can be synthesized either as a single
phase or as a mixture of both phases. The solubility limit of rare-earth elements in the monazite
or xenotime structure for each of the synthesized solid solutions was determined here by analysis
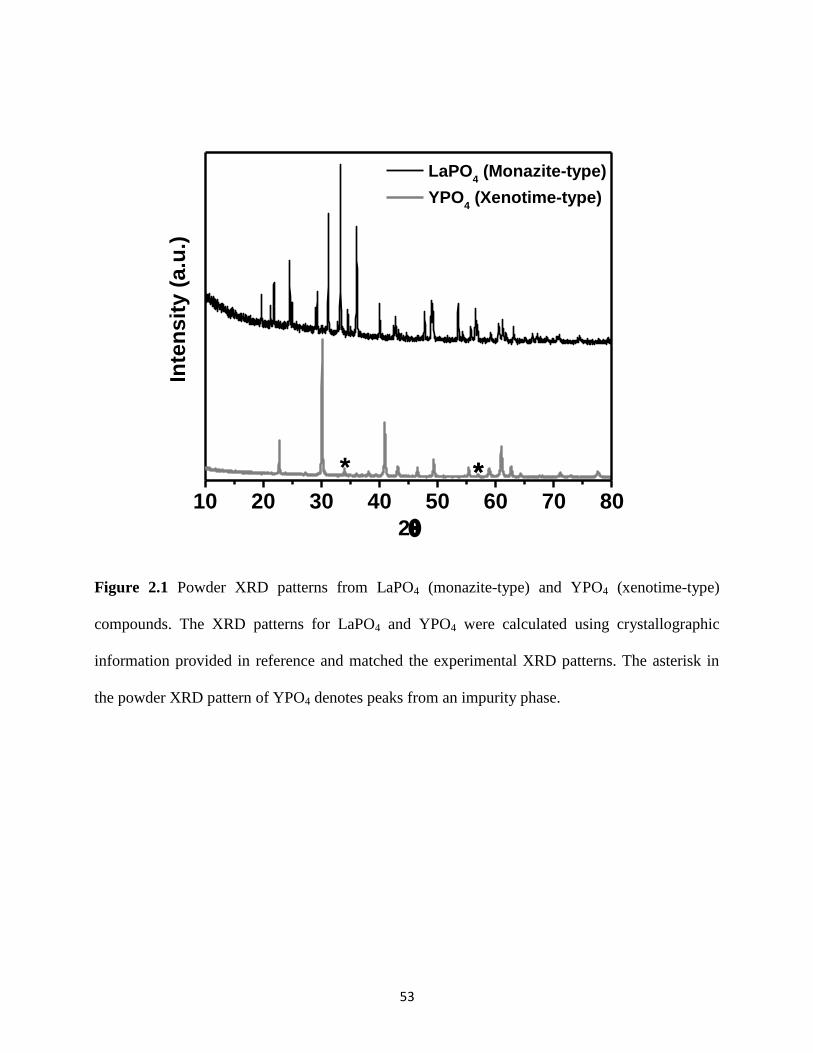
53
Figure 2.1 Powder XRD patterns from LaPO4 (monazite-type) and YPO4 (xenotime-type)
compounds. The XRD patterns for LaPO4 and YPO4 were calculated using crystallographic
information provided in reference and matched the experimental XRD patterns. The asterisk in
the powder XRD pattern of YPO4 denotes peaks from an impurity phase.
10 20 30 40 50 60 70 80
**
Inte
ns
ity
(a
.u.)
2
LaPO4 (Monazite-type)
YPO4 (Xenotime-type)
*
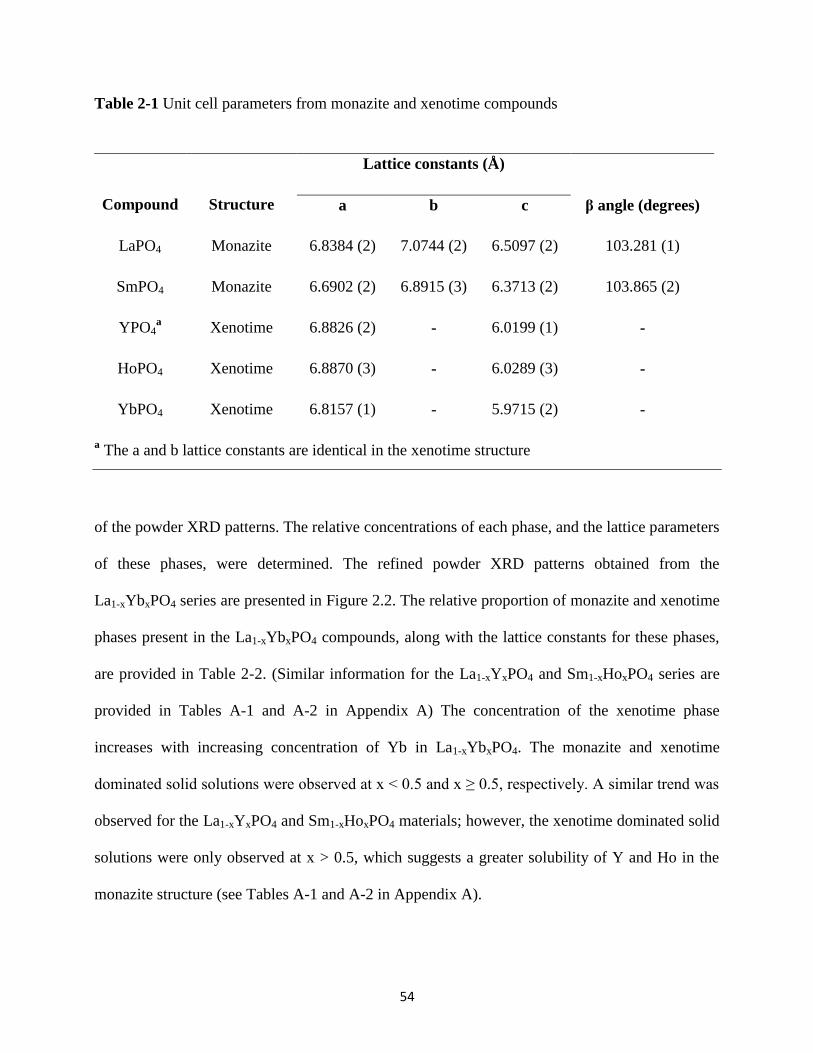
54
Table 2-1 Unit cell parameters from monazite and xenotime compounds
a The a and b lattice constants are identical in the xenotime structure
of the powder XRD patterns. The relative concentrations of each phase, and the lattice parameters
of these phases, were determined. The refined powder XRD patterns obtained from the
La1-xYbxPO4 series are presented in Figure 2.2. The relative proportion of monazite and xenotime
phases present in the La1-xYbxPO4 compounds, along with the lattice constants for these phases,
are provided in Table 2-2. (Similar information for the La1-xYxPO4 and Sm1-xHoxPO4 series are
provided in Tables A-1 and A-2 in Appendix A) The concentration of the xenotime phase
increases with increasing concentration of Yb in La1-xYbxPO4. The monazite and xenotime
dominated solid solutions were observed at x < 0.5 and x ≥ 0.5, respectively. A similar trend was
observed for the La1-xYxPO4 and Sm1-xHoxPO4 materials; however, the xenotime dominated solid
solutions were only observed at x > 0.5, which suggests a greater solubility of Y and Ho in the
monazite structure (see Tables A-1 and A-2 in Appendix A).
Compound
Structure
Lattice constants (Å)
a b c β angle (degrees)
LaPO4 Monazite 6.8384 (2) 7.0744 (2) 6.5097 (2) 103.281 (1)
SmPO4 Monazite 6.6902 (2) 6.8915 (3) 6.3713 (2) 103.865 (2)
YPO4a
Xenotime 6.8826 (2) - 6.0199 (1) -
HoPO4 Xenotime 6.8870 (3) - 6.0289 (3) -
YbPO4 Xenotime 6.8157 (1) - 5.9715 (2) -
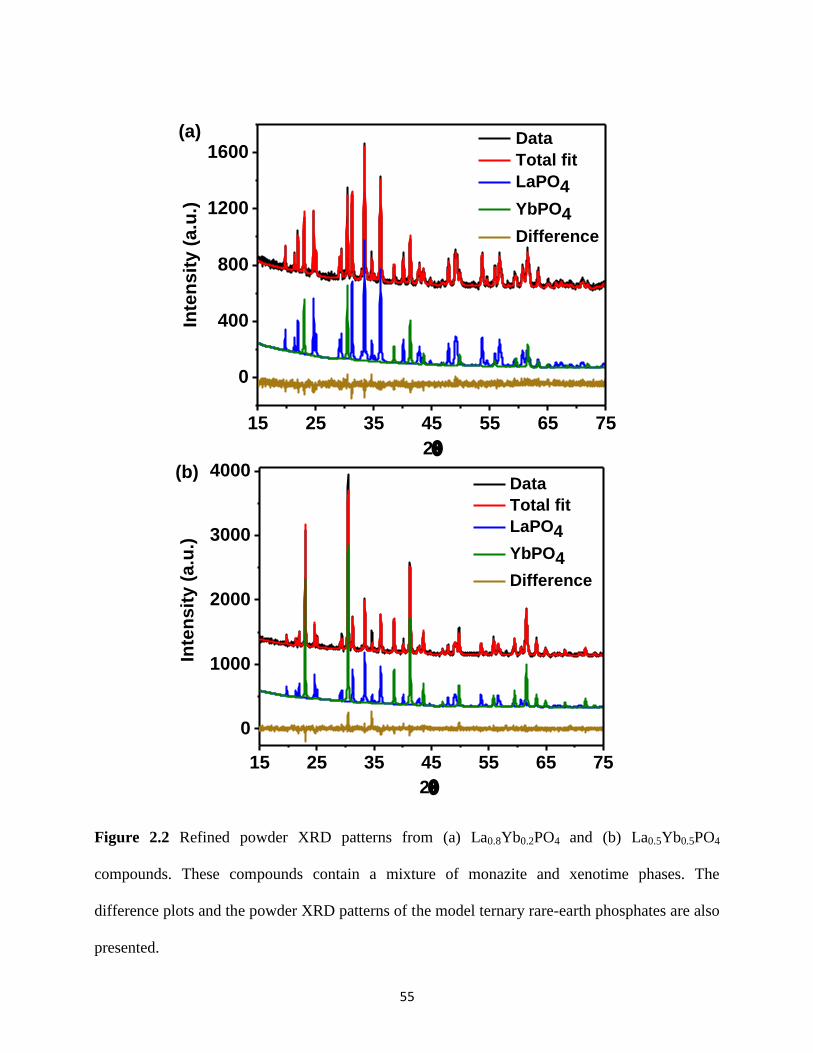
55
15 25 35 45 55 65 75
0
1000
2000
3000
4000(b) Data
Total fit
LaPO4
YbPO4
Difference
Inte
ns
ity
(a
.u.)
2
15 25 35 45 55 65 75
0
400
800
1200
1600 Data
Total fit
LaPO4
YbPO4
Difference
Inte
ns
ity
(a
.u.)
2
(a)
Figure 2.2 Refined powder XRD patterns from (a) La0.8Yb0.2PO4 and (b) La0.5Yb0.5PO4
compounds. These compounds contain a mixture of monazite and xenotime phases. The
difference plots and the powder XRD patterns of the model ternary rare-earth phosphates are also
presented.
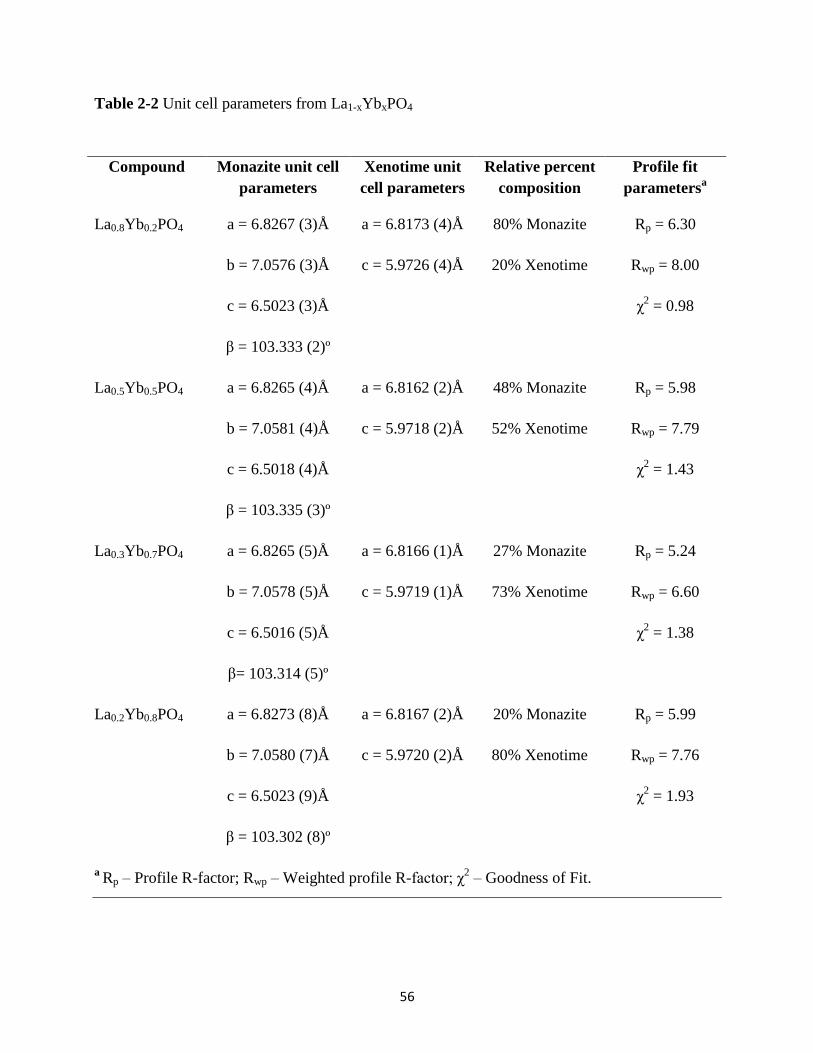
56
Table 2-2 Unit cell parameters from La1-xYbxPO4
a Rp – Profile R-factor; Rwp – Weighted profile R-factor; χ
2 – Goodness of Fit.
Compound Monazite unit cell
parameters
Xenotime unit
cell parameters
Relative percent
composition
Profile fit
parametersa
La0.8Yb0.2PO4 a = 6.8267 (3)Å
b = 7.0576 (3)Å
c = 6.5023 (3)Å
β = 103.333 (2)º
a = 6.8173 (4)Å
c = 5.9726 (4)Å
80% Monazite
20% Xenotime
Rp = 6.30
Rwp = 8.00
χ2 = 0.98
La0.5Yb0.5PO4 a = 6.8265 (4)Å
b = 7.0581 (4)Å
c = 6.5018 (4)Å
β = 103.335 (3)º
a = 6.8162 (2)Å
c = 5.9718 (2)Å
48% Monazite
52% Xenotime
Rp = 5.98
Rwp = 7.79
χ2 = 1.43
La0.3Yb0.7PO4 a = 6.8265 (5)Å
b = 7.0578 (5)Å
c = 6.5016 (5)Å
β= 103.314 (5)º
a = 6.8166 (1)Å
c = 5.9719 (1)Å
27% Monazite
73% Xenotime
Rp = 5.24
Rwp = 6.60
χ2 = 1.38
La0.2Yb0.8PO4 a = 6.8273 (8)Å
b = 7.0580 (7)Å
c = 6.5023 (9)Å
β = 103.302 (8)º
a = 6.8167 (2)Å
c = 5.9720 (2)Å
20% Monazite
80% Xenotime
Rp = 5.99
Rwp = 7.76
χ2 = 1.93
57
2.3.2 P K-edge XANES
The normalized P K-edge XANES spectra from ternary monazite (LaPO4) and xenotime (YbPO4
and YPO4) compounds are shown in Figure 2.3a. These spectra result from the dipolar excitation
of P 1s electrons into vacant P 3p orbitals. A significant difference in line-shape is observed
between the monazite (LaPO4) and xenotime (YbPO4 and YPO4) materials (i.e., examination of
these spectra can be used to distinguish between the two crystal structures).191
The absorption
energy of YbPO4 (or YPO4) increases by ~0.5 eV (~0.3 eV) with respect to LaPO4, and the
spectral line-shape is significantly different when comparing materials that adopt either the
monazite or xenotime structure (Figure 2.3a). A shift in absorption energy can occur due to
ground-state or final-state effects, or a combination of both. Prior to the absorption of a photon,
the energy of P 3p conduction states in YbPO4 or LaPO4 may vary as a result of ground-state
effects due to differences in the screening of the P nuclear charge because of both near and next
nearest neighbor effects, and/or because of a change in the distribution of the conduction states
that the P 1s electrons could be excited to.192
After the absorption of a photon, the 1s electron is
excited into the P 3p state and the resulting core-hole is screened either from the relaxation of
electrons present above the P 1s orbital (intra-atomic effects) or from the oxygen atoms
surrounding the P atom (extra-atomic effects). The contribution of intra-atomic effects to the
screening of a core hole is negligible in comparison to extra-atomic effects.192
Although the
symmetry of the PO4 tetrahedra is different in LaPO4 and YbPO4, the average P-O bond length is
found to be similar in these compounds (LaPO4 – 1.538Å; YbPO4 – 1.532Å).135
As a result,
extra-atomic relaxation effects would likely be similar in these compounds. Therefore, it is not
believed that the observed shift in the P K-edge absorption energy on going from LaPO4 to
YbPO4 is a result of final-state effects. Instead, the change in the distribution of the P 3p
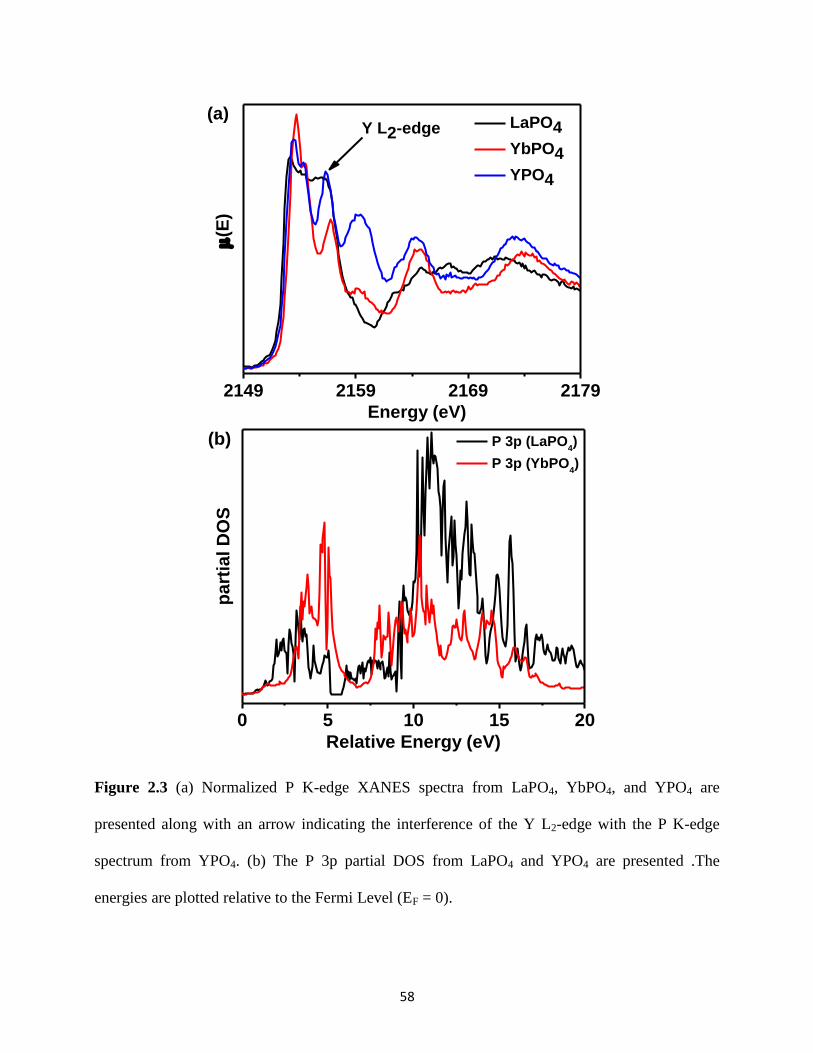
58
2149 2159 2169 2179
(E
)
Energy (eV)
LaPO4
YbPO4
YPO4
(a)Y L2-edge
0 5 10 15 20
pa
rtia
l D
OS
Relative Energy (eV)
P 3p (LaPO4)
P 3p (YbPO4)
(b)
Figure 2.3 (a) Normalized P K-edge XANES spectra from LaPO4, YbPO4, and YPO4 are
presented along with an arrow indicating the interference of the Y L2-edge with the P K-edge
spectrum from YPO4. (b) The P 3p partial DOS from LaPO4 and YPO4 are presented .The
energies are plotted relative to the Fermi Level (EF = 0).
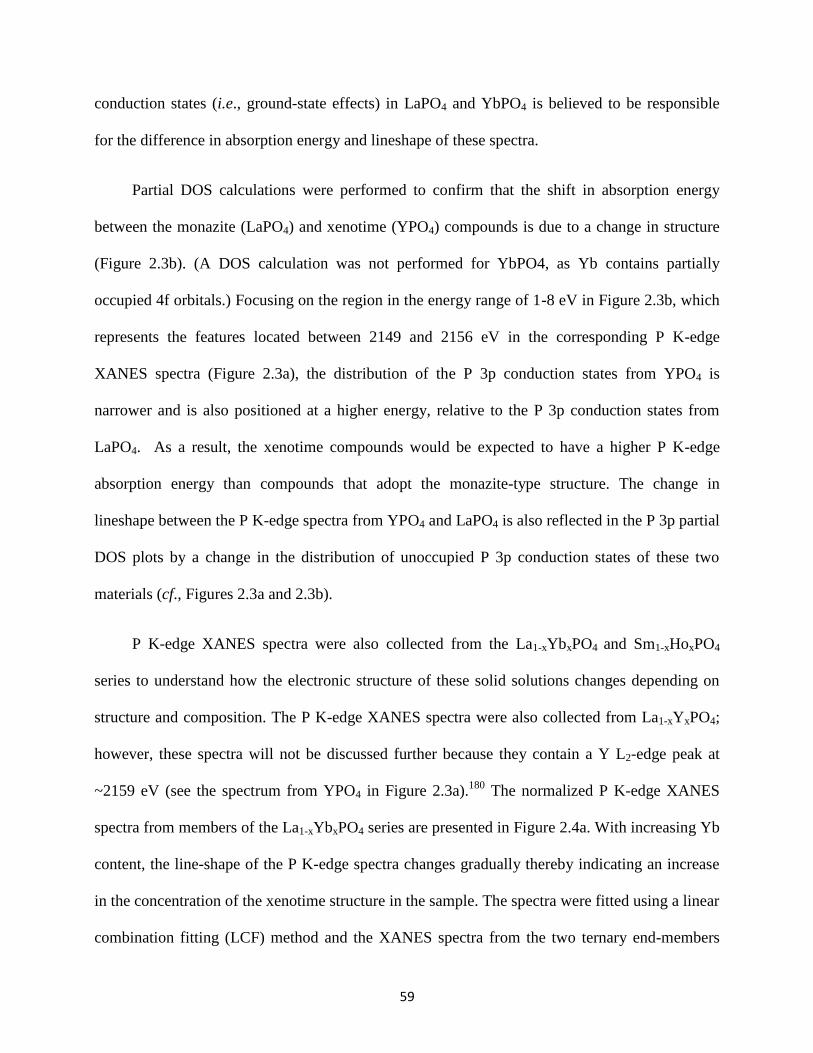
59
conduction states (i.e., ground-state effects) in LaPO4 and YbPO4 is believed to be responsible
for the difference in absorption energy and lineshape of these spectra.
Partial DOS calculations were performed to confirm that the shift in absorption energy
between the monazite (LaPO4) and xenotime (YPO4) compounds is due to a change in structure
(Figure 2.3b). (A DOS calculation was not performed for YbPO4, as Yb contains partially
occupied 4f orbitals.) Focusing on the region in the energy range of 1-8 eV in Figure 2.3b, which
represents the features located between 2149 and 2156 eV in the corresponding P K-edge
XANES spectra (Figure 2.3a), the distribution of the P 3p conduction states from YPO4 is
narrower and is also positioned at a higher energy, relative to the P 3p conduction states from
LaPO4. As a result, the xenotime compounds would be expected to have a higher P K-edge
absorption energy than compounds that adopt the monazite-type structure. The change in
lineshape between the P K-edge spectra from YPO4 and LaPO4 is also reflected in the P 3p partial
DOS plots by a change in the distribution of unoccupied P 3p conduction states of these two
materials (cf., Figures 2.3a and 2.3b).
P K-edge XANES spectra were also collected from the La1-xYbxPO4 and Sm1-xHoxPO4
series to understand how the electronic structure of these solid solutions changes depending on
structure and composition. The P K-edge XANES spectra were also collected from La1-xYxPO4;
however, these spectra will not be discussed further because they contain a Y L2-edge peak at
~2159 eV (see the spectrum from YPO4 in Figure 2.3a).180
The normalized P K-edge XANES
spectra from members of the La1-xYbxPO4 series are presented in Figure 2.4a. With increasing Yb
content, the line-shape of the P K-edge spectra changes gradually thereby indicating an increase
in the concentration of the xenotime structure in the sample. The spectra were fitted using a linear
combination fitting (LCF) method and the XANES spectra from the two ternary end-members
60
(i.e., LaPO4, and YbPO4) as standards (Figure 2.5). The fitted spectra matched well with the
experimentally observed P K-edge XANES spectra from the La1-xYbxPO4 series. The
concentration of LaPO4 and YbPO4 that contributed to the linearly combined XANES spectra
from the La1-xYbxPO4 series are listed in Table 2-3. The concentration of monazite and xenotime
phases determined by analysis of the P K-edge XANES spectra is in close agreement to the
results determined by analysis of the powder XRD patterns (c.f., Table 2-2 and Table 2-3).
The normalized P K-edge XANES spectra collected from the Sm1-xHoxPO4 series are
shown in Figure 2.4b. The Sm end-member of this series (i.e., x = 0) adopts the monazite
structure whereas the Ho end-member (i.e., x =1) adopts the xenotime structure.135
Similar to
YbPO4, a difference in line-shape is observed for these compounds and the absorption energy of
HoPO4 is ~0.2 eV above that of SmPO4. A pronounced variation in the line-shape of the P K-
edge spectra occurs with increasing substitution of Ho in the Sm1-xHoxPO4 series (Figure 2.4b). A
linear combination fitting was also performed for the Sm1-xHoxPO4 series using the XANES
spectra from SmPO4 and HoPO4 as standards and a good match was observed between the fitted
and experimentally observed XANES spectra (Figure A.1 in Appendix A). The concentrations of
the ternary phosphates (i.e., SmPO4 (monazite) and HoPO4 (xenotime)) that contributed to these
linearly combined spectra are in good agreement with the results obtained by analysis of powder
XRD patterns (c.f., Table A-1 and A-3 in Appendix A).
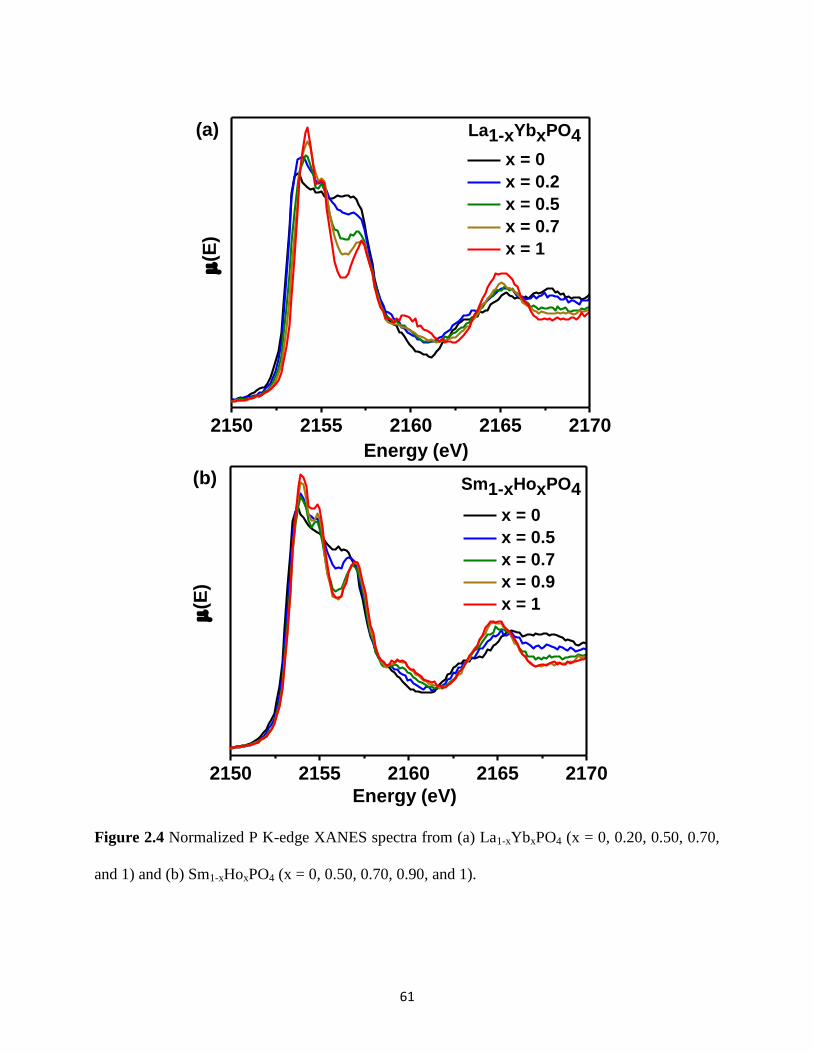
61
2150 2155 2160 2165 2170
(b)
(E
)
Energy (eV)
x = 0
x = 0.5
x = 0.7
x = 0.9
x = 1
Sm1-xHoxPO4
2150 2155 2160 2165 2170
(E
)
Energy (eV)
x = 0
x = 0.2
x = 0.5
x = 0.7
x = 1
La1-xYbxPO4(a)
Figure 2.4 Normalized P K-edge XANES spectra from (a) La1-xYbxPO4 (x = 0, 0.20, 0.50, 0.70,
and 1) and (b) Sm1-xHoxPO4 (x = 0, 0.50, 0.70, 0.90, and 1).
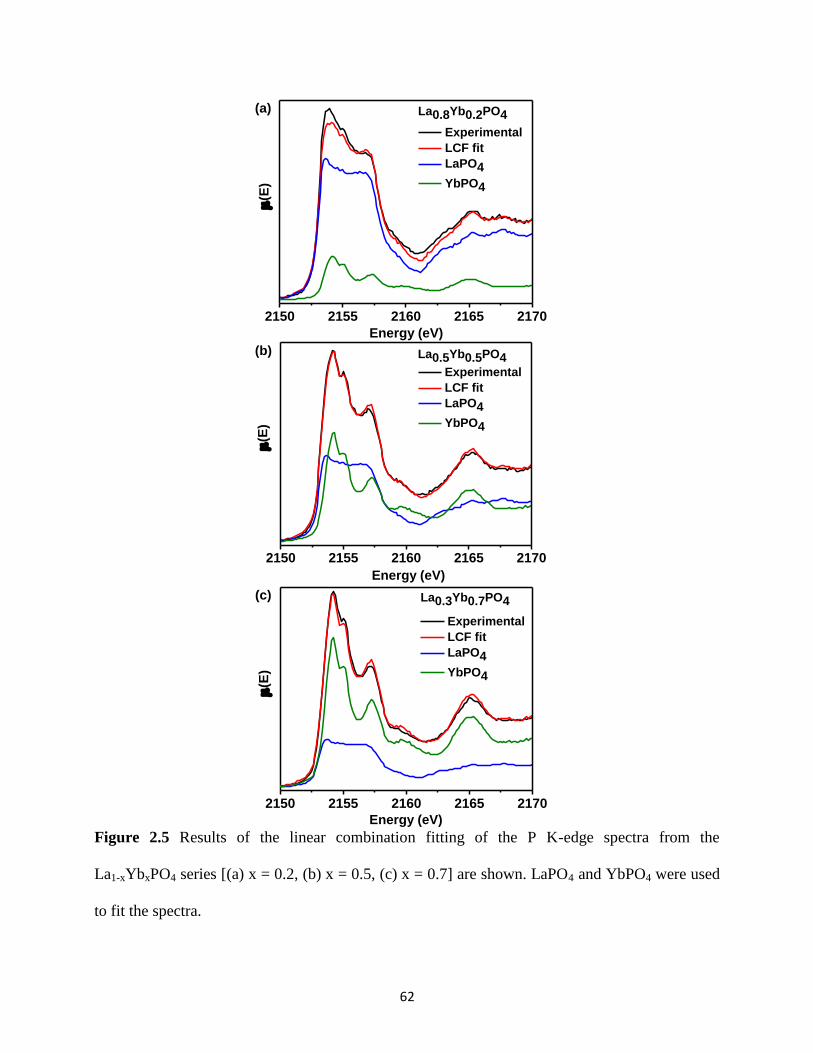
62
2150 2155 2160 2165 2170
(c)
Experimental
LCF fit
LaPO4
YbPO4
(E
)
Energy (eV)
La0.3Yb0.7PO4
2150 2155 2160 2165 2170
(b)
Experimental
LCF fit
LaPO4
YbPO4
(E
)
Energy (eV)
La0.5Yb0.5PO4
2150 2155 2160 2165 2170
(E
)
Energy (eV)
Experimental
LCF fit
LaPO4
YbPO4
(a) La0.8Yb0.2PO4
Figure 2.5 Results of the linear combination fitting of the P K-edge spectra from the
La1-xYbxPO4 series [(a) x = 0.2, (b) x = 0.5, (c) x = 0.7] are shown. LaPO4 and YbPO4 were used
to fit the spectra.
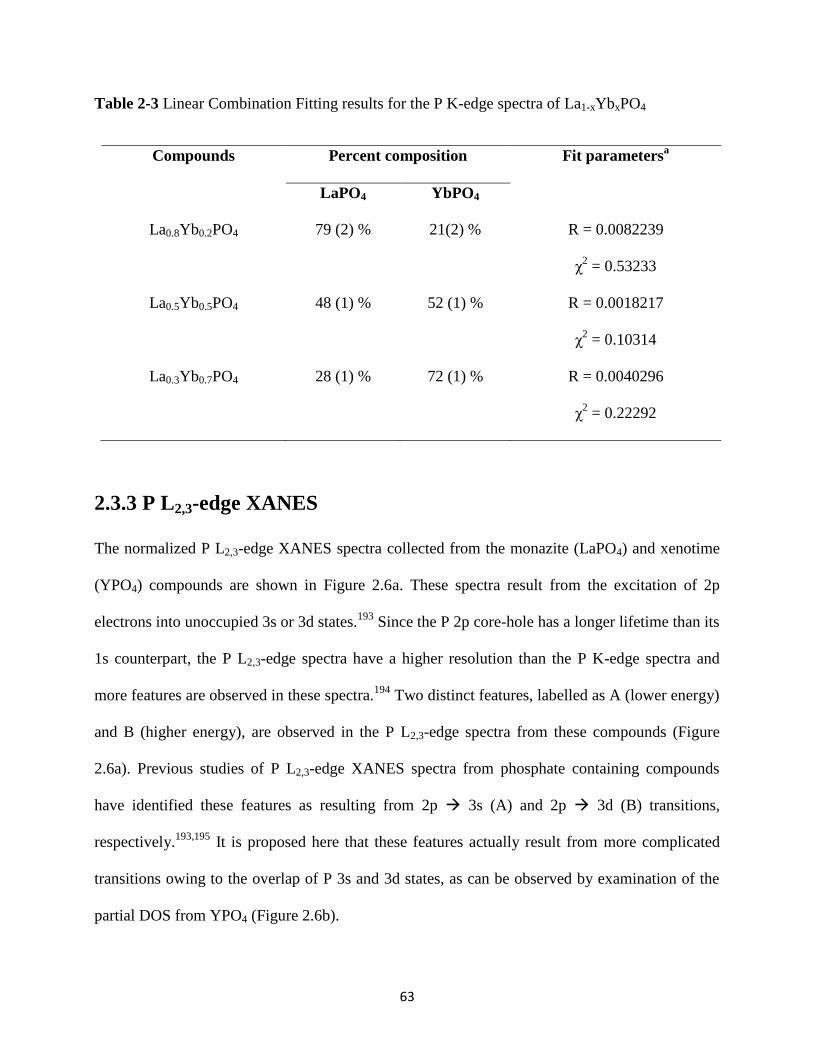
63
Table 2-3 Linear Combination Fitting results for the P K-edge spectra of La1-xYbxPO4
2.3.3 P L2,3-edge XANES
The normalized P L2,3-edge XANES spectra collected from the monazite (LaPO4) and xenotime
(YPO4) compounds are shown in Figure 2.6a. These spectra result from the excitation of 2p
electrons into unoccupied 3s or 3d states.193
Since the P 2p core-hole has a longer lifetime than its
1s counterpart, the P L2,3-edge spectra have a higher resolution than the P K-edge spectra and
more features are observed in these spectra.194
Two distinct features, labelled as A (lower energy)
and B (higher energy), are observed in the P L2,3-edge spectra from these compounds (Figure
2.6a). Previous studies of P L2,3-edge XANES spectra from phosphate containing compounds
have identified these features as resulting from 2p 3s (A) and 2p 3d (B) transitions,
respectively.193,195
It is proposed here that these features actually result from more complicated
transitions owing to the overlap of P 3s and 3d states, as can be observed by examination of the
partial DOS from YPO4 (Figure 2.6b).
Compounds Percent composition Fit parametersa
LaPO4 YbPO4
La0.8Yb0.2PO4 79 (2) % 21(2) % R = 0.0082239
χ2 = 0.53233
La0.5Yb0.5PO4 48 (1) % 52 (1) % R = 0.0018217
χ2 = 0.10314
La0.3Yb0.7PO4 28 (1) % 72 (1) % R = 0.0040296
χ2 = 0.22292
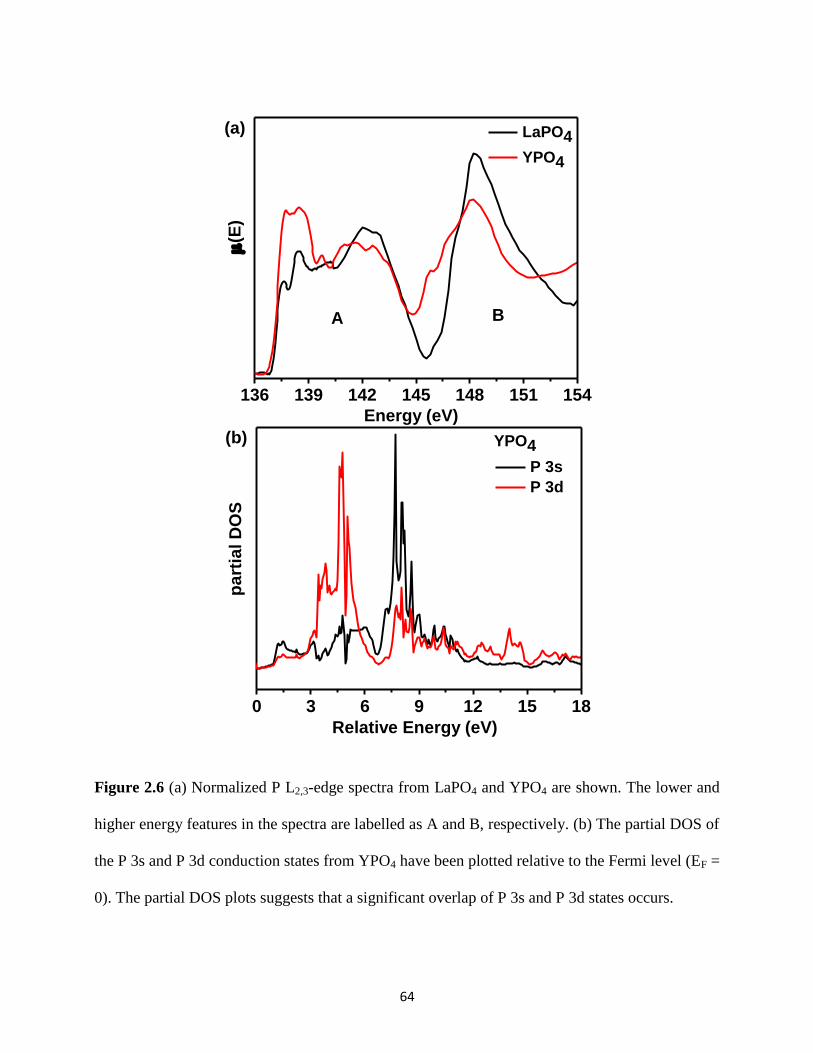
64
136 139 142 145 148 151 154
(E
)
Energy (eV)
LaPO4
YPO4
(a)
BA
0 3 6 9 12 15 18
(b)
pa
rtia
l D
OS
Relative Energy (eV)
P 3s
P 3d
YPO4
Figure 2.6 (a) Normalized P L2,3-edge spectra from LaPO4 and YPO4 are shown. The lower and
higher energy features in the spectra are labelled as A and B, respectively. (b) The partial DOS of
the P 3s and P 3d conduction states from YPO4 have been plotted relative to the Fermi level (EF =
0). The partial DOS plots suggests that a significant overlap of P 3s and P 3d states occurs.

65
The effect of the substitution of the rare-earth elements on the electronic structure of the
monazite or xenotime structure was studied by collecting the P L2,3-edge XANES spectra from
La1-xYxPO4 and La1-xYbxPO4. The P L2,3-edge spectra were also collected from the Sm1-xHoxPO4
series; however, these spectra strongly overlap the Sm N4,5-edge, which makes it impossible to
compare these spectra (See Figure A.2 in Appendix A).180
The normalized P L2,3-edge spectra
collected from the La1-xYbxPO4 series are presented in Figure 2.7. The P L2,3-edge spectra shift to
higher energy and a more pronounced fine structure is observed with increasing substitution of
La3+
for Yb3+
in La1-xYbxPO4. This observation suggests an increase in the concentration of the
xenotime structure. The normalized P L2,3-edge spectra collected from the La1-xYxPO4 series also
exhibited a slight variation in absorption energy and lineshape at higher values of x (see Figure
A.3 in Appendix A). A linear combination fitting of the P L2,3-edge spectra was not possible
because of difficulties in normalizing the spectra; however, these observations are in general
agreement with the analysis of the P K-edge XANES spectra and the powder XRD data (vide
supra).
2.3.4 Sm M5-, Ho M5-, Sm L3-, and Ho L3-edge XANES
M5- and L3- edge XANES spectra from Sm and Ho were collected to study how substitution
affected the electronic structure of the rare-earth atoms. The M5-edge XANES spectra correspond
to the transition of electrons from a 3d orbital into partially occupied 4f orbitals.196,197
The 3d
core level is split into 3d5/2 (M5-edge) and 3d3/2 (M4-edge) states because of spin-orbit
coupling.196,197
The normalized Sm M5-edge XANES spectra collected from the Sm1-xHoxPO4 (x
= 0, 0.1, 0.2, 0.5) series are presented in Figure 2.8a. The edge energy of the Sm M5-edge
XANES spectra remained almost invariant with increasing Ho substitution; however, the
intensity of the spectra increased across the series (Figure 2.8a). It is proposed here that the

66
Figure 2.7 Normalized P L2,3-edge spectra from the La1-xYbxPO4 (x = 0, 0.3, 0.5, 0.7, and 1)
series are shown.
136 139 142 145 148 151 154
(E
)
Energy (eV)
x = 0
x = 0.3
x = 0.5
x = 0.7
x = 1
La1-xYbxPO4
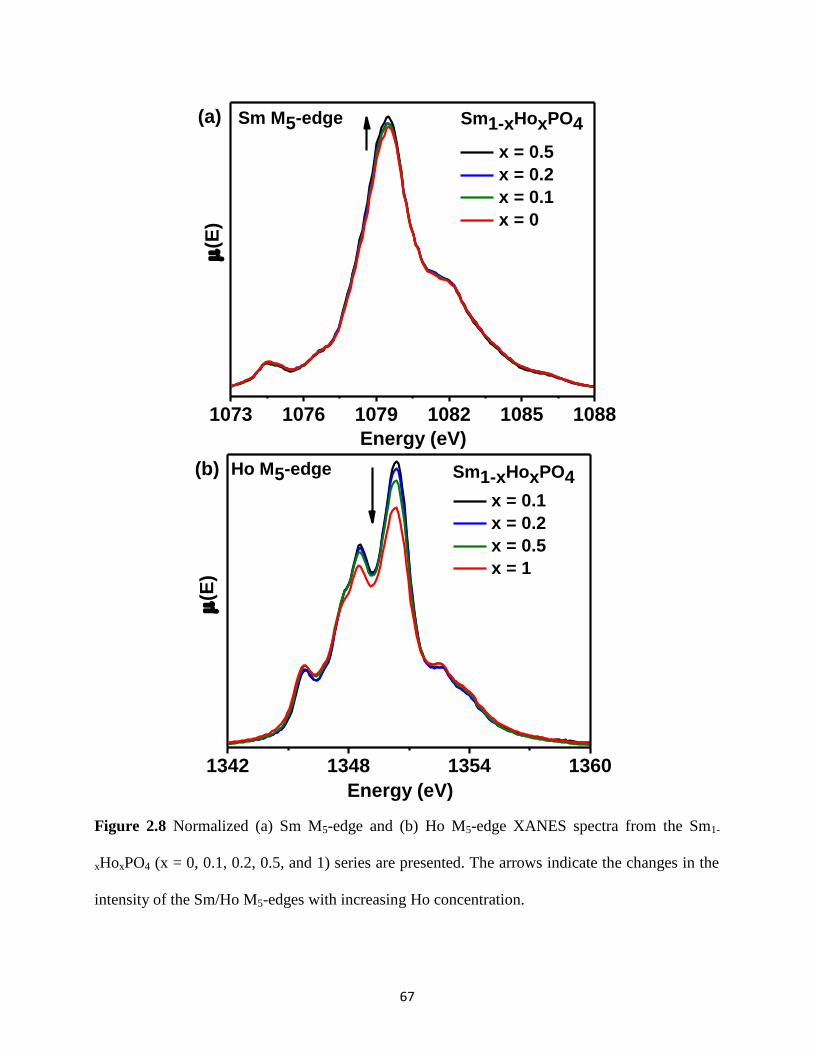
67
1342 1348 1354 1360
(E
)
Energy (eV)
x = 0.1
x = 0.2
x = 0.5
x = 1
Sm1-xHoxPO4(b) Ho M5-edge
1073 1076 1079 1082 1085 1088
(E
)
Energy (eV)
x = 0.5
x = 0.2
x = 0.1
x = 0
Sm1-xHoxPO4(a) Sm M5-edge
Figure 2.8 Normalized (a) Sm M5-edge and (b) Ho M5-edge XANES spectra from the Sm1-
xHoxPO4 (x = 0, 0.1, 0.2, 0.5, and 1) series are presented. The arrows indicate the changes in the
intensity of the Sm/Ho M5-edges with increasing Ho concentration.
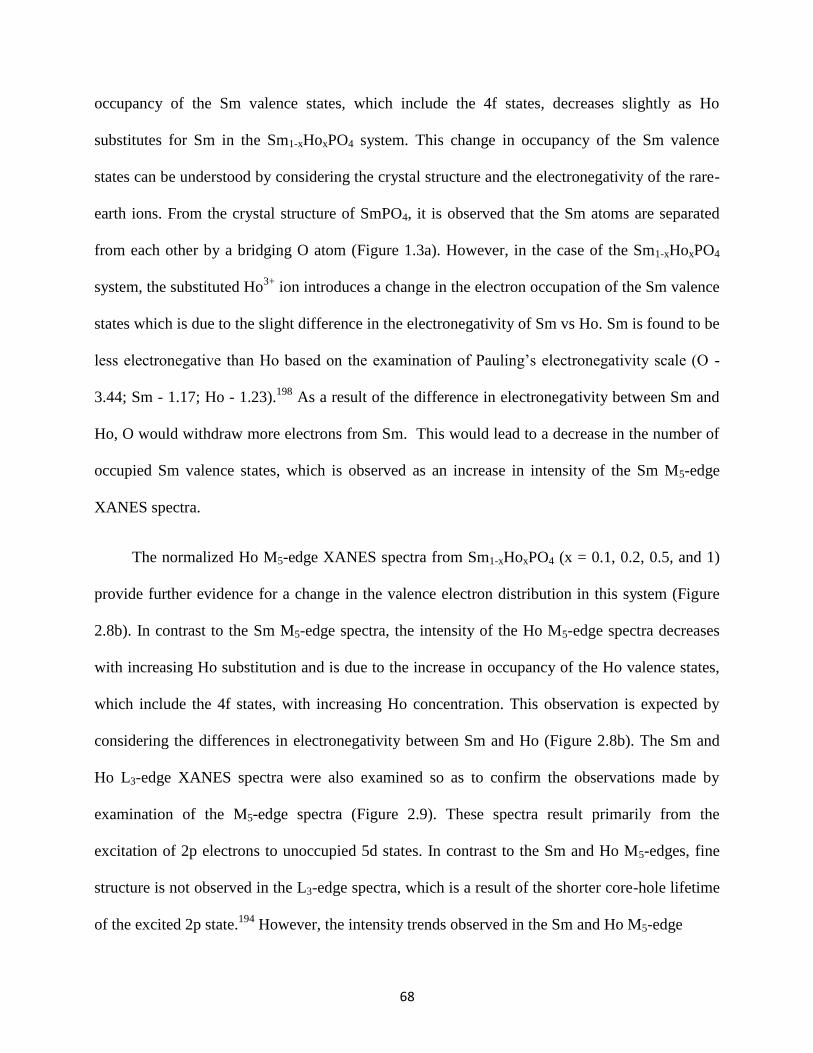
68
occupancy of the Sm valence states, which include the 4f states, decreases slightly as Ho
substitutes for Sm in the Sm1-xHoxPO4 system. This change in occupancy of the Sm valence
states can be understood by considering the crystal structure and the electronegativity of the rare-
earth ions. From the crystal structure of SmPO4, it is observed that the Sm atoms are separated
from each other by a bridging O atom (Figure 1.3a). However, in the case of the Sm1-xHoxPO4
system, the substituted Ho3+
ion introduces a change in the electron occupation of the Sm valence
states which is due to the slight difference in the electronegativity of Sm vs Ho. Sm is found to be
less electronegative than Ho based on the examination of Pauling’s electronegativity scale (O -
3.44; Sm - 1.17; Ho - 1.23).198
As a result of the difference in electronegativity between Sm and
Ho, O would withdraw more electrons from Sm. This would lead to a decrease in the number of
occupied Sm valence states, which is observed as an increase in intensity of the Sm M5-edge
XANES spectra.
The normalized Ho M5-edge XANES spectra from Sm1-xHoxPO4 (x = 0.1, 0.2, 0.5, and 1)
provide further evidence for a change in the valence electron distribution in this system (Figure
2.8b). In contrast to the Sm M5-edge spectra, the intensity of the Ho M5-edge spectra decreases
with increasing Ho substitution and is due to the increase in occupancy of the Ho valence states,
which include the 4f states, with increasing Ho concentration. This observation is expected by
considering the differences in electronegativity between Sm and Ho (Figure 2.8b). The Sm and
Ho L3-edge XANES spectra were also examined so as to confirm the observations made by
examination of the M5-edge spectra (Figure 2.9). These spectra result primarily from the
excitation of 2p electrons to unoccupied 5d states. In contrast to the Sm and Ho M5-edges, fine
structure is not observed in the L3-edge spectra, which is a result of the shorter core-hole lifetime
of the excited 2p state.194
However, the intensity trends observed in the Sm and Ho M5-edge
69
8050 8065 8080 8095 8110
(E
)
Energy (eV)
x = 1
x = 0.7
x = 0.5
Sm1-xHoxPO4Ho L3-edge(b)
6700 6715 6730 6745 6760
(E
)
Energy (eV)
x = 0.5
x = 0.2
x = 0
Sm1-xHoxPO4Sm L3-edge(a)
Figure 2.9 Normalized Sm L3- and Ho L3-edge XANES spectra from the Sm1-xHoxPO4 series are
presented. The arrows indicate the changes in the intensity of Sm/Ho L3-edges with increasing
Ho concentration
70
XANES spectra are reproduced in the Sm and Ho L3-edge XANES spectra, which confirms the
interpretation provided above (i.e., that the electron occupancy of the Sm and Ho valence states
changes depending on composition).
2.3.5 P 2p, O 1s, and La 3d XPS
P 2p, O1s, and La 3d XPS spectra were collected from La1-xYbxPO4 and YPO4 to determine if
XPS can serve as a tool for determining if rare-earth phosphates adopt the xenotime or monazite
structure. The P 2p XPS spectra did not exhibit any detectable binding energy (BE) shift or
change in lineshape between the monazite and xenotime compounds (Figure 2.10a); however, the
O 1s XPS spectra did show a minor shift in BE (~0.1 – 0.2 eV) (Figure 2.10b). The observed shift
in the O 1s spectra could be a result of differences in screening of the O nuclear charge because
of differences in the electronegativity of La and Yb/Y and/or because of a change in structure.198
The La 3d XPS spectra were also collected from the La1-xYbxPO4 (x = 0, 0.3, and 0.7) series to
examine if any changes occurred in the spectra (Figure 2.10c). The spectra from the quaternary
phosphates (La0.7Yb0.3PO4, and La0.3Yb0.7PO4) were observed to shift to higher BE by ~0.17 eV
relative to the ternary phosphate (LaPO4). Overall, the XPS spectra were observed to be relatively
insensitive to variations in the concentration of monazite and xenotime in the La1-xYbxPO4
materials.

71
843 841 839 837 835 833 831
Inte
ns
ity
Binding Energy (eV)
LaPO4
La0.7Yb0.3PO4
La0.3Yb0.7PO4
La 3d5/2 XPS(c)
535 534 533 532 531 530 529
LaPO4
La0.8Yb0.2PO4
La0.5Yb0.5PO4
La0.3Yb0.7PO4
YbPO4
YPO4
Inte
ns
ity
Binding Energy (eV)
O 1s XPS(b)
137 136 135 134 133 132 131
Inte
ns
ity
Binding Energy (eV)
LaPO4
La0.8Yb0.2PO4
La0.5Yb0.5PO4
La0.3Yb0.7PO4
YbPO4
YPO4
P 2p XPS(a)
Figure 2.10 High-resolution (a) P 2p, (b) O 1s, and (c) La 3d5/2 XPS spectra from La1-xYbxPO4
and YPO4 are presented. A distinct shift in binding energy was not observed between the
monazite and xenotime compounds.
72
2.4 Conclusion
Multiple rare-earth phosphate solid-solutions (La1-xYbxPO4, La1-xYxPO4, and Sm1-xHoxPO4) have
been synthesized. Examination of the P K-edge XANES spectra has shown that spectra from
materials adopting the monazite structure have a different lineshape and energy compared to
spectra from materials that adopt the xenotime structure. The quantitative linear combination
fitting of the P K-edge spectra were equivalent to powder XRD analysis of the solid-solutions.
Variations in the lineshape and energy of the P L2,3-edge XANES spectra were also observed;
however, a quantitative analysis of these spectra was not possible. Analysis of the P 2p, O 1s and
La 3d XPS spectra revealed a minor shift in binding energy between the two crystal structures.
The electronic structure of rare-earth phosphate solid-solutions was studied in greater detail by
XANES and XPS in this study than has been presented previously. It was found in this
investigation that P K-edge XANES spectra provide a spectroscopic fingerprint for the monazite-
and xenotime- type structures, thereby making these spectra useful in determining the
composition and structure of rare-earth phosphates in both geological and synthetic samples.
73
Chapter 3
A STRUCTURAL INVESTIGATION OF HYDROUS
AND ANHYDROUS RARE-EARTH PHOSPHATES2
3.1 Introduction
Rare-earth phosphates are an interesting class of materials that have applications as nuclear
wasteforms, in photonics, as proton conductors, as catalysts, and in biolabeling.88,199–204
These
applications stem from the structural diversity exhibited by these compounds. Depending on the
water content, two classes of rare-earth phosphates exist namely the anhydrous and hydrous rare-
earth phosphate materials. In the previous chapter, the crystal and electronic structures of
anhydrous rare-earth phosphate materials adopting the monazite- and xenotime-type structures
were discussed in detail using X-ray diffraction and X-ray spectroscopy (XANES and XPS). Of
the two X-ray spectroscopic techniques, the XANES spectrum was shown to be more sensitive to
changes in the crystal structures of materials. Hydrous rare-earth phosphate materials are also
found in nature and, depending on the sizes of rare-earth ions and the synthetic methods used,
these materials can adopt the rhabdophane- (REPO4.nH2O; RE = La to Dy) or xenotime- (REPO4
2 Reproduced in part with permission from M. R. Rafiuddin, A. P. Grosvenor, Inorganic Chemistry (2016) 55, 9685
– 9695. Copyright 2016 American Chemical Society.
74
& RE’PO4.nH2O; RE = Tb to Lu and Y; RE’ = Ho to Lu and Y) type structure.126,135
In the
current chapter, a structural investigation of hydrous rare-earth phosphate materials adopting the
rhabdophane- and xenotime type structure was carried out using XRD and XANES. In contrast to
the monazite and xenotime structures, structural studies of the rhabdophane-type materials are
rather limited due to their metastable nature.113
The rhabdophane structure initially loses water
upon heating to form an anhydrous compound followed by an irreversible structural
transformation to the monazite- or xenotime- type structure depending on the rare-earth present
when annealed at higher temperatures.113
Materials adopting the rhabdophane-type structure are
usually synthesized in powder form by solution based synthetic methods and no instances of
single crystal growth of these materials have been reported in the literature.205,206
The crystal
structure of rhabdophane solved using an ab-initio method is presented in Figure 1.4 and a
detailed description of the structure is provided in Section 1.5.2. Materials adopting the
rhabdophane structure crystallize in the monoclinic crystal system.126
The structure consists of
open channels formed by the connection of two different chains of alternating SmOn (n = 8 or 9)
and PO4 tetrahedra. The lattice water resides in the open channel oriented along the ‘a’
direction.126
A structural investigation of the hydrous and anhydrous type rare-earth phosphates was
carried out in this study using powder XRD and X-ray absorption near-edge spectroscopy
(XANES). The REPO4.nH2O (RE = La, Nd, Sm, Gd, Dy, Y, Yb) and Gd1-xDyxPO4.nH2O (x =
0.0, 0.2, 0.4, 0.8, 1.0) materials were synthesized using a precipitation route with the crystal
structure adopted by the as-synthesized materials being observed to depend on the size of the RE
ion. The as-synthesized materials were annealed at various temperatures and studied by powder
XRD in order to examine changes in the long-range structure of these materials. Information

75
about the local structure of the RE and P ions in the as-synthesized and annealed materials was
obtained from the analysis of RE L1- (RE = Gd, Dy, Sm), RE L3-, P K-, and P L2,3- edge XANES
spectra. To the best knowledge of the author, this represents the first study to investigate
variations in the local structure of REPO4.nH2O (RE = La, Nd, Sm, Gd, Dy, Y, Yb) materials
with varying annealing temperature. The primary objective of this study was to understand how
the long-range and local structure of REPO4.nH2O materials changed as a function of temperature
and size of the RE ion.
3.2 Experimental
3.2.1 Synthesis and Powder XRD
The hydrated rare-earth phosphates (REPO4.nH2O and Gd1-xDyxPO4.nH2O [x = 0.0, 0.2, 0.4, 0.8,
1.0]; RE = La, Nd, Sm, Gd, Dy, Y, Yb) were synthesized following the procedure developed by
Kijkowska.205
La2O3 (Alfa Aesar; 99.99%), Nd2O3 (Alfa Aesar; 99.9%), Sm2O3 (Alfa Aesar;
99.9%), Gd2O3 (Alfa Aesar; 99.99%), Dy2O3 (Alfa Aesar; 99.9%), Y2O3 (Alfa Aesar; 99.99%),
Yb2O3 (Alfa Aesar; 99.9%), and H3PO4 (Fisher Scientific; 85%) were used as the starting
materials. Finely ground powders of RE2O3 (0.0020 moles) were added to a beaker containing
13.7 mL of 14.6 M H3PO4 (0.200 moles) and the resulting mixture was stirred until a clear
solution was obtained. A PO4:RE2O3 mole ratio of 100:1 was used to synthesize these
compounds. It must be noted here that the mixture containing Nd2O3 and H3PO4 remained cloudy
even after stirring for long periods of time (~1 day); however, a clear solution was obtained while
using other RE2O3 (RE = La, Sm, Gd, Dy, Y, and Yb) oxides. The clear or cloudy solution was
then diluted with 100 mL of water. This solution was then transferred to a round bottomed flask
and refluxed at ~130°C for 2 hours. The clear solution containing La ions became cloudy
76
immediately after the addition of 100 mL of water while the solutions containing other RE ions
(RE = Sm, Gd, Dy, Y, Yb) remained clear. The resulting precipitate was filtered and washed
using deionized water after refluxing and then dried in air overnight before being heated at 60°C
for 1 hour.
The phase purity and the crystal structure of the as-synthesized materials (REPO4.nH2O
[RE = La, Nd, Sm, Gd, Dy, Y, Yb] and Gd1-xDyxPO4.nH2O [x = 0.0, 0.2, 0.4, 0.8, 1.0]) was
determined by analysis of powder XRD patterns collected using a PANalytical Empyrean system
(Co Kα1,2 or Cu Kα1,2 X-ray source). Powder XRD patterns were also collected from
REPO4.nH2O (RE = La, Nd, Sm, Gd, Dy, Y, Yb) materials annealed at different temperatures
(500°C -1200°C) for 12h (followed by quench cooling in air) in order to study the effect of
annealing temperature on the long-range order of these materials. Powder XRD patterns from the
as-synthesized and annealed materials were collected in the 2θ range of 10°-80° using a step size
of 0.017° and the lattice constants were determined using the HighScore Plus software
program.178
The powder XRD pattern from as-synthesized DyPO4.nH2O (rhabdophane-type
structure) was refined using the hexagonal and the monoclinic structural models to determine the
best structure to describe this phase.126,142
For refinement purposes, the powder XRD pattern
from DyPO4.H2O was collected over a wide 2θ range (5° - 120°) using a step size of 0.017° with
the data being refined over the 2θ range of 10°-80°. The following parameters were varied during
the refinement: scale factors, zero shift, lattice constants, profile variables, and the overall
isotropic thermal factor (BOVL). The atomic positions were fixed during the refinement.
3.2.2 Thermogravimetric analysis (TGA)
Thermogravimetric analysis was performed using a TA Instrument Q5000 TGA instrument to
determine the total water content in the as-synthesized materials. Powdered samples of

77
DyPO4.nH2O (rhabdophane-type) and YbPO4.nH2O (xenotime-type) weighing ~17 mg were
heated in air (25.0 ml/min) in a Pt pan from 25°C to 700°C at 5°C/min with the weight loss being
constantly monitored.
3.2.3 XANES
3.2.3.1 P K- and P L2,3-edge XANES
The P K-edge XANES spectra from the as-synthesized and annealed REPO4.nH2O (RE = Sm,
Gd, Dy, Yb) materials were collected using the Soft X-ray Micro-characterization Beamline
(SXRMB; 06B1-1) located at the Canadian Light Source (CLS).179
Information regarding the
sample preparation and experiment was provided in Section 2.2.2.1. The P L2,3-edge XANES
spectra were also collected from as-synthesized and annealed DyPO4.nH2O materials using the
Variable Line Spacing-Plane Grating Monochromator (VLS-PGM; 11ID-2) beamline at the
CLS.182
The experimental information and sample preparation procedure was mentioned in
Section 2.2.2.2. All spectra discussed in this chapter were analyzed using the Athena software
program.181
3.2.3.2 RE L1- and L3-edge (RE = Sm, Gd, Dy) XANES
The RE L1- and L3- edge XANES spectra from REPO4.nH2O (RE = Sm, Gd, Dy, Yb) were
collected using the Sector 20 – Bending Magnet (20 BM; CLS@APS) beamline located at the
Advanced Photon Source (APS; Argonne National Laboratory).207
The spectra were collected in
transmission mode using a Si (111) double crystal monochromator and 100% N2 gas filled
ionization chambers. The spectral resolution varied from 0.9 eV at 6716 eV (Sm L3-edge) to 1.5
eV at 10486 eV (Yb L1-edge). Fine powders of the materials were sandwiched between layers of
kapton tape and the absorption signal was maximized by adjusting the number of layers. The
78
XANES spectra were collected using a step size of 0.15 eV through the RE L1- and RE L3- edges.
Spectra from the calibration standards were collected from metal foils placed between the
transmission and reference ionization chambers. The Gd L3-, Dy L3-, and Sm L1- edge spectra
were calibrated using Co metal foil (E0 = 7709 eV). The Gd L1-, Dy L1-, Sm L3-, Yb L1- edge
spectra were calibrated using Ni (E0 = 8333 eV), Zn (E0 = 9659 eV), Fe (E0 = 7112 eV), and Ga
(E0 = 10367) metal foils, respectively.180
3.3 Results and Discussion
3.3.1 TGA and Powder XRD
The as-synthesized REPO4.nH2O materials were found by XRD (vide infra) to adopt one of two
structure types: rhabdophane (RE = La, Nd, Sm, Gd, Dy) or xenotime (RE = Y, Yb).126,135
The
water content ‘n’ in the rhabdophane and xenotime structures was determined by performing
TGA on DyPO4.nH2O and YbPO4.nH2O (Figure B.1 in Appendix B). In accordance with
previous studies, two distinct regions were observed in the TGA plot from rhabdophane and are
attributed to the two-step elimination of water (Figure B.1a in the supporting information).208
However, in materials adopting the xenotime-type structure, a continuous weight loss was
observed in the temperature range of 25ºC-700°C (Figure B.1b in Appendix B).208
The value of
‘n’ was determined to be ~1 for both structures and represents the total water content (i.e., no
distinction was made between adsorbed and lattice water in this study). This result is in
agreement with a previous investigation of these materials.208
The total water content in the
rhabdophane- and xenotime- type structures appears to be removed once the temperature reaches
~700°C.
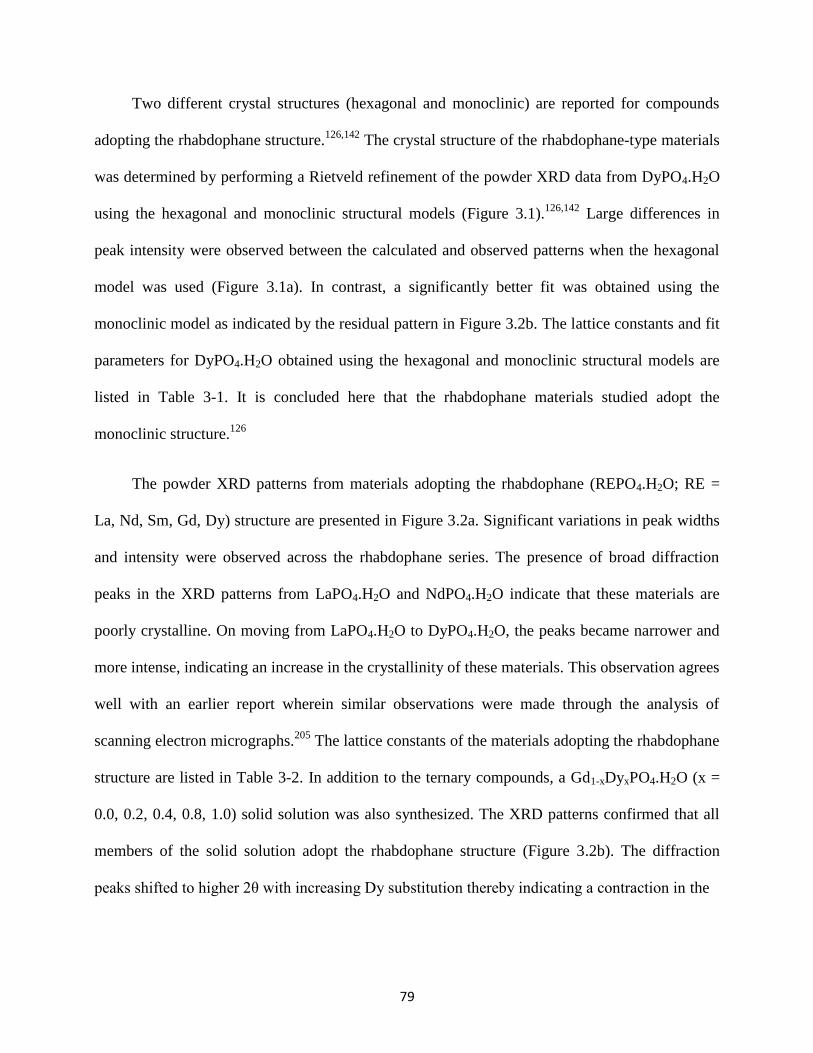
79
Two different crystal structures (hexagonal and monoclinic) are reported for compounds
adopting the rhabdophane structure.126,142
The crystal structure of the rhabdophane-type materials
was determined by performing a Rietveld refinement of the powder XRD data from DyPO4.H2O
using the hexagonal and monoclinic structural models (Figure 3.1).126,142
Large differences in
peak intensity were observed between the calculated and observed patterns when the hexagonal
model was used (Figure 3.1a). In contrast, a significantly better fit was obtained using the
monoclinic model as indicated by the residual pattern in Figure 3.2b. The lattice constants and fit
parameters for DyPO4.H2O obtained using the hexagonal and monoclinic structural models are
listed in Table 3-1. It is concluded here that the rhabdophane materials studied adopt the
monoclinic structure.126
The powder XRD patterns from materials adopting the rhabdophane (REPO4.H2O; RE =
La, Nd, Sm, Gd, Dy) structure are presented in Figure 3.2a. Significant variations in peak widths
and intensity were observed across the rhabdophane series. The presence of broad diffraction
peaks in the XRD patterns from LaPO4.H2O and NdPO4.H2O indicate that these materials are
poorly crystalline. On moving from LaPO4.H2O to DyPO4.H2O, the peaks became narrower and
more intense, indicating an increase in the crystallinity of these materials. This observation agrees
well with an earlier report wherein similar observations were made through the analysis of
scanning electron micrographs.205
The lattice constants of the materials adopting the rhabdophane
structure are listed in Table 3-2. In addition to the ternary compounds, a Gd1-xDyxPO4.H2O (x =
0.0, 0.2, 0.4, 0.8, 1.0) solid solution was also synthesized. The XRD patterns confirmed that all
members of the solid solution adopt the rhabdophane structure (Figure 3.2b). The diffraction
peaks shifted to higher 2θ with increasing Dy substitution thereby indicating a contraction in the
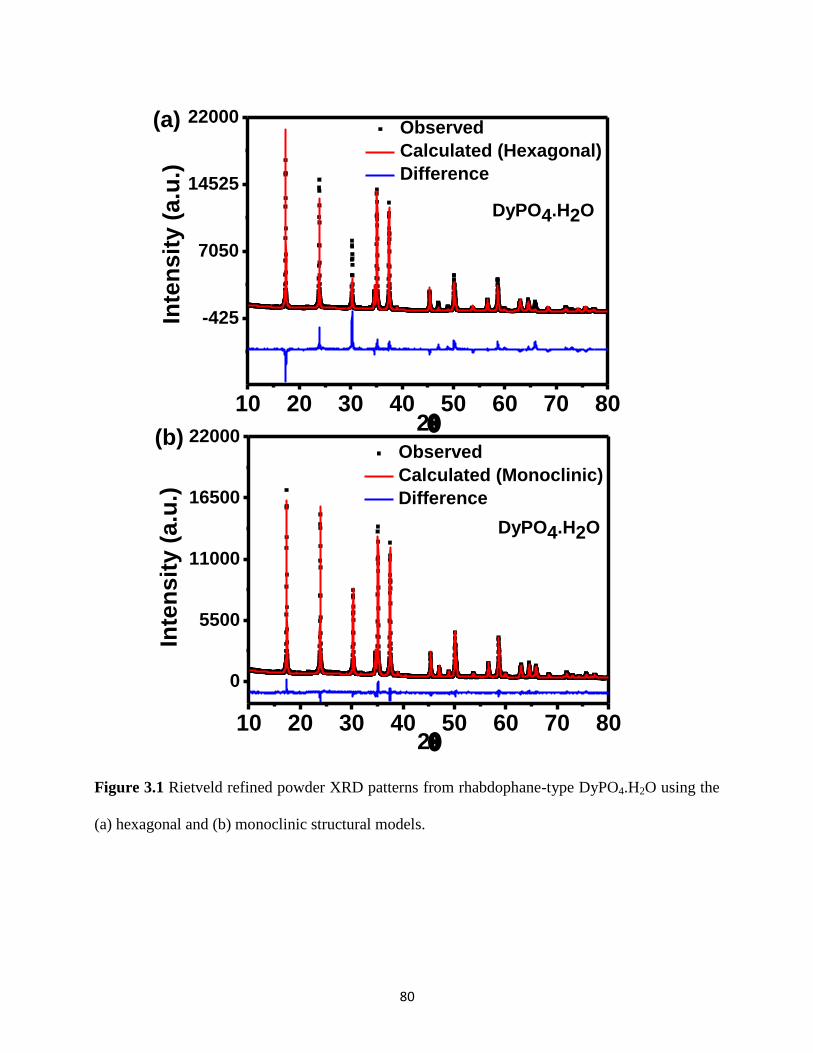
80
10 20 30 40 50 60 70 80
0
5500
11000
16500
22000
Inte
ns
ity
(a
.u.)
2
Observed
Calculated (Monoclinic)
Difference
DyPO4.H2O
(b)
10 20 30 40 50 60 70 80
-425
7050
14525
22000(a)
Inte
ns
ity
(a
.u.)
2
DyPO4.H2O
Observed
Calculated (Hexagonal)
Difference
Figure 3.1 Rietveld refined powder XRD patterns from rhabdophane-type DyPO4.H2O using the
(a) hexagonal and (b) monoclinic structural models.
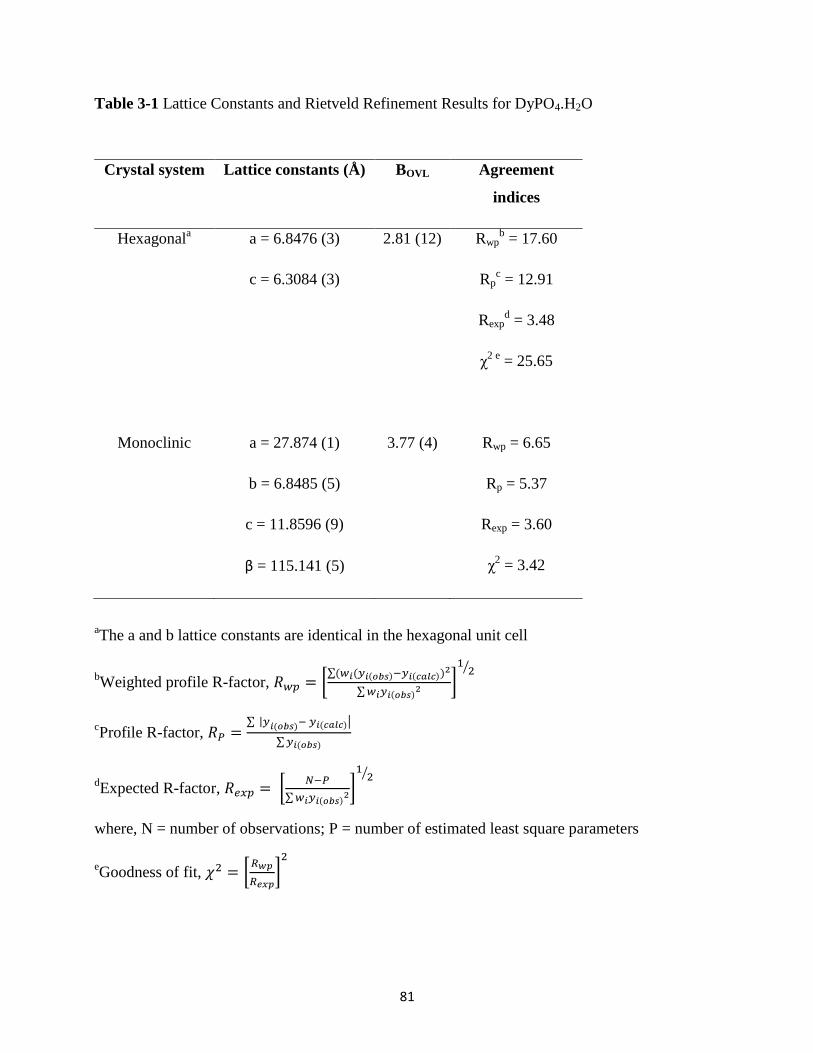
81
Table 3-1 Lattice Constants and Rietveld Refinement Results for DyPO4.H2O
aThe a and b lattice constants are identical in the hexagonal unit cell
bWeighted profile R-factor, 𝑅𝑤𝑝 = [
∑(𝑤𝑖(𝑦𝑖(𝑜𝑏𝑠)−𝑦𝑖(𝑐𝑎𝑙𝑐))2
∑ 𝑤𝑖𝑦𝑖(𝑜𝑏𝑠)2 ]
12⁄
cProfile R-factor, 𝑅𝑃 =
∑ |𝑦𝑖(𝑜𝑏𝑠)− 𝑦𝑖(𝑐𝑎𝑙𝑐)|
∑ 𝑦𝑖(𝑜𝑏𝑠)
dExpected R-factor, 𝑅𝑒𝑥𝑝 = [
𝑁−𝑃
∑ 𝑤𝑖𝑦𝑖(𝑜𝑏𝑠)2]
12⁄
where, N = number of observations; P = number of estimated least square parameters
eGoodness of fit, 𝜒2 = [
𝑅𝑤𝑝
𝑅𝑒𝑥𝑝]
2
Crystal system Lattice constants (Å) BOVL Agreement
indices
Hexagonala a = 6.8476 (3)
c = 6.3084 (3)
2.81 (12) Rwpb = 17.60
Rpc = 12.91
Rexpd = 3.48
χ2 e
= 25.65
Monoclinic a = 27.874 (1)
b = 6.8485 (5)
c = 11.8596 (9)
β = 115.141 (5)
3.77 (4) Rwp = 6.65
Rp = 5.37
Rexp = 3.60
χ2 = 3.42
82
15 20 25 30 35 40
2
x = 1
x = 0.8
x = 0.4
x = 0.2
x =0
Gd1-xDyxPO4.H2O
Inte
ns
ity
(a
.u.)
(b)
15 20 25 30 35 40
(a)
2
DyPO4.H2O
GdPO4.H2O
SmPO4.H2O
NdPO4.H2O
LaPO4.H2O
Inte
ns
ity
(a
.u.)
Rhabdophane
Figure 3.2 Powder XRD patterns from the as-synthesized rhabdophane-type (a) REPO4.H2O (RE
= La, Nd, Sm, Gd, Dy) and (b) Gd1-xDyxPO4.H2O materials.
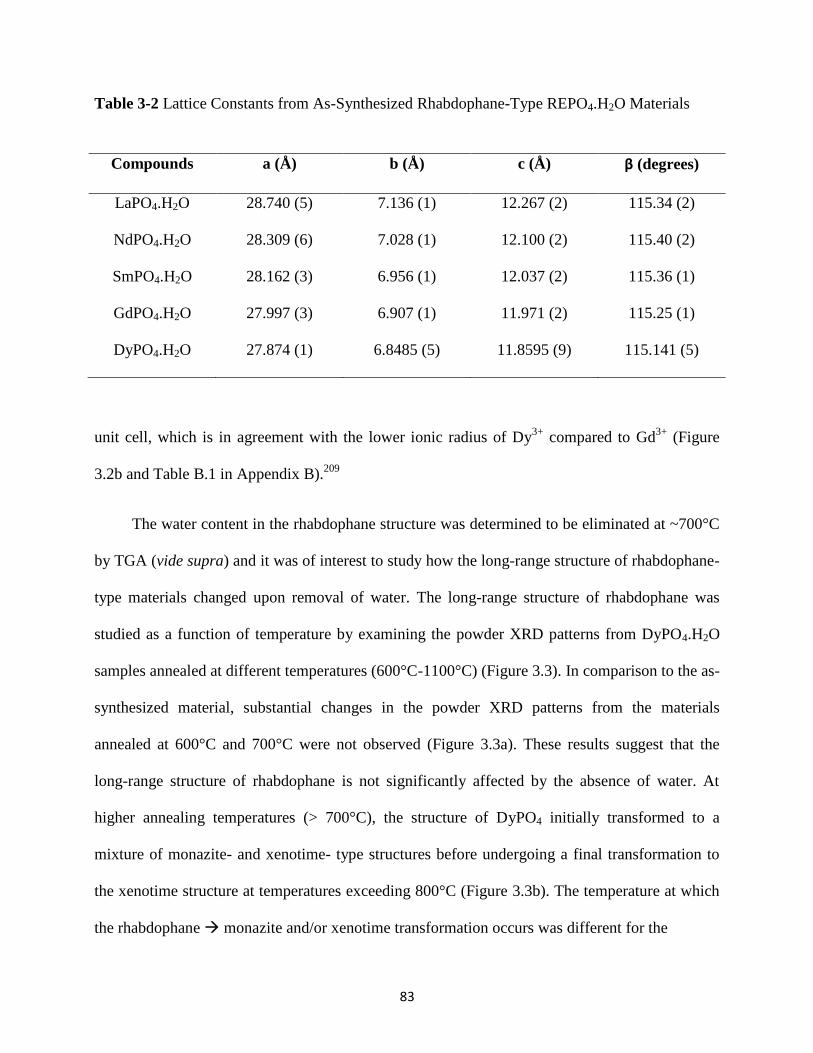
83
Table 3-2 Lattice Constants from As-Synthesized Rhabdophane-Type REPO4.H2O Materials
unit cell, which is in agreement with the lower ionic radius of Dy3+
compared to Gd3+
(Figure
3.2b and Table B.1 in Appendix B).209
The water content in the rhabdophane structure was determined to be eliminated at ~700°C
by TGA (vide supra) and it was of interest to study how the long-range structure of rhabdophane-
type materials changed upon removal of water. The long-range structure of rhabdophane was
studied as a function of temperature by examining the powder XRD patterns from DyPO4.H2O
samples annealed at different temperatures (600°C-1100°C) (Figure 3.3). In comparison to the as-
synthesized material, substantial changes in the powder XRD patterns from the materials
annealed at 600°C and 700°C were not observed (Figure 3.3a). These results suggest that the
long-range structure of rhabdophane is not significantly affected by the absence of water. At
higher annealing temperatures (> 700°C), the structure of DyPO4 initially transformed to a
mixture of monazite- and xenotime- type structures before undergoing a final transformation to
the xenotime structure at temperatures exceeding 800°C (Figure 3.3b). The temperature at which
the rhabdophane monazite and/or xenotime transformation occurs was different for the
Compounds a (Å) b (Å) c (Å) β (degrees)
LaPO4.H2O 28.740 (5) 7.136 (1) 12.267 (2) 115.34 (2)
NdPO4.H2O 28.309 (6) 7.028 (1) 12.100 (2) 115.40 (2)
SmPO4.H2O 28.162 (3) 6.956 (1) 12.037 (2) 115.36 (1)
GdPO4.H2O 27.997 (3) 6.907 (1) 11.971 (2) 115.25 (1)
DyPO4.H2O 27.874 (1) 6.8485 (5) 11.8595 (9) 115.141 (5)
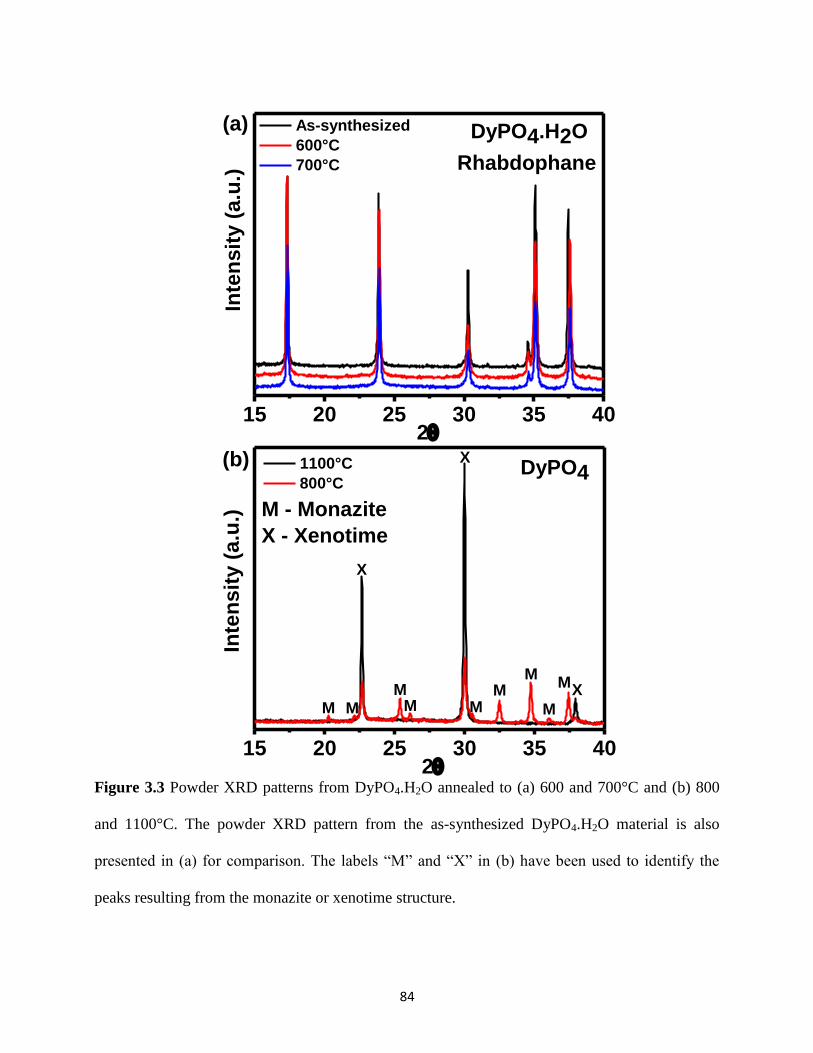
84
15 20 25 30 35 40
M - Monazite
X - Xenotime
Inte
ns
ity (
a.u
.)
2
1100°C
800°C
X
M MMM M M
M
M
MX
XDyPO4
(b)
15 20 25 30 35 40
Rhabdophane
Inte
nsit
y (
a.u
.)
2
As-synthesized
600°C
700°C
DyPO4.H2O(a)
Figure 3.3 Powder XRD patterns from DyPO4.H2O annealed to (a) 600 and 700°C and (b) 800
and 1100°C. The powder XRD pattern from the as-synthesized DyPO4.H2O material is also
presented in (a) for comparison. The labels “M” and “X” in (b) have been used to identify the
peaks resulting from the monazite or xenotime structure.

85
compounds in the rhabdophane series (500°<T≤700°C), and was observed to increase with a
decrease in the size of the rare-earth (RE = La, Sm, Gd, Dy) ions (See Figure 3.3b and Figure B.2
in Appendix B).
It has been reported that the structural transformation of REPO4.H2O (rhabdophane-type) to
REPO4 (monazite- or/and xenotime-type) at high-temperature is accompanied by the formation of
minor amounts of rare-earth polytrioxophosphate (REP3O9).210,211
The as-synthesized precipitate
may contain adsorbed H3PO4 that can react with REPO4.H2O at higher temperatures to form
REP3O9.210,211
However, in the present study, the REP3O9 (RE = La, Nd, Sm, Gd, Dy) phase was
not observed during the structural transformation of rhabdophane- to monazite- and/or xenotime-
type structures. This is because the as-synthesized precipitates of REPO4.H2O were washed with
a large excess of water prior to annealing to remove any adsorbed phosphates.
The as-synthesized YbPO4.H2O (and YPO4.H2O) materials were determined by analysis of
powder XRD patterns to adopt the xenotime-type structure (Figure 3.4).135
The xenotime-type
structure crystallizes in a tetragonal unit cell which is of higher symmetry when compared to the
monoclinic unit cell adopted by the rhabdophane structure.126,135
The long-range structure of
YbPO4.H2O was studied as a function of temperature by collecting powder XRD patterns from
YbPO4.H2O annealed to 600°C and 1200°C (Figure 3.4). Upon heating to 600°C, the diffraction
peaks become broader and shifted slightly to higher 2θ (See inset in Figure 3.4). These
observations suggest a decrease in crystallinity as well as a contraction in the unit cell of the
xenotime-type structure upon removal of water. Further heating to 1200°C results in an
improvement in the crystallinity of the material as indicated by the presence of intense and
narrow diffraction peaks (Figure 3.4). In contrast to the rhabdophane structure, the xenotime-type
structure was stable at all annealing temperatures as indicated by the powder XRD patterns from

86
YbPO4.H2O annealed at 600°C or 1200°C (Figure 3.4). The lattice constants of as-synthesized
YbPO4.H2O are presented in Table 3-3 along with the lattice constants from this material after
annealing at 600°C or 1200°C. A slightly larger unit cell was observed for the as-synthesized
material in comparison to the materials annealed to 600°C or 1200°C. These observations are
consistent with an earlier report in which a similar contraction in the unit cell parameters of
xenotime-type materials was observed after annealing ErPO4.H2O (also prepared using a
precipitation route) to 950°C.208
These results indicate that the presence of water introduces
changes in the xenotime crystal structure; however, more detailed studies on YbPO4.H2O are
required in order to explain how water affects the local and long-range structure.
3.3.2 XANES
The effect of annealing temperature on the long-range order of materials adopting the
rhabdophane- and xenotime- type structures was discussed in Section 3.3.1 through the analysis
of powder XRD data. It was shown that the powder XRD data of DyPO4.H2O (rhabdophane-
type) annealed to 700°C did not exhibit significant changes in the long-range order of the
rhabdophane-type structure upon removal of water whereas distinct (although minor) changes in
the powder XRD pattern of YbPO4.H2O were observed with increasing annealing temperature.
XANES spectra were collected from the REPO4.H2O (RE = Sm, Gd, Dy, Yb) materials in order
to determine how the local structures of these materials are affected by the loss of water.
Temperature-induced changes in the local coordination environment of P and RE (RE = Sm, Gd,
Dy, Yb) ions were probed by examination of P K-, P L2,3-, and RE L1- edge XANES spectra.
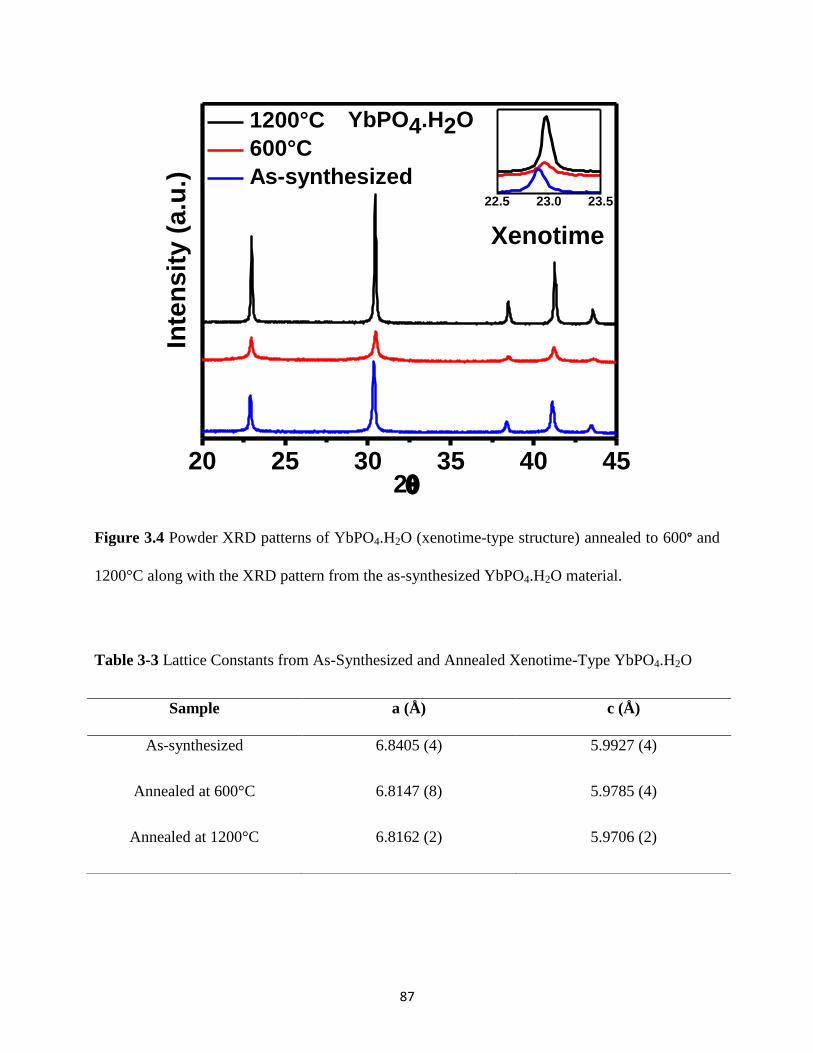
87
20 25 30 35 40 452
1200°C
600°C
As-synthesized
YbPO4.H2O
Inte
ns
ity
(a
.u.)
Xenotime
22.5 23.0 23.5
Figure 3.4 Powder XRD patterns of YbPO4.H2O (xenotime-type structure) annealed to 600° and
1200°C along with the XRD pattern from the as-synthesized YbPO4.H2O material.
Table 3-3 Lattice Constants from As-Synthesized and Annealed Xenotime-Type YbPO4.H2O
Sample a (Å) c (Å)
As-synthesized 6.8405 (4) 5.9927 (4)
Annealed at 600°C 6.8147 (8) 5.9785 (4)
Annealed at 1200°C 6.8162 (2) 5.9706 (2)
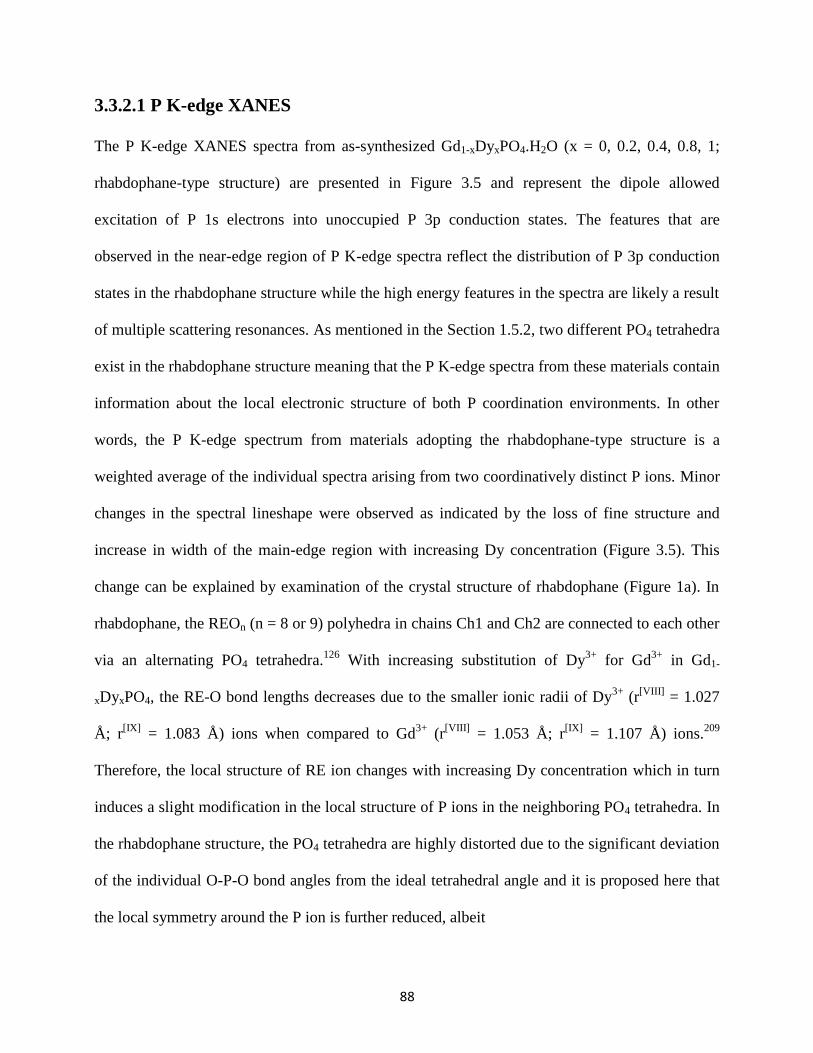
88
3.3.2.1 P K-edge XANES
The P K-edge XANES spectra from as-synthesized Gd1-xDyxPO4.H2O (x = 0, 0.2, 0.4, 0.8, 1;
rhabdophane-type structure) are presented in Figure 3.5 and represent the dipole allowed
excitation of P 1s electrons into unoccupied P 3p conduction states. The features that are
observed in the near-edge region of P K-edge spectra reflect the distribution of P 3p conduction
states in the rhabdophane structure while the high energy features in the spectra are likely a result
of multiple scattering resonances. As mentioned in the Section 1.5.2, two different PO4 tetrahedra
exist in the rhabdophane structure meaning that the P K-edge spectra from these materials contain
information about the local electronic structure of both P coordination environments. In other
words, the P K-edge spectrum from materials adopting the rhabdophane-type structure is a
weighted average of the individual spectra arising from two coordinatively distinct P ions. Minor
changes in the spectral lineshape were observed as indicated by the loss of fine structure and
increase in width of the main-edge region with increasing Dy concentration (Figure 3.5). This
change can be explained by examination of the crystal structure of rhabdophane (Figure 1a). In
rhabdophane, the REOn (n = 8 or 9) polyhedra in chains Ch1 and Ch2 are connected to each other
via an alternating PO4 tetrahedra.126
With increasing substitution of Dy3+
for Gd3+
in Gd1-
xDyxPO4, the RE-O bond lengths decreases due to the smaller ionic radii of Dy3+
(r[VIII]
= 1.027
Å; r[IX]
= 1.083 Å) ions when compared to Gd3+
(r[VIII]
= 1.053 Å; r[IX]
= 1.107 Å) ions.209
Therefore, the local structure of RE ion changes with increasing Dy concentration which in turn
induces a slight modification in the local structure of P ions in the neighboring PO4 tetrahedra. In
the rhabdophane structure, the PO4 tetrahedra are highly distorted due to the significant deviation
of the individual O-P-O bond angles from the ideal tetrahedral angle and it is proposed here that
the local symmetry around the P ion is further reduced, albeit

89
2149 2159 2169 2179Energy (eV)
x = 0
x = 0.2
x = 0.4
x = 0.8
x = 1(E
)
Gd1-xDyxPO4.H2O
Figure 3.5 P K-edge XANES spectra from the as-synthesized Gd1-xDyxPO4.H2O (x = 0.0, 0.2,
0.4, 0.8, and 1.0) materials.
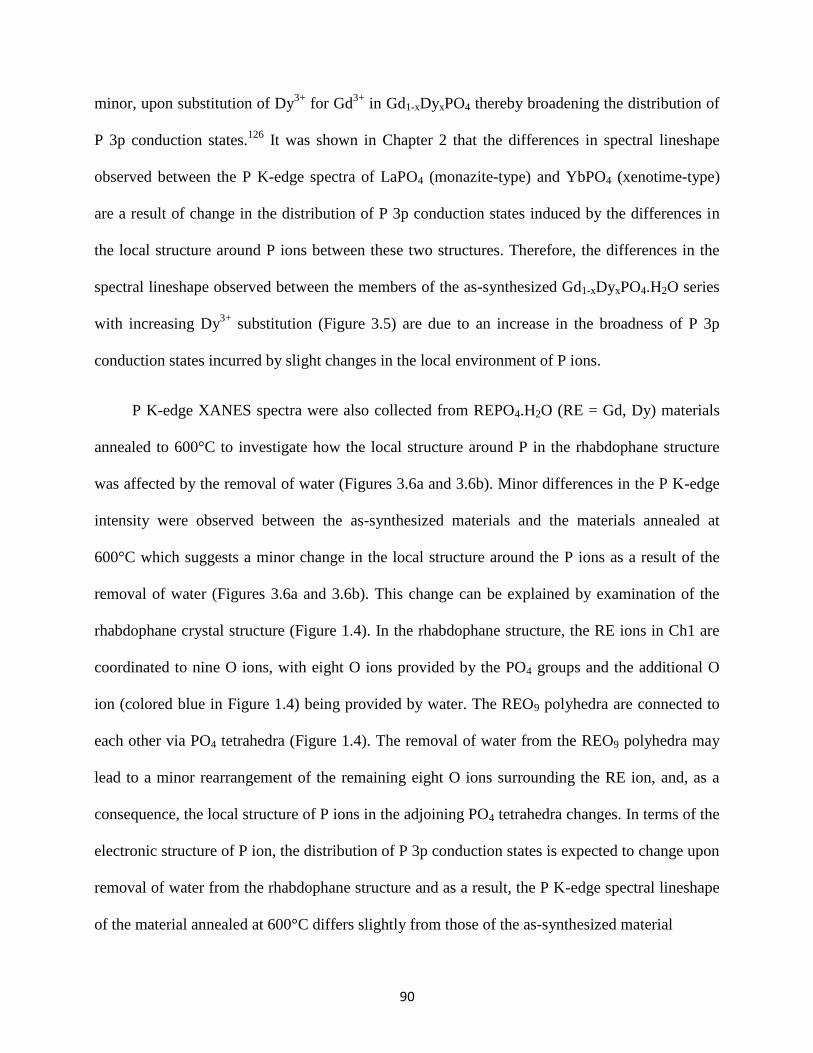
90
minor, upon substitution of Dy3+
for Gd3+
in Gd1-xDyxPO4 thereby broadening the distribution of
P 3p conduction states.126
It was shown in Chapter 2 that the differences in spectral lineshape
observed between the P K-edge spectra of LaPO4 (monazite-type) and YbPO4 (xenotime-type)
are a result of change in the distribution of P 3p conduction states induced by the differences in
the local structure around P ions between these two structures. Therefore, the differences in the
spectral lineshape observed between the members of the as-synthesized Gd1-xDyxPO4.H2O series
with increasing Dy3+
substitution (Figure 3.5) are due to an increase in the broadness of P 3p
conduction states incurred by slight changes in the local environment of P ions.
P K-edge XANES spectra were also collected from REPO4.H2O (RE = Gd, Dy) materials
annealed to 600°C to investigate how the local structure around P in the rhabdophane structure
was affected by the removal of water (Figures 3.6a and 3.6b). Minor differences in the P K-edge
intensity were observed between the as-synthesized materials and the materials annealed at
600°C which suggests a minor change in the local structure around the P ions as a result of the
removal of water (Figures 3.6a and 3.6b). This change can be explained by examination of the
rhabdophane crystal structure (Figure 1.4). In the rhabdophane structure, the RE ions in Ch1 are
coordinated to nine O ions, with eight O ions provided by the PO4 groups and the additional O
ion (colored blue in Figure 1.4) being provided by water. The REO9 polyhedra are connected to
each other via PO4 tetrahedra (Figure 1.4). The removal of water from the REO9 polyhedra may
lead to a minor rearrangement of the remaining eight O ions surrounding the RE ion, and, as a
consequence, the local structure of P ions in the adjoining PO4 tetrahedra changes. In terms of the
electronic structure of P ion, the distribution of P 3p conduction states is expected to change upon
removal of water from the rhabdophane structure and as a result, the P K-edge spectral lineshape
of the material annealed at 600°C differs slightly from those of the as-synthesized material
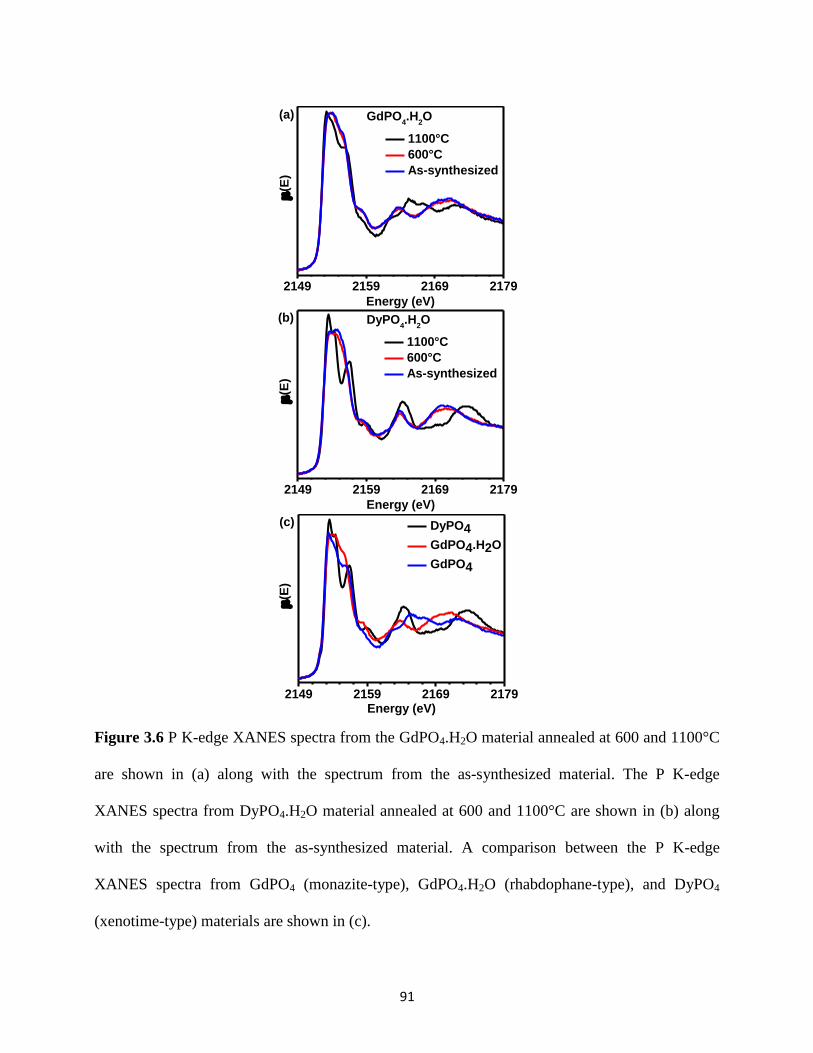
91
2149 2159 2169 2179
(E
)
Energy (eV)
1100°C
600°C
As-synthesized
DyPO4.H
2O(b)
2149 2159 2169 2179
GdPO4.H
2O
1100°C
600°C
As-synthesized
(E
)
Energy (eV)
(a)
2149 2159 2169 2179
(E
)
Energy (eV)
DyPO4
GdPO4.H2O
GdPO4
(c)
Figure 3.6 P K-edge XANES spectra from the GdPO4.H2O material annealed at 600 and 1100°C
are shown in (a) along with the spectrum from the as-synthesized material. The P K-edge
XANES spectra from DyPO4.H2O material annealed at 600 and 1100°C are shown in (b) along
with the spectrum from the as-synthesized material. A comparison between the P K-edge
XANES spectra from GdPO4 (monazite-type), GdPO4.H2O (rhabdophane-type), and DyPO4
(xenotime-type) materials are shown in (c).
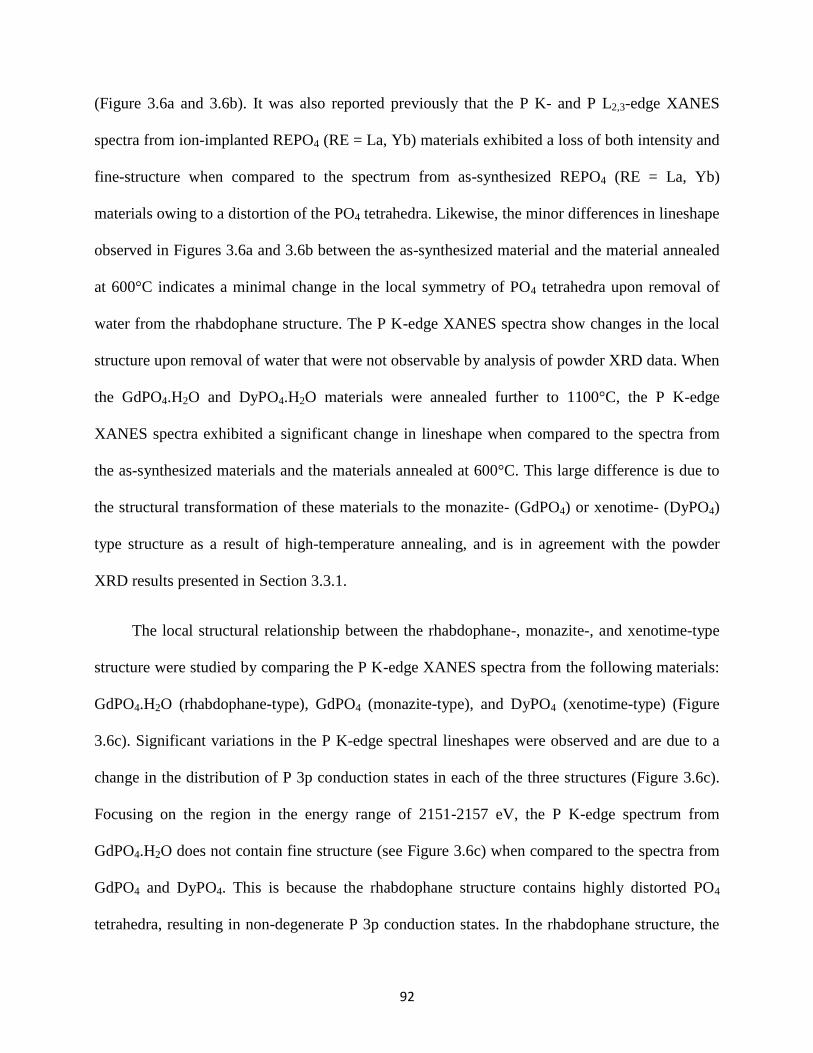
92
(Figure 3.6a and 3.6b). It was also reported previously that the P K- and P L2,3-edge XANES
spectra from ion-implanted REPO4 (RE = La, Yb) materials exhibited a loss of both intensity and
fine-structure when compared to the spectrum from as-synthesized REPO4 (RE = La, Yb)
materials owing to a distortion of the PO4 tetrahedra. Likewise, the minor differences in lineshape
observed in Figures 3.6a and 3.6b between the as-synthesized material and the material annealed
at 600°C indicates a minimal change in the local symmetry of PO4 tetrahedra upon removal of
water from the rhabdophane structure. The P K-edge XANES spectra show changes in the local
structure upon removal of water that were not observable by analysis of powder XRD data. When
the GdPO4.H2O and DyPO4.H2O materials were annealed further to 1100°C, the P K-edge
XANES spectra exhibited a significant change in lineshape when compared to the spectra from
the as-synthesized materials and the materials annealed at 600°C. This large difference is due to
the structural transformation of these materials to the monazite- (GdPO4) or xenotime- (DyPO4)
type structure as a result of high-temperature annealing, and is in agreement with the powder
XRD results presented in Section 3.3.1.
The local structural relationship between the rhabdophane-, monazite-, and xenotime-type
structure were studied by comparing the P K-edge XANES spectra from the following materials:
GdPO4.H2O (rhabdophane-type), GdPO4 (monazite-type), and DyPO4 (xenotime-type) (Figure
3.6c). Significant variations in the P K-edge spectral lineshapes were observed and are due to a
change in the distribution of P 3p conduction states in each of the three structures (Figure 3.6c).
Focusing on the region in the energy range of 2151-2157 eV, the P K-edge spectrum from
GdPO4.H2O does not contain fine structure (see Figure 3.6c) when compared to the spectra from
GdPO4 and DyPO4. This is because the rhabdophane structure contains highly distorted PO4
tetrahedra, resulting in non-degenerate P 3p conduction states. In the rhabdophane structure, the
93
individual O-P-O bond angles in the PO4 tetrahedra ranges from ~ 91.7° to 121.6° thereby
indicating a significant deviation from the ideal tetrahedral angle (109.5°).126
However, minor
fine structure can be observed in the P K-edge spectra of GdPO4 (Figure 3.6c) and indicates an
increase in the number of degenerate P 3p conduction states in materials adopting the monazite
structure. Although the PO4 tetrahedra in the monazite structure is also distorted (unequal P-O
bond distances and O-P-O bond angles), the magnitude of distortion in the PO4 tetrahedra is less
when compared to the rhabdophane structure due to the narrower range of O-P-O bond angles
(~103.9° - 112.4°) in the monazite structure.135
In comparison to P K-edge spectrum from GdPO4
adopting the monazite-type structure, the P K-edge spectrum from DyPO4 (xenotime-type)
contained a more pronounced fine structure (see Figure 3.6c) which is due to the presence of a
more symmetric PO4 tetrahedra (similar P-O bond distances and two distinct O-P-O bond angles)
that result in an increase in the number of degenerate P 3p conduction states available for 1s
electrons to be excited to.135
It should be noted that in the xenotime-type structure, the individual
O-P-O bond angles in PO4 tetrahedra are ~102.9° and ~112.9°.135
Based on these observations,
the changes in the spectral lineshape of the monazite-, rhabdophane-, and xenotime- type
structures are observed to be a result of a change in the distribution of P 3p conduction states with
the degree of PO4 distortion that leads to these changes being arranged in the following order:
rhabdophane (most distorted PO4 tetrahedra) < monazite < xenotime (least distorted PO4
tetrahedra).
The effect of annealing temperature on the local structure of P in YbPO4.H2O (xenotime-
type structure) was studied by collecting P K-edge XANES spectra from YbPO4.H2O before and
after annealing (Figure 3.7). The P K-edge spectrum from the as-synthesized material has a lower
intensity and less pronounced fine structure than the spectrum obtained from the material
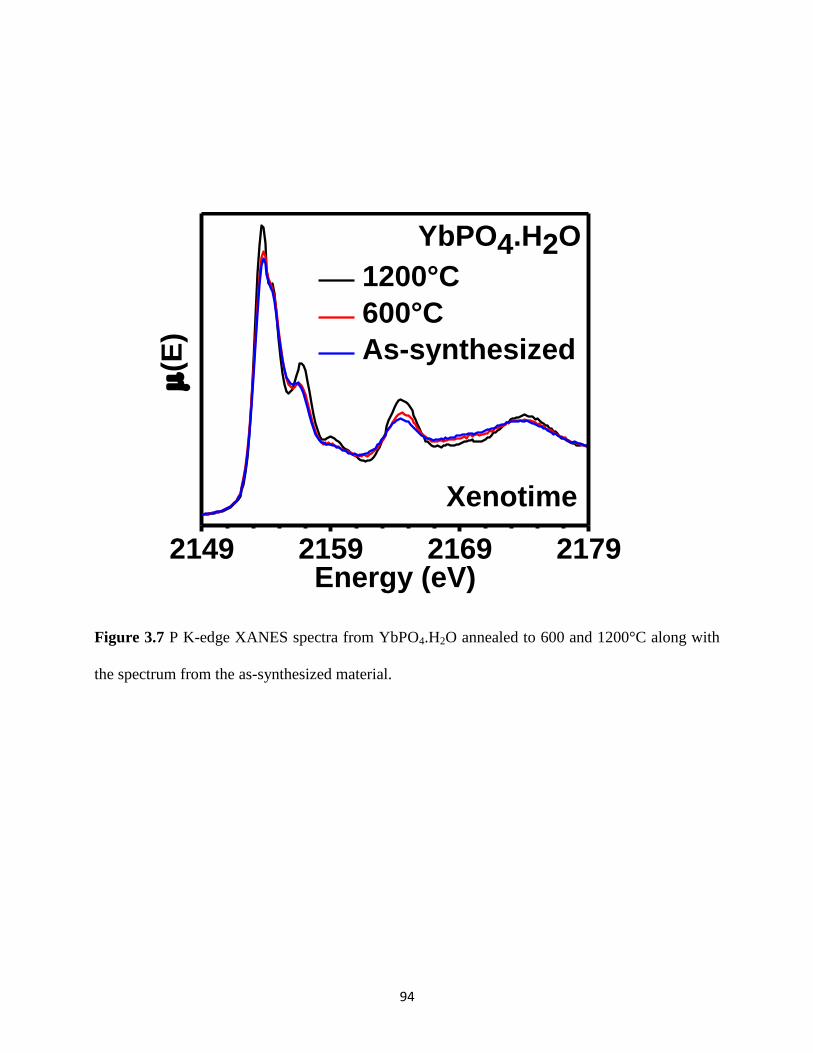
94
Figure 3.7 P K-edge XANES spectra from YbPO4.H2O annealed to 600 and 1200°C along with
the spectrum from the as-synthesized material.
2149 2159 2169 2179
(E
)
Energy (eV)
1200°C
600°C
As-synthesized
YbPO4.H2O
Xenotime
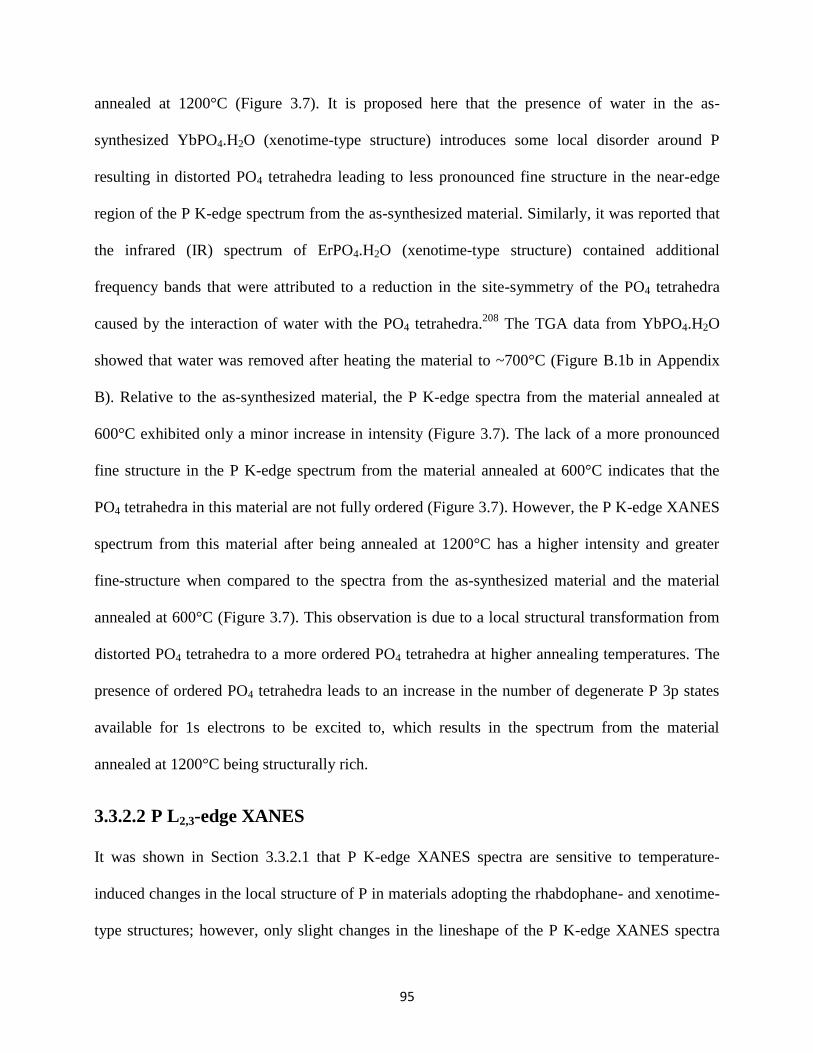
95
annealed at 1200°C (Figure 3.7). It is proposed here that the presence of water in the as-
synthesized YbPO4.H2O (xenotime-type structure) introduces some local disorder around P
resulting in distorted PO4 tetrahedra leading to less pronounced fine structure in the near-edge
region of the P K-edge spectrum from the as-synthesized material. Similarly, it was reported that
the infrared (IR) spectrum of ErPO4.H2O (xenotime-type structure) contained additional
frequency bands that were attributed to a reduction in the site-symmetry of the PO4 tetrahedra
caused by the interaction of water with the PO4 tetrahedra.208
The TGA data from YbPO4.H2O
showed that water was removed after heating the material to ~700°C (Figure B.1b in Appendix
B). Relative to the as-synthesized material, the P K-edge spectra from the material annealed at
600°C exhibited only a minor increase in intensity (Figure 3.7). The lack of a more pronounced
fine structure in the P K-edge spectrum from the material annealed at 600°C indicates that the
PO4 tetrahedra in this material are not fully ordered (Figure 3.7). However, the P K-edge XANES
spectrum from this material after being annealed at 1200°C has a higher intensity and greater
fine-structure when compared to the spectra from the as-synthesized material and the material
annealed at 600°C (Figure 3.7). This observation is due to a local structural transformation from
distorted PO4 tetrahedra to a more ordered PO4 tetrahedra at higher annealing temperatures. The
presence of ordered PO4 tetrahedra leads to an increase in the number of degenerate P 3p states
available for 1s electrons to be excited to, which results in the spectrum from the material
annealed at 1200°C being structurally rich.
3.3.2.2 P L2,3-edge XANES
It was shown in Section 3.3.2.1 that P K-edge XANES spectra are sensitive to temperature-
induced changes in the local structure of P in materials adopting the rhabdophane- and xenotime-
type structures; however, only slight changes in the lineshape of the P K-edge XANES spectra
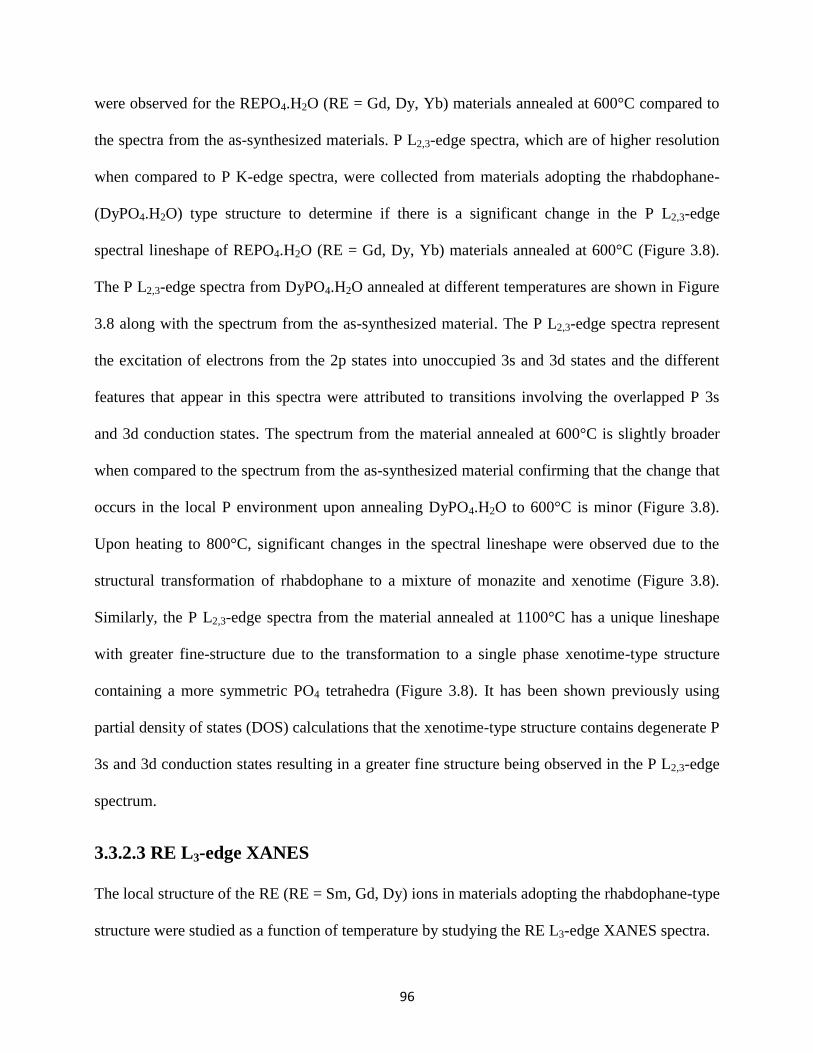
96
were observed for the REPO4.H2O (RE = Gd, Dy, Yb) materials annealed at 600°C compared to
the spectra from the as-synthesized materials. P L2,3-edge spectra, which are of higher resolution
when compared to P K-edge spectra, were collected from materials adopting the rhabdophane-
(DyPO4.H2O) type structure to determine if there is a significant change in the P L2,3-edge
spectral lineshape of REPO4.H2O (RE = Gd, Dy, Yb) materials annealed at 600°C (Figure 3.8).
The P L2,3-edge spectra from DyPO4.H2O annealed at different temperatures are shown in Figure
3.8 along with the spectrum from the as-synthesized material. The P L2,3-edge spectra represent
the excitation of electrons from the 2p states into unoccupied 3s and 3d states and the different
features that appear in this spectra were attributed to transitions involving the overlapped P 3s
and 3d conduction states. The spectrum from the material annealed at 600°C is slightly broader
when compared to the spectrum from the as-synthesized material confirming that the change that
occurs in the local P environment upon annealing DyPO4.H2O to 600°C is minor (Figure 3.8).
Upon heating to 800°C, significant changes in the spectral lineshape were observed due to the
structural transformation of rhabdophane to a mixture of monazite and xenotime (Figure 3.8).
Similarly, the P L2,3-edge spectra from the material annealed at 1100°C has a unique lineshape
with greater fine-structure due to the transformation to a single phase xenotime-type structure
containing a more symmetric PO4 tetrahedra (Figure 3.8). It has been shown previously using
partial density of states (DOS) calculations that the xenotime-type structure contains degenerate P
3s and 3d conduction states resulting in a greater fine structure being observed in the P L2,3-edge
spectrum.
3.3.2.3 RE L3-edge XANES
The local structure of the RE (RE = Sm, Gd, Dy) ions in materials adopting the rhabdophane-type
structure were studied as a function of temperature by studying the RE L3-edge XANES spectra.
97
Figure 3.8 P L2,3-edge XANES spectra from DyPO4.H2O annealed to 600°C, 800°C, and 1100°C
along with the spectrum from the as-synthesized material.
136 138 140 142 144 146
Energy (eV)
1100°C
800°C
600°C
As-synthesized
(E
) DyPO4.H2O
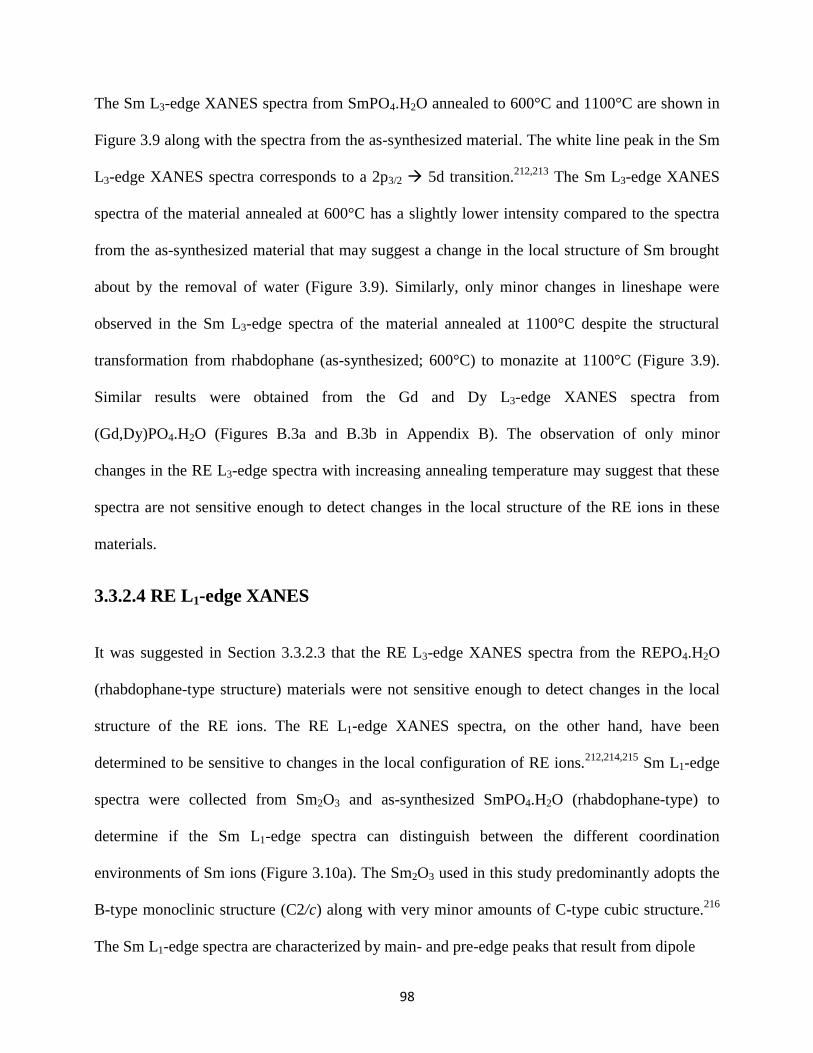
98
The Sm L3-edge XANES spectra from SmPO4.H2O annealed to 600°C and 1100°C are shown in
Figure 3.9 along with the spectra from the as-synthesized material. The white line peak in the Sm
L3-edge XANES spectra corresponds to a 2p3/2 5d transition.212,213
The Sm L3-edge XANES
spectra of the material annealed at 600°C has a slightly lower intensity compared to the spectra
from the as-synthesized material that may suggest a change in the local structure of Sm brought
about by the removal of water (Figure 3.9). Similarly, only minor changes in lineshape were
observed in the Sm L3-edge spectra of the material annealed at 1100°C despite the structural
transformation from rhabdophane (as-synthesized; 600°C) to monazite at 1100°C (Figure 3.9).
Similar results were obtained from the Gd and Dy L3-edge XANES spectra from
(Gd,Dy)PO4.H2O (Figures B.3a and B.3b in Appendix B). The observation of only minor
changes in the RE L3-edge spectra with increasing annealing temperature may suggest that these
spectra are not sensitive enough to detect changes in the local structure of the RE ions in these
materials.
3.3.2.4 RE L1-edge XANES
It was suggested in Section 3.3.2.3 that the RE L3-edge XANES spectra from the REPO4.H2O
(rhabdophane-type structure) materials were not sensitive enough to detect changes in the local
structure of the RE ions. The RE L1-edge XANES spectra, on the other hand, have been
determined to be sensitive to changes in the local configuration of RE ions.212,214,215
Sm L1-edge
spectra were collected from Sm2O3 and as-synthesized SmPO4.H2O (rhabdophane-type) to
determine if the Sm L1-edge spectra can distinguish between the different coordination
environments of Sm ions (Figure 3.10a). The Sm2O3 used in this study predominantly adopts the
B-type monoclinic structure (C2/c) along with very minor amounts of C-type cubic structure.216
The Sm L1-edge spectra are characterized by main- and pre-edge peaks that result from dipole
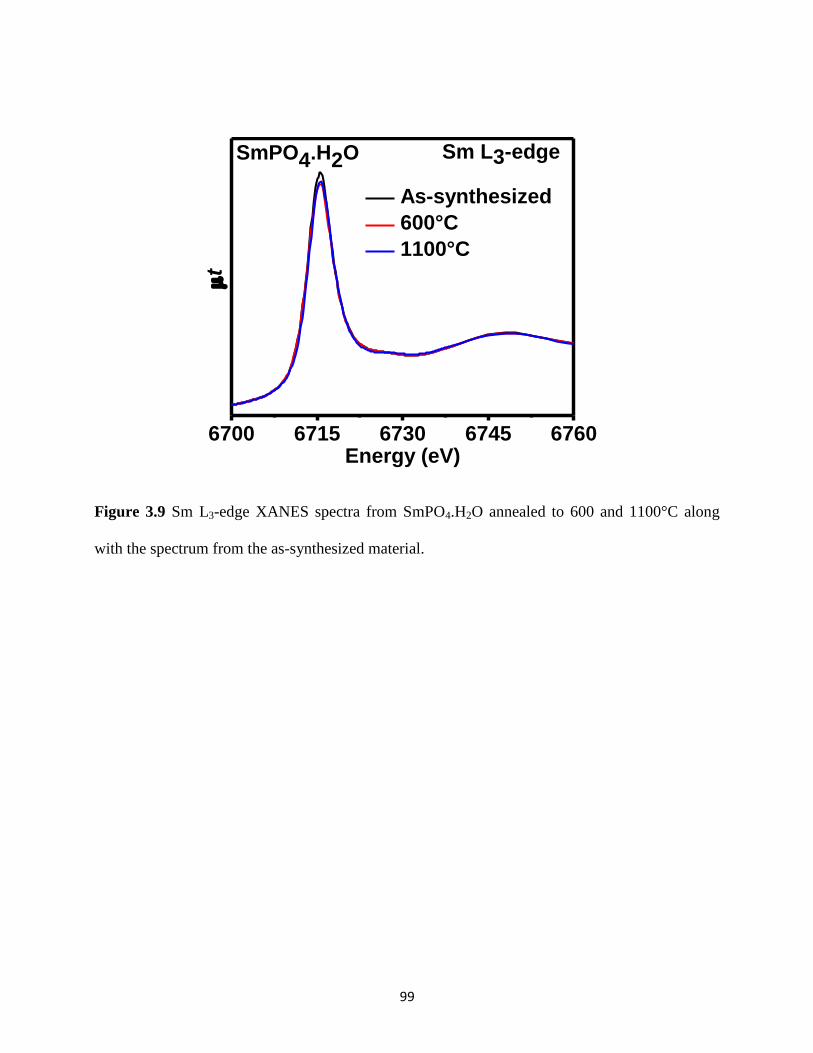
99
Figure 3.9 Sm L3-edge XANES spectra from SmPO4.H2O annealed to 600 and 1100°C along
with the spectrum from the as-synthesized material.
6700 6715 6730 6745 6760Energy (eV)
As-synthesized
600°C
1100°C
Sm L3-edge
t
SmPO4.H2O

100
7730 7750 7770 7790 7810
Energy (eV)
1100°C
600°C
As-synthesized
Sm2O3
Sm L1-edge
SmPO4.H2O
t
(a)
9040 9060 9080 9100 9120
Energy (eV)
Dy L1-edge
t
1100°C
600°C
As-synthesized
DyPO4.H2O
(c)
8370 8390 8410 8430 8450
Energy (eV)
1100°C
600°C
As-synthesized
t
(b) Gd L1-edge
GdPO4.H2O
Figure 3.10 Sm L1-edge XANES spectra from SmPO4.H2O annealed to 600 and 1100°C are
shown in (a) along with the spectrum from Sm2O3 and the as-synthesized material. The Gd L1-
edge XANES spectra from GdPO4.H2O annealed to 600 and 1100°C are shown in (b) along with
the spectrum from as-synthesized material. The Dy L1-edge XANES spectra from DyPO4.H2O
annealed to 600 and 1100°C are shown in (c) along with the spectrum from the as-synthesized
material.
101
allowed 2s 6p transitions and 2s 6p-5d transitions, respectively (Figure 3.10a). The pre-
edge peak arises as a result of the overlap of Sm 6p and 5d states which is in turn made possible
due to the presence of distorted SmOn (n = 6 - 9) polyhedra in Sm2O3 and SmPO4.H2O.160,161
It
should be noted that the pre-edge feature in Sm2O3 is more intense when compared to
SmPO4.H2O and thereby reflects the greater extent of overlap between the Sm 6p and 5d states in
Sm2O3. Overall, the Sm L1-edge spectrum from Sm2O3 (coordination number = 6 & 7) exhibited
a unique lineshape in comparison to the spectrum from SmPO4.H2O (coordination number = 8 &
9) which confirms that these spectra are sensitive to changes in the coordination environment of
RE ions.
The RE (RE = Sm, Gd, Dy) L1-edge XANES spectra were collected from REPO4.H2O (RE
= Sm, Gd, Dy) to analyze the changes in the local structure of the RE ion with increasing
annealing temperature (Figure 3.10). Minor differences in the RE L1-edge spectral lineshape were
observed between the as-synthesized materials and the materials annealed at 600°C (Figure 3.10).
This observation indicates that the local structure of the RE (RE = Sm, Gd, Dy) ions is only
slightly affected by the removal of water from the rhabdophane-type structure. At 1100°C, the
rhabdophane-type structure transforms to the monazite- (SmPO4, GdPO4) or xenotime- (DyPO4)
type structure and is accompanied by a significant change in the RE L1-edge spectral lineshape
(Figure 3.10). In comparison to the spectra from as-synthesized REPO4.H2O (RE = Sm, Gd), the
RE L1-edge spectra from REPO4 (RE = Sm, Gd; monazite-type structure) exhibited greater fine
structure suggesting a greater number of degenerate RE 6p conduction states in materials
adopting the monazite structure compared to the rhabdophane-type structure (Figures 3.10a and
3.10b). This change in lineshape could be explained by analysis of crystal structures of
rhabdophane and monazite. The rhabdophane structure contains six distinct RE ions and the

102
corresponding REOn (n = 8 or 9) polyhedra formed by each of these RE ions having unique RE-
O bond distances.126
In contrast, the monazite-type structure only has one distinct REO9
polyhedra; however, the 9 RE-O bond lengths are different from each other.135
It is proposed here
that the REO9 polyhedra in the monazite-type structure are less distorted than the REOn (n = 8 or
9) polyhedra in the rhabdophane-type structure, resulting in a greater number of degenerate RE
6p conduction states in materials that adopt the monazite-type structure.
The Dy L1-edge spectrum from DyPO4 is structurally rich as indicated by the appearance of
a much more pronounced fine-structure when compared to the spectrum from SmPO4 or GdPO4
(cf. Figure 3.10). This observation can be explained by comparing the monazite and xenotime
crystal structures (Figures 1.3a and 1.3b). In the xenotime structure, the RE ions are coordinated
to 8 O atoms and the resulting REO8 polyhedra are symmetrical (2 distinct RE-O bond distances)
when compared to the REO9 polyhedra present in the monazite structure (Figures 1.3a and 1.3b).
As a result, the degeneracy of the RE 6p conduction states in the xenotime structure increases
resulting in distinct fine-structure being observed in the Dy L1-edge spectrum from DyPO4
(Figure 3.10c). From this study, the degeneracy of RE 6p conduction states can be arranged in the
following order: rhabdophane (most distorted REOn [n = 8 or 9] polyhedra) < monazite <
xenotime (least distorted REO8 polyhedra).
Yb L1-edge XANES spectra were collected from YbPO4.H2O (xenotime-type) to examine
how the annealing temperature influences the local structure of Yb (Figure 3.11). The Yb L1-edge
spectrum from the as-synthesized material has a slightly lower main-edge intensity compared to
the spectrum from the materials annealed at 600°C and 1200°C (Figure 3.11). This observation
indicates a slight distortion of the Yb coordination environment in the as-synthesized material
caused by the presence of water. Upon annealing the as-synthesized material to 600°C and
103
Figure 3.11 Yb L1-edge XANES spectra from YbPO4.H2O annealed to 600 and 1200°C along
with the spectrum from the as-synthesized material. The arrow indicates an increase in the Yb L1
main-edge intensity with increasing annealing temperature.
10480 10500 10520 10540 10560
Energy (eV)
t
1200°C
600°C
As-synthesized
Yb L1-edge
Xenotime
YbPO4.H2O
104
1200°C, a slight increase in the main-edge intensity (~10502 eV) was observed that indicates an
ordering of the local environment around the Yb3+
ion created by the combined effects of high
temperature annealing as well as the removal of water (Figure 3.11).
3.4. Conclusion
This study has provided detailed insights into the long-range and local structures of rare-earth
phosphates adopting multiple structures. Examination of powder XRD data from rhabdophane-
type DyPO4.H2O has confirmed that this material adopts the monoclinic crystal system.
Temperature-induced structural variations of the rhabdophane- and xenotime- type structure were
also studied using TGA, powder XRD, and XANES. Powder XRD results have shown that the
anhydrous rhabdophane structure can only be stabilized over a limited temperature range (e.g.,
700°C<T<800°C) whereas the xenotime-type structure was stable at all temperatures studied
despite the removal of water. The local structural changes that occur upon removal of water from
the rhabdophane- and xenotime- type structures were studied by collection of P K-, P L2,3-, RE
L1-, and L3-edge XANES spectra. The XANES studies have shown that the local symmetry of
the PO4 tetrahedra and RE-O polyhedra in REPO4.H2O materials are modified by the removal of
water. The relationship between the three rare-earth phosphates structures (rhabdophane-,
monazite-, and xenotime-type structures) was also established in this study. This study, for the
first time, has shown how the local structure of REPO4.H2O varies as a function of temperature
and composition which will therefore aid in the optimization of these materials for photonics,
biolabeling, catalytic, and nuclear wasteform applications.
105
Chapter 4
PROBING THE EFFECT OF RADIATION
DAMAGE ON THE STRUCTURE OF RARE-
EARTH PHOSPHATES3
4.1 Introduction
Chapters 2 and 3 of this thesis provided a fundamental understanding of the crystal and electronic
structures of anhydrous and hydrous rare-earth phosphate materials. The work presented in
Chapter 3 has shown that the hydrous rare-earth phosphates adopting the rhabdophane structure
are metastable as revealed by their structural transformation at higher temperatures. In order for a
crystalline material to be initially considered for nuclear wasteform applications, the material of
interest must be structurally stable at higher temperatures. This is because actinide incorporated
nuclear wasteforms will be exposed to high temperatures caused due to actinide decay and
storage of wasteforms in geological repositories. The metastable nature of rhabdophane-type
3 Reprinted in part from Journal of Alloys and Compounds, 653, M. R. Rafiuddin, A. P. Grosvenor “Probing the
effect of radiation damage on the structure of rare-earth phosphates”, 279 – 289, 2015, with permission from
Elsevier.
106
materials makes them unsuitable for nuclear wasteform applications; however, as has been shown
in Chapters 2 and 3, the anhydrous rare-earth phosphates adopting the monazite- or xenotime-
type structures are stable at higher temperatures. Another criterion that must be considered when
developing materials as nuclear wasteforms is their resistance to potential structural damage
events caused by the radioactive decay of incorporated actinides. This chapter addresses this
criterion by determining the structural response of monazite- and xenotime-type rare-earth
phosphates to simulated radiation conditions.
Single- and multi-phase crystalline ceramics that are resistant to radiation damage have
been proposed as candidate materials for encapsulating radioactive waste.61,217,218
In this regard,
monazite and xenotime are considered as host-matrices for nuclear waste because of the ability of
these structures to contain actinide elements.89,121
The crystal structures of the monazite- and
xenotime-type rare-earth phosphates are presented in Figures 1.3a and 1.3b and a detailed
discussion of these structure types was provided in Section 1.5.1. An actinide element
incorporated in a crystalline ceramic can undergo a radioactive decay process during which it
may (depending upon the decay process) transform into a new radionuclide by releasing a high-
energy α-particle.78
Because of this decay, the crystalline host matrix could experience structural
damage either from the recoil energy associated with the daughter product (recoil atom)
radionuclide and/or from the highly energetic α-particle.78
Therefore, an issue surrounding
actinide containing crystalline ceramics is the tendency of these materials to undergo a radiation-
induced crystalline to amorphous transition in a process called metamiction.107
A description of
the radiation damage process in nuclear wasteforms and its consequences was provided in
Section 1.4.
107
Numerous investigations on the structural stability of natural as well as synthetic monazite
samples are reported in the literature.89,104,106,120,122,123,219
The structural stability of synthetic
monazite samples have been studied either by doping monazite ceramics with actinides (internal
irradiation) or by simulating the long-term actinide storage by implantation of the material using
high-energy ion beams (external irradiation).89,104,107,124,125,223
Since many actinides have a very
long half-life, the structural stability of a crystalline wasteform is most often determined by ion-
implantation.106
Heavy ions (such as Au-, Kr
+, and Ar
+) are generally used to simulate the effects
of the daughter product on the crystal structure of a proposed wasteform.89,93,123,162
In an early
study on the radiation resistance of the monazite structure, Karioris et al. showed the monazite
structure to be unstable towards heavy ion-implantation; however, they also showed that the
damaged monazite structure could be converted back to its original crystalline state after
annealing the irradiated material to ~296°C for 20 hours.122
In another study, Meldrum et al.
experimentally determined the critical amorphization temperature (Tc; i.e., the temperature above
which the material does not undergo metamiction) of a variety of ion-implanted ternary
monazite- and xenotime-type orthophosphates and found the monazite structure to have a lower
Tc than the xenotime structure.89
This observation could suggest that the monazite structure is
more resistant to radiation damage than the xenotime structure.89
In a more recent study,
Deschanels et al. performed thermal annealing experiments on Au- ion-implanted monazite
ceramics and studied them using transmission electron microscopy (TEM).106
It was shown in
this study that complete recrystallization of metamict monazite occurred after annealing the
material to 300°C for 1 hour.106
In addition to observing annealing-induced recrystallization,
Deschanels et al. also observed the recrystallization of amorphous regions in damaged monazite
samples under the influence of an electron beam.106
A theoretical study of the radiation resistance
of xenotime (YPO4) by Urusov et al. shed light on the ability of recoil atoms to bring about a
108
cascade of atomic displacements in this structure.220
Immediately after the creation of a cascade
of atomic displacements, some of the displaced atoms returned to their original crystallographic
positions which led to the partial recovery of the xenotime structure.220
The design of new crystalline wasteforms that are resistant to radiation damage requires
a detailed understanding of the electronic structure of a material before and after exposure to
radiation. In this context, the electronic structure was studied using X-ray absorption near-edge
spectroscopy (XANES) as it provides information on the local coordination environment,
oxidation state, and bonding environment of the absorbing atom.221
In Chapter 2, the electronic
structure of La1-xYbxPO4, La1-xYxPO4, and Sm1-xHoxPO4 were studied using XANES. It was
shown in this study that the P K-edge XANES spectra provide a spectroscopic fingerprint for the
monazite and xenotime structures because of the distinct change in spectral lineshape and
absorption energy observed between the two structures.
The effect of Au- ion-implantation on the structure of La1-xYbxPO4 is discussed in this
chapter. The La and Yb end-members crystallize in either the monoclinic monazite (x = 0) or
tetragonal xenotime (x = 1) structure, respectively. At all other values of ‘x’, a mixture of both
monazite and xenotime phases exist, which allows for an investigation of co-mineralized
samples. The Au- ions used in the study were implanted in the near-surface region of these
materials which required the use of surface-sensitive glancing angle XANES (GA-XANES) and
micro X-ray diffraction (µ-XRD) to investigate the effect of ion-implantation on the local and
long range structure of these materials. The extent of structural damage in La1-xYbxPO4 was
studied as a function of depth by varying the X-ray angle of incidence during the GA-XANES
experiments. This study has allowed for a detailed comparison of the response of the monazite
and xenotime structure to ion-implantation. Although GA-XANES has been utilized in
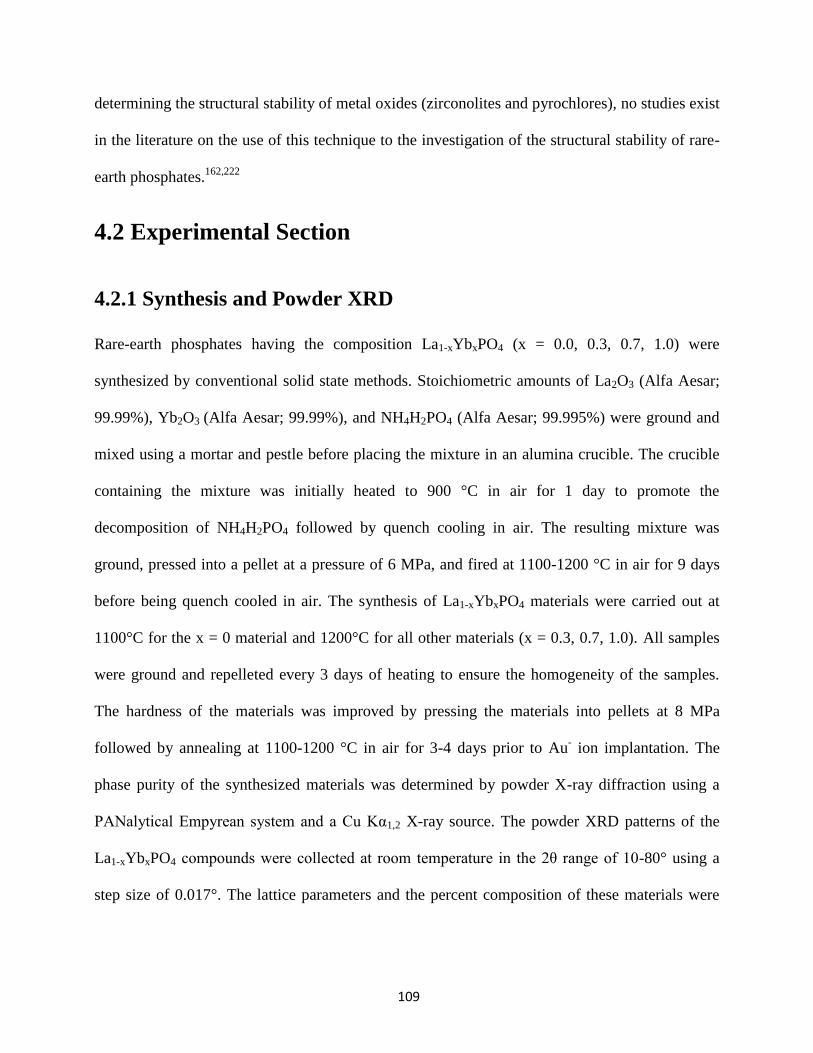
109
determining the structural stability of metal oxides (zirconolites and pyrochlores), no studies exist
in the literature on the use of this technique to the investigation of the structural stability of rare-
earth phosphates.162,222
4.2 Experimental Section
4.2.1 Synthesis and Powder XRD
Rare-earth phosphates having the composition La1-xYbxPO4 (x = 0.0, 0.3, 0.7, 1.0) were
synthesized by conventional solid state methods. Stoichiometric amounts of La2O3 (Alfa Aesar;
99.99%), Yb2O3 (Alfa Aesar; 99.99%), and NH4H2PO4 (Alfa Aesar; 99.995%) were ground and
mixed using a mortar and pestle before placing the mixture in an alumina crucible. The crucible
containing the mixture was initially heated to 900 °C in air for 1 day to promote the
decomposition of NH4H2PO4 followed by quench cooling in air. The resulting mixture was
ground, pressed into a pellet at a pressure of 6 MPa, and fired at 1100-1200 °C in air for 9 days
before being quench cooled in air. The synthesis of La1-xYbxPO4 materials were carried out at
1100°C for the x = 0 material and 1200°C for all other materials (x = 0.3, 0.7, 1.0). All samples
were ground and repelleted every 3 days of heating to ensure the homogeneity of the samples.
The hardness of the materials was improved by pressing the materials into pellets at 8 MPa
followed by annealing at 1100-1200 °C in air for 3-4 days prior to Au- ion implantation. The
phase purity of the synthesized materials was determined by powder X-ray diffraction using a
PANalytical Empyrean system and a Cu Kα1,2 X-ray source. The powder XRD patterns of the
La1-xYbxPO4 compounds were collected at room temperature in the 2θ range of 10-80° using a
step size of 0.017°. The lattice parameters and the percent composition of these materials were

110
determined using the HighScore Plus software program.178
The sample plate was continuously
rotated to avoid preferential orientation effects during data collection.
4.2.2 Ion Beam Implantation
Ion beam implantation experiments were carried out using the 1.7 MeV high-current Tandetron
accelerator located at Interface Science Western (ISW), the University of Western Ontario. La1-
xYbxPO4 (x = 0.0, 0.3, 0.7, 1.0) pellets were implanted with 2 MeV Au- ions to a dose of 1x10
14,
5x10¹⁴
, or 1x10¹⁵
ions/cm2 in order to simulate structural damage resulting from the decay of
radioactive elements. The surface of the pellets was aligned normal to the incident Au- ion beam
for ion implantation. The ion-implanted La1-xYbxPO4 samples were also annealed at temperatures
lower than the synthesis temperature to examine if the structure of the material was able to
recover. The annealing experiments were performed by heating the ion-implanted La1-xYbxPO4
materials to 300°C or 900°C in air for 3 days.
The ion beam implantation depth profiles of La1-xYbxPO4, and the corresponding number of
vacancies generated per nanometer by the Au- ions, were calculated using the Stopping and
Range of Ions in Matter (SRIM-2013) software package.223
The calculations were performed
using a total of 5000 Au- ions and the displacement energies of the target atoms La, Yb, and P
were assumed to be 25 eV and the displacement energy of O was assumed to be 28 eV.223
The
real values of the displacement energies for the target atoms (La, Yb, P, and O) are unknown so
the default displacement energy values from the SRIM software program were used during the
calculations.223,224
The densities of La1-xYbxPO4 (x = 0.0, 0.3, 0.7, 1.0) that were used in these
calculations were: 4.93 g/cm3, 5.87 g/cm
3, 6.20 g/cm
3, and 6.45 g/cm
3, respectively.
225,226 These
calculations have shown that the ions implant to a depth ranging between 50 and 450 nm with the
maximum number of implanted Au- ions being observed at ~275 nm (see Figure 4.1 and Figure
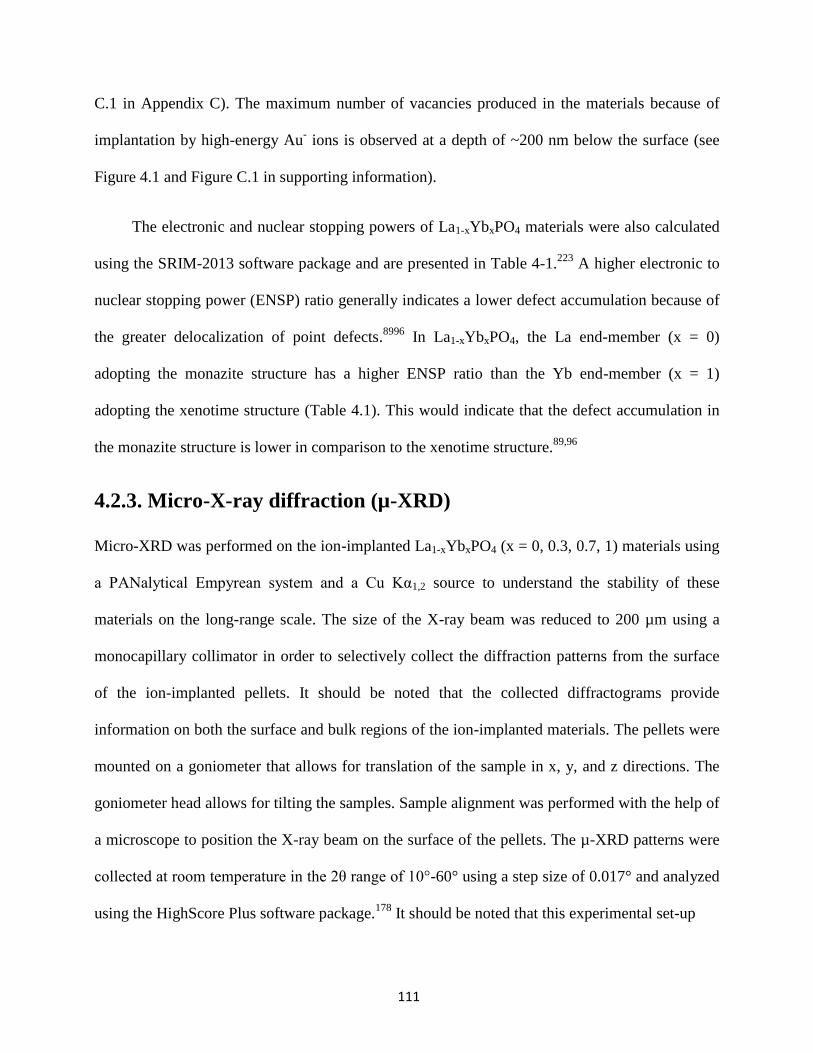
111
C.1 in Appendix C). The maximum number of vacancies produced in the materials because of
implantation by high-energy Au- ions is observed at a depth of ~200 nm below the surface (see
Figure 4.1 and Figure C.1 in supporting information).
The electronic and nuclear stopping powers of La1-xYbxPO4 materials were also calculated
using the SRIM-2013 software package and are presented in Table 4-1.223
A higher electronic to
nuclear stopping power (ENSP) ratio generally indicates a lower defect accumulation because of
the greater delocalization of point defects.8996
In La1-xYbxPO4, the La end-member (x = 0)
adopting the monazite structure has a higher ENSP ratio than the Yb end-member (x = 1)
adopting the xenotime structure (Table 4.1). This would indicate that the defect accumulation in
the monazite structure is lower in comparison to the xenotime structure.89,96
4.2.3. Micro-X-ray diffraction (µ-XRD)
Micro-XRD was performed on the ion-implanted La1-xYbxPO4 (x = 0, 0.3, 0.7, 1) materials using
a PANalytical Empyrean system and a Cu Kα1,2 source to understand the stability of these
materials on the long-range scale. The size of the X-ray beam was reduced to 200 µm using a
monocapillary collimator in order to selectively collect the diffraction patterns from the surface
of the ion-implanted pellets. It should be noted that the collected diffractograms provide
information on both the surface and bulk regions of the ion-implanted materials. The pellets were
mounted on a goniometer that allows for translation of the sample in x, y, and z directions. The
goniometer head allows for tilting the samples. Sample alignment was performed with the help of
a microscope to position the X-ray beam on the surface of the pellets. The µ-XRD patterns were
collected at room temperature in the 2θ range of 10°-60° using a step size of 0.017° and analyzed
using the HighScore Plus software package.178
It should be noted that this experimental set-up

112
Figure 4.1 Ion-implantation depth profile of La0.7Yb0.3PO4 (black) calculated using the SRIM-
2013 software package. A total of 5000 Au- ions having energy of 2 MeV was used during this
calculation. A plot depicting the number of vacancies generated by the Au- ions as a function of
depth is also presented.
Table 4-1 Calculated Electronic and Nuclear Stopping Powers for La1-xYbxPO4
Compound Crystal structure Electronic
stopping
power dE/dxe
(eV/nm)
Nuclear
stopping
power dE/dxn
(eV/nm)
Electronic to
Nuclear stopping
power ratio
(ENSP)
LaPO4 Monazite 2497 3873 0.645
La0.7Yb0.3PO4 Monazite+Xenotime 2747 4483 0.613
La0.3Yb0.7PO4 Monazite+Xenotime 2611 4571 0.571
YbPO4 Xenotime 2510 4639 0.541
50 150 250 350 450 550
Vacan
cie
s p
er A
u- io
ns
Target Depth (nm)
Au
- io
ns/c
m2
La0.7Yb0.3PO4
113
did not permit spinning of the sample during data collection and, therefore, preferential
orientation effects could be observed in the µ-XRD patterns.
4.2.4. XANES
4.2.4.1. P K- and La L3-edge GA-XANES
P K- and La L3-edge GA-XANES spectra from ion-implanted La1-xYbxPO4 were collected using
the Soft X-ray Microcharacterization Beamline (SXRMB; 06B1-1) located at the Canadian Light
Source (CLS).179
The ion-implanted pellets were mounted on carbon tape before being placed in
the vacuum chamber. The GA-XANES spectra were collected from the surface of the pellets by
allowing the X-rays to hit the sample surface at an angle greater than the critical angle for total
external reflection.169
Since the attenuation depths of X-rays depend strongly on the angle
between the X-ray beam and the sample surface, XANES spectra can be collected from different
regions of the material by tuning the X-ray angle of incidence. The X-ray attenuation depths, and
the corresponding glancing angles, for X-rays having energies equivalent to those of the P K- and
La L3-edge were calculated using a web-based program and are presented in Table 4-2.227
The
web-based program utilizes the Beer-Lambert law (Equation 1.1) to calculate the X-ray
attenuation depths.228
The P K- and La L3-edge GA-XANES spectra from the ion-implanted materials were
collected in partial fluorescent yield (PFY) mode and total electron yield (TEY) mode; however,
the TEY signal suffered from charging effects. An attempt was made to reduce charging effects
in the GA-XANES spectra collected in TEY mode by connecting the surface of the pellet to the
electrically grounded Cu sample holder using Ag paint. Nevertheless, the TEY signal from the P
K-edge spectra still exhibited signs of severe charging in this material. A moderate TEY signal
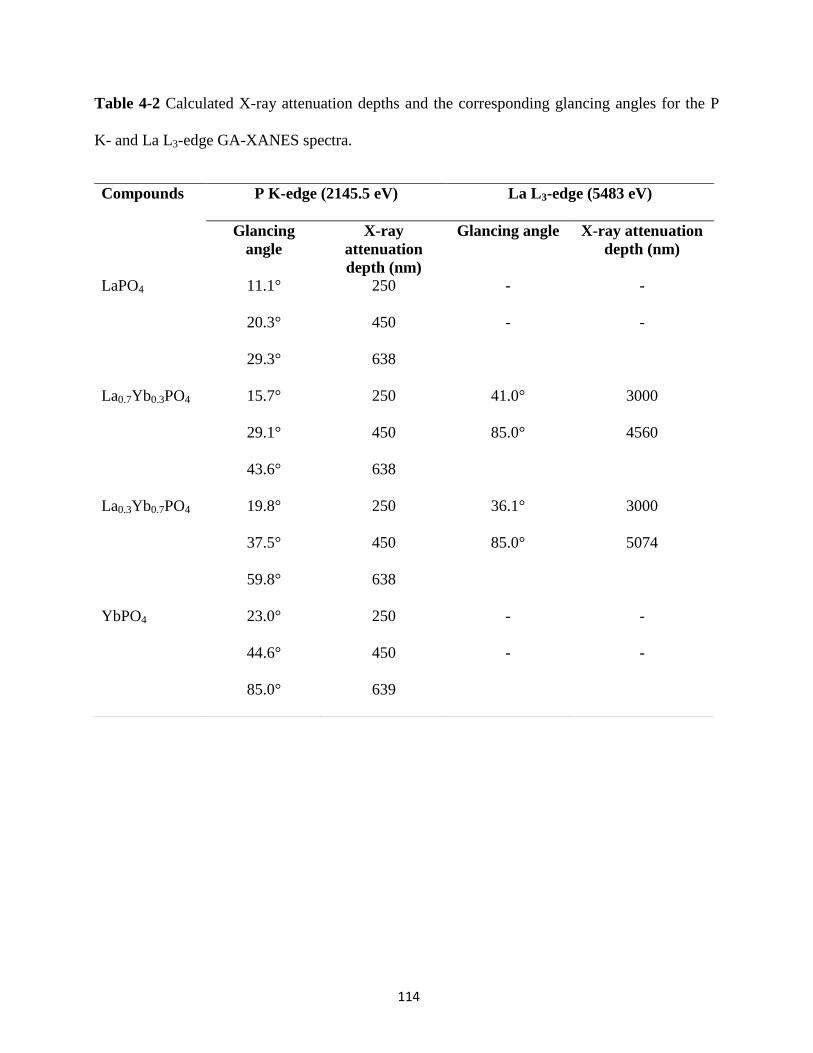
114
Table 4-2 Calculated X-ray attenuation depths and the corresponding glancing angles for the P
K- and La L3-edge GA-XANES spectra.
Compounds P K-edge (2145.5 eV) La L3-edge (5483 eV)
Glancing
angle
X-ray
attenuation
depth (nm)
Glancing angle X-ray attenuation
depth (nm)
LaPO4 11.1° 250 - -
20.3°
29.3°
450
638
- -
La0.7Yb0.3PO4 15.7° 250 41.0° 3000
29.1°
43.6°
450
638
85.0° 4560
La0.3Yb0.7PO4 19.8° 250 36.1° 3000
37.5°
59.8°
450
638
85.0° 5074
YbPO4 23.0° 250 - -
44.6°
85.0°
450
639
- -
115
was obtained for certain compositions in the case of the higher energy La L3-edge spectra. It
should be noted that the PFY signals from white-line La L3-edge spectra were distorted by
absorption effects so only the TEY spectra that were successfully collected were analyzed. P K-
edge spectra were calibrated by collecting the spectrum from red P (Alfa Aesar; 99%) with the
maximum in the first derivative of the P K-edge set to 2145.5 eV.180
La L3-edge XANES spectra
were calibrated using the spectrum from Cr metal by setting the maximum in the first derivative
of the Cr K-edge to 5989 eV.180
All XANES spectra were analyzed using the Athena software
program.181
4.2.4.2. P L2,3-edge XANES
P L2,3-edge XANES spectra were also collected from the ion-implanted La1-xYbxPO4 materials
using the Variable Line Spacing-Plane Grating Monochromator (VLS-PGM; 11ID-2) beamline
located at the CLS.182
The ion-implanted pellets were mounted on carbon tape and the spectra
were measured in vacuum in total fluorescence yield (TFY) mode. These spectra were not
collected using glancing angle geometry. The P L2,3-edge XANES spectra were calibrated using
red P, with the P L2,3-edge absorption energy set to 130 eV.
4.3. Results and discussion
4.3.1. Bulk and micro X-ray diffraction
Bulk powder XRD patterns from the as-synthesized La1-xYbxPO4 (x = 0.0, 0.3, 0.7, and 1.0)
materials are presented in Figure 4.2 along with the µ-XRD patterns from the Au- ion-implanted
La1-xYbxPO4 materials (doses: 1x10¹⁴
, 5x10¹⁴
, and 1x10¹⁵
ions/cm2). The end-members of the
La1-xYbxPO4 series adopt the lower symmetry monazite (x = 0) structure or the higher symmetry

116
15 20 25 30 35 40 45
2
Inte
nsit
y (
a.u
.)
*
As-synthesized
1x10¹⁴
ions/cm2
5x10¹⁴
ions/cm2
1x10¹⁵
ions/cm2La
0.3Yb
0.7PO
4(d)
15 20 25 30 35 40 452
Inte
nsit
y (
a.u
.)
As-synthesized
(c)
1x10¹⁴
ions/cm2
5x10¹⁴
ions/cm2
La0.7Yb0.3PO4 1x10¹⁵
ions/cm2
15 20 25 30 35 40 452
Inte
nsit
y (
a.u
.)
(b)
As-synthesized
1x10¹⁴
ions/cm2
5x10¹⁴
ions/cm2
1x10¹⁵
ions/cm2
YbPO4
(0 2 0)
15 20 25 30 35 40 452
Inte
nsit
y (
a.u
.)
As-synthesized
1x10¹⁵
ions/cm2LaPO4
(a) (0 2 -1)
Figure 4.2 µ-XRD patterns from (a) LaPO4, (b) YbPO4, (c) La0.7Yb0.3PO4, and (d) La0.3Yb0.7PO4
materials implanted with three different doses of Au- ions (1x10
14, 5x10
14, and 1x10
15 ions/cm
2)
are shown. Bulk powder XRD patterns from the as-synthesized materials are also shown. The dot
symbol in (b) indicates the presence of an anomalous peak. The peak labelled with an asterisk
symbol in (d) arises from both the monazite phase [(0 1 -2) peak] and unreacted Yb2O3 [(2 2 2)
peak]. Diffraction peaks from the impurity phase, Yb2O3 [(2 2 2) peak], observed in the pattern
from YbPO4 and La0.3Yb0.7PO4 are represented by a diamond symbol.

117
xenotime (x = 1) structure, respectively. It is to be noted that the powder XRD pattern of YbPO4
showed the presence of a minor amount of Yb2O3 (indicated by a diamond symbol in Figure
4.2b) in addition to the predominant xenotime phase. However, the presence of this low
concentration impurity does not impact the analysis of the XANES spectra. At intermediate
values of x (x = 0.3 and 0.7), the materials exist as a mixture of both the monazite and xenotime
phases. Information about the lattice constants and relative concentration of monazite and
xenotime phases were obtained from the Rietveld refined powder XRD data from La1-xYbxPO4
(Table C-1 in Appendix C). It was assumed in this study that the composition of the monazite
structure was LaPO4 while the composition of the xenotime structure was YbPO4 because of the
poor solubility of Yb in the monazite structure (and vice versa for La in the xenotime structure).
The general trend in the La1-xYbxPO4 series is that the relative concentration of the xenotime
structure increases with greater Yb concentration (see Table C-1 in the supporting information).
Powder patterns collected using the µ-XRD set-up from the ion-implanted materials
allowed for a qualitative examination of how the long-range structure of these materials was
affected by ion-implantation. In comparison to the powder XRD patterns from the as-synthesized
materials, the µ-XRD patterns from the ion-implanted La1-xYbxPO4 materials exhibited broader
diffraction peaks (Figure 4.2). This observation indicates that the structure of the materials was
damaged as a result of ion-implantation. The full width at half maximum (FWHM) values of the
(0 2 -1) and (0 2 0) reflections from the as-synthesized and ion-implanted La1-xYbxPO4 materials
are listed in Table 4.3. The (0 2 -1) peak is characteristic of the monazite phase while the (0 2 0)
peak is characteristic of the xenotime phase. The FWHM values of the characteristic peaks from
the as-synthesized compounds were obtained from the bulk powder XRD data. Diffraction peaks
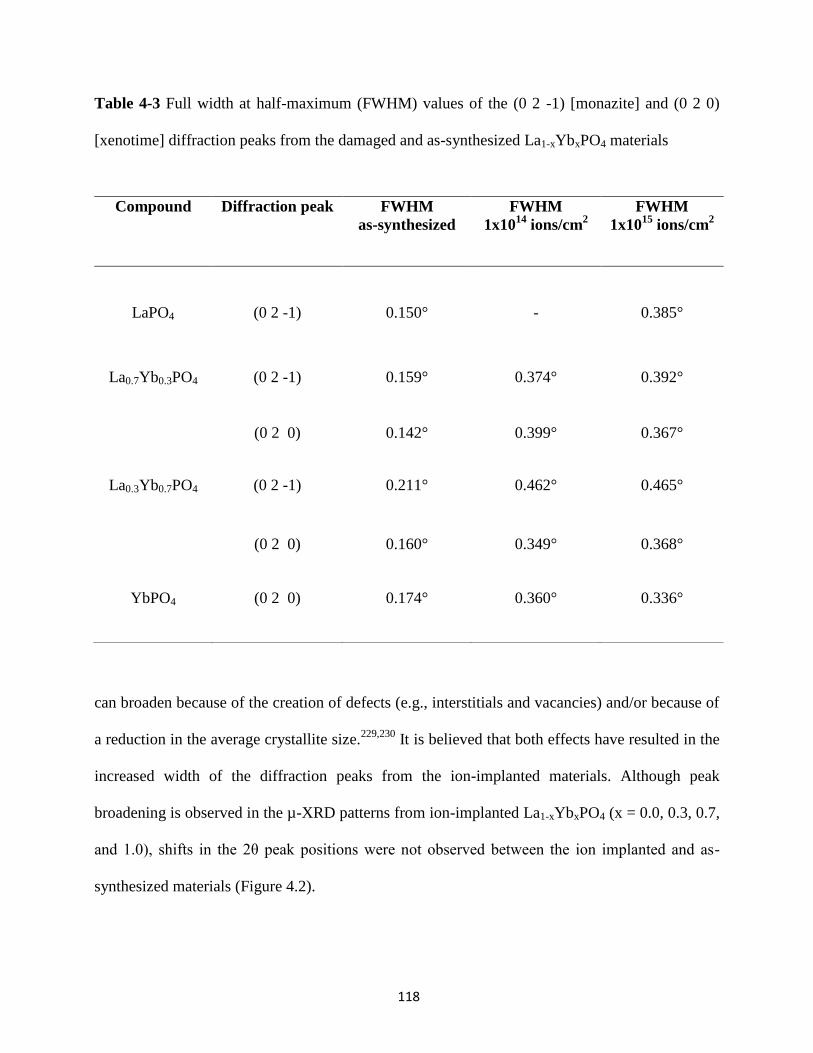
118
Table 4-3 Full width at half-maximum (FWHM) values of the (0 2 -1) [monazite] and (0 2 0)
[xenotime] diffraction peaks from the damaged and as-synthesized La1-xYbxPO4 materials
can broaden because of the creation of defects (e.g., interstitials and vacancies) and/or because of
a reduction in the average crystallite size.229,230
It is believed that both effects have resulted in the
increased width of the diffraction peaks from the ion-implanted materials. Although peak
broadening is observed in the µ-XRD patterns from ion-implanted La1-xYbxPO4 (x = 0.0, 0.3, 0.7,
and 1.0), shifts in the 2θ peak positions were not observed between the ion implanted and as-
synthesized materials (Figure 4.2).
Compound Diffraction peak FWHM
as-synthesized
FWHM
1x10¹⁴
ions/cm2
FWHM
1x10¹⁵
ions/cm2
LaPO4 (0 2 -1) 0.150° - 0.385°
La0.7Yb0.3PO4 (0 2 -1) 0.159° 0.374° 0.392°
(0 2 0) 0.142° 0.399° 0.367°
La0.3Yb0.7PO4 (0 2 -1) 0.211° 0.462° 0.465°
(0 2 0) 0.160° 0.349° 0.368°
YbPO4 (0 2 0) 0.174° 0.360° 0.336°

119
One of the 2θ peaks (marked with an asterisk symbol in Figure 4.2d) in the µ-XRD pattern
from La0.3Yb0.7PO4 that was implanted with ions to the highest dose (1x10¹⁵
ions/cm2) was
observed to be more intense in comparison to the diffraction pattern from La0.3Yb0.7PO4 that was
implanted to a lower dose. This observation may be attributed to preferential orientation effects
(Figure 4.2d). Examination of the µ-XRD pattern from YbPO4 that was implanted with ions at
the highest dose (1x10¹⁵
ions/cm2) revealed the presence of an anomalous peak (marked with a
dot symbol in Figure 4.2b). This peak is not due to the xenotime structure or any of the unreacted
starting materials and the underlying reason for the appearance of this peak is unknown.
4.3.2. P K-edge GA-XANES: Ion implanted La1-xYbxPO4
Normalized P K-edge XANES spectra that represent the transition of electrons from the P 1s state
to P 3p conduction states were collected from the ion-implanted La1-xYbxPO4 (x = 0.0, 0.3, 0.7,
1.0) materials at various glancing angles to study the extent of structural damage as a function of
depth, implantation dose (1x10¹⁴
, 5x10¹⁴
, and 1x10¹⁵
ions/cm2), and composition (Figures 4.3 to
4.6). The P K-edge spectra from the as-synthesized La1-xYbxPO4 materials are also included in
Figures 4.3 to 4.6.
The P K-edge GA-XANES spectra from ternary LaPO4 (monazite) implanted with Au- ions
to a dose of 5x10¹⁴
and 1x10¹⁵
ions/cm2 are presented in Figure 4.3. A significant change in the
spectral lineshape is observed as a result of ion-implantation and the glancing angle used to
collect the spectra; however, no significant differences in the spectra were observed depending on
ion dose. Relative to the spectra from as-synthesized LaPO4, the P K-edge spectra from the ion-
implanted materials clearly exhibit a loss of both intensity and fine structure. The near-edge
region of the spectra was broader as a result of ion-implantation, and it is proposed that this is
due to a distortion of the PO4 coordination environment (Figures 4.3a and 4.3b).
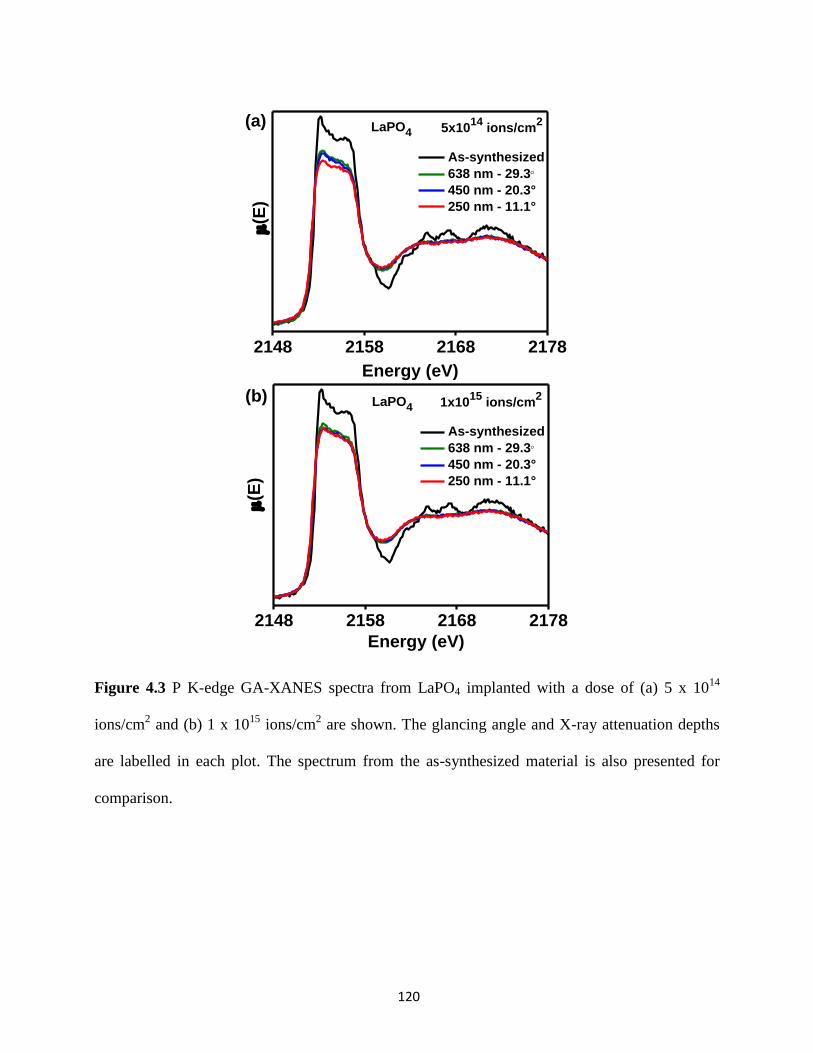
120
2148 2158 2168 2178
As-synthesized
638 nm - 29.3
450 nm - 20.3°
250 nm - 11.1°
Energy (eV)
LaPO4 1x10¹⁵
ions/cm2
(E
)
(b)
2148 2158 2168 2178
As-synthesized
638 nm - 29.3
450 nm - 20.3°
250 nm - 11.1°
Energy (eV)
(E
)
LaPO4 5x10¹⁴
ions/cm2(a)
Figure 4.3 P K-edge GA-XANES spectra from LaPO4 implanted with a dose of (a) 5 x 10¹⁴
ions/cm2 and (b) 1 x 10
15 ions/cm
2 are shown. The glancing angle and X-ray attenuation depths
are labelled in each plot. The spectrum from the as-synthesized material is also presented for
comparison.
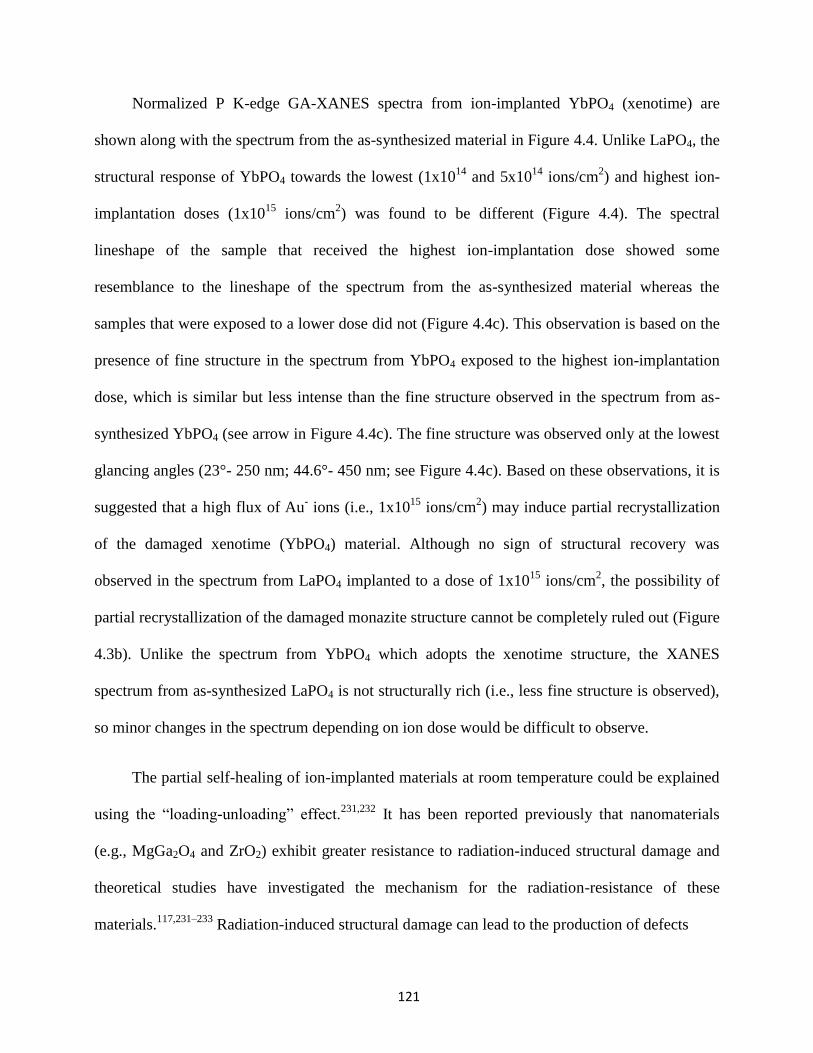
121
Normalized P K-edge GA-XANES spectra from ion-implanted YbPO4 (xenotime) are
shown along with the spectrum from the as-synthesized material in Figure 4.4. Unlike LaPO4, the
structural response of YbPO4 towards the lowest (1x10¹⁴
and 5x10¹⁴
ions/cm2) and highest ion-
implantation doses (1x10¹⁵
ions/cm2) was found to be different (Figure 4.4). The spectral
lineshape of the sample that received the highest ion-implantation dose showed some
resemblance to the lineshape of the spectrum from the as-synthesized material whereas the
samples that were exposed to a lower dose did not (Figure 4.4c). This observation is based on the
presence of fine structure in the spectrum from YbPO4 exposed to the highest ion-implantation
dose, which is similar but less intense than the fine structure observed in the spectrum from as-
synthesized YbPO4 (see arrow in Figure 4.4c). The fine structure was observed only at the lowest
glancing angles (23°- 250 nm; 44.6°- 450 nm; see Figure 4.4c). Based on these observations, it is
suggested that a high flux of Au- ions (i.e., 1x10
15 ions/cm
2) may induce partial recrystallization
of the damaged xenotime (YbPO4) material. Although no sign of structural recovery was
observed in the spectrum from LaPO4 implanted to a dose of 1x10¹⁵
ions/cm2, the possibility of
partial recrystallization of the damaged monazite structure cannot be completely ruled out (Figure
4.3b). Unlike the spectrum from YbPO4 which adopts the xenotime structure, the XANES
spectrum from as-synthesized LaPO4 is not structurally rich (i.e., less fine structure is observed),
so minor changes in the spectrum depending on ion dose would be difficult to observe.
The partial self-healing of ion-implanted materials at room temperature could be explained
using the “loading-unloading” effect.231,232
It has been reported previously that nanomaterials
(e.g., MgGa2O4 and ZrO2) exhibit greater resistance to radiation-induced structural damage and
theoretical studies have investigated the mechanism for the radiation-resistance of these
materials.117,231–233
Radiation-induced structural damage can lead to the production of defects
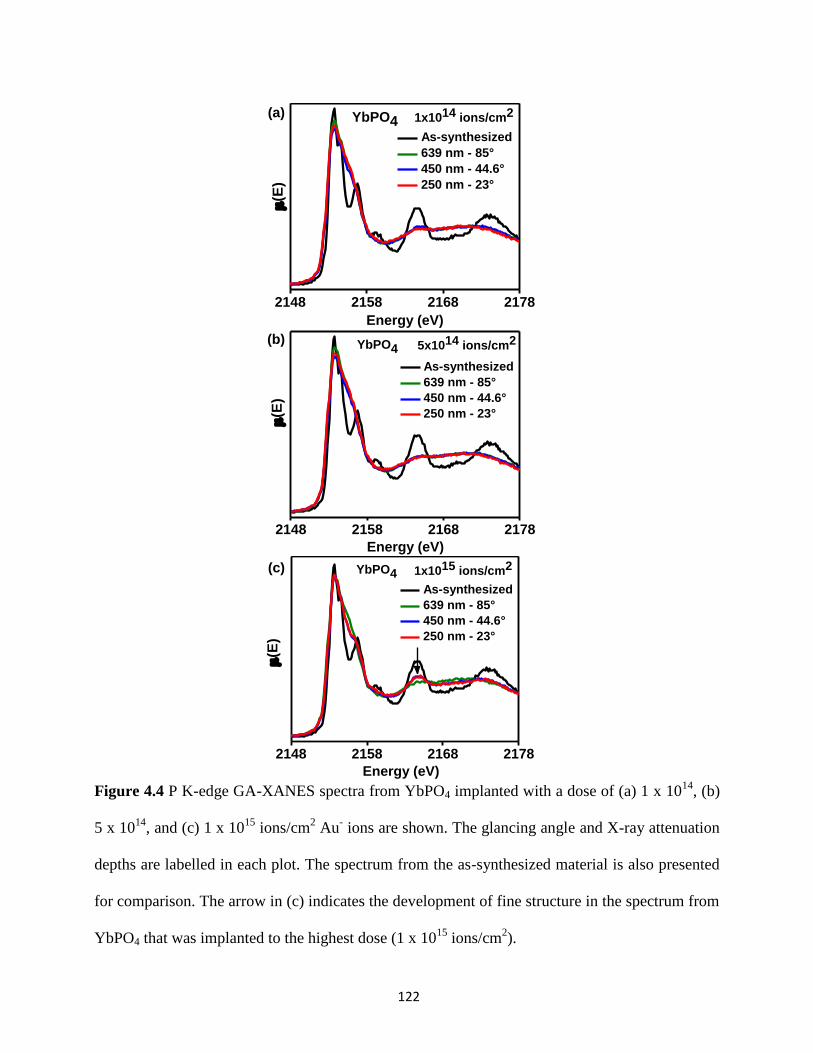
122
2148 2158 2168 2178
(E
)
YbPO4 5x10¹⁴ ions/cm2
As-synthesized
639 nm - 85°
450 nm - 44.6°
250 nm - 23°
Energy (eV)
(b)
2148 2158 2168 2178
(E
)
YbPO4 1x10¹⁵ ions/cm2
As-synthesized
639 nm - 85°
450 nm - 44.6°
250 nm - 23°
Energy (eV)
(c)
2148 2158 2168 2178
Energy (eV)
As-synthesized
639 nm - 85°
450 nm - 44.6°
250 nm - 23°
YbPO4 1x10¹⁴ ions/cm2
(E
)
(a)
Figure 4.4 P K-edge GA-XANES spectra from YbPO4 implanted with a dose of (a) 1 x 10¹⁴
, (b)
5 x 10¹⁴
, and (c) 1 x 10¹⁵
ions/cm2 Au
- ions are shown. The glancing angle and X-ray attenuation
depths are labelled in each plot. The spectrum from the as-synthesized material is also presented
for comparison. The arrow in (c) indicates the development of fine structure in the spectrum from
YbPO4 that was implanted to the highest dose (1 x 10¹⁵
ions/cm2).

123
such as interstitial atoms and vacancies.232,234
The grain boundaries present in the material traps
the interstitial atom and releases it when there are enough vacancies in the vicinity of the grain
boundary.231,232
In this way, the vacancies are annihilated and the material is able to self-heal
from structural damage.231,232
The high dose of Au- ions (1x10
15 ions/cm
2) that were used to
implant the YbPO4 material may have also resulted in local heating of the sample with the
accompanying rise in temperature providing enough energy for the movement of displaced atoms
and the partial recovery of the structure.235,236
P K-edge GA-XANES spectra were also collected from ion-implanted and as-synthesized
quaternary La1-xYbxPO4 (x = 0.3 and 0.7) materials to understand the effect of heavy/light rare-
earth substitution on the structural stability of monazite/xenotime structures (Figures 4.5 and 4.6).
The relative percent composition of monazite and xenotime phases in as-synthesized
La0.7Yb0.3PO4 (Monazite - 70%; Xenotime - 30%) and La0.3Yb0.7PO4 (Monazite - 25%; Xenotime
- 76%) compounds were determined previously by Rietveld refinement of powder XRD data as
well as from a linear combination fitting (LCF) of P K-edge XANES spectra. The P K-edge
XANES spectrum from as-synthesized La0.3Yb0.7PO4 exhibited more fine structure in comparison
to the spectrum from La0.7Yb0.3PO4 due to the higher concentration of the xenotime structure.
After ion-implantation, La0.7Yb0.3PO4 and La0.3Yb0.7PO4 were structurally damaged as observed
by changes in the spectral lineshape of the P K-edge spectra (Figure 4.5 and 4.6). Similar to
LaPO4, the P K-edge of ion-implanted La0.7Yb0.3PO4 did not exhibit a varied structural response
to different ion-implantation doses (Figure 4.5). However, the results obtained for ion-implanted
La0.3Yb0.7PO4 are similar to those obtained for ion-implanted YbPO4 (Figure 4.6). At the highest
dose (1x10¹⁵
ions/cm2), the Yb-rich compound exhibited signs of partial structural recovery as
indicated by the appearance of fine structure in the P K-edge spectra (see arrow in Figure 4.6c).

124
2148 2158 2168 2178
As-synthesized
638 nm - 43.6°
450 nm - 29.1°
250 nm - 15.7°
1x10¹⁵ ions/cm2
Energy (eV)
(E
)
La0.7Yb0.3PO4(c)
2148 2158 2168 2178
As-synthesized
638 nm - 43.6°
450 nm - 29.1°
250 nm - 15.7°
Energy (eV)
(E
)
La0.7Yb0.3PO4
5x10¹⁴ ions/cm2
(b)
2148 2158 2168 2178
As-synthesized
638 nm - 43.6°
450 nm - 29.1°
250 nm - 15.7°
Energy (eV)
(E
)
La0.7Yb0.3PO4
1x10¹⁴ ions/cm2
(a)
Figure 4.5 Normalized P K-edge GA-XANES spectra from La0.7Yb0.3PO4 implanted with Au-
ions to a dose of (a) 1x10¹⁴
, (b) 5x10¹⁴
, and (c) 1x10¹⁵
ions/cm2 are shown. The glancing angle
and resulting X-ray attenuation depths are labelled in each plot. The spectrum from the as-
synthesized material is also presented for comparison.
125
2148 2158 2168 2178
As-synthesized
638 nm - 59.8°
450 nm - 37.5°
250 nm - 19.8°
La0.3Yb0.7PO4
1x10¹⁵ ions/cm2
Energy (eV)
(c)
(E
)
2148 2158 2168 2178
As-synthesized
638 nm - 59.8°
450 nm - 37.5°
250 nm - 19.8°
La0.3Yb0.7PO4
5x10¹⁴ ions/cm2
Energy (eV)
(E
)
(b)
2148 2158 2168 2178
As-synthesized
638 nm - 59.8°
450 nm - 37.5°
250 nm - 19.8°
Energy (eV)
La0.3Yb0.7PO4
1x10¹⁴ ions/cm2
(E
)
(a)
Figure 4.6 P K-edge GA-XANES spectra from La0.3Yb0.7PO4 implanted with Au- ions to a dose
of (a) 1x10¹⁴
, (b) 5x10¹⁴
, and (c) 1x10¹⁵
ions/cm2 are shown. The glancing angle and X-ray
attenuation depths are labelled in each plot. The spectrum from the as-synthesized material is also
presented for comparison. The arrow in Figure 4.6c indicates the development of fine structure
after La0.3Yb0.7PO4 was implanted to the highest dose (1x10¹⁵
ions/cm2).
126
No signs of structural recovery were observed when La0.3Yb0.7PO4 was implanted to lower doses
(1x10¹⁴
and 5x10¹⁴
ions/cm2; Figures 4.6a and 4.6b).
4.3.3. P K-edge GA-XANES: Thermal annealing of ion implanted
La1-xYbxPO4
As described in Section 4.3.2, the La1-xYbxPO4 materials are not resistant to radiation-induced
structural damage. Actinides, in general, produce high levels of heat during the radioactive decay
process in addition to the production of high energy recoil daughter product nuclides and α-
particles.40,78
However, depending on the composition of the crystalline wasteform, the heat
released during the radioactive decay process could promote structural reorganization of the
damaged material.237
P K-edge GA-XANES spectra were collected from the ion-implanted La1-xYbxPO4 (x = 0.0,
0.3, 0.7, 1.0) materials after annealing them to 300° or 900° C to study the heat-induced recovery
process of these materials. (It should be noted that not all ion-implanted materials were implanted
to the same dose before annealing.) The P K-edge XANES spectra collected from the annealed
materials using the lowest glancing angles are shown in Figure 4.7. The P K-edge GA-XANES
spectra from ion-implanted LaPO4 before and after annealing to 300° or 900° C are shown in
Figure 4.7a along with the spectrum from as-synthesized LaPO4. The annealed ion-implanted
LaPO4 samples showed signs of partial structural recovery as indicated by the increase in
intensity and decrease in width of the near-edge region in comparison to the spectrum from ion-
implanted LaPO4. Although significant differences in the spectral lineshape were observed
between the ion-implanted and annealed ion-implanted LaPO4 materials, no major differences in
the spectra were observed between the two annealing temperatures (i.e., 300°C vs. 900°C).

127
2148 2158 2168 2178
As-synthesized
Annealed-900°C (250 nm)
Annealed-300°C (250 nm)
Before annealing (250 nm)
5x10¹⁴
ions/cm2La0.3Yb0.7PO4
Energy (eV)
(E
) (d)
2148 2158 2168 2178
Energy (eV)
As-synthesized
Annealed-900°C (250 nm)
Annealed-300°C (250 nm)
Before annealing (250 nm)
La0.7Yb0.3PO4 5x10¹⁴
ions/cm2
(E
)
(c)
2148 2158 2168 2178
As-synthesized
Annealed-900°C (250 nm)
Annealed-300°C (250 nm)
Before annealing (250 nm)
(E
)
Energy (eV)
1x10¹⁴
ions/cm2
YbPO4(b)
2148 2158 2168 2178
As-synthesized
Annealed-900°C (250 nm)
Annealed-300°C (250 nm)
Before annealing (250 nm)
Energy (eV)
LaPO4 1x10¹⁵
ions/cm2
(E
)
(a)
Figure 4.7 P K-edge GA-XANES spectra from ion-implanted (a) LaPO4 (1x10¹⁵
ions/cm2), (b)
YbPO4 (1x10¹⁴
ions/cm2), (c) La0.7Yb0.3PO4 (5x10
14 ions/cm
2), and (d) La0.3Yb0.7PO4 (5x10
14
ions/cm2) annealed at 300° and 900° C are shown along with the spectra from the as-synthesized
and ion-implanted La1-xYbxPO4 materials before annealing. Only the spectra collected from a
depth of 250 nm are shown.

128
The effect of temperature on the structural recovery of damaged YbPO4 was also studied
using P K-edge GA-XANES (Figure 4.7b). The spectrum from YbPO4 annealed at 300° C
revealed only minor indications of structural recovery. However, the structure of YbPO4 was
observed to recover to its original state after annealing the material to 900° C (see Figure 4.7b).
The difference in behaviour between LaPO4 and YbPO4 may be attributed to the LaPO4 sample
receiving a higher dose of ions as well as the different structures adopted by these materials. The
P K-edge GA-XANES spectra from the La0.7Yb0.3PO4 and La0.3Yb0.7PO4 materials that were ion-
implanted to the same dose (5x10¹⁴
ions/cm2) and then annealed also displayed signs of structural
recovery (Figures 4.7c and 4.7d). Had there been any surface segregation of phases in these
quaternary compounds it would be expected that only one phase would recover from the
structural damage. However, both the monazite and xenotime structures partially recover from
structural damage as indicated by the similarity of the spectral lineshape to that of the as-
synthesized material. The signs of recovery were more evident in the spectra from the ion-
implanted materials annealed at the highest temperature (900°C); however, structural recovery
was not complete. This conclusion is a result of the differences in the intensity of the P K-edge
GA-XANES spectra between the as-synthesized and annealed ion-implanted materials (See
Figures 4.7c and 4.7d).
4.3.4 P L2,3-edge XANES
The normalized P L2,3-edge XANES spectra from ion-implanted La1-xYbxPO4 are shown in
Figure 4.8 along with the spectra from the as-synthesized materials. The P L2,3-edge spectrum
generally represents the transition of electrons from the P 2p state to P 3s and 3d conduction
states.238
In Chapter 2, the two distinct features observed in the P L2,3-edge spectra from as-
synthesized La1-xYbxPO4 (A and B) were assigned to the transition of P 2p electrons into the

129
overlapping P 3s and 3d states. Similar to P K-edge GA-XANES spectra, the P L2,3-edge spectra
were observed to be sensitive to changes in the local coordination environment of P as a result of
ion-implantation. Relative to the as-synthesized materials, the lineshape of the spectra from the
ion-implanted La1-xYbxPO4 (x = 0, 0.3, 0.7, 1.0) materials changed significantly (see Figure 4.8).
The increased broadness of the spectra from the ion-implanted materials implies that the
degeneracy of the P conduction states is lost as a result of ion-implantation.
The P L2,3-edge spectra from the ion-implanted La1-xYbxPO4 (x = 0.3 and 0.7) materials
that were annealed at 300° and 900°C are shown in Figure 4.9. The near-edge region in the P
L2,3-edge spectra from the ion-implanted La1-xYbxPO4 (x = 0.3 and 0.7) materials becomes
narrower with increasing annealing temperature, which is a result of the partial recovery of the
structure of these materials. Considerable differences in the spectral lineshape were observed
between the two annealing temperatures and it was observed that the spectral lineshape of ion-
implanted La0.7Yb0.3PO4 and La0.3Yb0.7PO4 annealed at the highest temperature (900° C) closely
resembled that of the as-synthesized material (Figure 4.9). These observations are in agreement
with those obtained by the examination of the P K-edge GA-XANES spectra from the annealed
ion-implanted materials (See Section 4.3.3).
4.3.5. La L3-edge XANES
La L3-edge GA-XANES spectra were collected from the ion-implanted La1-xYbxPO4 materials to
examine changes in the local coordination environment of La. The La L3-edge partial fluorescent
yield (PFY) spectra were distorted because of severe absorption effects so the total electron yield
(TEY) mode was the preferred method of detection.239,240
The TEY La L3-edge XANES spectra
from the ion-implanted La0.7Yb0.3PO4 and La0.3Yb0.7PO4 materials are shown in Figure 4.10
along with the spectra from the as-synthesized materials. The white-line feature in the La L3-edge
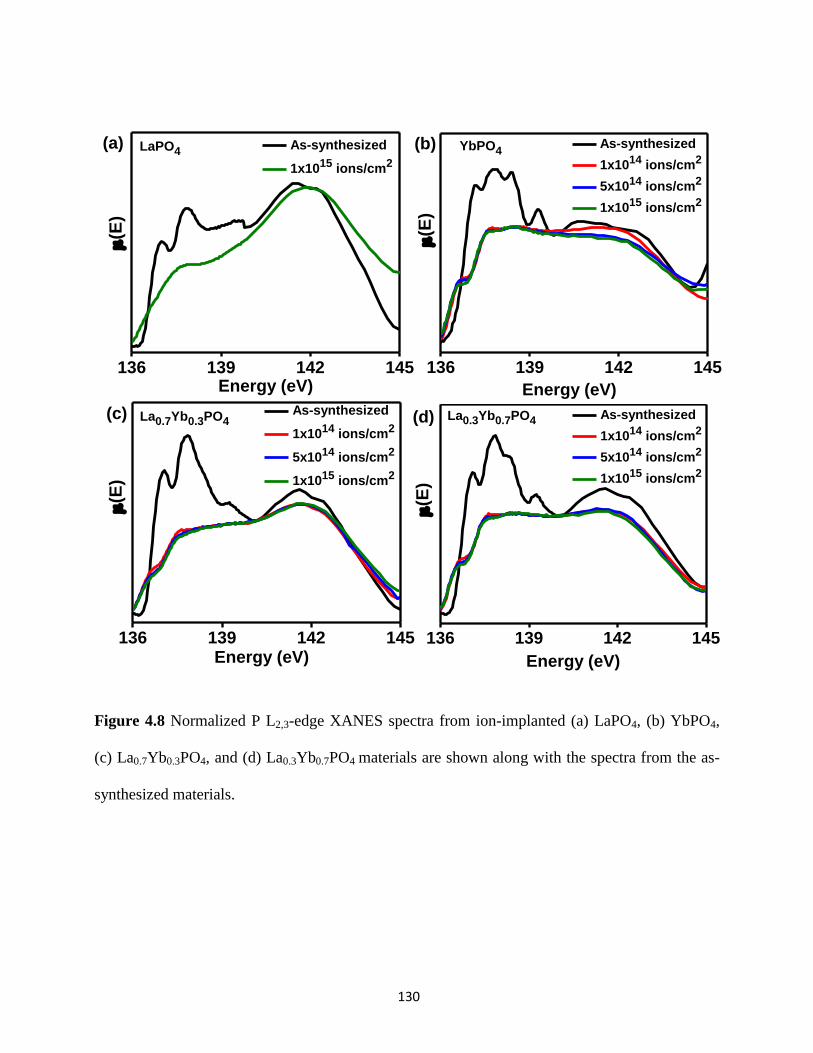
130
136 139 142 145
(d)
(E
)
Energy (eV)
As-synthesized
1x10¹⁴ ions/cm2
5x10¹⁴ ions/cm2
1x10¹⁵ ions/cm2
La0.3Yb0.7PO4
136 139 142 145
(E
)
Energy (eV)
As-synthesized
1x10¹⁴ ions/cm2
5x10¹⁴ ions/cm2
1x10¹⁵ ions/cm2
(c) La0.7Yb0.3PO4
136 139 142 145
(E
)
Energy (eV)
As-synthesized
1x10¹⁴ ions/cm2
5x10¹⁴ ions/cm2
1x10¹⁵ ions/cm2
(b) YbPO4
136 139 142 145
(E
)
Energy (eV)
As-synthesized
1x10¹⁵ ions/cm2
(a) LaPO4
Figure 4.8 Normalized P L2,3-edge XANES spectra from ion-implanted (a) LaPO4, (b) YbPO4,
(c) La0.7Yb0.3PO4, and (d) La0.3Yb0.7PO4 materials are shown along with the spectra from the as-
synthesized materials.
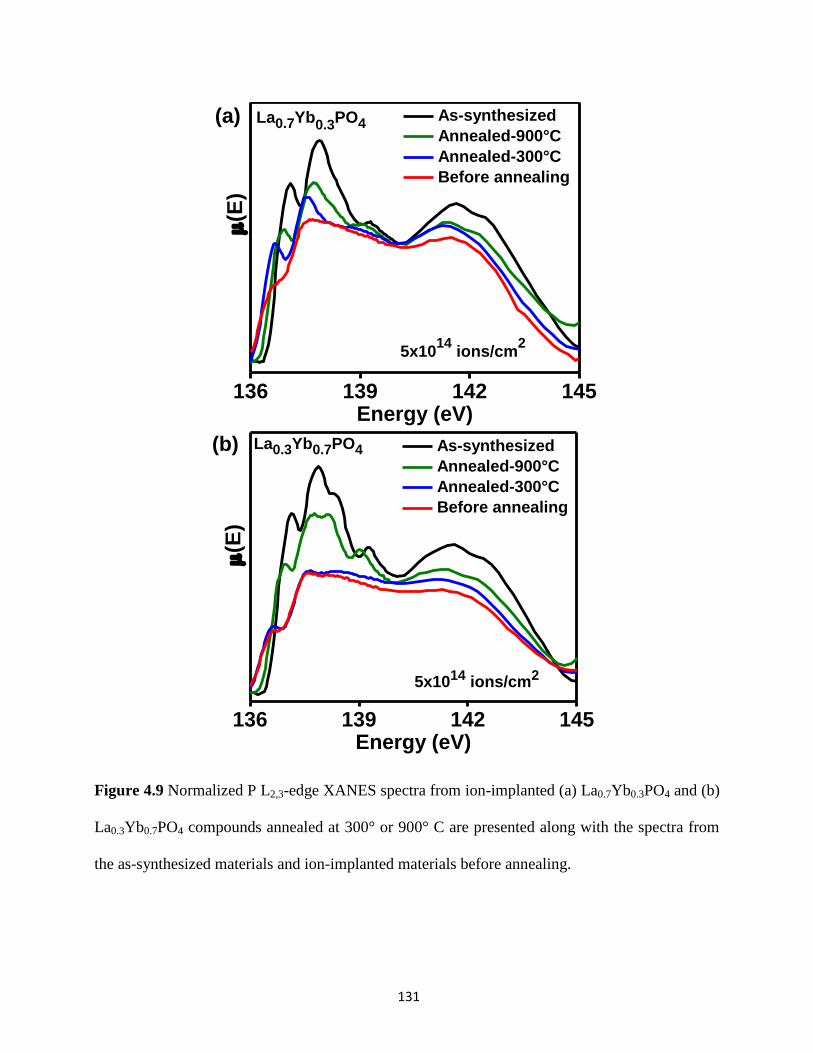
131
136 139 142 145
(E
)
Energy (eV)
As-synthesized
Annealed-900°C
Annealed-300°C
Before annealing
5x10¹⁴ ions/cm2
(b) La0.3Yb0.7PO4
136 139 142 145
(E
)
Energy (eV)
As-synthesized
Annealed-900°C
Annealed-300°C
Before annealing
5x10¹⁴
ions/cm2
(a) La0.7Yb0.3
PO4
Figure 4.9 Normalized P L2,3-edge XANES spectra from ion-implanted (a) La0.7Yb0.3PO4 and (b)
La0.3Yb0.7PO4 compounds annealed at 300° or 900° C are presented along with the spectra from
the as-synthesized materials and ion-implanted materials before annealing.
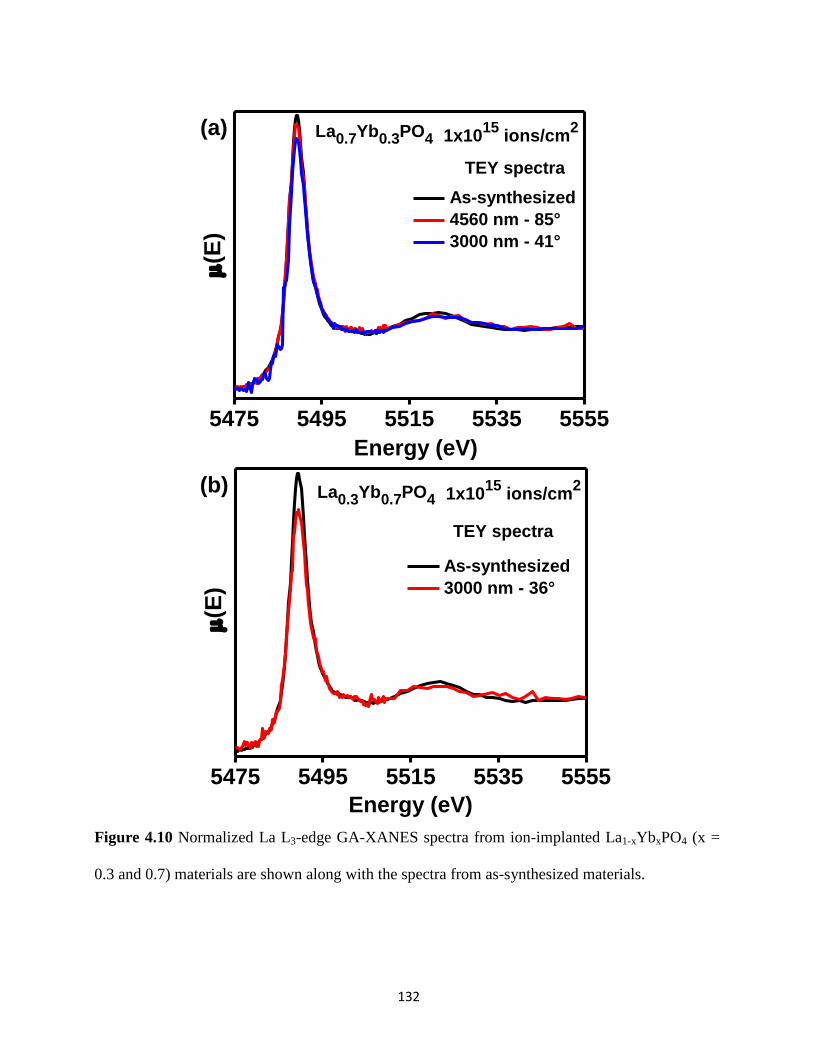
132
5475 5495 5515 5535 5555
Energy (eV)
As-synthesized
3000 nm - 36°
La0.3Yb0.7PO4 1x10¹⁵
ions/cm2
TEY spectra
(E
)
(b)
5475 5495 5515 5535 5555
As-synthesized
4560 nm - 85°
3000 nm - 41°
Energy (eV)
1x10¹⁵
ions/cm2La0.7Yb0.3PO4
TEY spectra
(E
)
(a)
Figure 4.10 Normalized La L3-edge GA-XANES spectra from ion-implanted La1-xYbxPO4 (x =
0.3 and 0.7) materials are shown along with the spectra from as-synthesized materials.
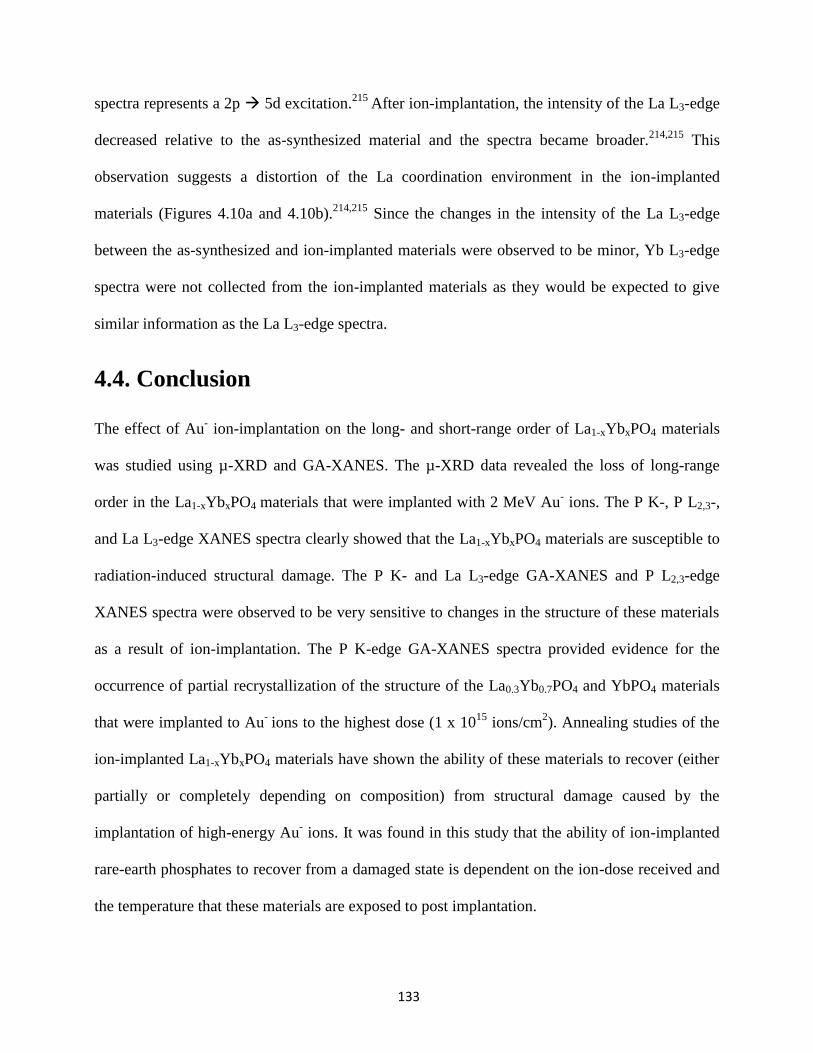
133
spectra represents a 2p 5d excitation.215
After ion-implantation, the intensity of the La L3-edge
decreased relative to the as-synthesized material and the spectra became broader.214,215
This
observation suggests a distortion of the La coordination environment in the ion-implanted
materials (Figures 4.10a and 4.10b).214,215
Since the changes in the intensity of the La L3-edge
between the as-synthesized and ion-implanted materials were observed to be minor, Yb L3-edge
spectra were not collected from the ion-implanted materials as they would be expected to give
similar information as the La L3-edge spectra.
4.4. Conclusion
The effect of Au- ion-implantation on the long- and short-range order of La1-xYbxPO4 materials
was studied using µ-XRD and GA-XANES. The µ-XRD data revealed the loss of long-range
order in the La1-xYbxPO4 materials that were implanted with 2 MeV Au- ions. The P K-, P L2,3-,
and La L3-edge XANES spectra clearly showed that the La1-xYbxPO4 materials are susceptible to
radiation-induced structural damage. The P K- and La L3-edge GA-XANES and P L2,3-edge
XANES spectra were observed to be very sensitive to changes in the structure of these materials
as a result of ion-implantation. The P K-edge GA-XANES spectra provided evidence for the
occurrence of partial recrystallization of the structure of the La0.3Yb0.7PO4 and YbPO4 materials
that were implanted to Au- ions to the highest dose (1 x 10
15 ions/cm
2). Annealing studies of the
ion-implanted La1-xYbxPO4 materials have shown the ability of these materials to recover (either
partially or completely depending on composition) from structural damage caused by the
implantation of high-energy Au- ions. It was found in this study that the ability of ion-implanted
rare-earth phosphates to recover from a damaged state is dependent on the ion-dose received and
the temperature that these materials are exposed to post implantation.
134
Chapter 5
A SHORT TERM INVESTIGATION OF THE
CHEMICAL DURABILITY OF HYDROUS AND
ANHYDROUS RARE-EARTH PHOSPHATES
5.1 Introduction
In Chapters 2 and 3, fundamental structural aspects of hydrous and anhydrous rare-earth
phosphates were discussed and in Chapter 4, the structural stability of monazite- and xenotime-
type materials when exposed to simulated radiation conditions was determined. For permanent
disposal of nuclear waste elements, the wasteforms are packed within multiple containers, which
are intended for storage in a deep geological repository.40,49,50,53
However, under a failed
container situation the wasteforms could be exposed to groundwater present in the geological
repository. In this scenario, the radionuclides contained in a wasteform could leach out of the
material and reach the biosphere through groundwater migration.23
Materials proposed for
nuclear wasteform applications must be leach resistant in addition to being radiation resistant.
The current chapter is focused on determining the chemical durability of hydrous and anhydrous
rare-earth phosphate materials in deionized water so as to understand the leaching behaviour of
these materials.

135
Rare-earth phosphates adopting the monazite- (REPO4; RE = La - Gd) and xenotime-type
(RE’PO4; RE’ = Tb - Lu & Y) structures are considered as promising materials for the
immobilization of actinides and several studies in relation to the structure and properties of these
materials have been reported in the literature.78,88,89,121,190
Leaching studies of synthetic and
natural monazite samples under basic conditions have shown that the surface of the monazite can
be chemically altered to produce a hydrous layer adopting the rhabdophane (REPO4.nH2O; RE =
La - Dy) structure.126,128–132
This hydrous rare-earth phosphate mineral (rhabdophane) is expected
to play a vital role in controlling or stopping the release of actinides from monazite.126
The crystal
structures of materials adopting monazite- (CePO4; space group - P21/n), xenotime- (YPO4; space
group - I41/amd), and rhabdophane-(SmPO4.0.667H2O; space group - C2) type structures are
presented in Figures 1.3 and 1.4.126,135
Leaching studies of nuclear wasteforms are generally carried out using standard protocols
such as the materials characterization center tests (MCC), the single-pass flow through tests
(SPFT), the product consistency tests (PCT), or the international atomic energy agency (IAEA)
tests.241–244
These leaching tests can be conducted in either static or dynamic conditions.245
Under
static conditions, the leachant solution which is in contact with the wasteform, is partially
withdrawn from the test vessel at regular intervals of time and these tests mimic the low flow-
rates of groundwater in geological repositories.245
Under dynamic leaching conditions, the
leachant solution is completely withdrawn and replaced with fresh solution at regular time
intervals.245
As a result, dynamic leaching tests will prevent the formation of any secondary
phases on the surface of wasteform and provide an accurate picture of the leaching behavior of a
wasteform.245
With the exception of a few studies, leaching studies on rare-earth phosphate based
wasteforms reported in the literature have been focused mostly on materials adopting the

136
monazite-type structure.245–249
Early investigations into the leaching behaviour of glass and
monazite based wasteforms in deionized water have revealed that the monazite matrix is
chemically more durable when compared to borosilicate glass.250
Therefore, monazite ceramics
serve as a potential alternative to borosilicate glass wasteforms used for immobilization of
nuclear wastes.250
The objective of this chapter was to conduct a investigation (short-term) of the chemical
durability of monazite- (LaPO4), xenotime- (YbPO4), and rhabdophane- (GdPO4.nH2O) type
materials in deionized water. The concentration of RE and P ions in the solution was determined
using inductively coupled plasma – mass spectrometry (ICP-MS). The long-range and local
structures of REPO4 and REPO4.H2O materials before and after exposure to deionized water was
studied using X-ray diffraction (XRD) and X-ray absorption near-edge spectroscopy (XANES),
respectively. Information regarding the local structure around P and RE ions was obtained by
analysis of P K-, P L2,3-, and RE L1-edge XANES spectra. This is the first study to compare the
leaching behaviour of monazite-, xenotime-, and rhabdophane-type rare-earth phosphates.
5.2. Experimental
5.2.1. Synthesis
The rare-earth phosphates adopting the monazite- (LaPO4), xenotime- (YbPO4), and
rhabdophane- (GdPO4.H2O) type structures were synthesized using the procedure discussed in
Chapters 2 and 3. The REPO4.H2O (RE = La, Yb, Gd) materials was synthesized using a
precipitation route as described in Chapter 3. The as-synthesized precipitates were filtered using a
Grade 42 Whatman quantitative filter paper (pore size – 2.5 µm) and washed with large volumes
of water to remove any soluble impurities. The as-synthesized precipitates were dried in air for 1
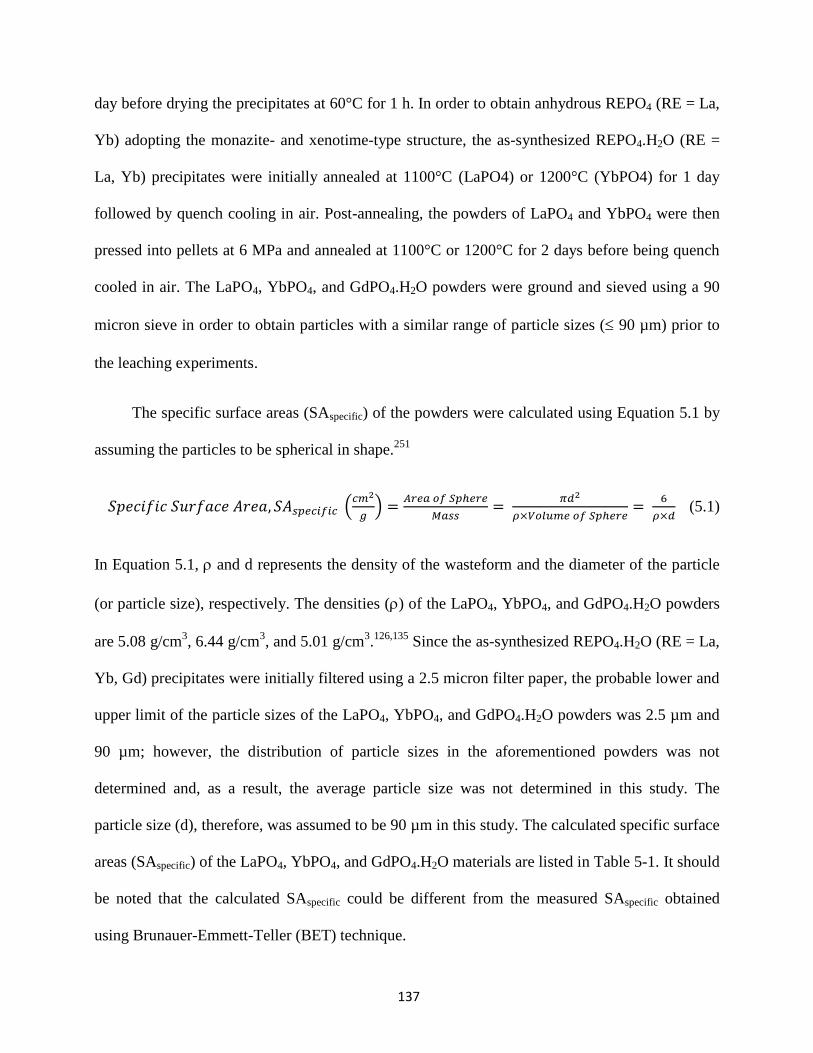
137
day before drying the precipitates at 60°C for 1 h. In order to obtain anhydrous REPO4 (RE = La,
Yb) adopting the monazite- and xenotime-type structure, the as-synthesized REPO4.H2O (RE =
La, Yb) precipitates were initially annealed at 1100°C (LaPO4) or 1200°C (YbPO4) for 1 day
followed by quench cooling in air. Post-annealing, the powders of LaPO4 and YbPO4 were then
pressed into pellets at 6 MPa and annealed at 1100°C or 1200°C for 2 days before being quench
cooled in air. The LaPO4, YbPO4, and GdPO4.H2O powders were ground and sieved using a 90
micron sieve in order to obtain particles with a similar range of particle sizes ( 90 µm) prior to
the leaching experiments.
The specific surface areas (SAspecific) of the powders were calculated using Equation 5.1 by
assuming the particles to be spherical in shape.251
𝑆𝑝𝑒𝑐𝑖𝑓𝑖𝑐 𝑆𝑢𝑟𝑓𝑎𝑐𝑒 𝐴𝑟𝑒𝑎, 𝑆𝐴𝑠𝑝𝑒𝑐𝑖𝑓𝑖𝑐 (𝑐𝑚2
𝑔) =
𝐴𝑟𝑒𝑎 𝑜𝑓 𝑆𝑝ℎ𝑒𝑟𝑒
𝑀𝑎𝑠𝑠=
𝜋𝑑2
𝜌×𝑉𝑜𝑙𝑢𝑚𝑒 𝑜𝑓 𝑆𝑝ℎ𝑒𝑟𝑒=
6
𝜌×𝑑 (5.1)
In Equation 5.1, and d represents the density of the wasteform and the diameter of the particle
(or particle size), respectively. The densities () of the LaPO4, YbPO4, and GdPO4.H2O powders
are 5.08 g/cm3, 6.44 g/cm
3, and 5.01 g/cm
3.126,135
Since the as-synthesized REPO4.H2O (RE = La,
Yb, Gd) precipitates were initially filtered using a 2.5 micron filter paper, the probable lower and
upper limit of the particle sizes of the LaPO4, YbPO4, and GdPO4.H2O powders was 2.5 µm and
90 µm; however, the distribution of particle sizes in the aforementioned powders was not
determined and, as a result, the average particle size was not determined in this study. The
particle size (d), therefore, was assumed to be 90 µm in this study. The calculated specific surface
areas (SAspecific) of the LaPO4, YbPO4, and GdPO4.H2O materials are listed in Table 5-1. It should
be noted that the calculated SAspecific could be different from the measured SAspecific obtained
using Brunauer-Emmett-Teller (BET) technique.
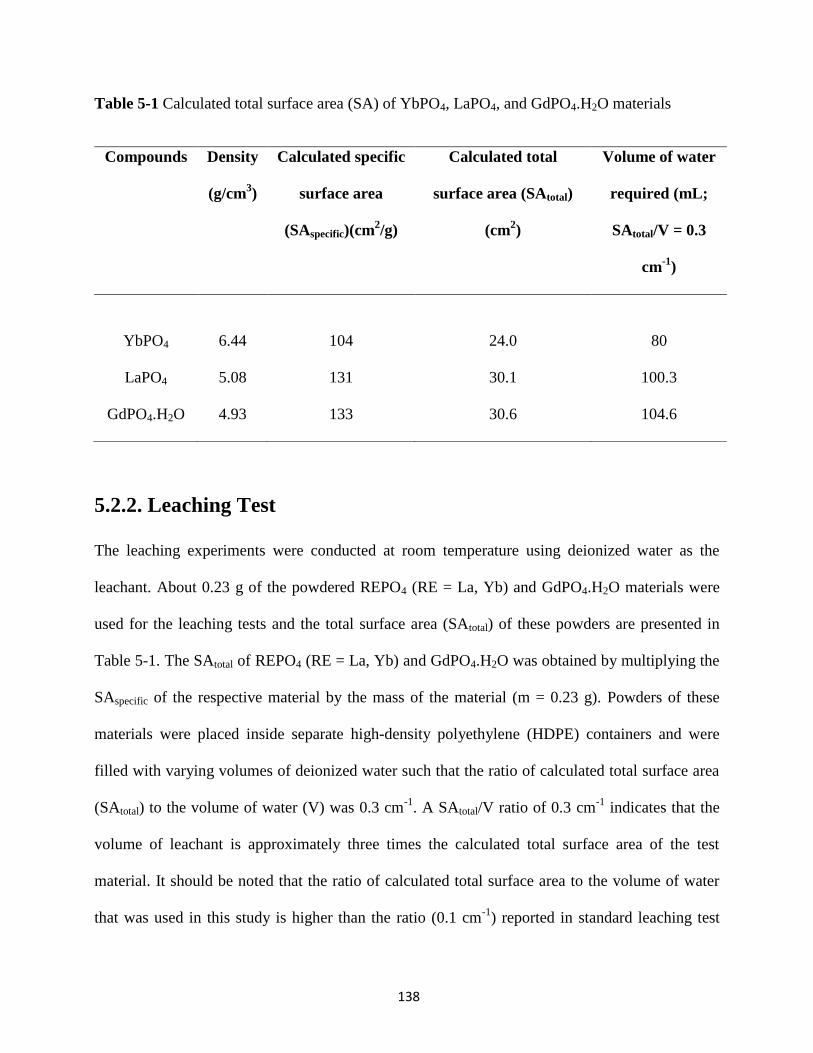
138
Table 5-1 Calculated total surface area (SA) of YbPO4, LaPO4, and GdPO4.H2O materials
5.2.2. Leaching Test
The leaching experiments were conducted at room temperature using deionized water as the
leachant. About 0.23 g of the powdered REPO4 (RE = La, Yb) and GdPO4.H2O materials were
used for the leaching tests and the total surface area (SAtotal) of these powders are presented in
Table 5-1. The SAtotal of REPO4 (RE = La, Yb) and GdPO4.H2O was obtained by multiplying the
SAspecific of the respective material by the mass of the material (m = 0.23 g). Powders of these
materials were placed inside separate high-density polyethylene (HDPE) containers and were
filled with varying volumes of deionized water such that the ratio of calculated total surface area
(SAtotal) to the volume of water (V) was 0.3 cm-1
. A SAtotal/V ratio of 0.3 cm-1
indicates that the
volume of leachant is approximately three times the calculated total surface area of the test
material. It should be noted that the ratio of calculated total surface area to the volume of water
that was used in this study is higher than the ratio (0.1 cm-1
) reported in standard leaching test
Compounds Density
(g/cm3)
Calculated specific
surface area
(SAspecific)(cm2/g)
Calculated total
surface area (SAtotal)
(cm2)
Volume of water
required (mL;
SAtotal/V = 0.3
cm-1
)
YbPO4 6.44 104 24.0 80
LaPO4 5.08 131 30.1 100.3
GdPO4.H2O 4.93 133 30.6 104.6

139
methods.261
According to standard leaching protocols, the volume of leachant must be ten times
the total surface area of the specimen. Using this ratio would mean that large volumes of water
are required for conducting leaching studies and this requirement places a limit on the type of
wasteform that can be studied. For wasteforms that possess very low leach rates, the
concentration of the leached elements in the solution will be very low; hence, in order to generate
measurable solution concentration of the leached elements, ratios higher than 0.1 cm-1
are
generally used. The volumes of deionized water required to fill the HDPE vessels containing the
REPO4 (RE = La, Yb) and GdPO4.H2O materials are listed in Table 5-1.
Two series of leaching experiments were conducted in order to analyze the leaching
behaviour of rare-earth phosphates in deionized water, and to determine the effect of leaching on
the long-range and local structure of the test materials. In the first set of leaching experiments, the
leaching behaviour was studied by performing triplicate experiments on each test material under
semi-static conditions in which 5 mL of the leachant solution was withdrawn from the test vessel
according to the schedule shown in Table 5-2 and renewed with the same volume of fresh
deionized water. Each test vessel was shaken manually once every day during the entire three
month period in order to speed up the leaching process. After stirring, the solution was left
undisturbed until the solids settled. The withdrawn leachant solution was tested for the presence
of RE (RE = La, Yb, Gd) and P ions using an ICP-MS instrument (Perkin Elmer NexION 300D)
located in the Aqueous Geochemistry Laboratory, Department of Geological Sciences, University
of Saskatchewan (Saskatoon, Canada). It should be noted that the withdrawn leachant solution
was not filtered prior to ICP-MS analysis. The ICP-MS data was collected from the leachant
solution over a period of two months. The instrumental detection limits for the P, La, Gd, and Yb
ions in solution are 100 ppb, 0.40 ppb, 1.00 ppb, and 0.04 ppb, respectively. ICP-MS analysis
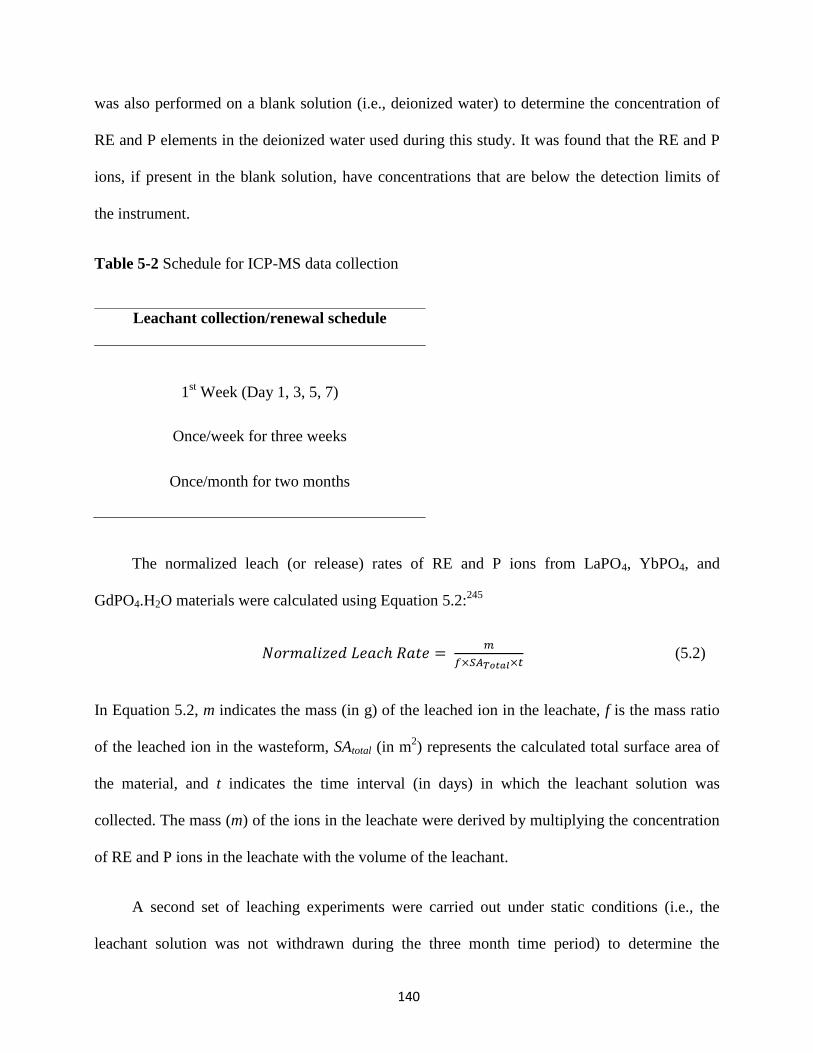
140
was also performed on a blank solution (i.e., deionized water) to determine the concentration of
RE and P elements in the deionized water used during this study. It was found that the RE and P
ions, if present in the blank solution, have concentrations that are below the detection limits of
the instrument.
Table 5-2 Schedule for ICP-MS data collection
The normalized leach (or release) rates of RE and P ions from LaPO4, YbPO4, and
GdPO4.H2O materials were calculated using Equation 5.2:245
𝑁𝑜𝑟𝑚𝑎𝑙𝑖𝑧𝑒𝑑 𝐿𝑒𝑎𝑐ℎ 𝑅𝑎𝑡𝑒 = 𝑚
𝑓×𝑆𝐴𝑇𝑜𝑡𝑎𝑙×𝑡 (5.2)
In Equation 5.2, m indicates the mass (in g) of the leached ion in the leachate, f is the mass ratio
of the leached ion in the wasteform, SAtotal (in m2) represents the calculated total surface area of
the material, and t indicates the time interval (in days) in which the leachant solution was
collected. The mass (m) of the ions in the leachate were derived by multiplying the concentration
of RE and P ions in the leachate with the volume of the leachant.
A second set of leaching experiments were carried out under static conditions (i.e., the
leachant solution was not withdrawn during the three month time period) to determine the
Leachant collection/renewal schedule
1st Week (Day 1, 3, 5, 7)
Once/week for three weeks
Once/month for two months
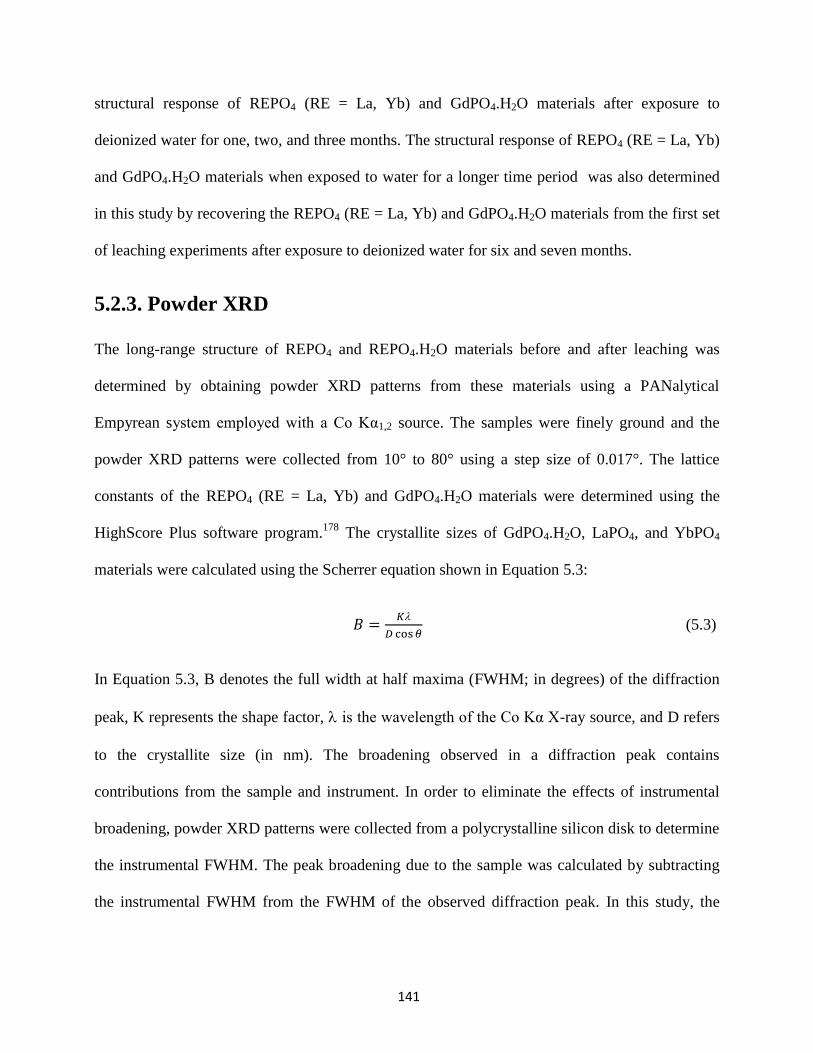
141
structural response of REPO4 (RE = La, Yb) and GdPO4.H2O materials after exposure to
deionized water for one, two, and three months. The structural response of REPO4 (RE = La, Yb)
and GdPO4.H2O materials when exposed to water for a longer time period was also determined
in this study by recovering the REPO4 (RE = La, Yb) and GdPO4.H2O materials from the first set
of leaching experiments after exposure to deionized water for six and seven months.
5.2.3. Powder XRD
The long-range structure of REPO4 and REPO4.H2O materials before and after leaching was
determined by obtaining powder XRD patterns from these materials using a PANalytical
Empyrean system employed with a Co Kα1,2 source. The samples were finely ground and the
powder XRD patterns were collected from 10° to 80° using a step size of 0.017°. The lattice
constants of the REPO4 (RE = La, Yb) and GdPO4.H2O materials were determined using the
HighScore Plus software program.178
The crystallite sizes of GdPO4.H2O, LaPO4, and YbPO4
materials were calculated using the Scherrer equation shown in Equation 5.3:
𝐵 =𝐾
𝐷 cos 𝜃 (5.3)
In Equation 5.3, B denotes the full width at half maxima (FWHM; in degrees) of the diffraction
peak, K represents the shape factor, is the wavelength of the Co Kα X-ray source, and D refers
to the crystallite size (in nm). The broadening observed in a diffraction peak contains
contributions from the sample and instrument. In order to eliminate the effects of instrumental
broadening, powder XRD patterns were collected from a polycrystalline silicon disk to determine
the instrumental FWHM. The peak broadening due to the sample was calculated by subtracting
the instrumental FWHM from the FWHM of the observed diffraction peak. In this study, the
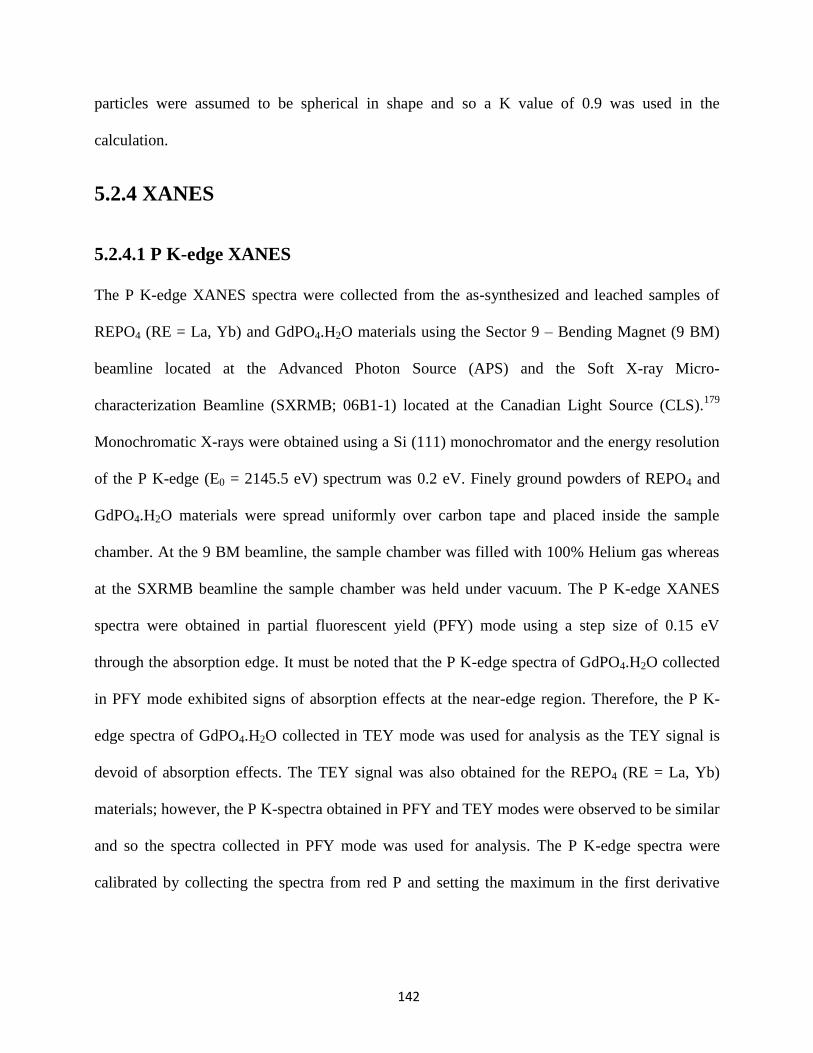
142
particles were assumed to be spherical in shape and so a K value of 0.9 was used in the
calculation.
5.2.4 XANES
5.2.4.1 P K-edge XANES
The P K-edge XANES spectra were collected from the as-synthesized and leached samples of
REPO4 (RE = La, Yb) and GdPO4.H2O materials using the Sector 9 – Bending Magnet (9 BM)
beamline located at the Advanced Photon Source (APS) and the Soft X-ray Micro-
characterization Beamline (SXRMB; 06B1-1) located at the Canadian Light Source (CLS).179
Monochromatic X-rays were obtained using a Si (111) monochromator and the energy resolution
of the P K-edge (E0 = 2145.5 eV) spectrum was 0.2 eV. Finely ground powders of REPO4 and
GdPO4.H2O materials were spread uniformly over carbon tape and placed inside the sample
chamber. At the 9 BM beamline, the sample chamber was filled with 100% Helium gas whereas
at the SXRMB beamline the sample chamber was held under vacuum. The P K-edge XANES
spectra were obtained in partial fluorescent yield (PFY) mode using a step size of 0.15 eV
through the absorption edge. It must be noted that the P K-edge spectra of GdPO4.H2O collected
in PFY mode exhibited signs of absorption effects at the near-edge region. Therefore, the P K-
edge spectra of GdPO4.H2O collected in TEY mode was used for analysis as the TEY signal is
devoid of absorption effects. The TEY signal was also obtained for the REPO4 (RE = La, Yb)
materials; however, the P K-spectra obtained in PFY and TEY modes were observed to be similar
and so the spectra collected in PFY mode was used for analysis. The P K-edge spectra were
calibrated by collecting the spectra from red P and setting the maximum in the first derivative
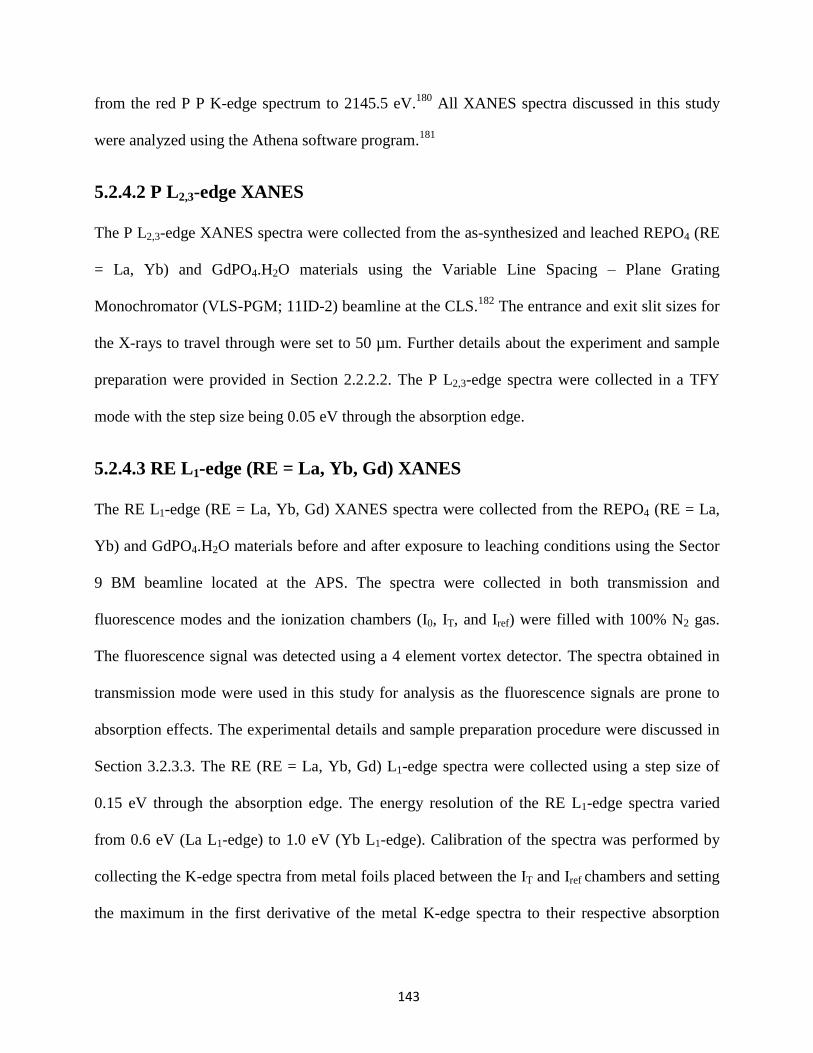
143
from the red P P K-edge spectrum to 2145.5 eV.180
All XANES spectra discussed in this study
were analyzed using the Athena software program.181
5.2.4.2 P L2,3-edge XANES
The P L2,3-edge XANES spectra were collected from the as-synthesized and leached REPO4 (RE
= La, Yb) and GdPO4.H2O materials using the Variable Line Spacing – Plane Grating
Monochromator (VLS-PGM; 11ID-2) beamline at the CLS.182
The entrance and exit slit sizes for
the X-rays to travel through were set to 50 µm. Further details about the experiment and sample
preparation were provided in Section 2.2.2.2. The P L2,3-edge spectra were collected in a TFY
mode with the step size being 0.05 eV through the absorption edge.
5.2.4.3 RE L1-edge (RE = La, Yb, Gd) XANES
The RE L1-edge (RE = La, Yb, Gd) XANES spectra were collected from the REPO4 (RE = La,
Yb) and GdPO4.H2O materials before and after exposure to leaching conditions using the Sector
9 BM beamline located at the APS. The spectra were collected in both transmission and
fluorescence modes and the ionization chambers (I0, IT, and Iref) were filled with 100% N2 gas.
The fluorescence signal was detected using a 4 element vortex detector. The spectra obtained in
transmission mode were used in this study for analysis as the fluorescence signals are prone to
absorption effects. The experimental details and sample preparation procedure were discussed in
Section 3.2.3.3. The RE (RE = La, Yb, Gd) L1-edge spectra were collected using a step size of
0.15 eV through the absorption edge. The energy resolution of the RE L1-edge spectra varied
from 0.6 eV (La L1-edge) to 1.0 eV (Yb L1-edge). Calibration of the spectra was performed by
collecting the K-edge spectra from metal foils placed between the IT and Iref chambers and setting
the maximum in the first derivative of the metal K-edge spectra to their respective absorption

144
energy. Calibration of the La L1-, Yb L1-, and Gd L1- edge spectra was done using Mn (E0 = 6539
eV), Ga (E0 = 10367 eV), and Ni (E0 = 8333 eV) metal foils, respectively.180
5.3 Results and Discussion
5.3.1. Powder XRD: Before Leaching
Prior to the leaching experiment, powder XRD patterns were collected from the as-synthesized
LaPO4 (monazite-type), YbPO4 (xenotime-type), and GdPO4.H2O (rhabdophane-type) materials
in order to determine the phase purity of these materials (Figure 5.1). The powder XRD patterns
shown in Figure 5.1 reveal the phase purity of the as-synthesized materials. The lattice constants
of LaPO4, YbPO4, and GdPO4.H2O materials are listed in Table 5-3. When compared to the
powder XRD patterns from the LaPO4 and YbPO4 materials, the powder XRD pattern of
GdPO4.H2O materials contains broader diffraction peaks (Figure 5.1). The diffraction peaks in
powder XRD patterns could broaden due to the presence of smaller sized crystallites and/or
lattice strain in the crystalline solid. Since the GdPO4.H2O materials were synthesized at a
temperature much lower than that required for the synthesis of LaPO4 and YbPO4 materials, it is
more likely that the peak broadening observed in the powder XRD pattern of GdPO4.H2O is due
to the presence of smaller sized crystallites in the GdPO4.H2O material. The crystallite sizes of
the GdPO4.H2O, LaPO4, and YbPO4 materials were calculated using Equation 5.3 assuming
negligible contribution of strain towards peak broadening, and are listed in Table 5-3. As shown
in Table 5-3, the crystallite size of the GdPO4.H2O material is lower than that of LaPO4 or
YbPO4.
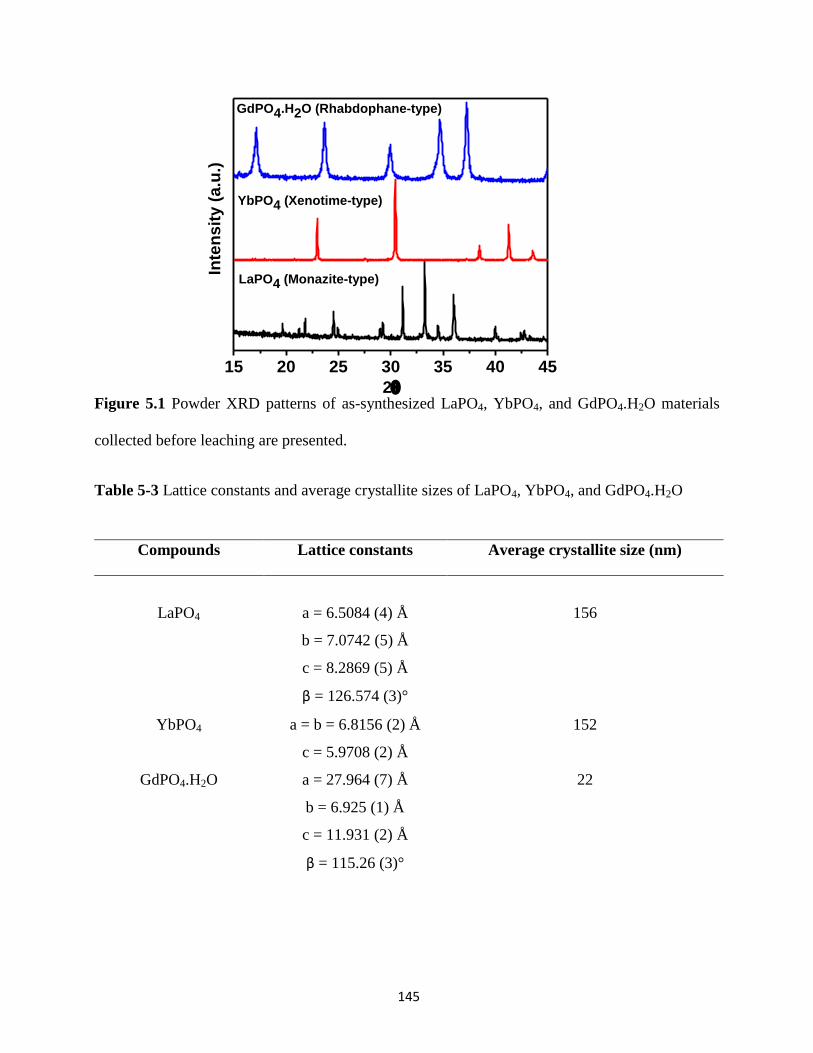
145
15 20 25 30 35 40 45
GdPO4.H2O (Rhabdophane-type)
YbPO4 (Xenotime-type)In
ten
sit
y (
a.u
.)
2
LaPO4 (Monazite-type)
Figure 5.1 Powder XRD patterns of as-synthesized LaPO4, YbPO4, and GdPO4.H2O materials
collected before leaching are presented.
Table 5-3 Lattice constants and average crystallite sizes of LaPO4, YbPO4, and GdPO4.H2O
Compounds Lattice constants Average crystallite size (nm)
LaPO4 a = 6.5084 (4) Å
b = 7.0742 (5) Å
c = 8.2869 (5) Å
β = 126.574 (3)°
156
YbPO4 a = b = 6.8156 (2) Å
c = 5.9708 (2) Å
152
GdPO4.H2O a = 27.964 (7) Å
b = 6.925 (1) Å
c = 11.931 (2) Å
β = 115.26 (3)°
22

146
5.3.2. ICP-MS: Leaching behaviour of REPO4 and REPO4.H2O
The chemical durability of the LaPO4 (monazite-type), YbPO4 (xenotime-type), and GdPO4.H2O
(rhabdophane-type) materials upon exposure to deionized water was studied by withdrawing
aliquots of deionized water from the respective test vessel at regular time intervals (See Table 5-
2) and analyzing the leachate solution for RE (RE = La, Yb, Gd) and P ions using ICP-MS. The
elemental concentration of RE (RE = La, Yb, Gd) and P ions in the leachate determined using
ICP-MS are plotted as a function of time and are presented in Figure 5.2. The ICP-MS data
obtained on Day 1 indicated that the GdPO4.H2O material (rhabdophane-type) released higher
amounts of RE (RE = Gd) and P ions to the leachant solution when compared to those released
by LaPO4 (monazite-type) and YbPO4 (xenotime-type) (Figure 5.2). However, the LaPO4 and
YbPO4 materials were found to exhibit similar chemical behaviour on Day 1. The differential
chemical response of these materials in deionized water is attributed to the differences in the
crystal structure, crystallinity, and solubility of the as-synthesized LaPO4, YbPO4, and
GdPO4.H2O materials.252
In terms of crystal structure, the rhabdophane structure consists of infinite channels
oriented along the ‘a’ direction and the water of crystallization associated with this structure
resides in this channel (See Figure 1.4).126
In this study, it is proposed that the leachant solution
(i.e. deionized water) may diffuse through these channels and interact with the RE and P elements
present in the rhabdophane structure which might allow for a greater leaching of the
rhabdophane-type material. The crystallinity of the materials prior to the leaching experiment
may also have an effect on the leaching process. In Section 5.3.1, it was shown using powder
XRD that the rhabdophane-type material is less crystalline when compared to materials adopting
the monazite- and xenotime- type structure (See Table 5-3). The individual crystallites within a
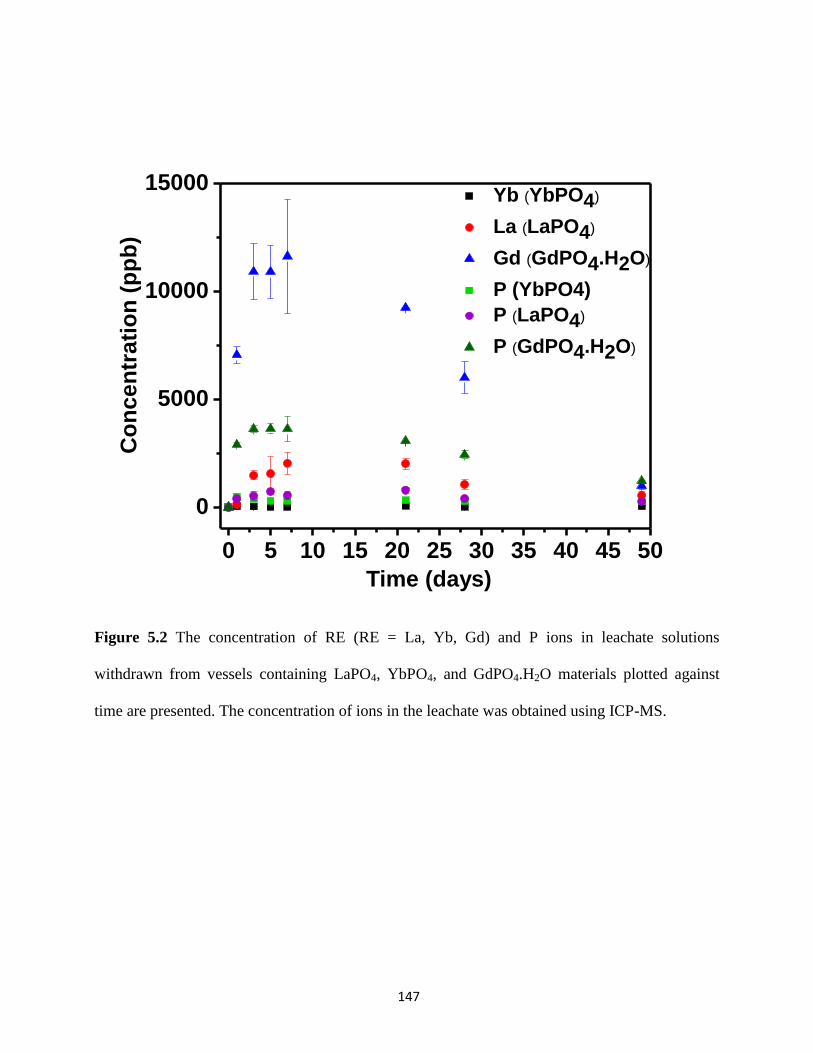
147
Figure 5.2 The concentration of RE (RE = La, Yb, Gd) and P ions in leachate solutions
withdrawn from vessels containing LaPO4, YbPO4, and GdPO4.H2O materials plotted against
time are presented. The concentration of ions in the leachate was obtained using ICP-MS.
0 5 10 15 20 25 30 35 40 45 50
0
5000
10000
15000 Yb (YbPO4)
La (LaPO4)
Gd (GdPO4.H2O)
P (YbPO4)
P (LaPO4)
P (GdPO4.H2O)
Co
nc
en
tra
tio
n (
pp
b)
Time (days)

148
polycrystalline material are separated by a grain boundary and a study by Rakesh et al. has shown
that during leaching experiments, these grain boundaries will serve as a preferred site for
chemical attack.253
The number of grain boundaries in a material generally varies inversely with
the crystallite size. Therefore, the presence of smaller sized crystallites in rhabdophane-type
material will increase the number of grain boundaries which in turn may allow for a greater
leaching of the rhabdophane-type material in deionized water.
The concentration of RE (RE = La, Gd) and P ions in the leachate solution released by the
LaPO4 and GdPO4.H2O materials displayed a similar increasing trend during the first week.
However, in the case of YbPO4, the concentration of Yb and P ions in the leachate solution did
not change significantly during the first week and were found to be similar. These observations
could suggest the establishment of equilibrium between YbPO4 and its constituent ions at an
early stage of the leaching experiment. It is also observed in Figure 5.2 that the concentration of
RE (RE = La, Gd) and P ions in the leachate were not similar despite the 1:1 stoichiometry of RE
and P in LaPO4 and GdPO4.H2O materials. Bois et al. investigated the leaching behaviour of
La0.3Zr2(PO4)3 and LaPO4 ceramics in deionized water and found that the concentration of P ions
in the leachant solution is greater than the concentration of La and Zr ions.254
The authors of that
study proposed that the dissimilarity in concentration could arise from the presence of residual
phosphoric acid adhering to the solid and/or due to the precipitation of secondary phases on the
surface of solid as a result of leaching.254
In the present study, the presence of phosphoric acid
adhering to the solid’s surface could be dispelled as the solids were washed with large volumes of
water (followed by drying) prior to leaching. Similarly, the XRD analysis of the as-synthesized
materials confirmed the absence of any crystalline phosphorus and/or rare-earth containing
impurities and it is proposed that the differences in the concentration of RE and P ions in the
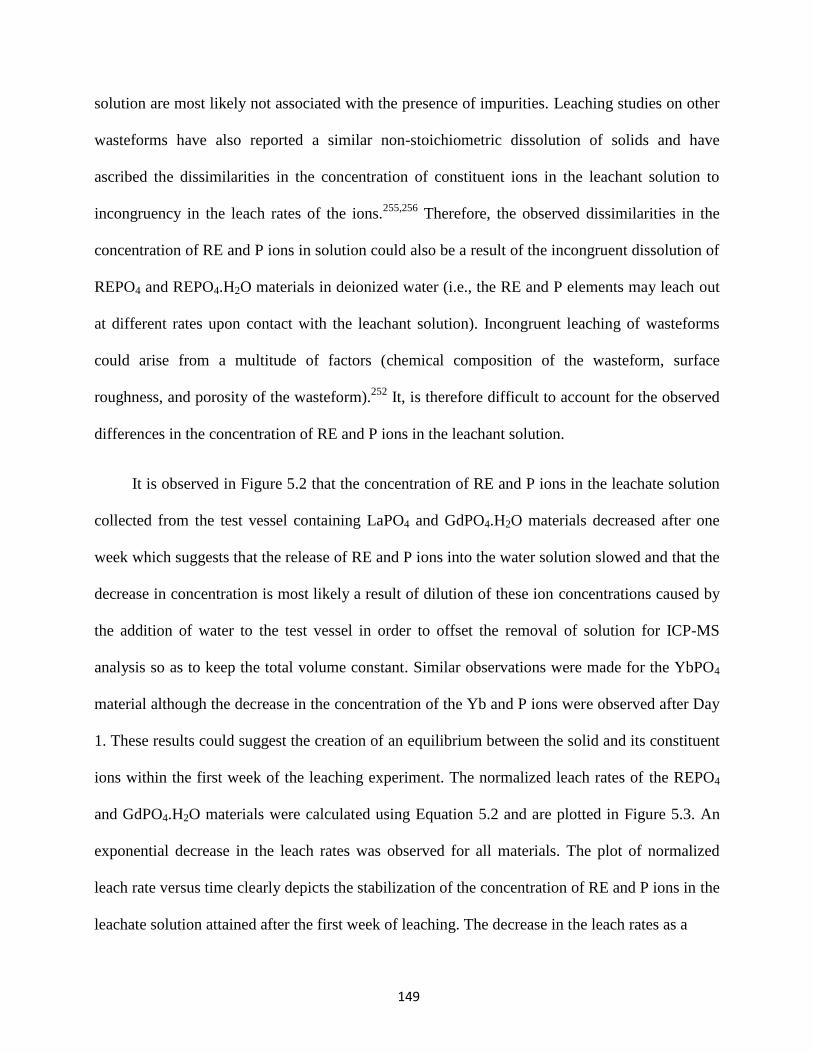
149
solution are most likely not associated with the presence of impurities. Leaching studies on other
wasteforms have also reported a similar non-stoichiometric dissolution of solids and have
ascribed the dissimilarities in the concentration of constituent ions in the leachant solution to
incongruency in the leach rates of the ions.255,256
Therefore, the observed dissimilarities in the
concentration of RE and P ions in solution could also be a result of the incongruent dissolution of
REPO4 and REPO4.H2O materials in deionized water (i.e., the RE and P elements may leach out
at different rates upon contact with the leachant solution). Incongruent leaching of wasteforms
could arise from a multitude of factors (chemical composition of the wasteform, surface
roughness, and porosity of the wasteform).252
It, is therefore difficult to account for the observed
differences in the concentration of RE and P ions in the leachant solution.
It is observed in Figure 5.2 that the concentration of RE and P ions in the leachate solution
collected from the test vessel containing LaPO4 and GdPO4.H2O materials decreased after one
week which suggests that the release of RE and P ions into the water solution slowed and that the
decrease in concentration is most likely a result of dilution of these ion concentrations caused by
the addition of water to the test vessel in order to offset the removal of solution for ICP-MS
analysis so as to keep the total volume constant. Similar observations were made for the YbPO4
material although the decrease in the concentration of the Yb and P ions were observed after Day
1. These results could suggest the creation of an equilibrium between the solid and its constituent
ions within the first week of the leaching experiment. The normalized leach rates of the REPO4
and GdPO4.H2O materials were calculated using Equation 5.2 and are plotted in Figure 5.3. An
exponential decrease in the leach rates was observed for all materials. The plot of normalized
leach rate versus time clearly depicts the stabilization of the concentration of RE and P ions in the
leachate solution attained after the first week of leaching. The decrease in the leach rates as a
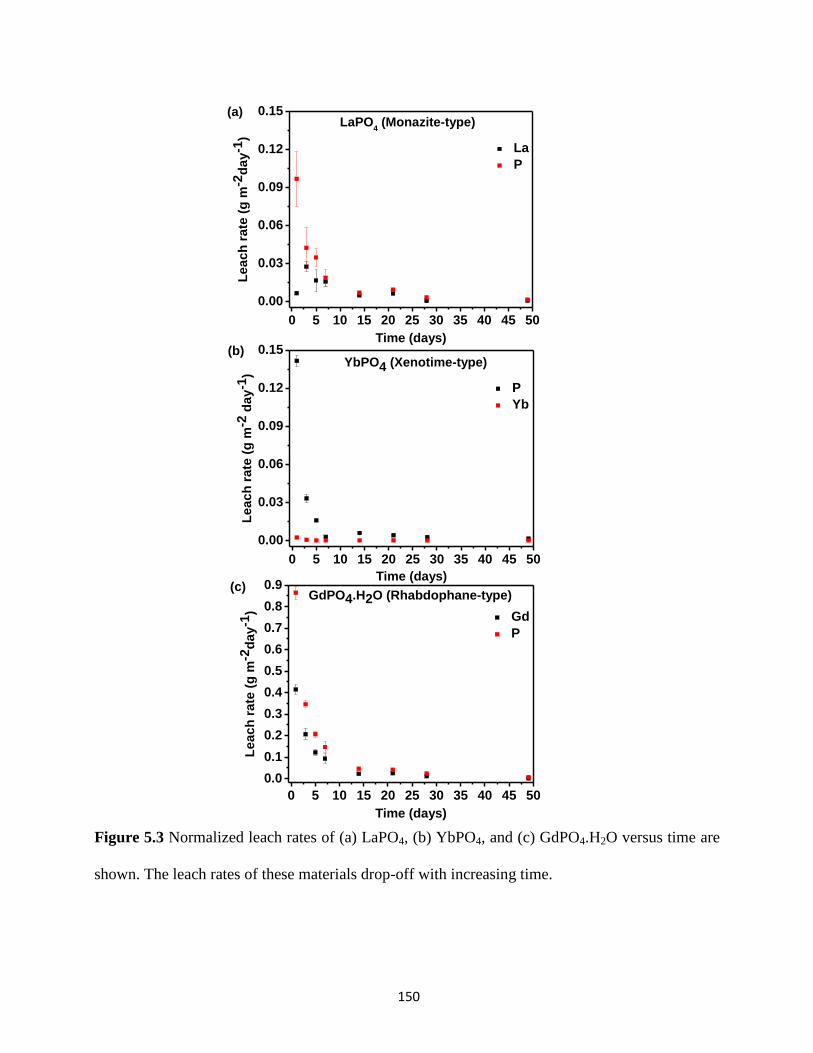
150
0 5 10 15 20 25 30 35 40 45 50
0.0
0.1
0.2
0.3
0.4
0.5
0.6
0.7
0.8
0.9(c)
Gd
P
Le
ac
h r
ate
(g
m-2
da
y-1
)
Time (days)
GdPO4.H2O (Rhabdophane-type)
0 5 10 15 20 25 30 35 40 45 50
0.00
0.03
0.06
0.09
0.12
0.15
P
Yb
Le
ac
h r
ate
(g
m-2
da
y-1
)
Time (days)
YbPO4 (Xenotime-type)(b)
0 5 10 15 20 25 30 35 40 45 50
0.00
0.03
0.06
0.09
0.12
0.15(a)
La
P
Le
ac
h r
ate
(g
m-2
da
y-1
)
Time (days)
LaPO4 (Monazite-type)
Figure 5.3 Normalized leach rates of (a) LaPO4, (b) YbPO4, and (c) GdPO4.H2O versus time are
shown. The leach rates of these materials drop-off with increasing time.

151
function of time could also be attributed to the development of a film on the surface of these
materials owing to their prolonged exposure to deionized water. It should be noted that the
normalized leach rates presented in this study were obtained using the calculated total surface
area (SAtotal) and the true leach rates of these materials will vary from what is shown here.
5.3.3. Powder XRD: Effect of leaching on the long-range structure
The structural response of materials to leaching was determined at different stages of the leaching
experiment by obtaining powder XRD patterns from LaPO4, YbPO4, and GdPO4.H2O materials
every month for a total duration of seven months (Figure 5.4). The absence of secondary phases
in the powder XRD pattern of LaPO4, YbPO4, and GdPO4.H2O materials obtained after leaching
indicates that the long-range structure of these materials is preserved after exposure to deionized
water. It must be noted that in the case of GdPO4.H2O, slight broadening of the diffraction peak
was observed after leaching which indicates a slight loss in the crystallinity of the material.
However, no significant changes in the peak widths were observed for the LaPO4 and YbPO4
materials after leaching.
5.3.4. XANES: Effect of leaching on the local structure
It was shown in the previous section using powder XRD that the long-range structure of the
LaPO4, YbPO4, and GdPO4.H2O materials remained unaffected under aqueous leaching
conditions. While XRD analysis has confirmed the absence of crystalline impurity or secondary
phases after leaching, it did not offer any information about the presence of amorphous secondary
phases (if any) as well as the changes in local structure upon exposure of the materials to
deionized water. XANES spectra are sensitive to changes in the local structure of materials.
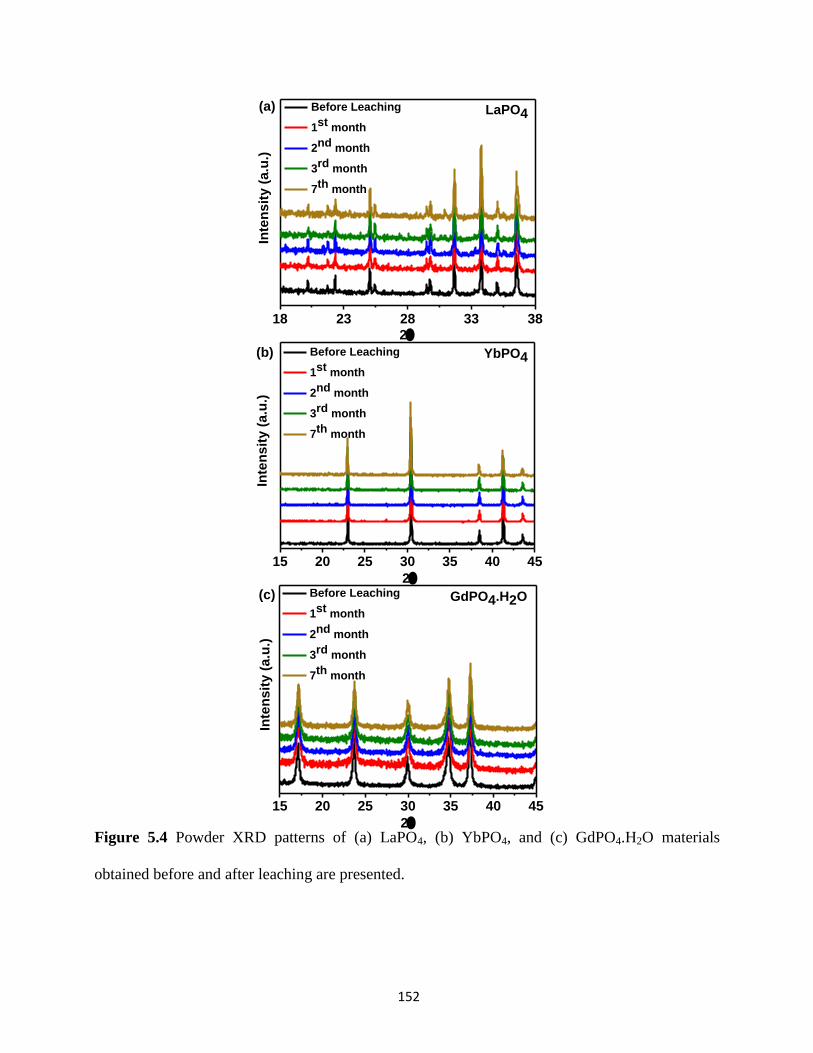
152
15 20 25 30 35 40 45
Inte
ns
ity
(a
.u.)
2
Before Leaching
1st month
2nd month
3rd month
7th month
GdPO4.H2O(c)
15 20 25 30 35 40 45
Before Leaching
1st month
2nd month
3rd month
7th month
(b)
Inte
ns
ity
(a
.u.)
2
YbPO4
18 23 28 33 38
Before Leaching
1st month
2nd month
3rd month
7th month
Inte
ns
ity
(a
.u.)
2
(a) LaPO4
Figure 5.4 Powder XRD patterns of (a) LaPO4, (b) YbPO4, and (c) GdPO4.H2O materials
obtained before and after leaching are presented.
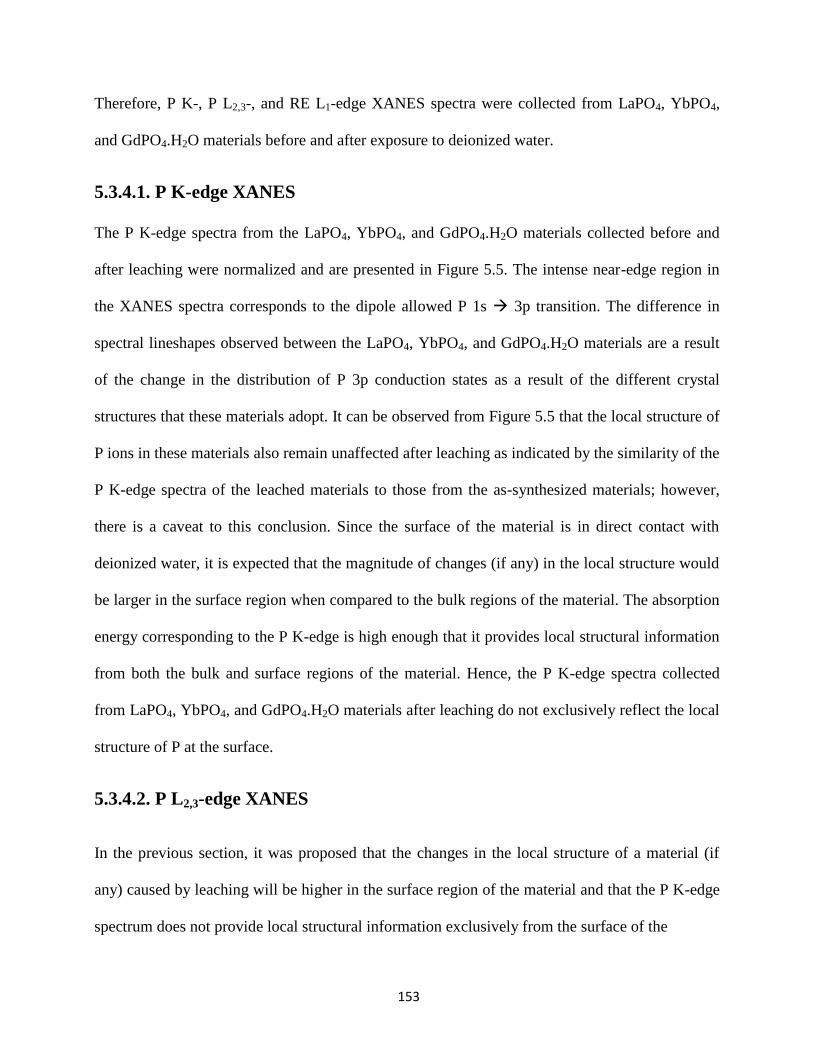
153
Therefore, P K-, P L2,3-, and RE L1-edge XANES spectra were collected from LaPO4, YbPO4,
and GdPO4.H2O materials before and after exposure to deionized water.
5.3.4.1. P K-edge XANES
The P K-edge spectra from the LaPO4, YbPO4, and GdPO4.H2O materials collected before and
after leaching were normalized and are presented in Figure 5.5. The intense near-edge region in
the XANES spectra corresponds to the dipole allowed P 1s 3p transition. The difference in
spectral lineshapes observed between the LaPO4, YbPO4, and GdPO4.H2O materials are a result
of the change in the distribution of P 3p conduction states as a result of the different crystal
structures that these materials adopt. It can be observed from Figure 5.5 that the local structure of
P ions in these materials also remain unaffected after leaching as indicated by the similarity of the
P K-edge spectra of the leached materials to those from the as-synthesized materials; however,
there is a caveat to this conclusion. Since the surface of the material is in direct contact with
deionized water, it is expected that the magnitude of changes (if any) in the local structure would
be larger in the surface region when compared to the bulk regions of the material. The absorption
energy corresponding to the P K-edge is high enough that it provides local structural information
from both the bulk and surface regions of the material. Hence, the P K-edge spectra collected
from LaPO4, YbPO4, and GdPO4.H2O materials after leaching do not exclusively reflect the local
structure of P at the surface.
5.3.4.2. P L2,3-edge XANES
In the previous section, it was proposed that the changes in the local structure of a material (if
any) caused by leaching will be higher in the surface region of the material and that the P K-edge
spectrum does not provide local structural information exclusively from the surface of the
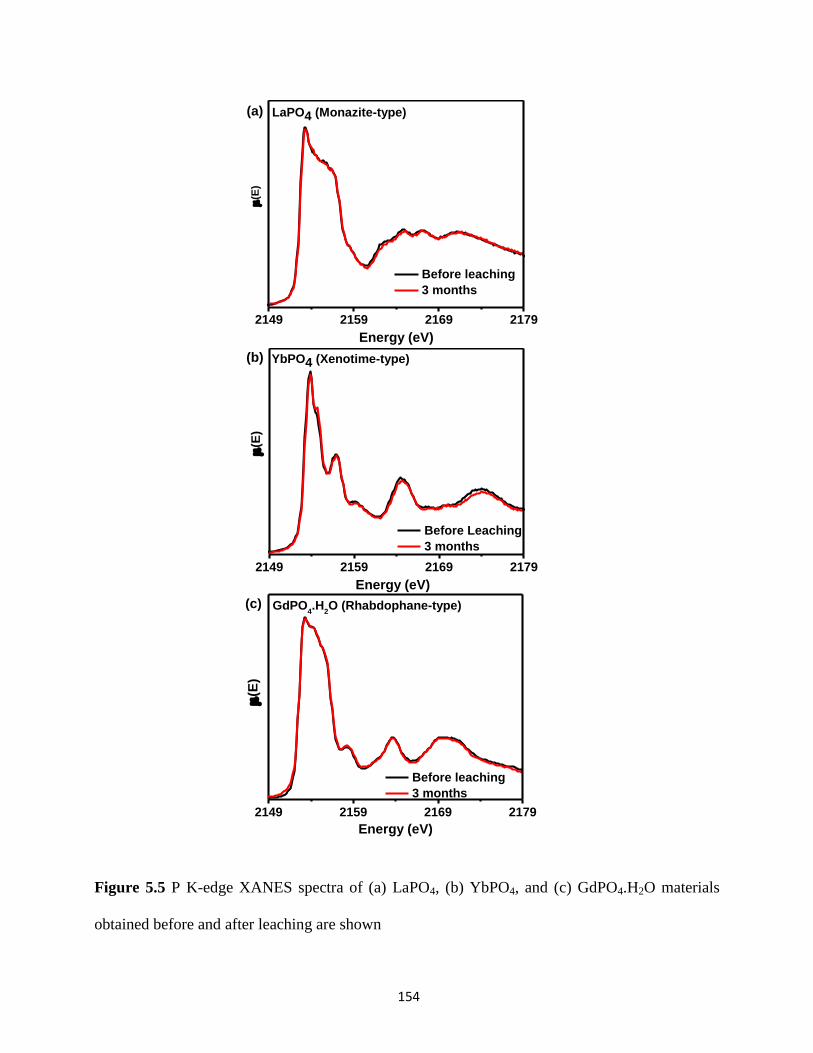
154
2149 2159 2169 2179
(c) GdPO4.H
2O (Rhabdophane-type)
(E
)
Energy (eV)
Before leaching
3 months
2149 2159 2169 2179
(b) YbPO4 (Xenotime-type)
(E
)
Energy (eV)
Before Leaching
3 months
2149 2159 2169 2179
(E
)
Energy (eV)
Before leaching
3 months
LaPO4 (Monazite-type)(a)
Figure 5.5 P K-edge XANES spectra of (a) LaPO4, (b) YbPO4, and (c) GdPO4.H2O materials
obtained before and after leaching are shown
155
material. P L2,3-edge spectra were collected from LaPO4, YbPO4, and GdPO4.H2O materials
before and after leaching in order to obtain surface specific local structural information (Figure
5.6). The P L2,3-edge XANES spectra are surface sensitive due to the low energy of P L2,3-edge.
The P L2,3-edge spectra result from the transition of electrons from the spin-orbit split 2p states
into unoccupied 3d and 3s states. The P L2,3-edge spectra are structurally rich and contain various
features representing the transition of electrons from the 2p state into overlapping 3d and 3s
conduction states. The higher energy features present in the P L2,3-edge spectra of GdPO4.H2O
are due to the overlap of the Gd N-edge with the P L2,3-edge spectra. It can be observed from
Figure 5.6 that the P L2,3-edge spectra of leached samples are similar to the spectra from the as-
synthesized materials. These results confirm that the local structure of the surface regions do not
change significantly as a result of leaching.
5.3.4.3. RE L1-edge XANES
The RE L1-edge spectra were collected from LaPO4, YbPO4, and GdPO4.H2O materials before
and after leaching in order to determine the changes in the local structure of the RE ion (Figure
5.7). The near-edge region in the RE L1-edge spectra represent the RE 2s 6p transition. In the
pre-edge region, a small shoulder is observed as a result of a RE 2s 6p-5d transition. The pre-
edge feature is sensitive to the local symmetry of the RE ion and the intensity of this feature
generally increases with decreasing local symmetry around the RE ion. The pre-edge shoulder
observed in the Yb L1-edge spectra is less pronounced when compared to the pre-edge regions in
the La L1- and Gd L1-edge spectra (Figure 5.7) because the YbO8 polyhedra in YbPO4 are more
symmetrical when compared to the LaO9 and GdOn (n = 8 and 9) polyhedra in the LaPO4 and
GdPO4.H2O materials.126,135
Similar to the results obtained from analysis of the P K- and P L2,3-
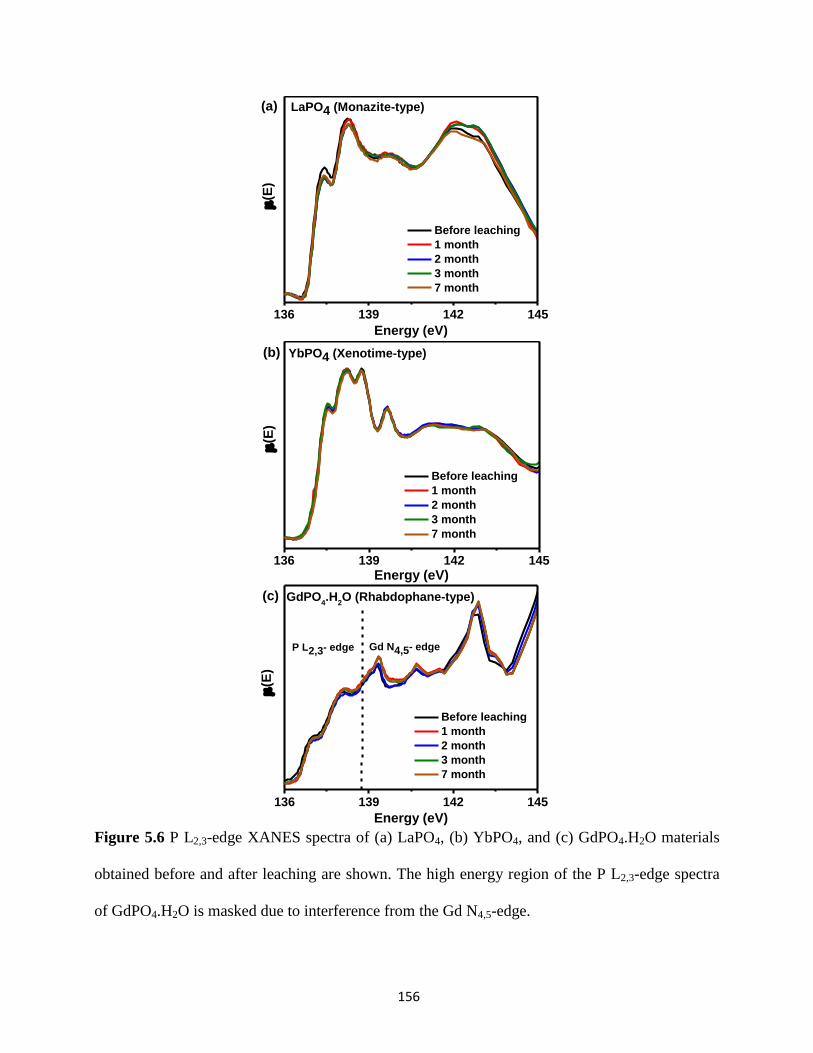
156
136 139 142 145
(c) GdPO4.H
2O (Rhabdophane-type)
Gd N4,5- edge
(E
)
Energy (eV)
Before leaching
1 month
2 month
3 month
7 month
P L2,3- edge
136 139 142 145
(b) YbPO4 (Xenotime-type)
(E
)
Energy (eV)
Before leaching
1 month
2 month
3 month
7 month
136 139 142 145
(E
)
Energy (eV)
Before leaching
1 month
2 month
3 month
7 month
LaPO4 (Monazite-type)(a)
Figure 5.6 P L2,3-edge XANES spectra of (a) LaPO4, (b) YbPO4, and (c) GdPO4.H2O materials
obtained before and after leaching are shown. The high energy region of the P L2,3-edge spectra
of GdPO4.H2O is masked due to interference from the Gd N4,5-edge.
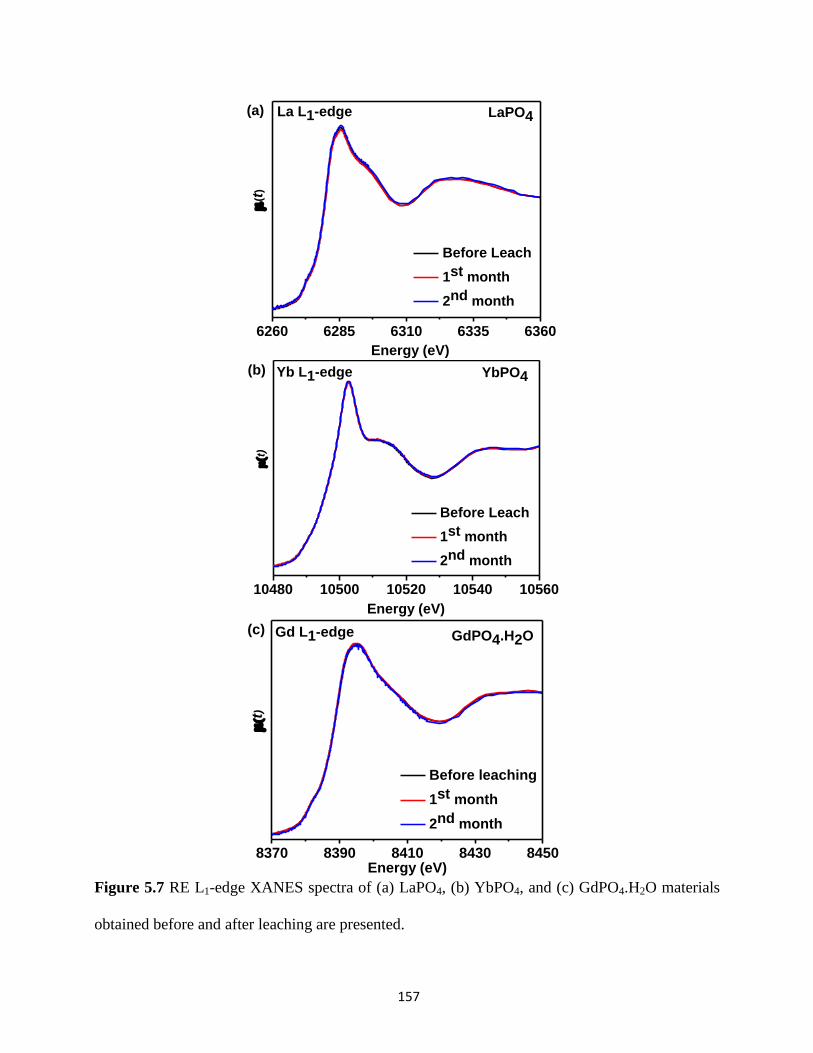
157
8370 8390 8410 8430 8450
(t
)
Energy (eV)
Before leaching
1st month
2nd month
GdPO4.H2O(c) Gd L1-edge
10480 10500 10520 10540 10560
(t
)
Energy (eV)
Before Leach
1st month
2nd month
YbPO4 (b) Yb L1-edge
6260 6285 6310 6335 6360
Energy (eV)
Before Leach
1st month
2nd month
(t
)
LaPO4(a) La L1-edge
Figure 5.7 RE L1-edge XANES spectra of (a) LaPO4, (b) YbPO4, and (c) GdPO4.H2O materials
obtained before and after leaching are presented.
158
edge spectra, no significant changes in the local structure of the RE ions were observed after
leaching.
5.4 Conclusion
This study has investigated the room temperature chemical durability of monazite-, xenotime-,
and rhabdophane-type rare-earth phosphates by conducting the leaching experiments in deionized
water under semi-static conditions. In terms of chemical response, the material adopting the
rhabdophane structure was found to dissolve more in deionized water when compared to
materials adopting the monazite- and xenotime-type structures. A stabilization in the
concentration of RE and P ions in the water solution was attained for all three materials after one
week of leaching. Examination of the long-range and local structures of these materials before
and after leaching was carried out using powder XRD and XANES, respectively. No significant
changes in the powder XRD pattern and XANES spectra of the leached samples were observed
when compared to those of as-synthesized samples. This observation is ascribed to the fact that
the concentration of the leached ions in solution are only in the ppb – ppm range. Therefore, these
materials exhibit little to no change in their long-range and local structure after leaching. This
study, for the first time, has provided a comparison of the dissolution behaviour of monazite-,
xenotime-, and rhabdophane-type materials in an aqueous environment and has shown that the
structures of these materials remain intact after seven months of leaching. This study has
provided the basis for conducting future leaching experiments on these materials under harsh
chemical conditions including conditions that simulate the groundwater in a geological
repository.
159
Chapter 6
CONCLUSIONS AND FUTURE WORK
6.1. Conclusions and Significance
The studies presented in this thesis have contributed to a much broader understanding of the
structural properties of monazite-, xenotime-, and rhabdophane-type rare-earth phosphate
materials and how these materials would respond to conditions simulating the effects of radiation
in nuclear wasteforms as well as conditions simulating a failed container situation in a geological
repository (i.e., the metal container that holds the nuclear wasteform fails and groundwater enters
the container and interacts with the nuclear wasteform). The results that were presented in this
thesis will add to a growing body of fundamental research work on various crystalline materials
proposed for nuclear waste sequestration applications. This research will assist in the selection
process of potential candidate materials for storing nuclear waste.
In Chapter 2, a fundamental understanding of the crystal and electronic structure of
monazite- and xenotime-type rare-earth phosphates was obtained using X-ray diffraction and
spectroscopic techniques. Naturally occurring rare-earth phosphate minerals reveal the existence
of monazite-xenotime solid solutions, and, in Chapter 2, the solubility limit for the substitution of
smaller sized rare-earth (RE) ions into the larger sized RE site in the monazite-type structure was
160
studied by synthesizing RE1-xRE'xPO4 (RE = La, Sm; RE’ = Yb, Y, Ho) materials via a
conventional solid-state method. The end-members of the RE1-xRE'xPO4 series adopt the
monazite- (x = 0) and xenotime-type (x = 1) structures. Powder X-ray diffraction (XRD) analysis
of these materials indicated the formation of a solid solution over a narrow compositional range
(0.1 x 0.2). The electronic structure of these materials was investigated using X-ray
absorption near-edge spectroscopy (XANES) and X-ray photoelectron spectroscopy (XPS).
While the XPS spectra exhibited very minor changes in binding energy between the two
structures, significant differences in absorption energy and spectral lineshape were observed in
the P K-edge XANES spectra of materials adopting either monazite or xenotime structures. This
study has shown that the XANES spectra are influenced by changes in the crystal structure of
these materials and that P K-edge XANES spectra could be used as a spectroscopic fingerprint
for the identification of monazite- and xenotime-type structures in natural and synthetic samples.
The long-range and local structures of hydrous rare-earth phosphates (REPO4.H2O)
adopting the rhabdophane- (RE = La - Dy) and xenotime-type (RE = Tb – Lu & Y) structures
were investigated in detail using powder XRD and XANES and the results obtained from this
study was presented in Chapter 3. The REPO4.H2O materials were synthesized using a low
temperature precipitation route in which RE2O3 was dissolved in concentrated H3PO4 and the
clear solution was refluxed at temperatures above the boiling point of water to obtain the
REPO4.H2O precipitate. The crystal structure of the rhabdophane materials was determined by
performing a Rietveld refinement of the XRD data and it was found that the rhabdophane
materials adopts the monoclinic structure rather than the most often reported hexagonal structure.
Thermogravimetric analysis (TGA) of the REPO4.H2O materials has confirmed the removal of
water at specific temperatures and this study determined the structure of these materials after the
161
removal of water by annealing the as-synthesized REPO4.H2O materials at a variety of
temperatures. The structure of the resulting products was determined ex-situ using powder XRD
and XANES. It was found through this study that the rhabdophane-type structure is metastable
and transforms into thermodynamically stable monazite- or xenotime-type structures at higher
temperatures depending on the size of RE ion. The xenotime-type REPO4.H2O material was
found to be structurally stable at all temperatures studied although minor variations in the powder
XRD and XANES spectra were observed upon removal of water molecules. This study, for the
first time, has provided detailed insights into the structure of REPO4.H2O materials and how
these materials would respond to changes in temperature. In terms of nuclear wasteform
applications, understanding the structure of REPO4.H2O materials is important as these phases
are proposed to form during the aqueous alteration of monazite- and xenotime-type rare-earth
phosphates.128–132
An actinide element incorporated in a crystalline ceramic can undergo a radioactive decay
process during which the crystalline matrix could experience structural damage from the high
recoil energies associated with daughter product radionuclide. Therefore, the radiation damage
due to recoil atom was simulated by implanting high energy Au- ions (2 MeV) of varying ion
doses (ions/cm2) into pellets of La1-xYbxPO4 and the structural response of these materials to ion-
implantation was determined and was discussed in Chapter 4. The Au- ions were implanted in the
surface regions of the pellet. Glancing angle XANES (GA-XANES) and µ-XRD were used to
obtain the structural information from the ion-implanted regions of the pellet. In this study, the
GA-XANES was shown to be an effective technique in obtaining local structural information
from materials in which the chemical environment surrounding the element of interest at the
surface region is different from those present in the bulk region. The P K-edge GA-XANES

162
spectra obtained from ion-implanted monazite- and xenotime-type materials reveal a distortion in
the local structure around P ion after ion implantation. However, the P K-edge GA-XANES
spectra from xenotime-type materials implanted with a high dose of Au- ions exhibited signs of
partial structural recovery as indicated by the partial resemblance of the GA-XANES spectra
from the ion-implanted material to those obtained before ion-implantation. The high ion dose
could cause local heating of the ion-implanted material which therefore induces a partial
recrystallization of the material. This is an important result for nuclear wasteform applications
because actinides emit heat during the radioactive decay process and the emitted heat could
restore the structural order in a structurally damaged crystalline host matrix. This study also
investigated the effect of radioactive decay heat on the structure of ion-implanted monazite- and
xenotime-type materials by annealing the ion-implanted materials to 300°C and 900°C and
investigating the structural response to these temperatures using GA-XANES. Depending on the
annealing temperature and composition, the structures of ion-implanted monazite and xenotime
materials were found to recover either partially or completely upon annealing. The results
obtained from this study point out the structural resilience of monazite- and xenotime-type
materials thereby making them an ideal candidate for storing radioactive waste.
Assessing the chemical durability of nuclear wasteforms is of the utmost importance and
results obtained from the short-term leaching studies on monazite-, xenotime-, and rhabdophane-
type materials were presented in Chapter 5. Deionized water was used as a leaching medium and
powders of as-synthesized materials were exposed to deionized water at room temperature for a
total period of three months. The elemental concentration in the leachate (i.e., deionized water)
was determined using ICP-MS. Based on the ICP-MS data, it was found that materials adopting
the rhabdophane structure leach at a faster rate when compared to monazite- and xenotime-type
163
materials. Structural characterization of materials before and after leaching was performed using
powder XRD and XANES. Both the long-range and local structures of these materials were
found to remain unaltered after leaching. This preliminary study has determined the chemical and
structural response of hydrous and anhydrous rare-earth phosphates to aqueous conditions at
room temperature and in doing so provides the groundwork for carrying out advanced leaching
studies (i.e., leaching under basic and acidic conditions; temperature-dependent leaching study
etc.) on these materials.
This thesis discussed the structure, radiation stability, and chemical durability of rare-earth
phosphate materials proposed for nuclear waste sequestration applications. The work presented in
Chapters 2 and 3 showcases the rich structural chemistry of monazite-, xenotime-, and
rhabdophane-type rare-earth phosphates by providing a comprehensive understanding of the
long-range and local structures of monazite-, xenotime-, and rhabdophane-type materials using
powder XRD and XANES. One of the major findings from these studies is that the P K-edge
XANES spectra from these materials have a distinct spectral lineshape which allows for the
detailed elucidation of the local environment around the P ion in these materials. The structural
richness of P K-edge XANES spectra was exploited in Chapter 4 of this thesis wherein the
structural response of monazite- and xenotime-type materials to high energy Au- ion-implantation
was monitored primarily using P K-edge XANES spectra collected in a glancing angle mode. In
this Chapter, the structural stability of monazite- and xenotime-type materials to radiation events
caused by actinide incorporation in crystalline materials was studied by simulating these events
in a laboratory through high energy heavy ion implantation in solids. This method of study
allowed for a quick determination of structural response of materials to radiation events
accumulated as a result of at least 100 years of actinide storage. Through the use of GA-XANES,
164
this study has shown that the monazite- and xenotime-type ceramics lose local order after ion-
implantation but can be restored back to their original structure either partially or completely
upon annealing to temperatures ≥ 300°C. Having determined the structure and radiation stability
of rare-earth phosphate materials, the final chapter of this thesis addressed the chemical durability
of monazite-, xenotime-, and rhabdophane-type structures upon exposure to deionized water. In
this study, a comparison of the dissolution behaviour of these materials was made and it was
found that the materials adopting the rhabdophane-type structure dissolves more when compared
to materials adopting the monazite- and xenotime-type structures. All of the studies that were
presented in this thesis have provided a greater understanding of the structure of rare-earth
phosphate materials from both a fundamental and practical standpoint.
6.2. Future Work
A great deal of information about the structure and properties of monazite-, xenotime-, and
rhabdophane-type rare-earth phosphate materials has been presented in this thesis. The work
presented in this thesis discussed the long-range, local, and electronic structure of hydrous and
anhydrous rare-earth phosphate materials in addition to discussing the effect of radiation damage
and leaching on the structure of these materials. The complex structure and structural
transformations of rhabdophane-type materials presented in Chapter 3 of this thesis opens up new
possibilities for carrying out solid state exploratory research. Similarly, the results obtained from
the radiation (Chapter 4) and leaching (Chapter 5) studies of rare-earth phosphates materials can
be used as a basis for further research explorations. Some of the proposed future work plans for
the research presented in Chapters 3, 4, and 5 will be discussed below.
165
It was shown in Chapter 3 that the materials adopting the rhabdophane-type structure are
sensitive to changes in temperature as indicated by the loss of water with increasing temperature.
Upon complete loss of water, the rhabdophane structure can be stabilized over a narrow
temperature range (e.g. 700°C < T < 800°C). Beyond this temperature range, the rhabdophane-
type structure transforms into either the monazite- or xenotime-type structure thereby revealing
the metastable nature of rhabdophane. The metastability of the rhabdophane phase therefore
makes it an ideal system to study under extreme pressure conditions. The use of extreme
pressures could open up new pathways for obtaining novel crystal structures with exotic
properties and no studies have yet been reported in the literature on the effect of pressure on the
structure of rhabdophane. This study is purely exploratory in nature and the major objective of
this study would be to determine how the crystal structure of rhabdophane materials varies as a
function of pressure. The high-pressure route could potentially lead to the formation of new
materials which may not be accessible via high temperature methods. To this end, the extreme
pressures required for conducting this study would be achieved through the use of a Diamond
Anvil Cell (DAC). The DAC allows for the study of materials over a wide-range of pressures
ranging from a few GPa to pressures typically found in the Earth’s core (~ 380 GPa).257
The
structural response of these materials to varying pressures (e.g., 1 GPa – 100 GPa) can be
monitored using X-ray based diffraction and spectroscopic techniques (e.g., XANES).
The effect of energetic α-recoil nuclei (daughter products) on the structure of monazite- and
xenotime-type rare-earth phosphates was studied by simulating the radiation events in these
materials via high energy Au- ion implantation in Chapter 4. This study has successfully
demonstrated the use of GA-XANES to obtain selective local structural information from the ion-
implanted regions of the material and the resulting GA-XANES spectra indicate a change in the
166
local structure of these materials after ion-implantation. In an α-decay event, the actinide element
incorporated within a wasteform decays via production of high energy α-recoil nuclei and α-
particles. Therefore, the role played by α-particles on the structure of crystalline wasteform must
also be taken into account while conducting radiation studies on proposed materials of interest.
This can be done by implanting high-energy He ions into the surface of sintered pellets of
materials adopting the monazite- and xenotime-type structures and the structural characterization
can be performed using glancing angle XRD and XANES. Some studies in the literature have
provided evidence of structural recovery of heavy ion implanted ceramics upon irradiating the
ion-implanted material with high energy electron beams.89,104,106
To this end, the sintered pellets
of monazite and xenotime materials could be exposed to 2 MeV Au- ion beams at a specified
dose (ions/cm2) followed by exposure to a similar dosage of 2 MeV He ions. This study would
determine the combined effects of α-particles and α-recoil atoms on the structure of monazite-
and xenotime-type materials.
In the concluding study of this thesis, preliminary leaching experiments were conducted on
materials adopting the monazite-, xenotime-, and rhabdophane-type structure and the results were
presented in Chapter 5. This study has shown that the structure (bulk and surface) of these
materials remain unaltered after exposure to deionized water for three months. In a failed
container situation in a geological repository, the wasteform could be exposed to groundwater for
very long periods of time. Depending on the location of the geological repository, the
groundwater could be either acidic or basic or neutral. Accordingly, the chemical durability of
rare-earth phosphate materials under those conditions can be studied by conducting the leaching
experiments in harsh media (e.g., acidic and basic solutions). The use of acidic and basic
solutions also speeds up the leaching of the materials and would effectively simulate the long-
167
term exposure of wasteforms to groundwater.249,258,259
The leaching studies can also be conducted
using natural groundwater samples collected from sites proposed for geological repository
construction. It is reported in the literature that the rhabdophane mineral grows on the surface of
monazite minerals as a result of aqueous alteration of the latter.126,128–134
Therefore, it is important
to determine if the surface of the synthetic monazite samples could be chemically altered in a
reasonable time scale to produce a thick surface layer with a chemical composition resembling
that of rhabdophane. This study could be conducted by exposing the pellets of synthetic
analogues of monazite material to strong basic or acidic solutions for long periods of time. After
the leaching experiments, the surface of the pellets could be examined using glancing angle XRD
and XANES. Formation of the rhabdophane phase on the surface of monazite material can be
confirmed by comparing the glancing angle XRD and XANES data of the surface of the pellet
with that of a standard rhabdophane material.

168
REFERENCES
(1) United Nations, Department of Economic and Social Affairs, Population Division (2015).
World Population Prospects: The 2015 Revision, Key Findings and Advance Tables.
Working Paper No. ESA/P/WP.241
(2) Asif, M.; Muneer, T. Renew. Sustain. Energy Rev. 2007, 11, 1388–1413.
(3) Franco, S.; Mandla, V. R.; Ram Mohan Rao, K. Renew. Sustain. Energy Rev. 2017, 71,
898–907.
(4) Höök, M.; Tang, X. Energy Policy 2013, 52, 797–809.
(5) Newbold, K. B. 2017. Population Growth. The International Encyclopedia of Geography.
1-6.
(6) Wang, J.; Feng, L.; Tang, X.; Bentley, Y.; Höök, M. Futures 2017, 86, 58–72.
(7) Hoffert, M. I.; Caldeira, K.; Benford, G.; Criswell, D. R.; Green, C.; Herzog, H.; Jain, A.
K.; Kheshgi, H. S.; Lackner, K. S.; Lewis, J. S.; Lightfoot, H. D.; Manheimer, W.;
Mankins, J. C.; Mauel, M. E.; Perkins, L. J.; Schlesinger, M. E.; Volk, T.; Wigley, T. M.
L. Science 2002, 298, 981–987.
(8) Menyah, K.; Wolde-Rufael, Y. Energy Policy 2010, 38, 2911–2915.
(9) Dresselhaus, M. S.; Thomas, I. L. Nature 2001, 414, 332–337.
(10) Panwar, N. L.; Kaushik, S. C.; Kothari, S. Renew. Sustain. Energy Rev. 2011, 15, 1513–
1524.
169
(11) Lund, H. Energy 2007, 32, 912–919.
(12) Eerkens, J. W. Renewable Energy Sources and Their Limitations. The Nuclear Imperative:
A Critical Look at the Approaching Energy Crisis (More Physics for Presidents), 2nd
Edition; Springer: Netherland, 2010; pp 65-75.
(13) Evans, A.; Strezov, V.; Evans, T. J. Renew. Sustain. Energy Rev. 2009, 13, 1082–1088.
(14) Painuly, J. P. Renew. Energy 2001, 24, 73–89.
(15) Zinkle, S. J.; Was, G. S. Acta Mater. 2013, 61, 735–758.
(16) Jewell, J. Energy Policy 2011, 39, 1041–1055.
(17) Sims, R. E. H.; Rogner, H. H.; Gregory, K. Energy Policy 2003, 31, 1315–1326.
(18) International Energy Agency. Key World Energy Statistics; Paris, 2016.
(19) Pękala, Ł. M.; Tan, R. R.; Foo, D. C. Y.; Jeżowski, J. M. Appl. Energy 2010, 87, 1903–
1910.
(20) Abbott, D. Proc. IEEE 2010, 98, 42–66.
(21) Ewing, R. C. Can. Mineral. 2001, 39, 697-715.
(22) Sellin, P.; Leupin, O. X. Clays Clay Miner. 2014, 61, 477-498.
(23) Ewing, R. C.; Whittleston, R. A.; Yardley, B. W. D. Elements 2016, 12, 233-237.
(24) Ewing, R. C. Proc. Natl. Acad. Sci. 1999, 96, 3432–3439.
(25) McCloy, J. S.; Goel, A. MRS Bull. 2017, 42, 233–240.
170
(26) Montel, J.-M. Comptes Rendus Geosci. 2011, 343, 230–236.
(27) Hubbert, M. K. Nuclear Energy and The Fossil Fuel. Presented at the Spring Meeting of
the Southern District, Division of Production, American Petroleum Institute, San Antonio,
Texas, March 7-9, 1956.
(28) Ewing, R. C. Can. Mineral. 2005, 43, 2099–2116.
(29) The nuclear fuel cycle : from ore to wastes; Wilson, P. D., Ed.; Oxford University Press:
New York, 1996.
(30) Dreicer, M.; Tort, V.; Margerie, H. Nuclear Fuel Cycle: Implementation in France; Final
Report Prepared for Directorate General XII of the Commission of the European
Communities in the Framework of the ExternE Project, Contract No. CCE/ARMINES
JOU2-CT92-0236; August, 1995.
(31) Lenzen, M. Energy Convers. Manag. 2008, 49, 2178–2199.
(32) Lehmann, B. Rev. Econ. Geol. 2008, No. 2, 16–26.
(33) Raffensperger, J. P.; Garven, G. Am. J. Sci. 1995, 295, 639–696.
(34) OECD Nuclear Energy Agency. Uranium 2007: Resources, Production and Demand; A
Joint Report by the OECD Nuclear Energy Agency and the International Atomic Energy
Agency; OECD, Paris, 2008.
(35) OECD Nuclear Energy Agency. Trends in the Nuclear Fuel Cycle: Economic,
Environmental and Social Aspect, OECD, Paris, 2001
(36) Rosman, K. J. R.; Taylor, P. D. P. Pure Appl. Chem. 1998, 70, 217–235.

171
(37) International Atomic Energy Agency. Nuclear Fuel Cycle Information System: A
Directory of Nuclear Fuel Cycle Facilities; IAEA-TECDOC-1613; IAEA, Vienna, 2009.
(38) Bruno, J.; Ewing, R. C. Elements 2007, 2, 343-349.
(39) Bunn, M.; Holdren, J. P.; Pickett, S. E.; Weeks, J.; Macfarlane, A. Interim Storage of
Spent Nuclear Fuel: A Safe, Flexible, and Cost-Effective Approach to Spent Fuel
Management; Cambridge: Managing the Atom Project, Harvard University and Project on
Sociotechnics of Nuclear Energy, University of Tokyo, 2001
(40) Ewing, R. C. Nat Mater 2015, 14, 252–257.
(41) International Atomic Energy Agency. Estimation of Global Inventories of Radioactive
Waste and Other Radioactive Materials; IAEA-TECDOC-1591, IAEA, Vienna, 2008.
(42) International Atomic Energy Agency. Survey of Wet and Dry Spent Fuel Storage; IAEA-
TECDOC-1100; IAEA, Vienna, 1999.
(43) International Atomic Energy Agency. Geological Disposal Facilities for Radioactive
Waste; Specific Safety Guide No. SSG-14; IAEA, Vienna, 2011.
(44) Macfarlane, A. Annu. Rev. Energy Environ. 2001, 26, 201–235.
(45) Sovacool, B. K. Energy Policy 2008, 36, 2950–2963.
(46) Bodansky, D. Phys. Today 2006, 59, 80–81.
(47) Ewing, R. C.; Runde, W.; Albrecht-Schmitt, T. E. MRS Bull. 2010, 35, 859–866.
(48) Kuno, M.; Hamada, M. Radioactive Waste Treatment and Disposal Technique. In
Earthquake Engineering for Nuclear Facilities; Hamada M., Kuno, M., Eds.; Springer,
172
Singapore, 2017; pp 211-228.
(49) Plodinec, M. J. Glas. Technol. 2000, 41, 186–192.
(50) Weber, W. J.; Navrotsky, A.; Stefanovsky, S.; Vance, E. R.; Vernaz, E. MRS Bull. 2009,
34, 46–53.
(51) Harrison, M. T. Procedia Mater. Sci. 2014, 7, 10–15.
(52) Lee, W. E.; Ojovan, M. I.; Stennett, M. C.; Hyatt, N. C. Adv. Appl. Ceram. 2006, 105, 3–
12.
(53) Apted, M.; Ahn, J. Multiple-barrier geological repository design and operation strategies
for safe disposal of radioactive materials. In Geological Repository Systems for Safe
Disposal of Spent Nuclear Fuels and Radioactive Waste; Ahn, J., Apted, M. J., Eds.;
Woodhead Publishing Series in Energy, 2010; Vol. 9, pp 3–28.
(54) Hedin, A.; Olsson, O. Elements 2016, 12, 247–252.
(55) Grambow, B. Elements 2016, 12, 239–245.
(56) Metlay, D. S. Elements 2016, 12, 269-274.
(57) Johnson, B.; Newman, A.; King, J. Ann. Oper. Res. 2017, 253, 733–755.
(58) Ewing, R. C.; Weber, W. J. Nuclear Waste Management and Disposal. In Fundamentals of
Materials for Energy and Environmental Sustainability; Ginley, D. S., Cahen, D., Eds.,;
Cambridge University Press: New York, 2012; pp 178–193.
(59) Donald, I.; Metcalfe, B. L.; Taylor, R. N. J. J. Mater. Sci. 1997, 32, 5851–5887.
173
(60) Ewing, R. C. Proc. Natl. Acad. Sci. U. S. A. 1999, 96, 3432–3439.
(61) Lumpkin, G. R. Elements 2007, 2, 365-372.
(62) Gin, S.; Abdelouas, A.; Criscenti, L. J.; Ebert, W. L.; Ferrand, K.; Geisler, T.; Harrison,
M. T.; Inagaki, Y.; Mitsui, S.; Mueller, K. T.; Marra, J. C.; Pantano, C. G.; Pierce, E. M.;
Ryan, J. V; Schofield, J. M.; Steefel, C. I.; Vienna, J. D. Mater. Today 2013, 16, 243–248.
(63) Fournier, M.; Gin, S.; Frugier, P. J. Nucl. Mater. 2014, 448, 348–363.
(64) Poinssot, C.; Gin, S. J. Nucl. Mater. 2012, 420, 182–192.
(65) Ojovan, M. I.; Lee, W. E. Immobilization of Radioactive Wastes in Glass. In An
Introduction to Nuclear Waste Immobilisation; Ojovan, M. I., Lee, W. E., Eds.; Elsevier:
Oxford, 2005; pp 213–249.
(66) Ojovan, M. I.; Batyukhnova, O. G. Glasses for Nuclear Waste Immobilization.
Proceedings of the WM'07 Conference, Tucson, AZ, February 25 - March 1, 2007
(67) Mesko, M. G.; Day, D. E. J. Nucl. Mater. 1999, 273, 27–36.
(68) Bohre, A.; Avasthi, K.; Pet’kov, V. I. J. Ind. Eng. Chem. 2017, 50, 1–14.
(69) Grambow, B. Elements 2007, 2, 357-364.
(70) Vienna, J. D.; Ryan, J. V; Gin, S.; Inagaki, Y. Int. J. Appl. Glas. Sci. 2013, 4, 283–294.
(71) Jantzen, C. M.; Brown, K. G.; Pickett, J. B. Int. J. Appl. Glas. Sci. 2010, 1, 38–62.
(72) Weber, W. J. Procedia Mater. Sci. 2014, 7, 237–246.
(73) Connelly, A. J.; Hand, R. J.; Bingham, P. A.; Hyatt, N. C. J. Nucl. Mater. 2011, 408, 188–
174
193.
(74) Utton, C. A.; Swanton, S. W.; Schofield, J.; Hand, R. J.; Clacher, A.; Hyatt, N. C. Mineral.
Mag. 2013, 76, 2919-2930.
(75) Barkatt, A.; Barkatt, A.; Pehrsson, P. E.; Szoke, P.; Macedo, P. B. Nucl. Chem. Waste
Manag. 1981, 2, 151–164.
(76) Gin, S. Procedia Mater. Sci. 2014, 7, 163–171.
(77) Ringwood, A. E.; Willis, P. Nature 1984, 311, 735–737.
(78) Weber, W. J.; Ewing, R. C.; Catlow, C. R. A.; de la Rubia, T. D.; Hobbs, L. W.; Kinoshita,
C.; Matzke, H.; Motta, A. T.; Nastasi, M.; Salje, E. K. H.; Vance, E. R.; Zinkle, S. J. J.
Mater. Res. 1998, 13, 1434–1484.
(79) Farnan, I.; Cho, H.; Weber, W. J. Nature 2007, 445, 190–193.
(80) Hatch, L. P. Am. Sci. 1953, 41, 410–421.
(81) Lumpkin, G. R.; Smith, K. L.; Gieré, R.; Williams, C. T. Geol. Soc. London, Spec. Publ.
2004, 236, 89-111.
(82) Stefanovsky, S. V; Yudintsev, S. V; Gieré, R.; Lumpkin, G. R. Geol. Soc. London, Spec.
Publ. 2004, 236, 37-63.
(83) Ringwood, A. E.; Oversby, V. M.; Kesson, S. E.; Sinclair, W.; Ware, N.; Hibberson, W.;
Major, A. Nucl. Chem. Waste Manag. 1981, 2, 287–305.
(84) Kessoft, S. E.; Sinclair, W. J.; Ringwood, A. E. Nucl. Chem. Waste Manag. 1983, 4, 259–
265.
175
(85) Ringwood, a. E. Mineral. Mag. 1985, 49, 159–176.
(86) Ringwood, A. E.; Oversby, V. M.; Sinclair, W. The Effects of Radiation Damage on
Synroc. In Scientific Basis for Nuclear Waste Management; Northrup, C. J. M., Ed.;
Springer: Boston, 1980; Vol.2, pp 273–280.
(87) Vance, E. R. MRS Bull. 1994, 19, 28–32.
(88) Oelkers, E. H.; Montel, J.-M. Elements 2008, 4, 113–116.
(89) Meldrum, a.; Boatner, L.; Ewing, R. Phys. Rev. B 1997, 56, 13805–13814.
(90) Bailey, D. J.; Stennett, M. C.; Hyatt, N. C. Procedia Chem. 2016, 21, 371–377.
(91) Wang, S. .; Wang, L. .; Ewing, R. .; Was, G. .; Lumpkin, G. . Nucl. Instruments Methods
Phys. Res. Sect. B Beam Interact. with Mater. Atoms 1999, 148, 704–709.
(92) Schlenz, H.; Heuser, J.; Neumann, A.; Schmitz, S.; Bosbach, D. Z. Kristallog. Cryst.
Mater. 2013, 228, 113-123.
(93) Meldrum, A.; Boatner, L. A.; Weber, W. J.; Ewing, R. C. Geochim. Cosmochim. Acta
1998, 62, 2509–2520.
(94) Lian, J.; Zu, X. T.; Kutty, K. V. G.; Chen, J.; Wang, L. M.; Ewing, R. C.; Ewing, R. C.
Phys. Rev. B - Condens. Matter Mater. Phys. 2002, 66, 541081–541085.
(95) Yudintsev, S. V.; Lizin, A. a.; Livshits, T. S.; Stefanovsky, S. V.; Tomilin, S. V.; Ewing,
R. C. J. Mater. Res. 2015, 7, 1–13.
(96) Trachenko, K. J. Phys. Condens. Matter 2004, 16, R1491–R1515.
176
(97) Urusov, V. S.; Grechanovsky, A. E.; Eremin, N. N. Glas. Phys. Chem. 2012, 38, 55–62.
(98) Men, D.; Patel, M. K.; Usov, I. O.; Toiammou, M.; Monnet, I.; Pivin, J. C.; Porter, J. R.;
Mecartney, M. L. J. Nucl. Mater. 2013, 443, 120–127.
(99) Ewing, R. C.; Weber, W. J.; Clinard, F. W. Prog. Nucl. Energy 1995, 29, 63–127.
(100) Ewing, R. C.; Weber, W. J. Actinide Waste Forms and Radiation Effects. In The
Chemistry of the Actinide and Transactinide Elements; Morss, L. R., Edelstein, N. M.,
Fuger, J., Eds.; Springer: Dordrecht, 2011; Vol. 6, pp 3813–3887.
(101) Stanek, C. R.; Uberuaga, B. P.; Scott, B. L.; Feller, R. K.; Marks, N. A. Curr. Opin. Solid
State Mater. Sci. 2012, 16, 126–133.
(102) Thomé, L.; Debelle, A.; Garrido, F.; Mylonas, S.; Décamps, B.; Bachelet, C.; Sattonnay,
G.; Moll, S.; Pellegrino, S.; Miro, S.; Trocellier, P.; Serruys, Y.; Velisa, G.; Grygiel, C.;
Monnet, I.; Toulemonde, M.; Simon, P.; Jagielski, J.; Jozwik-Biala, I.; Nowicki, L.; Behar,
M.; Weber, W. J.; Zhang, Y.; Backman, M.; Nordlund, K.; Djurabekova, F. Nucl.
Instruments Methods Phys. Res. Sect. B Beam Interact. with Mater. Atoms 2013, 307, 43–
48.
(103) Ewing, R. C. Comptes Rendus Geosci. 2011, 343, 219–229.
(104) Picot, V.; Deschanels, X.; Peuget, S.; Glorieux, B.; Seydoux-Guillaume, A. M.; Wirth, R.
J. Nucl. Mater. 2008, 381, 290–296.
(105) McVay, G. L.; Weber, W. J.; Pederson, L. R. Nucl. Chem. Waste Manag. 1981, 2, 103–
108.

177
(106) Deschanels, X.; Seydoux-Guillaume, A. M.; Magnin, V.; Mesbah, A.; Tribet, M.;
Moloney, M. P.; Serruys, Y.; Peuget, S. J. Nucl. Mater. 2014, 448, 184–194.
(107) Ewing, R. C.; Meldrum, A.; Wang, L.; Wang, S. Rev. Mineral. Geochemistry 2000, 39,
319–361.
(108) Interface Science Western
http://www.isw.physics.uwo.ca/facilities_techniques/ion_implantation.html (Accessed
October 28, 2017).
(109) Naab, F. U.; Toader, O. F.; Was, G. S. Phys. Procedia 2015, 66, 632–640.
(110) Long, K. R.; Van Gosen, B. S.; Foley, N. K.; Cordier, D. The principal rare earth
elements deposits of the United States - A summary of domestic deposits and a global
perspective; U.S. Geological Survey Scientific Investigations Report 2010-5220; USGS:
Virginia, 2010
(111) Zepf, V. Rare Earth Elements: What and Where They Are. In Rare Earth Elements.
Springer Theses (Recognizing Outstanding Ph.D. Research); Springer: Heidelberg, 2013;
pp 11–39.
(112) Voncken, J. H. L. The Ore Minerals and Major Ore Deposits of the Rare-Earths. In The
Rare Earth Elements; SpringerBriefs in Earth Sciences, Springer: Cham, 2016; pp 15–52.
(113) Boatner, L. A. Rev. Mineral. Geochemistry 2002, 48, 87–121.
(114) Forster, H. J. Am. Mineral. 1998, 83, 1302–1315.
(115) van Emden, B.; Thornber, M. R.; Graham, J.; Lincoln, F. J. Can. Mineral. 1997, 35, 95-

178
104.
(116) Spear, F. S.; Pyle, J. M. Rev. Mineral. Geochemistry 2002, 48, 293-335.
(117) Lu, F.; Shen, Y.; Sun, X.; Dong, Z.; Ewing, R. C.; Lian, J. Acta Mater. 2013, 61, 2984–
2992.
(118) Hikichi, Y.; Nomura, T.; Tanimura, Y.; Suzuki, S.; Miyamoto, M. J. Am. Ceram. Soc.
1990, 73, 3594–3596.
(119) Tomašić, N.; Gajović, A.; Bermanec, V.; Su, D. S.; Rajić Linarić, M.; Ntaflos, T.; Schlögl,
R. Phys. Chem. Miner. 2006, 33, 145.
(120) Seydoux-Guillaume, A. M.; Wirth, R.; Nasdala, L.; Gottschalk, M.; Montel, J. M.;
Heinrich, W. Phys. Chem. Miner. 2002, 29, 240–253.
(121) Vance, E. R.; Zhang, Y.; McLeod, T.; Davis, J. J. Nucl. Mater. 2011, 409, 221–224.
(122) Karioris, F. G.; Gowda, K. A.; Cartz, L. Radiat. Eff. Lett. 1981, 58, 1–3.
(123) Meldrum, A.; Boatner, L. A.; Wang, L. M.; Ewing, R. C. Nucl. Instruments Methods Phys.
Res. Sect. B-Beam Interact. with Mater. Atoms 1997, 127, 160–165.
(124) Meldrum, A.; Wang, L. M.; Ewing, R. C. Nucl. Instruments Methods Phys. Res. Sect. B
Beam Interact. with Mater. Atoms 1996, 116, 220–224.
(125) Dacheux, N.; Clavier, N.; Podor, R. Am. Mineral. 2013, 98, 833-847.
(126) Mesbah, A.; Clavier, N.; Elkaim, E.; Gausse, C.; Kacem, I. Ben; Szenknect, S.; Dacheux,
N. Cryst. Growth Des. 2014, 14, 5090–5098.

179
(127) Qin, D.; Mesbah, A.; Gausse, C.; Szenknect, S.; Dacheux, N.; Clavier, N. J. Nucl. Mater.
2017, 492, 88–96.
(128) Nagy, G.; Draganits, E.; Demény, A.; Pantó, G.; Árkai, P. Chem. Geol. 2002, 191, 25–46.
(129) Du Fou de Kerdaniel, E.; Clavier, N.; Dacheux, N.; Terra, O.; Podor, R. J. Nucl. Mater.
2007, 362, 451–458.
(130) Ochiai, A.; Utsunomiya, S. Minerals 2017, 7, 84.
(131) Krenn, E.; Finger, F. Lithos 2007, 95, 130–147.
(132) Berger, A.; Gnos, E.; Janots, E.; Fernandez, A.; Giese, J. Chem. Geol. 2008, 254, 238–248.
(133) Jonasson, R. G.; Bancroft, G. M.; Boatner, L. A. Geochim. Cosmochim. Acta 1988, 52,
767–770.
(134) Clavier, N.; Dacheux, N.; Podor, R. Inorg. Chem. 2006, 45, 220–229.
(135) Ni, Y.; Hughes, J. M.; Mariano, A. N. Am. Mineral. 1995, 80, 21–26.
(136) Clavier, N.; Podor, R.; Dacheux, N. J. Eur. Ceram. Soc. 2011, 31, 941–976.
(137) Kolitsch, U.; Holtstam, D. Eur. J. Mineral. 2004, 16, 117–126.
(138) Milligan, W. O.; Mullica, D. F.; Beall, G. W.; Boatner, L. A. Inorganica Chim. Acta 1982,
60, 39–43.
(139) Beall, G. W.; Boatner, L. A.; Mullica, D. F.; Milligan, W. O. J. Inorg. Nucl. Chem. 1981,
43, 101–105.
(140) Mullica, D. F.; Milligan, W. O.; Grossie, D. A.; Beall, G. W.; Boatner, L. A. Inorganica
180
Chim. Acta 1984, 95, 231–236.
(141) Mooney, R. C. L. J. Chem. Phys. 1948, 16, 1003.
(142) Mooney, R. C. L. Acta Crystallogr. 1950, 3, 337–340.
(143) Ferhi, M.; Horchani-Naifer, K.; Férid, M. J. Lumin. 2008, 128, 1777–1782.
(144) Lu, S.; Zhang, J.; Zhang, J.; Zhao, H.; Luo, Y.; Ren, X. Nanotechnology 2010, 21, 365709.
(145) Di, W.; Li, J.; Shirahata, N.; Sakka, Y.; Willinger, M.-G.; Pinna, N. Nanoscale 2011, 3,
1263–1269.
(146) Wang, X.; Gao, M. J. Mater. Chem. 2006, 16, 1360–1365.
(147) Buissette, V.; Moreau, M.; Gacoin, T.; Boilot, J. P.; Chane-Ching, J. Y.; Le Mercier, T.
Chem. Mater. 2004, 16, 3767–3773.
(148) Momma, K.; Izumi, F. J. Appl. Crystallogr. 2008, 41, 653–658.
(149) Rehr, J. J.; Kas, J. J.; Vila, F. D.; Newville, M. Theory and Analysis of XAFS. In XAFS
Techniques for Catalysts, Nanomaterials, and Surfaces; Iwasawa, Y., Asakura, K., Tada,
M., Eds.; Springer: Cham, 2017; pp 13–50.
(150) Balerna, A.; Mobilio, S. Introduction to Synchrotron Radiation. In Synchrotron Radiation:
Basics, Methods and Applications; Mobilio, S., Boscherini, F., Meneghini, C., Eds.;
Springer: Heidelberg, 2015; pp 3–28.
(151) Willmott, P. Spectroscopic Techniques. In An Introduction to Synchrotron Radiation; John
Wiley & Sons, Ltd: Chichester, 2011; pp 223–302.
181
(152) Newville, M. Rev. Mineral. Geochemistry 2014, 78, 33-74.
(153) Penner-Hahn, J. E. Coord. Chem. Rev. 1999, 190, 1101–1123.
(154) Schnohr, C. S.; Ridgway, M. C. Introduction to X-ray Absorption Spectroscopy. In X-Ray
Absorption Spectroscopy of Semiconductors; Schnohr, C. S., Ridgway, M. C., Eds.;
Springer Series in Optical Sciences, Springer: Heidelberg, 2015; Vol. 190, pp 1–26.
(155) Willmott, P. The Interaction of X-rays with Matter. In An Introduction to Synchrotron
Radiation; John Wiley & Sons, Ltd: Chichester, 2011; pp 15–37.
(156) Wende, H. Reports Prog. Phys. 2004, 67, 2105–2181.
(157) Yano, J.; Yachandra, V. K. Photosynth. Res. 2009, 102, 241.
(158) Penner-Hahn, J. E. X-ray Absorption Spectroscopy. eLS 2005, 1-4.
(159) Henderson, G. S.; de Groot, F. M. F.; Moulton, B. J. A. Rev. Mineral. Geochemistry 2014,
78, 75-138.
(160) Yamazoe, S.; Hitomi, Y.; Shishido, T.; Tanaka, T. J. Phys. Chem. C 2008, 112, 6869–
6879.
(161) Yamamoto, T. X-Ray Spectrom. 2008, 37, 572–584.
(162) Aluri, E. R.; Hayes, J. R.; Walker, J. D. S.; Grosvenor, A. P. J. Phys. Chem. C 2014, 118,
7910–7922.
(163) Bunker, G. Introduction to XAFS: A Practical Guide to X-ray Absorption Fine Structure
Spectroscopy; Cambridge University Press, 2010.
182
(164) Willmott, P. Synchrotron Physics. In An Introduction to Synchrotron Radiation; John
Wiley & Sons, Ltd: Chichester, 2011; pp 39–86.
(165) Aquilanti, G.; Vaccari, L.; Plaisier, J. R.; Goldoni, A. Instrumentation at Synchrotron
Radiation Beamlines. In Synchrotron Radiation: Basics, Methods and Applications;
Mobilio, S., Boscherini, F., Meneghini, C., Eds.; Springer: Heidelberg, 2015; pp 65–104.
(166) Willmott, P. Beamlines. In An Introduction to Synchrotron Radiation; John Wiley & Sons,
Ltd: Chichester, 2011; pp 87–131.
(167) Margaritondo, G. Characteristics and Properties of Synchrotron Radiation. In Synchrotron
Radiation: Basics, Methods and Applications; Mobilio, S., Boscherini, F., Meneghini, C.,
Eds.; Springer: Heidelberg, 2015; pp 29–63.
(168) Fornasini, P. Introduction to X-ray Absorption Spectroscopy. In Synchrotron Radiation:
Basics, Methods and Applications; Mobilio, S., Boscherini, F., Meneghini, C., Eds.;
Springer: Heidelberg, 2015; pp 181–211.
(169) Waychunas, G. A. Rev. Mineral. Geochemistry 2002, 49, 267-315.
(170) van der Heide, P. Introduction. In X-Ray Photoelectron Spectroscopy: An Introduction to
Principles and Practices; John Wiley & Sons, Inc.: Hoboken, NJ, USA, 2011; pp 1–12.
(171) Hüfner, S.; Schmidt, S.; Reinert, F. Nucl. Instruments Methods Phys. Res. Sect. A Accel.
Spectrometers, Detect. Assoc. Equip. 2005, 547, 8–23.
(172) Sarma, D. D.; Santra, P. K.; Mukherjee, S.; Nag, A. Chem. Mater. 2013, 25, 1222–1232.
(173) Weimer, J. J. X-ray Photoelectron Spectroscopy. In Characterization of Materials; John
183
Wiley & Sons, Inc., 2002; pp 1-43.
(174) Gratz, R.; Heinrich, W. Am. Mineral. 1997, 82, 772-780.
(175) Heinrich, W.; Rehs, G.; Franz, G. J. Metamorph. Geol. 1997, 15, 3–16.
(176) Van Emden, B.; Thornber, M. R.; Graham, J.; Lincoln, F. J. Solid Solution Behaviour of
Synthetic Monazite and Xenotime from Structure Refinement of Powder Data. Advances
in X-ray Analysis - Proceedings of the 45th Annual X-ray Conference, Denver, Colarado,
USA; 1997.
(177) Andrehs, G.; Heinrich, W. Chem. Geol. 1998, 149, 83–96.
(178) Degen, T.; Sadki, M.; Bron, E.; König, U.; Nénert, G. Powder Diffr. 2014, 29, S13–S18.
(179) Hu, Y. F.; Coulthard, I.; Chevrier, D.; Wright, G.; Igarashi, R.; Sitnikov, A.; Yates, B. W.;
Hallin, E. L.; Sham, T. K.; Reininger, R. AIP Conf. Proc. 2010, 1234, 343–346.
(180) Thompson, A.; Attwood, D.; Gullikson, E. M.; Howells, M.; Kim, K.--J.; Kirz, J.;
Kortright, J.; Lindau, I.; Yanwei, L.; Pianetta, P.; Robinson, A.; Scofield, J.; Underwood,
J.; Williams, G.; Winick, H.; Thompson, A.; Attwood, D.; Gullikson, E. M.; Howells, M.;
Kortright, J.; Robinson, L. F.; Underwood, J.; Kim, K.--J.; Kirz, J.; Lindau, I.; Pianetta, P.;
Winick, H.; Williams, G.; Scofield, J. X-ray data booklet; Lawrence Berkeley National
Laboratory: Berkeley 2009.
(181) Ravel, B.; Newville, M. J. Synchrotron Radiat. 2005, 12, 537–541.
(182) Hu, Y. F.; Zuin, L.; Reininger, R.; Sham, T. K. AIP Conf. Proc. 2007, 879, 535–538.
(183) Regier, T.; Krochak, J.; Sham, T. K.; Hu, Y. F.; Thompson, J.; Blyth, R. I. R. Nucl.
184
Instruments Methods Phys. Res. Sect. A Accel. Spectrometers, Detect. Assoc. Equip. 2007,
582, 93–95.
(184) Martin, R. L.; Shirley, D. A. J. Chem. Phys. 1976, 64, 3685.
(185) Fairley, N. CasaXPS Version 2.3.16 ; Casa Software Ltd (www.casaxps.com). 2011.
(186) Andersen, O. K.; Jepsen, O. Phys. Rev. Lett. 1984, 53, 2571–2574.
(187) Blöchl, P. E.; Jepsen, O.; Andersen, O. K. Phys. Rev. B 1994, 49, 16223–16233.
(188) Hayes, J. R.; Grosvenor, A. P. J. Phys. Condens. Matter 2011, 23, 465502.
(189) Tromp, M.; Moulin, J.; Reid, G.; Evans, J. AIP Conf. Proc. 2007, 882, 699–701.
(190) Clavier, N.; Podor, R.; Dacheux, N. J. Eur. Ceram. Soc. 2011, 31, 941–976.
(191) Ingall, E. D.; Brandes, J. A.; Diaz, J. M.; de Jonge, M. D.; Paterson, D.; McNulty, I.;
Elliott, W. C.; Northrup, P. J. Synchrotron Radiat. 2011, 18, 189–197.
(192) Gaultois, M. W.; Grosvenor, A. P. J. Phys. Chem. C 2010, 114, 19822–19829.
(193) Kruse, J.; Leinweber, P.; Eckhardt, K.-U.; Godlinski, F.; Hu, Y.; Zuin, L. J. Synchrotron
Radiat. 2009, 16, 247–259.
(194) de Groot, F. Coord. Chem. Rev. 2005, 249, 31–63.
(195) Li, D.; Bancroft, G. M.; Kasrai, M.; Fleet, M. E.; Feng, X. H.; Tan, K. H. Am. Mineral.
1994, 79, 785–788.
(196) Thole, B. T.; van der Laan, G.; Fuggle, J. C.; Sawatzky, G. A.; Karnatak, R. C.; Esteva, J.-
M. Phys. Rev. B 1985, 32, 5107–5118.
185
(197) Kaindl, G.; Kalkowski, G.; Brewer, W. D.; Perscheid, B.; Holtzberg, F. J. Appl. Phys.
1984, 55, 1910–1915.
(198) Allred, A. L. J. Inorg. Nucl. Chem. 1961, 17, 215–221.
(199) Ewing, R. C.; Wang, L. Rev. Mineral. Geochemistry 2002, 48, 673–699.
(200) Li, H.; Zhu, G.; Ren, H.; Li, Y.; Hewitt, I. J.; Qiu, S. Eur. J. Inorg. Chem. 2008, 2008,
2033–2037.
(201) Wang, L.; He, D.; Feng, S.; Yu, C.; Hu, L.; Qiu, J.; Chen, D. Sci. Rep. 2015, 5, 8490.
(202) Kitamura, N.; Amezawa, K.; Tomii, Y.; Yamamoto, N. Solid State Ionics 2003, 162–163,
161–165.
(203) Onoda, H.; Nariai, H.; Moriwaki, A.; Maki, H.; Motooka, I. J. Mater. Chem. 2002, 12,
1754–1760.
(204) Meiser, F.; Cortez, C.; Caruso, F. Angew. Chemie Int. Ed. 2004, 43, 5954–5957.
(205) Kijkowska, R. J. Mater. Sci. 2003, 8, 229–233.
(206) Mayence, A.; Navarro, J. R. G.; Ma, Y.; Terasaki, O.; Bergstro, L. Inorg. Chem. 2014, 53,
5067–5072.
(207) Heald, S. M.; Brewe, D. L.; Stern, E. A.; Kim, K. H.; Brown, F. C.; Jiang, D. T.; Crozier,
E. D.; Gordon, R. A. J. Synchrotron Radiat. 1999, 6, 347–349.
(208) Kijkowska, R. Thermochim. Acta 2003, 404, 81–88.
(209) Shannon, R. D. Acta Crystallogr. Sect. A 1976, 32, 751–767.
186
(210) Lucas, S.; Champion, E.; Bregiroux, D.; Bernache-Assollant, D.; Audubert, F. J. Solid
State Chem. 2004, 177, 1302–1311.
(211) Lucas, S.; Champion, E.; Bernache-Assollant, D.; Leroy, G. J. Solid State Chem. 2004,
177, 1312–1320.
(212) Asakura, H.; Shishido, T.; Fuchi, S.; Teramura, K.; Tanaka, T. J. Phys. Chem. C 2014,
118, 20881–20888.
(213) Ishii, M.; Crowe, I. F.; Halsall, M. P.; Hamilton, B.; Hu, Y.; Sham, T.-K.; Harako, S.;
Zhao, X.-W.; Komuro, S. J. Appl. Phys. 2013, 114, 133505.
(214) Asakura, H.; Shishido, T.; Teramura, K.; Tanaka, T. J. Phys. Chem. C 2015, 119, 8070–
8077.
(215) Asakura, H.; Shishido, T.; Teramura, K.; Tanaka, T. Inorg. Chem. 2014, 53, 6048–6053.
(216) Kennedy, B. J.; Avdeev, M. Solid State Sci. 2011, 13, 1701–1703.
(217) Lee, W. E.; Gilbert, M.; Murphy, S. T.; Grimes, R. W. J. Am. Ceram. Soc. 2013, 96, 2005–
2030.
(218) Men, D.; Patel, M. K.; Usov, I. O.; Toiammou, M.; Monnet, I.; Pivin, J. C.; Porter, J. R.;
Mecartney, M. L. J. Nucl. Mater. 2013, 443, 120–127.
(219) Burakov, B. E.; Yagovkina, M. A.; Garbuzov, V. M.; Kitsay, A. A.; Zirlin, V. A. MRS
Proc. 2004, 824.
(220) Urusov, V. S.; Grechanovsky, A. E.; Eremin, N. N. Glas. Phys. Chem. 2012, 38, 55–62.
(221) De Groot, F. Chem. Rev. 2001, 101, 1779–1808.
187
(222) Reid, D. P.; Stennett, M. C.; Ravel, B.; Woicik, J. C.; Peng, N.; Maddrell, E. R.; Hyatt, N.
C. Nucl. Instruments Methods Phys. Res. Sect. B Beam Interact. with Mater. Atoms 2010,
268, 1847–1852.
(223) Ziegler, J. F.; Ziegler, M. D.; Biersack, J. P. Nucl. Instruments Methods Phys. Res. Sect. B
Beam Interact. with Mater. Atoms 2010, 268, 1818–1823.
(224) Nasdala, L.; Grötzschel, R.; Probst, S.; Bleisteiner, B. Can. Mineral. 2010, 48, 351-359.
(225) Zhang, F. X.; Lang, M.; Ewing, R. C.; Lian, J.; Wang, Z. W.; Hu, J.; Boatner, L. A. J.
Solid State Chem. 2008, 181, 2633–2638.
(226) Rustad, J. R. Am. Mineral. 2012, 97, 791-799.
(227) X-ray Attenuation lengths http://henke.lbl.gov/optical_constants/atten2.html.
(228) Avci, R.; Davis, B. H.; Wolfenden, M. L.; Kellerman, L. R.; Lucas, K.; Martin, J.;
Deliorman, M. Corros. Sci. 2015, 93, 9–18.
(229) Balzar, D. J. Res. Natl. Inst. Stand. Technol. 1998, 98, 321–353.
(230) Ungár, T. Scr. Mater. 2004, 51, 777–781.
(231) Ackland, G. Science 2010, 327, 1587-1588.
(232) Bai, X.-M.; Voter, A. F.; Hoagland, R. G.; Nastasi, M.; Uberuaga, B. P. Science 2010,
327, 1631-1634.
(233) Shen, T. D.; Feng, S.; Tang, M.; Valdez, J. A.; Wang, Y.; Sickafus, K. E. Appl. Phys. Lett.
2007, 90, 263115.
188
(234) Watkins, G. D. Phys. Rev. Lett. 1974, 33, 223–225.
(235) Tan, H. H.; Jagadish, C.; Williams, J. S.; Zou, J.; Cockayne, D. J. H.; Sikorski, A. J. Appl.
Phys. 1995, 77, 87–94.
(236) Margalit, S.; Nemirovsky, Y.; Rotstein, I. 1993, 6386, 1–5.
(237) Prieur, D.; Vigier, J.-F.; Wiss, T.; Janssen, A.; Rothe, J.; Cambriani, A.; Somers, J. J. Solid
State Chem. 2014, 212, 7–12.
(238) Kruse, J.; Leinweber, P.; Eckhardt, K. U.; Godlinski, F.; Hu, Y.; Zuin, L. J. Synchrotron
Radiat. 2009, 16, 247–259.
(239) Tröger, L.; Arvanitis, D.; Baberschke, K.; Michaelis, H.; Grimm, U.; Zschech, E. Phys.
Rev. B 1992, 46, 3283–3289.
(240) Achkar, A. J.; Regier, T. Z.; Wadati, H.; Kim, Y.-J.; Zhang, H.; Hawthorn, D. G. Phys.
Rev. B 2011, 83, 81106.
(241) Strachan, D. M.; Turcotte, R. P.; Barnes, B. O. Nucl. Technol. 1982, 56, 306–312.
(242) ASTM C1285-02. ASTM, Conshohocken, USA, 2002. ASTM International 2002, pp 1–26.
(243) ASTM-C1662-10. ASTM, Conshohocken, USA, 2010. ASTM International 2010, pp 1–13.
(244) Hespe, E. D. At. Energy Rev. 1971, 9, 195–207.
(245) Dacheux, N.; Clavier, N.; Podor, R. Am. Mineral. 2013, 98, 833–847.
(246) Gausse, C.; Szenknect, S.; Qin, D. W.; Mesbah, A.; Clavier, N.; Neumeier, S.; Bosbach,
D.; Dacheux, N. Eur. J. Inorg. Chem. 2016, 2016, 4615–4630.
189
(247) Teng, Y.; Wang, X.; Huang, Y.; Wu, L.; Zeng, P. Ceram. Int. 2015, 41, 10057–10062.
(248) Kumar, S. P.; Gopal, B. J. Nucl. Mater. 2015, 458, 224–232.
(249) Teng, Y.; Zeng, P.; Huang, Y.; Wu, L.; Wang, X. J. Nucl. Mater. 2015, 465, 482–487.
(250) Sales, B. C.; White, C. W.; Boatner, L. A. Nucl. Chem. Waste Manag. 1983, 4, 281–289.
(251) ASTM C1285-14. ASTM, Conshohocken, USA, 2014. ASTM International 2014, pp 1–27.
(252) Stone, J. A. Nucl. Chem. Waste Manag. 1981, 2, 113–118.
(253) Kumar, R.; Das, S.; Ray, R. K.; Biswas, A. K. Hydrometallurgy 1993, 32, 39–59.
(254) Bois, L.; Guittet, M. J.; Carrot, F.; Trocellier, P.; Gautier-Soyer, M. J. Nucl. Mater. 2001,
297, 129–137.
(255) Szenknect, S.; Finkeldei, S.; Brandt, F.; Ravaux, J.; Odorico, M.; Podor, R.; Lautru, J.;
Dacheux, N.; Bosbach, D. J. Nucl. Mater. 2017, 496, 97–108.
(256) Finkeldei, S.; Brandt, F.; Rozov, K.; Bukaemskiy, A. A.; Neumeier, S.; Bosbach, D. Appl.
Geochemistry 2014, 49, 31–41.
(257) Grochala, W.; Hoffmann, R.; Feng, J.; Ashcroft, N. W. Angew. Chemie - Int. Ed. 2007, 46,
3620–3642.
(258) Angeli, F.; McGlinn, P.; Frugier, P. J. Nucl. Mater. 2008, 380, 59–69.
(259) ASTM C1308-08. ASTM, Conshohocken, USA, 2008. ASTM International 2008, pp 1–14.

190
Appendix A
SUPPORTING TABLES AND FIGURES FOR
CHAPTER 2
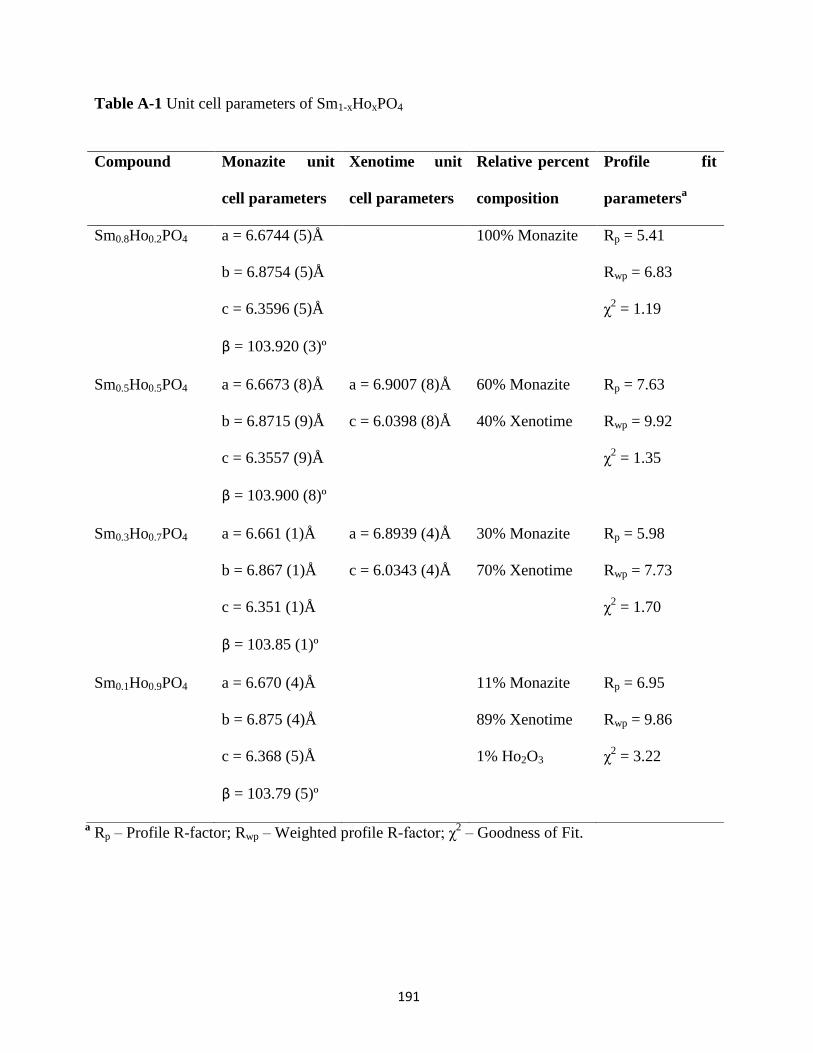
191
Table A-1 Unit cell parameters of Sm1-xHoxPO4
a Rp – Profile R-factor; Rwp – Weighted profile R-factor; χ
2 – Goodness of Fit.
Compound Monazite unit
cell parameters
Xenotime unit
cell parameters
Relative percent
composition
Profile fit
parametersa
Sm0.8Ho0.2PO4 a = 6.6744 (5)Å
b = 6.8754 (5)Å
c = 6.3596 (5)Å
β = 103.920 (3)º
100% Monazite Rp = 5.41
Rwp = 6.83
χ2 = 1.19
Sm0.5Ho0.5PO4 a = 6.6673 (8)Å
b = 6.8715 (9)Å
c = 6.3557 (9)Å
β = 103.900 (8)º
a = 6.9007 (8)Å
c = 6.0398 (8)Å
60% Monazite
40% Xenotime
Rp = 7.63
Rwp = 9.92
χ2 = 1.35
Sm0.3Ho0.7PO4 a = 6.661 (1)Å
b = 6.867 (1)Å
c = 6.351 (1)Å
β = 103.85 (1)º
a = 6.8939 (4)Å
c = 6.0343 (4)Å
30% Monazite
70% Xenotime
Rp = 5.98
Rwp = 7.73
χ2 = 1.70
Sm0.1Ho0.9PO4 a = 6.670 (4)Å
b = 6.875 (4)Å
c = 6.368 (5)Å
β = 103.79 (5)º
11% Monazite
89% Xenotime
1% Ho2O3
Rp = 6.95
Rwp = 9.86
χ2 = 3.22

192
Table A-2 Unit cell parameters of La1-xYxPO4
a Rp – Profile R-factor; Rwp – Weighted profile R-factor; χ
2 – Goodness of Fit.
Compound Monazite unit
cell parameters
Xenotime unit
cell parameters
Relative percent
composition
Profile fit
parametersa
La0.9Y0.1PO4 a = 6.8238 (5)
b = 7.0526 (5)
c = 6.4997 (5)
β = 103.356 (3)
100% Monazite Rp = 7.62
Rwp = 9.98
χ2 = 1.14
La0.6Y0.4PO4 a = 6.802 (1)
b = 7.026 (1)
c = 6.481 (1)
β = 103.434 (5)
a = 6.8831 (7)
c = 6.0203 (7)
74% Monazite
26% Xenotime
Rp =7.72
Rwp = 9.90
χ2 = 1.53
La0.5Y0.5PO4 a = 6.7964 (9)
b = 7.020 (1)
c = 6.476 (1)
β = 103.456 (6)
a = 6.8840 (7)
c = 6.0213 (6)
63% Monazite
37% Xenotime
Rp = 7.80
Rwp = 9.70
χ2 = 1.60
La0.4Y0.6PO4 a = 6.8017 (9)
b = 7.026 (1)
c = 6.480 (1)
β = 103.440 (7)
a = 6.8837 (4)
c = 6.0220 (3)
47% Monazite
53% Xenotime
Rp = 7.61
Rwp = 9.46
χ2 = 1.54
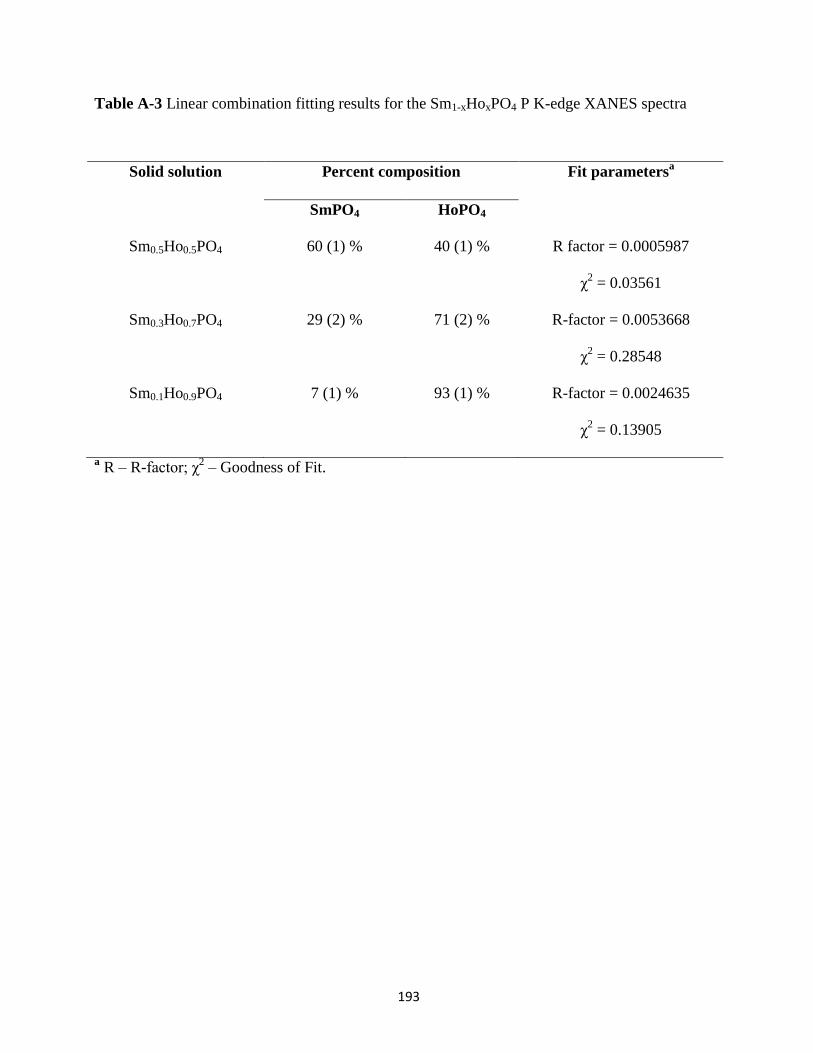
193
Table A-3 Linear combination fitting results for the Sm1-xHoxPO4 P K-edge XANES spectra
a R – R-factor; χ
2 – Goodness of Fit.
Solid solution Percent composition Fit parametersa
SmPO4 HoPO4
Sm0.5Ho0.5PO4 60 (1) % 40 (1) % R factor = 0.0005987
χ2 = 0.03561
Sm0.3Ho0.7PO4 29 (2) % 71 (2) % R-factor = 0.0053668
χ2 = 0.28548
Sm0.1Ho0.9PO4 7 (1) % 93 (1) % R-factor = 0.0024635
χ2 = 0.13905
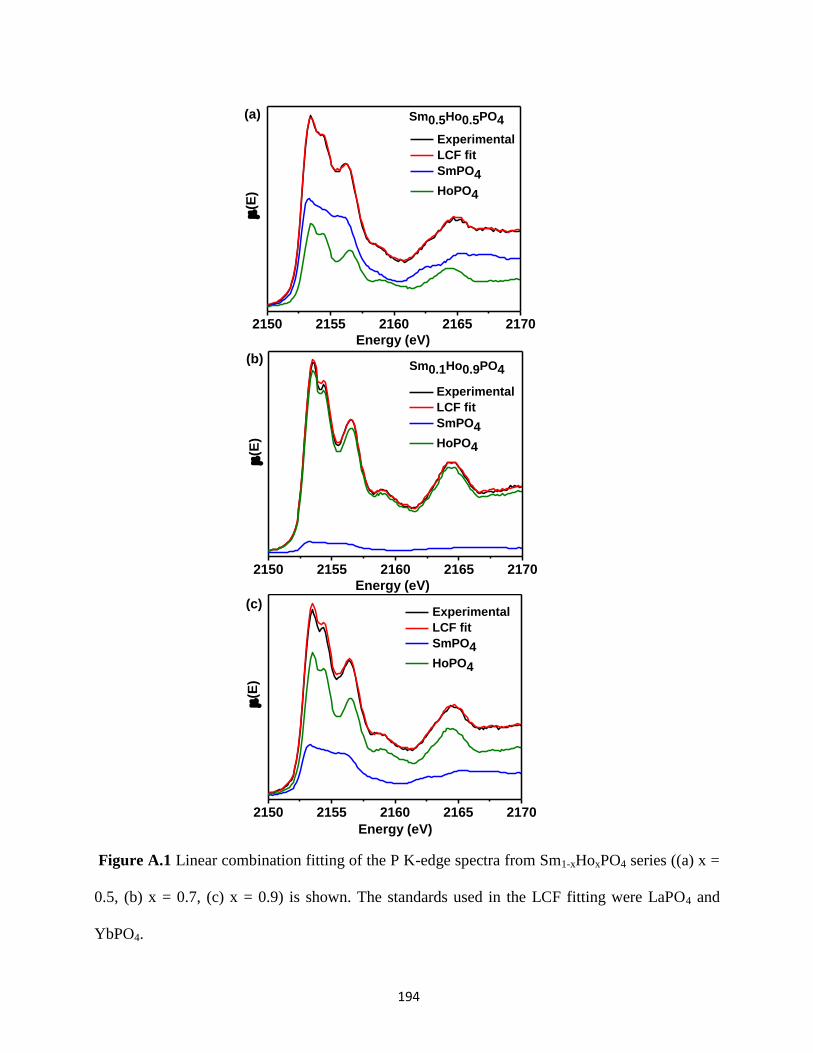
194
2150 2155 2160 2165 2170
Experimental
LCF fit
SmPO4
HoPO4
(E
)
Energy (eV)
(c)
2150 2155 2160 2165 2170
Experimental
LCF fit
SmPO4
HoPO4
(E
)
Energy (eV)
Sm0.1Ho0.9PO4(b)
2150 2155 2160 2165 2170
(E
)
Energy (eV)
Experimental
LCF fit
SmPO4
HoPO4
Sm0.5Ho0.5PO4(a)
Figure A.1 Linear combination fitting of the P K-edge spectra from Sm1-xHoxPO4 series ((a) x =
0.5, (b) x = 0.7, (c) x = 0.9) is shown. The standards used in the LCF fitting were LaPO4 and
YbPO4.
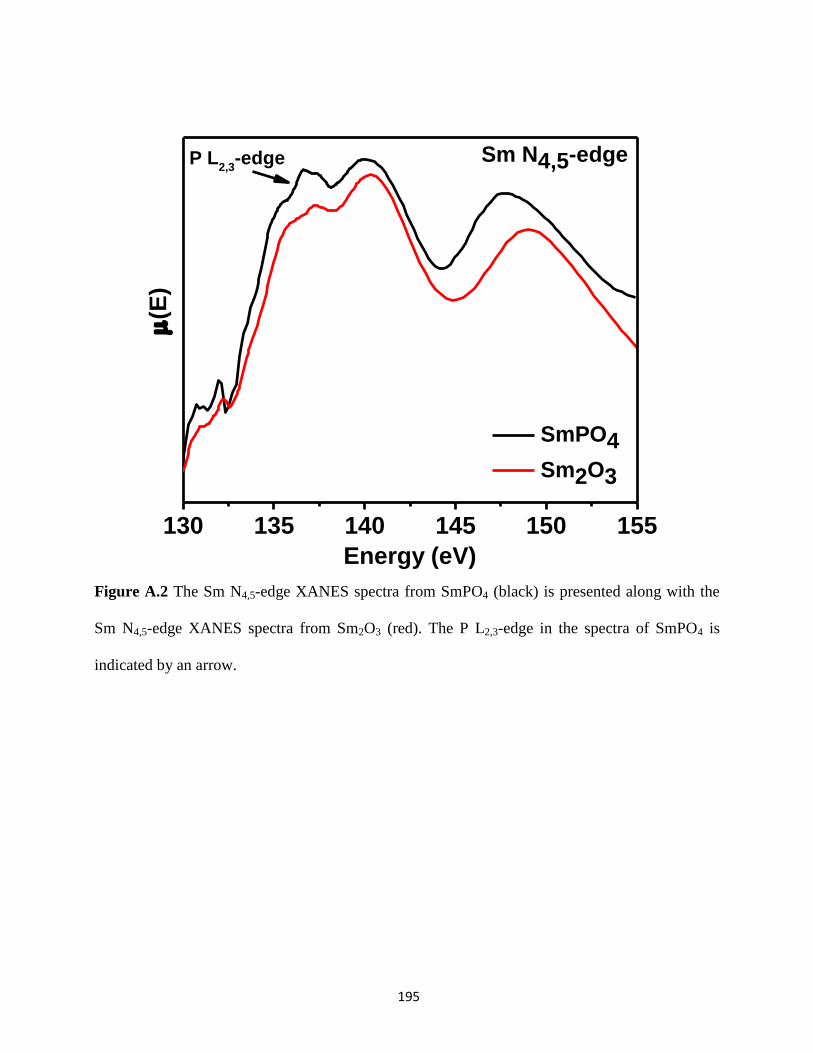
195
130 135 140 145 150 155
(E
)
Energy (eV)
SmPO4
Sm2O3
Sm N4,5-edgeP L2,3
-edge
Figure A.2 The Sm N4,5-edge XANES spectra from SmPO4 (black) is presented along with the
Sm N4,5-edge XANES spectra from Sm2O3 (red). The P L2,3-edge in the spectra of SmPO4 is
indicated by an arrow.
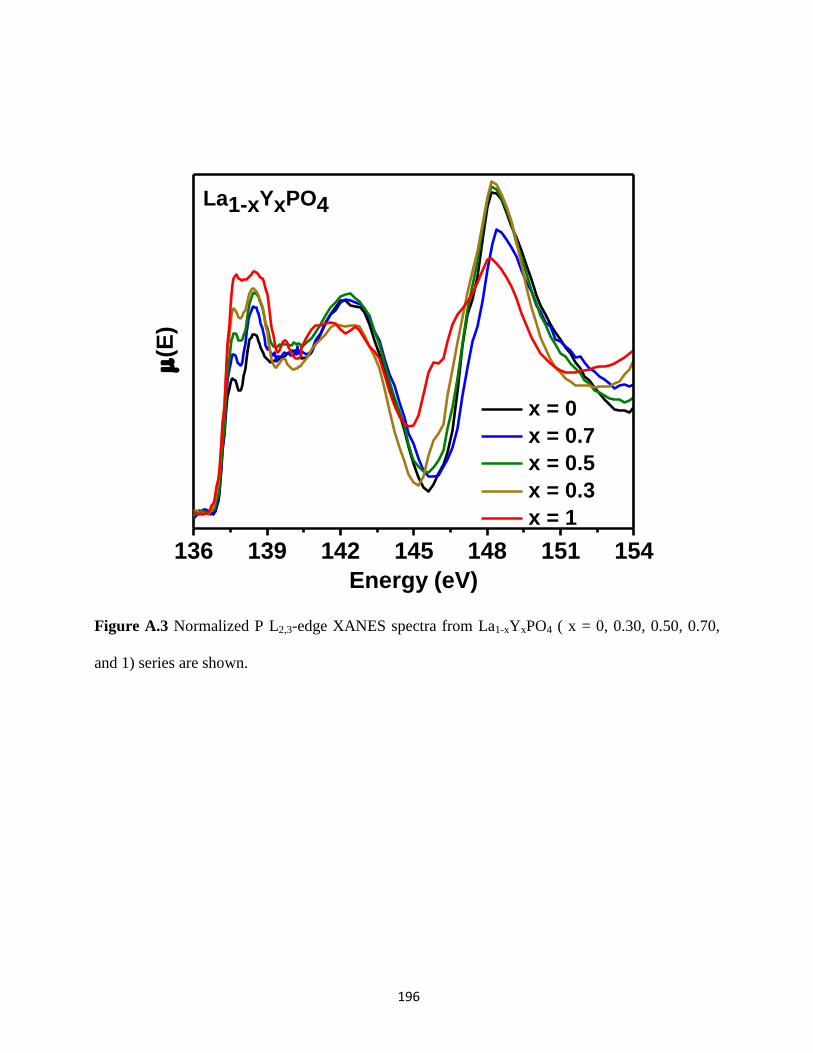
196
136 139 142 145 148 151 154
x = 0
x = 0.7
x = 0.5
x = 0.3
x = 1
(E
)
Energy (eV)
La1-xYxPO4
Figure A.3 Normalized P L2,3-edge XANES spectra from La1-xYxPO4 ( x = 0, 0.30, 0.50, 0.70,
and 1) series are shown.

197
Appendix B
SUPPORTING TABLES AND FIGURES FOR
CHAPTER 3
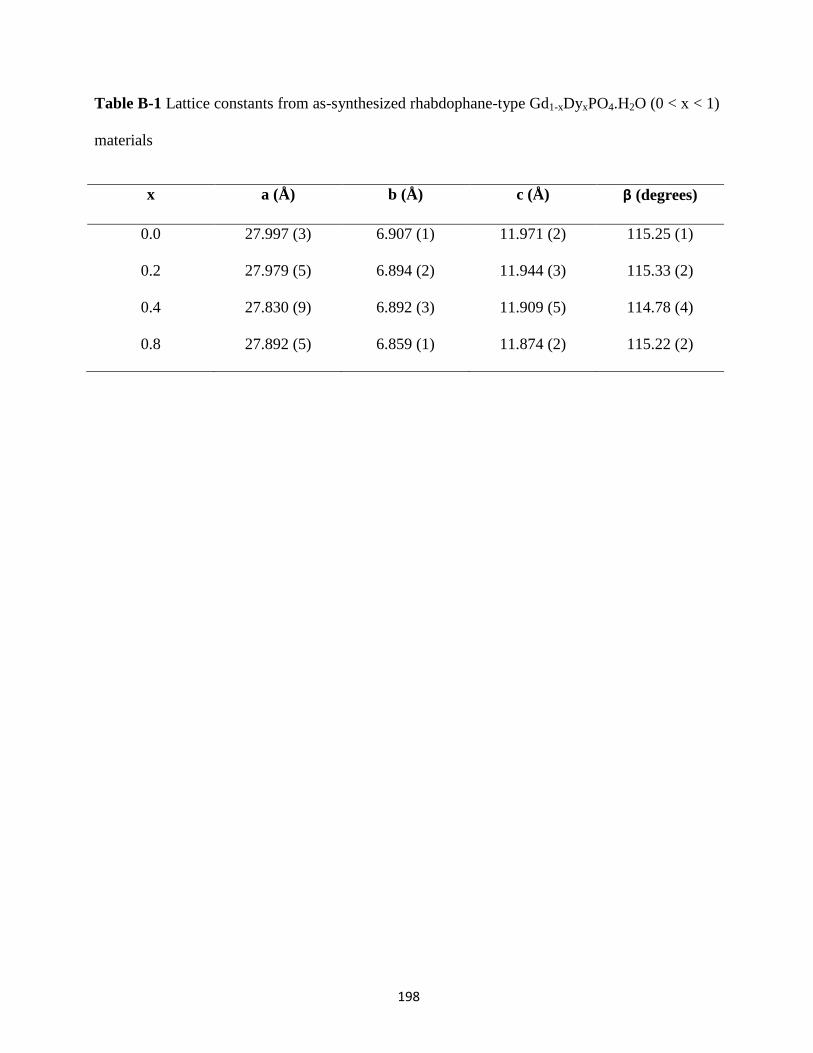
198
Table B-1 Lattice constants from as-synthesized rhabdophane-type Gd1-xDyxPO4.H2O (0 < x < 1)
materials
x a (Å) b (Å) c (Å) β (degrees)
0.0 27.997 (3) 6.907 (1) 11.971 (2) 115.25 (1)
0.2 27.979 (5) 6.894 (2) 11.944 (3) 115.33 (2)
0.4 27.830 (9) 6.892 (3) 11.909 (5) 114.78 (4)
0.8 27.892 (5) 6.859 (1) 11.874 (2) 115.22 (2)

199
100 200 300 400 500 600 70092
93
94
95
96
97
98
99
100
% W
eig
ht
los
s
Temperature (°C)
YbPO4.H2O
(Xenotime)
(b)
100 200 300 400 500 600 70093
94
95
96
97
98
99
100 DyPO4.H2O
(Rhabdophane)
% W
eig
ht
loss
Temperature (°C)
(a)
Figure B.1 TGA plots from the (a) rhabdophane-type DyPO4.H2O and (b) xenotime-type
YbPO4.H2O materials are shown.
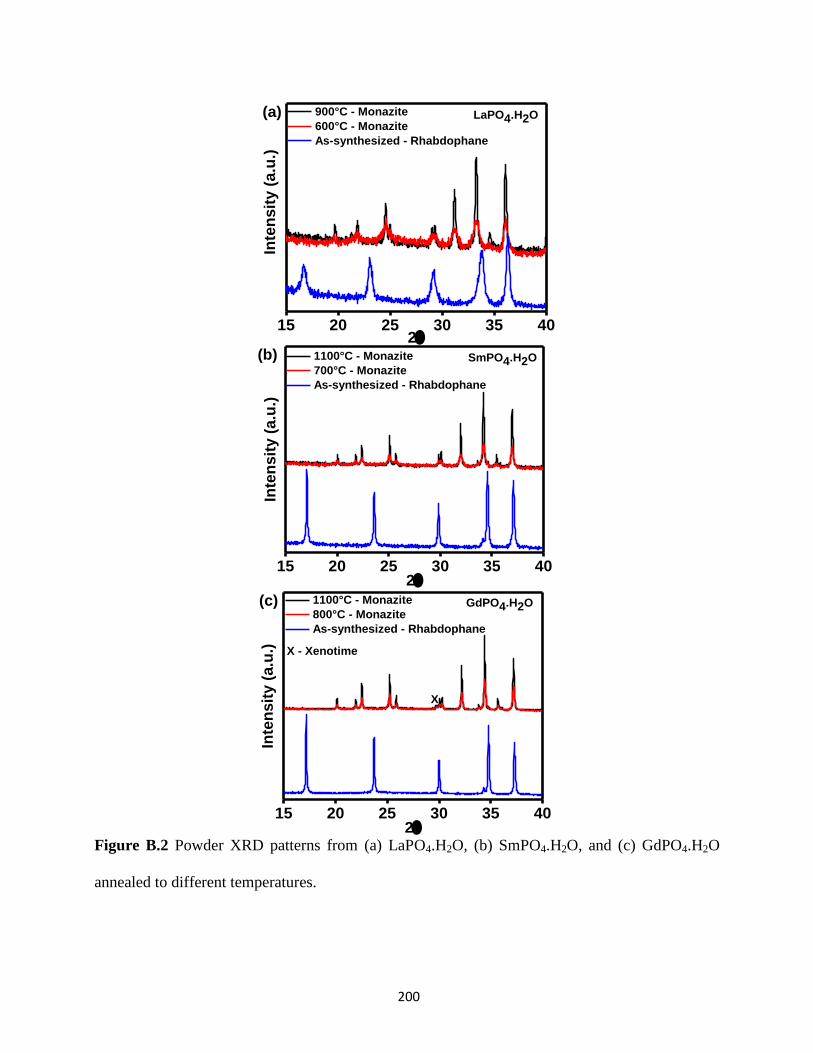
200
15 20 25 30 35 40
X
Inte
nsit
y (
a.u
.)
2
1100°C - Monazite
800°C - Monazite
As-synthesized - Rhabdophane
GdPO4.H2O
X - Xenotime
(c)
15 20 25 30 35 40
Inte
ns
ity
(a
.u.)
2
1100°C - Monazite
700°C - Monazite
As-synthesized - Rhabdophane
SmPO4.H2O(b)
15 20 25 30 35 40
Inte
nsit
y (
a.u
.)
2
900°C - Monazite
600°C - Monazite
As-synthesized - Rhabdophane
LaPO4.H2O(a)
Figure B.2 Powder XRD patterns from (a) LaPO4.H2O, (b) SmPO4.H2O, and (c) GdPO4.H2O
annealed to different temperatures.

201
7780 7795 7810 7825 7840
(b)
Energy (eV)
As-synthesized
600°C
1100°C
DyPO4.H2O Dy L3-edge
(E
)
7230 7245 7260 7275 7290
(a)
Energy (eV)
As-synthesized
600°C
1100°C
GdPO4.H2O Gd L3-edge
(E
)
Figure B.3 RE (RE = Gd, Dy) L3-edge XANES spectra from REPO4.H2O (RE = Gd, Dy)
annealed to 600°C and 1100°C are presented along with the spectrum from the as-synthesized
material.

202
Appendix C
SUPPORTING TABLES AND FIGURES FOR
CHAPTER 4
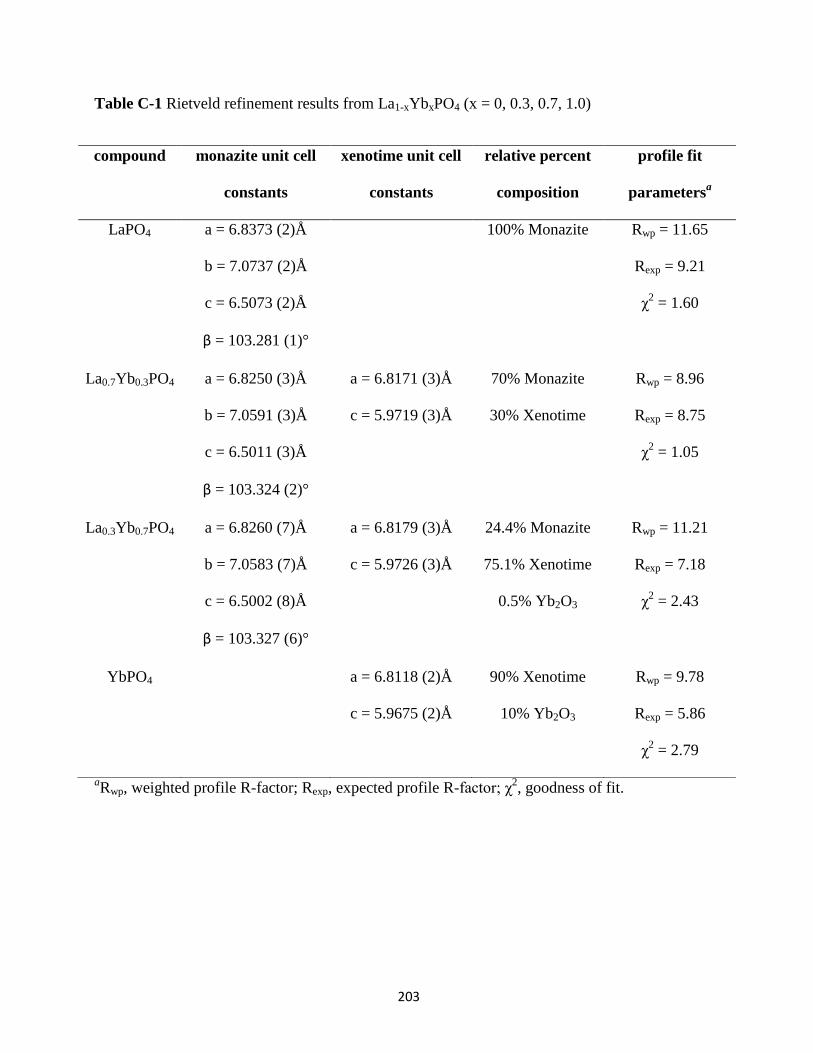
203
Table C-1 Rietveld refinement results from La1-xYbxPO4 (x = 0, 0.3, 0.7, 1.0)
aRwp, weighted profile R-factor; Rexp, expected profile R-factor; χ
2, goodness of fit.
compound monazite unit cell
constants
xenotime unit cell
constants
relative percent
composition
profile fit
parametersa
LaPO4 a = 6.8373 (2)Å
b = 7.0737 (2)Å
c = 6.5073 (2)Å
β = 103.281 (1)°
100% Monazite Rwp = 11.65
Rexp = 9.21
χ2 = 1.60
La0.7Yb0.3PO4 a = 6.8250 (3)Å
b = 7.0591 (3)Å
c = 6.5011 (3)Å
β = 103.324 (2)°
a = 6.8171 (3)Å
c = 5.9719 (3)Å
70% Monazite
30% Xenotime
Rwp = 8.96
Rexp = 8.75
χ2 = 1.05
La0.3Yb0.7PO4 a = 6.8260 (7)Å
b = 7.0583 (7)Å
c = 6.5002 (8)Å
β = 103.327 (6)°
a = 6.8179 (3)Å
c = 5.9726 (3)Å
24.4% Monazite
75.1% Xenotime
0.5% Yb2O3
Rwp = 11.21
Rexp = 7.18
χ2 = 2.43
YbPO4 a = 6.8118 (2)Å
c = 5.9675 (2)Å
90% Xenotime
10% Yb2O3
Rwp = 9.78
Rexp = 5.86
χ2 = 2.79

204
50 150 250 350 450 550
Va
can
cie
s p
er A
u- io
ns
Target depth (nm)
Au
io
ns
/cm
2
YbPO4(c)
50 150 250 350 450 550
Vacan
cie
s p
er A
u- io
ns
Target depth (nm)
Au
io
ns/c
m2
La0.3Yb0.7PO4(b)
50 150 250 350 450 550
Va
ca
nc
ies
pe
r Au
- ion
s
Target depth (nm)
Au
io
ns
/cm
2
LaPO4(a)
Figure C.1 Au- ion-implantation depth and vacancy profile of (a) LaPO4, (b) La0.3Yb0.7PO4, and
(c) YbPO4 compounds.