Embed Size (px)
Citation preview

A Strategic Plan for Growth
Fixed Income Investor Meetings Boston - New York City February 23-24, 2015

2 2
Safe Harbor Except for the historical statements contained in this release, the matters discussed herein, are forward-looking statements that are subject to certain risks, uncertainties and assumptions. Such forward-looking statements, including our 2015 earnings per share guidance and assumptions, are intended to be identified in this document by the words “anticipate,” “believe,” “estimate,” “expect,” “intend,” “may,” “objective,” “outlook,” “plan,” “project,” “possible,” “potential,” “should” and similar expressions. Actual results may vary materially. Forward-looking statements speak only as of the date they are made, and we do not undertake any obligation to update them to reflect changes that occur after that date. Factors that could cause actual results to differ materially include, but are not limited to: general economic conditions, including inflation rates, monetary fluctuations and their impact on capital expenditures and the ability of Xcel Energy Inc. and its subsidiaries (collectively, Xcel Energy) to obtain financing on favorable terms; business conditions in the energy industry, including the risk of a slow down in the U.S. economy or delay in growth recovery; trade, fiscal, taxation and environmental policies in areas where Xcel Energy has a financial interest; customer business conditions; actions of credit rating agencies; competitive factors, including the extent and timing of the entry of additional competition in the markets served by Xcel Energy Inc. and its subsidiaries; unusual weather; effects of geopolitical events, including war and acts of terrorism; state, federal and foreign legislative and regulatory initiatives that affect cost and investment recovery, have an impact on rates or have an impact on asset operation or ownership or impose environmental compliance conditions; structures that affect the speed and degree to which competition enters the electric and natural gas markets; costs and other effects of legal and administrative proceedings, settlements, investigations and claims; actions by regulatory bodies impacting our nuclear operations, including those affecting costs, operations or the approval of requests pending before the Nuclear Regulatory Commission; financial or regulatory accounting policies imposed by regulatory bodies; availability or cost of capital; employee work force factors; and the other risk factors listed from time to time by Xcel Energy in reports filed with the Securities and Exchange Commission (SEC), including Risk Factors in Item 1A and Exhibit 99.01 of Xcel Energy Inc.’s Annual Report on Form 10-K for the year ended Dec. 31, 2014.

3
Fully Regulated, Diverse Utility
NSP-Wisconsin (NSPW) 5-10% of earnings
NSP-Minnesota (NSPM) 35-45% of earnings
Southwestern Public Service (SPS)
5-15% of earnings
Public Service Co. of Colorado (PSCo) 45-55% of earnings
Operate in 8 States
Combination Utility 90% electric
10% natural gas
Customers 3.5 million electric
1.9 million natural gas 2015 Dividend (Annualized) = $1.28 2015 Ongoing EPS Guidance = $2.00 - $2.15
4 4
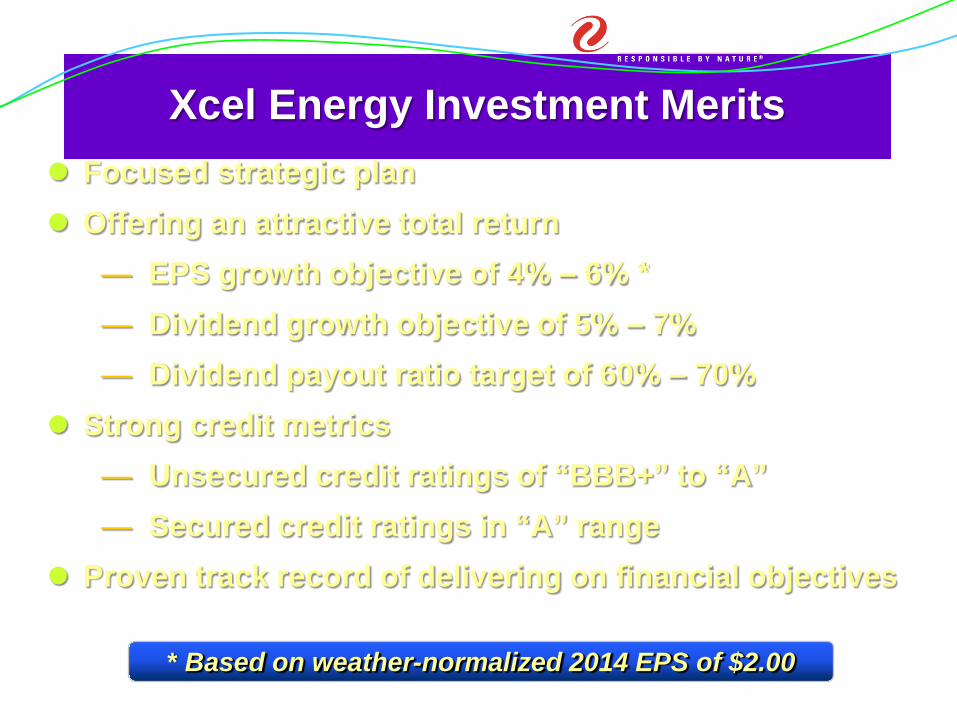
Xcel Energy Investment Merits Focused strategic plan Offering an attractive total return
— EPS growth objective of 4% – 6% * — Dividend growth objective of 5% – 7% — Dividend payout ratio target of 60% – 70%
Strong credit metrics — Unsecured credit ratings of “BBB+” to “A” — Secured credit ratings in “A” range
Proven track record of delivering on financial objectives
* Based on weather-normalized 2014 EPS of $2.00
5
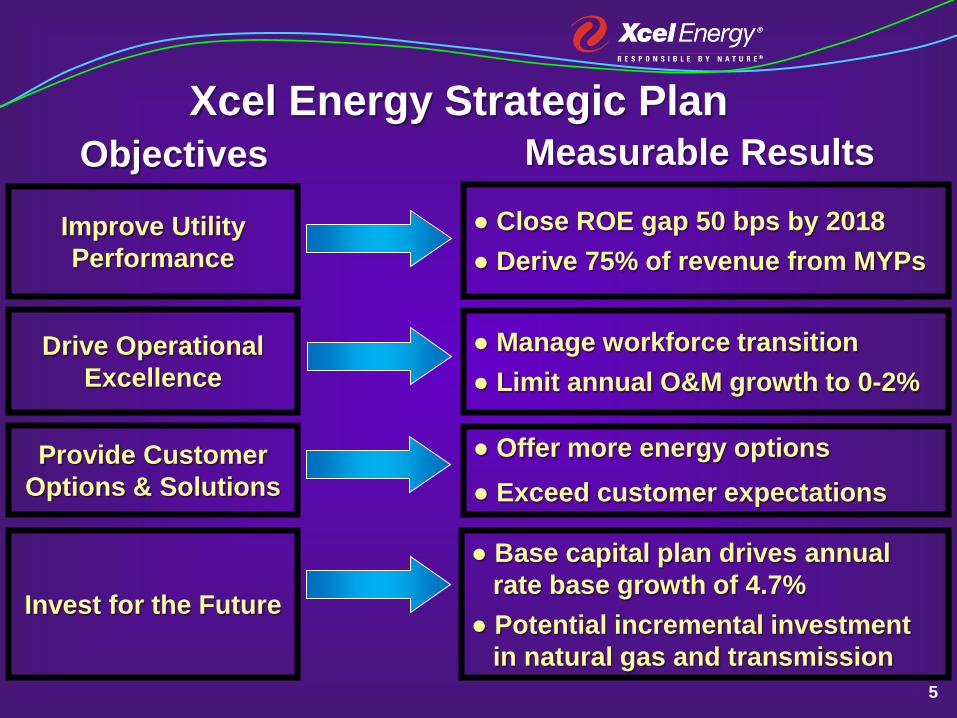
Improve Utility Performance
● Close ROE gap 50 bps by 2018 ● Derive 75% of revenue from MYPs
Objectives Measurable Results Xcel Energy Strategic Plan
Drive Operational Excellence
● Manage workforce transition ● Limit annual O&M growth to 0-2%
Provide Customer Options & Solutions
● Offer more energy options ● Exceed customer expectations
Invest for the Future
● Base capital plan drives annual rate base growth of 4.7% ● Potential incremental investment in natural gas and transmission
6
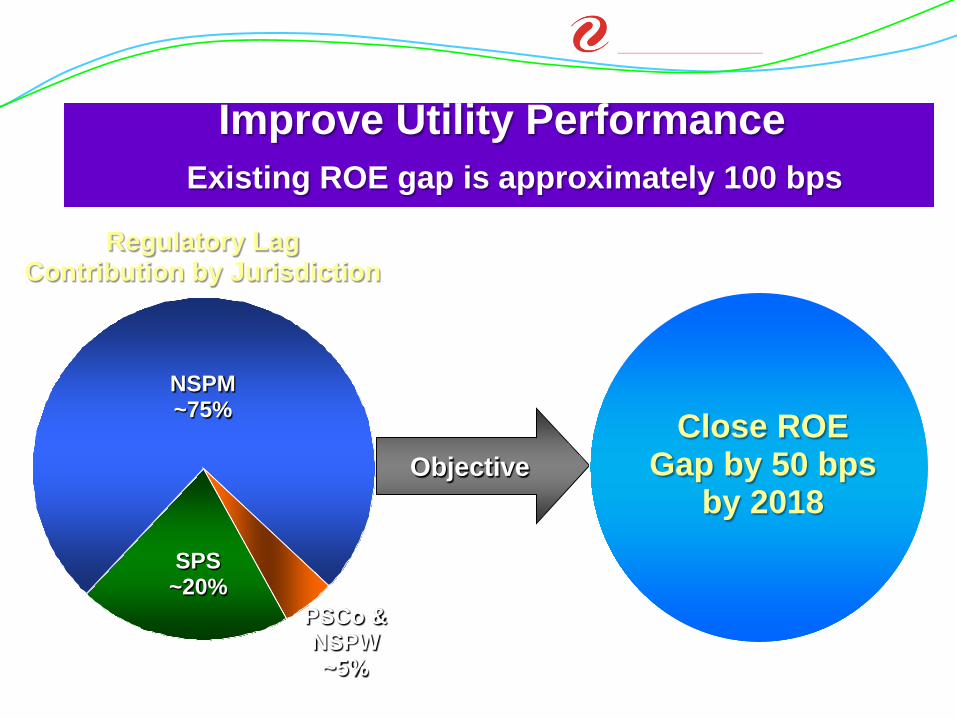
Improve Utility Performance
6
Objective Close ROE
Gap by 50 bps by 2018
NSPM ~75%
SPS ~20%
PSCo & NSPW ~5%
Regulatory Lag Contribution by Jurisdiction
Existing ROE gap is approximately 100 bps
7
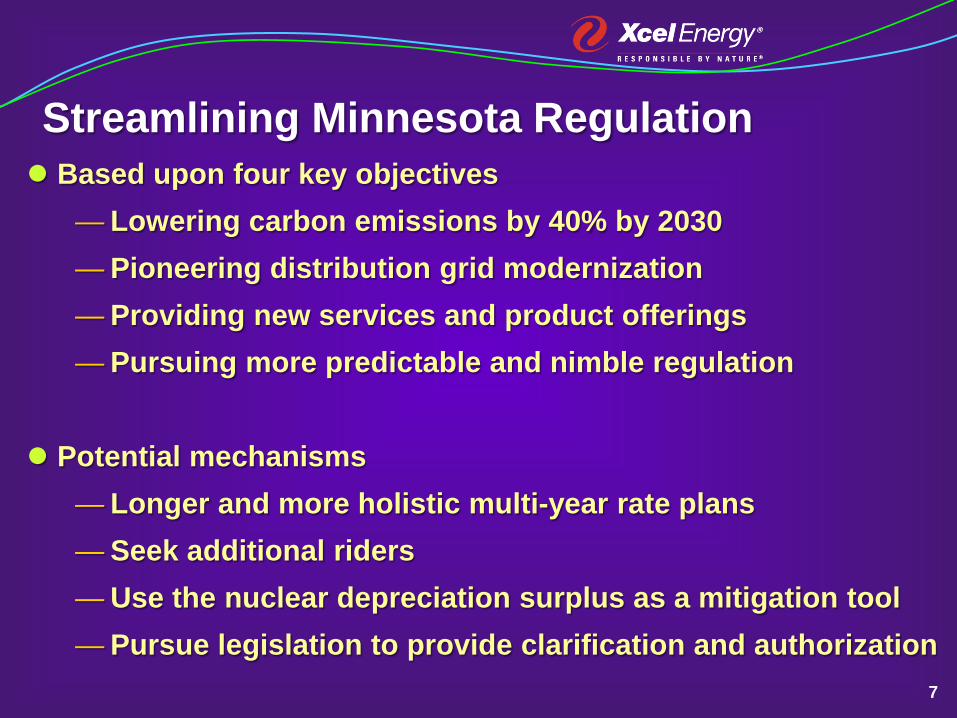
Streamlining Minnesota Regulation Based upon four key objectives
— Lowering carbon emissions by 40% by 2030 — Pioneering distribution grid modernization — Providing new services and product offerings — Pursuing more predictable and nimble regulation
Potential mechanisms
— Longer and more holistic multi-year rate plans — Seek additional riders — Use the nuclear depreciation surplus as a mitigation tool — Pursue legislation to provide clarification and authorization

8
Legislative Initiatives in Texas
Collaborating with other non-ERCOT utilities
Pursuing legislative changes to reduce regulatory lag
— Ability to implement temporary rates 35 days from filing
— Allow the addition of post test year capital additions
— Allow for the filing of a transmission rider twice a year
— Allow for generation cost recovery rider
9
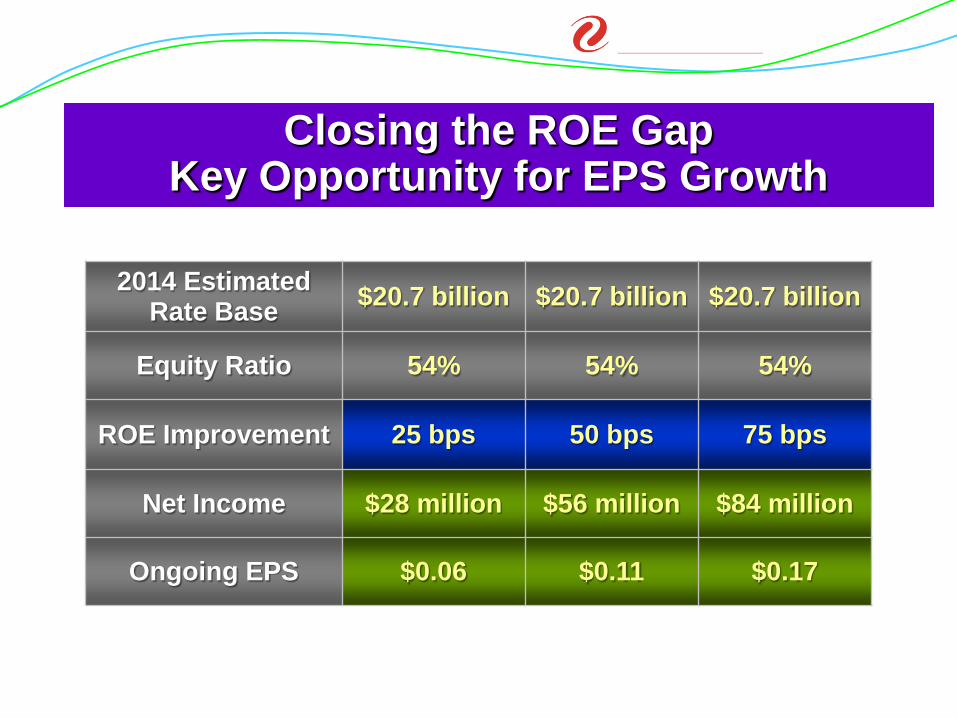
Closing the ROE Gap Key Opportunity for EPS Growth
2014 Estimated Rate Base $20.7 billion $20.7 billion $20.7 billion
Equity Ratio 54% 54% 54%
ROE Improvement 25 bps 50 bps 75 bps
Net Income $28 million $56 million $84 million
Ongoing EPS $0.06 $0.11 $0.17
9

10
Impact of Improved Earned ROE
Consolidated Earned ROE
10.0%
5-year EPS CAGR
4% - 5%
10.5%
11.0%
5% - 6%
6% - 7%
10
Based on Xcel Energy’s consolidated GAAP ROE
11
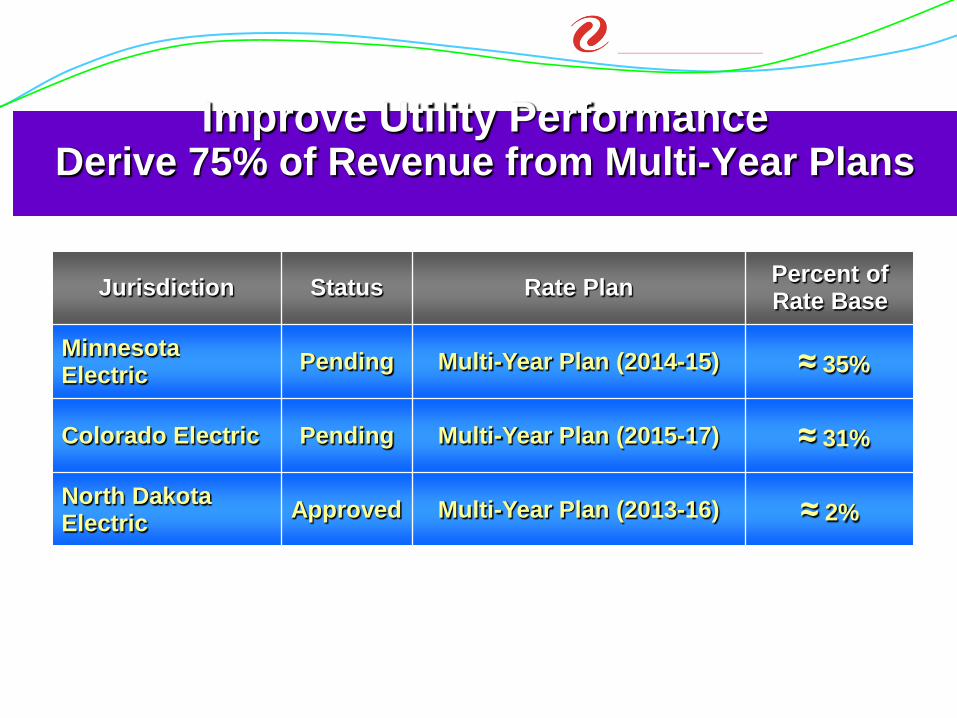
Improve Utility Performance Derive 75% of Revenue from Multi-Year Plans
Jurisdiction Status Rate Plan Percent of Rate Base
Minnesota Electric Pending Multi-Year Plan (2014-15) ≈ 35%
Colorado Electric Pending Multi-Year Plan (2015-17) ≈ 31%
North Dakota Electric Approved Multi-Year Plan (2013-16) ≈ 2%

Driving Operational Excellence Bending the Cost Curve
Sustainable cost control – Standardization of processes – Optimize purchasing power – Technology
Stabilization of nuclear costs Workforce transition Proactive maintenance Employee benefits programs Investing in capital to reduce O&M
Objective Annual O&M Growth
0% - 2% Drives
12

13
2015 2016 2017 2018 2019Transmission Generation Distribution Other
Dollars in millions
13
Base Capital Investment Plan Five-Year Total of $14.5 Billion
$3,375
$2,780 $2,825 $2,650 $2,850
14
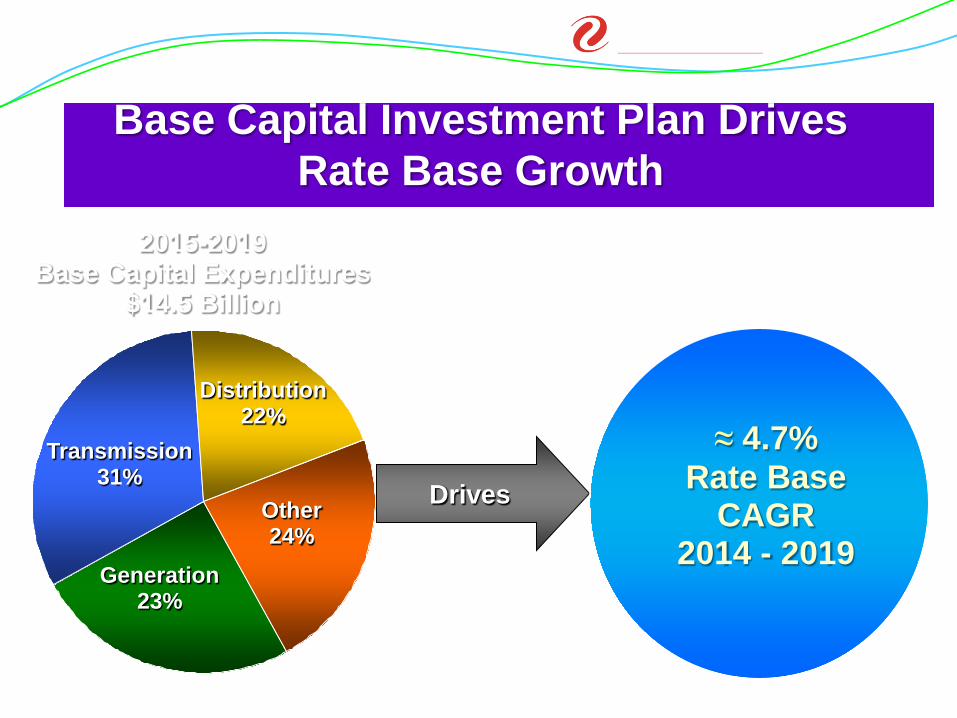
Base Capital Investment Plan Drives Rate Base Growth
14
2015-2019 Base Capital Expenditures
$14.5 Billion
Drives
≈ 4.7% Rate Base
CAGR 2014 - 2019
Transmission 31%
Generation 23%
Distribution 22%
Other 24%

15 15
Investing for the Future Potential Natural Gas Investment
Take advantage of organic growth opportunities Leverage existing natural gas footprint Potential incremental investment opportunities
— Natural gas pipelines — Natural gas storage — Rate-basing of natural gas reserves
We will continue to be disciplined and thoughtful as we pursue growth

Operating Company
Miles of Gas Transmission
Number of Customers
PSCo 2,118 1,330,000
NSPM 96 493,000
NSPW 3 110,000
SPS 20 N/A
Xcel Energy 2,237 1,933,000
Sixth largest natural gas consumer in the country Annual natural gas usage ~450 Bcf Spend $1.5 - $2.0 billion annually
Xcel Energy An Experienced Natural Gas Provider
16
NSPW 4%
SPS 20% PSCO
48%
NSPM 28%
2013 Natural Gas Consumption

17
Transmission: A Two-Pronged Strategy Operating Company: A low risk base business
— Driven by reliability standards & state/regional energy policies — Incumbent in areas with a substantial need for investment
Will defend using ROFR provisions when available ROFR statutes in MN, ND, and SD
Transco: Optimizing the opportunity in an evolving landscape — Expansion into broader FERC Order 1000 regions — Pursuing growth in an aggressive but disciplined manner — Making smart investments that position us well for the future
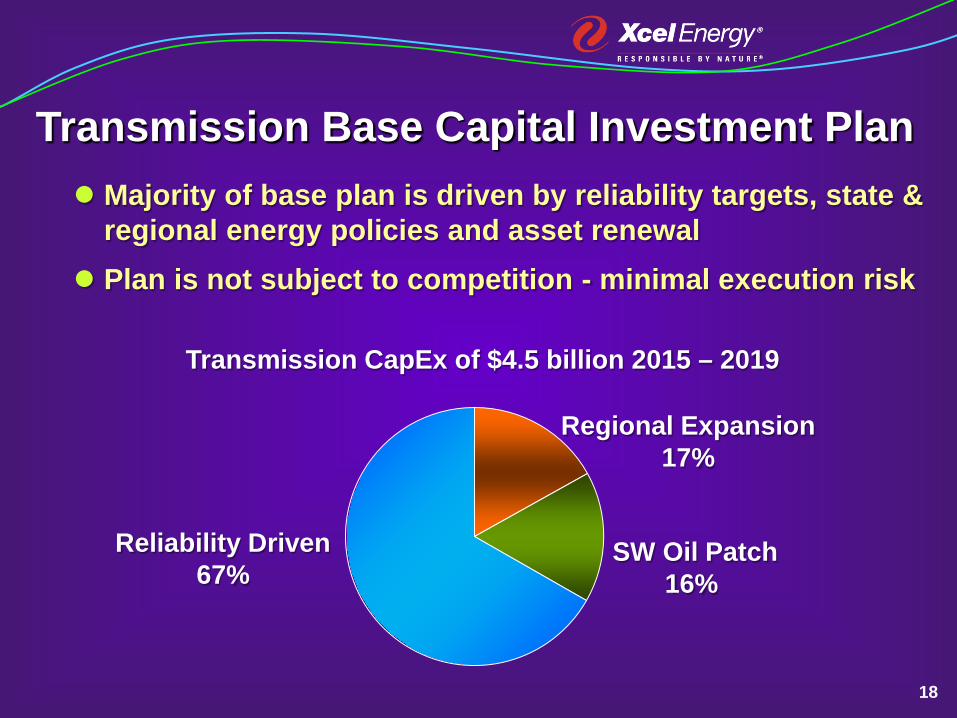
Majority of base plan is driven by reliability targets, state & regional energy policies and asset renewal
Plan is not subject to competition - minimal execution risk
18
Transmission Base Capital Investment Plan
Reliability Driven 67%
Regional Expansion 17%
SW Oil Patch 16%
Transmission CapEx of $4.5 billion 2015 – 2019

19
Pending Regulatory Cases
Monticello EPU/LCM prudence review - expected decision 2015 Q1
19
Rate Case Requested Increase Requested ROE Expected Decision
Minnesota Electric $221 million Over Two Years 10.25% 2015 Q1
South Dakota Electric $16 million 10.25% Mid-2015
Texas Electric $65 million 10.25% Mid-2015
Colorado Electric Settlement Reached $53 million 9.83% 2015 Q1
20
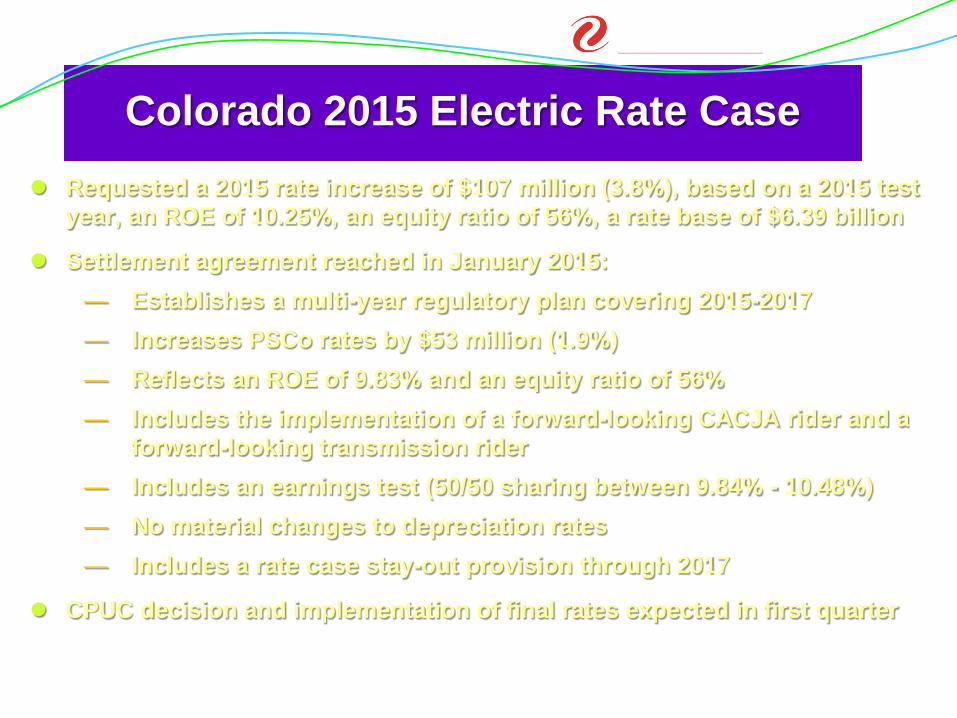
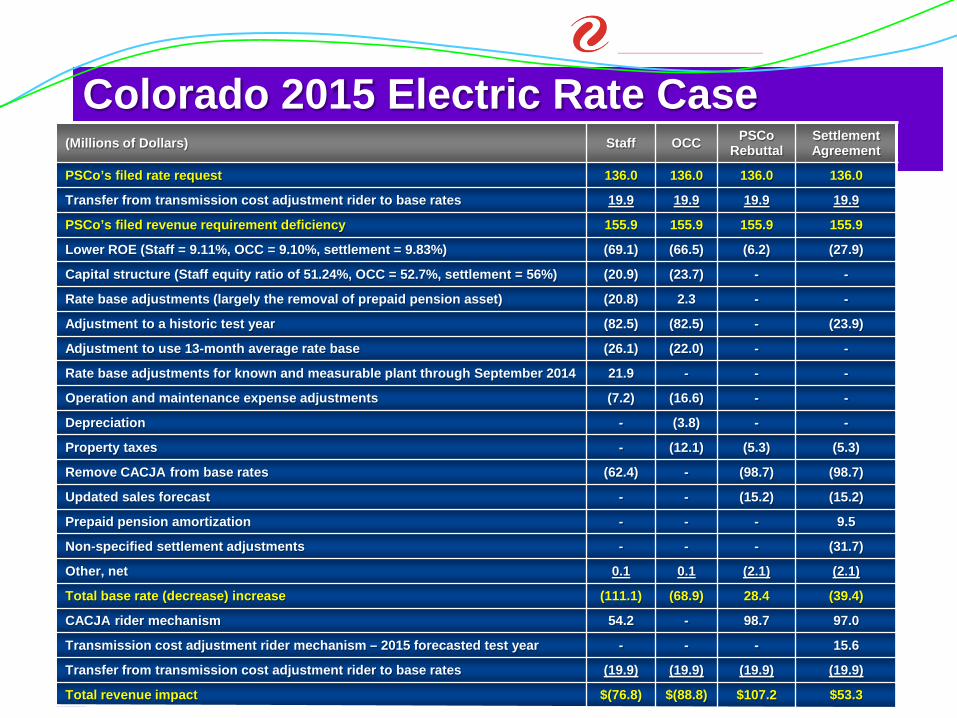
Colorado 2015 Electric Rate Case Requested a 2015 rate increase of $107 million (3.8%), based on a 2015 test
year, an ROE of 10.25%, an equity ratio of 56%, a rate base of $6.39 billion
Settlement agreement reached in January 2015: — Establishes a multi-year regulatory plan covering 2015-2017 — Increases PSCo rates by $53 million (1.9%) — Reflects an ROE of 9.83% and an equity ratio of 56% — Includes the implementation of a forward-looking CACJA rider and a
forward-looking transmission rider — Includes an earnings test (50/50 sharing between 9.84% - 10.48%) — No material changes to depreciation rates — Includes a rate case stay-out provision through 2017
CPUC decision and implementation of final rates expected in first quarter
20

Minnesota Multi-Year Electric Rate Case NSP-Minnesota filed a two-year, electric rate case seeking a
revised net increase of $221 million over two years
The filing is based on a requested ROE of 10.25%, a 52.5% equity ratio, a 2014 average rate base of $6.67 billion and an additional average rate base of $0.412 billion in 2015.
MPUC approved interim rates of $127 million effective Jan. 2014
ALJ recommended a net rate increase of $192 million over two years, based on an ROE of 9.77% and equity ratio of 52.5%
Commission deliberation – March 26, 2015
21

22
Monticello EPU/LCM Prudence Filing Original estimate was $320 million and final cost was $665 million
Monticello uprate & life extension was a sound investment — Rebuilt plant provides customer value through 2030 — Essential for carbon reduction commitment — Our experience is in line with industry performance
In July 2014, the DOC recommended a disallowance of $72 million for Minnesota - the equivalent of $94 million for all jurisdictions
In August 2014, the OAG recommended a disallowance of $321 million In February 2015, the ALJ recommended a disallowance of $72 million
for Minnesota - the equivalent of $94 million for all jurisdictions, consistent with the DOC recommendation
Commission deliberation – March 6, 2015
22

23
Texas 2015 Electric Rate Case Requested a 2015 electric rate increase of $64.75 million (6.7%)
— Based on a June 2014 historic test year with known and measurable adjustments
— ROE of 10.25% and equity ratio of 53.97% — Electric rate base of $1.56 billion
Includes $442 million post-test year investment
Parties have agreed rates will become effective June 2015
A PUCT decision is anticipated in mid-2015 — Intervenor Testimony April 1, 2015 — Staff’s Testimony April 8, 2015 — SPS Rebuttal Testimony April 24, 2015 — Hearings Begin May 11, 2015
23
24
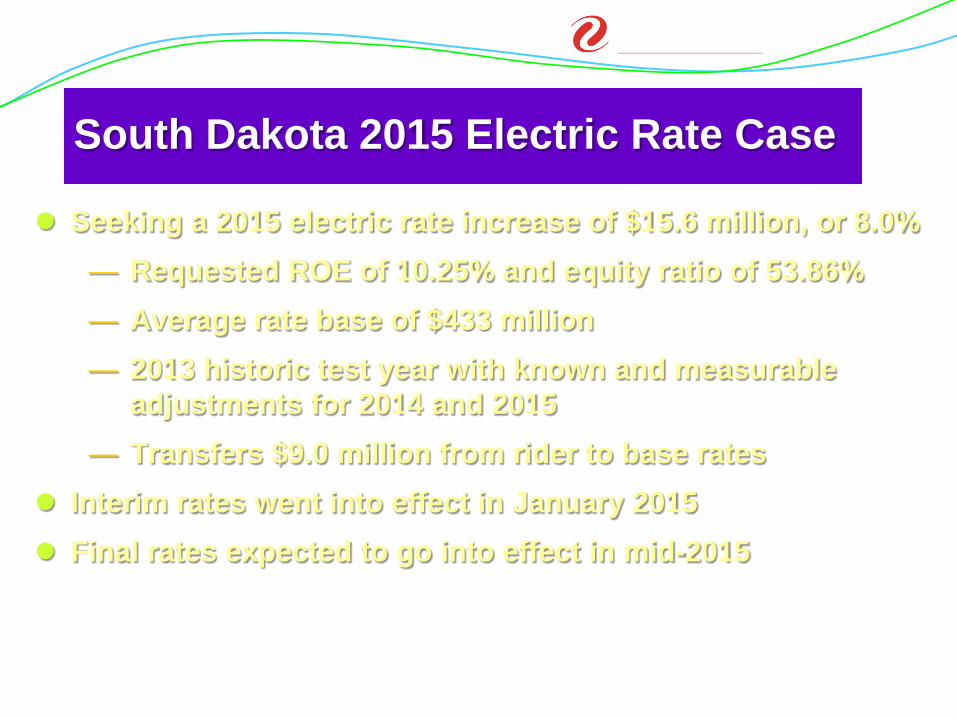
South Dakota 2015 Electric Rate Case
Seeking a 2015 electric rate increase of $15.6 million, or 8.0% — Requested ROE of 10.25% and equity ratio of 53.86% — Average rate base of $433 million — 2013 historic test year with known and measurable
adjustments for 2014 and 2015 — Transfers $9.0 million from rider to base rates
Interim rates went into effect in January 2015 Final rates expected to go into effect in mid-2015
24
25 25
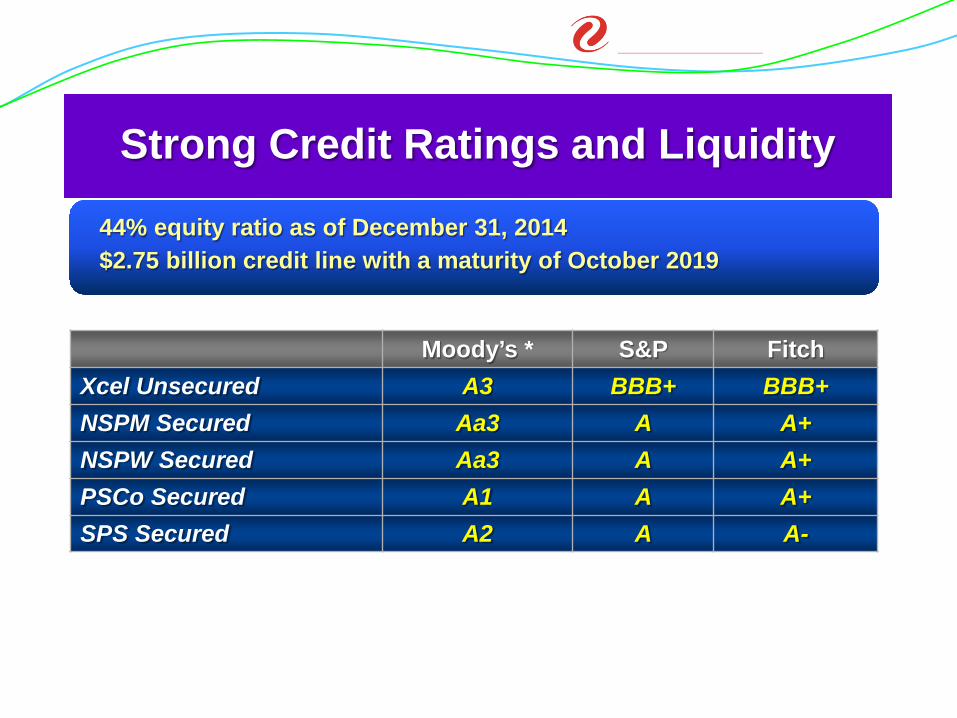
Strong Credit Ratings and Liquidity
44% equity ratio as of December 31, 2014 $2.75 billion credit line with a maturity of October 2019
Moody’s * S&P Fitch Xcel Unsecured A3 BBB+ BBB+ NSPM Secured Aa3 A A+ NSPW Secured Aa3 A A+ PSCo Secured A1 A A+ SPS Secured A2 A A-

26
Equity $ 10,214 44.4 Current Portion LT Debt 258 1.1 Short-Term Debt 1,020 4.4 Long-Term Debt 11,500 50.0 Total Capitalization $22,992 100.0
Millions Percent
Strong Balance Sheet As of December 31, 2014

27
$0
$400
$800
$1,200
$1,600
2015 2016 2017 2018 2019 2020 2021 2022 2023 2024 2025
Hold Co NSPM NSPWPSCo SPS
Manageable Debt Maturities Dollars in millions
27

28
$14,480
$11,500
$0
$2,995$2,605$375
Modest Financing Needs Financing Plan 2015-2019
Cap Ex
CFO * New Debt
DRIP & Benefits
Equity **
Funding capital expenditures
Refinanced Debt
$ millions
* Cash from operations is net of dividend and pension funding ** No external equity required during 5-year plan
Financing plans are subject to change

29
Financing Plan for 2015
Issuer Security Amount (millions) Timing
Hold Co Senior Unsecured $500 Second Quarter
NSP-M First Mortgage Bonds $600 Third Quarter
PSCo First Mortgage Bonds $250 Second Quarter
NSP-W First Mortgage Bonds $100 Second Quarter
SPS First Mortgage Bonds $250 Third Quarter
Financing plans are subject to change, depending on capital expenditures, internal cash generation, rating agency views, market conditions and other factors
30
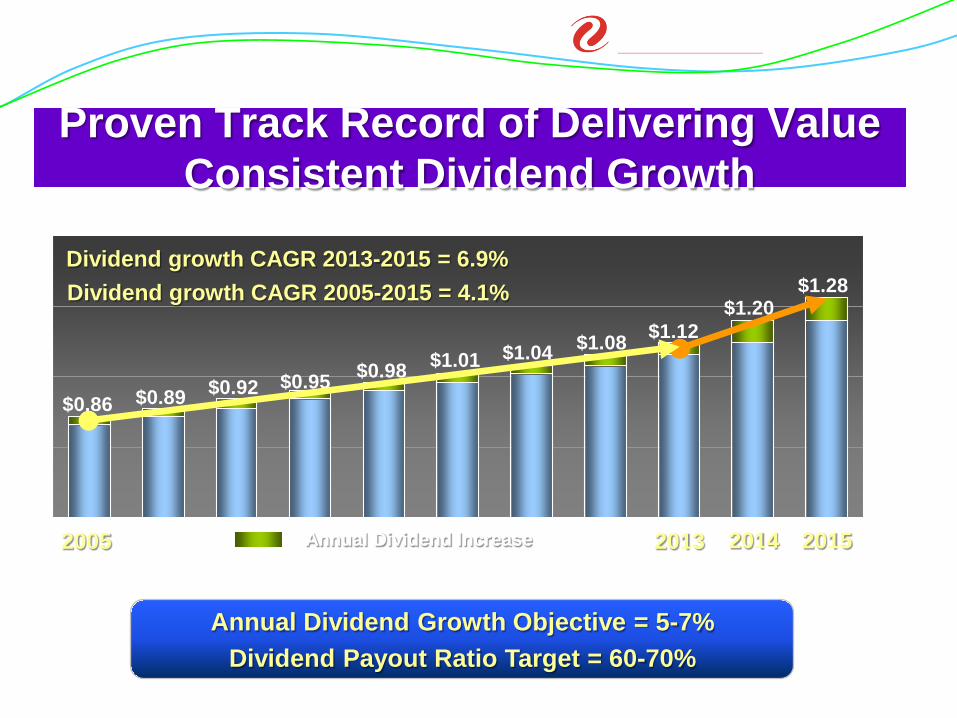
$0.86
2005
2014
$0.89 $0.92 $0.95 $0.98 $1.01 $1.04 $1.08 $1.12
Annual Dividend Increase
Proven Track Record of Delivering Value Consistent Dividend Growth
2015
$1.20
Annual Dividend Growth Objective = 5-7% Dividend Payout Ratio Target = 60-70%
30
$1.28 Dividend growth CAGR 2005-2015 = 4.1% Dividend growth CAGR 2013-2015 = 6.9%
2013
31 * Reconciliation of Ongoing EPS to GAAP EPS included in appendix
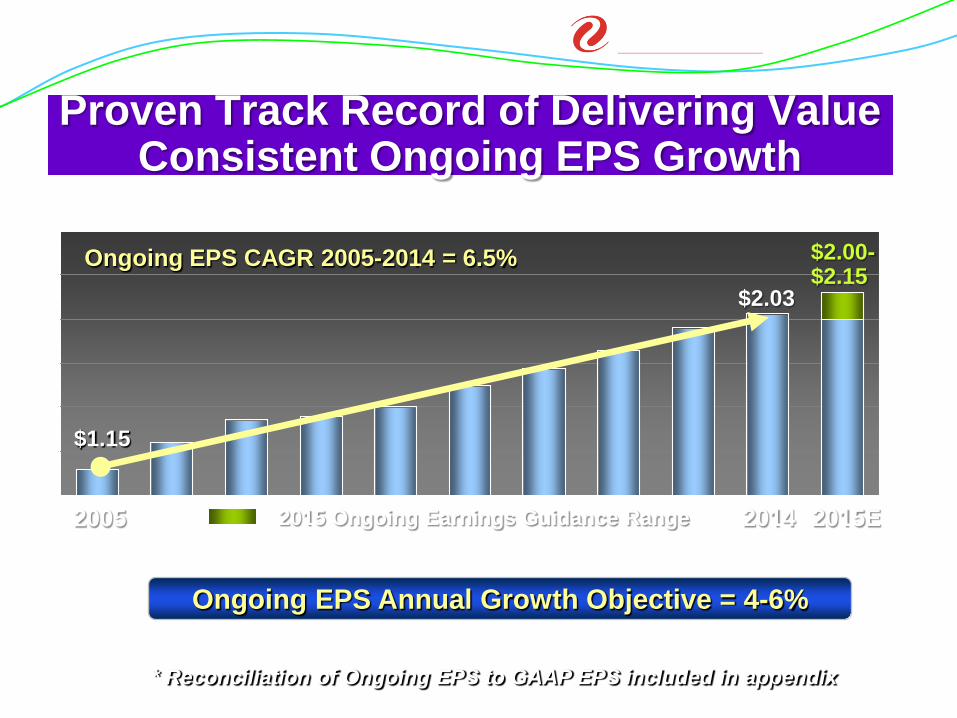
Proven Track Record of Delivering Value Consistent Ongoing EPS Growth
2005
$1.15
$2.03
2015 Ongoing Earnings Guidance Range 2015E
31
Ongoing EPS Annual Growth Objective = 4-6%
$2.00-$2.15
Ongoing EPS CAGR 2005-2014 = 6.5%
2014

32
Proven Track Record Delivering on Financial Objectives
2005 Achieved
2006 Achieved 2007 Exceeded
2008 Achieved
2009 Achieved
2010 Achieved
2011 Achieved
2012 Achieved
2013 Achieved
2014 Achieved
EPS Guidance
33
Appendix
33

34
Reconciliation – Ongoing EPS to GAAP EPS 2005 2006 2007 2008 2009 2010 2011 2012 2013 2014
Ongoing EPS $1.15 $1.30 $1.43 $1.45 $1.50 $1.62 $1.72 $1.82 $1.95 $2.03
PSRI-COLI $0.05 $0.05 $(0.08) $0.01 $(0.01) $(0.01) - - - -
Prescription Drug Tax Benefit - - - - - - - $0.03 - -
SPS FERC Order - - - - - - - - $(0.04) - Cont. Ops $1.20 $1.35 $1.35 $1.46 $1.49 $1.61 $1.72 $1.85 $1.91 $2.03
Discont. Ops $0.03 $0.01 - - $(0.01) $0.01 - - - -
GAAP EPS $1.23 $1.36 $1.35 $1.46 $1.48 $1.62 $1.72 $1.85 $1.91 $2.03
Xcel Energy’s management believes that ongoing earnings provide a meaningful comparison of earnings results and is representative of Xcel Energy’s fundamental core earnings power. Xcel Energy’s management uses ongoing earnings internally for financial planning and analysis, for reporting of results to the Board of Directors, and when communicating its earnings outlook to
analysts and investors.
34
35
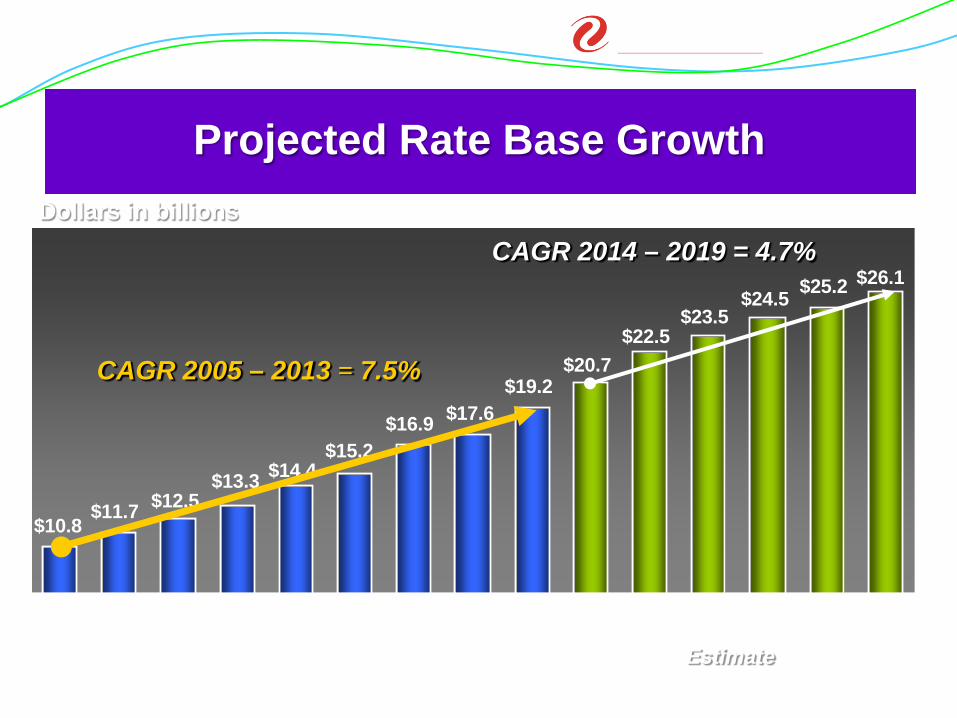
Projected Rate Base Growth Dollars in billions
$26.1$25.2$24.5$23.5
$22.5$20.7
$19.2$17.6$16.9
$15.2
$10.8$11.7
$14.4$13.3$12.5
2005 2006 2007 2008 2009 2010 2011 2012 2013 2014 2015 2016 2017 2018 2019
CAGR 2005 – 2013 = 7.5%
CAGR 2014 – 2019 = 4.7%
Estimate 35

36
2014 Weather-Adjusted Retail Electric Sales
Better Than Expected 2014 Sales Growth
0.6%1.2%
3.3%
2.3%
1.3%
XcelEnergy
NSPM PSCo NSPW SPS

37
Capital Expenditures by Function
2015 2016 2017 2018 2019 Total Electric Generation $1,190 $630 $620 $415 $450 $3,305
Electric Transmission $875 $780 $905 $975 $1,000 $4,535
Electric Distribution $605 $630 $640 $650 $680 $3,205
Natural Gas $370 $370 $305 $355 $380 $1,780
Nuclear Fuel $90 $120 $120 $65 $150 $545
Other $245 $250 $235 $190 $190 $1,110
Total $3,375 $2,780 $2,825 $2,650 $2,850 $14,480
Dollars in millions
38
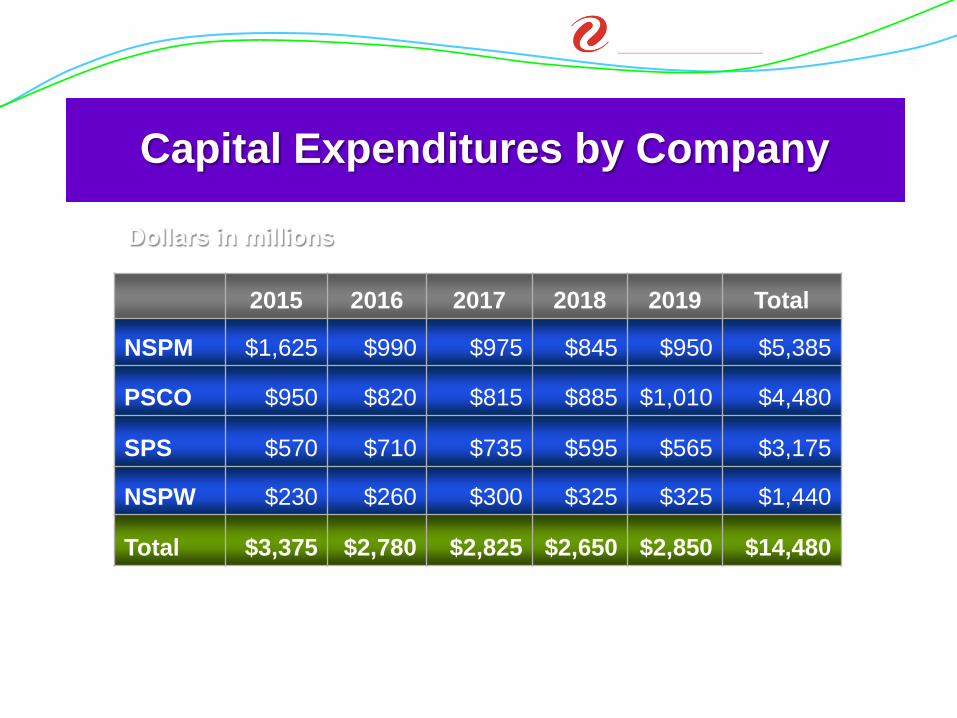
Capital Expenditures by Company
Dollars in millions
2015 2016 2017 2018 2019 Total
NSPM $1,625 $990 $975 $845 $950 $5,385
PSCO $950 $820 $815 $885 $1,010 $4,480
SPS $570 $710 $735 $595 $565 $3,175
NSPW $230 $260 $300 $325 $325 $1,440
Total $3,375 $2,780 $2,825 $2,650 $2,850 $14,480
38

39
SPP Scoring Methodology
Engineering Design – 200 pts Project Management – 200 pts Operating Ability – 250 pts Cost Analysis – 225 pts Creditworthiness – 125 pts Project proposal bonus – 100 pts
Accomplished development team Skillful project execution Seasoned operator Proven low cost leader Industry leading Balance Sheet Submitted ~15% of proposed SPP projects
Criteria Xcel Energy Brings

40
Proven Low Cost Leader – 345 kV Lines
$0.0
$0.5
$1.0
$1.5
$2.0
$2.5
Xcel Energy Average
$1.72
SPP Average
$1.76
ERCOT Average
$1.80
MISO Average
$2.22
WECC Average
$2.11
* Adjusted to 2013 dollars using the Handy Whitman Construction Cost Index
Average Cost per Mile, Adjusted *
13 25 55 12 35 # of projects
Overall Average = $2.1 million/mile
Dollars in millions per mile
Source: Analysis uses data from FERC, State Commissions, Regional Transmission Organizations, EEI publications and other publicly available data sources

41
Regulatory vs. Authorized ROE - 2013 OPCO Jurisdiction
Rate Base ($ millions)
Authorized ROE
W/A Earned ROE Regulatory Plan
NSPM
MN Electric $6,719 9.83% 8.22% 2014-2015 MYP Filed MN Gas 436 10.09 9.76 ND Electric 389 9.75 9.54 2013-2016 MYP ND Gas 43 10.75 11.39 SD Electric 409 Black box 7.28
PSCo CO Electric 5,922 10.00 11.32* 2012-2014 MYP CO Gas 1,483 9.72 9.01 2013 Rate Case
SPS TX Electric 1,256 Black box 10.11** 2014 Rate Case NM Electric 456 Black box 6.58** 2014 Rate Case
NSPW
WI Electric 777 10.40 10.23 2013 Rate Case WI Gas 85 10.40 9.81 2013 Rate Case MI Electric 17 10.30 7.57 2014 Rate Case MI Gas 3 11.25 (11.58) Wholesale 1,225 N/A N/A
41
* Before customer refund based on earnings test. PSCo earned 10.27%, after customer refund. ** Actual ROE, not weather-normalized

42
2014 Q4
2015 Q1
2015 Q2
2015 Q3
2015 Q4
Minnesota Regulatory Calendar
MN 2014 – 2015 Rate Case
Monticello Case
MN Legislative Session
MN Regulatory Filing
Resource Plan Filing
Alternative Plan: 2016 – 2018 Rate Case Filing

43 43
Minnesota Multi-Year Electric Rate Case
* The ALJ recommended that the MPUC accept the DOC and NSPM agreement to true up the sales forecast to W/N actual sales and to a limited true-up mechanism for property taxes.
(millions of dollars) 2014
ALJ DOC Surrebuttal
NSP-M Rebuttal
NSP-Minnesota’s original request $192.7 $192.7 $192.7 Monticello EPU (31.3) (33.9) (12.2) Sales forecast* (15.8) (43.2) (15.8) ROE (DOC = 9.64%, ALJ = 9.77%) (28.4) (36.2) - Health care, pension and other benefits (1.9) (11.4) (1.9) Property taxes* (9.0) (9.0) (9.0) Prairie Island EPU (5.1) (5.1) (5.1) Other, net (5.2) (8.0) (6.5) Recommended 2014 rate increase (unadjusted) $96.0 $45.9 $142.2 Sales forecast - estimated true-up adjustment (22.7) 4.7 (22.7) Property tax - estimated true-up adjustment (4.2) (4.2) (4.2) Total Recommended rate increase (adjusted) $69.1 $46.4 $115.3
44 44
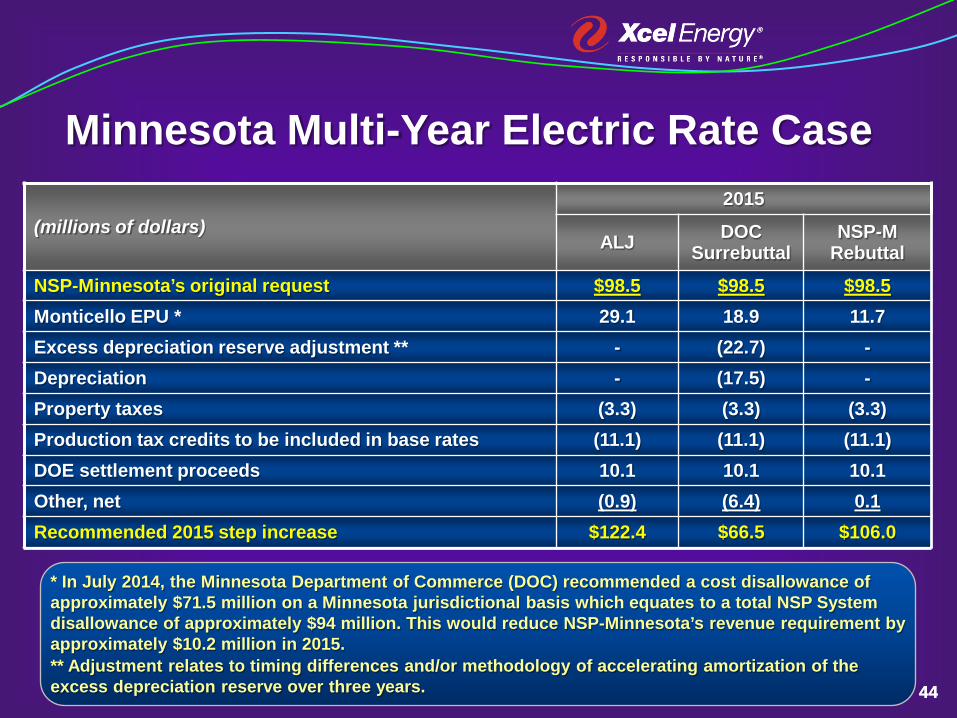
Minnesota Multi-Year Electric Rate Case
* In July 2014, the Minnesota Department of Commerce (DOC) recommended a cost disallowance of approximately $71.5 million on a Minnesota jurisdictional basis which equates to a total NSP System disallowance of approximately $94 million. This would reduce NSP-Minnesota’s revenue requirement by approximately $10.2 million in 2015. ** Adjustment relates to timing differences and/or methodology of accelerating amortization of the excess depreciation reserve over three years.
(millions of dollars) 2015
ALJ DOC Surrebuttal
NSP-M Rebuttal
NSP-Minnesota’s original request $98.5 $98.5 $98.5 Monticello EPU * 29.1 18.9 11.7 Excess depreciation reserve adjustment ** - (22.7) - Depreciation - (17.5) - Property taxes (3.3) (3.3) (3.3) Production tax credits to be included in base rates (11.1) (11.1) (11.1) DOE settlement proceeds 10.1 10.1 10.1 Other, net (0.9) (6.4) 0.1 Recommended 2015 step increase $122.4 $66.5 $106.0
45
Colorado 2015 Electric Rate Case (Millions of Dollars) Staff OCC PSCo
Rebuttal Settlement Agreement
PSCo’s filed rate request 136.0 136.0 136.0 136.0
Transfer from transmission cost adjustment rider to base rates 19.9 19.9 19.9 19.9
PSCo’s filed revenue requirement deficiency 155.9 155.9 155.9 155.9
Lower ROE (Staff = 9.11%, OCC = 9.10%, settlement = 9.83%) (69.1) (66.5) (6.2) (27.9)
Capital structure (Staff equity ratio of 51.24%, OCC = 52.7%, settlement = 56%) (20.9) (23.7) - -
Rate base adjustments (largely the removal of prepaid pension asset) (20.8) 2.3 - -
Adjustment to a historic test year (82.5) (82.5) - (23.9)
Adjustment to use 13-month average rate base (26.1) (22.0) - -
Rate base adjustments for known and measurable plant through September 2014 21.9 - - -
Operation and maintenance expense adjustments (7.2) (16.6) - -
Depreciation - (3.8) - -
Property taxes - (12.1) (5.3) (5.3)
Remove CACJA from base rates (62.4) - (98.7) (98.7)
Updated sales forecast - - (15.2) (15.2)
Prepaid pension amortization - - - 9.5
Non-specified settlement adjustments - - - (31.7)
Other, net 0.1 0.1 (2.1) (2.1)
Total base rate (decrease) increase (111.1) (68.9) 28.4 (39.4)
CACJA rider mechanism 54.2 - 98.7 97.0
Transmission cost adjustment rider mechanism – 2015 forecasted test year - - - 15.6
Transfer from transmission cost adjustment rider to base rates (19.9) (19.9) (19.9) (19.9)
Total revenue impact $(76.8) $(88.8) $107.2 $53.3 45

46
Minnesota Resource Plan Filing
In January 2015, NSP filed its resource plan, which recommends:
— Adding 600 MW of wind by 2020 and 1,200 MW by 2027
— Adding 187 MW of large scale solar by 2016 and 1,700 MW by 2030
— 500 MW of customer-driven, small-scale solar
— 1,750 MW of new natural gas capacity
— Run Sherco Units 1 and 2 with decreasing reliance through 2030
Next Steps:
— Stakeholder input
— Supplemental filing
— MPUC final decision expected in 2016
46

47 47
23%
12% 56%
1%5%3%
23%
11%
15%46%
1%4%
Proactive Environmental Leadership Fuel Mix Based on Energy
2005 2020 2013
18%
12%
43%22%
2%3%
Coal Natural Gas Nuclear Wind Hydro Other
48 48
60
65
70
75
80
85
90
95
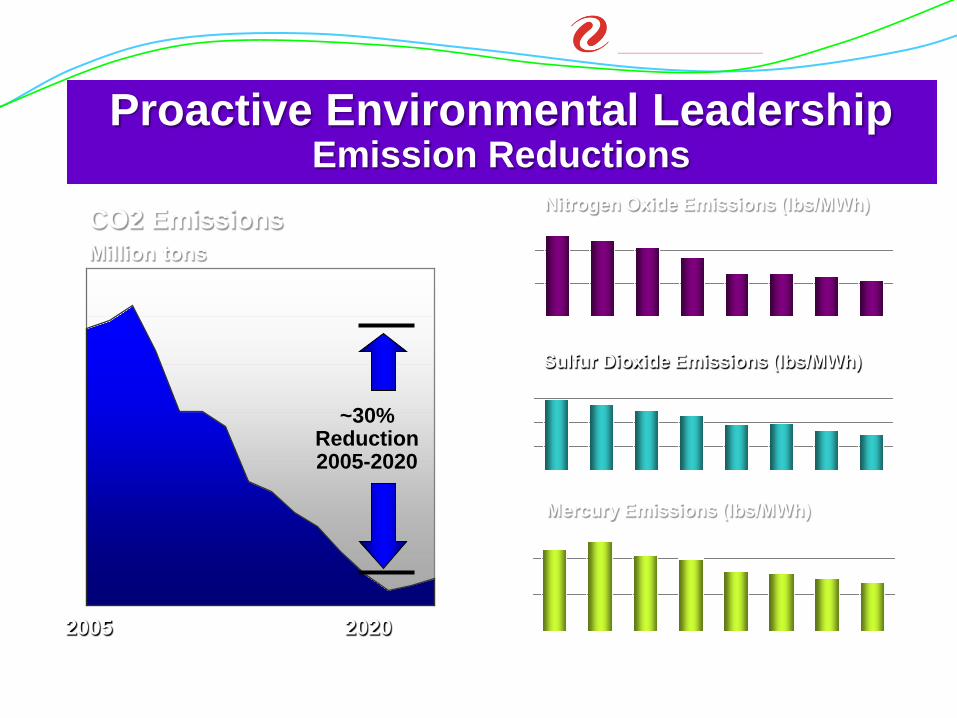
Proactive Environmental Leadership Emission Reductions
CO2 Emissions Million tons
~30% Reduction 2005-2020
2020 0
1,000
2,000
3,000
2005 2007 2009 2011 2012
Mercury Emissions (lbs/MWh)
0
50,000
100,000
150,000
200,000
2005 2006 2007 2008 2009 2010 2011 2012
Sulfur Dioxide Emissions (lbs/MWh)
0
50,000
100,000
150,000
2005 2006 2007 2008 2009 2010 2011 2012
Nitrogen Oxide Emissions (lbs/MWh)
2005 2006 2008 2010

49 49