Embed Size (px)
Citation preview
A Stable International Monetary
System Emerges: Inflation Targeting as
Bretton Woods, Reversed
Andrew K. Rose UC Berkeley, CEPR and NBER
1
Motivation #1
• Much Discussion on Current Account Sustainability
o Is there a “Revived Bretton Woods” system of fixed
exchange rates?
o Focus on East Asia (especially China vis-à-vis USA)
• Here: same question (sustainability), different focus
2
Motivation #2
• Many Currency Crises through end of 20th century
• (Many) Fewer Now
• Good Luck or Good Policy?
o Are International Financial Crises a Relic of an
Archaic “System” that is Disappearing?
3
My Focus: Inflation Targeters
• 14 (of 30) OECD countries have inflation targets (IT)
o Population > 430 million
o 12 OECD in EMU, closet inflation targeter
2 more (Denmark, Slovakia) waiting to join
o US another closet IT (Goodfriend); Japan soon?
• 10 developing countries (> 750 mn) also target inflation
• Arguably most important, successful monetary framework
o Spreading quickly
4
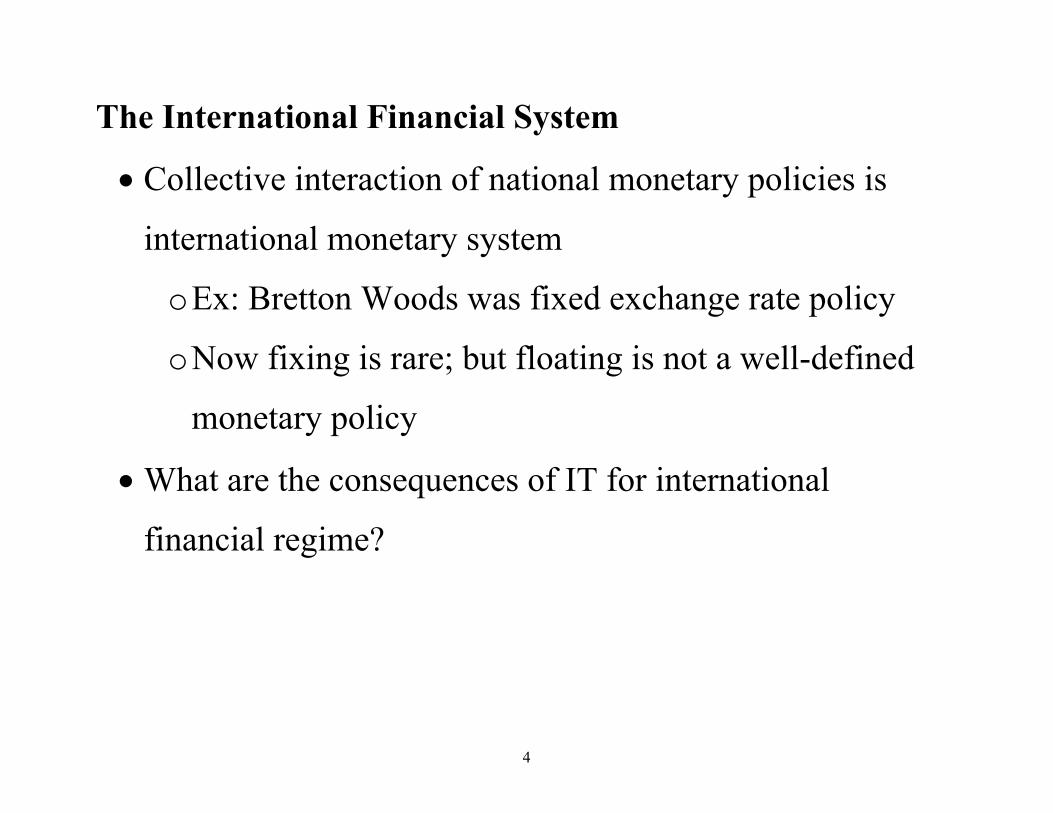
The International Financial System
• Collective interaction of national monetary policies is
international monetary system
o Ex: Bretton Woods was fixed exchange rate policy
o Now fixing is rare; but floating is not a well-defined
monetary policy
• What are the consequences of IT for international
financial regime?
5
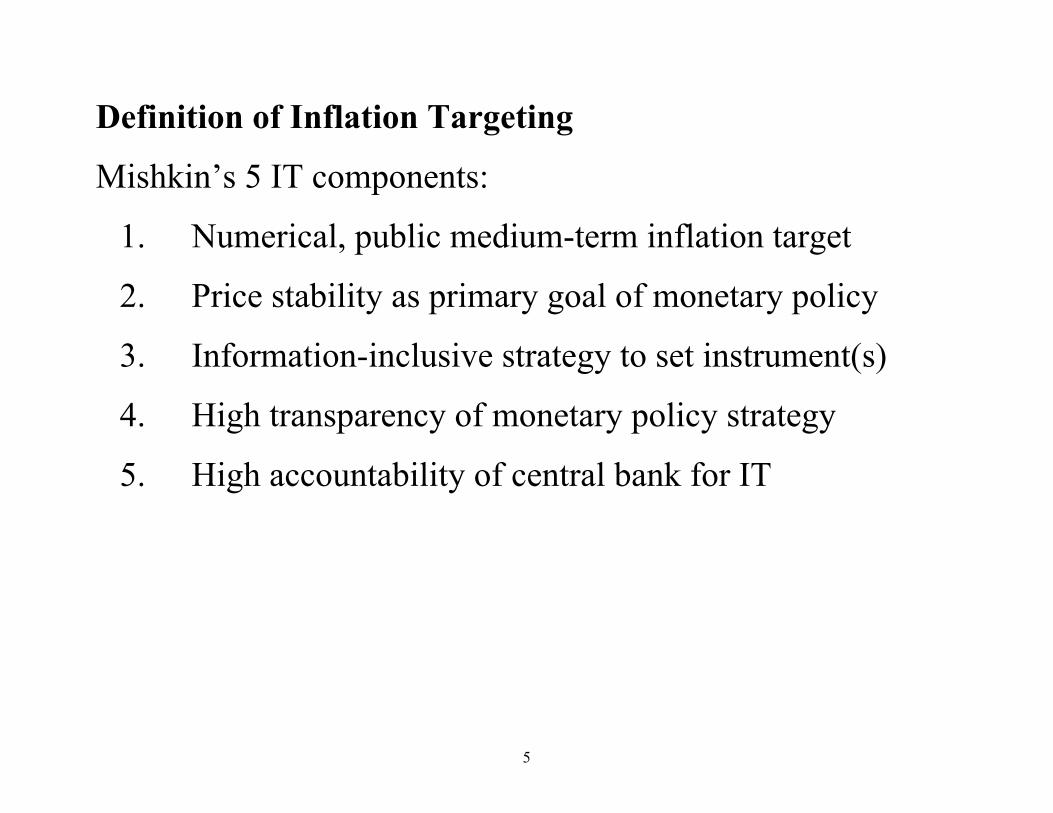
Definition of Inflation Targeting
Mishkin’s 5 IT components:
1. Numerical, public medium-term inflation target
2. Price stability as primary goal of monetary policy
3. Information-inclusive strategy to set instrument(s)
4. High transparency of monetary policy strategy
5. High accountability of central bank for IT
6
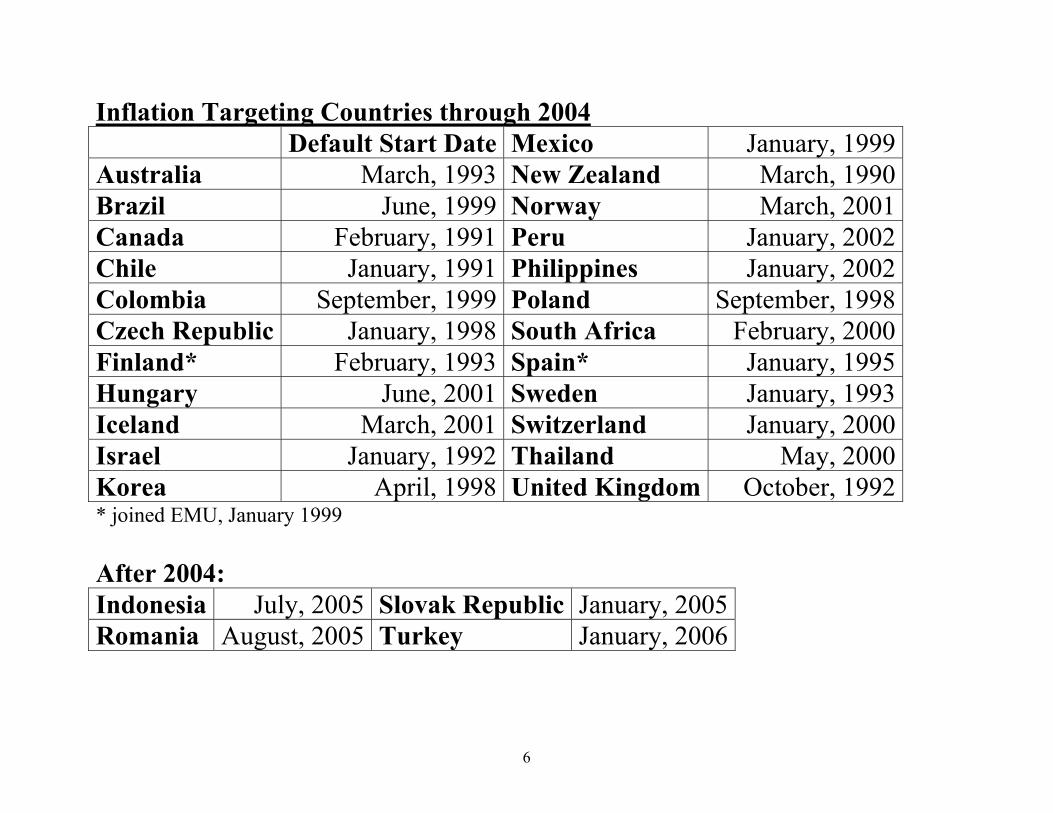
Inflation Targeting Countries through 2004 Default Start Date Mexico January, 1999Australia March, 1993 New Zealand March, 1990Brazil June, 1999 Norway March, 2001Canada February, 1991 Peru January, 2002Chile January, 1991 Philippines January, 2002Colombia September, 1999 Poland September, 1998Czech Republic January, 1998 South Africa February, 2000Finland* February, 1993 Spain* January, 1995Hungary June, 2001 Sweden January, 1993Iceland March, 2001 Switzerland January, 2000Israel January, 1992 Thailand May, 2000Korea April, 1998 United Kingdom October, 1992* joined EMU, January 1999 After 2004: Indonesia July, 2005 Slovak Republic January, 2005Romania August, 2005 Turkey January, 2006
7
Countries Tend to Adopt IT after Exchange Rate Crises
• Brazil, Czech Republic, Finland, Indonesia, Korea,
Mexico, Philippines, Sweden, Thailand, Turkey, United
Kingdom
Only 3 Crisis Countries have not switched to IT (yet):
• Argentina, Malaysia, Russia
8
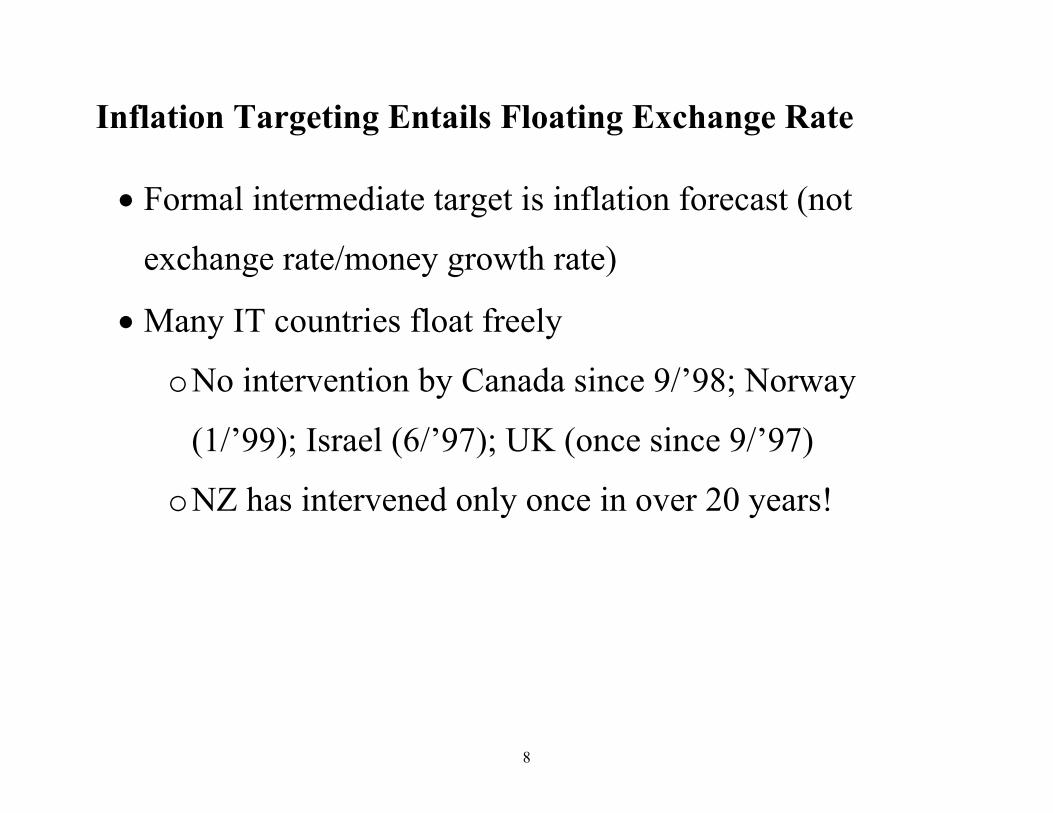
Inflation Targeting Entails Floating Exchange Rate
• Formal intermediate target is inflation forecast (not
exchange rate/money growth rate)
• Many IT countries float freely
o No intervention by Canada since 9/’98; Norway
(1/’99); Israel (6/’97); UK (once since 9/’97)
o NZ has intervened only once in over 20 years!
9
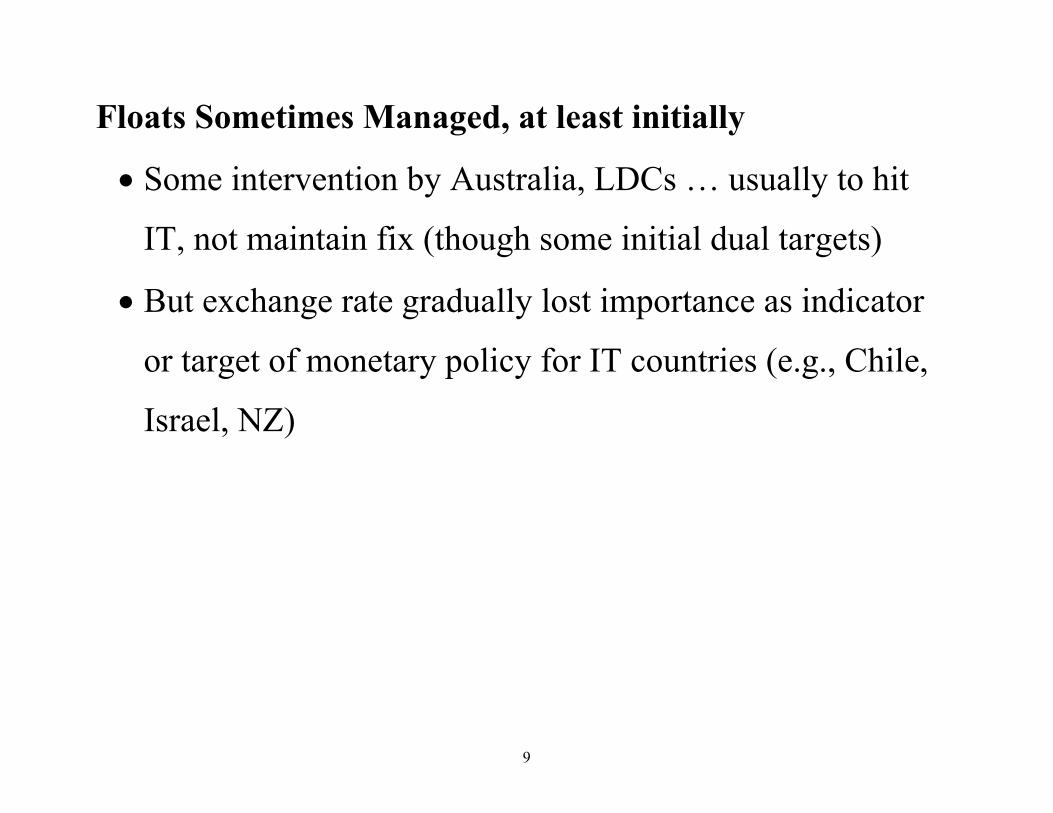
Floats Sometimes Managed, at least initially
• Some intervention by Australia, LDCs … usually to hit
IT, not maintain fix (though some initial dual targets)
• But exchange rate gradually lost importance as indicator
or target of monetary policy for IT countries (e.g., Chile,
Israel, NZ)
10
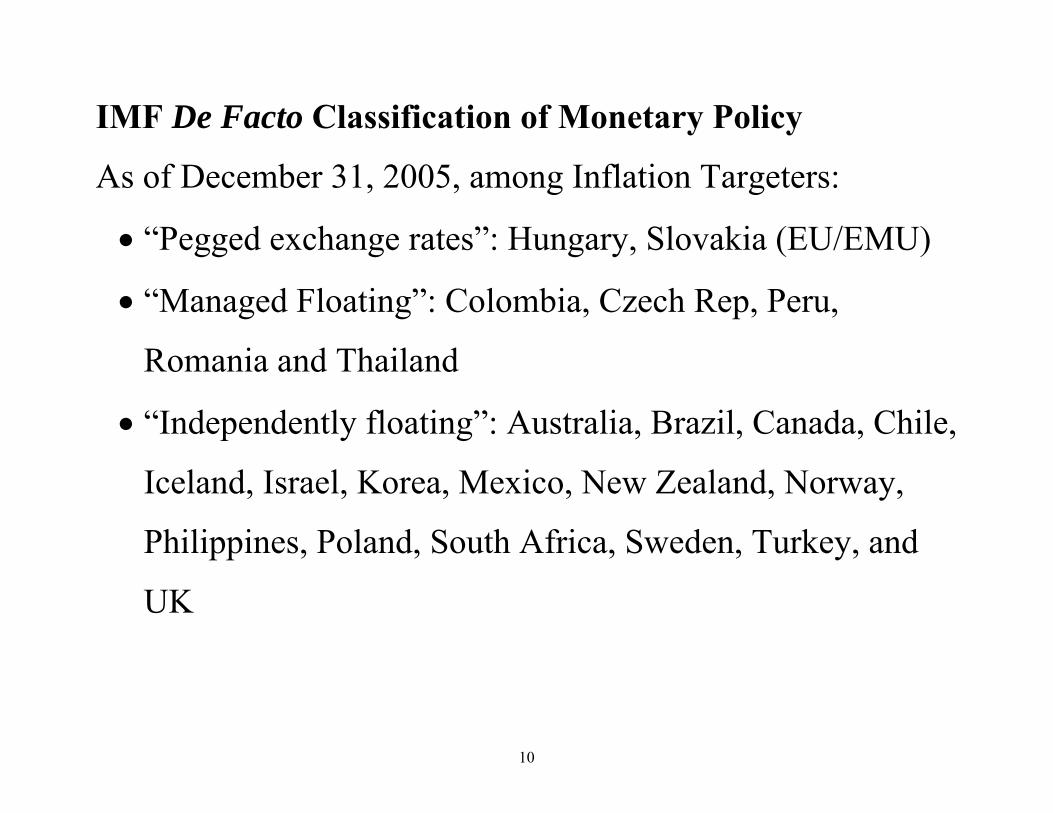
IMF De Facto Classification of Monetary Policy
As of December 31, 2005, among Inflation Targeters:
• “Pegged exchange rates”: Hungary, Slovakia (EU/EMU)
• “Managed Floating”: Colombia, Czech Rep, Peru,
Romania and Thailand
• “Independently floating”: Australia, Brazil, Canada, Chile,
Iceland, Israel, Korea, Mexico, New Zealand, Norway,
Philippines, Poland, South Africa, Sweden, Turkey, and
UK

11
Existing Literature
• Theoretical work on normative properties
o Ex: Benigno and Benigno, Obstfeld and Rogoff
• Empirical work on domestic aspects of IT
o Ex: Ball and Sheridan: does IT matter?
o Ex: Siklos: did inflation process change?
12
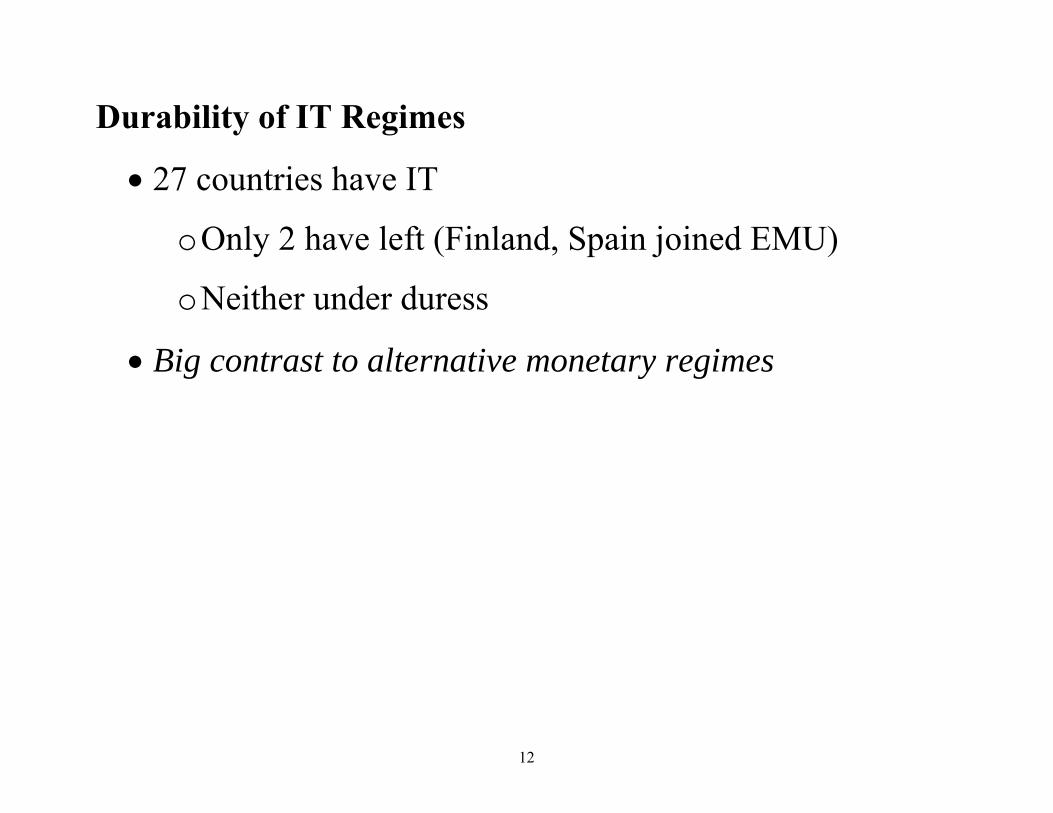
Durability of IT Regimes
• 27 countries have IT
o Only 2 have left (Finland, Spain joined EMU)
o Neither under duress
• Big contrast to alternative monetary regimes
13
Enough Data to Compare IT and Alternatives?
• NZ adopted IT first, only in 1990
• Is (short) span of data long (enough)?
14
Perhaps …
• Obstfeld and Rogoff in “Mirage of fixed exchange rates”:
few fixed exchange rates last 5 years!
o Bretton-Woods lasted only 1/’59 through 8/’71
Even this had many de/revaluations
o Money-growth target regimes even shorter
15
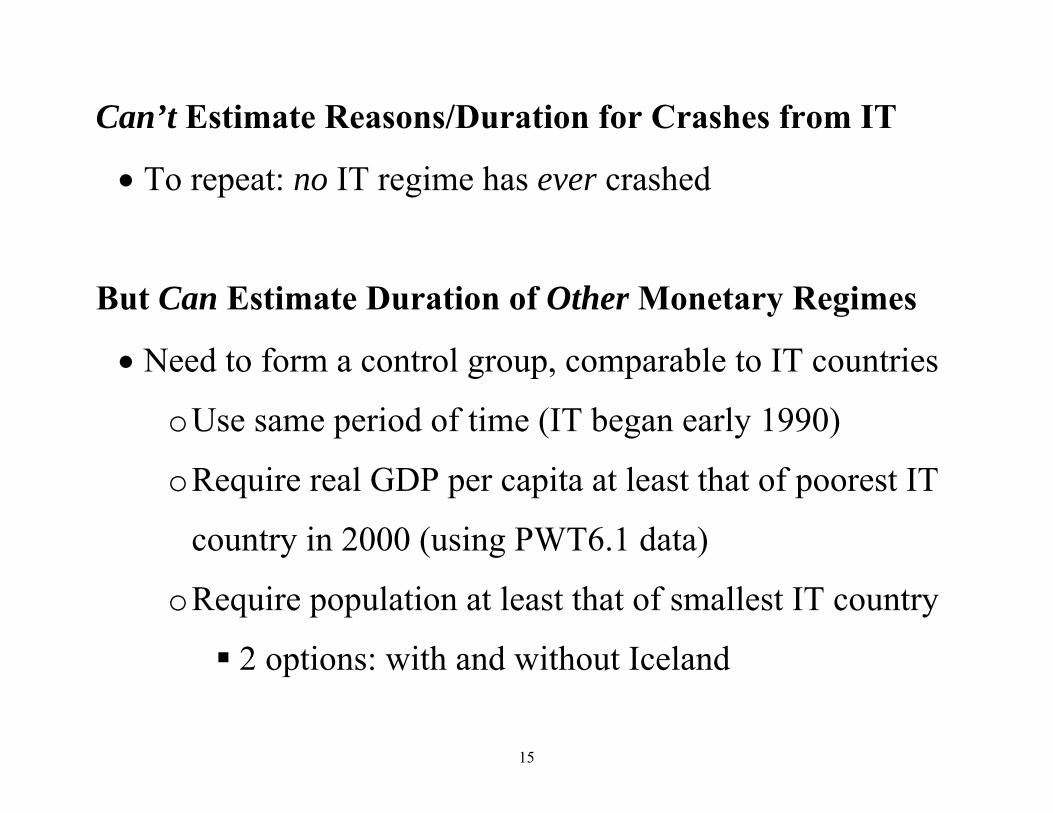
Can’t Estimate Reasons/Duration for Crashes from IT
• To repeat: no IT regime has ever crashed
But Can Estimate Duration of Other Monetary Regimes
• Need to form a control group, comparable to IT countries
o Use same period of time (IT began early 1990)
o Require real GDP per capita at least that of poorest IT
country in 2000 (using PWT6.1 data)
o Require population at least that of smallest IT country
2 options: with and without Iceland
16
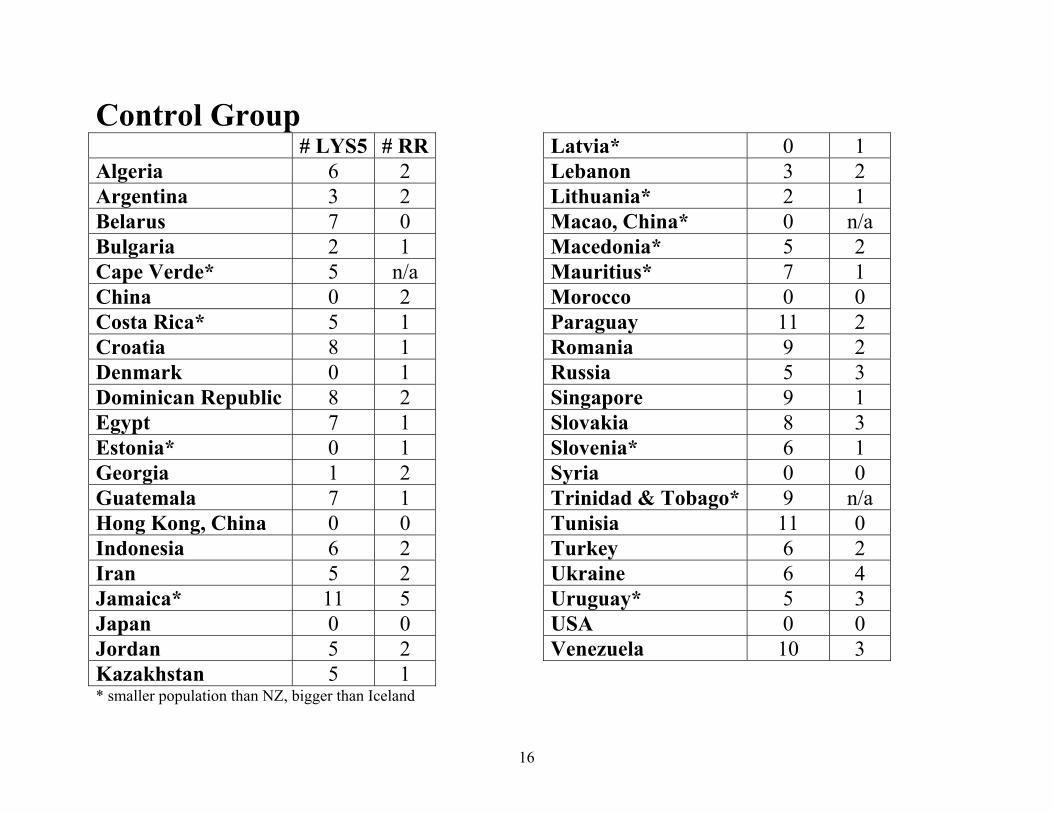
Control Group # LYS5 # RR Algeria 6 2 Argentina 3 2 Belarus 7 0 Bulgaria 2 1 Cape Verde* 5 n/a China 0 2 Costa Rica* 5 1 Croatia 8 1 Denmark 0 1 Dominican Republic 8 2 Egypt 7 1 Estonia* 0 1 Georgia 1 2 Guatemala 7 1 Hong Kong, China 0 0 Indonesia 6 2 Iran 5 2 Jamaica* 11 5 Japan 0 0 Jordan 5 2 Kazakhstan 5 1
Latvia* 0 1 Lebanon 3 2 Lithuania* 2 1 Macao, China* 0 n/a Macedonia* 5 2 Mauritius* 7 1 Morocco 0 0 Paraguay 11 2 Romania 9 2 Russia 5 3 Singapore 9 1 Slovakia 8 3 Slovenia* 6 1 Syria 0 0 Trinidad & Tobago* 9 n/a Tunisia 11 0 Turkey 6 2 Ukraine 6 4 Uruguay* 5 3 USA 0 0 Venezuela 10 3
* smaller population than NZ, bigger than Iceland
1
De Facto Measures of Exchange Rate Regimes
• Use Levy-Yeyati and Sturzenegger (2003) “LYS”
o use exchange rates and intervention to create annual
(5- and 3-way) classifications of regimes through 2004
• Also use Reinhart-Rogoff (2004) “RR”
o use parallel markets to create monthly 14-way
classification of regimes through 2001
2
Parenthetically:
IMF De Jure Measure of Exchange Rate Regime (GGW)
• 45 fixes of exchange rate from 1990 onwards
o 23 ended
o 22 have not ended yet 3 Dollarizations (Ecuador, El Salvador, Timor Leste)
4 European Currency Boards (Bulgaria, Estonia, Latvia, Lithuania)
12 young (since 2000) fixes (Belarus, Iraq, Lebanon, Libya,
Mauritania, Pakistan, Solomon Islands, Trinidad & Tobago,
Turkmenistan, Ukraine, Venezuela, Vietnam), usually with
controls
Others: (China, Guinea-Bissau, Morocco), also with controls
3
Issues with De Facto Regime Classifications
• Samples differ, incomplete
• Classifications do not coincide
o Ex: LYS have 7 switches for Belarus ’90 to ’04; RR
have none ’90 to ’01 (“freely falling” throughout)
• Some switches may not be reflected
o Would like monetary, not exchange rate regimes
Ex: floater that switches in and out of money
growth rate wouldn’t show up in LYS/RR
Result is over-estimation of stability
4
Still, Exchange Rate Regimes Typically Short
• Ex: Jamaica switched regimes 11 times in 15 years (LYS)
• 5 countries experienced no changes with both schemes
o Morocco targets M1 growth, with peg against secret
multilateral basket, and many capital controls
o Syria has peg with many controls, multiple exchange
rates
o HK has successful currency board
o US and Japan have “no explicit nominal anchor,
monitor various indicators to conducting policy”
5
Statistical Techniques Imply Short Durations
• Estimate standard measures of duration
• Use 3 measures of ER regimes
• All imply short durations
6
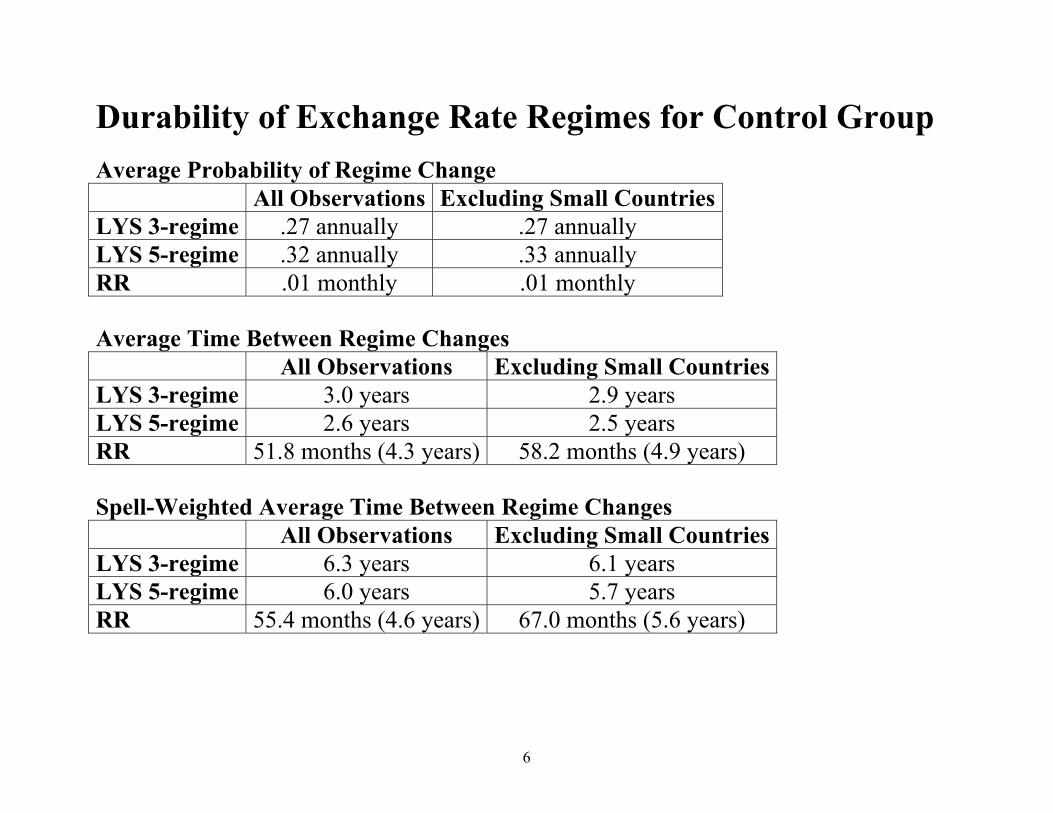
Durability of Exchange Rate Regimes for Control Group Average Probability of Regime Change All Observations Excluding Small CountriesLYS 3-regime .27 annually .27 annually LYS 5-regime .32 annually .33 annually RR .01 monthly .01 monthly Average Time Between Regime Changes All Observations Excluding Small CountriesLYS 3-regime 3.0 years 2.9 years LYS 5-regime 2.6 years 2.5 years RR 51.8 months (4.3 years) 58.2 months (4.9 years) Spell-Weighted Average Time Between Regime Changes All Observations Excluding Small CountriesLYS 3-regime 6.3 years 6.1 years LYS 5-regime 6.0 years 5.7 years RR 55.4 months (4.6 years) 67.0 months (5.6 years)
7
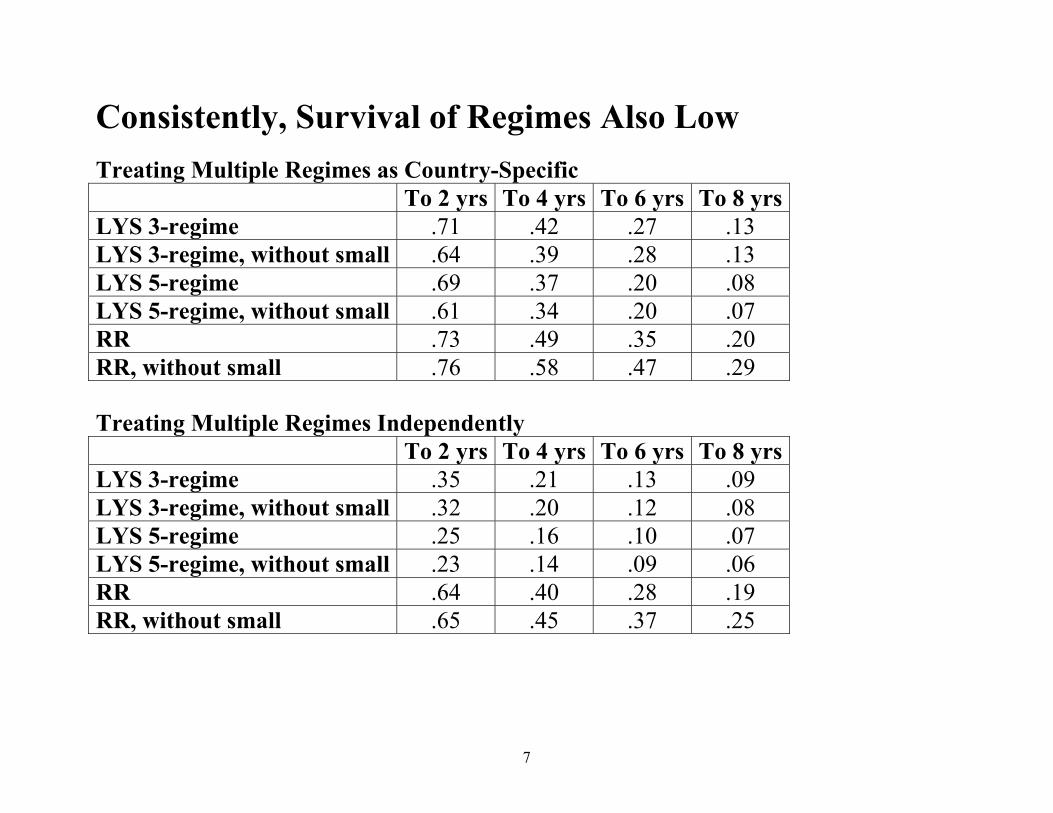
Consistently, Survival of Regimes Also Low Treating Multiple Regimes as Country-Specific To 2 yrs To 4 yrs To 6 yrs To 8 yrsLYS 3-regime .71 .42 .27 .13 LYS 3-regime, without small .64 .39 .28 .13 LYS 5-regime .69 .37 .20 .08 LYS 5-regime, without small .61 .34 .20 .07 RR .73 .49 .35 .20 RR, without small .76 .58 .47 .29 Treating Multiple Regimes Independently To 2 yrs To 4 yrs To 6 yrs To 8 yrsLYS 3-regime .35 .21 .13 .09 LYS 3-regime, without small .32 .20 .12 .08 LYS 5-regime .25 .16 .10 .07 LYS 5-regime, without small .23 .14 .09 .06 RR .64 .40 .28 .19 RR, without small .65 .45 .37 .25
8
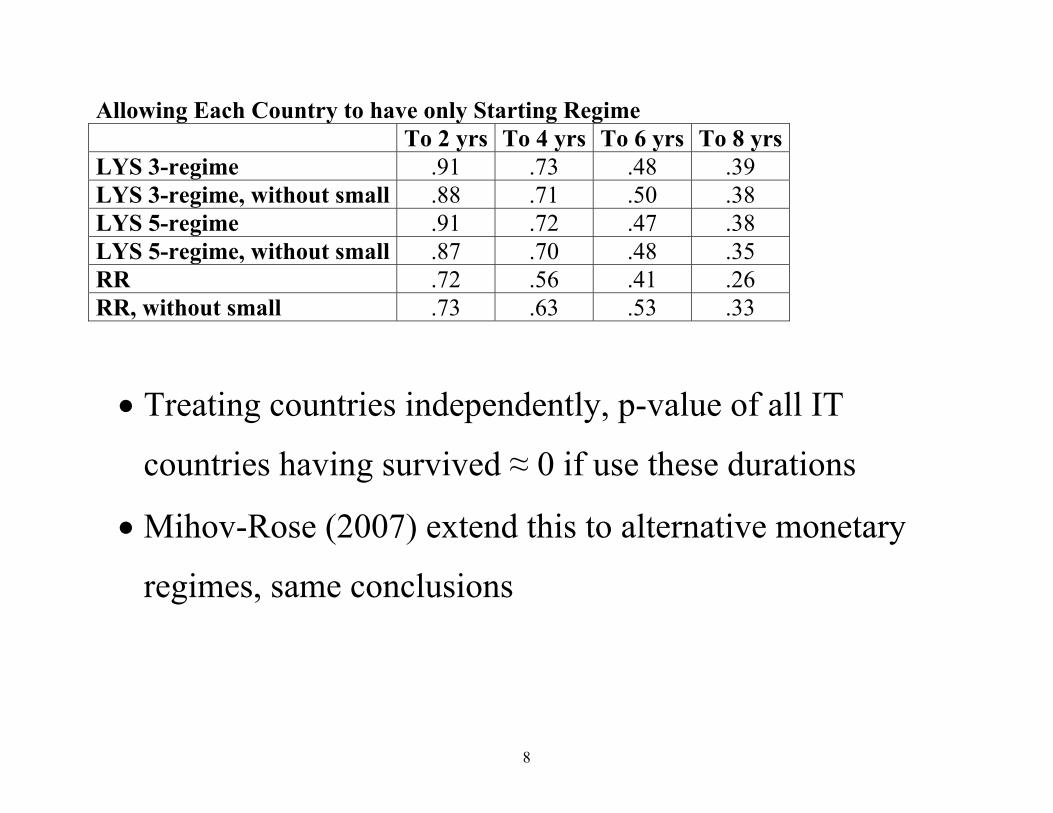
Allowing Each Country to have only Starting Regime To 2 yrs To 4 yrs To 6 yrs To 8 yrsLYS 3-regime .91 .73 .48 .39 LYS 3-regime, without small .88 .71 .50 .38 LYS 5-regime .91 .72 .47 .38 LYS 5-regime, without small .87 .70 .48 .35 RR .72 .56 .41 .26 RR, without small .73 .63 .53 .33
• Treating countries independently, p-value of all IT
countries having survived ≈ 0 if use these durations
• Mihov-Rose (2007) extend this to alternative monetary
regimes, same conclusions
9
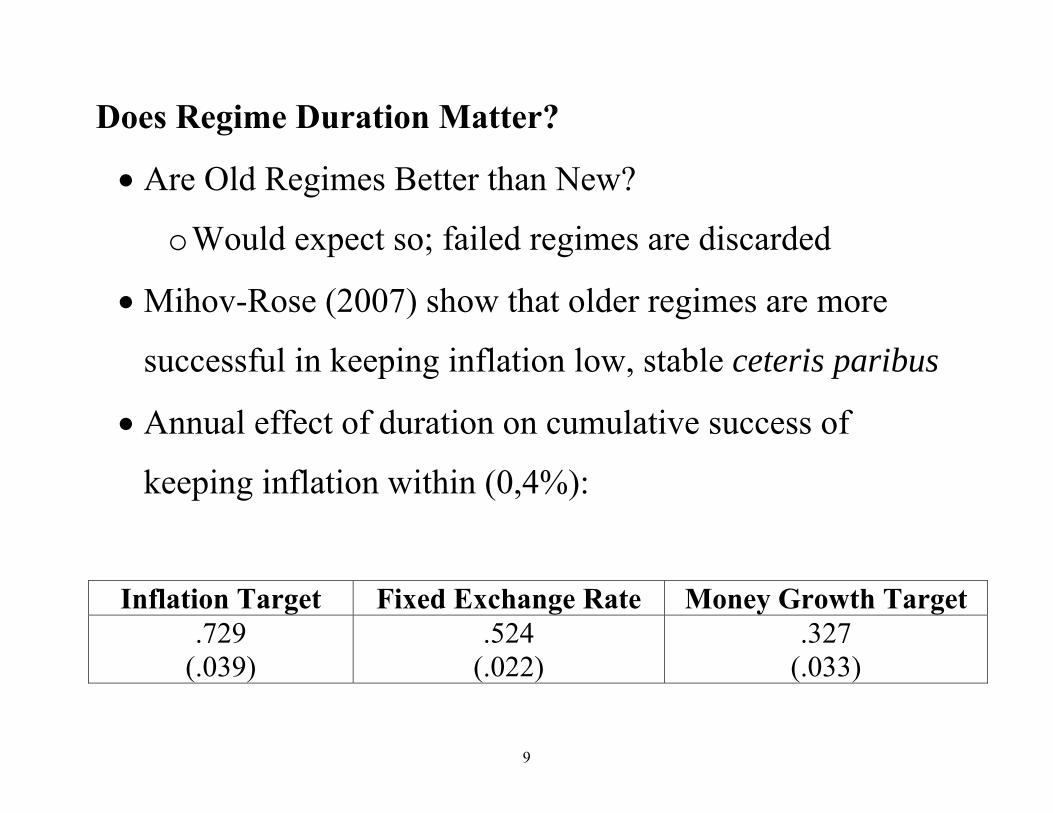
Does Regime Duration Matter?
• Are Old Regimes Better than New?
o Would expect so; failed regimes are discarded
• Mihov-Rose (2007) show that older regimes are more
successful in keeping inflation low, stable ceteris paribus
• Annual effect of duration on cumulative success of
keeping inflation within (0,4%):
Inflation Target Fixed Exchange Rate Money Growth Target
.729 (.039)
.524 (.022)
.327 (.033)
10
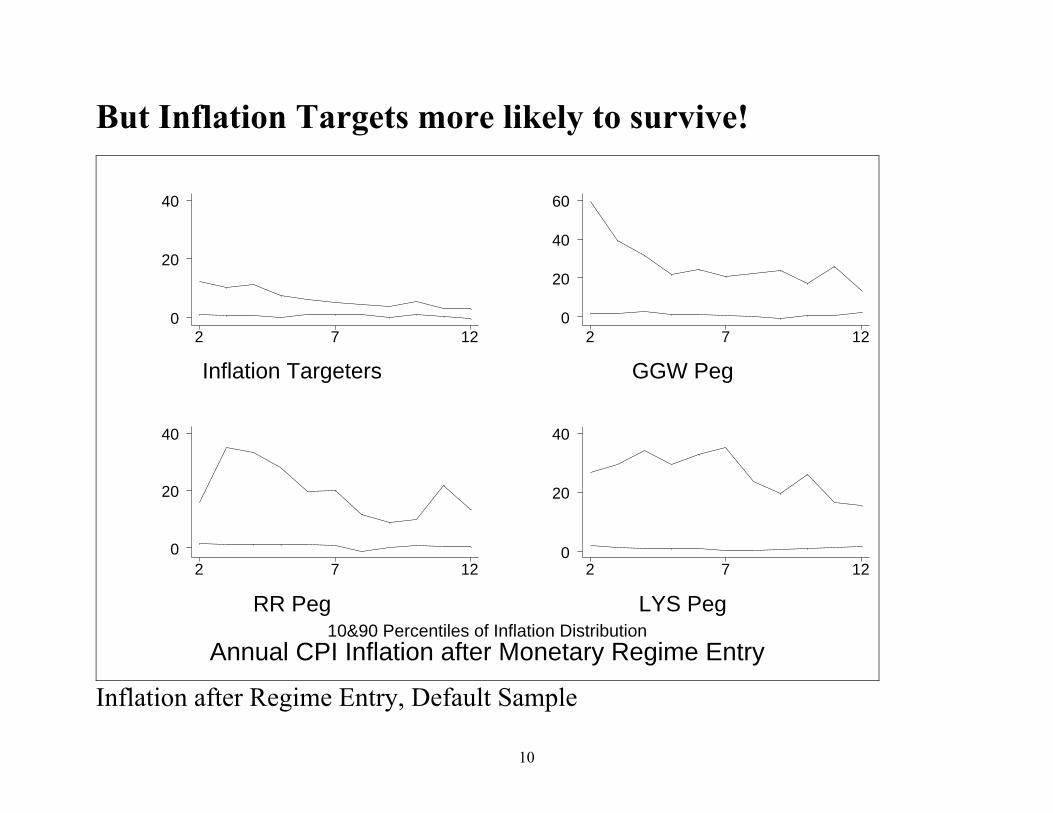
But Inflation Targets more likely to survive!
Annual CPI Inflation after Monetary Regime Entry10&90 Percentiles of Inflation Distribution
Inflation Targeters
2 7 12
40
20
0
GGW Peg
2 7 12
60
40
20
0
RR Peg
2 7 12
40
20
0
LYS Peg
2 7 12
40
20
0
Inflation after Regime Entry, Default Sample
11
Conclusion
• IT is far more durable than Exchange Rate Regimes!
o Durability matters; older regimes more successful
• Durability a big Contrast with Previous Systems
12
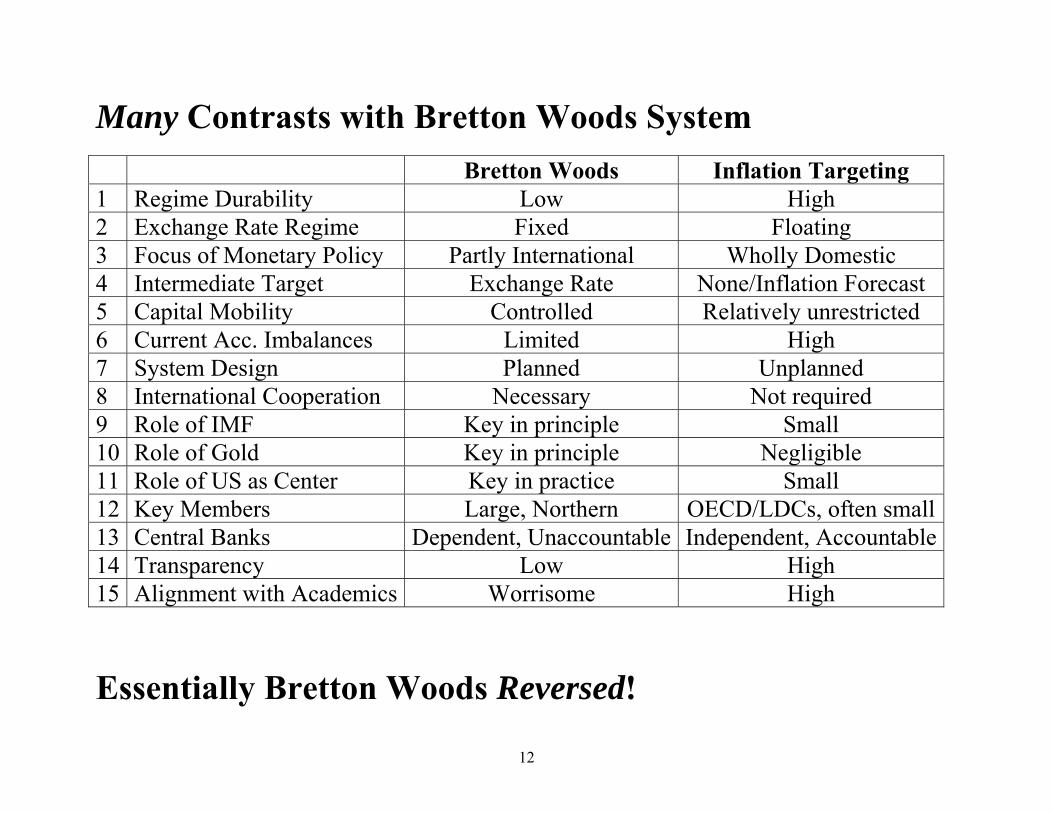
Many Contrasts with Bretton Woods System Bretton Woods Inflation Targeting 1 Regime Durability Low High 2 Exchange Rate Regime Fixed Floating 3 Focus of Monetary Policy Partly International Wholly Domestic 4 Intermediate Target Exchange Rate None/Inflation Forecast 5 Capital Mobility Controlled Relatively unrestricted 6 Current Acc. Imbalances Limited High 7 System Design Planned Unplanned 8 International Cooperation Necessary Not required 9 Role of IMF Key in principle Small 10 Role of Gold Key in principle Negligible 11 Role of US as Center Key in practice Small 12 Key Members Large, Northern OECD/LDCs, often small13 Central Banks Dependent, Unaccountable Independent, Accountable14 Transparency Low High 15 Alignment with Academics Worrisome High
Essentially Bretton Woods Reversed!
13
Do IT Countries Have Higher Exchange Rate Volatility?
• Domestic focus of monetary policy might result in higher
exchange rate volatility
o Mussa/Baxter-Stockman/Flood-Rose: fixers have
nominal lower exchange rate volatility (and real, in
short run)
• But: lower policy volatility, more stable expectations
might result in lower exchange rate volatility
• Easy to test
14
Comparing Exchange Rate Volatility: IT and Control
• Use IFS effective exchange rate data
o Nominal for 45 IT and Control-Group countries
o Real (CPI) for 42
• Estimate standard deviations of logs over non-overlapping
intervals
o Four 4-year periods (1/’90 to 12/’93, etc)
o Two 8-yr periods
o One 16-yr period
o Drop data for IT countries before IT began
15
Regression Framework
• Regress volatility on:
o Dummy for IT countries (key coefficient tabulated)
o Controls from WDI:
Current account (% GDP)
Log Openness (Trade, % GDP)
Log Population
Log real GDP per capita (PPP)
o Intercept, time effects

16
Nominal Real
Volatility Interval: 4 years 8 years 16 yrs 4 years 8 years 16 yrs Default -.05
(.05) -.14 (.10)
-.32* (.15)
-.00 (.01)
-.01 (.02)
-.05 (.03)
Without Time Effects -.06 (.05)
-.15 (.10)
-.00 (.01)
-.01 (.02)
No Controls -.10* (.04)
-.19* (.08)
-.40**(.13)
-.03* (.01)
-.04* (.02)
-.07** (.02)
Without Pop & Curr Acc -.06 (.05)
-.11 (.09)
-.31* (.15)
-.00 (.02)
-.01 (.02)
-.05 (.03)
Without 1.5 σ outliers -.06 (.05)
-.15 (.10)
-.18* (.08)
-.00 (.01)
-.01 (.02)
-.03 (.02)
Quantile Estimation
-.01 (.01)
-.04 (.04)
-.14**(.05)
.02 (.01)
.01 (.03)
-.04* (.02)
Without Small -.07 (.05)
-.17 (.11)
-.38* (.16)
-.00 (.01)
-.02 (.03)
-.06 (.03)
Without Poor (< $5000) -.04 (.04)
-.13 (.09)
-.27* (.12)
.00 (.01)
-.01 (.03)
-.04 (.03)
Weighted by log real GDP
-.05** (.01)
-.14** (.02)
-.32**(.03)
-.001 (.003)
-.011**(.004)
-.048**(.005)
Volatility of 1st-Diff of Log -.002 (.007)
-.011 (.012)
-.019 (.011)
Avg Abs 1st-Diff of Log -.001 (.004)
-.004 (.005)
-.004 (.004)

17
Exchange Rate Volatility Usually Lower for IT Countries!
• Often insignificantly different from zero
• Reasonably robust to:
o Specification
o Outliers
o Sample
o Estimator
o Non-stationarity in neer
• 64 coefficients: only 5 positive (none significant)
o 17 significantly negative at .05; 8 at .01
18
Regime Choice: A Serious Caveat?
• Simultaneity potentially serious, since countries choose
their monetary policy regimes
o Possible that countries expecting few “exchange rate
shocks” choose inflation targets
• An obvious econometric fix is to use a matching estimator
o Lin (2007) finds exchange rate volatility falls for
OECD, but rises for developing countries
19
Reserves and Current Account Imbalances
• Use Annual WDI data, ’90 through ‘04
o Current Account as % GDP
o M2/Reserves
o Reserves in Months of Imports
• Handle Analogously to ER Volatility
o Create country-specific averages over same samples
• Simply compare reserves and current accounts
o Compare IT and control-group countries
o No regression model

20
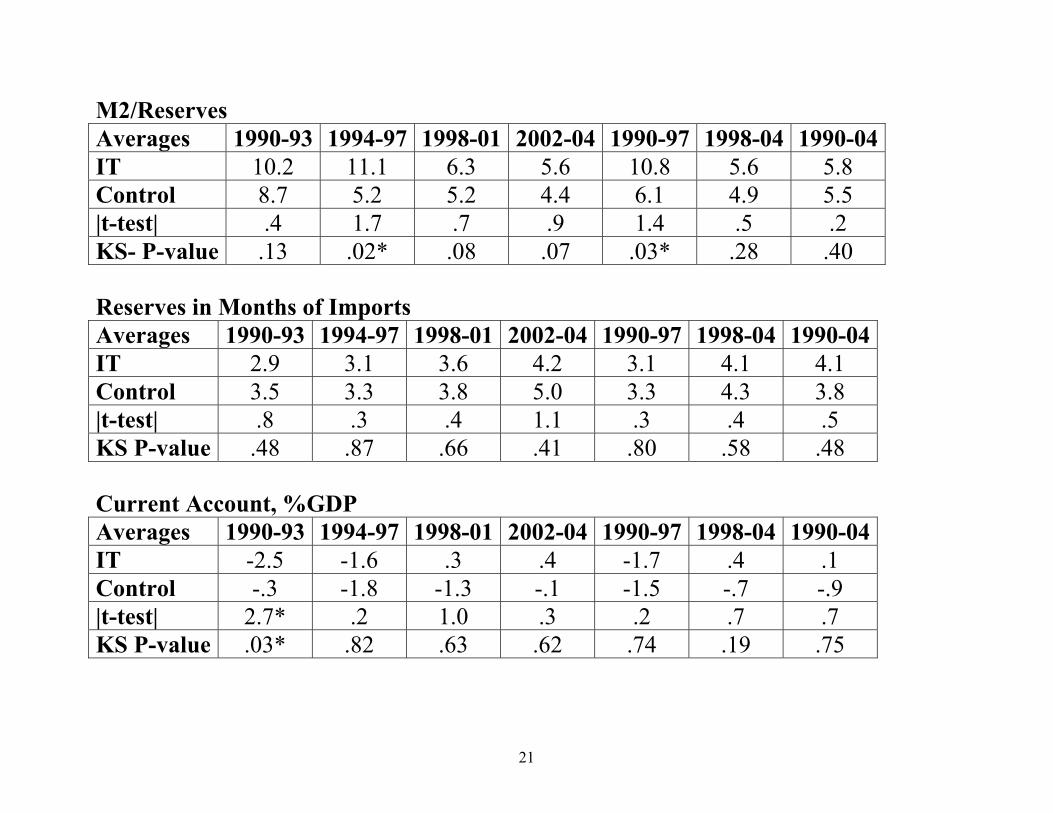
Reserves and Current Account Similar for IT, Controls
• Average values generally similar
o M2/Reserves smaller for IT in mid-‘90s
Similar in other samples
o Similar for Reserves/Imports
o Similar for Current Accounts
• Much dispersion across countries within groups
o Hence use non-parametric Kolmogorov-Smirnov tests
for equality of distribution
o Almost never reject equality
21
M2/Reserves Averages 1990-93 1994-97 1998-01 2002-04 1990-97 1998-04 1990-04IT 10.2 11.1 6.3 5.6 10.8 5.6 5.8 Control 8.7 5.2 5.2 4.4 6.1 4.9 5.5 |t-test| .4 1.7 .7 .9 1.4 .5 .2 KS- P-value .13 .02* .08 .07 .03* .28 .40 Reserves in Months of Imports Averages 1990-93 1994-97 1998-01 2002-04 1990-97 1998-04 1990-04IT 2.9 3.1 3.6 4.2 3.1 4.1 4.1 Control 3.5 3.3 3.8 5.0 3.3 4.3 3.8 |t-test| .8 .3 .4 1.1 .3 .4 .5 KS P-value .48 .87 .66 .41 .80 .58 .48 Current Account, %GDP Averages 1990-93 1994-97 1998-01 2002-04 1990-97 1998-04 1990-04IT -2.5 -1.6 .3 .4 -1.7 .4 .1 Control -.3 -1.8 -1.3 -.1 -1.5 -.7 -.9 |t-test| 2.7* .2 1.0 .3 .2 .7 .7 KS P-value .03* .82 .63 .62 .74 .19 .75
22
Sudden Stops • Are IT countries more vulnerable to “sudden stops” of
capital inflows?
• Use all (5) measures of sudden stops available
o Simple tests of frequency equality (equivalent to chi-
square tests)
o Note: sudden stops are rare, so would like larger
sample for good test
23
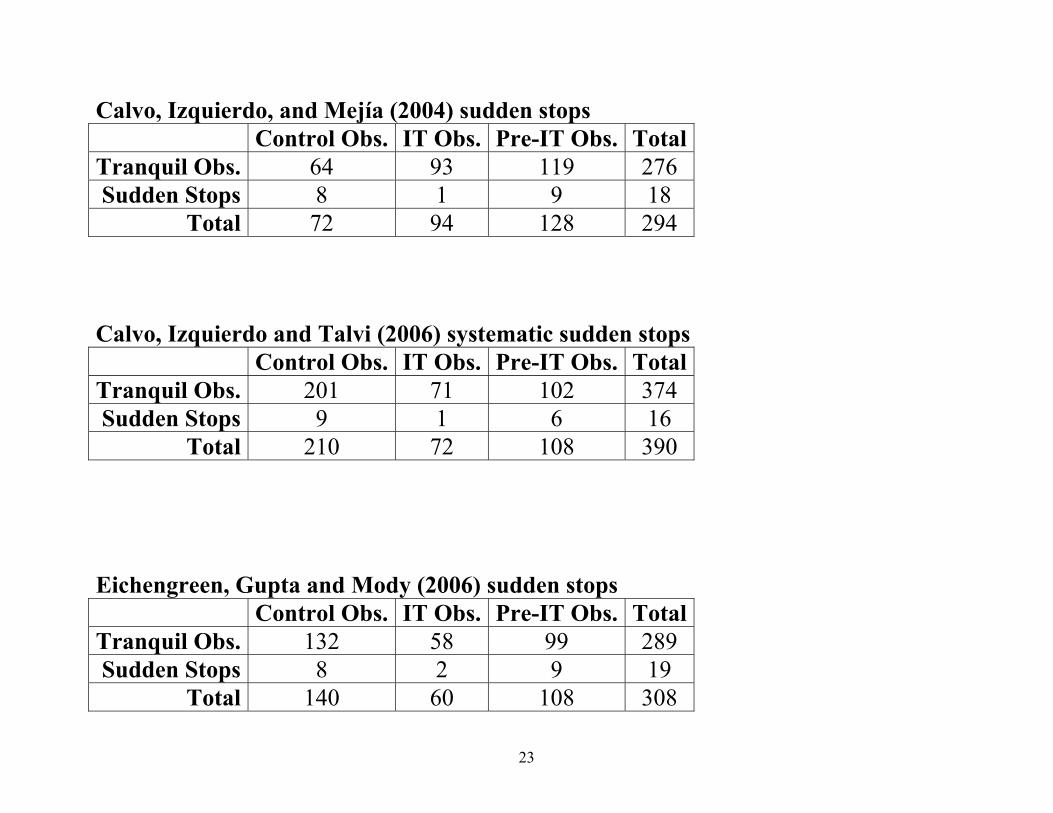
Calvo, Izquierdo, and Mejía (2004) sudden stops Control Obs. IT Obs. Pre-IT Obs. Total
Tranquil Obs. 64 93 119 276 Sudden Stops 8 1 9 18
Total 72 94 128 294 Calvo, Izquierdo and Talvi (2006) systematic sudden stops
Control Obs. IT Obs. Pre-IT Obs. TotalTranquil Obs. 201 71 102 374 Sudden Stops 9 1 6 16
Total 210 72 108 390 Eichengreen, Gupta and Mody (2006) sudden stops
Control Obs. IT Obs. Pre-IT Obs. TotalTranquil Obs. 132 58 99 289 Sudden Stops 8 2 9 19
Total 140 60 108 308
24
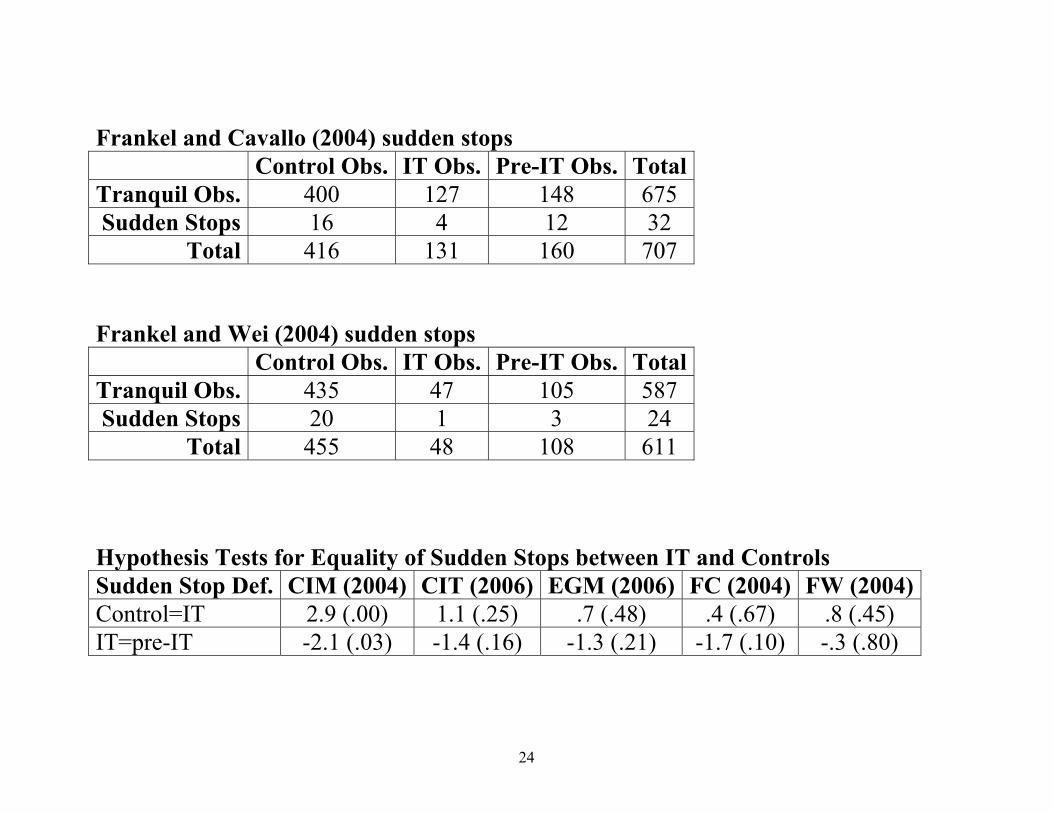
Frankel and Cavallo (2004) sudden stops
Control Obs. IT Obs. Pre-IT Obs. TotalTranquil Obs. 400 127 148 675 Sudden Stops 16 4 12 32
Total 416 131 160 707 Frankel and Wei (2004) sudden stops
Control Obs. IT Obs. Pre-IT Obs. TotalTranquil Obs. 435 47 105 587 Sudden Stops 20 1 3 24
Total 455 48 108 611 Hypothesis Tests for Equality of Sudden Stops between IT and Controls Sudden Stop Def. CIM (2004) CIT (2006) EGM (2006) FC (2004) FW (2004)Control=IT 2.9 (.00) 1.1 (.25) .7 (.48) .4 (.67) .8 (.45) IT=pre-IT -2.1 (.03) -1.4 (.16) -1.3 (.21) -1.7 (.10) -.3 (.80)

25
Conclusion:
• Sudden stops consistently less frequent for IT than for
control group
o But results rarely statistically significant
26
Parenthetically
• No Inflation Targeter has ever experienced a banking
crisis!
o Ho and von Hagen (2004) survey eight sets of dates,
add their own
o Kroszner, Laeven and Klingebiel (2006)
o No banking crises for: Australia, Canada, Chile, Israel,
New Zealand, Sweden, the UK
27
Conclusion
• Few Monetary Strategies exist
o Fixed exchange rates
o Money growth targets
o Hybrid/Ill-defined strategies
o Inflation Targets; the focus
28
Characteristics of Inflation Targeters
• Floating exchange rates
o Often without interventions or capital controls
o But ER volatility actually lower than non-IT
o No observable consequences for reserves/current
accounts
o Sudden stops less frequent
• IT is highly durable
• IT spreading quickly outside OECD (pervasive inside)
29
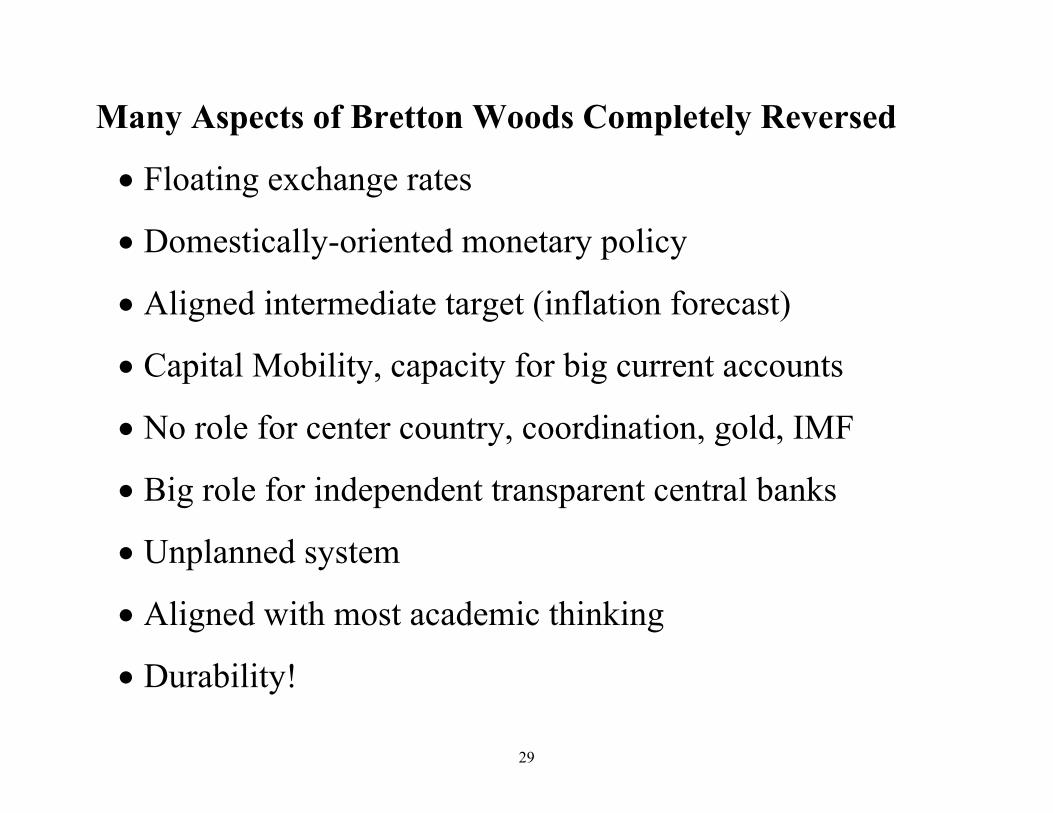
Many Aspects of Bretton Woods Completely Reversed
• Floating exchange rates
• Domestically-oriented monetary policy
• Aligned intermediate target (inflation forecast)
• Capital Mobility, capacity for big current accounts
• No role for center country, coordination, gold, IMF
• Big role for independent transparent central banks
• Unplanned system
• Aligned with most academic thinking
• Durability!
30
Financial Crises are not a feature of Inflation Targeters
• Are they a thing of the past?


![The Value of the Revolving Door: Political Appointees and the …faculty.haas.berkeley.edu/arose/MoserRosePres.pdf · 2013-11-05 · “Joseph Stiglitz […] The United States and](https://img.pdfslide.us/doc/110x75/5f71b2a71d6ca10c2d696ff2/the-value-of-the-revolving-door-political-appointees-and-the-2013-11-05-aoejoseph.jpg)