Embed Size (px)
Citation preview
A SPECTROPHOTOMETRIC STUDY OF BLOOD GROUP A-SPECIFIC SUBSTANCE ISOLATED FROM
HOG GASTRIC MUCOSA
BY GEORGE HOLZMAN* AND CARL NIEMANN
(From the Gates and Crellin Laboratories of Chemistry,t California Institute of Technology, Pasadena)
(Received for publication, January 12, 1948)
The isolation from hog gastric mucosa of homogeneous preparations of the polysaccharide-amino acid complex possessing the ability to inhibit the isoagglutination of human blood group A cells (1) has been hindered not only by dilliculties of manipulation and the presence in gastric mucosa of substances having properties similar to those of blood group A-specific sub- stance, but also by the fact that direct tests for determining the homo- geneity of the product are often insensitive and unreliable. In the past the efficacy of procedures used for the isolation and purification of group A substance have been evaluated by serological tests and in a few instances by ultracentrifugal analysis (2), electrophoretic analysis (3), total nitrogen content (3), apparent N-acetyl-D-glucosamine content (4), optical rotation (3)) and viscosity (3). Since we had at hand a large number of preparations of group A substance obtained from hog gastric mucosa by a variety of methods (5), it was thought advisable to determine to what extent ultra- violet spectrophotometry could be used for the evaluation of these prepara- tions. In addition such a study would also serve to indicate the importance of the aromatic amino acids as structural elements of group A substance.
The ultraviolet absorption spectra of group 0, A, and B substances from human urine and of group A substance from hog gastric mucosa, isolated by Freudenberg (6), were first studied by Groh, Szelyes, and Weltner (7) and later in greater detail by Weltner (8). These investigators reported that in neutral aqueous solution all of the blood group-specific substances showed weak selective absorption in the region 270 to 290 rnp, and their results indicated that the purification of group A substance, obtained from hog gastric mucosa, caused the extinction to increase throughout the ultraviolet region, since it was reported that a “purified” preparation and a “highly purified” preparation showed extinction coefh- cients of Ef:m. at 280 mp of 1.8 and 2.8, respectively. We have been
* Allied Chemical and Dye Corporation Fellow, 194fS-47. Present address, De- partment of Chemistry, Massachusetts Institute of Technology, Cambridge, Massa- chusetts.
t Contribution No. 1171.
305
306 BLOOD QROUP A-SPECIFIC SUBSTANCE
unable to confirm these results and in fact have observed that preparations of group A substance with greatly enhanced potencies, when compared with starting materials and intermediates, show little absorption in the ultra- violet. However, ultraviolet, spectrophotometry is particularly useful for the detection of certain impurities that may be present in preparations of the blood group-specific substances.
EXPERIMENTAL
Absorption Spectra-Optical densities for 1 cm. of solution at 25” were determined with a Beckman model DU spectrophotometer equipped with quartz cells at every 3 rnrz from 220 to 270 rnp, every 5 rnp from 270 to 300 rn,.t, and every 10 rnp from 300 to 350 mp. Additional observations were made when the maxima were displaced from the usual 260 rnp region. The spectra for all solutions were corrected for absorption due to solvent (cit- rate-phosphate buffer), which was important below 240 rnp. Extinction coefficients, E:‘&., were calculated from the usual relation, E:tm. = (loglo l,,jl)/cd, where d is bhe cell thickness and c the concentration of solute in gm. per 100 ml. of solution.
Gr0u.p A Substance SolutionsThose group A substance preparations which were used and not described previously (4, 5) are described in Table I. The solutions were prepared by dissolving the preparations in distilled water, taking 10 ml. aliquots, and adding 1 ml. of McIlvaine’s citrate- phosphate buffer, pH 7.0. The pH of the resulting mixtures was 7.20 =t 0.05 and the concentration of group A substance 300 to 380 y per ml. In a few instances, where indicated, solutions were prepared similarly at pH 6.30 f 0.05 and pH 8.05 f 0.05 by means of McIlvaine’s buffers. The final citric acid and disodium phosphate concentrations at pH 6.3, 7.2, and 8.0 were, respectively, 0.0034 M H&sHr.O~-0.0115 M NazHPOd, 0.0016 M
HaCaHbO,-0.015 M Na2HP0+ and 0.004 M H&HbOr-0.0176 M Na2HP04. Serological Tests--The inhibition of the isoagglutination test (4) and the
inhibition of the hemolysis test (5) have been described previously. The activities of many of the preparations used in this study were reported in the above papers.
RESULTS AND DISCUSSION
Group A substance preparations dissolved in distilled water generally give clear or slightly opalescent solutions. These solutions are colorless when prepared from undegraded preparations and faintly yellow when degraded preparations are used. The solutions show deviations from Beer’s law, since the extinction coefficients at a given wave-length and pH increase upon dilution.’ The extinction values also vary with pH and
1 Unpublished experiments.
0. HOLZMAN AND C. NIEMANh’ 307
generally increase in the region 220 to 350 rnp with decreasing PH.~ The extinction curves of solutions of pH 6 to 8 are not altered upon standing and the observed stability of solutions in this pH range is in agreement with observations made elsewhere by independent methods (3, 9). The in- crease in absorptisn of ahline solutions of group A substance observed by Weltner (8) is probably due to the lability of group A substance under
40
30
El% km.
90
ra
! I I I I I
!
I!
I I I I I
_-- 250 es0 950 990
w
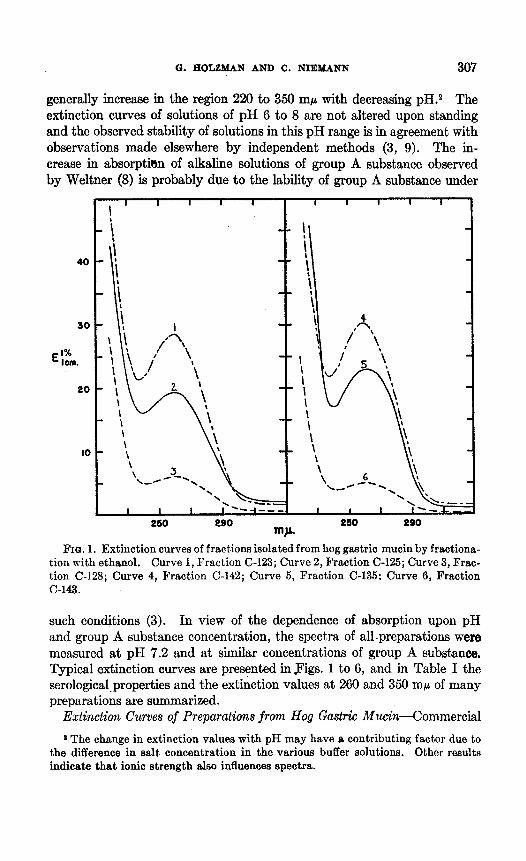
FIG. 1. Extinction curves of fract.ions isolated from hog gastric mucin by fractiona- tion with ethanol. Curve 1, Fract.ion C-123; Curve 2, Fraction C-125; Curve 3, Frac- tion C-128; Curve 4, Fraction C-142; Curve 5, Fraction C-135: Curve 6, Fraction c-143.
such conditions (3). In view of the dependence of absorption upon pH and group A substance concentration, the spectra of all-preparations were measured at pH 7.2 and at similar concentrations of group A substance. Typical extinction curves are presented in .Figs. 1 to 6, and in Table I the serological.properties and the extinction values at 260 and 350 rnp of many preparations are summarized.
Extinction Curves of Preparations from Hog Gastric Mucin-Commercial
* The change in extinction values with pH may have e contributing factor due to the difference in salt concentration in the various buffer solutions. Other results indicate that ionic strength also influences spectra.
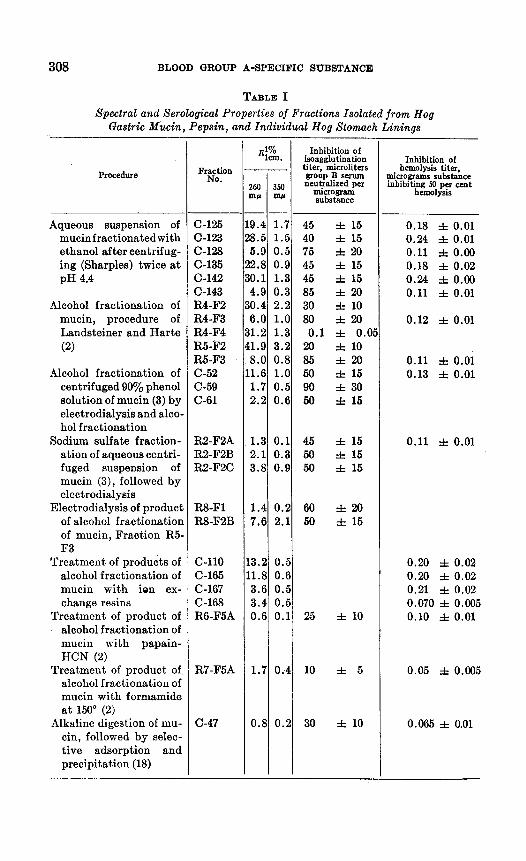
308
Procedure
Aqueous suspension of mucinfractionatedwith ethanol after centrifug- ing (Sharples) twice at pH 4.4
Alcohol fractionation of mucin, procedure of Landsteiner and Harte (2)
Alcohol fractionation of centrifuged 90% phenol solution of mucin (3) by electrodialysis and alto, ho1 fractionation
Sodium sulfate fraction- ation of aqueous centri- fuged suspension of mucin (3), followed by electrodialysis
Electrodialysis of producl of alcohol fractionatior of mucin, Fraction R5, F3
Treatment of products of alcohol fractionation of mucin with ion ex- change resins
Treatment of product of alcohol fractionation of mucin with papain- HCN (2)
Treatment of product of alcohol fractionation of mucin with formamide at 150” (2)
Alkaline digestion of mu- tin, followed by selec- tive adsorption and precipitation (18)
El% ICEIl.
160 350
mr nw
Inhibition of isoagglutination
titer, microliters DOUP B serum neutralized per
microgram substance
C-125 C-123 c-128 c-135 C-142 c-143 R4-F2 R4-F3 R4-F4 R5-F2 R5-F3 C-52 c-59 C-61
--
9.4 1.7 45 f 15 8.5 1.5 40 f 15 5.9 0.5 75 f 20 2.8 0.9 45 f 15 0.1 1.3 45 f 15 4.9 0.3 85 f 20 0.4 2.2 30 f 10 6.0 1.0 80 f 20 1.2 1.3 0.1 f o.ot 1.9 3.2 20 f 10 8.0 0.8 85 f 20 1.6 1.0 50 f 15 1.7 0.5 90 i 30 2.2 0.6 50 f 15
R2-F2A R2-F2B R2-F2C
1.3 0.1 45 f 15 2.1 0.3 50 f 15 3.8 0.9 50 i 15
R&F1 R8-F2B
1
.-
1
2
2 3
3
3 4
1
1 1
1.4 0.2 60 f 20 7.6 2.1 50 i 15
c-110 C-165 C-167 C-168 R6-F5A
3.2 0.5 1.8 0.6 3.6 0.5 3.4 0.5 0.6 0.1 25 f 10
R7-F5A 1.7 0:4 10 i 5
c-47 0.8/ 0.21 30 f 10 0.065 i 0.01
BLOOD GROUP A-SPECIFIC SUBSTANCE
TABLE I Spectral and Serological Properties of Fractions Isolated from Hog
Gastric Mucin, Pepsin, and Individual Hog Stomach Linings
Inhibition of hemolysis titer,
micrograms substmce inhibiting 30 per cent
hemolysis
0218 * 0.01 0.24 f 0.01 0.11 f 0.00 0.18 zh 0.02 0.24 f 0.00 0.11 f 0.01
0.12 rt 0.01
0.11 f 0.01 0.13 * 0.01
0.11 f 0.01
0.20 f 0.02 0.20 f 0.02 0.21 f 0.02 0.070 f 0.005 0.10 i 0.01
0.05 i 0.005
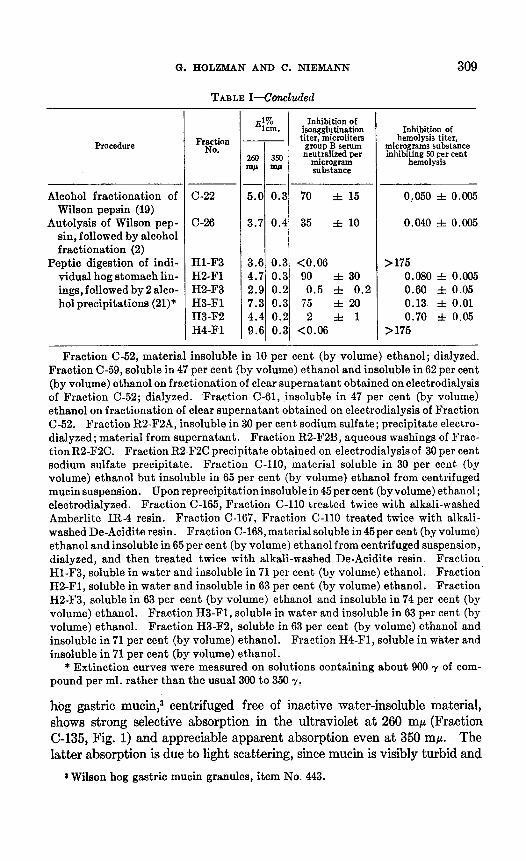
G. HOLZMAN AND C. NIEMANN
Procedure
Alcohol fractionation of Wilson pepsin (19)
Autolysis of Wilson pep- sin, followed by alcohol fractionation (2)
Peptic digestion of indi- vidual hog stomach lin- ings, followed by 2 alco- hol precipitations (21)*
-
. -
TABLE I--Gmcluded
C-22
C-26
Hl-F3 H2-Fl H2-F3 H3-Fl H3-F2 H4-Fl
-
I
El% Inhibition of 1CItI. isoagglutination
titer; microlitm group B semrn
260 350 neutralized per
mrw microgram substance
--
5.0 0.3 70 f 15
3.7 0.4 35 zk 10
3.6 0.3 <0.06 4.7 0.3 90 f 30 2.9 0.2 0.5 zk 0.2 7.3 0.3 75 i 20 4.4 0.2 9.61 0.3
2 i 1 <0.06
309
Inhibition of hemolysis titer,
micrograms substance inhibiting 50 per cent
hemolysis
0.050 f 0.095
0.040 zlz 0.005
>175 0.080 f 0.005 0.60 f 0.05 0.13 f 0.01
0.70 f 0.05 >175
Fraction C-52, material insoluble in 10 per cent (by volume) ethanol; dialyzed. Fraction C-59, soluble in 47 per cent (by volume) ethanol and insoluble in 62 per cent (by volume) ethanol on fractionation of clear supernatant obtained on electrodialysis of Fraction C-52; dialyzed. Fraction C-61, insoluble in 47 per cent (by volume) ethanol on fractionation of clear supernatant obtained on electrodialysis of Fraction C-52. Fraction R2-F2A, insoluble in 30 per cent sodium sulfate; precipitate electro- dialyzed; material from supernatant. Fraction R2-F2B, aqueous washings of Frac- tionR2-F2C. Fraction R2-F2Cprecipitate obtained on electrodialysisof 30 per cent sodium sulfate precipitate. Fraction C-110, material soluble in 30 per cent (by volume) ethanol but insoluble in 65 per cent (by volume) ethanol from centrifuged mucin suspension. Upon reprecipitationinsoluble in 45 per cent (by volume) ethanol; electrodialyzed. Fraction C-165, Fraction C-110 treated twice with alkali-washed Amberlite IR-4 resin. Fraction C-167, Fraction C-110 treated twice with alkali- washed De-Acidite resin. Fraction C-163, material soluble in 45per cent (by volume) ethanol and insoluble in 65 per cent (by volume) ethanol from centrifuged suspension, dialyzed, and then treated twice with alkali-washed De-Acidite resin. Fraction Hl-F3, soluble in water and insoluble in 71 per cent (by volume) ethanol. Fraction’ H2-Fl, soluble in water and insoluble in 63 per cent (by volume) ethanol. Fraction H2-F3, soluble in 63 per cent (by volume) ethanol and insoluble in 74 per cent (by volume) ethanol. Fraction H3-Fl, soluble in water and insoluble in 63 per cent (by volume) ethanol. Fraction H3-F2, soluble in 63 per cent (by volume) ethanol and insoluble in 71 per cent (by volume) ethanol. Fraction H4-Fl, soluble in water and insoluble in 71 per cent (by volume) ethanol.
* Extinction curves were measured on solutions containing about 900 y of com- pound per ml. rather than the usual 300 to 350 7:
hog gastric muciq3 centrifuged free of inactive water-insoluble material, shows strong selective absorption in the ultraviolet at 260 rnp (Fraction C-135, Fig. 1) and appreciable apparent absorption even at 350 rnp. The latter absorption is due to light scattering, since mucin is visibly turbid and
8 Wilson hog gastric mucin granules, item No. 443.
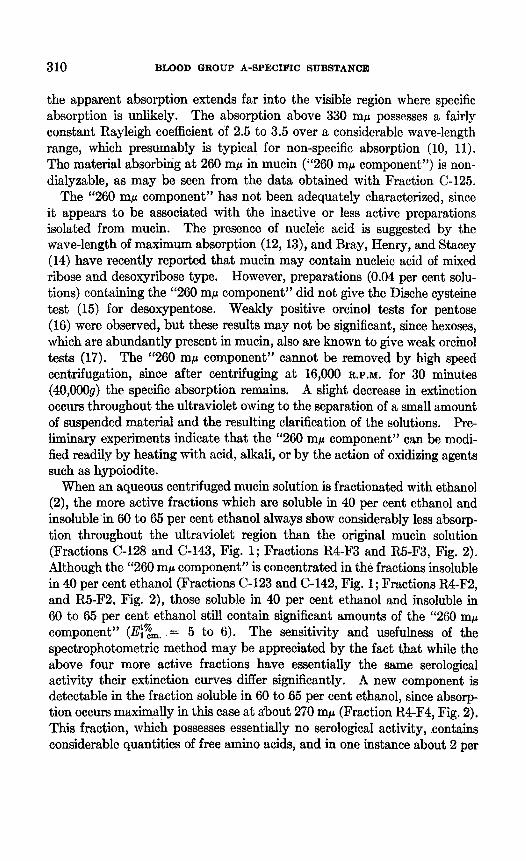
310 BLOOD GROUP A-SPECIFIC SUBSTANCE
the apparent absorption extends far into the visible region where specific absorption is unliitely. The absorption above 330 rnp possesses a fairly constant Rayleigh coe&ient of 2.5 to 3.5 over a considerable wave-length range, which presumably is typical for non-specific absorption (10, 11). The material absorbing at 260 rnp in mucin (“260 rnp component,“) is non- dialyzable, as may be seen from the data obtained with Fraction C-125.
The “260 rnp component” has not been adequately characterized, since it appears to be associated with the inactive or less active preparations isolated from mucin. The presence of nucleic. acid is suggested by the wave-length of maximum absorption (12, 13)) and Bray, Henry, and Stacey (14) have recently reported that mucin may contain nucleic acid of mixed ribose and desoxyribose type. However, preparations (0.04 per cent solu- tions) containing the “260 rncc component” did not give the Dische cysteine test (15) for desoxypentose. Weakly positive orcinol tests for pentose (16) were observed, but these results may not be significant, since hexoses, which are abundantly present in mucin, also are known to give weak orcinol tests (17). The “260 rnp component” cannot be removed by high speed centrifugation, since after centrifuging at 16,000 R.P.M. for 30 minutes (40,OOOg) the specific absorption remains. A slight decrease in extinction occurs throughout the ultraviolet owing to the separation of a small amount of suspended material and the resulting clarification of the solutions. Pre- liminary experiments indicate that the “260 rnp component” can be modi- fied readily by heating with acid, alkali, or by the action of oxidizing agents such as hypoiodite.
When an aqueous centrifuged mucin solution is fractionated with ethanol (2), the more active fractions which are soluble in 40 per cent ethanol and insoluble’in 60 to 65 per cent ethanol always show considerably less absorp- tion throughout the ultraviolet region than the original mucin solution (Fractions C-128 and C-143, Fig. 1; Fractions R4-F3 and R5-F3, Fig. 2). Although the “260 rnp component” is concentrated in the fractions insoluble in 40 per cent ethanol (Fractions C-123 and C-142, Fig. 1; Fractions R4-F2, and R5-F2, Fig. 2)) those soluble in 40 per cent ethanol and insoluble in 60 to 65 per cent ethanol still contain significant amounts of the “260 rnp component” (I#?&. = 5 to 6). The sensitivity and usefulness of the spectrophotometric method may be appreciated by the fact that while the above four more active fractions have essentially the same serological activity their extinction curves differ significantly. A new component is detectable in the fraction soluble in 60 to 65 per cent ethanol, since absorp- tion occurs maximally in this case at about 270 rnp (Fraction R4-F4, Fig. 2). This fraction, which possesses essentially no serological activity, contains considerable quantities of free amino acids, and in one instance about 2 per
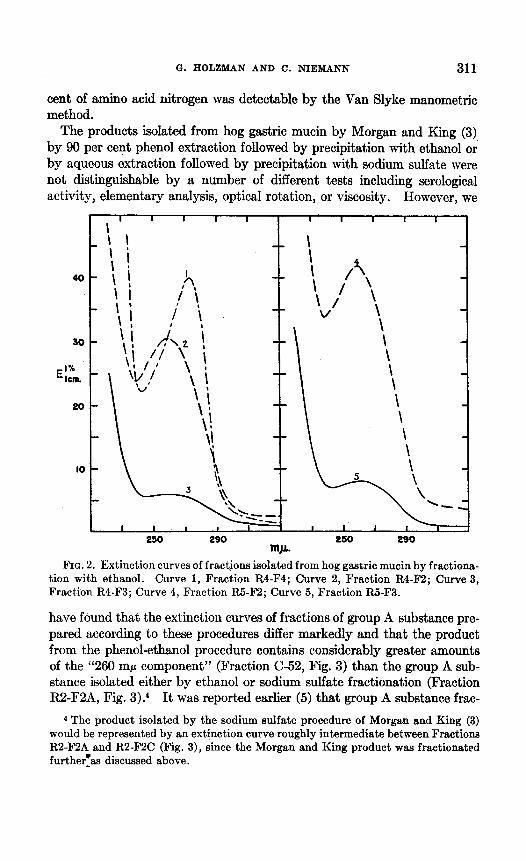
G. HOLZMAN AND C. NIEMANN 311
cent of amino acid nitrogen was detectable by the Van Slyke manometric method.
The products isolated from hog gastric mucin by Morgan and King (3) by 90 per cent phenol extraction followed by precipitation with ethanol or by aqueous extraction followed by precipitation with sodium sulfate were not distinguishable by a number of different tests including serological activity, elementary analysis, optical rotation, or viscosity. However, we
I I I I I I
I I I I I I
I
20
230 290 250 290 w.
FIG. 2. Extinction curves of fractions isolated from hog gastric mucin by fractiona- tion with ethanol. Curve 1, Fraction R4-F4; Curve 2, Fraction R4-F2; Curve 3, Fraction R4-F3; Curve 4, Fraction R5-F2; Curve 5, Fraction R5-F3.
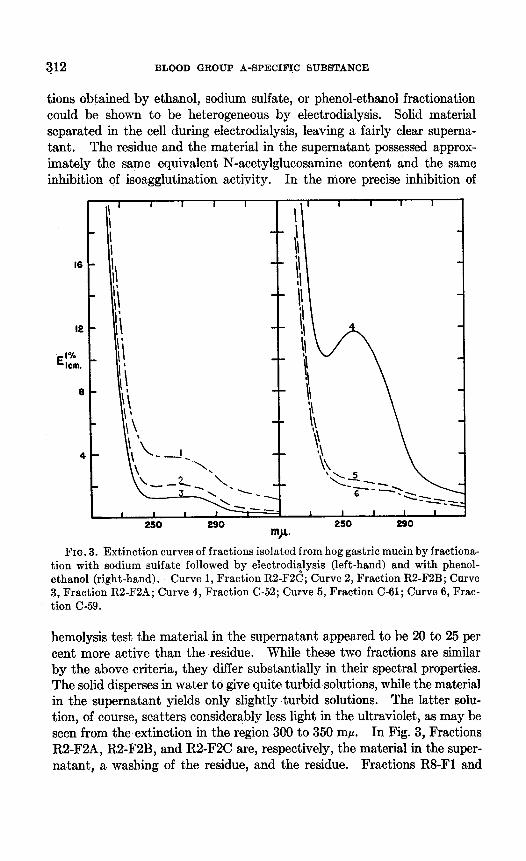
have found that the ext,inction curves of fractions of group A substance pre- pared according to these procedures differ markedly and that the product from the phenol-ethanol procedure contains considerably greater amounts of the “260 rnti component” (Fraction C-52, Fig. 3) than the group A sub- stance isolated either by ethanol or sodium sulfate fractionation (Fraction R2-F2A, Fig. 3).4 It was reported earlier (5) that group A substance frac-
4 The product isolated by the sodium sulfate procedure of Morgan and King (3) would be represented by an extinction curve roughly intermediate between Fractions R2-F2A and R2-F2C (Fig. 3), since the Morgan and King product was fractionated further:as discussed above.
312 BLOOD GROUP A-SPECIFIC SUBSTANCE
tions obtained by ethanol, sodium sulfate, or phenol-ethanol fractionation could be shown to be heterogeneous by electrodialysis. Solid material separated in the cell during electrodialysis, leaving a fairly clear superna- tant. The residue and the material in the supernatant possessed approx- imately the same equivalent N-acetylglucosamine content and the same inhibition of isoagglutination activity. In the niore precise inhibition of
16
6
I ’ I I I I
I I I
-
250 290
FIG. 3. Extinction curves of fractions isolated from hog gastric mucin by fractiona- tion with sodium sulfate followed by electrodi$ysis (left-hand) and with phenol- ethanol (right-hand). Curve 1, Fraction R2-F2C; Curve 2, Fraction lU-F2B; Curve 3, Fraction R2-F2A; Curve 4, Fraction C-52; Curve 5, Fraction C-61; Curve 6, Frac- tion C-59.
hemolysis test the material in the supernatant appeared to be 20 to 25 per cent more active than the residue. While these two fractions are similar by the above criteria, they ‘differ substantially in their spectral properties. The solid disperses in water to give quite turbid solutions, while the material in the supernatant yields only slightly turbid solutions. The latter solu- tion, of course, scatters considerably less light in the ultraviolet, as may be seen from the extinction in the region 300 to 350 rnp. In Fig. 3, Fractions R2-F2A, R2-F2B, and R2-F2C are, respectively, the material in the super- natant, a washing of the residue, and the residue. Fractions R.&F1 and
G. HOLZMAN AND C. NIEMANN 313
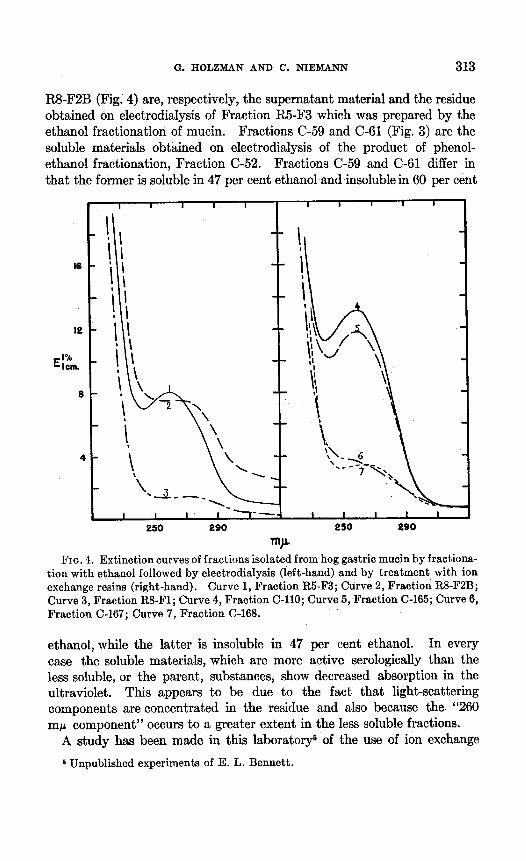
RSF2B (Fig. 4) are, respectively, the supernatant material and the residue obtained on electrodialysis of Fraction IS-F3 which was prepared by the ethanol fractionation of mucin. Fractions C-59 and C-61 (Fig. 3) are the soluble materials obtained on electrodialysis of the product of phenol- ethanol fractionation, Fraction C-52. Fractions C-59 and C-61 differ in that the former is soluble in 47 per cent ethanol and insoluble in 60 per cent
16
I2
6
4
I I I I I I I I I I
FIG. 4. Extinction curves of fractions isolated from hog gastric mucin by fractiona- tion with ethanol followed by electrodialysis (left-hand) and by treatment with ion exchange resins (right-hand). Curve 1, Fraction R5-F3; Curve 2, Fraction R8-F2B; Curve 3, Fraction R3-Fl; Curve 4, Fraction C-110; Curve 5, Fraction C-165; Curve 6, Fraction C-167; Curve 7, Fraction C-168.
ethanol, while the latter is insoluble in 47 per cent ethanol. In every case the soluble materials, which are more active serologically than the less soluble, or the parent, substances, show decreased absorption in the ultraviolet. This appears to be due to the fact that light-scattering components are concentrated in the residue and also because the “260 rnp component” occurs to a greater extent in the less soluble fractions.
A study has been made in this laboratory5 of the use of ion exchange
5 Unpublished experiments of E. L. Bennett.
314 BLOOD GROUP A-SPECIFIC SUBSTANCE
resins for the preparation of group A substance from hog gastric mucin. Preparations comparable in activity to those isolated by other procedures were obtained in this way. Fraction C-168 (Fig. 4) which exhibits weak absorption in the ultraviolet was obtained by treating a 60 per cent ethanol precipitate from mucin twice with base-treat,ed De-Acidite.6 The 40 per cent ethanol precipitate, which contains considerable quantities of the “260 rnp component” (Fraction C-110), can be transformed to a fraction showing weak absorption at 260 rnp by treatment with base-treated De- Acidite (Fraction C-167, Fig. 4). Treatment of Fraction C-110 with base- treated Amberlite IR-4 resin: a resin of similar type, is ineffective, however, in removing the “260 rnp component” (Fraction C-165, Fig. 4).
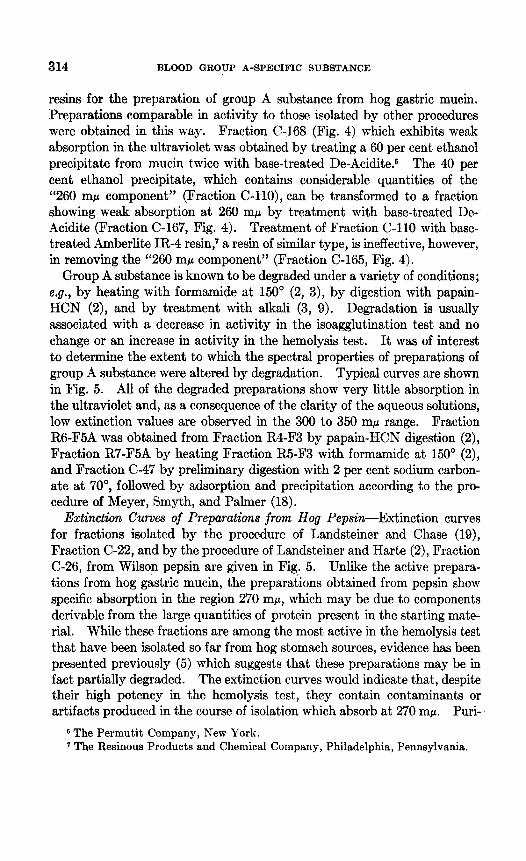
Group A substance is known to be degraded under a variety of conditions; e.g., by heating with formamide at 150” (2, 3), by digestion with papain- HCN (2), and by treatment with alkali (3, 9). Degradation is usually associated with a decrease in activity in the isoagglutination test and no change or an increase in activity in the hemolysis test. It was of interest to determine the extent to which the spectral properties of preparations of group A substance were altered by degradation. Typical curves are shown in Fig. 5. All of the degraded preparations show very little absorption in the ultraviolet and, as a consequence of the clarity of the aqueous solutions, low extinction values are observed in the 300 to 350 rnp range. Fraction R6-F5A was obtained from Fraction R4-F3 by papain-HCN digestion (2), Fraction R7-F5A by heating Fraction R5-F3 with formamide at 150” (2), and Fraction C-47 by preliminary digestion with 2 per cent sodium carbon- ate at 70”, followed by adsorption and precipitation according to the pro- cedure of Meyer, Smyth, and Palmer (18).
Extinction Curves of Preparations from Hog Pepsin--Extinction curves for fractions isolated by the procedure of Landsteiner and Chase (19), Fraction C-22, and by the procedure of Landsteiner and Harte (2), Fraction C-26, from Wilson pepsin are given in Fig. 5. Unlike the active prepara- tions from hog gastric mucin, the preparations obtained from pepsin show specific absorption in the region 270 mp, which may be due to components derivable from the large quantities of protein present in the starting mate- rial. While these fractions are among the most active in the hemolysis test that have been isolated so far from hog stomach sources, evidence has been presented previously (5) which suggests that these preparations may be in fact partially degraded. The extinction curves would indicate that, despite their high potency in the hemolysis test, they contain contaminants or artifacts produced in the course of isolation which absorb at 270 rnp. Puri-
e The Permutit Company, New York. 7 The Resinous Products and Chemical Company, Philadelphia, Pennsylvania.
G. HOLZMAN AND C. NIEMANN 315
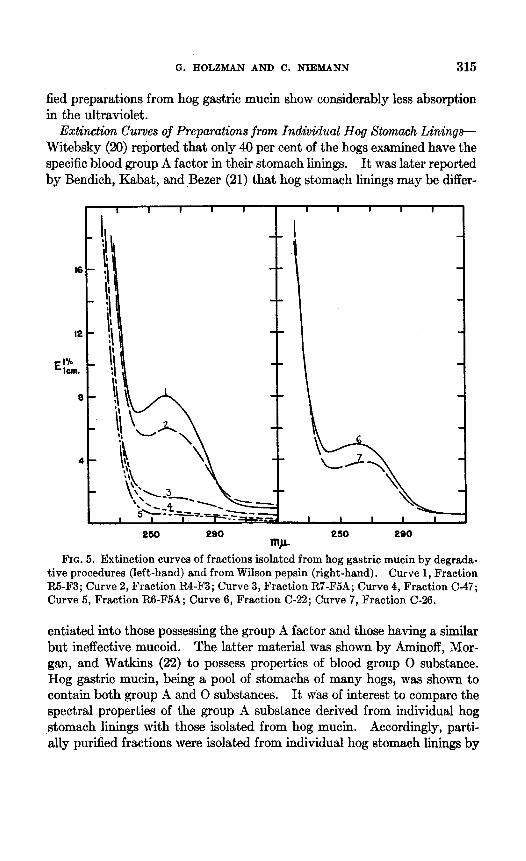
fied preparations from hog gastric mucin show considerably less absorption in the ultraviolet.
Extinction Curves of Preparations from Individual Hog Stomach Linings- Witebsky (20) reported that only 40 per cent of the hogs examined have the specific blood group A factor in their stomach linings. It was later reported by Bendich, Kabat, and Bezer (21) that hog stomach linings may be differ-
16
12
El” km.
a
4 I-
FIG. 5. Extinction curves of fractions isolated from hog gastric mucin by degrada- tive procedures (left-hand) and from Wilson pepsin (right-hand). Curve 1, Fraction R5-F3; Curve 2, Fraction R4-F3; Curve 3, Fraction R7-F5A; Curve 4, Fraction C-47; Curve 5, Fraction R6-F5A; Curve 6, Fraction C-22; Curve 7, Fraction C-26.
entiated into those possessing the group A factor and those having a similar but ineffective mucoid. The latter material was shown by Aminoff, Mor- gan, and Watkins (22) to possess properties of blood group 0 substance. Hog gastric mucin, being a pool of stomachs of many hogs, was shown to contain both group A and 0 substances. It was of interest to compare the spectral properties of the group A substance derived from individual hog stomach linings with those isolated from hog mucin. Accordingly, parti- ally purified fractions were isolated from individual hog stomach linings by
316 BLOOD GROUP A-SPECIFIC SUBSTANCE
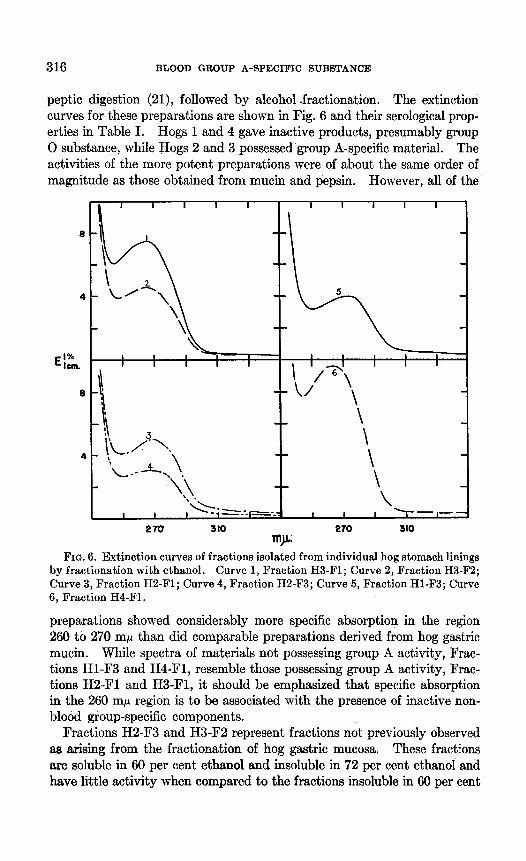
peptic digestion (21), followed by alcohol -fractionation. The extinction curves for these preparations are shown in Fig. 6 and their serological prop- erties in Table I. Hogs 1 and 4 gave inactive products, presumably group 0 substance, while Hogs 2 and 3 possessed group A-specific material. The activities of the more potent preparations were of about the same order of magnitude as those obtained from mucin and pepsin. However, all of the
270 310
I I I I I
\
\
\ I I It I --
270 310
FIG. 6. Extinction curves of fractions isolated from individual hog stomach linings by fractionation with ethanol. Curve 1, Fraction H3-Fl; Curve 2, Fraction H3-F2; Curve 3, Fraction H2-Fl; Curve 4, Fraction H2-F3; Curve 5, Fraction Hl-F3; Curve 6, Fraction H4-Fl.
preparations showed considerably more specific absorption in the region 260 to 270 rnp than did comparable preparations derived from hog gastric mucin. While spectra of materials not possessing group A activity, Frac- tions Hl-F3 and H4-Fl, resemble those possessing group A activity, Frac- tions H2-Fl and H3-F!, it should be emphasized that specific absorption in the 260 rnp region is to be associated with the presence of inactive non- blood group-specific components.
Fractions H2-F3 and H3-F2 represent fractions not previously observed az arising from the fractionation of hog gastric mucosa. These fractions are soluble in 60 per cent ethanol and insoluble in 72 per cent &hoi and have little activity when compared to the fractions insoluble in 60 per cent
G. HOLZMAN AND C. NIEMANN 317
ethanol (Fractions H2-Fl and H3-Fl). However, the relative potencies of Fractions H2-F3 and H3-F2 when compared with hog gastric mucin are about 10 to 20 times greater in the hemolysis test than in the isoagglutina- tion test, a behavior similar to that observed for degraded preparations from mucin (2,3,5). Undegraded preparations from mucin have approximately equivalent relative activities in these tests. The degraded character of group A substance isolated from pepsin has been previously recognized (5), but the possibility of degradation of group A substance in the peptic diges- tion of hog stomach linings has not been appreciated.
Maximum Tyrosine and Tryptophan Content of Preparations of Group A Substance-The tyrosine or tryptophan content of group A substance prep- arations can be calculated by ascribing the net absorption at 280 rnp en- tirely to either tyrosine or tryptophan.8eg It is necessary to apply a correc- tion for non-specific absorption (24, 25), and if this correction is applied throughout the ultraviolet region, then the more potent preparations which show low plateaus in the region 260 to 280 rnp possess extinction curves which have small maxima between 270 to 280 rnp. The maximum trypto- phan and tyrosine contents of both Fractions R6-F5A and C-47, which are among the most transparent in the ultraviolet, were calculated in this way to be 0.1 and 0.4 per cent, respectively. Undegraded preparations with less transparency would have correspondingly higher values, i.e., 0.2 to 0.3 per cent tryptophan and 0.8 to 1.2 per cent tyrosine. These maximum esti- mates would of course be lower if both amino acids were present. While these preparations are probably not pure, it seems certain that tyrosine and tryptophan, if indeed present in group A substance, are among the least abundant amino acids. The above results are consistent with the observa- tion that qualitative tests for the aromatic amino acids in group A substance are generally weak or negative (2) and with the sole quantitative result of Brand and Saidel (27) to the effect that a preparation of group A substance obtained from hog gastric mucin by the phenol procedure contained 0.3 per cent tyrosine and 0.2 per cent tryptophan.
SUMMARY
A study of the ultraviolet absorption spectra of preparations of blood group A-specific substance isolated from hog gastric mucin supports the
8 E:?&,. for tyrosine and tryptophan at 280 rnp are 69 and 278, respectively, in phosphate-citrate buffer at pH 7.2. Phenylalanine shows weak absorption at 255 rnp, and histidine shows specific absorption only below 240 mp. Sugars would be expected to absorb only below 230 rnp (13, 23).
9 Since group A substance preparations absorb weakly in the ultraviolet and be- cause tyrosine and tryptophan possess similar absorption spectra under the test con- ditions, it is difficult to determine tyrosine and tryptophan simultaneously as has been done previously (24-26). The procedure of measuring absorption in alkaline solution which allows considerable differentiation in the tyrosine and tryptophan spectra is inapplicable due to the lability of group A substance under these conditions.
318 BLOOD GROUP A-SPECIFIC SUBSTANCE
view that group A substance, and probably group 0 substance, has little specifk absorption in this spectral region and that other components account for most if not all of the specific absorption noted in the case of impure preparations. However, ultraviolet spectrophotometric analyses have been found to be particularly useful in following changes in composi- tion brought about by the fractionation of group A substance preparations obtained from hog gastric mucin as well as in comparing preparations iso- lated by different methods and from different sources. Such analyses have also indicated that tyrosine and tryptophan, if indeed present in group A substance, are but minor constituents.
BIBLIOGRAPHY
1. For recent reviews, see Meyer, K., in Anson, M. L., and Ed&l, J. T., Advances in protein chemistry, New York, 2, (1945); Morgan, W. T. J., Ann. Rep. Chem.
Sot., 42, 231 (1945); Stacey, M., Quart. Rev., 1, 236 (1947). 2. Landsteiner, K., and Harte, R. A., J. Exp. Med., 71, 551 (1940). 3. Morgan, W. T. J., and King, H. K., Biochem. J., 37, 640 (1943). 4. Holsman, G., Bennett, E., Brown, D., and Niemann, C., Arch. Biochem., 11, 415
(1946). 5. Brown, D. H., Bennett, E. L., Holzman, G., and Niemann, C., Arch. Biochem., 13,
421 (1947). 6. Freudenberg, K., Naturwissenschaften, 24, 522 (1936). 7. Gr6h, J., Sadyes, L., and Weltner, M., Biochem. Z., 290, 24 (1937). 8. Weltner, M., Biochem. Z., 297, 142 (1938). 9. Kabat, E. A., Bendich, A., and Beser, A., J. Exp. Med., 33, 477 (1946).
10. Heller, W., and Vassy, E., Phys. Rev., 63, 65 (1943). 11. Keller, W., and Vassy, E., J. Chem. Phys., 14, 565 (1946). 12. Green&in, J. P., in Anson, M. L., and Edsall, J. T., Advances in protein chemis-
try, New York, 1, 209 (1944). 13. Loofbourrow, J. R., Rev. Modern Phys., 12, 267 (1940). 14. Bray, H. G., Henry, H., and Stacey, M., Biochem. J., 40, 125 (1946). 15. Dische, Z., Proc. Sot. Exp. Biol. and Med., 66, 217 (1944).
16. Morrow, C. A., and Sandstrom, W. M., Biochemical laboratory methods, New York, 152 (1935).
17. McRary, W. L., and Slattery, M. C., Arch. Biochem., 6, 151 (1945). 18. Meyer, K., Smyth, E. M., and Palmer, J. W., J. Biol. Chem., 119, 73 (1937). 19. Landsteiner, K., and Chase, N. W., J. Exp. Med., 63, 813 (1936). 20. Witebsky, E., New York Academy of Sciences, Conference on blood groups, New
York, May 18-19 (1945). 21: Bendich, -4., Kabat, E. A., and Bezer, A., J. h’xp. Med., 83, 485 (1946). 22. Aminoff, D., Morgan, W. T. J., and Watkins, W. M., Nature, 158, 879 (1946). 23. Gabryelski, W., and Marchlewski, IL, Biochem Z., 260, 385 (1932). 24. Goodwin, T. W., and Morton, R. A., B&hem. J., 40, 628 (1946). 25. Holiday, E. R., Biochem. J., 30, 1795 (1936). 26. Holiday, E. R., and Ogsten, A. G., Biochem. J., 32, 1106 (1938). 27. Brand, E., and Saidel, L. J., J. Exp. Med., 33, 497 (1946).