Embed Size (px)
Citation preview
THE SPECTROPHOTOMETRIC DETERMINATION OF CERTAIN BLOOD PIGMENTS
BY G. B. RAY, H. A. BLAIR, AND c. I. THOMAS
(From the Department of Physiology, School of Medicine, Western Reserve University, Cleveland)
(Received for publication, June 10, 1932)
The use of the spectrophotometer as a means of estimating the relative and total concentrations of blood pigments was first intro- duced by Hiifner (1, 2), following the theoretical work of Vierordt (3). This author published tables whereby the relative concen- trations of oxyhemoglobin, hemoglobin, carboxyhemoglobin, and methemoglobin could be estimated from the quantitative char- acter of the absorption curve. Since Hiifner’s original papers, several investigators in this field have made redeterminations of his constants for pigments in pure solution but no revision of his tables has been carried out. It is of the greatest convenience to have these tables available for they offer an accurate and rapid means of estimating the relative concentration of any two pig- ments. The data given in this paper represent an adaptation of Htifner’s method to more recently determined constants and a simplification of the technique of computation. By means of simple formulae or previously prepared charts it is possible to estimate the concentration of total pigment, oxyhemoglobin, and a second pigment on as small a sample of blood as 0.05 cc. in a very short time with a high degree of precision. This method is also applicable to any sort of colored solution; for example, indicators. One may thus apply the same theory to the data given by Brode (4) and thereby estimate the hydrogen ion concentration of a sold- tion (5).
The accuracy of an oxyhemoglobin determination by this means is, according to Davis and Sheard (6), comparable to that of the gasometric method with the constant volume Van Slyke apparatus in the case of normal bloods or pigment concentrations. In the case
63
by guest on February 24, 2020http://w
ww
.jbc.org/D
ownloaded from
64 Spectrophotometry of Blood Pigments
of very dilut’e solutions, the accuracy of the spectrophotometer is unchanged, while the error of the gasometric method is increased. A second advantage, perhaps the most important, of the spectro- photometric method is the rapidity and ease with which one may make determinations. A determination of hemoglobin concen- tration can be made with check analyses in the time needed for a single gasometric reading.
Furthermore, it is possible to check the purity of the pigment at the time of the determination. While the gasometric determina- tion gives only the functional hemoglobin, one may, by means of the spectrophotometer, recognize at once the presence of a con- taminating substance. Thus, in solutions of purified hemoglobin, where methemoglobin formation may occur spont’aneously, any deviation from the normal relationships may be detected at once and the extent of inactivation calculated.
Theoretical
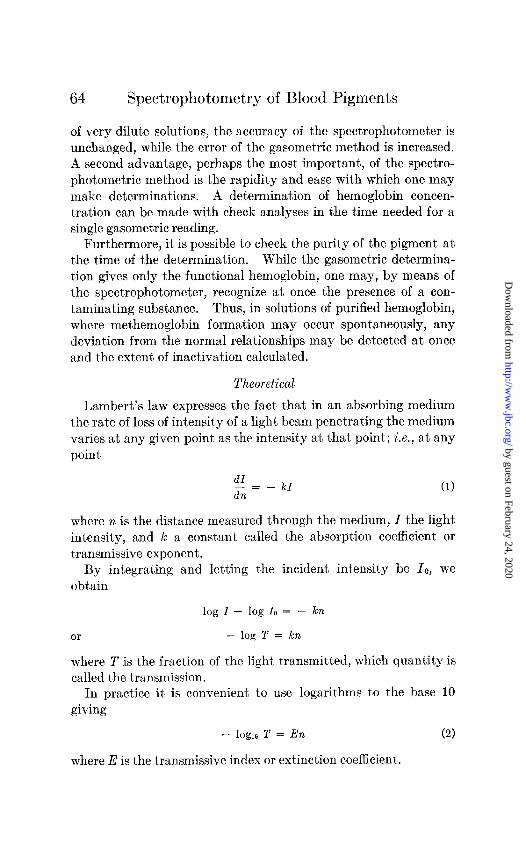
Lambert’s law expresses the fact that in an absorbing medium the rate of loss of intensity of a light beam penetrat’ing the medium varies at any given point as the intensity at that point; i.e., at any point
dI dn =
- kl (1)
where n is the distance measured through the medium, I the light intensity, and k a constant called the absorption coefficient or transmissive exponent.
By integrating and letting the incident intensity be IO, we obtain
log I - log lo = - kn
05 - log T = kn
where T is the fraction of the light transmitted, which quantity is called the transmission.
In practice it is convenient to use logarithms to the base 10 giving
- log,0 T = En (2)
where E is the transmissive index or extinction coefficient.
by guest on February 24, 2020http://w
ww
.jbc.org/D
ownloaded from
Ray, Blair, and Thomas 65
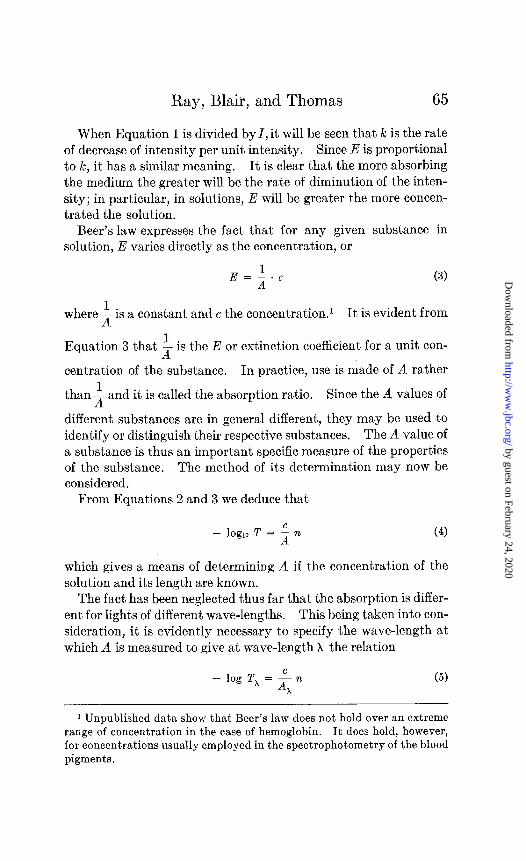
When Equation 1 is divided by I, it will be seen that k is the rate of decrease of intensity per unit intensity. Since E is proportional to Ic, it has a similar meaning. It is clear that the more absorbing the medium the greater will be the rate of diminution of the inten- sity; in particular, in solutions, E will be greater the more concen- trated the solution.
Beer’s law expresses the fact that for any given substance in solution, E varies directly as the concentration, or
E+ (3)
where I is a constant. and c the concentration.” A It is evident from
Equation 3 that i is the E or extinction coefficient for a unit con-
centration of the substance. In practice, use is made of A rather
than i and it is called the absorption ratio. Since the 4 values of
different substances are in general different, they may be used to identify or distinguish their respective substances. The A value of a substance is thus an important specific measure of the properties of the substance. The method of its determination may now be considered.
From Equat.ions 2 and 3 we deduce that
- loglo T = i n (4)
which gives a means of determining A if the concentration of the solution and its length are known.
The fact has been neglected thus far that the absorption is differ- ent for lights of different wave-lengths. This being taken into con- sideration, it is evidently necessary to specify the wave-length at which A is measured to give at wave-length X the relation
1 Unpublished data show that Beer’s law does not hold over an extreme range of concentration in the case of hemoglobin. It does hold, however, for concentrations usually employed in the spectrophotometry of the blood pigments.
by guest on February 24, 2020http://w
ww
.jbc.org/D
ownloaded from
66 Spectrophotometry of Blood Pigments
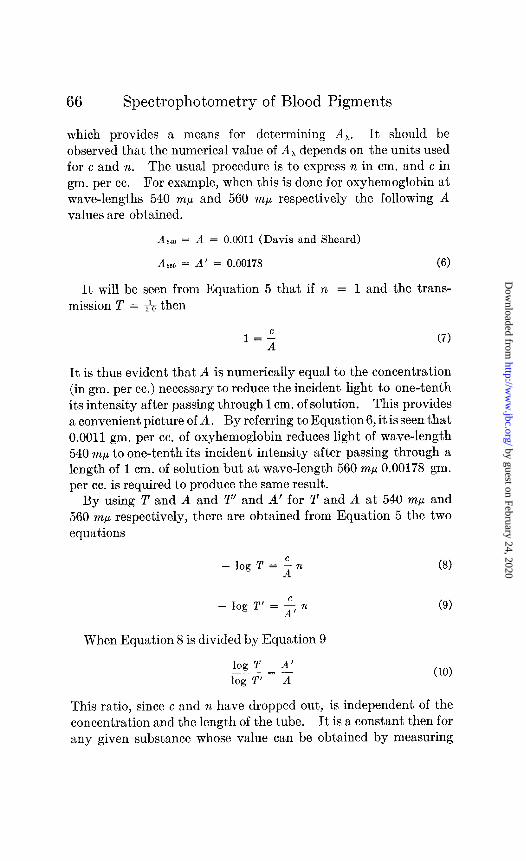
which provides a means for determining AX. It should be observed that the numerical value of A, depends on the units used for c and n. The usual procedure is to express n in cm. and c in gm. per cc. For example, when this is done for oxyhemoglobin at wave-lengths 540 rnp and 560 rnp respectively the following A values are obtained.
A 540 = A = 0.0011 (Davis and Sheard)
A 560 = A’ = 0.00178 (6)
It will be seen from Equation 5 that if n = 1 and the trans- mission T = +” then
1=2 (7)
It is thus evident that A is numerically equal to the concentration (in gm. per cc.) necessary to reduce the incident light to one-tenth its intensity after passing through 1 cm. of solution. This provides a convenient picture of A. By referring to Equation 6, it is seen that 0.0011 gm. per cc. of oxyhemoglobin reduces light of wave-length 540 mp to one-tenth its incident intensity after passing through a length of 1 cm. of solution but at wave-length 560 mp 0.00178 gm. per cc. is required to produce the same result.
By using T and A and T’ and A’ for T and A at 540 rnp and 560 mp respectively, there are obtained from Equation 5 the two equations
- log T = $72 (8)
c - log T’ = - n
A’ (9)
When Equation 8 is divided by Equation 9
log T A’ __=- log T’ A (10)
This ratio, since c and n have dropped out, is independent of the concentration and the length of the tube. It is a constant then for any given substance whose value can be obtained by measuring
by guest on February 24, 2020http://w
ww
.jbc.org/D
ownloaded from
Ray, Blair, and Thomas 67
only T and T’. It will be hereafter designated by R. It is usually called Hiifner’s ratio.
From Equations 3 and 10 is derived the equation
(11)
Therefore, these ratios are interchangeable. For example, their numerical value for oxyhemoglobin is, according to Equation 6,
R= 0.00178 - = 1 619 0.0011 ’
(12)
R, since it involves two A values, is evidently a much more specific identification for a particular substance than is a single A value.
The considerations thus far give a means of identifying a sub- stance in solution (Equation 10) when its concentration is not known or of estimating its concentration (Equation 8 or 9) when its identity is known. But no means have been provided for esti- mating the components of a mixture. This may be done easily for a mixture of two substances in the following way.
Since each of the substances will absorb just as if it were alone in solution, Lambert’s law may in this case be written
dl -= dn
- kI - kJ
where the k values are the transmissive exponents of the first and second substances respectively.
By integrating as before, we obtain
- log ; = (k + kJ 12
OP - log10 T = (E + EJ n 03)
where E and El are again the respective extinction coefficients of the first and second substances.
It is convenient at this point to introduce the idea,
Emix, = ’ + E, (14)
by guest on February 24, 2020http://w
ww
.jbc.org/D
ownloaded from
68 Spectrophotometry of Blood Pigments
in which Emi*. is the extinction coefficient of the mixture, or by use of Equation 3 to obtain
‘mix.
*mix. =:+2 (15)
1
or 1 C -=~
Amix. ‘mkA
+CI
Cmix.A’
or if the fraction 2 of the first substance be represented by x
and the fraction c$ of the second by y then
01 AAl
*mix. = xAl + yA
Thus, if A and A1 are known, Ami,, can be calculated for any mix- ture containing IZ: parts of t,he first (A) substance and y parts of the second (Al) substance.
From Equations 13,14, and 15 is derived the equation
‘mkn - log,, T = Emix,n = A
In,*. (17)
which provides a means of obtaining the total concentration of a mixture when Ami,. has been found.
Since x and y must be known to determine Ami,. it is now necessary t.o consider how these may be obtained. This may be done by measuring the light transmitted by the mixture at two different wave-lengths; for, by use of Equations 15 and 17 are obtained the equations
‘mix.lz - log T’ = A’ =
InIX. ( > ;f$ n
1 (19)
by guest on February 24, 2020http://w
ww
.jbc.org/D
ownloaded from
Ray, Blair, and Thomas 69
in which the letters that do not have the prime apply to the first wave-length (540mp) and the primed letters apply to the second wave-length (560~~~). When Equation 18 is divided by Equation 19 and R is considered the ratio of the logarithms, the resulting equation is
R = log T _ A,c + ACT A’A’I log T’ AA, ’ A’pz + Acl
(20)
This equation shows that R is independent of the absolute concen- tration, for, if the c values on the right-hand side are all multiplied by the same factor, R remains unchanged.
By dividing the numerator and the denominator by the total concentration, f&ix. = c + cl, and by assuming that
C ,
-=zand~=y=l-z ‘miu. cmix.
we obtain the equation
n = -4,~ + A(1 - zz) A’A’, AA, ’ A’12 + A’(1 - 2)
Cm
which provides a means of determining x and then also y when R has been measured. x and y having been determined in this way, A,:,. can be obtained from Equation 16 and then the total con- centration of pigment in the mixture can be obtained by use of Equation 17. It should be observed in doing this, that the same wave-length must be used for Equation 17 as that for which A,;,. is calculated in Equation 16; i.e., the wave-length to which A and Al apply.
It will be remembered (Equation 3) that $ is a more natural
unit than A itself, but the argument has been carried through with A values because they are commonly used. Greater simplicity
1 is attained in Equation 21, however, by using units of x which may
be written r, so that
1 1 T = -, TI = A,, etc. A
by guest on February 24, 2020http://w
ww
.jbc.org/D
ownloaded from
Spectrophotometry of Blood Pigments
Equations 18 to 21 written as Equations 18, a to 21, a when 1 - is replaced by r, become A
- log 1’ = (CT + ca,)n (18,a)
- log T’ = (CT’ + cdhz (19,a)
R= CT + Cl?-1
CT + Cl?-‘, (20,a)
R= XT + (1 - 2) 7.1
XT’ + (1 - z) r’1 (21,a)
From these is obtained Equation 22
Rr’l + r1
’ = R(r’ - r’J + (rt - T) (22)
which is easier to use than Equation 21. If x is the required per cent, Equation 22 may be multiplied by 100, in which case g = 100 - 2 instead of 1 - Z.
EXPERIMENTAL
The theoretical manipulation of Lambert’s law in the preceding section shows clearly that if the various derivations are to be of practical use it is necessary to establish certain constants and to introduce calculations involving these constants. The data in this paper, except where otherwise noted, were obtained with the Keuffel and Esser color analyzer (7). For a general discussion of spectro- photometry and spectrophotometers the reader is referred to the “Report of the Committee on Spectrophotometry of the Optical Society of America, 1922-23” (8).
In the data that follow, only fresh bloods were used unless other- wise noted and 0.4 per cent ammonium hydroxide was used as a diluent. All readings of transmission were made in groups of five and the averages taken. As mentioned above, only two wave- lengths need be read to utilize the formuhe; throughout this paper 540mp and 560mp have been used. In some cases a second observer made a second series of readings on a similar sample. All glassware employed was calibrated.
As may be gathered from the derivation of the formulae, the
by guest on February 24, 2020http://w
ww
.jbc.org/D
ownloaded from
Ray, Blair, and Thomas 71
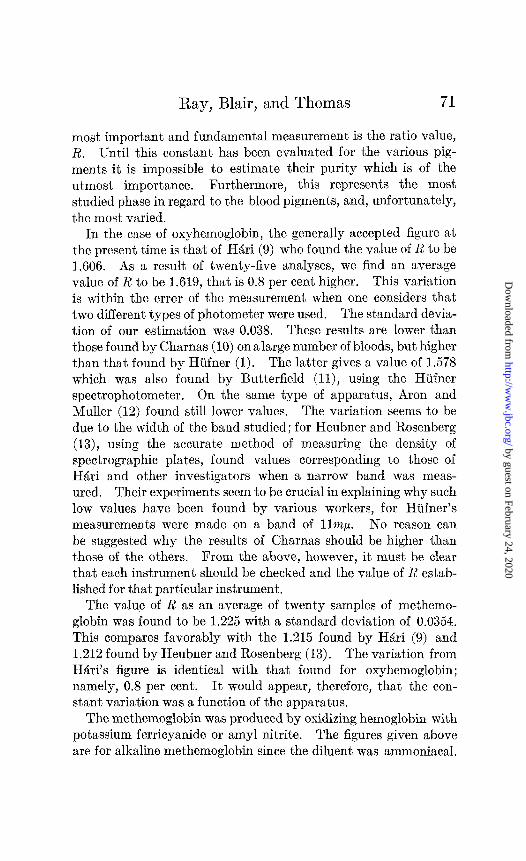
most important and fundamental measurement is the ratio value, R. Until this constant has been evaluated for the various pig- ments it is impossible to estimate their purity which is of the utmost importance. Furthermore, this represents the most studied phase in regard to the blood pigments, and, unfortunately, the most varied.
In the case of oxyhemoglobin, the generally accepted figure at the present time is that of H&i (9) who found the value of R to be 1.606. As a result of twenty-five analyses, we find an average value of R to be 1.619, that is 0.8 per cent higher. This variation is within the error of the measurement when one considers that two different types of photometer were used. The standard devia- tion of our estimation was 0.038. These results are lower than those found by Charnas (10) onalarge number of bloods, but higher than that found by Hiifner (1). The latter gives a value of 1.578 which was also found by Butterfield (ll), using the Hi.ifner spectrophotometer. On the same type of apparatus, Aron and Muller (12) found still lower values. The variation seems to be due to the width of the band studied; for Heubner and Rosenberg (13), using the accurate method of measuring the density of spectrographic plates, found values corresponding to those of H&i and other investigators when a narrow band was meas- ured. Their experiments seem to be crucial in explaining why such low values have been found by various workers, for Hufner’s measurements were made on a band of llm~. No reason can be suggested why the results of Charnas should be higher than those of the others. From the above, however, it must be clear that each instrument should be checked and the value of R estab- lished for that particular instrument.
The value of R as an average of twenty samples of methemo- globin was found to be 1.225 with a standard deviation of 0.0354. This compares favorably with the 1.215 found by H&i (9) and 1.212 found by Heubner and Rosenberg (13). The variation from H&i’s figure is identical with that found for oxyhemoglobin; namely, 0.8 per cent. It would appear, therefore, that the con- stant variation was a function of the apparatus.
The methemoglobin was produced by oxidizing hemoglobin with potassium ferricyanide or amyl nitrite. The figures given above are for alkaline methemoglobin since the diluent was ammoniacal,
by guest on February 24, 2020http://w
ww
.jbc.org/D
ownloaded from
72 Spectrophotometry of Blood Pigments
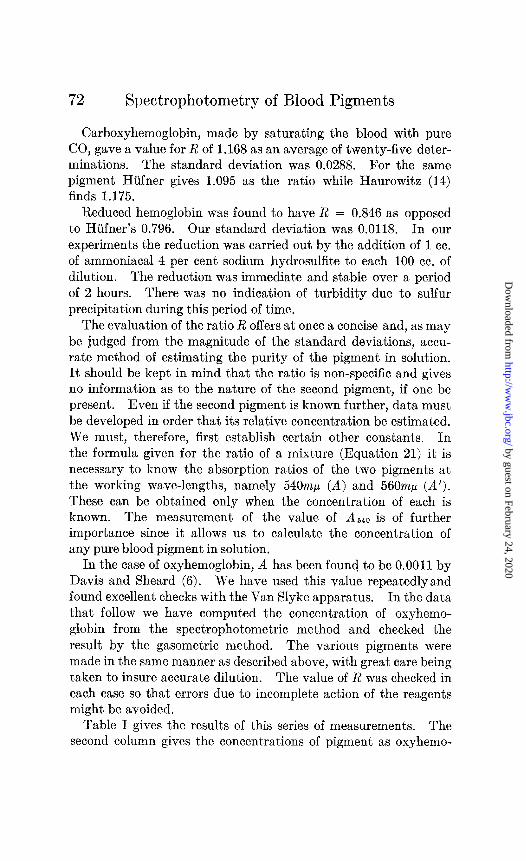
Carboxyhemoglobin, made by saturating the blood with pure CO, gave a value for R of 1.168 as an average of twenty-five deter- minations. The standard deviation was 0.0288. For the same pigment Htifner gives 1.095 as the ratio while Haurowitz (14) finds 1.175.
Reduced hemoglobin was found to have R = 0.846 as opposed to Hiifner’s 0.796. Our standard deviation was 0.0118. In our experiments the reduction was carried out by the addition of 1 cc. of ammoniacal 4 per cent sodium hydrosulfite to each 100 cc. of dilution. The reduction was immediate and stable over a period of 2 hours. There was no indication of turbidity due to sulfur precipitation during this period of time.
The evaluation of the ratio R offers at once a concise and, as may be judged from the magnitude of the standard deviations, accu- rate method of estimating the purity of the pigment in solution. It should be kept in mind that the ratio is non-specific and gives no information as to the nature of the second pigment, if one be present. Even if the second pigment is known further, data must be developed in order that its relative concentration be estimated. We must, therefore, first establish certain other constants. In the formula given for the ratio of a mixture (Equation 21) it is necessary to know the absorption ratios of the two pigments at the working wave-lengths, namely 540~~~ (A) and 560mp (A’). These can be obtained only when the concentration of each is known. The measurement of the value of AS40 is of further importance since it allows us to calculate the concentration of any pure blood pigment in solution.
In the case of oxyhemoglobin, A has been found to be 0.0011 by Davis and Sheard (6). We have used this value repeatedly and found excellent checks with the Van Slyke apparatus. In the data that follow we have computed the concentration of oxyhemo- globin from the spectrophotometric method and checked the result by the gasometric method. The various pigments were made in the same manner as described above, with great care being taken to insure accurate dilution. The value of R was checked in each case so that errors due to incomplete action of the reagents might be avoided,
Table I gives the results of this series of measurements. The second column gives the concentrations of pigment as oxyhemo-
by guest on February 24, 2020http://w
ww
.jbc.org/D
ownloaded from
Ray, Blair, and Thomas 73
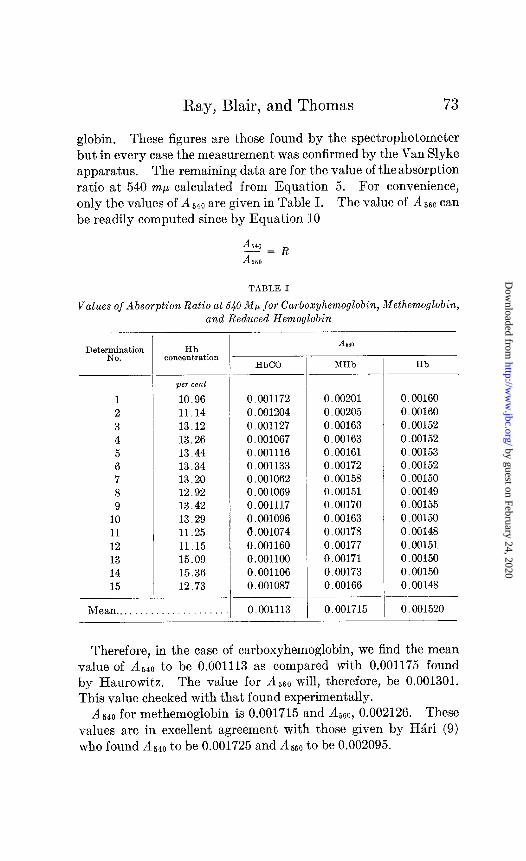
globin. These figures are those found by the spectrophotometer but in every case the measurement was confirmed by the Van Slyke apparatus. The remaining data are for the value of theabsorption ratio at 540 mp calculated from Equation 5. For convenience, only the values of A 540 are given in Table I. The value of A 560 can be readily computed since by Equation 10
TABLE I
Values of Absorption Ratio at 540 Mp for Carboxyhemoglobin, Methemoglobin, and Reduced Hemoglobin
1 2 3 4 5 6 7 8 9
10 11 12 13 14 15
Hb ooncentration
per cent 10.96 11.14 13.12 13.26 13.44 13.34 13.20 12.92 13.42 13.29 11.25 11.15 15.09 15.36 12.73
Mean.. 0.001113 0.001715 0.001520
HbCO MHb Hb
0.001172 0.00201 0.00160 0.001204 0.00205 0.00160 0.001127 0.00163 0.00152 0.001067 0.00163 0.00152 0.001116 0.00161 0.00153 0.001133 0.00172 0.00152 0.001062 0.00158 0.00150 0.001069 0.00151 0.00149 0.001117 0.00170 0.00155 0.001096 0.00163 0.00150 0.001074 0.00178 0.00148 0.001160 0.00177 0.00151 0.001100 0.00171 0.00150 0.001106 0.00173 0.00150 0.001087 0.00166 0.00148
iho
Therefore, in the case of carboxyhemoglobin, we find the mean value of AS40 to be 0.001113 as compared with 0.001175 found by Haurowitz. The value for AGO will, therefore, be 0.001301. This value checked with that found experimentally.
As40 for methemoglobin is 0.001715 and Am, 0.002126. These values are in excellent agreement with those given by H&i (9) who found AbhO to be 0.001725 and Am to be 0.002095.
by guest on February 24, 2020http://w
ww
.jbc.org/D
ownloaded from
74 Spectrophotometry of Blood Pigments
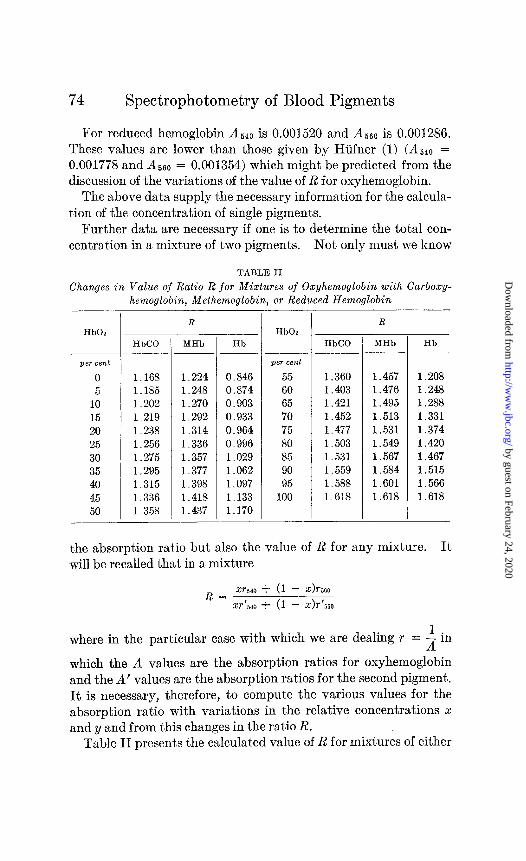
For reduced hemoglobin A640 is 0.001520 and A5ea is 0.001286. These values are lower than those given by Hiifner (1) (A540 = 0.001778 and A560 = 0.001354) which might be predicted from the discussion of the variations of the value of R for oxyhemoglobin.
The above data supply t’he necessary information for the calcula- tion of the concentration of single pigments.
Further data are necessary if one is to det.ermine the total con- centration in a mixture of two pigments. Not only must we know
TABLE II
Changes in Value of Ratio R for Mixtures of Oxyhemoglobin with Carboxy- hemoglobin, Methemoglobin, or Reduced Hemoglobin
HbOz HbCO
per cent
0 1.168 5 1.185
10 1.202 15 1.219 20 1.238 25 1.256 30 1.275 35 1.295 40 1.315 45 1.336 50 1.358
R T R HbOz
MHb Hb HbCO MHb Hb
1.224 0.846 1.248 0.874 1.270 0.903 1.292 0.933 1.314 0.964 1.336 0.996 1.357 1.029 1.377 1.062 1.398 1.097 1.418 1.133 1.437 1.170
per cent 55 60 65 70 75 80 85 90 95
100
1.360 1.457 1.208 1.403 1.476 1.248 1.421 1.495 1.288 1.452 1.513 1.331 1.477 1.531 1.374 1.503 1.549 1.420 1.531 1.567 1.467 1.559 1.584 1.515 1.588 1.601 1.566 1.618 1.618 1.618
the absorption ratio but also the value of IZ for any mixture. It will be recalled that in a mixture
R= 2r540 + (1 - x)rjfd
xr’540 + (1 - z)r’m
1 where in the particular case with which we are dealing r = - in A which the A values are the absorption ratios for oxyhemoglobin and the A’ values are the absorption ratios for the second pigment. It is necessary, therefore, to compute the various values for the absorption ratio with variations in the relative concentrations x and y and from this changes in the ratio R.
Table II presents the calculated value of R for mixtures of either
by guest on February 24, 2020http://w
ww
.jbc.org/D
ownloaded from
Ray, Blair, and Thomas 75
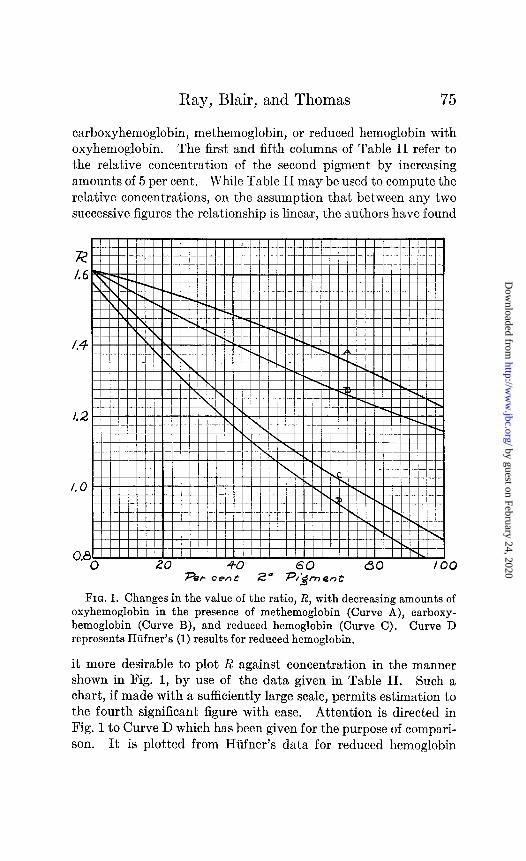
carboxyhemoglobin, methemoglobin, or reduced hemoglobin with oxyhemoglobin. The first and fifth columns of Table II refer to the relative concentration of the second pigment by increasing amounts of 5 per cent. While Table II may be used to compute the relative concentrations, on the assumption that between any two successive figures the relationship is linear, the authors have found
I.2
I. 0
I II lllllll Ill Ill Ill ill II IY-Ill II
I II I I Ill II Ii I I III II Ill III III I IN IIIIYII
FIG. 1. Changes in the value of the ratio, R, with decreasing amounts of oxyhemoglobin in the presence of methemoglobin (Curve A), carboxy- hemoglobin (Curve B), and reduced hemoglobin (Curve C). Curve D represents Hiifner’s (1) results for reduced hemoglobin.
it more desirable to plot R against concentration in the manner shown in Fig. 1, by use of the data given in Table II. Such a chart, if made with a sufficiently large scale, permits estimation to the fourth significant figure with ease. Attention is directed in Fig. 1 to Curve D which has been given for the purpose of compari- son. It is plotted from Htifner’s data for reduced hemoglobin
by guest on February 24, 2020http://w
ww
.jbc.org/D
ownloaded from
76 Spectrophotometry of Blood Pigments
and it will be observed that the variation is such that the error may be as high as 300 per cent; i.e., when the relative concentration is found to be 5 per cent by the corrected figures the older value indi- cates 20 per cent.
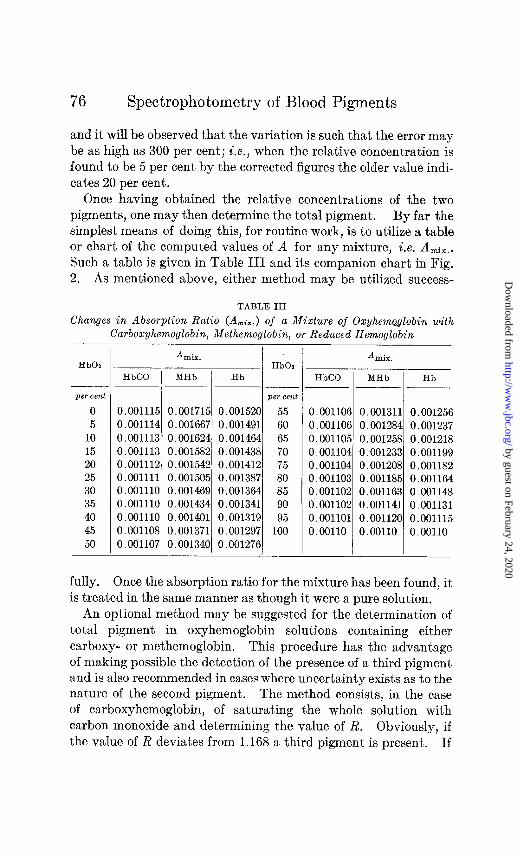
Once having obtained the relative concentrations of the two pigments, one may then determine the total pigment. By far the simplest means of doing this, for routine work, is to utilize a table or chart of the computed values of A for any mixture, i.e. Ami,,. Such a table is given in Table III and its companion chart in Fig. 2. As mentioned above, either method may be utilized success-
TABLE III
Changes in Absorption Ratio (Am<=.) oj a Mixture of Oxyhemaglobin with Carboxyhemoglobin, Methemoglobin, OT Reduced Hemoglobin
HbOn
per cent
0 5
10 15 20 25 30 35 40 45 50
-
Amix. HbOz
HbCO MHb Hb
per cent
0.001115 0.001715 0.001520 55 0.001114 0.001667 0.001491 60 0.001113 0.001624 0.001464 65 0.001113 0.001582 0.001438 70 0.001112 0.001542 0.001412 75 0.001111 0.001505 0.001387 80 0.001110 0.001469 0.001364 85 0.001110 0.001434 0.001341 90 0.001110 0.001401 0.001319 95 0.001108 0.001371 0.001297 100 0.001107 0.001340 0.001276
Amix.
HbCO MHb Hb ~~
0.001106 0.001311 0.001256 0.001106 0.001284 0.001237 0.001105 0.001258 0.001218 0.001104 0.001233 0.001199 0.001104 0.001208 0.001182 0.001103 0.001185 0.001164 0.001102 0.001163 0.001148 0.001102 0.001141 0.001131 0.001101 0.001120 0.001115 0.00110 0.00110 0.00110
fully. Once the absorption ratio for the mixture has been found, it is treated in the same manner as though it were a pure solution.
An optional method may be suggested for the determination of total pigment in oxyhemoglobin solutions containing either carboxy- or methemoglobin. This procedure has the advantage of making possible the detection of the presence of a third pigment and is also recommended in cases where uncertainty exists as to the nature of the second pigment. The method consist’s, in the case of carboxyhemoglobin, of saturating the whole solution with carbon monoxide and determining the value of R. Obviously, if the value of R deviat,es from 1.168 a third pigment is present. If
by guest on February 24, 2020http://w
ww
.jbc.org/D
ownloaded from
Ray, Blair, and Thomas 77
the value is that. of carboxyhemoglobin the total pigment concen- tration may be estimated from t.he usual formula for pure pig- ments. In t.he case of methemoglobin a slightly different method must be used; namely, one similar to that used by Van Slyke (15) for the gasometric determination of methemoglobin. The hemo- globin is reduced by the act’ion of ammoniacal sod,ium hydro- sulfite (1 cc. of 4 per cent Na2S302 in 2 per cent NH,OH) in 100 cc. dilution and the blood is at once saturated with carbon monoxide.
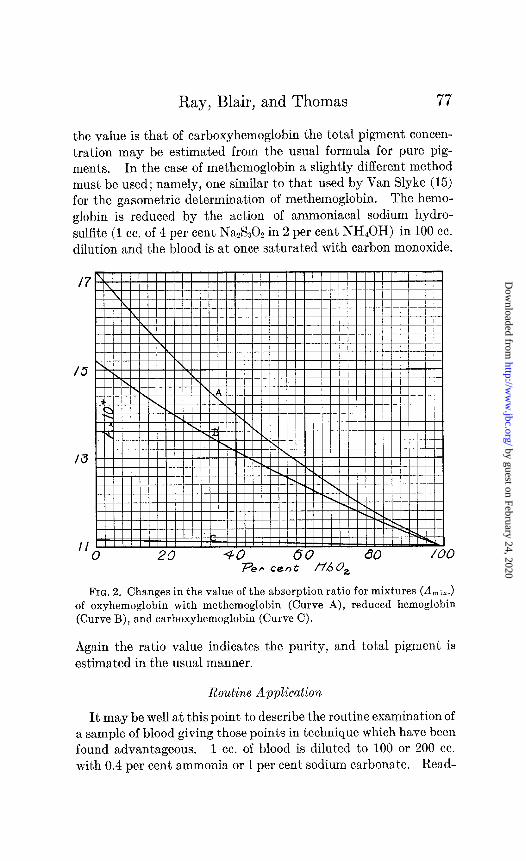
FIG. 2. Changes in the value of the absorption ratio for mixtures (AmiX.) of oxyhemoglobin with methemoglobin (Curve A), reduced hemoglobin (Curve B), and carboxyhemoglobin (Curve C).
Again the ratio value indicates the purity, and total pigment is est,imated in the usual manner.
Routine Application
It may be well at this point to describe the routine examination of a sample of blood giving those points in technique which have been found advantageous. 1 cc. of blood is diluted to 100 or 200 cc. with 0.4 per cent ammonia or 1 per cent sodium carbonat’e. Read,-
by guest on February 24, 2020http://w
ww
.jbc.org/D
ownloaded from
78 Spectrophotometry of Blood Pigments
ings can be made most efficiently when the transmission lies between 10 and 25 per cent and one soon learns to estimate the necessary dilution to give readings within this range. Two essen- tials must be observed at this point: first, that the solution be well mixed and oxygenated; secondly, that the solutions are crystal- clear since any turbidity is a source of error. We have found the Manufacturing Chemists Association type of volumetric flask par- ticularly useful for dilutions where oxygenation must be carried on simultaneously.
Whenever possible, readings should be made on a 1 cm. tube in order to simplify calculations. Transmission is read at the usual two wave-lengths. We have found five readings at each wave- lengt,h for each sample, checked by a similar set of readings on a second sample preferably from a new dilution when possible, to give the most accurate results. The average value of the trans- mission at each wave-length (TX) is then used in the calculations as indicated above.
If a solution of oxyhemoglobin and methemoglobin diluted 1: 100 and in a 1 cm. tube be taken as a specific example, the average value of Tb40 is found to be 0.138 and T560 to be 0.238, the recipro- cals of which are 7.24 and 4.20 respectively. Finding the loga- rithms of these we have 0.8597 and 0.6232. Using these figures in Equation 10 or 11, we obtain
R= - log T540 0.8597 - log TS60 0.6232 1’3g
2
From Fig. 1 we find that a ratio value of 1.392 is equivalent to 39 per cent oxyhemoglobin and 61 per cent methemoglobin. Fig. 2 shows that the absorption ratio of such a mixture (A,i,.) is 0.00141. Therefore, the total pigment c in the dilution will be by Equation 5
Amix. c=-.--IogT
n
or in gm. per cent of the original
0.8597 . 0.00141 C=
1 - dilution . 100
c = 0.001212 . 100 - 100
c = 12.12 gm. per cent total pigment
by guest on February 24, 2020http://w
ww
.jbc.org/D
ownloaded from
Ray, Blair, and Thomas 79
Hence, we have 4.74 gm. per cent oxyhemoglobin and 7.39 gm. per cent methemoglobin.
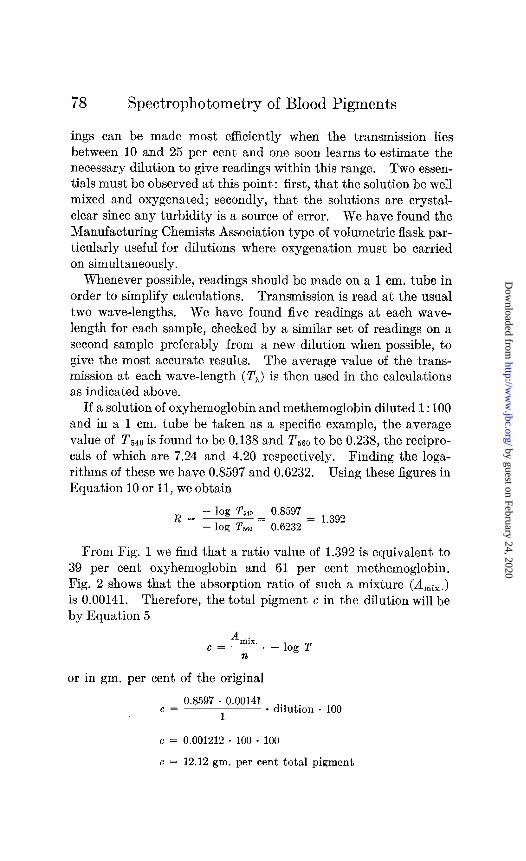
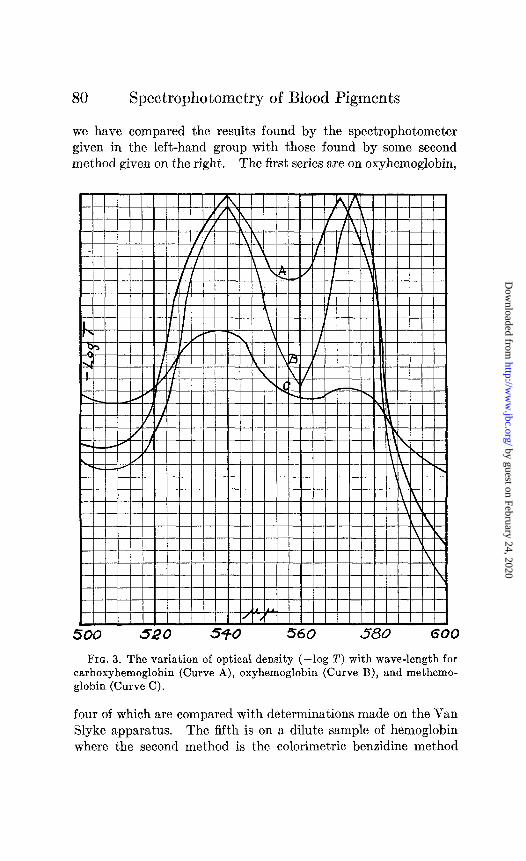
Usually, the nature of the second pigment is known or suspected from the history of the sample, but under certain conditions no information is available. Since the determination of the ratio value (R) is not specific, one must turn to other means for the recognition of the unknown. There are certain spect’rophoto- metric characteristics of the various pigments which assist mate- rially in the qualitative differentiation. A consideration of the absorption curves given in Fig. 3 will at once make these points obvious. This graph shows the absorption curve of oxyhemo- globin (Curve B), carboxyhemoglobin (Curve A), and alkaline methemoglobin (Curve C). In an unknown solution we may at once dismiss the possibility of reduced hemoglobin as one of the pigments since the process of dilution and mixing is sufficient to oxygenate it. We are, therefore, concerned with only the more stable pigments. Of these the more common are carboxy- and methemoglobin. They may be recognized at once by certain definite changes in the absorption at wave-length 575 mp.
If one finds a low ratio value but a density at 575 rnp equal or greater than that at 540 mp it will be seen from Fig. 1 that the second pigment is undoubtedly carboxyhemoglobin. If, on the other hand, the density is lower at 575 mp than it is at 540 mp, then the second pigment is methemoglobin, for it is obvious from the graphs that the absorption at 540 rnp is much greater than that at 575 mp in the case of methemoglobin. It is also obvious that it is unsafe for one to hold too rigidly to these criteria unless the observer is certain no other pigments than those mentioned above are present. In cases of unknown pigments the whole absorption curve must be plotted and characteristics of each type of blood pigment be considered. Such cases are, however, rare. The reader is referred to Haurowitz (14) for an extensive chart of absorption curves of various hemoglobin combinations. Even so the data found may be misleading and it is only by examination of known solutions containing t’he suspected mixtures that informa- tion may be obtained.
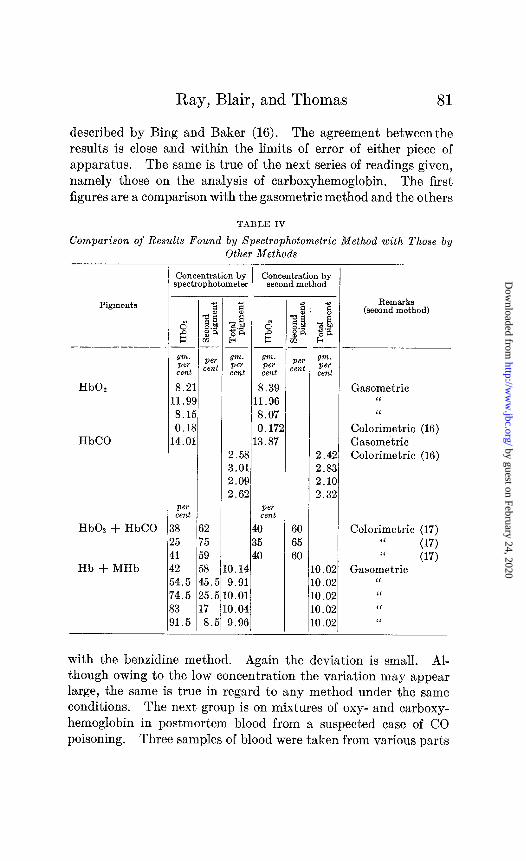
It is of interest to compare the results of analyses made by the procedure outlined above with certain standard methods. The results of various analyses are given in Table IV. In Table IV
by guest on February 24, 2020http://w
ww
.jbc.org/D
ownloaded from
80 Spectrophotometry of Blood Pigments
we have compared the results found by the spectrophotometer given in the left-hand group with those found by some second method given on the right. The first series are on oxyhemoglobin,
500 520 540 560 580 600
FIG. 3. The variation of optical density (-log T) with wave-length for carboxyhemoglobin (Curve A), oxyhemoglobin (Curve B), and methemo- globin (Curve C).
four of which are compared with determinations made on the Van Slyke apparatus. The fifth is on a dilute sample of hemoglobin where the second method is the calorimetric benzidine method
by guest on February 24, 2020http://w
ww
.jbc.org/D
ownloaded from
Ray, Blair, and Thomas 81
described by Bing and Baker (16). The agreement between the results is close and within the limits of error of either piece of apparatus. The same is true of the next series of readings given, namely those on the analysis of carboxyhemoglobin. The first figures are a comparison with the gasometric method and the others
TABLE IV
Comparison of Results Found by Spectrophotometric Method with Those by Other Methods
T Pigments
HbO,
HbCO
HbOz + HbCO
Hb + MHb
Concentration by spectrophotometer
Concentration by second method
c t
N s
ZE a.! m 8’ ~-
Qrn. pa Per cent cen
8.21 11.99 8.15 0.18 14.01
Per cent
18 62 !5 75 Ll 59 L2 58 i4.5 45.q ‘4.5 25.q 13 17 Il.5 8.$
_-
2 it!
7X.9 0”
2 a
x” _- Qnz. sm. Per Per cent cent
a.39 11.96 8.07 0.17:
13.87 2.58 3.01 2.09 2.62
Pm cent
40 35 40
0.14 9.91 0.01 0.04 9.96
Qm. Pep cent
Gasometric “ “
Calorimetric (16) Gasometric
2.42 Calorimetric (16) 2.83 2.10 2.32
Calorimetric (17) “
(17) “
(17) 0.02 Gasometric 0.02 “ 0.02 “ 0.02 “ 0.02 “
with the benzidine method. Again the deviation is small. Al- though owing to the low concentration the variation may appear large, the same is true in regard to any method under the same conditions. The next group is on mixtures of oxy- and carboxy- hemoglobin in postmortem blood from a suspected case of CO poisoning. Three samples of blood were taken from various parts
by guest on February 24, 2020http://w
ww
.jbc.org/D
ownloaded from
82 Spectrophotometry of Hood Pigments
of the body after embalming. The results found by the spectro- photometer are compared with estimations made by the colori- metric method of Sayers and Yant (17). Even under the unfavor- able conditions we find close approximations.
The final series represents a series of determinations made on a blood of known total pigment concentration which was divided and one portion partially converted to methemoglobin with potas- sium ferricyanide and then the two mixed. The ratio value was then determined and the total pigment computed. As may be seen the results are within 1 per cent of the average (10.01 gm. per cent).
While these scattered readings by no means present a complete picture of the possibilities of the method, they do show beyond question its adaptability and the fact that it is comparable in accuracy with other methods in common use.
SUMMARY
A revision of the earlier methods of quantitative spectrophotom- etry of the blood pigments is presented.
By means of previously prepared graphs, the data for which are given, it is possible to analyze a sample of blood for total pigment, oxygen content and capacity, and concentration of a second pig- ment (carboxyhemoglobin, methemoglobin, or reduced hemo- globin). The examination may be made on a small sample of blood, 0.05 cc., and in a very short time, with a high degree of precision.
BIBLIOGRAPHY
1. Hiifner, G., Arch. Anat. U. Physiol., Physiol. AM., 130 (1894). 2. Htifner, G., Arch. Anat. u. Physiol., Physiol. AU., 39 (1900). 3. Vierordt, Ii., Die Anwendung des Spektralapparates, Tubingen (1873);
cited by Hiifner (1). 4. Brode, W. R., J. Am. Chem. SOL, 46,581 (1924). 5. Clark, W. M., The determination of hydrogen ions, Baltimore, 3rd
edition (1928). 6. Davis, G. E., and Sheard, C., Arch. Int. Med., 40,226 (1927). 7. Keuffel, C. W., J. Optic. Sot. Am., 11,403 (1925). 8. Report of Committee on Spectrophotometry, 1922-23, J. Optic. Sot.
Am., 10,169 (1925). 9. Hari, P., Biochem. Z., 82,229 (1917); 96,257 (1919).
by guest on February 24, 2020http://w
ww
.jbc.org/D
ownloaded from
Ray, Blair, and Thomas 83
10. Charnas, D., in Abderhalden, E., Handbuch der biologischen Arbeits- methoden, Abt. IV, Tei14, Berlin and Vienna, 1090 (1923).
11. Butterfield, E. E., 2. physiol. Chem., 62,173 (1909). 12. Aron, H., and Muller, F., Arch. Anut. u. Physiol., Physiol. Abt., suppl.
118 (1906). 13. Heubner, W., and Rosenberg, H., B&hem. Z., 38,345 (1912). 14. Haurowitz, F., 2. physiol. Chem., 161,135 (1926). 15. Van Slyke, D. D., J. Biol. Chem., 66,409 (1925). 16. Bing, F. C., and Baker, R. W.: J. Biol. Chem., 92,589 (1931). 17. Sayers, R., and Yant, W., U. S. Dept. Commerce, Bureau Mines,
Techn. Paper 37s (1927).
by guest on February 24, 2020http://w
ww
.jbc.org/D
ownloaded from
G. B. Ray, H. A. Blair and C. I. ThomasBLOOD PIGMENTS
DETERMINATION OF CERTAIN THE SPECTROPHOTOMETRIC
1932, 98:63-83.J. Biol. Chem.
http://www.jbc.org/content/98/1/63.citation
Access the most updated version of this article at
Alerts:
When a correction for this article is posted•
When this article is cited•
alerts to choose from all of JBC's e-mailClick here
#ref-list-1
http://www.jbc.org/content/98/1/63.citation.full.htmlaccessed free atThis article cites 0 references, 0 of which can be
by guest on February 24, 2020http://w
ww
.jbc.org/D
ownloaded from