Embed Size (px)
Citation preview
A Spectral Based Forecasting Tool of Epileptic Seizures
Hedi Khammari and Ashraf Anwar
College of Computers and Info. Tech., Taif University, Saudi Arabia
Abstract
A new approach to recognize and predict succedent epileptic seizure by using single channel electroencephalogram (EEG) analysis is proposed. Spectral analysis of a brain time series of the left frontal FP1-F7 (LF) scalp location signal is devoted for seizure prediction and analysis. Important findings showing the presence of preictal spectral changes in studied brain signal are described. Spectral features occurring during the preictal epoch are extracted from the application of sliding spectral windows of raw EEG at different moments in time preceding the seizure onset. The same method is then applied to a couple of Intrinsic Mode Functions (IMF1 and IMF2) of the raw EEG (FP1-F7) decomposed by the algorithm of empirical mode decomposition. The main prediction features are derived from the changes of amplitudes, frequency and the number of spikes which are of diagnostic values. The sliding spectral windows were computed to trace the amplitude changes of higher harmonics during time interval preceding the seizure onset. Choosing different moments in time aims to identify the best prediction time of seizure onset. Obviously an early prediction time is always desirable but the seizure may result from an abrupt change and so the spectral ‘signs’ of an imminent seizure occur during a very short prediction time. From another viewpoint, it may be advantageous to consider a successive prediction times showing the increase of spike numbers and the predominance of certain waves rather than others when approaching seizure onset. The common prediction features extracted from the analysis of FP1-F7 signal for both patients were mainly the increasing number of spikes of low frequency waves namely delta and theta waves. Keywords: Electroencephalogram (EEG), Spectral Analysis, seizure onset, sliding window (FFT), Higher Harmonics (HH).
1. Introduction
The search for precursors and predictors of a seizure in the human EEG is of highest clinical relevance and may even guide to understand in depth the seizure generating mechanisms. The aim of this project is to investigate powerful and novel mathematical tools useful for EEGs analysis in order to provide insights into the epileptogenic process and to obtain results that may assist in diagnosis and treatment of epilepsy.
Epilepsy is among the most common neurological disorders, and represents temporary and reversible electric activity in the brain. Epilepsy is characterized by occasional, excessive and disorderly discharging of neurons, which can be detected by clinical manifestations, the seizures. These seizures are transient symptoms of abnormal, excessive or synchronous neuronal activity in the brain [1]. The high incidence of epilepsy stems from the fact that it occurs as a result of a large number of causes, including genetic abnormalities, developmental anomalies, febrile convulsions, as well as brain insults such as craniofacial trauma, central nervous system infections, hypoxia, ischemia, and tumors.
For the majority of the patients seizures usually occur suddenly and unexpectedly without any external intervention. An epileptic seizure is a complex symptom caused by a variety of pathologic processes in the brain. Epileptic seizures may be accompanied by an impairment or loss of consciousness; psychic, autonomic, or sensory symptoms; or motor phenomena. In some patients, seizures can occur hundreds of times per day; in rare instances, they occur only once every few years. The hallmark of epilepsy is recurrent seizures, thus the constant fear of the next seizure and the feeling of helplessness often have a strong impact on the daily life of a patient [2]. A system able to predict seizures would allow some preventive measures to keep the risk of seizure to a minimum and to improve substantially the quality of life and the social integration of the patients. Tremendous efforts have been spent on seizure prediction through EEG monitoring for a long time. It has long been observed that the transition from the interictal state (far from seizures) to the ictal state (seizure) is not sudden and may be preceded from minutes to hours by clinical, metabolic or electrical changes [3]. The goal of seizure prediction problem is to predict an upcoming seizure based on the analysis of biomedical signal recorded from patients. An automatic seizure detection system could bring a fast off –line diagnosis by reviewing EEG data by neurologist and can send an online warning signal to enhance the patient’s safety[20]. It was reported that childhood epilepsy was associated with high frequency epileptic activity [21].
IJCSI International Journal of Computer Science Issues, Vol. 9, Issue 3, No 3, May 2012 ISSN (Online): 1694-0814 www.IJCSI.org 337
Copyright (c) 2012 International Journal of Computer Science Issues. All Rights Reserved.

In seizure prediction problems, there are some basic terms as follow: The period during which the seizure actually occurs is described as the ictal period. It is a period of time in which seizure onset is identified by epileptologists through EEG or ECG waveform examination. The pre-ictalpre-seizure state, is the period immediately before the seizure onset. The period after the seizure is referred to as post-seizure or postictal period. The interval between two consecutive seizures is described as the interictalIn former studies, it was reported that the higher harmonic predominance can characterize certain behavior in nonlinear systems [14]. Spectral analysis based on such results was applied to characterize Sudden Cardiac Death in Electrocardiograms signals[17]. The remainder of this paper is split into four sections; section 2 contains the basic reminders and the methodology. An experimental setup is given in section 3. Section 4 is devoted to discuss the main obtained results. Finally, section 5 is dedicated to concluding remarks and openings.
2. General Reminders and Methodology
The multi-electrode scalp EEG data records were provideby 19 electrodes positions on the scalp (FP2, F4, C4, P4, O2, F8, T4, T6, FP1, F3, C3, P3, O1, F7, T3, T5, FZ, CZ, PZ) according to the International 10-20 system electrode placement as in figure 2.
Figure 1: EEG signal; pre-seizure and seizure activities(Patient chb01-03)
Note that in seizure prediction problem, the
duration of each state is decided by human than an objective value since the true mechanisms of spontaneous occurrence of seizures are not completely understood. In the following, the data corresponding to
In seizure prediction problems, there are some basic terms
The period during which the seizure actually occurs is It is a period of time in which
seizure onset is identified by epileptologists through EEG ictal period, or
state, is the period immediately before the seizure onset. The period after the seizure is referred to as
period. The interval between two interictal period.
orted that the higher harmonic can characterize certain behavior in
based on such results was applied to in Electrocardiograms
r is split into four sections; section 2 contains the basic reminders and the methodology. An experimental setup is given in section 3.
the main obtained results. concluding remarks and
Methodology
EEG data records were provided 19 electrodes positions on the scalp (FP2, F4, C4, P4,
T6, FP1, F3, C3, P3, O1, F7, T3, T5, FZ, CZ, 20 system of
seizure and seizure activities
Note that in seizure prediction problem, the duration of each state is decided by human thought rather than an objective value since the true mechanisms of
are not completely , the data corresponding to
ictal and postictal is discarded in this setting, because the task is to predict an upcoming seizure.
Figure 2: Electrode montage
Prediction Horizon is the period after an alarm within which a seizure is expected to occur within the prediction horizon, the alarm is classified as a true alarm; otherwise it is regarded as a false alarm. Prediction horizons reported in the literature range from several minutes to few hours [5]. Using spectral analysis of EEG for predibased upon the partitioning or banding of EEG spectrum into the traditional delta (δ), alpha (α) and beta (β) waves is the classical method [17The EEG is described in terms of rhythmic activity and transients. The prominent EEG bands characterizing the rhythmic activity are given in the following table.
Wave FrequencyDelta 1 Theta 4Alpha 8 Beta 13 Gamma 30 –
Table 1: Brain bands Among our objectives, we attempt to abnormalities in both frequencial and temporal From the analysis of EEG signals, signals, one can investigate how tvaries with time [15]. In the first part of analysis, we choose to apply sliding window FFT algorithmEEG signal namely FP1-F7 see figure 1
ictal and postictal is discarded in this setting, because the predict an upcoming seizure.
Electrode montage
is the period after an alarm within which a seizure is expected to occur [4]. If a seizure occurs within the prediction horizon, the alarm is classified as a true alarm; otherwise it is regarded as a false alarm. Prediction horizons reported in the literature range from
f EEG for prediction of epilepsy banding of EEG spectrum
into the traditional delta (δ), alpha (α) and beta (β) ].
The EEG is described in terms of rhythmic activity and ts. The prominent EEG bands characterizing the
rhythmic activity are given in the following table.
Frequency 1 – 4 Hz 4 – 8 Hz – 13 Hz – 30 Hz
– 100 Hz
Table 1: Brain bands
Among our objectives, we attempt to pinpoint dynamic both frequencial and temporal domain.
given as discrete time signals, one can investigate how the frequency content
In the first part of analysis, we window FFT algorithm, to a raw
see figure 1. The prediction
IJCSI International Journal of Computer Science Issues, Vol. 9, Issue 3, No 3, May 2012 ISSN (Online): 1694-0814 www.IJCSI.org 338
Copyright (c) 2012 International Journal of Computer Science Issues. All Rights Reserved.

horizon is assumed to be 20 minutes, during which four 1-minute intervals are chosen for spectral analysis. Such intervals start at -20mn, -10mn, -5mn, and -1mn prior the seizure onset, respectively. The second part of analysis is devoted to extract spectral features from two intrinsic mode functions derived from the Empirical Mode Decomposition (EMD) of the same raw EEG signal specifically FP1-F7. EMD is a general signal processing method for analyzing nonlinear and non stationary time series [11]. In such approach the basic idea is to separate the various frequencies in different intrinsic mode functions (IMF) each of which has a well defined frequency. Among the applications can be cited the phase synchronization of two nonlinear dynamical systems from the perspective of empirical mode decomposition and the wavelet theory reported in [12]. The Hilbert Huang transform (HHT) permits to decompose a signal into intrinsic mode functions (IMF), and obtain instantaneous frequency data. Such transform is better appropriate to handle data that are non stationary and nonlinear. The so-called IMFs extracted by the Empirical Mode Decomposition (EMD), satisfy two conditions: [6] 1. in the whole data set, the number of extrema and the number of zero-crossings must either be equal or differ at most by one; 2. At any point, the mean value of the envelope defined by the local maxima and the envelope defined by the local minima is zero. An algorithm based on the EMD was proposed in [7] to allow the detection of QRS complex of ECG.
In previous works, EMD algorithm was used as an important tool in ECG signal processing for noise suppression [8], to discriminate Ventricular Fibrillation (VF) from other cardiac arrhythmias [9] and to differentiate synthetic RR series from a non stationary integral pulse frequency modulation model and to real RR series from a data set of normal sinus arrhythmia [10]. In epilepsy analysis, EMD was used to recognize epilepsy seizures by using single channel EEG analysis [18]. An analysis of the effectiveness of the EMD to distinguish between epileptical periods from the interictal states was reported in[19]. The EMD is a fundamental step to decouple stationary components from nonstationary components in a signal [13]. It is a sifting process which decomposes a given signal x(t) into a set of intrinsic mode functions(IMF)[8].
∑=
+=K
kk trtdtx
0
)()()( (1)
)(tdk being the modes and )(tr is the residual term. The EMD can be used for a high frequency denoising of noise corrupted signals. The original signal is reconstructed by removing the IMFs that contain the most of the noise components and summing up the remaining
IMFs.
3. Experimental Setup
The data set used to extract the spectral features of continuous scalp EEG sampled at 256 Hz. The pediatric EEG data used in this paper is contained within the CHB-MIT database, which can be downloaded from the PhysioNet website [16]: http://physionet.org/physiobank/database/chbmit/. The current study included only two pediatric subjects with intractable seizures. The selected waveform records chb01_03 (female 11 years old) and chb02_19 (male 11 years) are of two pediatric patients after withdrawal of anti-seizure medication in order to assess their candidacy for surgical intervention. Upcoming seizure prediction arguments are characterized in terms of specificity which refers to the number and the type of wave spikes in the spectra of a particular brain signal FP1-F7, which roughly correspond to the departed frontal and prefrontal cortex regions. The main purpose is to understand the brain oscillations foregoing a seizure onset we analyze the continuous change of the spectral composition corresponding to a sliding window taken on the EEG time series. Every spectrum exhibit the amplitudes of one hundred spectral lines the constant including ac Fourier constant, the fundamental and the higher harmonics. Spectral analysis of a one minute length EEG recording is performed at four different moments in time preceding the seizure onset, namely -20mn, -10mn, -5mn and -1mn. For both patient EEG recordings, the one minute length epochs taken at such moments are split into strongly overlapping intervals.
4. Results and Discussion
◌Spectral analysis was performed for only one channel FP1-F7. The spectra given in this paper are not displayed as in classical way where x-axis is assigned to frequency and y-axis to the amplitude. The changes over time of the first hundred of higher harmonics (HHi, i=1,100) is traced to put evidence into the spectral composition of the studied signal FP1-F7. The spectral reorganization of the sliding windows moving from left to right approaching the seizure onset time, exhibits an increasing number of spikes. The analysis of changes of spike amplitudes and numbers shows that delta waves are predominent then theta waves rank second in spike amplitudes.
IJCSI International Journal of Computer Science Issues, Vol. 9, Issue 3, No 3, May 2012 ISSN (Online): 1694-0814 www.IJCSI.org 339
Copyright (c) 2012 International Journal of Computer Science Issues. All Rights Reserved.

It is obvious that if the prediction is made too early before the seizure onset, it is possible to remedy in time. Thereby, we opt to attempt prediction at different time points namely -20mn, -10mn, -5mn and -1mn, in order to extract the main relevant features leading to the imminent seizure. The progressive changes in FP1-F7 signal spectra are shown in figures 3,4,5 and 6 for patient chb01-03, and in figures 7,8,9 and 10 for patient chb02-19. Such patients were chosen to have similar age (11 years), a boy and a girl..
Figure 3. Spectra of FP1-F7 before 20mn of seizure onset
(Patient ch01-03)
Figure 4. Spectra of FP1-F7 before 10mn of seizure onset
(Patient ch01-03)
Figure 5. Spectra of FP1-F7 before 5mn of seizure onset
(Patient ch01-03)
Figure 6. Spectra of FP1-F7 before 1mn of seizure onset
(Patient ch01-03) The common spectral features of FP1-F7 signal for both patients are the increasing number of spikes of delta and theta waves, except in figure 6, where important spikes of alpha waves are seen. The spectral analysis using sliding windows is carried out to obtain diagnostic information. The variation of amplitudes, frequency and number of spikes are of diagnostic values.
0 200 400 600 800 1000 1200 1400 16000
1
2
3
4
5
6
7x 10
5
Windows number
high
er H
arm
onic
s am
plitu
des
EEG bands in FP1-F7 of ch01-3 (20mn before Seizure Onset)
deltathetaalphabetagamma
0 200 400 600 800 1000 1200 1400 16000
0.5
1
1.5
2
2.5x 10
5
Windows number
high
er H
arm
onic
s am
plitu
des
EEG bands in FP1-F7 of ch01-3 (10mn before Seizure Onset)
deltathetaalphabetagamma
0 200 400 600 800 1000 1200 1400 16000
2
4
6
8
10
12x 104
Windows number
high
er H
arm
onic
s am
plitu
des
EEG bands in FP1-F7 of ch01-3 (5mn before Seizure Onset)
deltathetaalphabetagamma
0 200 400 600 800 1000 1200 1400 16000
0.5
1
1.5
2
2.5
3x 10⁵
Windows number
high
er H
arm
onic
s am
plitu
des
EEG bands in FP1-F7 of ch01-3 (1mn before Seizure Onset)
deltathetaalphabetagamma
IJCSI International Journal of Computer Science Issues, Vol. 9, Issue 3, No 3, May 2012 ISSN (Online): 1694-0814 www.IJCSI.org 340
Copyright (c) 2012 International Journal of Computer Science Issues. All Rights Reserved.

Figure 7. Spectra of FP1-F7 before 20mn of seizure onset
(Patient ch02-19)
Figure 8. Spectra of FP1-F7 before 10mn of seizure onset
(Patient ch02-19)
Figure 9. Spectra of FP1-F7 before 5mn of seizure onset
(Patient ch02-19)
Figure 10. Spectra of FP1-F7 before 1mn of seizure onset
(Patient ch02-19) EMD extraction produces 12 IMFs for the FP1-F7 brain signal and a residue. Such residue is little left in the signal resulting from empirical sifting through it. For simplicity but without loss of generality, we confine ourselves to just apply the same analysis presented above to the first IMFs namely IMF1 and IMF2. For each patient, the EMD decomposition is applied to four 1-minute time intervals corresponding respectively to different moments in time preceding the seizure onset, namely -20mn, -10mn, -5mn and -1mn. In such cases we would need more useful features from the Intrinsic Mode function spectra to predict an imminent seizure. Only six IMFs generated by the decomposition are shown in figures 11.a and 11.b. The decomposed time intervals for both patients include the seizure onset.
Figure 11.a Decomposition of FP1-F7 using EMD
of seizure onset (Patient ch01-03) (IMF1-IMF6)
0 200 400 600 800 1000 1200 1400 16000
1
2
3
4
5
6
7
8
9x 10⁵
Windows number
high
er H
arm
onic
s am
plitu
des
EEG bands in FP1-F7 of ch02-19 (20Mn before Seizure Onset)
deltathetaalphabetagamma
0 200 400 600 800 1000 1200 1400 16000
2
4
6
8
10
12x 105
Windows number
high
er H
arm
onic
s am
plitu
des
EEG bands in FP1-F7 of ch02-19 (10mn before Seizure Onset)
deltathetaalphabetagamma
0 200 400 600 800 1000 1200 1400 16000
1
2
3
4
5
6x 10⁵
Windows number
high
er H
arm
onic
s am
plitu
des
EEG bands in FP1-F7 of ch02-19 (5mn before Seizure Onset)
deltathetaalphabetagamma
0 200 400 600 800 1000 1200 1400 16000
0.5
1
1.5
2
2.5
3
3.5x 10⁶
Windows number
high
er H
arm
onic
s am
plitu
des
EEG bands in FP1-F7 of ch02-19 (1mn before Seizure Onset)
deltathetaalphabetagamma
0 5000 10000 15000-200
0200
Record chb01-03 (Seizure Onset), FP1-F7
IMF1
0 5000 10000 15000-200
0200
IMF2
0 5000 10000 15000-100
0100
IMF3
0 5000 10000 15000-200
0200
IMF4
0 5000 10000 15000-500
0500
IMF5
0 5000 10000 15000-500
0500
IMF6
Samples
IJCSI International Journal of Computer Science Issues, Vol. 9, Issue 3, No 3, May 2012 ISSN (Online): 1694-0814 www.IJCSI.org 341
Copyright (c) 2012 International Journal of Computer Science Issues. All Rights Reserved.
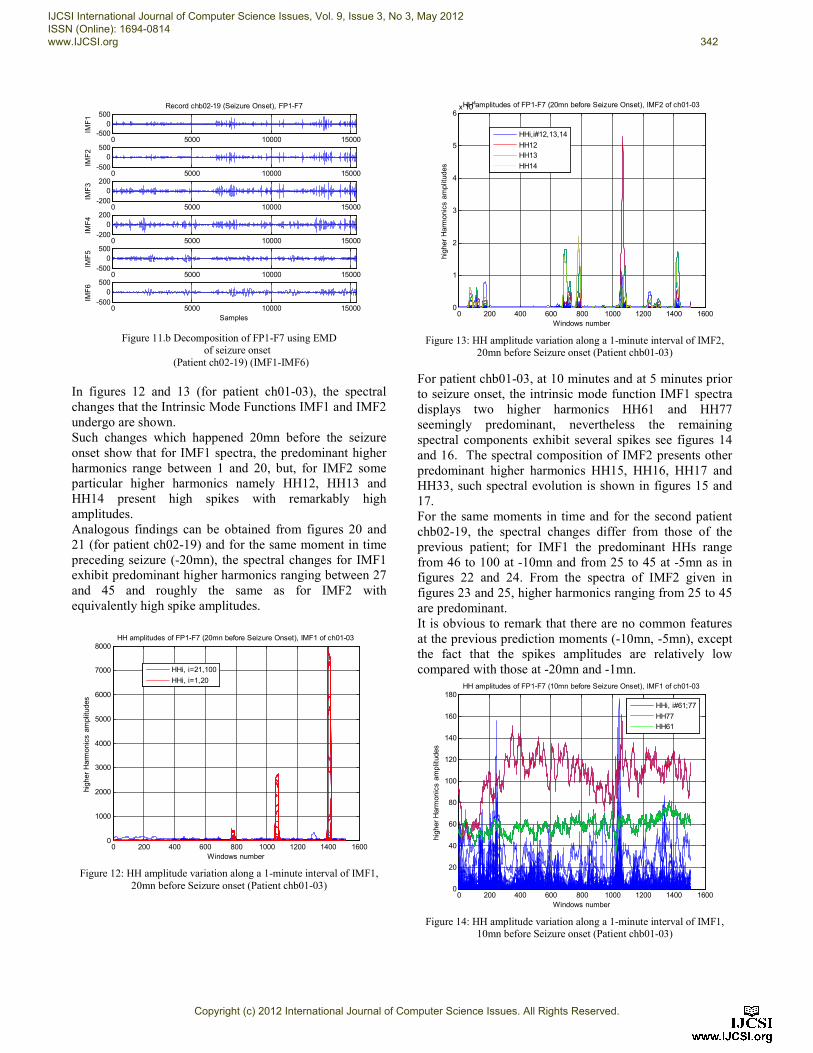
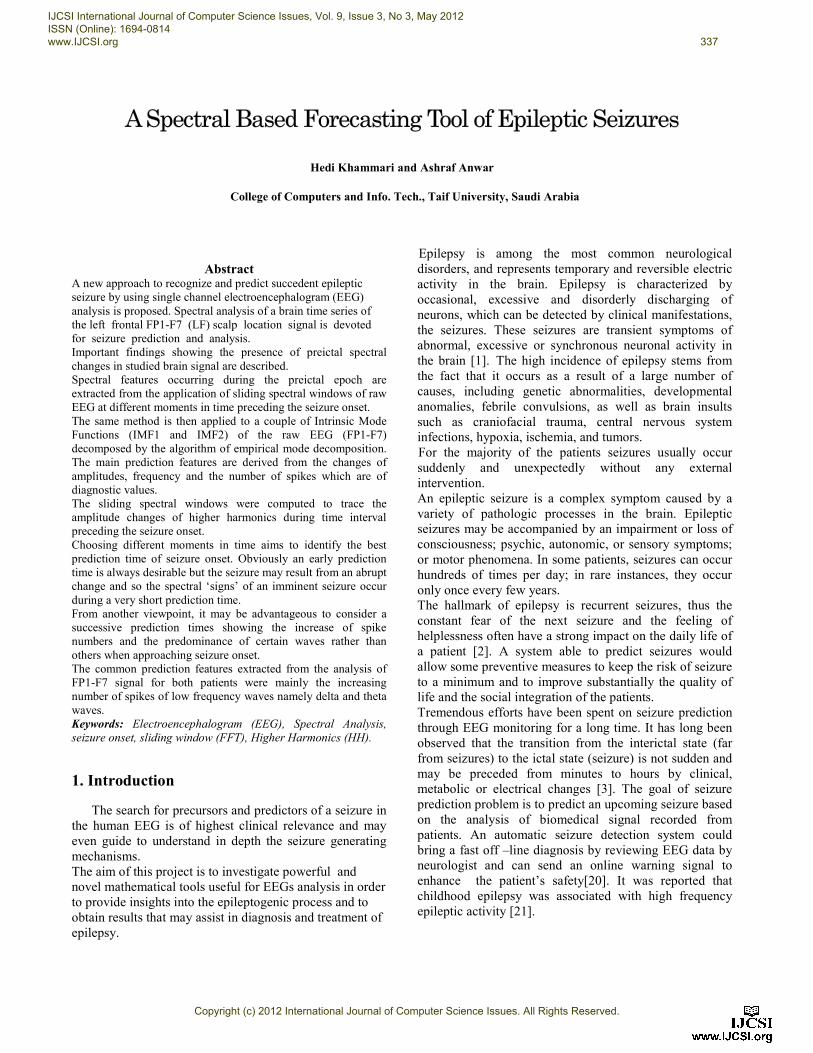
Figure 11.b Decomposition of FP1-F7 using EMD
of seizure onset (Patient ch02-19) (IMF1-IMF6)
In figures 12 and 13 (for patient ch01-03), the spectral changes that the Intrinsic Mode Functions IMF1 and IMF2 undergo are shown. Such changes which happened 20mn before the seizure onset show that for IMF1 spectra, the predominant higher harmonics range between 1 and 20, but, for IMF2 some particular higher harmonics namely HH12, HH13 and HH14 present high spikes with remarkably high amplitudes. Analogous findings can be obtained from figures 20 and 21 (for patient ch02-19) and for the same moment in time preceding seizure (-20mn), the spectral changes for IMF1 exhibit predominant higher harmonics ranging between 27 and 45 and roughly the same as for IMF2 with equivalently high spike amplitudes.
Figure 12: HH amplitude variation along a 1-minute interval of IMF1,
20mn before Seizure onset (Patient chb01-03)
Figure 13: HH amplitude variation along a 1-minute interval of IMF2,
20mn before Seizure onset (Patient chb01-03)
For patient chb01-03, at 10 minutes and at 5 minutes prior to seizure onset, the intrinsic mode function IMF1 spectra displays two higher harmonics HH61 and HH77 seemingly predominant, nevertheless the remaining spectral components exhibit several spikes see figures 14 and 16. The spectral composition of IMF2 presents other predominant higher harmonics HH15, HH16, HH17 and HH33, such spectral evolution is shown in figures 15 and 17. For the same moments in time and for the second patient chb02-19, the spectral changes differ from those of the previous patient; for IMF1 the predominant HHs range from 46 to 100 at -10mn and from 25 to 45 at -5mn as in figures 22 and 24. From the spectra of IMF2 given in figures 23 and 25, higher harmonics ranging from 25 to 45 are predominant. It is obvious to remark that there are no common features at the previous prediction moments (-10mn, -5mn), except the fact that the spikes amplitudes are relatively low compared with those at -20mn and -1mn.
Figure 14: HH amplitude variation along a 1-minute interval of IMF1,
10mn before Seizure onset (Patient chb01-03)
0 5000 10000 15000-500
0500
Record chb02-19 (Seizure Onset), FP1-F7
IMF1
0 5000 10000 15000-500
0500
IMF2
0 5000 10000 15000-200
0200
IMF3
0 5000 10000 15000-200
0200
IMF4
0 5000 10000 15000-500
0500
IMF5
0 5000 10000 15000-500
0500
IMF6
Samples
0 200 400 600 800 1000 1200 1400 16000
1000
2000
3000
4000
5000
6000
7000
8000
Windows number
high
er H
arm
onic
s am
plitu
des
HH amplitudes of FP1-F7 (20mn before Seizure Onset), IMF1 of ch01-03
HHi, i=21,100HHi, i=1,20
0 200 400 600 800 1000 1200 1400 16000
1
2
3
4
5
6x 10⁴
Windows number
high
er H
arm
onic
s am
plitu
des
HH amplitudes of FP1-F7 (20mn before Seizure Onset), IMF2 of ch01-03
HHi,i#12,13,14HH12HH13HH14
0 200 400 600 800 1000 1200 1400 16000
20
40
60
80
100
120
140
160
180
Windows number
high
er H
arm
onic
s am
plitu
des
HH amplitudes of FP1-F7 (10mn before Seizure Onset), IMF1 of ch01-03
HHi, i#61;77HH77HH61
IJCSI International Journal of Computer Science Issues, Vol. 9, Issue 3, No 3, May 2012 ISSN (Online): 1694-0814 www.IJCSI.org 342
Copyright (c) 2012 International Journal of Computer Science Issues. All Rights Reserved.
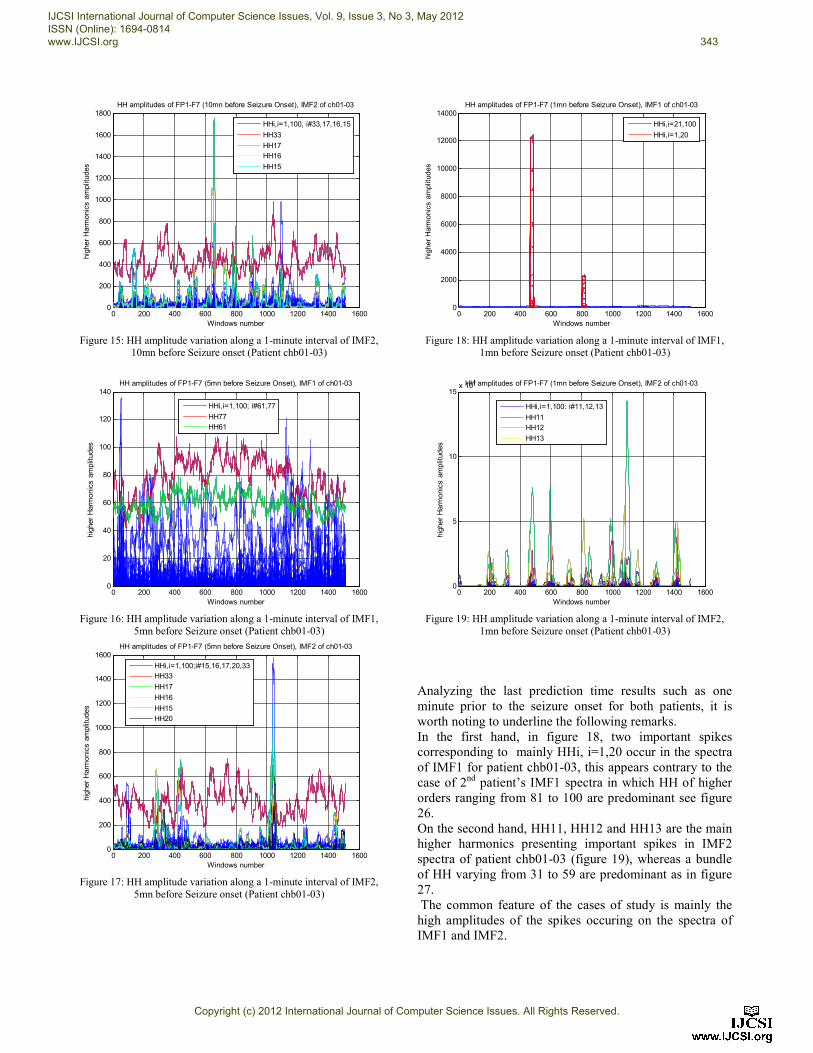
Figure 15: HH amplitude variation along a 1-minute interval of IMF2,
10mn before Seizure onset (Patient chb01-03)
Figure 16: HH amplitude variation along a 1-minute interval of IMF1,
5mn before Seizure onset (Patient chb01-03)
Figure 17: HH amplitude variation along a 1-minute interval of IMF2,
5mn before Seizure onset (Patient chb01-03)
Figure 18: HH amplitude variation along a 1-minute interval of IMF1,
1mn before Seizure onset (Patient chb01-03)
Figure 19: HH amplitude variation along a 1-minute interval of IMF2,
1mn before Seizure onset (Patient chb01-03) Analyzing the last prediction time results such as one minute prior to the seizure onset for both patients, it is worth noting to underline the following remarks. In the first hand, in figure 18, two important spikes corresponding to mainly HHi, i=1,20 occur in the spectra of IMF1 for patient chb01-03, this appears contrary to the case of 2nd patient’s IMF1 spectra in which HH of higher orders ranging from 81 to 100 are predominant see figure 26. On the second hand, HH11, HH12 and HH13 are the main higher harmonics presenting important spikes in IMF2 spectra of patient chb01-03 (figure 19), whereas a bundle of HH varying from 31 to 59 are predominant as in figure 27. The common feature of the cases of study is mainly the high amplitudes of the spikes occuring on the spectra of IMF1 and IMF2.
0 200 400 600 800 1000 1200 1400 16000
200
400
600
800
1000
1200
1400
1600
1800
Windows number
high
er H
arm
onic
s am
plitu
des
HH amplitudes of FP1-F7 (10mn before Seizure Onset), IMF2 of ch01-03
HHi,i=1,100, i#33,17,16,15HH33HH17HH16HH15
0 200 400 600 800 1000 1200 1400 16000
20
40
60
80
100
120
140
Windows number
high
er H
arm
onic
s am
plitu
des
HH amplitudes of FP1-F7 (5mn before Seizure Onset), IMF1 of ch01-03
HHi,i=1,100; i#61,77HH77HH61
0 200 400 600 800 1000 1200 1400 16000
200
400
600
800
1000
1200
1400
1600
Windows number
high
er H
arm
onic
s am
plitu
des
HH amplitudes of FP1-F7 (5mn before Seizure Onset), IMF2 of ch01-03
HHi,i=1,100;i#15,16,17,20,33HH33HH17HH16HH15HH20
0 200 400 600 800 1000 1200 1400 16000
2000
4000
6000
8000
10000
12000
14000
Windows number
high
er H
arm
onic
s am
plitu
des
HH amplitudes of FP1-F7 (1mn before Seizure Onset), IMF1 of ch01-03
HHi,i=21,100HHi,i=1,20
0 200 400 600 800 1000 1200 1400 16000
5
10
15x 104
Windows number
high
er H
arm
onic
s am
plitu
des
HH amplitudes of FP1-F7 (1mn before Seizure Onset), IMF2 of ch01-03
HHi,i=1,100: i#11,12,13HH11HH12HH13
IJCSI International Journal of Computer Science Issues, Vol. 9, Issue 3, No 3, May 2012 ISSN (Online): 1694-0814 www.IJCSI.org 343
Copyright (c) 2012 International Journal of Computer Science Issues. All Rights Reserved.

Figure 20: HH amplitude variation along a 1-minute interval of IMF1,
20mn before Seizure onset (Patient chb02-19)
Figure 21: HH amplitude variation along a 1-minute interval of IMF2,
20mn before Seizure onset (Patient chb02-19)
Figure 22: HH amplitude variation along a 1-minute interval of IMF1,
10mn before Seizure onset (Patient chb02-19)
Figure 23: HH amplitude variation along a 1-minute interval of IMF2,
10mn before Seizure onset (Patient chb02-19)
Figure 24: HH amplitude variation along a 1-minute interval of IMF1,
5mn before Seizure onset (Patient chb02-19)
Figure 25: HH amplitude variation along a 1-minute interval of IMF2,
5mn before Seizure onset (Patient chb02-19)
0 200 400 600 800 1000 1200 1400 16000
2000
4000
6000
8000
10000
12000
Windows number
high
er H
arm
onic
s am
plitu
des
HH amplitudes of FP1-F7 (20mn before Seizure Onset), IMF1 of ch02-19
HH27-45HH1-26 & HH46-100
0 200 400 600 800 1000 1200 1400 16000
0.5
1
1.5
2
2.5
3x 10⁴
Windows number
high
er H
arm
onic
s am
plitu
des
HH amplitudes of FP1-F7 (20mn before Seizure Onset), IMF2 of ch02-19
HH25-45HH1-24 & HH46-100
0 200 400 600 800 1000 1200 1400 16000
1000
2000
3000
4000
5000
6000
7000
8000
Windows number
high
er H
arm
onic
s am
plitu
des
HH amplitudes of FP1-F7 (10mn before Seizure Onset), IMF1 of ch02-19
HH25-45HH1-24HH46-100
0 200 400 600 800 1000 1200 1400 16000
1000
2000
3000
4000
5000
6000
7000
8000
9000
Windows number
high
er H
arm
onic
s am
plitu
des
HH amplitudes of FP1-F7 (10mn before Seizure Onset), IMF2 of ch02-19
HH25-45HH1-24HH46-100
0 200 400 600 800 1000 1200 1400 16000
1000
2000
3000
4000
5000
6000
Windows number
high
er H
arm
onic
s am
plitu
des
HH amplitudes of FP1-F7 (5mn before Seizure Onset), IMF1 of ch02-19
HH25-45HH1-HH24HH46-100
0 200 400 600 800 1000 1200 1400 16000
2000
4000
6000
8000
10000
12000
14000
Windows number
high
er H
arm
onic
s am
plitu
des
HH amplitudes of FP1-F7 (5mn before Seizure Onset), IMF2 of ch02-19
HH25-45HH1-24HH46-100
IJCSI International Journal of Computer Science Issues, Vol. 9, Issue 3, No 3, May 2012 ISSN (Online): 1694-0814 www.IJCSI.org 344
Copyright (c) 2012 International Journal of Computer Science Issues. All Rights Reserved.

Figure 26: HH amplitude variation along a 1-minute interval of IMF1,
1mn before Seizure onset (Patient chb02-19)
Figure 27: HH amplitude variation along a 1-minute interval of IMF2,
1mn before Seizure onset (Patient chb02-19) 5. Conclusions and openings We have reviewed in these paper important findings showing the presence of preictal spectral changes in Left frontal FP1-F7 brain signal. Developing such results is a promise for a better understanding of seizure generation mechanisms. The main results are focusing on spectral features occurring during the preictal epoch. Aiming to obtain diagnostic information, we applied spectral analysis using sliding windows. The changes of amplitudes, frequency and number of spikes are of diagnostic values. Spectral analysis was applied to the signal FP1-F7 in the first place, then to a couple of its components from the empirical mode decomposition namely IMF1 and IMF2. The sliding spectral windows were computed to trace the amplitude changes of higher harmonics during a time interval preceding the seizure onset.
Choosing different moments in time aims to identify the best prediction time of seizure onset, although an early prediction time is always desirable but the seizure can result from an abrupt change and so the spectral ‘signs’ of an imminent seizure cannot occur early than a certain time. From another viewpoint, it may be advantageous to consider a successive prediction times showing the increase of spike numbers and the predominance of certain waves rather than others when approaching seizure onset. The common prediction features extracted from the analysis of FP1-F7 signal for both patients were mainly the increasing number of spikes of delta and theta waves.
This paper was devoted to characterize the time preceding seizure through the higher harmonic interaction. Approaching the seizure onset, the spectral composition of EEG signal undergoes quantitative changes which affect the amplitudes and the ranks of the spectral lines.
The progressive occurrence of lower order higher harmonics and the spikes of higher harmonics from the same range in the few minutes preceding the seizure are the common features that have been observed for two patients. Further work might involve spectral analysis based on several human subjects with underlying epilepsy seizure in order to broaden the scope of higher harmonic reorganization in descending order amplitudes to brain signals.
Acknowledgments
We thank Physionet.org for providing CHB-MIT Scalp EEG Database. References
[1] Fisher and et al., 2005 ”Epileptic seizures and epilepsy: definitions proposed by the International League Against Epilepsy (ILAE) and the International Bureau for Epilepsy (IBE),” Epilepsia, vol. 46, pp. 470-472.
[2] Fisher and et al., 2000.”The impact of epilepsy from the patient’s perspective I. Descriptions and subjective perceptions,” Epilepsy Res., vol. 41, pp. 39-51. [3] Lehnertz, K., et al. (2007). State-of-the-art of seizure prediction. J Clin Neurophysiology, 24,pp. 147-153. [4] Sivasankari N. and et al., 2010”An extensive review of significant researches on epileptic seizure detection and prediction using electroencephalographic signals,” Advances in Biomedical Research. pp330-353. [5] Mormann F. 2008. ”Seizure prediction,” Scholarpedia, vol. 3, no. 10,pp. 5770, 2008.
[6] R. Fonseca-Pinto, J.L. Ducla-Soares, F. Arajo, P. Aguiar, A. Andrade,’On the influence of time-series length in EMD to extract frequency content: Simulations and models in biomedical signals’ Medical Engineering & Physics 31 (2009) 713-719.
[7] Zine-Eddine Hadj Slimane, Amine Nat-Ali,’ QRS
0 200 400 600 800 1000 1200 1400 16000
5
10
15x 104
Windows number
high
er H
arm
onic
s am
plitu
des
HH amplitudes of FP1-F7 (1mn before Seizure Onset), IMF1 of ch02-19
HH81-100HH61-80HH1-60
0 200 400 600 800 1000 1200 1400 16000
0.5
1
1.5
2
2.5x 10⁵
Windows number
high
er H
arm
onic
s am
plitu
des
HH amplitudes of FP1-F7 (1mn before Seizure Onset), IMF2 of ch02-19
HH31-50HH1-30HH51-100
IJCSI International Journal of Computer Science Issues, Vol. 9, Issue 3, No 3, May 2012 ISSN (Online): 1694-0814 www.IJCSI.org 345
Copyright (c) 2012 International Journal of Computer Science Issues. All Rights Reserved.

complex detection using Empirical Mode Decomposition’, Digital Signal Processing 20 (2010) 1221-1228. [8] Manuel Blanco-Velasco, Binwei Weng , Kenneth E. Barner,’ECG signal denoising and baseline wander correction based on the empirical mode Computers in Biology and Medicine 38 (2008) 1 [9] Emran Mohammad Abu Anas, Soo Yeol Lee , Md. Kamrul Hasan, ’Exploiting correlation of ECG with certain EMD functions for discrimination of ventricular fibrillation’ Computers in Biology and Medicine 41 (2011) 110-114. [10] Espen Alexander Furst Ihlen,’A comparis Hilbert spectral analyses of heart rate variability’, Med Biol Eng. Comput(2009) 47:1035-1044. [11] Hualou Liang, Qiu-Hua Lin, and J. D. Z. Chen, ’Application of the Empirical Mode Decompositio the Analysis of Esophageal Manometric Dat Gastroesophageal Reflux Disease ’IEEE Transactions on Biomedical Engineering, Vol. 52, N. 10, October 2005. [12] Dibakar Ghosh, A. Roy Chowdhury, ’Various Types of Chaos Synchronization- a Comparative Study of Empirical Mode Decomposition and Wavelet Approach’ International Journal of Nonlinear Science Vol.4(2007) No.1,pp.52-66. [13] John I. Salisbury, and Ying Sun,’Assessment of Chaotic Parameters in Nonstationary Electrocardiograms by use of Empirical Mode Decomposition’, Annals of Biomedical Engineering, Vol. 32, No. 10, pp. 1348 1354, October 2004. [14] Khammari H., Mira C. and Carcasses,J.P., ’Behavior of harmonics generated by a Duffing type equation with a nonlinear damping’. Part I: Int. Journal of and Chaos, Vol. 15, N10, pp. 3181-3221, 2005. [15] Khammari H.,’A New Spectral Based Characterization of Electrocardiogram Signals in Sudden Cardiac IJCSI International Journal of Computer Science Issues. 9(2): (2012). [16] Goldberger AL, Amaral LAN, Glass L, Hausdorff JM,
Ivanov PCh, Mark RG, Mietus JE, Moody GB, Peng C-K, Stanley HE. PhysioBank, PhysioToolkit, and PhysioNet: Components of a New Research Resource for Complex Physiologic Signals. Circulation 101(23):e215-e220 [Circulation Electronic Pages; http://circ.ahajournals.org/cgi/content/full/101/23/e215 2000 (June 13).
[17] D. K. Ravish and S. Shenbaga Devi ,’Automated Seizure Detection and Spectral Analysis of EEG Seizure Time Series European Journal of Scientific
Research ISSN 1450-216X Vol.68 No.1 (2012), pp. 72-82.
[18] Tianqiao Zhu ,Liyu Huang and Xuzi Tian, ‘ Seizure Prediction by Using Empirical Mode Decomposition and Complexity’, 2nd International Conference on Biomedical Engineering and Informatics 2009. BMEI '09. Tianjin, China.
tection using Empirical Mode Processing 20 (2010)
Velasco, Binwei Weng , Kenneth E. ising and baseline wander
tion based on the empirical mode decomposition’, Biology and Medicine 38 (2008) 1 - 13.
Emran Mohammad Abu Anas, Soo Yeol Lee , Md. on of ECG with
tions for discrimination of ventricular Biology and Medicine 41
Espen Alexander Furst Ihlen,’A comparison of two variability’, Med
1044. in, and J. D. Z. Chen,
tion of the Empirical Mode Decomposition to Esophageal Manometric Data in
ease ’IEEE Transactions on N. 10, October 2005.
Dibakar Ghosh, A. Roy Chowdhury, ’Various Types of a Comparative Study of
composition and Wavelet Nonlinear Science
un,’Assessment of Chaotic Electrocardiograms by use
Mode Decomposition’, Annals of 32, No. 10, pp. 1348-
Khammari H., Mira C. and Carcasses,J.P., ’Behavior of generated by a Duffing type equation with a
Journal of Bifurcation 3221, 2005.
A New Spectral Based Characterization lectrocardiogram Signals in Sudden Cardiac Death
f Computer Science
Goldberger AL, Amaral LAN, Glass L, Hausdorff JM, Ivanov PCh, Mark RG, Mietus JE, Moody GB, Peng
K, Stanley HE. PhysioBank, PhysioToolkit, and PhysioNet: Components of a New Research Resource
Circulation e220 [Circulation Electronic Pages;
http://circ.ahajournals.org/cgi/content/full/101/23/e215];
D. K. Ravish and S. Shenbaga Devi ,’Automated nd Spectral Analysis of EEG
Seizure Time Series European Journal of Scientific 216X Vol.68 No.1 (2012), pp.
Xuzi Tian, ‘Epileptic Using Empirical Mode
2nd International Biomedical Engineering and Informatics,
[19] Azadeh Kamali Tafreshi, Ali M Nasrabadi Omidvarnia, ‘Empirical mode decomposition in epileptic seizure prediction’, Proceedings of the 8th IEEE International Symposium on Signal Processing and Information Technology ISSPIT 2008 [20] Sheng-Fu Liang, Hsu-ChuanWang, ‘Combination of EEG Complexity and Spectral Analysis For Epilepsy Diagnosis and Seizure Detection EURASIP Journal on Advances in Signal Processing Volume 2010, Article ID 853434, 15 pages [21] Jing Xiang et al., ‘Frequency and spa of high-frequency neuromagnetic epilepsy’, Epileptic Disord 2009; 11 (2): 113
Dr. Hedi Khammarihis PhD degree in ElectricalEngineering from NationalSchool of Engineering, Tunis University in 1999he is an Associatecollege of computers and Information Technology, Taif University. His researchinterests are mainly in the area of nonlinear dynamics anapplication of in the field of communication,electric systems andbioinformatics.
Dr. Ashraf AnwarPhD degree in Electronics and Electrical Communication from Faculty of Engineering, Cairo University in 2005. Currently, he is an Assistant Professor at college of computers and Information Technology, Taif University. His research interests are mainly in the area of tracking system, control, and robotics.
Ali M Nasrabadi, Amir H Empirical mode decomposition in
Proceedings of the 8th International Symposium on Signal Processing
and Information Technology ISSPIT 2008 (2008). ChuanWang, andWan-Lin Chang
Combination of EEG Complexity and Spectral Analysis Epilepsy Diagnosis and Seizure Detection’,
EURASIP Journal on Advances in Signal Processing Volume 2010, Article ID 853434, 15 pages
Frequency and spatial characteristics frequency neuromagnetic signals in childhood
Epileptic Disord 2009; 11 (2): 113-25.
Dr. Hedi Khammari received his PhD degree in Electrical Engineering from National School of Engineering, Tunis University in 1999. Currently, he is an Associate Professor at college of computers and Information Technology, Taif University. His research interests are mainly in the area of nonlinear dynamics and the application of nonlinear theory in the field of communication, electric systems and bioinformatics.
Dr. Ashraf Anwar received his PhD degree in Electronics and Electrical Communication from Faculty of Engineering, Cairo University in 2005. Currently, he is an Assistant Professor at college of computers and Information Technology, Taif University. His research
are mainly in the area of tracking system, control, and
IJCSI International Journal of Computer Science Issues, Vol. 9, Issue 3, No 3, May 2012 ISSN (Online): 1694-0814 www.IJCSI.org 346
Copyright (c) 2012 International Journal of Computer Science Issues. All Rights Reserved.