Embed Size (px)
Citation preview
Controlled-Release of Tegretol-XR for
Treatment of Epileptic Seizures
BEE 4530: Computer Aided Engineering: Applications to Biomedical Processes
By:
Tracy Cheung
Laura Autumn Floyd
Sunmin Kim
Anthony Velott
Table of Contents
1. Executive Summary ................................................................................................................ 1
2. Introduction ............................................................................................................................. 2
3. Design Objectives ................................................................................................................... 3
3.1 Problem Schematic ......................................................................................................... 3
4. Results and Discussion ........................................................................................................... 4
4.1 Accuracy Check .............................................................................................................. 6
4.2 Sensitivity Analysis ........................................................................................................ 7
5. Conclusion and Design Recommendations .......................................................................... 11
Appendix A: Mathematical Statement of the Problem ................................................................. 12
Appendix B: Solution Strategy ..................................................................................................... 14
Appendix C: Additional visuals .................................................................................................... 16
Appendix D: References ............................................................................................................... 18
-1-
1. Executive Summary
Fifty million people around the world are currently affected by epilepsy. Fortunately, the disease
responds to treatment 70% of the time, but many of the medications prescribed require multiple
dosages per day. To ensure patient compliance, prevent adverse consequences due to missed
dosing, and to enhance medicative convenience for the patient, Tegretol has engineered as
extended-release pill, Tegretol-XR, which delivers carbamazepine at a nearly constant rate for a
twelve hour time period. The design of these tablets involves a drug infused matrix surrounded
by an insoluble shell, with a small orifice to allow drug release. When water diffuses through the
orifice, the interior pill matrix saturates, and carbamazepine begins to elute out of the orifice
until depletion, a process that is designed to take twelve hours.
Using COMSOL, a Tegretol-XR tablet was modeled as a 2D rectangular, axisymmetrical slab.
Researched diffusivity constants were found to precisely model the water and drug flow into and
out of the pills. The diffusion of the drug is coupled with the concentration of water, and as the
water infuses into the pill, the diffusivity of the drug is altered, ultimately leading to a sustained
release of carbamazepine over the allotted twelve hours. Results from our model indicate that
drug release closely follows ideal release kinetics and keeps an ample amount of drug in the
bloodstream at all times. It was found that altering the orifice size by 5% resulted in changes of
up to 16% in final average drug concentration, implicating that this is the most sensitive variable
analyzed. Variables like water diffusivity were much less influential to the final solution. Our
model of Tegretol-XR gives epileptic patients the option of taking only two pills a day, and thus,
significantly lowers the risk of a missed dose.
-2-
2. Introduction
Epilepsy has afflicted human beings for thousands of years and has been acknowledged in even
the earliest medical writings. Despite its long-standing presence, the disease generated much
controversy – with people in the late 1400s citing the appearance of seizures as a way of
identifying witches. Some states even required sterilization for all epileptic patients during the
early 1900s. After much attention and debate, it was finally understood that epilepsy is a group
of disorders that occurs as a result of seizures that temporarily impair brain function. Seizures
can alter consciousness, sensation, and behavior [1].
Epilepsy currently affects approximately 50 million people in the world. Approximately 90% of
these people are from developing regions. While 70% of epilepsy cases respond to treatments,
about 75% of people in developing regions never receive this treatment [2]. Additionally, the
compliance rates for three-times-a-day and four-times-a-day dosing are 75% and 50%
respectively, leading to patients missing doses, which could lead to fatal consequences [2]. An
anti-convulsant, carbamazepine is taken by epileptic patients to control their seizures. While
many brands exist, few address the problem that these pills must be taken 3 or 4 times a day.
The leading brand of carbamazepine in the United States is Tegretol. The brand‟s extended-
release tablets, denoted by an „XR‟, eliminate the need to take multiple pills in one day and thus
significantly lower the risk of a missed dose. The XR tablets work by using diffusion of water
and carbamazepine through a small hole in the tablets. When water enters the tablet, it
determines the rate of carbamazepine diffusion out of the hole, and this diffusion can be
sustained for long time periods. Using computer-aided engineering, we will be able to model
precisely the mechanism of how fluid enters the tablet‟s outer shell, causing the rate of drug
diffusion to change and ultimately leading to a sustained, controlled-release of carbamazepine
over an allotted period of time.
-3-
3. Design Objectives
We are interested in modeling the extended-release of 400mg of Tegretol-XR over a twelve hour
period. In order to optimize a controlled diffusion of the drug out of the pill, the rate of diffusion
of water through the pill‟s matrix must be determined. Once both diffusivities and their
relationship are ascertained, the mass transfer problem can be modeled over a twelve hour period
with COMSOL.
3.1 Problem Schematic
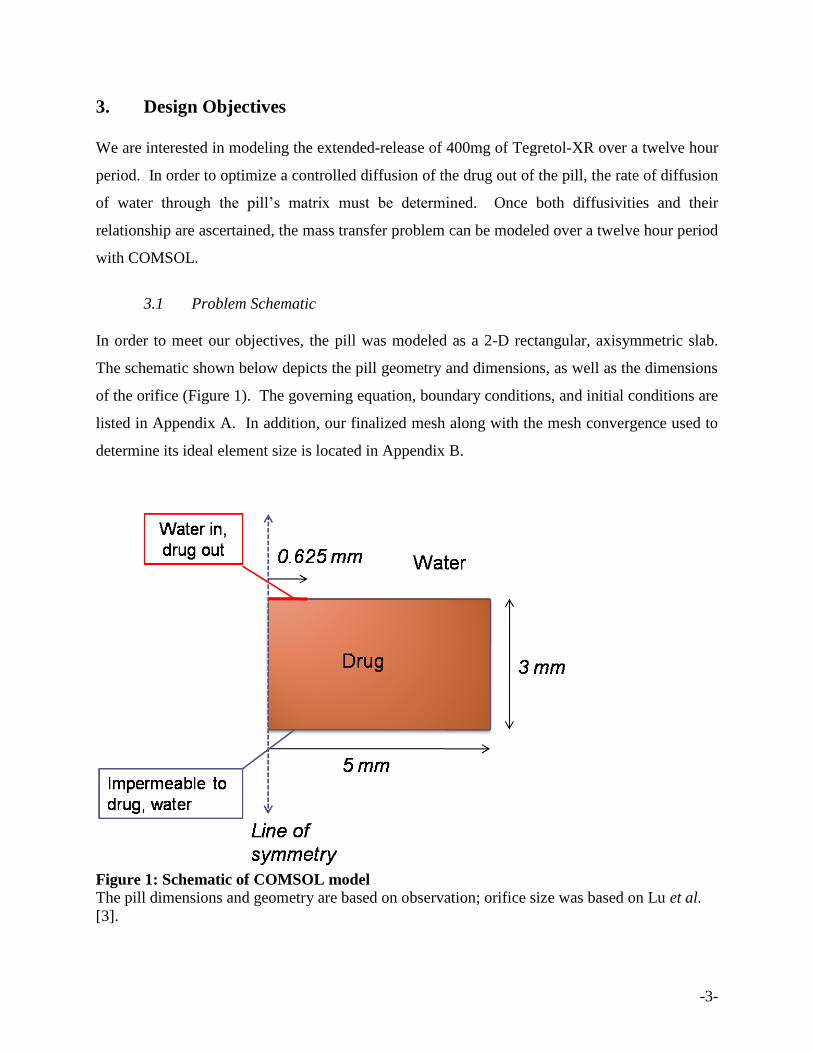
In order to meet our objectives, the pill was modeled as a 2-D rectangular, axisymmetric slab.
The schematic shown below depicts the pill geometry and dimensions, as well as the dimensions
of the orifice (Figure 1). The governing equation, boundary conditions, and initial conditions are
listed in Appendix A. In addition, our finalized mesh along with the mesh convergence used to
determine its ideal element size is located in Appendix B.
Figure 1: Schematic of COMSOL model The pill dimensions and geometry are based on observation; orifice size was based on Lu et al.
[3].
-4-
4. Results and Discussion
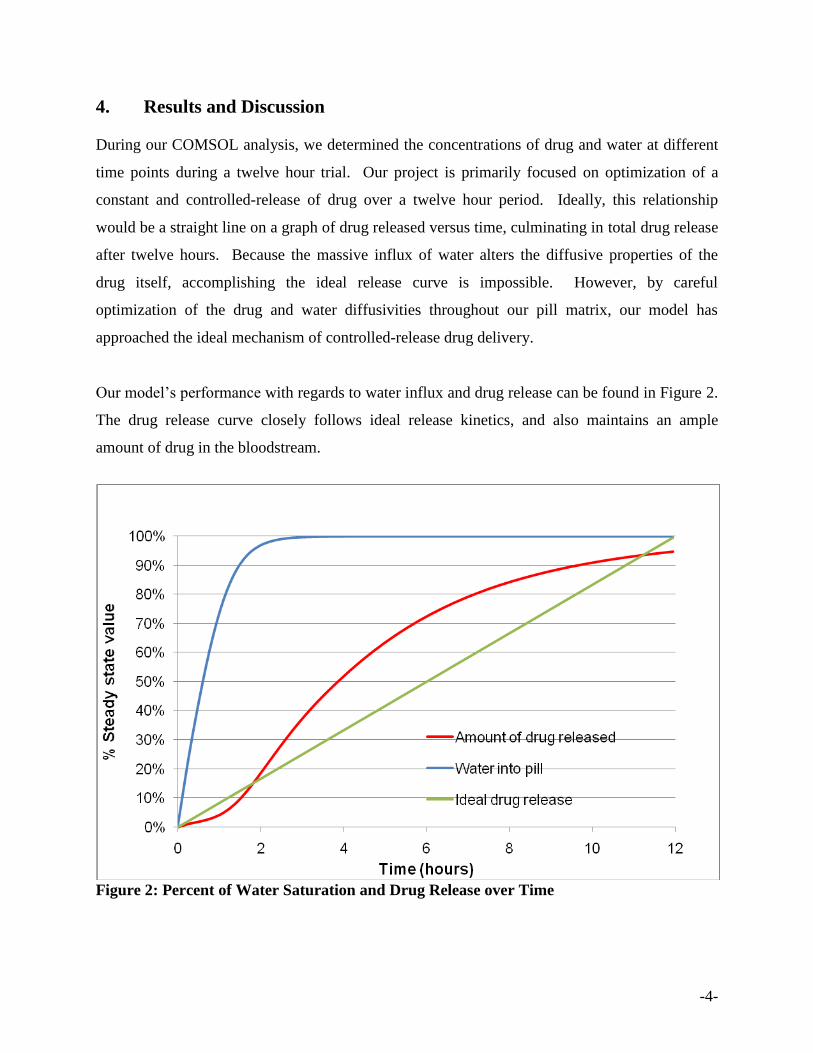
During our COMSOL analysis, we determined the concentrations of drug and water at different
time points during a twelve hour trial. Our project is primarily focused on optimization of a
constant and controlled-release of drug over a twelve hour period. Ideally, this relationship
would be a straight line on a graph of drug released versus time, culminating in total drug release
after twelve hours. Because the massive influx of water alters the diffusive properties of the
drug itself, accomplishing the ideal release curve is impossible. However, by careful
optimization of the drug and water diffusivities throughout our pill matrix, our model has
approached the ideal mechanism of controlled-release drug delivery.
Our model‟s performance with regards to water influx and drug release can be found in Figure 2.
The drug release curve closely follows ideal release kinetics, and also maintains an ample
amount of drug in the bloodstream.
Figure 2: Percent of Water Saturation and Drug Release over Time
-5-
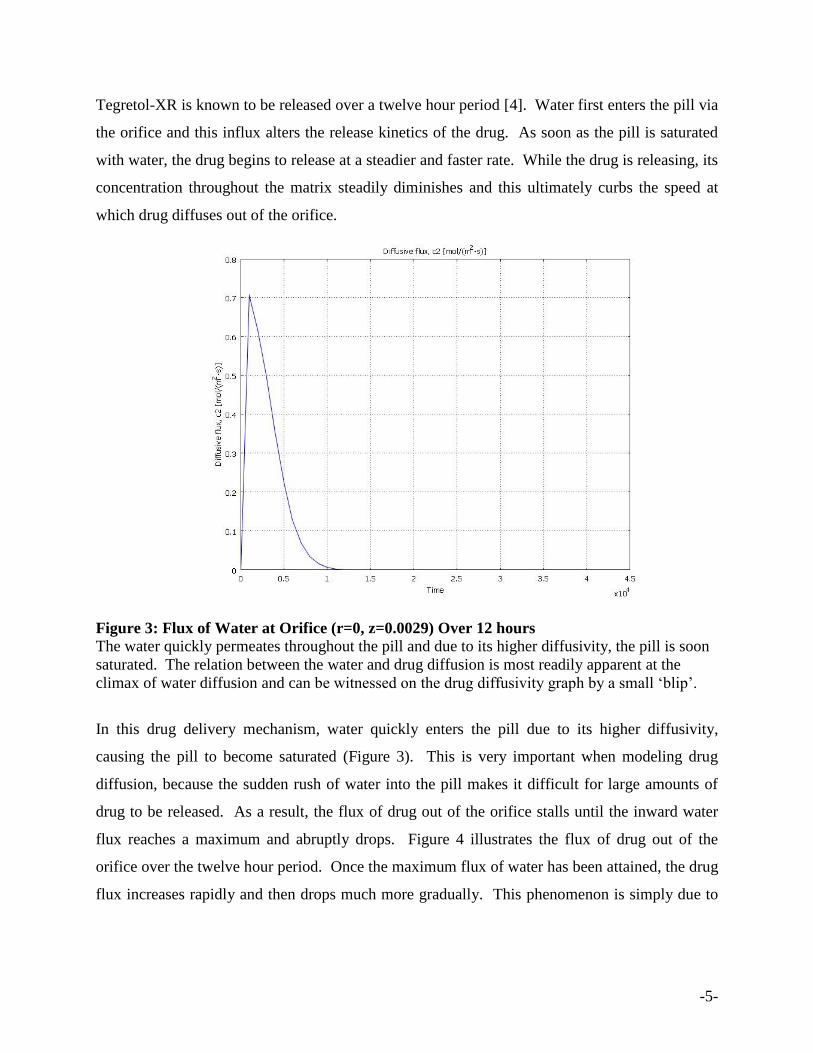
Tegretol-XR is known to be released over a twelve hour period [4]. Water first enters the pill via
the orifice and this influx alters the release kinetics of the drug. As soon as the pill is saturated
with water, the drug begins to release at a steadier and faster rate. While the drug is releasing, its
concentration throughout the matrix steadily diminishes and this ultimately curbs the speed at
which drug diffuses out of the orifice.
Figure 3: Flux of Water at Orifice (r=0, z=0.0029) Over 12 hours
The water quickly permeates throughout the pill and due to its higher diffusivity, the pill is soon
saturated. The relation between the water and drug diffusion is most readily apparent at the
climax of water diffusion and can be witnessed on the drug diffusivity graph by a small „blip‟.
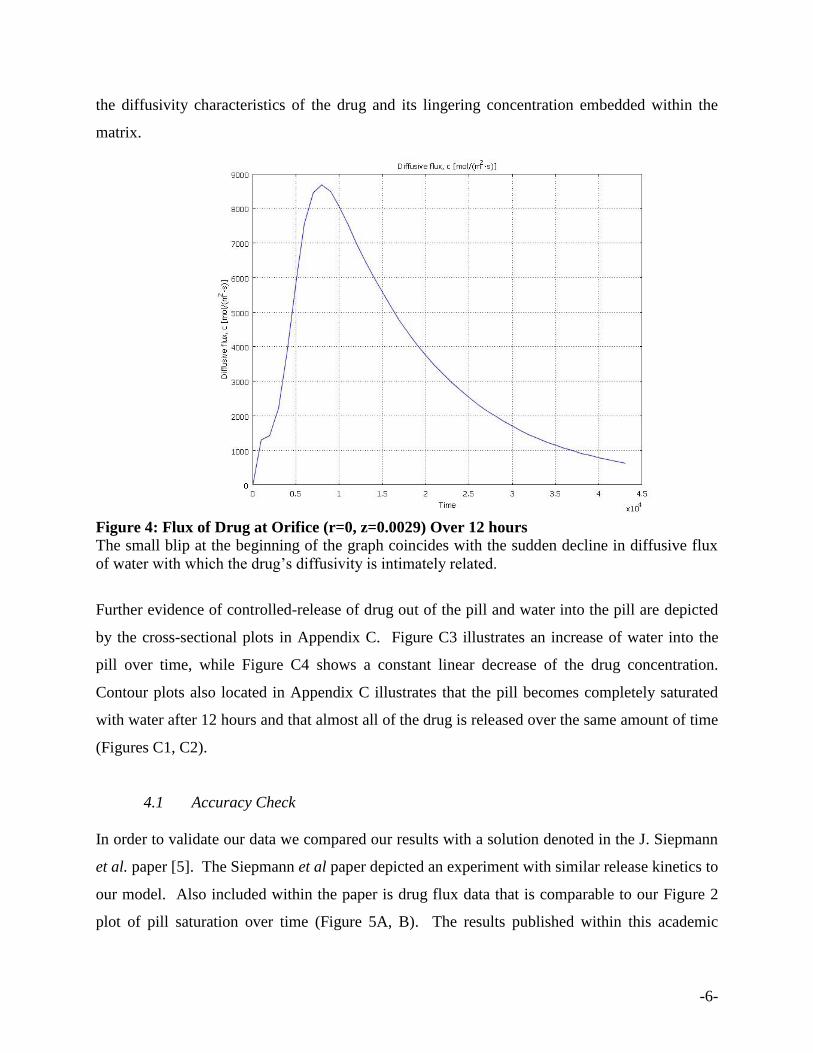
In this drug delivery mechanism, water quickly enters the pill due to its higher diffusivity,
causing the pill to become saturated (Figure 3). This is very important when modeling drug
diffusion, because the sudden rush of water into the pill makes it difficult for large amounts of
drug to be released. As a result, the flux of drug out of the orifice stalls until the inward water
flux reaches a maximum and abruptly drops. Figure 4 illustrates the flux of drug out of the
orifice over the twelve hour period. Once the maximum flux of water has been attained, the drug
flux increases rapidly and then drops much more gradually. This phenomenon is simply due to
-6-
the diffusivity characteristics of the drug and its lingering concentration embedded within the
matrix.
Figure 4: Flux of Drug at Orifice (r=0, z=0.0029) Over 12 hours
The small blip at the beginning of the graph coincides with the sudden decline in diffusive flux
of water with which the drug‟s diffusivity is intimately related.
Further evidence of controlled-release of drug out of the pill and water into the pill are depicted
by the cross-sectional plots in Appendix C. Figure C3 illustrates an increase of water into the
pill over time, while Figure C4 shows a constant linear decrease of the drug concentration.
Contour plots also located in Appendix C illustrates that the pill becomes completely saturated
with water after 12 hours and that almost all of the drug is released over the same amount of time
(Figures C1, C2).
4.1 Accuracy Check
In order to validate our data we compared our results with a solution denoted in the J. Siepmann
et al. paper [5]. The Siepmann et al paper depicted an experiment with similar release kinetics to
our model. Also included within the paper is drug flux data that is comparable to our Figure 2
plot of pill saturation over time (Figure 5A, B). The results published within this academic
-7-
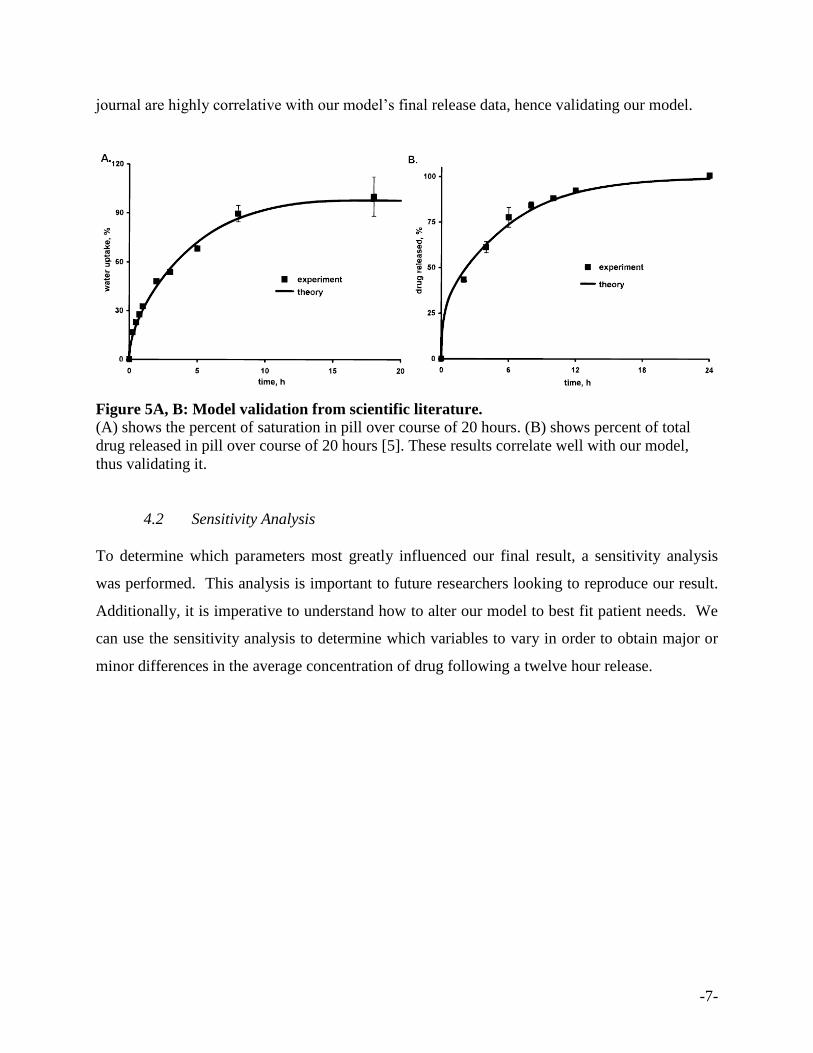
journal are highly correlative with our model‟s final release data, hence validating our model.
Figure 5A, B: Model validation from scientific literature.
(A) shows the percent of saturation in pill over course of 20 hours. (B) shows percent of total
drug released in pill over course of 20 hours [5]. These results correlate well with our model,
thus validating it.
4.2 Sensitivity Analysis
To determine which parameters most greatly influenced our final result, a sensitivity analysis
was performed. This analysis is important to future researchers looking to reproduce our result.
Additionally, it is imperative to understand how to alter our model to best fit patient needs. We
can use the sensitivity analysis to determine which variables to vary in order to obtain major or
minor differences in the average concentration of drug following a twelve hour release.
-8-
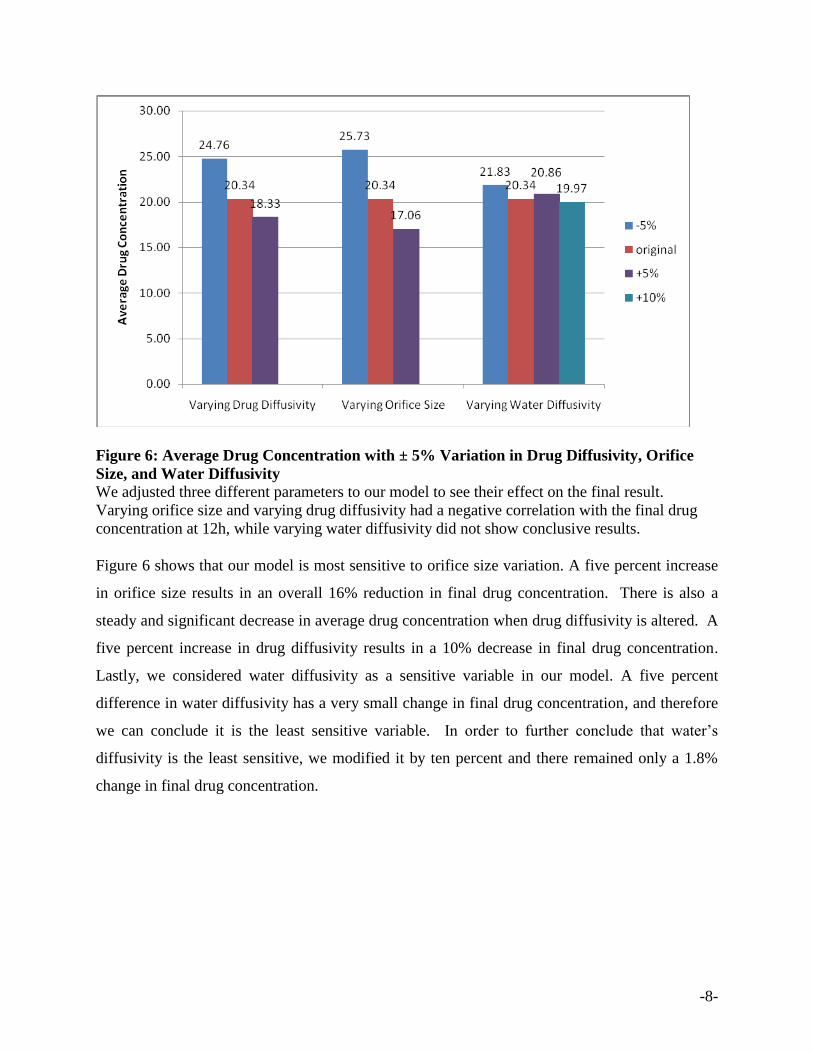
Figure 6: Average Drug Concentration with ± 5% Variation in Drug Diffusivity, Orifice
Size, and Water Diffusivity
We adjusted three different parameters to our model to see their effect on the final result.
Varying orifice size and varying drug diffusivity had a negative correlation with the final drug
concentration at 12h, while varying water diffusivity did not show conclusive results.
Figure 6 shows that our model is most sensitive to orifice size variation. A five percent increase
in orifice size results in an overall 16% reduction in final drug concentration. There is also a
steady and significant decrease in average drug concentration when drug diffusivity is altered. A
five percent increase in drug diffusivity results in a 10% decrease in final drug concentration.
Lastly, we considered water diffusivity as a sensitive variable in our model. A five percent
difference in water diffusivity has a very small change in final drug concentration, and therefore
we can conclude it is the least sensitive variable. In order to further conclude that water‟s
diffusivity is the least sensitive, we modified it by ten percent and there remained only a 1.8%
change in final drug concentration.
-9-
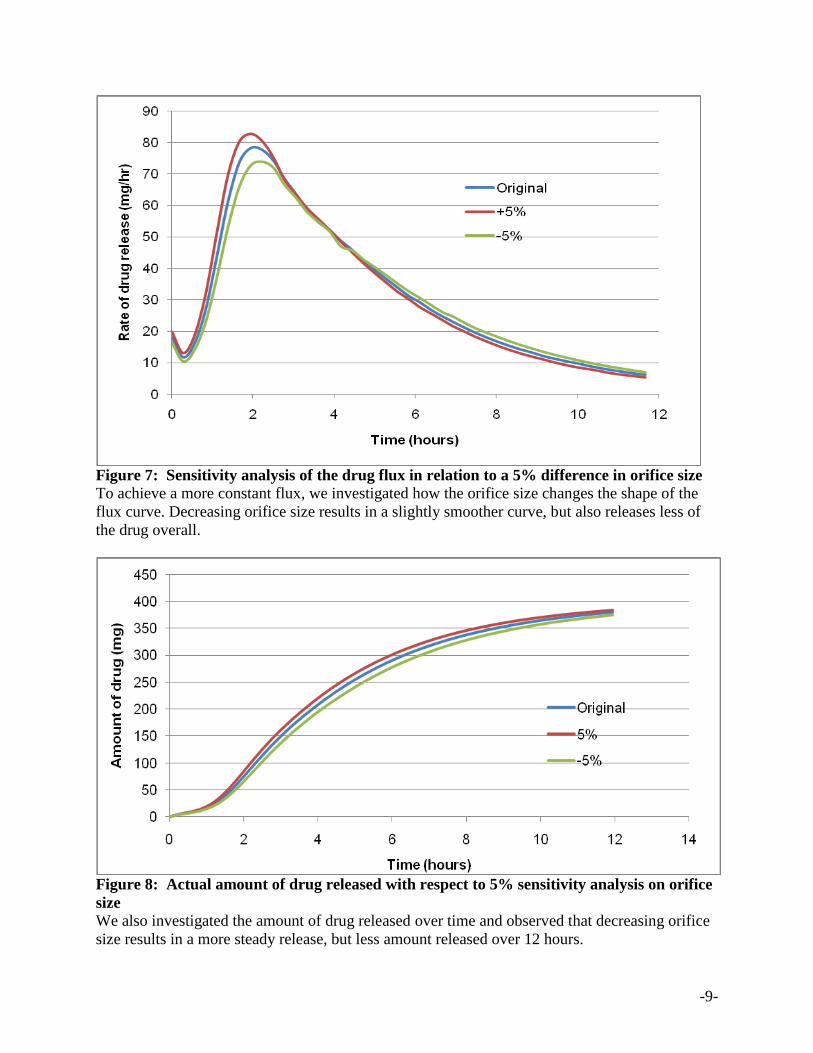
Figure 7: Sensitivity analysis of the drug flux in relation to a 5% difference in orifice size
To achieve a more constant flux, we investigated how the orifice size changes the shape of the
flux curve. Decreasing orifice size results in a slightly smoother curve, but also releases less of
the drug overall.
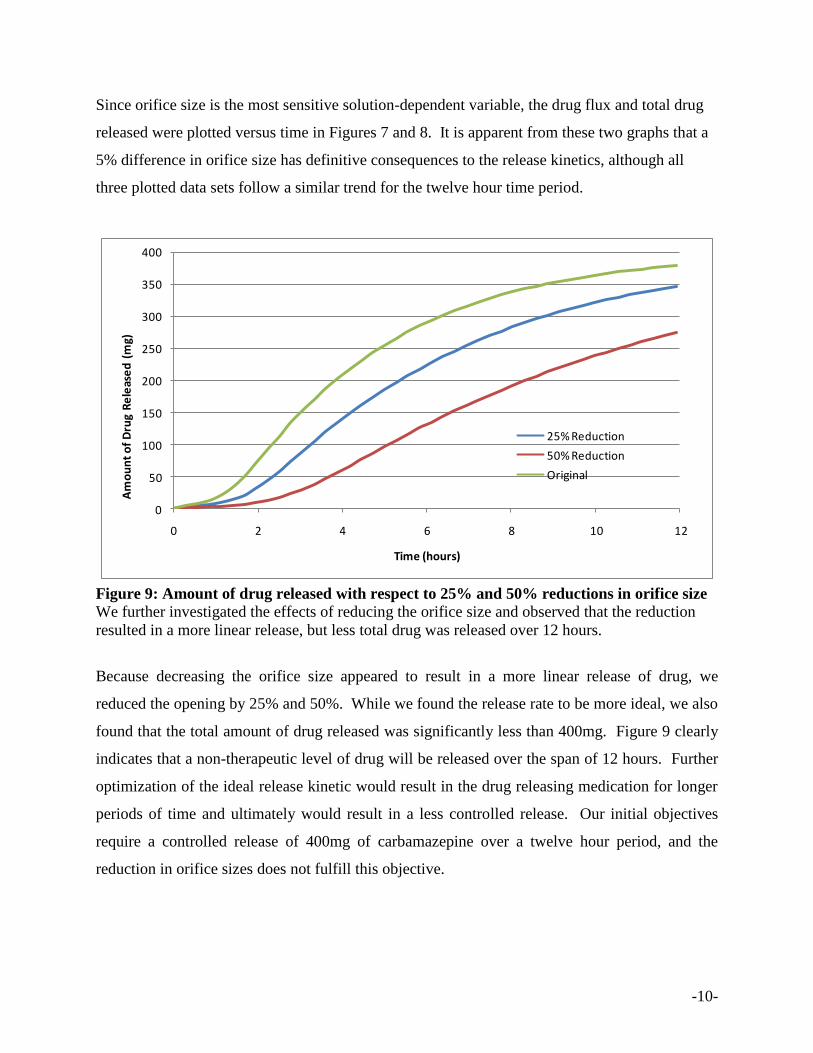
Figure 8: Actual amount of drug released with respect to 5% sensitivity analysis on orifice
size
We also investigated the amount of drug released over time and observed that decreasing orifice
size results in a more steady release, but less amount released over 12 hours.
-10-
Since orifice size is the most sensitive solution-dependent variable, the drug flux and total drug
released were plotted versus time in Figures 7 and 8. It is apparent from these two graphs that a
5% difference in orifice size has definitive consequences to the release kinetics, although all
three plotted data sets follow a similar trend for the twelve hour time period.
0
50
100
150
200
250
300
350
400
0 2 4 6 8 10 12
Am
ou
nt
of
Dru
g R
ele
ase
d (
mg)
Time (hours)
25% Reduction
50% Reduction
Original
Figure 9: Amount of drug released with respect to 25% and 50% reductions in orifice size
We further investigated the effects of reducing the orifice size and observed that the reduction
resulted in a more linear release, but less total drug was released over 12 hours.
Because decreasing the orifice size appeared to result in a more linear release of drug, we
reduced the opening by 25% and 50%. While we found the release rate to be more ideal, we also
found that the total amount of drug released was significantly less than 400mg. Figure 9 clearly
indicates that a non-therapeutic level of drug will be released over the span of 12 hours. Further
optimization of the ideal release kinetic would result in the drug releasing medication for longer
periods of time and ultimately would result in a less controlled release. Our initial objectives
require a controlled release of 400mg of carbamazepine over a twelve hour period, and the
reduction in orifice sizes does not fulfill this objective.
-11-
5. Conclusion and Design Recommendations
The goal of this project was to model the anti-convulsant drug release from an extended-release
Tegretol pill. For this tablet, the drug is eluted from the pill by osmotic pressure from water
saturation. We modeled this by using a drug diffusion rate that was inherently related to the
instantaneous water concentration. Due to a large water diffusivity value, water saturated the pill
swiftly and this led to a steady release of Tegretol-XR over a twelve hour period, confirming the
controlled-release mechanism of our pill. Sensitivity analysis performed at the conclusion of our
experiment indicated that drug diffusivity and orifice size are the most sensitive variables in our
model. Furthermore, the water diffusivity was determined to be the least sensitive variable, and
did not have an overtly substantial effect on final drug concentration. While decreased orifice
size did indeed result in a more steady release, it did not fulfill our design objective. Using an
orifice size of 1.25 mm results in the most ideal release of 400mg of carbamazepine over a
twelve hour period. Since this is our primary objective, further reduction of orifice size is
deemed unnecessary.
In order to design the ideal extended-release anti-convulsant pill for epileptic patients, many
factors must be taken into account. The pill must be manufactured and tested so that controlled-
release is an attainable goal. According to our sensitivity analysis, manufacturability issues
when drilling the small opening are very important. The orifice must be made a specific size in
order to not heavily influence the amount of drug released. Also, it is very important that the
patient does not chew the pill, which would completely ruin the extended-release mechanism.
The biological implications of ingesting a drug that stays in the bloodstream for a long period of
time must also be investigated.
Based on our analysis of Tegretol-XR, we find that this brand succeeds in achieving a controlled-
release of therapeutic levels of carbamazepine into the human body. While decreasing the
orifice size results in a more linear release of drug, the total amount of drug released also
becomes significantly less. Taking these factors into account, we suggest that Tegretol-XR
retain its specific orifice size because therapeutic levels of drug are maintained in the body at all
times, even though a constant rate of release is not achieved.
-12-
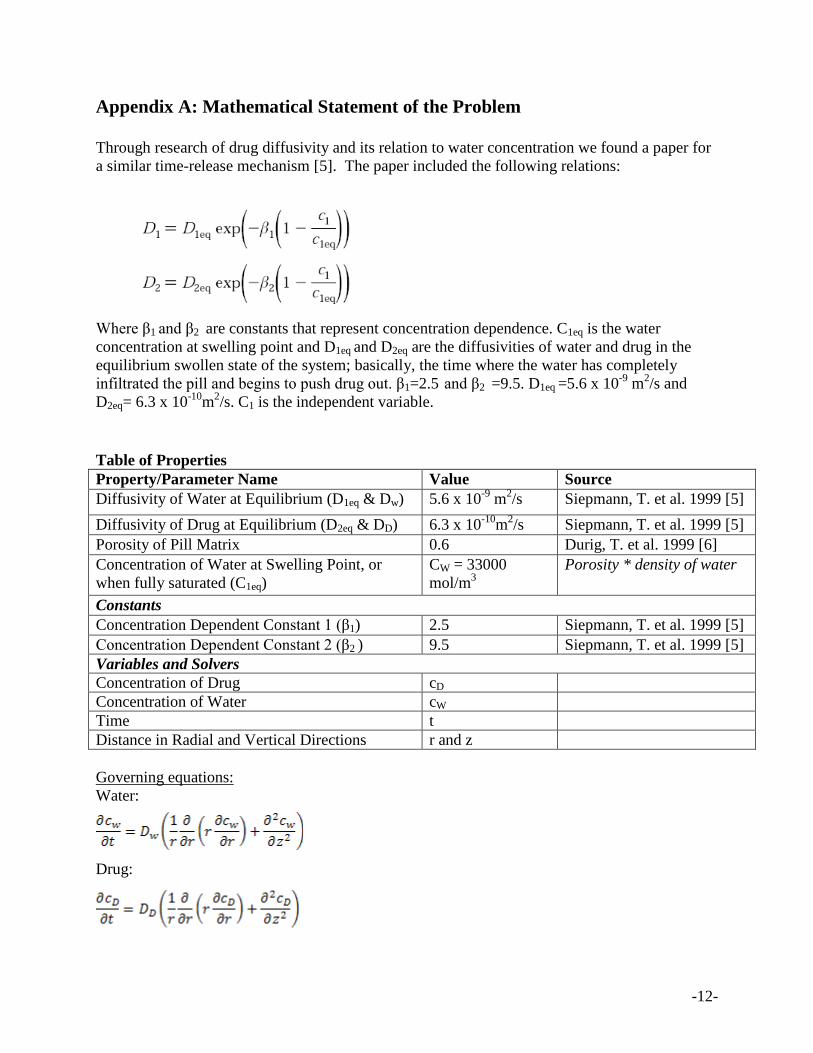
Appendix A: Mathematical Statement of the Problem
Through research of drug diffusivity and its relation to water concentration we found a paper for
a similar time-release mechanism [5]. The paper included the following relations:
Where β1 and β2 are constants that represent concentration dependence. C1eq is the water
concentration at swelling point and D1eq and D2eq are the diffusivities of water and drug in the
equilibrium swollen state of the system; basically, the time where the water has completely
infiltrated the pill and begins to push drug out. β1=2.5 and β2 =9.5. D1eq =5.6 x 10⁻⁹
m2/s and
D2eq= 6.3 x 10⁻¹⁰
m2/s. C1 is the independent variable.
Table of Properties
Property/Parameter Name Value Source
Diffusivity of Water at Equilibrium (D1eq & Dw) 5.6 x 10⁻⁹
m2/s Siepmann, T. et al. 1999 [5]
Diffusivity of Drug at Equilibrium (D2eq & DD) 6.3 x 10⁻¹⁰
m2/s Siepmann, T. et al. 1999 [5]
Porosity of Pill Matrix 0.6 Durig, T. et al. 1999 [6]
Concentration of Water at Swelling Point, or
when fully saturated (C1eq)
CW = 33000
mol/m3
Porosity * density of water
Constants
Concentration Dependent Constant 1 (β1) 2.5 Siepmann, T. et al. 1999 [5]
Concentration Dependent Constant 2 (β2 ) 9.5 Siepmann, T. et al. 1999 [5]
Variables and Solvers
Concentration of Drug cD
Concentration of Water cW
Time t
Distance in Radial and Vertical Directions r and z
Governing equations:
Water:
Drug:
-13-
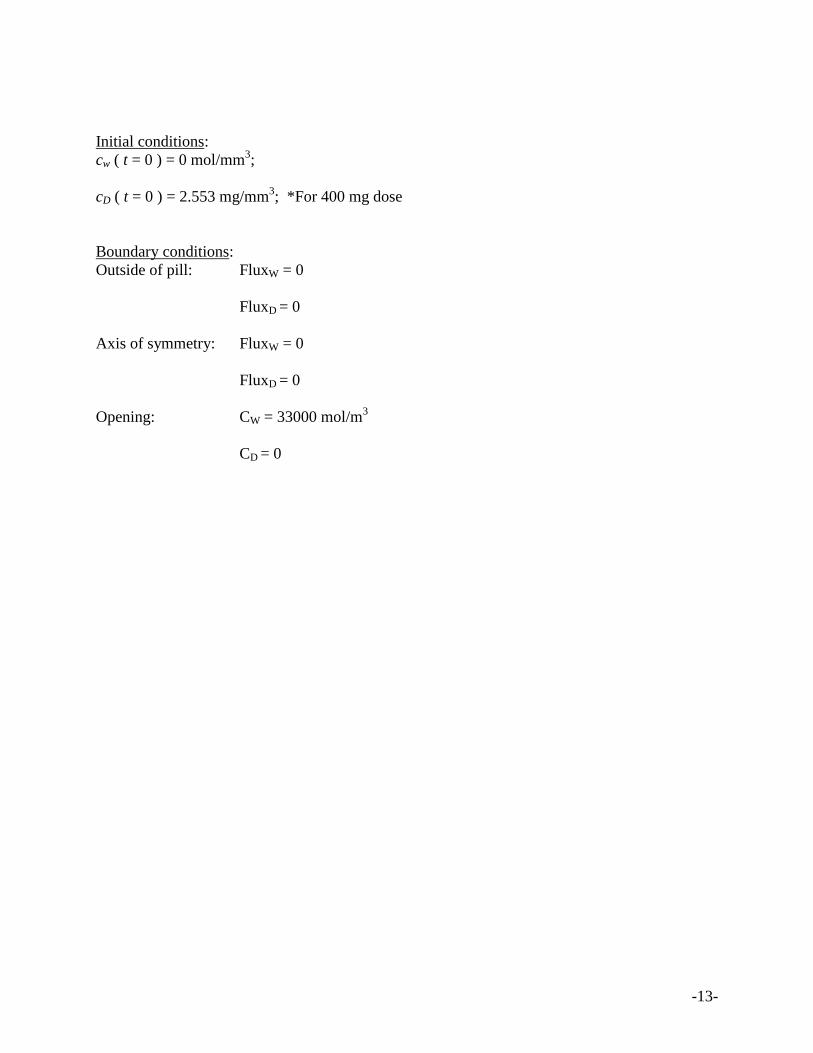
Initial conditions:
cw ( t = 0 ) = 0 mol/mm3;
cD ( t = 0 ) = 2.553 mg/mm3; *For 400 mg dose
Boundary conditions:
Outside of pill: FluxW = 0
FluxD = 0
Axis of symmetry: FluxW = 0
FluxD = 0
Opening: CW = 33000 mol/m3
CD = 0
-14-
Appendix B: Solution Strategy
Our problem was solved using the direct finite element method because our schematic has a
simple, 2D geometry and thus, does not require the iterative method.
For this problem, we used a constant time step of 1000 seconds to model water and drug
diffusion into and out of the pill. This was sufficient for modeling since we wanted to observe
the release of drug over an extended period of time.
The transient nature of this problem led COMSOL to use both a relative and absolute tolerance.
We used the default value of 0.01 for relative tolerance and 0.0010 for the absolute tolerance.
Given that our problem was not exceptionally complex, the default COMSOL values were
sufficient for modeling release of carbamazepine from the pill.
A 1D, 2-noded element was used for the mesh. Figures B1 and B2 below illustrate the final
mesh used as well as the mesh convergence.
-15-
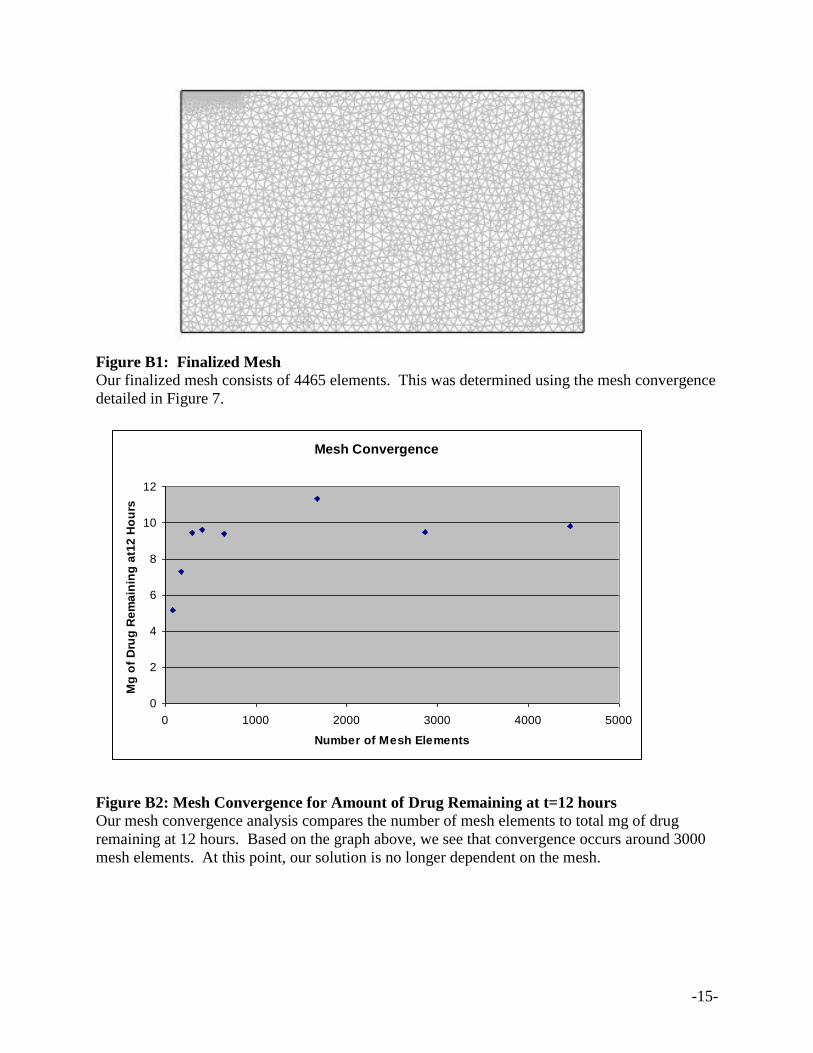
Figure B1: Finalized Mesh
Our finalized mesh consists of 4465 elements. This was determined using the mesh convergence
detailed in Figure 7.
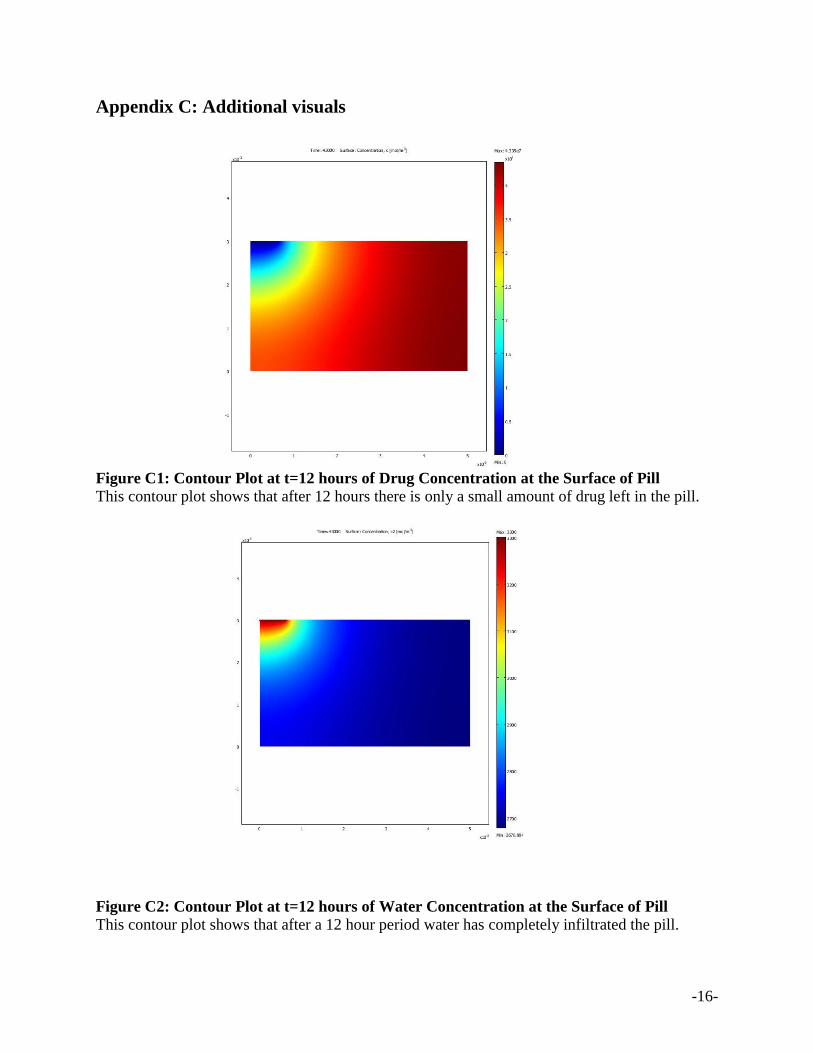
Figure B2: Mesh Convergence for Amount of Drug Remaining at t=12 hours
Our mesh convergence analysis compares the number of mesh elements to total mg of drug
remaining at 12 hours. Based on the graph above, we see that convergence occurs around 3000
mesh elements. At this point, our solution is no longer dependent on the mesh.
Mesh Convergence
0
2
4
6
8
10
12
0 1000 2000 3000 4000 5000
Number of Mesh Elements
Mg
of
Dru
g R
em
ain
ing
at1
2 H
ou
rs
-16-
Appendix C: Additional visuals
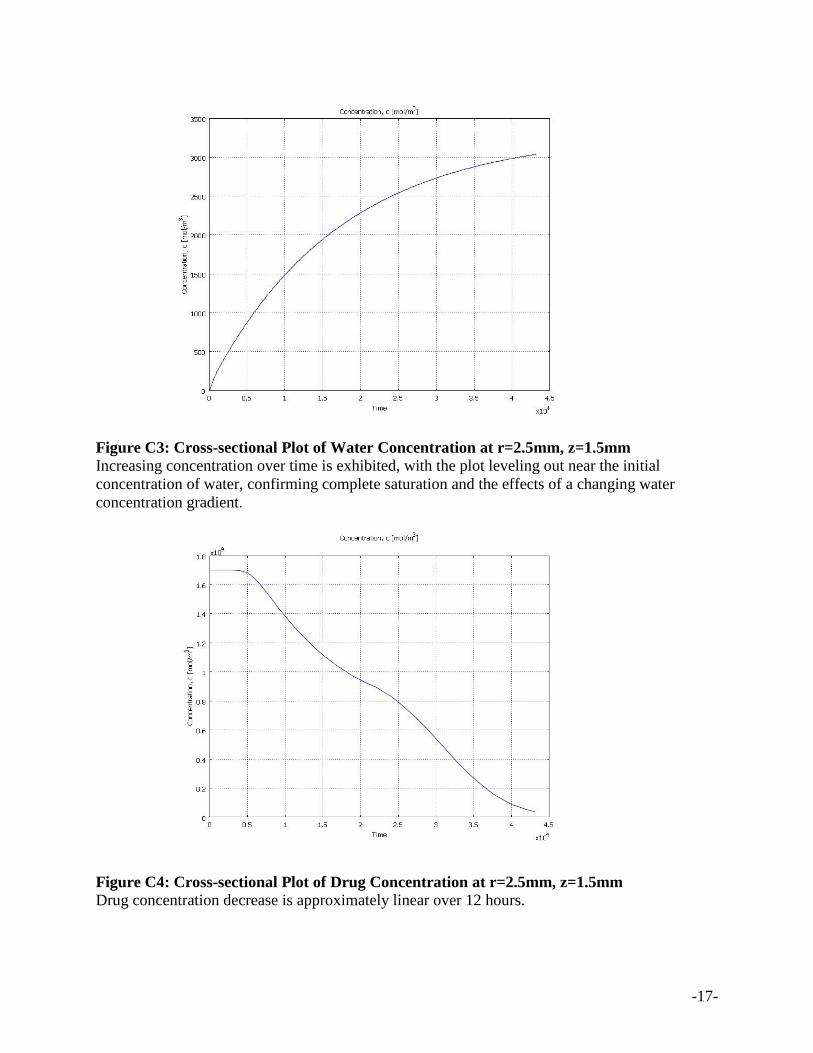
Figure C1: Contour Plot at t=12 hours of Drug Concentration at the Surface of Pill
This contour plot shows that after 12 hours there is only a small amount of drug left in the pill.
Figure C2: Contour Plot at t=12 hours of Water Concentration at the Surface of Pill
This contour plot shows that after a 12 hour period water has completely infiltrated the pill.
-17-
Figure C3: Cross-sectional Plot of Water Concentration at r=2.5mm, z=1.5mm
Increasing concentration over time is exhibited, with the plot leveling out near the initial
concentration of water, confirming complete saturation and the effects of a changing water
concentration gradient.
Figure C4: Cross-sectional Plot of Drug Concentration at r=2.5mm, z=1.5mm
Drug concentration decrease is approximately linear over 12 hours.
-18-
Appendix D: References
[1]. “Epilepsy.” World Health Organization. 2009. http://www.who.int/mediacentre/factshe
ets/fs999/en/index.html. [Accessed 6 April 2009].
[2]. “Epilepsy.com.” 2009. http://www.epilepsy.com/101/ep101_facts. [Accessed 6 April
2009].
[3]. Lu En-Xian, Jiang Zhi-Qiang, Zhang Qi-Zhi, Jiang Xin-Guo. 2003. “A water-insoluble
drug monolithic osmotic tablet system utilizing gum arabic as an osmotic, suspending and
expanding agent.”
[4]. “Tegretol-XR.” 2009. http://www.epilepsy.com/medications/b_tegretolxr_intro.
[Accessed 8 March 2009].
[5]. J. Siepmann, K. Podual, M. Sriwongjanya, N. A. Peppas, R. Bodmeier. 1999 “A new
model describing the swelling and drug release kinetics from hydroxypropyl methylcellulose
tablets.”
[6]. Durig T., Venkatesh G.M., Fassihi R. 1999. “An investigation into the erosion behaviour
of a high drug-load (85%) particulate system designed for an extended-release matrix tablet.
Analysis of erosion kinetics in conjunction with variations in lubrication, porosity and
compaction rate.”
[7]. Panomsuk Suwannee P., Hatanaka Tomomi, Aiba Tetsuya, Katayama Kazunori. 1995.
“Hydrophilic Cellulose Matrix.”


![EPI 2: First-line anti-epileptic medication for management ... · [2015] EPI 2: First-line anti-epileptic medication for management of acute convulsive seizures, when intravenous](https://img.pdfslide.us/doc/110x75/5f23ded294c053128d4015d3/epi-2-first-line-anti-epileptic-medication-for-management-2015-epi-2-first-line.jpg)