Embed Size (px)
Citation preview
A SPATIAL ANALYSIS OF DISSECTION INDEX IN VARAHA NADI WATERSHED USING GEOGRAPHIC INFORMATION SYSTEM
KEYWORDS Dissection Index, Relative relief, GIS, Fishnet, IDW
ORIGINAL RESEARCH PAPER GEOGRAPHY
1. INTRODUCTION Drainage dissection is a significant morphometric tool and an indicator for estimating the nature and magnitude of dissection in relation to vertical exaggeration of terrain. It is expressed as the ratio between the relative altitude and absolute height. It is dimensionless because it is expressed always in terms of ratio or percentage. e concept of relative relief and its importance become useless if the intensity of absolute altitude may not differ in nature and thus the dissection becomes meaningless because equal relative altitude are not always of equal importance since their absolute a altitude may differ.
According to Dove Nir, the concept of relative relief is not entirely a satisfactory criterion to analyse the nature of relief. Equal relative altitudes are not always of equal importance, since their absolute altitude may differ. e picture gained from relative altitude is static, for it fails to take into account the vertical distance from the erosion base.
In general, the values of dissection index are basically a ratio which range between 0 (%) and 1 (100%). But it cannot be absolute zero because no part of the earth is devoid of dissection except the surface which is permanently covered and protected with thick ice sheet and also it cannot be more than unity except in the case of vertical cliff. us, dissection index determines and discriminates the stages of cycle erosion and recites the history of terrain development. Generally, three groups of dissection index viz., (i) 0.0 – 0.1 or 1% to 10%, (ii) 0.2 – 0.3 or 2% to 30% and (iii) above 0.3 or 30% are closely related to penultimate or monadnock stage, equilibrium or mature stage and inequilibrium or youthful stage of cycle of erosion and terrain development (Govind Prasad).
2. OBJECTIVESe main aim of the present study is to analyse the dissection index of Varaha Nadi Watershed with the following objectives:
1. To find out dissection index of Varaha Nadi watershed. 2. To observe the relationship of dissection index with other terrain characteristics of the study area.
3. STUDY AREA° °e Varaha Nadi Watershed extends between 10 3'N to 10 15'4.N
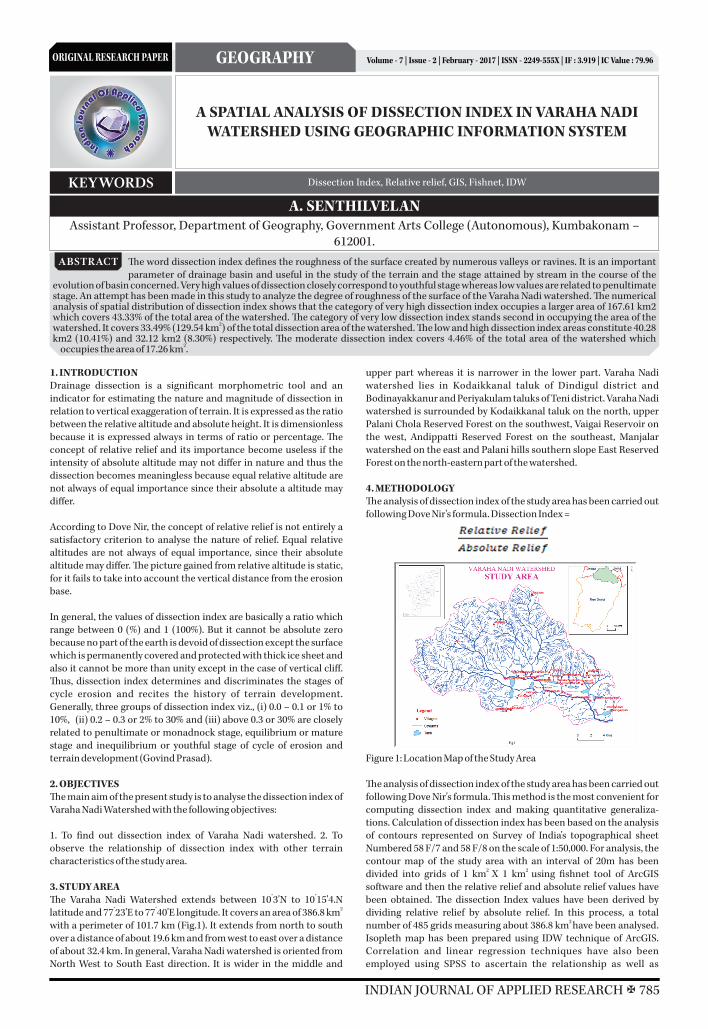
° ° 2latitude and 77 23'E to 77 40'E longitude. It covers an area of 386.8 km with a perimeter of 101.7 km (Fig.1). It extends from north to south over a distance of about 19.6 km and from west to east over a distance of about 32.4 km. In general, Varaha Nadi watershed is oriented from North West to South East direction. It is wider in the middle and
upper part whereas it is narrower in the lower part. Varaha Nadi watershed lies in Kodaikkanal taluk of Dindigul district and Bodinayakkanur and Periyakulam taluks of Teni district. Varaha Nadi watershed is surrounded by Kodaikkanal taluk on the north, upper Palani Chola Reserved Forest on the southwest, Vaigai Reservoir on the west, Andippatti Reserved Forest on the southeast, Manjalar watershed on the east and Palani hills southern slope East Reserved Forest on the north-eastern part of the watershed.
4. METHODOLOGYe analysis of dissection index of the study area has been carried out following Dove Nir's formula. Dissection Index =
Figure 1: Location Map of the Study Area
e analysis of dissection index of the study area has been carried out following Dove Nir's formula. is method is the most convenient for computing dissection index and making quantitative generaliza-tions. Calculation of dissection index has been based on the analysis of contours represented on Survey of India's topographical sheet Numbered 58 F/7 and 58 F/8 on the scale of 1:50,000. For analysis, the contour map of the study area with an interval of 20m has been
2 2 divided into grids of 1 km X 1 km using fishnet tool of ArcGIS software and then the relative relief and absolute relief values have been obtained. e dissection Index values have been derived by dividing relative relief by absolute relief. In this process, a total
2 number of 485 grids measuring about 386.8 km have been analysed. Isopleth map has been prepared using IDW technique of ArcGIS. Correlation and linear regression techniques have also been employed using SPSS to ascertain the relationship as well as
A. SENTHILVELANAssistant Professor, Department of Geography, Government Arts College (Autonomous), Kumbakonam –
612001.
Volume - 7 | Issue - 2 | February - 2017 | ISSN - 2249-555X | IF : 3.919 | IC Value : 79.96
e word dissection index defines the roughness of the surface created by numerous valleys or ravines. It is an important parameter of drainage basin and useful in the study of the terrain and the stage attained by stream in the course of the
evolution of basin concerned. Very high values of dissection closely correspond to youthful stage whereas low values are related to penultimate stage. An attempt has been made in this study to analyze the degree of roughness of the surface of the Varaha Nadi watershed. e numerical analysis of spatial distribution of dissection index shows that the category of very high dissection index occupies a larger area of 167.61 km2 which covers 43.33% of the total area of the watershed. e category of very low dissection index stands second in occupying the area of the
2watershed. It covers 33.49% (129.54 km ) of the total dissection area of the watershed. e low and high dissection index areas constitute 40.28 km2 (10.41%) and 32.12 km2 (8.30%) respectively. e moderate dissection index covers 4.46% of the total area of the watershed which
2occupies the area of 17.26 km .
ABSTRACT
INDIAN JOURNAL OF APPLIED RESEARCH X 785

association of dissection with other terrain parameters.
5. RESULT AND DISCUSSIONe analysis of the frequency distribution of dissection index (Table 1) reveals that very low category of dissection index occupies 39.79% of the total frequencies. e low dissection index group constitutes 5.57% whereas the moderate and high dissection areas occupy 4.74% and 11.34% of the total frequencies respectively. e very high dissection index is found to cover 38.56%.
e numerical analysis of areal distribution of dissection index (Table 2) shows that the category of very high dissection index
2occupies a larger area of 167.61 km which covers 43.33% of the total area of the watershed. e category of very low dissection index stands second in occupying the area of the watershed. It covers
233.49% (129.54 km ) of the total dissection area of the watershed. e 2low and high dissection index areas constitute 40.28 km (10.41%)
2 and 32.12 km (8.30%) respectively. e moderate dissection index covers 4.46% of the total area of the watershed which occupies the
2area of 17.26 km .
Table 1: Frequency Distribution of Dissection Index
e regional distribution of dissection index varies from north to south and east to west (Fig.2). It is ranging from 0 to 0.64 indicating the impact of slope, absolute relief and relative relief on dissection index. In general regional distribution is categorized as below.
3.3.1 Very Low 2e category of very low dissection index covers an area of 129.54 km
in the watershed. It occupies 33.49% of the total area of the watershed. e spatial distribution of dissection index reveals that this group of dissection index is mostly concentrated in the northwest, central, southeast and eastern part of the watershed.
Table 2: Dissection Index – Area Distribution
3.3.2 Low 2e low dissection index occupies an area of 4.28 km which accounts
for 10.41% of the total area of the watershed. It is found in the central part along the borders of very low category. is category of dissection index can also be visualized as small pockets in the southeast and eastern part of the watershed.
3.3.3 Moderate 2e area of moderate dissection constitutes 4.46% (17.26 km ) of the
total study area. e moderate category of dissection index is concentrated in the central, southeast and eastern part bordering the low dissection index group. is category can also be seen in the southeastern part of the watershed as a small patch amidst very low category of dissection index.
3.3.4 High 2e high dissection index area covers 32.12 Km (8.30%) of the total
area of the watershed. It is largely concentrated in the central part of the watershed in juxtaposition with moderate and very high categories of dissection index.
Figure 2: Spatial Distribution of Dissection Index
3.3.5 Very High 2e very high dissection index occupies the larger area of 167.61 km
which constitutes 43.33% of the total area of the study area. is classification of dissection index is found in the northeast, northwest, southwest and north central part of the watershed.
e relationship of dissection index with absolute relief, relative relief and slope has been established with correlation and regression analysis (Table 3). Dissection Index is positively correlated with slope at the significant level of 0.01 which means that there is a 1 in 100 probability (1%) that the resulting correlation happened by chance, and 99 in 100 probabilities (99%) that the correlation between dissection index and slope is a reliable finding.
Table: 3 Regression Analysis of Dissection Index with other variables
**Correlation is significant at the 0.01 level (2-tailed)
2It has an R value of 0.616 which means that 61.6% of variation in dissection is explained by slope. e linear relationship between these two variables is shown in figure 4. e regression equation which explains the variable Y is Y = 0.013 + 0.012X for slope as DI slope
independent variable. From this equation, we can explain the variable dissection when the X variable slope is known.
Figure 3: Dissection Index Vs Slope
e relationship between relative relief and dissection index shows a strong positive correlation with 67.7% of association. It is learnt from the result that the degree of dissection increases with the increase of relative relief. e linear relationship between these two variables is
ORIGINAL RESEARCH PAPER Volume - 7 | Issue - 2 | February - 2017 | ISSN - 2249-555X | IF : 3.919 | IC Value : 79.96
Class Interval Frequency Frequency (%) Categories<0.08 193 39.79 Very Low
0.08-0.16 27 5.57 Low0.16-0.24 23 4.74 Moderate0.24-0.32 55 11.34 High
>0.32 187 38.56 Very HighTotal 485 100
Class interval 2Area (km ) Area (%) Categories<0.08 129.54 33.49 Very Low
0.08-0.16 40.28 10.41 Low0.16-0.24 17.26 4.46 Moderate0.24-0.32 32.12 8.30 High
>0.32 167.61 43.33 Very HighTotal 386.81 100
�
Variables R 2R Adjusted 2R 'p' value
Slope **0.785 0.616 0.615 0.001Relative relief **0.823 0.677 0.677 0.001Absolute relief **0.480 0.230 0.228 0.001
�
786 X INDIAN JOURNAL OF APPLIED RESEARCH

shown in figure 4. e regression equation which explains the variable Y is Y = 0.074 + 0.001X for relative relief as independ-DI Relative Relief
ent variable. From this equation, we can explain the variable dissection when the X variable relative relief is known.
Figure 4: Dissection Index Vs Relative Relief
e dissection index and absolute relief have correlation coefficient of 0.480 which indicates that there is a meagre correlation and association between dissection index and absolute relief. It can also be clearly understood from the best fit line of linear regression shown in fig.5.
Figure 5: Dissection Index Vs Absolute Relief
2It has an R value of 0.228 which means that only 22.8% of variation in dissection is explained by absolute relief. e regression equation which explains the variable Y is Y = 0.110 + 0.000X for DI Absolute Relief
absolute relief as independent variable. From this equation, we can explain the variable dissection when the X variable absolute relief is known.
6. CONCLUSIONe following conclusions may be deduced from the quantitative analysis of dissection index of Varaha Nadi Watershed.
* It is observed from the analysis that the cycle of erosion has reached its penultimate stage in the eastern and south-eastern part of the watershed as most of these areas experience low dissection.
* It is learnt from the spatial distribution of dissection index that the western, northern, south-western parts of the watershed correspond to the youthful stage of cycle of erosion as very high dissection is found in these areas.
* It is inferred from the regression analysis that absolute relief has low relation and association with dissection index whereas the relationship between relative relief and dissection index shows a strong positive correlation with 67.7% of association. It is learnt from the result that the degree of dissection increases with the increase of relative relief.
* e dissection index and slope evince a positive correlation (0.785) at 0.01 significant levels although not a perfect one. e very steep slope and steep slope correspond to high dissection whereas level and gentle slope lead to low dissection.
REFERENCES:Chang Kang-tsung, (2013), “Introduction to Geographic Information Systems”, McGraw Hill Education (India), New Delhi.Monkhouse, F.J. and Wilkinson, H.R. (1963), “Maps and Diagrams”, Methuen & Co. Ltd., London. Nir Dove, (1957), “e ratio of relative and absolute altitude of Mt. Camel”, Geographical Review, 47, 564-569.Prasad Govind, (2007), “Trends and Techniques of Geomorphology”, Discovery Publishing House, New Delhi.Reddy et al., (1983), “Terrain analysis of the Swarnamukhi basin”, National Geography Journal of India, XXIX, 176-187.Singh, N.K.P. and Singh, C.P. (1994), “Slope Categories and Slope Development in South Mirzapur Region, U.P.”, 56(4), 1-13.Singh, S.B. (1967), “Slope Categories (Wentworth's Method) and Slope Development in the Simla Hills”, Himalayan Geology, 6.Singh, S.B. (1967), “Average Slope Analysis of Simla Hills”, e Geographical Viewpoint, 12-20.Singh, Savindra (1979), “A Morphological Study of Average Slopes of the Small Basins of the Ranchi Plateau, India”, National Geographer, 14(1), 35-34.Singh, Savindra (1982), “A Geomorphological Study of Slopes in the Adjoining Areas of Nagod”, National Geographer, XVII(2), 107-120.Smith, G.H. (1938), “e Morphometry of Landscape, An Analysis of Slope”, Annals, Association of American Geographers, 28, 63-64.Strahler, A.N. (1956), “Quantitative Slope Analysis”, Bulletin, Geological Society of America, 67, 571-96.Wentworth, C.K. (1930), “A Simplified Method of Determining the Average Slope of Land surfaces”, American Journal of Sciences, 20, 184-194.
�
�
1.
2.
3.
4.
5.
6.
7.
8.
9.
10.
11.
12.
13.
ORIGINAL RESEARCH PAPER Volume - 7 | Issue - 2 | February - 2017 | ISSN - 2249-555X | IF : 3.919 | IC Value : 79.96
INDIAN JOURNAL OF APPLIED RESEARCH X 787