Embed Size (px)
Citation preview

Int J Fract (2013) 184:171–183DOI 10.1007/s10704-013-9858-8
ORIGINAL PAPER
A solution to the parameter-identification conundrum:multi-scale interaction potentials
J. G. M. van Mier
Received: 30 October 2012 / Accepted: 19 March 2013 / Published online: 5 June 2013© Springer Science+Business Media Dordrecht 2013
Abstract Softening is a structural property, not amaterial property. Any material will show softening,but in this paper the focus is primarily on cementand concrete, which show this property very clearlyowing to their coarse heterogeneity (relative to com-mon laboratory-scale specimen sizes). A new modelapproach is presented, based on pair-potentials describ-ing the interaction between two neighbouring particlesat any desired size/scale level. Because of the resem-blance with a particle model an equivalent lattice canbe constructed. The pair-potential is then the behaviorallaw of a single lattice element. This relation betweenforce and displacement depends on the size of the con-sidered lattice element as well as on the rotationalstiffness at the nodes, which not only depends on theflexibility of the global lattice to which the element isconnected but also on the flexural stiffness of the con-sidered element itself. The potential F − r relation isa structural property that can be directly measured inphysical experiments, thereby solving size effects andboundary effects.
Keywords Concrete · Fracture · Model parameters ·Interaction potentials (F − δ) · Size effect ·Asymptotic behaviour
J. G. M. van MierSwiss Federal Institute of Technology(ETH Zurich),8093 Zurich, Switzerlande-mail:[email protected]
1 Introduction
A reliable model for fracture of concrete is helpful forthe design of strong and flexible structures that canwithstand a variety of complex loadings. Two proper-ties of concrete are of great importance when consid-ering fracture. First of all, the material has a very lowtensile strength, much lower than its compressive resis-tance. The imbalance between tensile and compressivestrength becomes even larger when high (compressive)strength concrete is applied. Also in the case of con-fined compression the relative difference increases. Thesecond, for fracture very important characteristic ofconcrete is its rough heterogeneity. The heterogene-ity is a consequence of economics: reducing the priceof concrete through the addition of relatively cheapsand and gravel to the more expensive binder (Port-land) cement is common practice. Not only the costs ofconcrete decrease, the properties improve in compari-son to the properties of pure hardened Portland cement,in particular the cement’s brittleness is partly over-come. Models for concrete for structural applicationsare generally based on continuum mechanics. This400-year old methodology is based on the assumptionthat material properties can be described using stressand strain as state variables, or stated differently, themechanical behaviour of the material can be describedby means of average properties. Central to developinga sound continuum-based theory is, not surprisingly,the so called Representative Volume Element (RVE),i.e. the smallest material volume needed to define the
123
172 J. G. M. van Mier
average properties of the considered material. Conven-tional wisdom learns that the RVE should at least be afactor 3 to 5 larger than the largest heterogeneity foundin the material. For concrete, but also other materials,the size of the grains is considered when defining theRVE. From a series of uniaxial tensile tests on speci-mens of varying size we concluded that the RVE shouldbe larger than at least 8 times the maximum aggregatesize, see Van Vliet and Van Mier (2000). This con-clusion was based on the observation that beyond thisthreshold the scatter in the experiments decreases andbecomes more-or-less constant. Small specimens, orrather, small structures show clearly the effect of het-erogeneity. The increase of scatter below the aforemen-tioned threshold increases as one single aggregate maybe responsible for the structure’s behaviour. Next tothis, what we will call ‘RVE-based-on-fixed-material-structure’, clearly the size of nucleating and activelygrowing cracks must be considered. If a crack increasesto a size of the same order of magnitude as the charac-teristic specimen size, boundary condition effects andgeometry-related effects cannot be ignored any longer.In concrete cracks are not only caused by mechanicalloading, but environmental conditions may have a pro-found influence as well. Differential temperature distri-butions during the hydration of cement (when concretehardens) and/or differential moisture content in variouspart of a structure lead to eigen-stresses and with that, ifthe strength threshold is exceeded to crack nucleationand growth.
Owing to the coarse heterogeneity of concrete severestress concentrations are present in the material whenexternal load is applied. The stress-concentrations arethe results from E-mismatch between the various mate-rial phases in the composites and the material’s poros-ity. An important factor leading to crack growth inconcrete at moderate external loading levels is the lowtensile strength of the interfacial transition zone (ITZ)between matrix and aggregates. It is noted that when wewould scale-down the specimen/structure size belowthe aggregate size, and zoom-in on a volume of cementmatrix, the same observations can be made. Comparedto the cement structure small sand grains will be rel-atively coarse and cause stress-concentrations. Goingfurther down in scale will bring us to the scale of thecement binder. Here we will find un-hydrated cement,and the hydration products, which again can be seenas aggregates (now the un-hydrated cement kernels)embedded in a matrix with a clear smaller material
structure (the structure of hydrated cement is found atnm-size/scale).
Thus, obviously, concrete and also cement are highlyheterogeneous at various size/scale levels. It wouldbe tempting to address the heterogeneity of concrete(and cement) via a fractal analysis, but it appears that‘jumps’ are made along the dimensional scale, whichwould demand for a multi-fractal approach. We willnot discuss these matters further, but rather suggest adifferent solution that will incorporate heterogeneity atany size/scale level implicitly. The proposed solutionis based on a lattice model. Lattice models have beensuggested as a tool for analyzing fracture of disorderedmaterials in the last two decades of the past century,see for instance Roux and Guyon (1985), Termoniaand Meakin (1986) and Herrmann et al. (1989), amongmany others. Since 1990 we have applied lattice-typemodels for simulating fracture of concrete, which hasshown to be a valuable tool for obtaining a better under-standing of fracture, be it that the approach is mostfruitful when at the same time relevant experiments arecarried out; see for instance Schlangen and Van Mier(1992) and Lilliu and Van Mier (2003) for 2D- and3D-versions of the ‘Delft’ lattice model. Quite essen-tial in our approach has been to incorporate the struc-ture of concrete (or cement) directly into the model.Various methods are available to do so; the interestedreader is referred to Van Mier (2012) for an overview.In a lattice model the material is modeled as a regu-lar or irregular network of linear elements. For fractureit appears that the most realistic results are obtainedif beam elements are used. By means of a finite ele-ment program forces and deformations in the networkare calculated, and given a fracture criterion it can bedecided which of the elements will break. Fractureis simulated by removing in each load-step just oneelement, re-calculating the stress-redistributions afterremoval, after which the next critical element is deter-mined and removed. The disadvantage of this rathercoarse way of simulating fracture is that the calcu-lated load-displacement curves are generally too brittle.This can be repaired by including a softening stress-crack opening relation for the lattice elements as pro-posed by Ince et al. (2003). The obvious disadvan-tage is that not only the computation becomes moreelaborate but also the softening stress-crack openingis in principle ‘un-determined. The main advantage ofour lattice approach based on element removal is thatit is simple and transparent. No complicated iterative
123123

Multi-scale interaction potentials 173
procedures are needed, which is quite essential if themodel is used in combination with experiments. Thegoal is getting a better understanding of fracture mech-anisms in disordered materials like concrete; it is cer-tainly not an attempt to develop a simulation modelthat can be fitted as closely as possible to experimentaldata. Up till now always the decision to fracture an ele-ment was based on a simple ‘stress-criterion’, i.e. whenstresses in a lattice element would exceed a prescribedmaximum stress (e.g. normal stress, flexural stress, etc.)the element would fail instantaneously (elastic-purelybrittle). This implies that still continuum beam theoryis used to decide whether an element will fail or not. Inview of the statements regarding the RVE this is quiteextraordinary (and probably not correct) since in theaforementioned lattice models the size of a lattice ele-ment is in the same order as the material’s heterogene-ity, for instance in concrete usually the lattice elementlength is selected 3 to 4 times smaller than the smallestaggregate particle incorporated in the material struc-ture. Clearly there is reason to look at these matters ina different way, which is precisely what we will do inthis paper.
The organization of the paper is as follows. In Sect.2 we will argue that softening is a structural prop-erty, not a material property. This distinction is quiteessential since it will be necessary to deviate fromcohesive fracture models. In Sect. 3 we will show thatthe consequence of softening as a structural property,multi-scale approaches are deemed to fail. Rather anapproach called ‘up-scaling’ from a pre-defined small-est size/scale level seems a more realistic option, whichis then worked out in Sect. 4 for fracture of concrete.The softening relation needed in the ‘structural lattice’debated in Sect. 4 is no longer expressed in terms ofσ and δ, but rather in F and δ, and must be regardedas the structural property of a lattice element. A con-sequence is that the sought relationship between Fand δ depends on the structural boundary conditions(fixed or pinned support; more general, the rotationalstiffness kr of the supports) and on the size of thelattice element, viz. a structural property. This isprecisely what can be measured routinely in basicexperiments in concrete technology, namely the uni-axial tensile properties and the (confined) compressivebehaviour. A further advantage of using a ‘structural’lattice model is that very likely compressive fracturecan be captured in a lattice model as well. Buckling oflattice elements can be considered and can be included
in the model in a relatively simple and straightforwardmanner. Again here we find the significant influence ofboundary conditions and element slenderness (geome-try), which is now incorporated directly into the model.Finally, in Sect. 5 methods are suggested that can beused to validate the new model approach. Without thatthe model would be incomplete as so many models aretoday.
2 What can be measured directly in fractureexperiments?
In popular cohesive models for concrete the crack-tipclosing stress is modeled according to the outcomeof a uniaxial tension test between fixed (non-rotating)loading platen. This is what the fictitious crack modeldevelopers tell us; see Hillerborg et al. (1976). Sincethe early 1980s there have been numerous efforts toestablish a standard tension or bending test that wouldhelp quantifying the properties needed in the fictitiouscrack model. What all experiments tell, however, isthat none of the required properties for the fictitiouscrack model are true material properties. These para-meters are the tensile strength ft , the fracture energyG f , the maximum crack opening δc and the shape ofthe softening curve σ(δ). In some way they all dependon specimen size, specimen geometry and boundaryconditions. Drawing an equivalent to fracture under(confined) compression shows the same effects, albeitin this case specimen geometry and boundary condi-tions appear to be even more influential. In the caseof tensile fracture researchers often revert to in-directtests under the argument that uniaxial tension tests aretoo difficult. Instead seemingly simple experiments arecarried out like the Brazilian splitting test or a (3-pointof 4-point) bending test on prismatic beams. These lat-ter tests require back-analysis of the results, and thus anumber of assumptions are usually needed that are notalways realistic. Here we focus on uniaxial tension anddraw a parallel to uniaxial compression tests becauseboth tests can deliver the data needed for the ‘structural’lattice model, which is presented in Sect. 4. Observa-tions from uniaxial tension and uniaxial compressiontests lead to the following overview:
(1) When considering concrete the characteristic spec-imen size should be larger than 100–150 mm (i.e. 5to 8 times the maximum aggregate size); for con-cretes with very large aggregates (dam concrete)
123
174 J. G. M. van Mier
this would lead to even larger specimen sizes.Along the same lines of reasoning: for hardenedcement paste the minimum required specimen sizewould be 500–1000µm.
(2) In the fictitious crack model it has become commonpractice to model the pre-peak stress-strain curveas purely linear elastic. Experiments by Evans andMarathe (1968) indicate that already at a relativelylow stress-level in the pre-peak regime microcrack-ing starts. This is also the outcome from own exper-iments and simulations, see Van Mier (2009).
(3) The fictitious crack model tells us that microcrackspropagate and widen in the softening regime. Thisis not true. Not only the experiments by Evans andMarathe (1968) lead to a different conclusion, asurvey carried out by Mindess (1991) shows thatthe extent of a fracture process zone, commonlyassociated with the length of the crack-tip bridg-ing zone, not only depends on specimen geome-try but also on the accuracy of the crack detectionmethods used. It is also easy to show that in thesoftening regime a macroscopic crack dominatesthe behaviour of a test specimen, see Van Mier andNooru-Mohamed (1990). These finding for uniax-ial tension can easily be extended to (confined)compression; see Van Mier (2012).
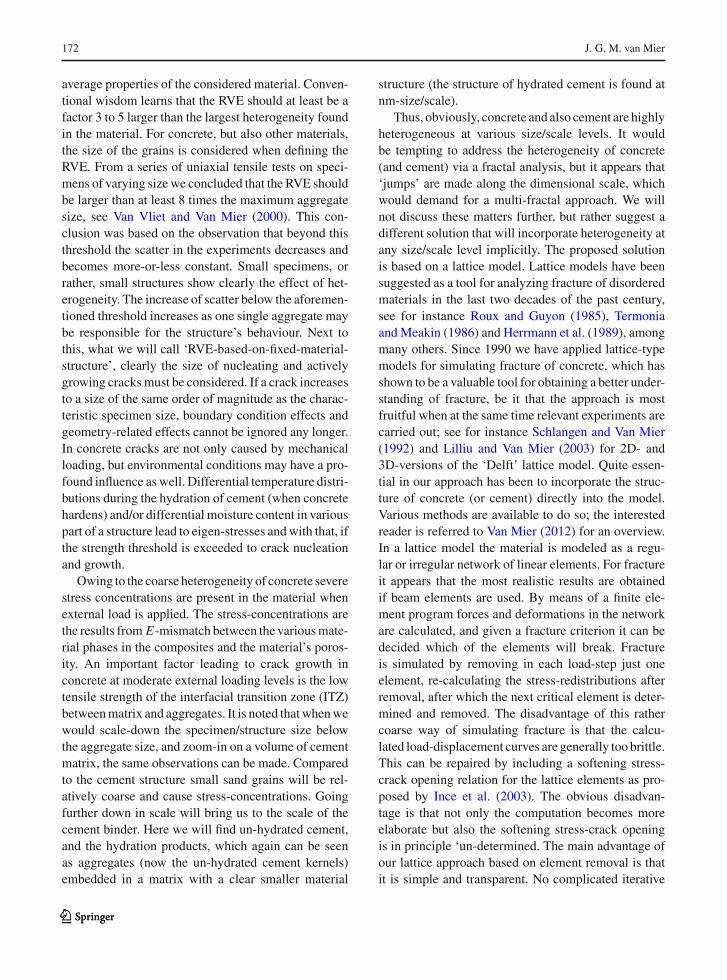
(4) The specimen size has a significant influenceon the tensile strength of a specimen. In gen-eral tensile strength will decrease with increas-ing specimen size (Fig. 1a); see for instanceVan Vliet and Van Mier (2000) and Van Mierand Van Vliet (2003). Several (competing) theo-ries describe this decrease of structural strengthwith specimen/structure size; see for instanceWeibull (1939), Bažant (1984) and Carpinteri etal. (2003). The theory by Weibull is the only sizeeffect approach based on sound physics. The mainassumption here is that large structures have alarger probability of containing defects and henceare weaker. The other two models, sometimesdubbed ‘laws’ are exercises in curve-fitting. Quiteimportant in both latter approaches is the notionof the asymptotic behaviour for small and largesizes (see Fig. 1a). Trying to validate the asymp-totic behaviour in the small size range is impossi-ble: as soon as the specimen/structure size becomessmaller than the RVE experimental scatter willbecome larger and a solid conclusion cannot bedrawn. The RVE is estimated at 8da and indicated
in Fig. 1a. The large-size asymptotic behaviourcannot be established either because the laboratoryfacilities will be decisive for the maximum size of aspecimen/structure that can be tested. In most labsthe characteristic specimen size will not exceed 2m. A workable option would be to test larger spec-imens floating on water. The large-size asymptoteis considered more important than the lower-sizeasymptote for the sole reason that such results canbe used directly in structural engineering. Note thatat the lower-size asymptote, below the RVE, westart testing different materials, namely the indi-vidual constituents of concrete: hardened cementpaste and aggregate. In Fig. 1a conclusions aboutmodels and experiments can only be drawn in thearea enclosed by the box of the diagram. Beyondthese boundaries only fruitless speculation is pos-sible; many hours have been lost at conferencesin the past decade debating the best ‘size effectlaw’ on the basis of the behaviour at the extremes.It is obvious that it is impossible to discriminatebetween the proposed models (Bažant 1984 andCarpinteri et al. 2003) simply because it will neverbe possible to validate the speculations by meansof physical experiment.
(5) With increasing specimen/structure size the frac-ture energy (i.e. the area under the post-peak soft-ening curve) increases as shown in Fig. 1b. Forlarge sizes (> 1.6 m for 8-mm concrete) the curveseems to level of towards a horizontal asymptote.Therefore it is believed that fracture energy maybe a true material property, but very large speci-mens are needed to make the actual measurementsfor a given concrete. Models based on local frac-ture energy g f (for instance Duan and Hu 2004)are difficult to feed with experimental data sim-ply because at the lower end of the size-scale mea-surements of fracture energy will not yield realisticvalues. The complete stress-deformation diagramis affected when specimen/structure size increases.Larger specimens show a more brittle behaviour;just beyond peak even snap-back behaviour mayoccur depending on the choice of control parame-ter in the closed-loop testing system (see also ref-erences mentioned in the next paragraph).
(6) It is by no means clear for which characteris-tic specimen size the softening diagram neededin the fictitious crack model must be determined.Obtaining a stable softening diagram is not easy if
123123

Multi-scale interaction potentials 175
Fig. 1 Size effect on structural strength (a) and fracture energy(b) from uniaxial tensile tests on dog-bone shaped specimens.Testing below the RVE-size (taken here as 8 da , and indicated in(a)) is not possible due to increasing scatter. Therefore assumedasymptotic behaviour in the small size/scale regime can neverbe validated experimentally. The fracture energy has been calcu-lated up till 180 μ m crack opening, denoted as G F,180 and till full
separation G F . In the latter case measured curves were linearlyextrapolated to the point where they intersected with the x-axis.Data are from Van Mier and Van Vliet (2003). The Weibull the-ory has been fitted to the experimental data; for SEL and MFSLonly trends are shown indicating the asymptotic behaviour forsmall and large sizes
the right equipment is lacking, see Van Mier andShi (2002). Considering that the fracture energygrows towards an asymptotic value for larger speci-mens, this might indicate that even larger specimens(2-m range) would be required than based on con-sidering the RVE. At those larger sizes maintainingstability of crack growth in the softening regime ismost difficult because often snap-back behaviourmay occur. The difficulties can be overcome, how-ever, as shown in Van Vliet and Van Mier (2000)and Van Mier and Shi (2002), but require next tothe servo-hydraulic control system some additionalelectronics.
(7) Boundary conditions have a pronounced influenceon the softening behaviour, both in tension andunder (confined) compression. More specifically, in
tension the rotational freedom at the nodes affectsthe tensile strength, the pre-peak non-linearity,the shape of the softening curve and the fractureenergy. In (confined) compression, in addition tothe rotational freedom of the supports the fric-tional restraint at the specimen-loading platen inter-face must be considered. In Fig. 2 three differ-ent cases are shown: fixed boundaries (kr = ∞)
using a slender specimen (h/d > 2) in Fig. 2a,pinned boundaries (kr = 0) using a slender spec-imen in Fig. 2b and in Fig. 2c a stubby specimen(h/d < 1) loaded between fixed boundaries. Withfixed boundaries two cracks will develop in the soft-ening regime; restraining the rotations at the speci-mens ends will cause the bump in the diagram as thetwo cracks develop in sequence from two opposite
123

176 J. G. M. van Mier
sides of the specimen, see Van Mier (1986). In con-trast, when a slender specimen is loaded betweenpinned boundaries the first crack to develop is alsothe crack leading to complete failure of the spec-imen, i.e. no secondary cracking can occur. Thefracture energy is markedly smaller in the sec-ond case as a direct consequence of the reducedcrack area; the tensile strength is smaller underpinned boundaries in comparison to fixed bound-aries; see Van Mier et al. (1995). When a stubbyspecimen is used instead of a slender specimen thestress-redistributions occur earlier, around peak,and results by Hordijk (1991) show that the pre-peak part of the diagram becomes more curved, thedeformation at peak-load increases and the ‘bump’has disappeared. The result is shown schematicallyin Fig. 2c. More recently, Akita et al. (2007) showedthat the specimen shape has a significant effect ontensile strength as well.
(8) As a consequence of the size effect on strength anddeformation, and the influence of boundary rota-tions it is impossible to choose the ‘best’ or ‘mostappropriate’ type of experiment for determining thesoftening diagram of concrete in tension and withthat the closing stress-profile in a cohesive frac-ture model. The point of view that comes closestto all results is that softening is a ‘structural prop-erty’, rather than a ‘material property’. It is impos-sible to separate boundary effects from materialeffects in all these experiments. The main reasonis that a crack with a size comparable to the speci-men/structure dimensions is developing, and like inclassical fracture mechanics a correction for theseeffects must be incorporated in any model trying
to deal with the aforementioned phenomena. Thus,the behaviour measured in a uniaxial tensile testis valid only for the chosen specimen size and theapplied boundary conditions. The resulting F − δ
relation should be used directly in a model, as this isthe only un-biased result that can be derived from anexperiment. We will return to these matters in Sect.4. It should be noted that the last remaining ‘contin-uum state variable’ in the fictitious crack model hasbeen dropped; rather than giving results in terms ofaverage stress over the specimens cross-section itwill be an improvement to present matters directlyin force and displacement, thereby also incorporat-ing the pre-peak behaviour in the formulation. Notethat this is a significant deviation from the fictitiouscrack model.
For compressive fracture the same situation emerges,see Van Mier (2009, 2012). Next to the chosen bound-ary rotations also frictional restraint between loadingplaten and specimen ends will affect the measurements.Higher boundary restraint results in a higher compres-sive strength, larger deformations at peak stress anda shallower softening branch. The interested reader isreferred to my recent book for a complete overview ofall factors affecting compressive fracture; see Van Mier(2012). The aforementioned effects will also be foundunder confined compression, provided the confinementstays below the brittle-to-ductile transition.
In conclusion to this section it can be stated that itdoes not make sense to continue with cohesive fracturemodels for concrete. The essential parameter, the σ −w
relation is not a ‘material property’ but must be seen asthe response of the complete specimen-machine sys-tem. Softening is a ‘structural property’. In Sect. 4 we
Fig. 2 Effect of boundary rotations on tensile stress-deformationdiagram of concrete. In a and b a slender specimen is loadedbetween fixed (non-rotating) loading platen and pinned (freely
rotating) loading platen, respectively, whereas in c fixed speci-men ends are used in a test on a stubby specimen
123123

Multi-scale interaction potentials 177
Fig. 3 Two images of apolished surface ofhardened cement paste,before (a) and afterindentation with aBerkovich diamond tip. Thealmost white particles arethe remaining un-hydratedcores of partially hydratedcement grains. Light grayand dark gray are the lowand high-density calciumsilicate hydrates (CSH), andblack is porosity. After VanMier (2007)
will see how we can still work with such a relation-ship.
3 Multi-scale modeling?
Recently there has been quite some interest in multi-scale modeling. At the smallest considered size/scale-level the behaviour of the constituents of a compos-ite are determined, for example, and used in sequen-tial analyses at higher size/scale levels, all the wayup to the macroscopic (or engineering) level. Doesthis make sense? It will only work when at the small-est size/scale true material properties are used. Inscaling-up to larger size/scale levels boundary effectsand size effects can be incorporated, which wouldlead to correct results at the macroscopic level. Thequestion is thus: are we capable of determining truematerial properties at the smallest size/scale? In rela-tion to this question immediately a second one can beposed, namely: what is the most appropriate ‘small-est’ size/scale to start from? Let us assume that weare dealing with concrete and the appropriate lowersize/scale-level is the [µm]-level where the structure ofhydrated cement can be seen in great detail. In Fig. 3the structure of cement at the [µm]-size/scale is shown,before and after an indent with a Berkovich diamondtip. The smooth gray area at the right corner of Fig. 3ais part of a sand grain, the more-or-less white particlein the center is an un-hydrated cement grain (approxi-mately 50 µm across), the smaller darker gray patchesforming the matrix between the sand and un-hydratedcement particles is hydrated cement, interspersed with
porosity, which appears as black specs. The hydratedcement usually comes in two forms: low-density Cal-cium Silicate Hydrates (in short: CSH) away fromthe un-hydrated kernel, and high-density CSH directlyin contact with the un-hydrated cement grain. In thesmallest-scale part of the multi-scale model we needto incorporate all these material phases and, in addi-tion, the interfaces between the various components. Aminimum model would require knowledge about themechanical properties of un-hydrated cement (whichis a composite by itself, as can be seen in Fig. 3b afterthe indentation has been made), low- and high densityCSH and at least 3 types of interfaces. The indenta-tion shown in Fig. 3b is one of the few (in-direct) testsavailable for determining the mechanical properties ofthese material phases. For instance, Constantinides andUlm (2004) have attempted to determine the Young’smodulus of low- and high-density CSH by means ofindentation tests, and reported a higher modulus forhigh-density CSH in comparison to low-density CSH.Problems in indentation testing are numerous, and justthe simple fact that the tests are in-direct makes themsuspicious. As an alternative one can try to carry outuniaxial tension tests (see for instance Trtik et al. 2007).Machining tiny specimens of hardened cement paste,or isolating small probes made of the individual cementhydrates (see below) is tedious, and often leads to usinglarger specimens that contain all the aforementionedmaterial phases. Using a micro-mechanical model onewould then have to perform back-calculations and try toestimate the properties of the various material phases.For certain, not a simple task and not a small taskeither.
123
178 J. G. M. van Mier
An alternative route is to scale-down from the micro-mechanical tensile test and try to obtain specimensconsisting of pure cement phases (low-density CSH,high-density CSH, calcium hydroxide and un-hydratedcement), for instance by using a focused ion beam(FIB). This is certainly not an easy task either, butcan be done. If we have succeeded in producing thespecimens and testing them as well, the same prob-lems that we discussed in the previous Section willreturn: what to do with size effects and boundary con-ditions? The answer will not change: again we are mea-suring structural properties rather than material prop-erties, except perhaps for the Young’s modulus andthe fracture energy, but these are certainly not suffi-cient for constructing a fracture model. So, the sugges-tion to use a lattice model and to feed into the modeldirectly the structural properties of a lattice elementmight be a workable approach. In the next Section wewill explore the advantages and disadvantages of such amodel.
4 Structural lattice based on multi-scaleinteraction potentials (F-r)
There is a resemblance between the shape of theattractive part of an atomic potential and the tensileforce-deformation diagram for concrete, see Van Mier(2007). A well-known form for the atomic potential fornoble gases is the Lennard-Jones (LJ) potential, whichmay be written as:
VL J (r)
ε= −4
[(σ
r
)12 −(σ
r
)6]
, (1)
where σ and ε are units of length and energy, respec-tively. The potential describes the balance betweenattractive and repulsive forces at the level of atoms.Is the distance between two atoms below the equilib-rium separation r0, the repulsion must be overcome andthe atoms must be forced to remain at the prescribeddistance. With increasing separation distance betweenthe atoms the energy needed decreases. Equation (1)can be rewritten as:
F
Fu= α
[(σ
r
)m −(σ
r
)n], (2)
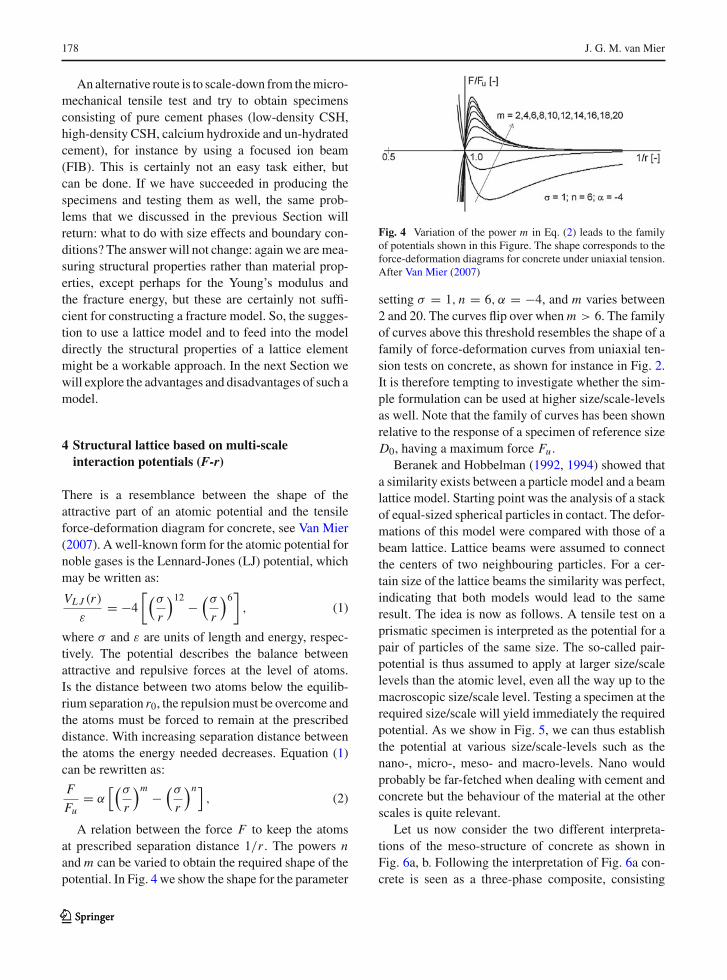
A relation between the force F to keep the atomsat prescribed separation distance 1/r . The powers nand m can be varied to obtain the required shape of thepotential. In Fig. 4 we show the shape for the parameter
Fig. 4 Variation of the power m in Eq. (2) leads to the familyof potentials shown in this Figure. The shape corresponds to theforce-deformation diagrams for concrete under uniaxial tension.After Van Mier (2007)
setting σ = 1, n = 6, α = −4, and m varies between2 and 20. The curves flip over when m > 6. The familyof curves above this threshold resembles the shape of afamily of force-deformation curves from uniaxial ten-sion tests on concrete, as shown for instance in Fig. 2.It is therefore tempting to investigate whether the sim-ple formulation can be used at higher size/scale-levelsas well. Note that the family of curves has been shownrelative to the response of a specimen of reference sizeD0, having a maximum force Fu .
Beranek and Hobbelman (1992, 1994) showed thata similarity exists between a particle model and a beamlattice model. Starting point was the analysis of a stackof equal-sized spherical particles in contact. The defor-mations of this model were compared with those of abeam lattice. Lattice beams were assumed to connectthe centers of two neighbouring particles. For a cer-tain size of the lattice beams the similarity was perfect,indicating that both models would lead to the sameresult. The idea is now as follows. A tensile test on aprismatic specimen is interpreted as the potential for apair of particles of the same size. The so-called pair-potential is thus assumed to apply at larger size/scalelevels than the atomic level, even all the way up to themacroscopic size/scale level. Testing a specimen at therequired size/scale will yield immediately the requiredpotential. As we show in Fig. 5, we can thus establishthe potential at various size/scale-levels such as thenano-, micro-, meso- and macro-levels. Nano wouldprobably be far-fetched when dealing with cement andconcrete but the behaviour of the material at the otherscales is quite relevant.
Let us now consider the two different interpreta-tions of the meso-structure of concrete as shown inFig. 6a, b. Following the interpretation of Fig. 6a con-crete is seen as a three-phase composite, consisting
123123

Multi-scale interaction potentials 179
Fig. 5 Pair-potentials for application in a beam-lattice model atvarious size/scale levels (nano-, micro-, meso- and macro-level).After Van Mier (2012). Note that the potential is active betweentwo particles of identical size; the distance between the particlesis here shown exaggerated to indicate that only normal forces areconsidered between the interacting particles
of cement-matrix in which the various aggregates areembedded. Between the two phases is an interfacialtransition zone, which has relatively low strength, andis in fact the weakest part of the concrete structure.Since the matrix is shown here as a continuous phase,we could interpret this visualization as the situationafter hydration. The matrix is built up from the small-est sand grains that have not been explicitly includedin the model, the Portland cement, and, if present, fly-ash and/or condensed silica. In the lattice model thatwe built in Delft and Zurich, as a series of consec-utive PhD-projects, the visualization of Fig. 6a wastaken as a starting point. The regular or random lat-tice was simply projected on top of the 3-phase mate-rial structure and properties were assigned dependingon where a certain lattice element would be located,see Fig. 6c. In Fig. 6b concrete is depicted as a stackof spherical particles of varying size. In a way thisis the situation before the cement hydrates; only thewater needed for hydration is not shown in this Fig-ure (note that the mixing water in concrete is initiallyabsorbed at the particle’s surfaces and possible excesswater will gather in voids between the particles). Allparticles sizes are present: from the largest [mm]-sizeaggregates to the smallest (sub-[μm] size) fly-ash andcondensed silica particles with the cement grains ofa size falling between these extremes. With such ahierarchical system the densest possible material struc-ture can be obtained, which will have the highest pos-sible strength. The material interpretation of Fig. 6bcan also be turned into a lattice. By simply connect-ing the centers of neighbouring particles a lattice isconstructed. Each lattice element represents the inter-
action between the two neighbouring particles. Inter-preting the system as just a bunch of pair-interactionsis probably too simple, and higher order interactionsmay be included, at the cost of a loss in transparencyof the model. In Fig. 6d the connectivity between theparticle centers is shown, in Fig. 6e the remaininglattice.
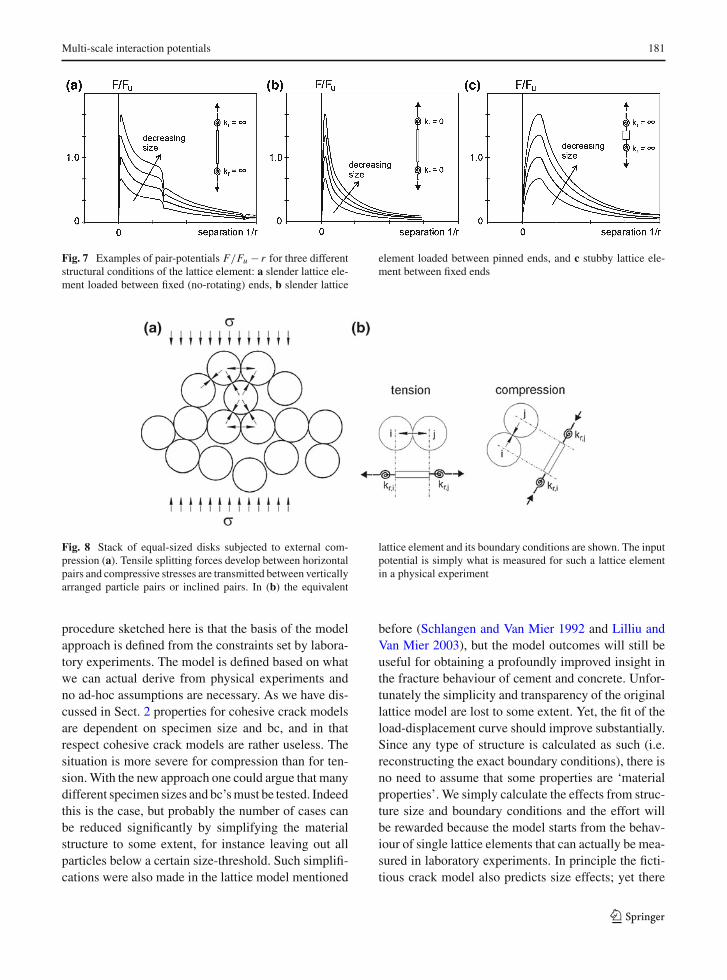
The potential law, Eq. (2) describes the behaviour ofa lattice element, but an essential adjustment must bemade. The potential used in our lattice model dependson the actual size of the individual lattice elements,and on the rotational support stiffness at both nodes,i.e. the connectivity to the other lattice elements. Therotational stiffness at the supports depends not onlyon the connectivity to the rest of the lattice but alsoon the flexural stiffness of the lattice element itself. So,rather than descending to a so-called material level, anddescribing the properties of the lattice elements via con-stitutive equations, we remain at the ‘structural level’and describe the properties of each lattice elementdirectly as a function of size and support conditions.The complication that arises in conventional cohesivefracture models is solved, namely the dependence ofcohesive fracture properties on element size and bound-ary conditions is now implicitly included in the model.Figure 7 shows examples of (size-dependent) poten-tials for three different boundary conditions and vary-ing specimen slenderness. Specific characteristics ofa lattice element are included in the F − r poten-tial. For instance the ‘bump’ in the softening curvewhen a slender lattice element is tested between fixedboundaries is included in the potential function. It isnot seen as an ‘inconvenience’ that at all costs mustbe removed from the model. No, it is just part of thebehaviour of that particular lattice element when theelement’s ends are fixed against rotations. Likewise wewill have to use the smooth curve for a lattice elementbetween pinned supports, which is actually a condi-tion that will not be found in a beam lattice model, andthe increased pre-peak deformations for a stubby lat-tice beam between fixed supports. The latter case mayappear frequently since in the beam lattices exploredto date always relatively stubby elements have beenused, which came from the demand to justify the elasticlattice properties to those of a real concrete specimenor structure; see for instance in Schlangen and Mier(1994).
Returning to the model of Fig. 6d, e, which wasderived from the concrete material structure of Fig. 6b,
123

180 J. G. M. van Mier
we can easily see the implications of this model. Forcompression the effects from bc on lattice elementresponse are even more pronounced in comparison tothe effects shown here for tension; see the overview inChapter 8 in Van Mier (2012). The same approach assketched above can be applied, however. As an exam-ple consider the particle stack of equal-sized disks(2D is considered for explaining the matter here) sub-jected to external compression in Fig. 8a. The con-tact forces between the particles are either compres-sive or tensile (splitting forces will occur between hor-izontal oriented particle pairs), as shown in the equiv-alent lattice model. If the disks are of varying sizethe lattice element sizes vary correspondingly and thepotential functions describing the relation between lat-tice element force F and deformation r will vary aswell.
5 Which experiments are essential?
In the model approach suggested in the previous sectionthe behaviour of a lattice element is described directlyin terms of force and deformation. The consequence isthat for each lattice element size and bc the behaviourmust be estimated from experiments. How can this bedone? In the first place the task will be simplified byconsidering a limited set of bc’s, which could be iden-tified from elastic analyses of a corresponding beamlattice. The size of the lattice elements can be set usingthe approach in Schlangen and Mier (1994). After therotational stiffnesses of the two nodes of an elementhave been established, we know how large the speci-men should be as well as the rotational support stiff-nesses. After that it is rather simple and straightforwardto conduct the experiment. The main advantage of the
Fig. 6 Two differentinterpretations of themeso-structure of concrete:a concrete as a three-phasecomposite of matrix,aggregate and interfacialtransition zone (ITZ), and bas a stack of particles ofdifferent size. The model of(a) has been used frequentlyin the past: a regular orrandom lattice wasprojected on top of thematerial structure and thelattice elements would beassigned propertiesaccording their location onthe material structure asshown in (c). In the modelof (b) particles can beanything from gravel, sand,condensed silica, Portlandcement, fly-ash, and so on.The particle stack of (b) canform the basis for theconstruction of a lattice asshown in (d) and (e), whichwould form the basis of the‘structural lattice’ discussedin this paper
123123
Multi-scale interaction potentials 181
Fig. 7 Examples of pair-potentials F/Fu − r for three differentstructural conditions of the lattice element: a slender lattice ele-ment loaded between fixed (no-rotating) ends, b slender lattice
element loaded between pinned ends, and c stubby lattice ele-ment between fixed ends
Fig. 8 Stack of equal-sized disks subjected to external com-pression (a). Tensile splitting forces develop between horizontalpairs and compressive stresses are transmitted between verticallyarranged particle pairs or inclined pairs. In (b) the equivalent
lattice element and its boundary conditions are shown. The inputpotential is simply what is measured for such a lattice elementin a physical experiment
procedure sketched here is that the basis of the modelapproach is defined from the constraints set by labora-tory experiments. The model is defined based on whatwe can actual derive from physical experiments andno ad-hoc assumptions are necessary. As we have dis-cussed in Sect. 2 properties for cohesive crack modelsare dependent on specimen size and bc, and in thatrespect cohesive crack models are rather useless. Thesituation is more severe for compression than for ten-sion. With the new approach one could argue that manydifferent specimen sizes and bc’s must be tested. Indeedthis is the case, but probably the number of cases canbe reduced significantly by simplifying the materialstructure to some extent, for instance leaving out allparticles below a certain size-threshold. Such simplifi-cations were also made in the lattice model mentioned
before (Schlangen and Van Mier 1992 and Lilliu andVan Mier 2003), but the model outcomes will still beuseful for obtaining a profoundly improved insight inthe fracture behaviour of cement and concrete. Unfor-tunately the simplicity and transparency of the originallattice model are lost to some extent. Yet, the fit of theload-displacement curve should improve substantially.Since any type of structure is calculated as such (i.e.reconstructing the exact boundary conditions), there isno need to assume that some properties are ‘materialproperties’. We simply calculate the effects from struc-ture size and boundary conditions and the effort willbe rewarded because the model starts from the behav-iour of single lattice elements that can actually be mea-sured in laboratory experiments. In principle the ficti-tious crack model also predicts size effects; yet there
123
182 J. G. M. van Mier
an un-resolved problem remains, i.e. softening is not amaterial property.
Next to the tests aimed at establishing the potential-law for the individual lattice elements, large scaletests on larger material volumes are quite essen-tial, in particular the determination of the evolutionof the crack populations under a variety of loadingpaths. These large-scale tests are needed to establishfracture mechanisms. A useful approach is the use ofX-ray tomography, which can provide the evolution ofthe full three-dimensional crack population in time; seefor instance Trtik et al. (2007) and Meyer et al. (2009).
6 Conclusion
In this paper we discuss an alternative to cohesive crackmodels, namely a lattice model based on F − r poten-tials. The potential function to be used depends on thesize of the lattice element (slenderness h/d) and therotational stiffness at the nodes. The rotational stiffnessat the nodes of each lattice element depends on the con-nectivity of an element to neighbouring lattice elementsas well as on the flexural stiffness of the lattice ele-ments themselves. The implication is that for a varietyof boundary conditions and a variety of lattice elementsizes the potential function must be measured, but theenormous advantage is that what is needed as input inthe model can actually be measured in physical exper-iments. The potential describes the structural behav-iour of a lattice element. Material properties do notexist, which is the main deviation here from assump-tions in cohesive models where the softening curve isconsidered as a material property. Basically we startfrom what can be measured in a fracture experiment,in stead of trying to measure haphazardly proposedparameters. The model approach explained in this shortpaper is an elegant manner to overcome the parameter-identification conundrum which seems to affect mostfracture models today.
References
Akita H, Koide H, Mihashi H (2007) Specimen geometry in uni-axial tension test of concrete. In: Carpinteri A et al (eds) Pro-ceedings FraMCoS-6. Taylor & Francis, London, pp 243–248
Bažant ZP (1984) Size effect in blunt fracture: concrete, rock,metal. J Eng Mech 110:518–535
Beranek WJ, Hobbelman GJ (1992) Handboek voor het mech-anisch gedrag van metselwerk (Glossary of the mechani-
cal behaviour of masonry). Report C-77, CUR Foundation,Gouda (in Dutch)
Beranek WJ, Hobbelman GJ (1994) Constitutive modelling ofstructural concrete as an assemblage of spheres. In: Mang H,Bicanic N, de Borst R (eds) Computational models of concretestructures, proceedings EURO-C. Pineridge Press, Swansea,pp 535–542
Carpinteri A, Chiaia B, Cornetti P (2003) On the mechanics ofquasi-brittle materials with a fractal microstructure. Eng FractMech 70:2321–2349
Constantinides G, Ulm FJ (2004) The effect of two types of C-S-H on the elasticity of cement-based materials: results fromnano-indentation and micro-mechanical modeling. Cem ConcRes 34(1):67–70
Duan K, Hu X (2004) Specimen boundary induced size effect onquasi-brittle fracture. Strength Fract Complex 2:47–68
Evans RH, Marathe MS (1968) Microcracking and stress-straincurves for concrete in tension. Mater Struct (RILEM) 1(1):61–64
Herrmann HJ, Hansen A, Roux S (1989) Fracture of disor-dered elastic lattices in two dimensions. Phys Rev B 39(1):637–648
Hillerborg A, Modeér M, Peterson P-E (1976) Analysis of crackformation and crack growth in concrete by means of fracturemechanics and finite elements. Cem Conc Res 6:773–782
Hordijk DA (1991) Local approach to fatigue of concrete. PhDthesis, Delft University of Technology
Ince R, Arslan A, Karihaloo BL (2003) Lattice modeling of sizeeffect in concrete strength. Eng Fract Mech 70:2307–2320
Lilliu G, Van Mier JGM (2003) 3D lattice type fracture modelfor concrete. Eng Fract Mech 70(7/8):927–942
Meyer D, Man H-K, Van Mier JGM (2009) Fracture of foamedcementitious materials: a combined experimental and numer-ical study. In: Zhao H, Fleck NA (eds), Mechanical proper-ties of cellular materials. New York: IUTAM Bookseries 12,Springer Science+ Business, Media, 115–123
Mindess S (1991) Fracture process zone detection. In: Shah SP,Carpinteri A (eds) Fracture mechanics test methods for con-crete. Chapman & Hall, London, pp 231–261
Roux S, Guyon E (1985) Mechanical percolation: a small beamlattice study. J Phys Lett 46:L999–L1004
Schlangen E, Van Mier JGM (1992) Experimental and numericalanalysis of the micro-mechanisms of fracture of cement-basedcomposites. Cem Conc Comp 14(2):105–118
Schlangen E, Van Mier JGM (1994) Fracture simulations in con-crete and rock using a random lattice. In: Siriwardane H,Zaman MM (eds) Computer methods and advances in geo-mechanics. Balkema, Rotterdam, pp 1641–1646
Termonia Y, Meakin P (1986) Formation of fractal cracks in akinetic fracture model. Nature 320:429–431
Trtik P, Stähli P, Landis EN, Stampanoni M, Van Mier JGM(2007) Microtensile testing and 3D imaging of hydrated port-land cement. In: Carpinteri A, Gambarova P, Ferro G, PlizzariG (eds), Proceedings 6th international conference on fracturemechanics of concrete and concrete structures (FraMCoS-VI).London: Taylor & Francis, 1277–1282
Van Mier JGM (1986) Fracture of concrete under complex stress.HERON 31(3):1–90
Van Mier JGM (2007) Multi-scale interaction potentials (F −r) for describing fracture of brittle disordered materials likecement and concrete. Int J Fract 143(1):41–78
123123

Multi-scale interaction potentials 183
Van Mier JGM (2009) Mode II fracture localization in concreteloaded in compression. J Eng Mech (ASCE) 135(1):1–8
Van Mier JGM (2012) Concrete fracture—multiscale approach.Taylor & Francis/CRC Press, Boca Raton
Van Mier JGM, Nooru-Mohamed MB (1990) Geometrical andstructural aspects of concrete fracture. Eng Fract Mech35(4/5):617–628
Van Mier JGM, Schlangen E, Vervuurt A (1995) Lattice typefracture models for concrete. In: Mühlhaus H-B (ed) Contin-uum models for materials with micro-structure. Wiley, Chich-ester, pp 341–377
Van Mier JGM, Shi C (2002) Stability issues in uniaxial ten-sile tests on brittle disordered materials. Int J Solids Struct39:3359–3372
Van Mier JGM, Van Vliet MRA (2003) Influence of microstruc-ture of concrete on size/scale effects in tensile fracture. EngFract Mech 70(16):2281–2306
Van Vliet MRA, Van Mier JGM (2000) Experimental investiga-tion of size effect in concrete and sandstone under uniaxialtension. Eng Fract Mech 65(2/3):165–188
Weibull W (1939) A statistical theory of strength of materials.Roy Swedish Inst Eng Res 151:1–45
123
![[PPT]The regulatory conundrum: achieving effective …acmd.com.bd/docs/Siddiqui, 2015. The regulatory conundrum... · Web viewThe regulatory conundrum: achieving effective corporate](https://img.pdfslide.us/doc/110x75/5aa627577f8b9a7c1a8e58e9/pptthe-regulatory-conundrum-achieving-effective-acmdcombddocssiddiqui.jpg)