Embed Size (px)
Citation preview
Louisiana State UniversityLSU Digital Commons
LSU Historical Dissertations and Theses Graduate School
1998
A Social Cognitive Theory Model of SalespersonPerformance.Robert Chapman McmurrianLouisiana State University and Agricultural & Mechanical College
Follow this and additional works at: https://digitalcommons.lsu.edu/gradschool_disstheses
This Dissertation is brought to you for free and open access by the Graduate School at LSU Digital Commons. It has been accepted for inclusion inLSU Historical Dissertations and Theses by an authorized administrator of LSU Digital Commons. For more information, please [email protected].
Recommended CitationMcmurrian, Robert Chapman, "A Social Cognitive Theory Model of Salesperson Performance." (1998). LSU Historical Dissertationsand Theses. 6749.https://digitalcommons.lsu.edu/gradschool_disstheses/6749
INFORMATION TO USERS
This manuscript has been reproduced from the microfilm master. UME
films the text directly from the original or copy submitted. Thus, some
thesis and dissertation copies are in typewriter face, A diile others may be
from any type of computer printer.
The quality of this reproduction is dependent upon the quality o f the
copy submitted. Broken or indistinct print, colored or poor quality
illustrations and photographs, print bleedthrough, substandard margins,
and improper alignment can adversely afreet reproduction.
In the unlikely event that the author did not send UMI a complete
manuscript and there are missing pages, these will be noted. Also, if
unauthorized copyright material had to be removed, a note will indicate
the deletion.
Oversize materials (e.g., maps, drawings, charts) are reproduced by
sectioning the original, beginning at the upper left-hand comer and
continuing from left to right in equal sections with small overlaps. Each
original is also photographed in one exposure and is included in reduced
form at the back of the book.
Photographs included in the original manuscript have been reproduced
xerographically in this copy. HSgher quality 6” x 9” black and white
photographic prints are available for any photographs or illustrations
appearing in this copy for an additional charge. Contact UMI directly to
order.
UMIA Bell & Ifowell Information Company
300 North Zeeb Road, Ann Arbor MI 48106-1346 USA 313/761-4700 800/521-0600
Reproduced with permission of the copyright owner. Further reproduction prohibited without permission.

Reproduced with permission of the copyright owner. Further reproduction prohibited without permission.

A SOCIAL COGNITIVE THEORY MODEL OF SALESPERSON PERFORMANCE
A Dissertation
Submitted to the Graduate Faculty of the Louisiana State University and
Agricultural and Mechanical College in partial fulfillment of the
requirements for the degree of Doctor of Philosophy
m
The Interdepartmental Program in Business Administration
byRobert Chapman McMurrian
B.S., Louisiana Tech University, 1968 M.B.A., Louisiana Tech University, 1969
August, 1998
Reproduced with permission of the copyright owner. Further reproduction prohibited without permission.

UMI Number: 99 02651
UMI Microform 9902651 Copyright 1998, by UMI Company. All rights reserved.
This microform edition is protected against unauthorized copying under Title 17, United States Code.
UMI300 North Zeeb Road Ann Arbor, MI 48103
Reproduced with permission of the copyright owner. Further reproduction prohibited without permission.

ACKNOWLEDGEMENTS
I wish to thank the dissertation committee of Professors Daryl McKee, Cheryl
Adkins, William C. Black, Michael Hartline, David Hughes, and Elizabeth Woodside. It
would be almost impossible to adequately express my appreciation for their patience and
assistance throughout the dissertation process. A special thanks to Daryl McKee, who
served as chair of the dissertation committee. Professor McKee’s insight and
thoughtfulness kept me going and focused when it seemed that completion of the
dissertation was somewhat problematic.
I would also like to acknowledge the support of the faculty of Louisiana State
University’s marketing department. Their assistance, first class instruction, leadership and
comraderie are unsurpassed.
Reproduced with permission of the copyright owner. Further reproduction prohibited without permission.

TABLE OF CONTENTS
ACKNOWLEDGEMENTS...................................................................................................... ü
LIST OF TABLES.................................................................................................................... ix
LIST OF nOURES....................................................................................................................xiv
ABSTRACT................................................................................................................................xvi
CHAPTER IINTRODUCTION................................................................................................................ 1
Dissertation Overview..................................................................................................... 4Proposed Model.............................................................................................................. 5Research Questions......................................................................................................... 7Overview of the Proposed Study................................................................................... 8Contributions of the Research........................................................................................ 9
Academic Contributions............................................................................................. 10Managerial Contributions........................................................................................... 10
CHAPTER 2LITERATURE REVIEW.....................................................................................................12
Introduction...................................................................................................................... 12Current Theoretical Frameworks.....................................................................................12Role Variables.................................................................................................................. 14Selling Skills and Aptitude..............................................................................................21Motivation........................................................................................................................ 30Personal Factors.............................................................................................................. 33Organizational and Environmental Factors....................................................................42
Sales Contests............................................................................................................ 45Supervisory Behavior and Control........................................................................... 47Salesperson-Manager Relationship........................................................................... 52
Critique............................................................................................................................ 52
CHAPTER 3CONCEPTUAL FRAMEWORK AND HYPOTHESES
Introduction...................................................................................................................... 55Social Cognitive Theory................................................................................................. 55
Symbolizing.................................................................................................................56Forethought.................................................................................................................56Vicarious Capability................................................................................................... 57Self-Regulation........................................................................................................... 57Self-Reflection............................................................................................................ 57
Modeling.......................................................................................................................... 59Self-Efficacy.....................................................................................................................61
111
Reproduced with permission of the copyright owner. Further reproduction prohibited without permission.

Physiological State......................................................................................................... 65Past Performance........................................................................................................... 66Feedback........................................................................................................................ 66Expectancy..................................................................................................................... 68Adaptive Selling............................................................................................................ 68Effort.............................................................................................................................. 70Current Performance...................................................................................................... 71Summary........................................................................................................................ 73
CHAPTER 4RESEARCH METHOD..................................................................................................... 75
Introduction.................................................................................................................... 75Research Design............................................................................................................. 75Proposed Analysis of Measures..................................................................................... 76
Multivariate Normality............................................................................................. 76Internal Consistency and Dimensionality................................................................ 76Validity...................................................................................................................... 78
CHAPTERSDEVELOPMENT AND EVALUATION OF MEASUREMENT SCALES.................. 80
Introduction.................................................................................................................... 80Pretest Procedures......................................................................................................... 80
Sample and Context.................................................................................................. 80Data Collection......................................................................................................... 80
Self-Monitoring.............................................................................................................. 83Multivariate Normality............................................................................................. 84Internal Consistency and Unidimensionality............................................................ 84
Generalized Self-Esteem................................................................................................ 85Multivariate Normality............................................................................................. 86Internal Consistency and Unidimensionality............................................................ 86
Co worker Acceptance................................................................................................... 88Multivariate Normality............................................................................................. 89Internal Consistency and Unidimensionality............................................................ 89
Modeling........................................................................................................................ 91Construct Definition................................................................................................. 91Generation of Item Pool........................................................................................... 92Measurement Format................................................................................................ 92Review of Initial Item Pool...................................................................................... 92Inclusion of Validation Item s................................................................................... 93First Administration to Development Sample.......................................................... 93Evaluation of Items................................................................................................... 94Multivariate Normality............................................................................................. 94Internal Consistency and Dimensionality................................................................ 95Factor Loadings........................................................................................................ 97
Socialization................................................................................................................... 98
IV
Reproduced with permission of the copyright owner. Further reproduction prohibited without permission.

Multivariate Normality............................................................................................. 99Internal Consistency and Unidimensionality............................................................ 99
Job Tension.................................................................................................................... 101Multivariate Normality..............................................................................................102Internal Consistency and Unidimensionality.............................................................102
Past Performance............................................................................................................104Multivariate Normality..............................................................................................105Internal Consistency and Unidimensionality.............................................................105
Coworker Feedback....................................................................................................... 106Multivariate Normality..............................................................................................107Internal Consistency and Dimensionality................................................................. 108Factor Loadings.........................................................................................................110
Manager Feedback..........................................................................................................111Multivariate Normality..............................................................................................I l lInternal Consistency and Dimensionality................................................................. 112Factor Loadings........................................................................................................ 114
Self-EflScacy................................................................................................................... 116Expectancy..................................................................................................................... 116
Multivariate Normality..............................................................................................117Internal Consistency and Unidimensionality.............................................................117
Effort............................................................................................................................... 119Multivariate Normality..............................................................................................119Internal Consistency and Unidimensionality.............................................................120
Adaptive Selling.............................................................................................................121Multivariate Normality..............................................................................................122Internal Consistency and Dimensionality................................................................. 123Factor Loadings.........................................................................................................125
Current Performance...................................................................................................... 126Multivariate Normality..............................................................................................127Internal Consistency and Unidimensionality.............................................................127
Manager-Rated Performance.........................................................................................129Multivariate Normality..............................................................................................129Internal Consistency and Unidimensionality.............................................................130
Discriminant Validity..................................................................................................... 131
CHAPTER 6PROPOSED FINAL STUDY.............................................................................................133
Introduction.................................................................................................................... 133Sample............................................................................................................................133Context...........................................................................................................................134Data Collection...............................................................................................................134Proposed Measurement.................................................................................................. 135
Self-Monitoring........................................................................................................ 135Generalized Self-Esteem.......................................................................................... 136Co worker Acceptance..............................................................................................137
Reproduced with permission of the copyright owner. Further reproduction prohibited without permission.
Co worker Acceptance............................................................................................... 137Modeling.....................................................................................................................138Socialization............................................................................................................... 139Job Tension................................................................................................................ 140Role Conflict - Job............................................. 141Role Conflict - Manager............................................................................................ 142Role Conflict - Customer........................................................................................... 142Role Ambiguity - Job................................................................................................. 142Role Ambiguity - Manager......................................................................................... 142Role Ambiguity - Customer.......................................................................................142Past Performance........................................................................................................143Coworker Feedback................................................................................................... 143Manager Feedback......................................................................................................144Self-EfiBcacy............................................................................................................... 145Expectancy................................................................................................................. 147Efifort........................................................................................................................... 147Adaptive Selling.........................................................................................................148Current Performance.................................................................................................. 149Manager-Rated Current Performance........................................................................149
Proposed Analysis........................................................................................................... ISOMeasurement Model.................................................................................................. 150Structural Model.........................................................................................................150
CHAPTER 7FINAL STUDY: DATA COLLECTION AND EVALUATION OFMEASUREMENT SCALES...............................................................................................152
Introduction......................................................................................................................152Procedures in Final Study...............................................................................................152
Data Collection...........................................................................................................152Sample Characteristics............................................................................................... 153
Measurement Model Analysis and Results..................................................................... 155Self-Monitoring............................................................................................................... 155
Item Normality...........................................................................................................156Internal Consistency and Dimensionality.................................................................. 156
Task Specific Self-Esteem...............................................................................................158Item Normality...........................................................................................................158Internal Consistency and Dimensionality.................................................................. 158
Coworker Acceptance.................................................................................................... 160Item Normality...........................................................................................................160Internal Consistency and Dimensionality.................................................................. 160
Modeling..........................................................................................................................162Item Normality...........................................................................................................162Internal Consistency and Dimensionality.................................................................. 162
Socialization.................................................................................................................... 165Item Normality...........................................................................................................165
VI
Reproduced with permission of the copyright owner. Further reproduction prohibited without permission.

Role Ambiguity................................................................................................................ 167Item Normality........................................................................................................... 167Internal Consistency and Dimensionality..................................................................167
Role Conflict....................................................................................................................170Item Normality...........................................................................................................170Internal Consistency and Dimensionality................................................................. 170
Past Performance............................................................................................................. 172Item Normality...........................................................................................................173Internal Consistency and Dimensionality................................................................. 173
Coworker Feedback.........................................................................................................174Item Normality...........................................................................................................175Internal Consistency and Dimensionality................................................................. 175
Manager Feedback...........................................................................................................177Item Normality...........................................................................................................178Internal Consistency and Dimensionality..................................................................178
Self-Efi5cacy.....................................................................................................................180Item Normality...........................................................................................................180Internal Consistency and Dimensionality..................................................................181
Expectancy.......................................................................................................................182Item Normality........................................................................................................... 183Internal Consistency and Dimensionality..................................................................183
Effort.................................................................................................................................184Item Normality...........................................................................................................185Internal Consistency and Dimensionality..................................................................185
Adaptive Selling.............................................................................................................. 186Item Normality...........................................................................................................187Internal Consistency and Dimensionality..................................................................187
Current Performance........................................................................................................190Item Normality...........................................................................................................190Internal Consistency and Dimensionality..................................................................190
Discriminant Validity.......................................................................................................192
CHAPTER 8STRUCTURAL MODEL AND HYPOTHESES EVALUATIONS................................ 193
Introduction......................................................................................................................193Structural Model Evaluation...........................................................................................193Overall Model F it............................................................................................................ 195Structural Model F it........................................................................................................197Model Respecification.................................................... 199Evaluation of Hypotheses.............................................................................................. 206Modeling..........................................................................................................................206Self-EfiBcacy.................................................................................................................... 209Expectancy...................................................................................................................... 212Adaptive Selling..............................................................................................................214Efifort................................................................................................................................ 215
VII
Reproduced with permission of the copyright owner. Further reproduction prohibited without permission.

Current Performance....................................................................................................... 216Summary..........................................................................................................................217
CHAPTER 9CONCLUSIONS AND FUTURE RESEARCH................................................................218
Introduction......................................................................................................................218Findings and Theoretical Contributions......................................................................... 218Self-Efficacy....................................................................................................................219Modeling..........................................................................................................................224Summary..........................................................................................................................226Managerial Contributions............................................................................................... 227Limitations.......................................................................................................................228Future Research...............................................................................................................229
BIBLIOGRAPHY......................................................................................................................231
APPENDIX AFINAL STUDY SURVEY INSTRUMENTS....................................................................241
APPENDIX BCORRELATION MATRIX................................................................................................. 262
VITA...........................................................................................................................................264
V lll
Reproduced with permission of the copyright owner. Further reproduction prohibited without permission.

LIST OF TABLES
Table 2.1 Role Variables...................................................................................................... 15
Table 2.2 Skill and Aptitude Variables................................................................................ 21
Table 2.3 Motivation Variable(s)........................................................................................ 30
Table 2.4 Personal Factors................................................................................................... 34
Table 2.5 Organizational and Environmental Factors......................................................... 43
Table 5.1 Pretest Sample Demographic Information.......................................................... 81
Table 5.2 Psychometric Properties for Self-Monitoring..................................................... 85
Table 5.3 Standardized Loadings, Means and Standard Deviationsfor Self-Monitoring........................................................................................ 85
Table 5.4 Psychometric Properties for Generalized Self-Esteem....................................... 87
Table 5.5 Standardized Loadings, Means and Standard Deviationsfor Generalized Self-Esteem.......................................................................... 88
Table 5.6 Psychometric Properties for Coworker Acceptance.......................................... 90
Table 5.7 Standardized Loadings, Means and Standard Deviationsfor Coworker Acceptance............................................................................. 90
Table 5.8 Psychometric Properties for Modeling................................................................ 96
Table 5.9 Standardized Loadings, Means and Standard Deviationsfor Modeling.................................................................................................. 96
Table 5.10 F actor Loadings Comparison for Modeling........................................................ 98
Table 5.11 Psychometric Properties for Socialization........................................................... 100
Table 5.12 Standardized Loadings, Means and Standard Deviationsfor Socialization..............................................................................................101
Table 5.13 Psychometric Properties for Job Tension............................................................ 103
IX
Reproduced with permission of the copyright owner. Further reproduction prohibited without permission.

Table 5.14 Standardized Loadings, Means and Standard Deviationsfor Job Tension................................................................................................103
Table 5.15 Psychometric Properties for Past Performance................................................... 106
Table 5.16 Standardized Loadings, Means and Standard Deviationsfor Past Performance......................................................................................106
Table 5.17 Psychometric Properties for Coworker Feedback...............................................109
Table 5.18 Standardized Loadings, Means and Standard Deviationsfor Coworker Feedback..................................................................................109
Table 5.19 Factor Loadings Comparison for Coworker Feedback...................................... 111
Table 5.20 Psychometric Properties for Manager Feedback................................................. 114
Table 5.21 Standardized Loadings, Means and Standard Deviationsfor Manager Feedback.................................................................................... 114
Table 5.22 Factor Loadings Comparison for Manager Feedback........................................ 115
Table 5.23 Psychometric Properties for Expectancy............................................................ 118
Table 5.24 Standardized Loadings, Means and Stand Deviationsfor Expectancy.................................................................................................119
Table 5.25 Psychometric Properties for Effort.......................................................................121
Table 5.26 Standardized Loadings, Means and Standard Deviationsfor Effort......................................................................................................... 121
Table 5.27 Psychometric Properties for Adaptive Selling......................................................124
Table 5.28 Standardized Loadings, Means and Standard Deviationsfor Adaptive Selling........................................................................................ 125
Table 5.29 Factor Loadings Comparison for Adaptive Selling.............................................126
Table 5.30 Psychometric Properties for Current Performance.............................................. 128
Table 5.31 Standardized Loadings, Means and Standard Deviationsfor Current Performance.................................................................................128
Table 5.32 Psychometric Properties for Manager-Rated Performance.................................131
Reproduced with permission of the copyright owner. Further reproduction prohibited without permission.
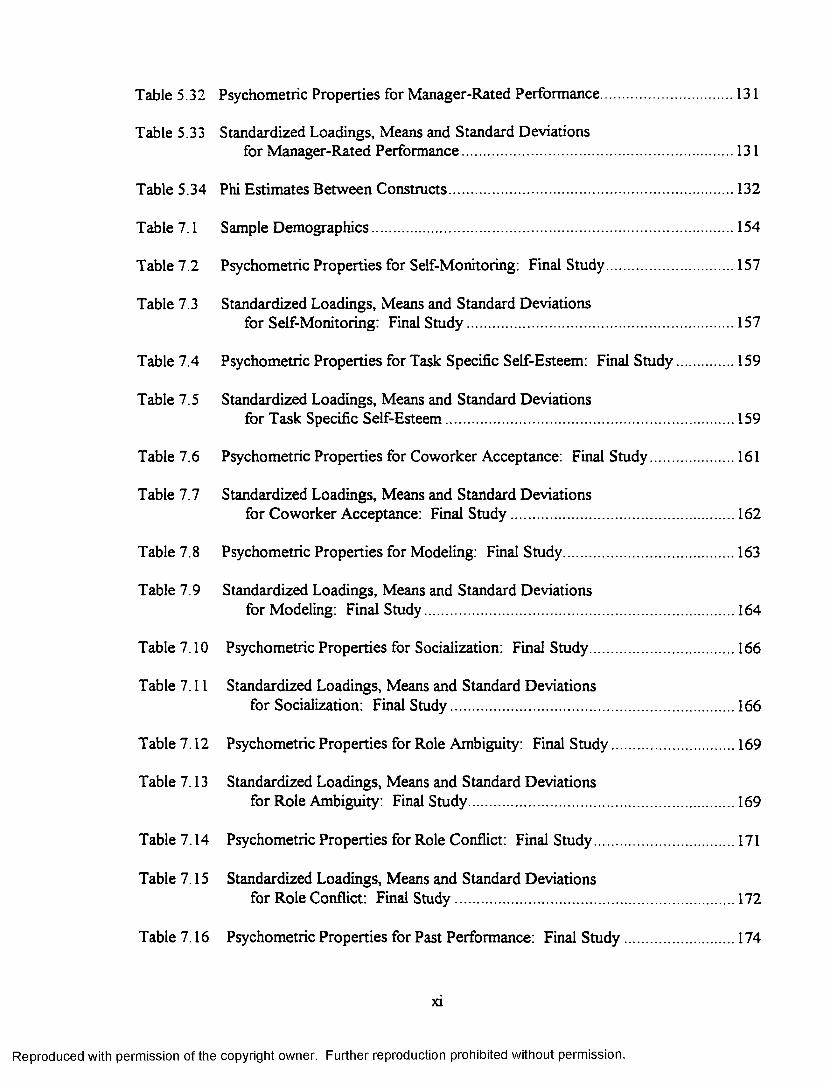
Table 5 .32 Psychometric Properties for Manager-Rated Performance..................................131
Table 5.33 Standardized Loadings, Means and Standard Deviationsfor Manager-Rated Performance.................................................................... 131
Table 5.34 Phi Estimates Between Constructs.........................................................................132
Table 7.1 Sample Demographics............................................................................................ 154
Table 7.2 Psychometric Properties for Self-Monitoring; Final Study................................. 157
Table 7.3 Standardized Loadings, Means and Standard Deviationsfor Self-Monitoring: Final Study................................................................... 157
Table 7.4 Psychometric Properties for Task Specific Self-Esteem: Final Study................ 159
Table 7.5 Standardized Loadings, Means and Standard Deviationsfor Task Specific Self-Esteem.........................................................................159
Table 7.6 Psychometric Properties for Coworker Acceptance: Final Study.......................161
Table 7.7 Standardized Loadings, Means and Standard Deviationsfor Coworker Acceptance: Final Study.........................................................162
Table 7.8 Psychometric Properties for Modeling: Final Study.............................................163
Table 7.9 Standardized Loadings, Means and Standard Deviationsfor Modeling: Final Study.............................................................................. 164
Table 7.10 Psychometric Properties for Socialization: Final Study..................................... 166
Table 7.11 Standardized Loadings, Means and Standard Deviationsfor Socialization: Final Study........................................................................166
Table 7.12 Psychometric Properties for Role Ambiguity: Final Study................................169
Table 7.13 Standardized Loadings, Means and Standard Deviationsfor Role Ambiguity: Final Study................................................................... 169
Table 7.14 Psychometric Properties for Role Conflict: Final Study.................................... 171
Table 7.15 Standardized Loadings, Means and Standard Deviationsfor Role Conflict: Final Study.......................................................................172
Table 7.16 Psychometric Properties for Past Performance: Final Study.............................174
XI
Reproduced with permission of the copyright owner. Further reproduction prohibited without permission.

Table 7.17 Standardized Loadings, Means and Standard Deviationsfor Past Performance: Final Study............................................................... 174
Table 7.18 Psychometric Properties for Coworker Feedback: Final Study.........................176
Table 7.19 Standardized Loadings, Means and Standard Deviationsfor Coworker Feedback................................................................................ 176
Table 7.20 Psychometric Properties for Manager Feedback: Final Study...........................179
Table 7.21 Standardized Loadings, Means and Standard Deviationsfor Manager Feedback: Final Study.............................................................179
Table 7.22 Psychometric Properties for Self-Efficacy: Final Study......................................182
Table 7.23 Standardized Loadings, Means and Standard Deviationsfor Self-Efficacy: Final Study.......................................................................182
Table 7.24 Psychometric Properties for Expectancy: Final Study........................................184
Table 7.25 Standardized Loadings, Means and Standard Deviationsfor Expectancy: Final Study.........................................................................184
Table 7.26 Psychometric Properties for Effort: Final Study................................................ 186
Table 7.27 Standardized Loadings, Means and Standard Deviationsfor Effort: Final Study...................................................................................186
Table 7.28 Psychometric Properties for Adaptive Selling: Final Study............................... 189
Table 7.29 Standardized Loadings, Means and Standard Deviationsfor Adaptive Selling.......................................................................................189
Table 7.30 Psychometric Properties for Current Performance: Final Study........................191
Table 7.31 Standardized Loadings, Means and Standard Deviationsfor Current Performance: Final Study..........................................................191
Table 8.1 Structural Model Fit Statistics............................................................................. 195
Table 8.2 Path Estimates of Proposed Structural Model.....................................................198
Table 8.3 for Structural Equations................................................................................. 198
Table 8.4 Standardized Loadings.........................................................................................199
XU
Reproduced with permission of the copyright owner. Further reproduction prohibited without permission.

T able 8.5 Modification Indices and Residuals..................................................................... 200
Table 8.6 Fit Statistics: Respecified Structural Model....................................................... 205
Table 8.7 R^ for Endogenous Constructs: Respecified Structural Model......................... 205
Table 8.8 Path Estimates: Respecified Structural Model...................................................205
T able 8.9 Hypotheses Evaluations: Respecified Model..................................................... 217
xm
Reproduced with permission of the copyright owner. Further reproduction prohibited without permission.

LIST OF FIGURES
Figure 3.1 Proposed Social Cognitive Model of Sales Performance................................ 74
Figure 5.1 Single Construct Model for Self-Monitoring................................................... 83
Figure 5.2 Single Construct Model for Generalized Self-Esteem.................................... 86
Figure 5.3 Single Construct Model for Coworker Acceptance........................................ 89
Figure 5.4 Correlated First-Order Factor Model for Modeling........................................ 94
Figure 5.5 Second-Order Factor Model for Modeling..................................................... 97
Figure 5.6 Single Construct Model for Socialization........................................................ 99
Figure 5.7 Single Construct Model for Job Tension........................................................... 102
Figure 5.8 Single Construct Model for Past Performance................................................. 104
Figure 5.9 Correlated First-Order Factor Model for Coworker Feedback....................... 107
Figure 5.10 Second-Order Factor Model for Coworker Feedback......................................110
Figure 5.11 Correlated First-Order Factor Model for Manager Feedback......................... 112
Figure 5.12 Second-Order Factor Model for Manager Feedback........................................115
Figure 5.13 Single Construct Model for Expectancy...........................................................117
Figure 5.14 Single Construct Model for Effort.....................................................................120
Figure 5.15 Correlated First-Order Factor Model for Adaptive Selling..............................123
Figure 5.16 Second-Order Factor Model for Adaptive Selling............................................126
Figure 5.17 Single Construct Model for Current Performance............................................127
Figure 5.18 Single Construct Model for Manager-Rated Performance...............................129
Figure 8.1 Social Cognitive Theory Structural Model........................................................196
Figure 8.2 Respecified Model 1.......................................................................................... 202
Figure 8.3 Respecified Model 2...........................................................................................203
XIV
Reproduced with permission of the copyright owner. Further reproduction prohibited without permission.

Figure 8.4 Respecified Model 3............................................................................................ 204
Figure 8.5 Respecified Social Cognitive Theory Model......................................................207
XV
Reproduced with permission of the copyright owner. Further reproduction prohibited without permission.

ABSTRACT
A primary objective of marketing practitioners, especially sales managers in
organizations with personal selling functions and salesforces, has been an understanding of
the factors related to effective sales performance. Much of the current research dedicated
to understanding these factors has been grounded in Vroom’s expectancy theory which
posits that successful performance of a task is a function of the level of effort that a person
expends on the task. There are three factors that influence this level of effort: (1) an
expectation that effort will result in better performance; (2) a belief that better
performance will result in meaningful rewards; and (3) a trust that earned rewards will be
paid or given to an individual. Such past research, however, has explained only a small
part of the variance in performance among salespeople.
The purpose of this dissertation was to examine the usefulness of Bandura’s social
cognitive theory in explaining a salesperson’s level of performance. A central concept in
social cognitive theory is that individuals’ levels of self-efBcacy, beliefs they possess the
necessary abilities to successfully perform a specific task, will have a direct influence on
their levels of expectancy, and thus, levels of effort. Bandura also suggests that modeling
the behaviors of coworkers is key in the development of a person’s self-efficacy.
In this study o f400 salespeople in automobile dealerships in Louisiana, it was
found that a person’s level of self-efBcacy did have a significant impact on expectancy and
effort. Additionally, self-efficacy was found to have an effect on the practice of adaptive
selling skills by the responding salespeople. Two additional findings in the study were also
significant. First, modeling the behaviors of coworkers did not influence levels of self-
efficacy. Second, performance feedback from other salespeople in an organization had a
XVI
Reproduced with permission of the copyright owner. Further reproduction prohibited without permission.

much greater impact on levels of self-efBcacy than did feedback from sales managers.
The results of the study suggest that social cognitive theory can be utilized along with
expectancy theory in developing a greater understanding o f the factors related to
successful sales behaviors in a personal selling environment.
xvu
Reproduced with permission of the copyright owner. Further reproduction prohibited without permission.

CHAPTER 1
INTRODUCTION
One factor in the success of almost every selling enterprise is an organization’s
ability to develop a strong personal selling representation with its customers and
prospects. A successful organization must attract, select, and train sales representatives
who have capabilities to successfully perform the selling task, and must retain and
encourage salespeople who perform effectively.
Indicators of the importance of personal selling in today’s economy is the large
dollar expenditures invested in the selling activity and the significant number of persons
employed in sales. In 1986 businesses in the United States invested approximately $127
billion and employed over seven million people in personal selling activities (Dalrymple
and Cron 1992). Substantial amounts of time and money are invested in building and
maintaining effective sales organizations. In some high-technology fields, such as
computers, the formal training program may last up to two years and companies may
invest more than $100,000 before a salesperson becomes a productive part o f a firm’s
marketing program. In 1979, total marketing costs for industrial companies ranged from
8.6 percent to 16.7 percent of sales depending on the size of the companies in terms of
annual sales revenue. Personal selling costs, as a percent of these total marketing
expenses, ranged from 4.3 percent to 7.8 percent, again depending on the size o f the
companies (Churchill et al. 1985).
The role of personal selling in a successful marketing strategy can be illustrated in
the case of Lanier Business Products. In the 1960’s, Lanier was a regional distributor of
dictating machines in the southern United States with annual sales of approximately $12
1
Reproduced with permission of the copyright owner. Further reproduction prohibited without permission.

million. By 1982, the company had become a nationwide manufacturer and marketer of
both dictating and word processing equipment with earnings of about $13 million on
sales of $350 million. Lanier’s sales in 1982 accounted for one third of total sales in the
word processing industry (Business Week 1983). Lanier executives attributed this
industry-leading growth to both its customer-oriented market approach and to its
aggressive, professional sales force.
Understanding the determinants of salesperson performance has been a major
topic of interest to marketing managers and scholars. American firms spend an estimated
$10 billion annually on sales training, with the average cost of training an industrial
products salesperson exceeding $25,000 (Leong et al. 1989). The interest by academic
researchers is indicated by a meta-analysis consolidating research results fi-om more than
100 articles reporting associations between sales performance and its antecedents
(Churchill et al. 1985).
In the last 10 years, business organizations in the United States averaged
investing more than $7 billion on various personnel administration activities. Of this
total, a substantial amount is invested in recruiting and training salespeople (Avila and
Fern 1986).
Personal selling is one of the most important elements in marketing
communications for most business-to-business sales organizations. Unfortunately,
personal selling effort and sales outcomes involve substantial individual differences in
the performance o f its principal component - the salesperson. One third of industrial
salespeople typically account for 62 percent of orders received by a company (Weitz
1978). Because o f this high variance in sales performance, it is important for sales
Reproduced with permission of the copyright owner. Further reproduction prohibited without permission.

management to identify the factors associated with these individual differences. Isolating
these factors has important implications for the criteria used in selecting salespeople, the
amount of emphasis placed on training, and the specific elements that should be
incorporated in a sales training program. Walker et al. (1977) reviewed factors related
to successful sales outcomes and suggested that a salesperson’s performance is a
function of an individual’s: (1) level of motivation; (2) sales aptitude; and (3) perception
of how the sales role should be performed. Some variance in performance, however, is
related to the environment in which a salesperson operates and cannot be attributed to
individual salespersons’ activities.
Ineffective performance can also be a major factor in high turnover rates among
salespeople (Darmon 1993). Recruiting salespeople with a high potential for success is
often a recurrent and continuous task for sales managers. The cost, time and energy
requirements of operating a salesforce are at record levels. Thus, one of today’s major
concerns of sales management is turnover. The cost of recruiting, training, and the
opportunity costs of lost business due to a vacated sales territory can, on average, be
almost $75,000 per salesperson (Futrell and Parasuraman 1984). As a result, it is
important that organizations understand factors related to longevity in a sales career.
Knowing how to characterize salespeople who have the greatest potential to be
successful in specific selling situations offers the potential for increased efficiency in
recruiting as well as lower salesforce turnover rates. The net result means lower
recruiting and training costs, along with higher levels of sales productivity and profit
generation.
Reproduced with permission of the copyright owner. Further reproduction prohibited without permission.

Given the large investment in personal selling by business organizations, it is
surprising that knowledge gaps still exist in our understanding of the factors antecedent
to effective sales performance. Reviewing these investments, it would seem especially
important to identify factors that have significant impacts on a salesperson’s performance
and to understand their relationship to successful selling outcomes.
Salespeople have a key influence on a firm’s success. And with such major
investments in selling personnel and a company’s industry share and bottom line outcome
depending on these salespeople, it is important to understand the factors that contribute
to a salesperson’s performance.
Dissertation Overview
Most research related to sales performance is grounded in two theories,
expectancy theory and job characteristics (Becherer et al. 1983). The central idea of the
expectancy model is that the strength of a tendency for a salesperson to behave in a
certain way is a function of the strength of a salesperson’s expectancy that the behavior
will be followed by a specific consequence or result. The primary emphasis of the job
characteristics model is that salesperson motivation to perform, job satisfaction, and job
performance are a function of task design. The job characteristics model identifies five
core job dimensions hypothesized to result in psychological states that result in more
effective work outcomes.
Existing sales performance literature draws on expectancy theory and the job
characteristics model to hypothesize relationships of individual salesperson factors (e.g.
organizational commitment) and characteristics of the selling task (e.g. role ambiguity)
Reproduced with permission of the copyright owner. Further reproduction prohibited without permission.

to successful sales performance. This research addresses a gap in this sales performance
literature, utilizing Bandura’s social cognitive theory to examine the influence o f a
salesperson’s self-efBcacy on performance and the antecedents o f self-efBcacy in a
personal selling environment. The objective of this research is to develop a social
cognitive model of sales performance and to examine the relative influence of
environmental factors on a salesperson’s level of personal belief that the individual has
the capability to effectively perform a selling task.
Proposed Model
An overview of the proposed conceptual model is briefly described this section.
The proposed model is described in greater detail in Chapter 3, including the theoretical
support for the proposed relationships in the model.
The proposed conceptual model in this research hypothesizes that effective
performance in a specific sales environment is directly related to the level of effort a
salesperson expends in the selling task. This is important because a salesperson can have
excellent personal selling skills, yet fail to achieve sales goals due to a lack o f efifort in
the task, while an individual with less selling skills performs successfully given a high
level of task effort. Key to a high level of effort in a task is a person’s expectancy that
the effort will result in specific desirable outcomes, and an inner belief that a person has
inherent capabilities making successful performance in a task possible.
Key to a person’s level of effort in a selling task is the individual’s belief he or
she possesses the capabilities necessary for successful performance of the task (self-
efBcacy) (Bandura 1986). The more that salespeople believe that they have the
necessary sales skills and can successfully perform a selling task, the harder they will
Reproduced with permission of the copyright owner. Further reproduction prohibited without permission.

work at a sales task and the more effort they will expend to successfully perform. Sujan,
Weitz, and Kumar (1994) reported that salespeople high in self-efiBcacy exhibit a greater
performance orientation to working hard (as compared to salespeople lower in self-
efiBcacy), and that these high self-eflBcacious salespeople require less external
encouragement in the sales task.
Based on Bandura’s social cognitive theory, it will be hypothesized in the
proposed model that there are four antecedents o f self-eflBcacy in a personal selling
context. Modeling is the observance and practice of behaviors of peers that result in
successful outcomes. Role stress, a psychological state, is the level of apprehension an
individual feels regarding the potential for a successful outcome in a specific task. Past
performance is the level of success experienced by an individual in a similar task
preceding the current task. Feedback is the input a person receives from both managers
and peers regarding the performance of a task. For example, when a salesperson is told
by a manager or other salespeople that they are doing a good job, belief that one has
capabilities contributing to success is enhanced, leading to additional effort on the job.
Conversely, when a salesperson is informed by a manager or other salespeople that they
are not doing a good job, belief in one’s capabilities is diminished, with an adverse effect
on effort in the task.
The proposed social cognitive model of salesperson performance also
hypothesizes three antecedents of a salesperson’s level of modeling activities (i.e.,
learning successful sales behaviors from peers through the observance o f successful
behaviors and incorporating these observed behavior into their own practices): (1) self
monitoring; (2) self-esteem; and (3) acceptance by coworkers. First, to the extent
Reproduced with permission of the copyright owner. Further reproduction prohibited without permission.

individuals make self-appraisals of their performance of a specifc task (self-monitoring),
they tend to alter behaviors if the outcomes of the behaviors (e.g., sales performance) do
not fit desired self-images they have established for themselves. Second, individuals that
feel generally good about themselves and maintain good personal images of themselves
(self-esteem) should exhibit greater tendencies to incorporate the successful behaviors of
peers. Persons high in self-esteem tend to feel that the modeled behaviors will have
successful outcomes personally. Third, among individuals that are accepted by those in
the work group (i.e., incorporated into and made to feel a part of the group) there is a
higher level of modeling, or actively practicing the behaviors of peers, due to a desire to
maintain their status as an integral part of a group by performing up a group’s standards.
Research Questions
While each of the paths in the proposed social cognitive model represents a
hypothesis to be tested in this study, the study addresses three general research
questions. First, what is the role of modeling the behavior of other salespeople in
developing a higher level of belief in one’s own capabilities to successfully perform a
sales job? This is an important element concerning one’s self-efficacy that has not been
addressed in the sales performance literature.
Second, what are the antecedents of modeling task behaviors and what is the
relative contribution of each factor to the overall level of modeling a person attempts?
While modeling has been identified as antecedent to self-efiBcacy in Bandura’s social
cognitive theory, there have been no attempts by researchers to empirically test the
relationship between self-efiBcacy and modeling, or the antecedents of modeling
behavior.
Reproduced with permission of the copyright owner. Further reproduction prohibited without permission.
8
Third, does social cognitive theory provide additional explanation of effective
performance by salespeople? Existing sales performance research has examined the
effects of both environmental and personal variables on sales behaviors. This research,
however, has not examined the role of self-efficacy in a selling context nor the impact of
environmental variables on an individual’s level of self-efficacy.
Based on the proposed social cognitive model, this research will examine the
following specific questions: (1) What is the impact of a salesperson’s belief that he/she
possesses certain capabilities to successfully perform on ultimate performance? (2) What
are the determinants of this belief in one’s capabilities and what are their relative
importances? (3) What is the relative importance of the factors that lead a salesperson to
actively practice modeling (i.e., incorporate the selling behaviors of other salespeople)?
(4) Which source of performance feedback (manager or coworker) has greater influence
on the level of a salesperson’s belief in his/her capabilities to successfully perform a
selling task?
Overview of the Proposed Study
The proposed social cognitive model of sales performance will be examined in a
the context of automobile dealerships. The sample will consist of automobile salespeople
in dealerships throughout Louisiana. Automobile salespeople were selected for this
research for three reasons: (1) a larger sample of salespeople can be more readily
contacted than with other types of salespeople; (2) automobile salespeople have a high
level of control over the effort they expend in performing their sales job; and (3)
automobile dealerships provide a selling environment in which salespeople report to sales
Reproduced with permission of the copyright owner. Further reproduction prohibited without permission.

managers and have sufiBcient opportunities to observe the behaviors and associated
performance outcomes of other salespeople.
The proposed sales performance model will be tested with structural equation
modeling. Structural equation modeling estimates the hypothesized relationships, while
accounting for random measurement error. Thus, structural equation modeling provides
for a more rigorous test of social cognitive theory in a selling environment.
This research will be conducted in two stages. In the first stage, a pretest of the
proposed measures will be conducted. Measurement items with potential problems can
be identified early in the research allowing refinement of the measures for the final study.
A pretest also provides initial estimates of the psychometric properties of the measures
to be used in the study. Scale dimensionality, internal consistency, and discriminant
validity can be assessed and modifications to measures made to ensure accuracy in the
primary study.
The second stage of this research will consist of final data collection and analysis.
This data will serve as the main dissertation study in which the proposed model and
hypothesized relationships will be tested.
Contributions of the Research
The objective of the proposed dissertation is to examine the contribution of
Bandura’s social cognitive theory in the explanation of variance in sales performance
among individual salespeople. There are both academic and managerial contributions
resulting from this study.
Reproduced with permission of the copyright owner. Further reproduction prohibited without permission.

10
Academic Contributions
Social cognitive theory has not been extensively used in marketing research as an
explanation of sales performance. Self-efiBcacy, a primary determinant of task
performance through task effort in social cognitive theory, has not been considered as
antecedent to performance in existing marketing literature that proposes both individual
and environmental factors as performance determinants. This empirical research will
provide a test of social cognitive theory as a useful explanation of variance in individual
sales performance. The study will examine the contribution of the antecedents
(modeling, psychological state, past performance, and verbal persuasion) to a
salesperson’s level of self-efiBcacy.
Additionally, the proposed research examines the role of self-monitoring, self
esteem and peer (coworker) acceptance in a salesperson’s level of modeling behaviors,
incorporating observed actions of other salespeople, which contribute to increased
performance levels. These antecedents of modeling behavior have not been tested.
Thus, byproduct of the proposed research will be the development of a scale to measure
the modeling construct.
By bringing together the antecedents of self-efiBcacy into a single performance
model, the proposed research should fill a gap in our understanding of the factors that
contribute to successful task performance in a personal selling context
Managerial Contributions
As discussed previously, business organizations in the United States invest more
that $127 million and employ over seven million people in personal selling activities.
Direct selling organizations, as an industry, account for over $14 billion in annual sales in
Reproduced with permission of the copyright owner. Further reproduction prohibited without permission.

11
the United States and more than $40 billion worldwide. It is incumbent on sales
managers that they understand the factors contributing to a salesperson’s successful
performance. This research should contribute to such understanding.
This is also the first research examining the role of modeling in an individual’s
level of self-efiBcacy. This should assist sales managers in the development o f sales
training programs. It is anticipated that, based on the role of modeling, a key part of a
sales training program would be the opportunity to work with successful salespeople in
an organization, observing, first-hand, desirable sales behaviors. Inexperienced
salespeople would then have opportunities to practice and to incorporate successful
behaviors into their own job behaviors.
Increasing the performance levels of salespeople positively affects an
organization’s bottom line. Such an increase in performance may result in additional
revenue from increases in sales volume, while salesperson turnover associated with
inadequate performance is reduced. Subsequently, costs associated with recruiting,
hiring and training new salespeople are less, along with opportunity costs associated with
uncovered, or inadequately covered, sales territories due to turnover.
Reproduced with permission of the copyright owner. Further reproduction prohibited without permission.

CHAPTER 2
LITERATURE REVIEW
Introduction
The objective of this dissertation is to model antecedents o f salesperson
performance based on the theoretical foundation of social cognitive theory. The purposes
of Chapter 2 are threefold: (1) survey the current body of salesperson performance
marketing literature; (2) offer a critique of the current salesperson performance literature;
and (3) review the potential contribution of social cognitive theory to the study of
salesperson performance.
Current Theoretical Frameworks
The majority of sales performance research to date has been grounded in either
Vroom’s expectancy theory (Vroom 1964) or Hackman and Lawler’s job characteristics
model (Hackman and Lawler 1971). The main tenet of expectancy theory in a personal
selling context is that the strength of a tendency for a salesperson to behave in a certain
way is a function of the strength of a salesperson’s expectancy that the act will be
followed by a specific consequence (Becherer et al. 1982). Expectancy theory posits that
the key to successful performance is motivation to perform, and that motivation is
dependent on three elements: (1) rewards for specific action or performance must be
present and achievable; (2) the rewards for specific action or performance must have
valence to a person (i.e. the rewards must be personally valuable and desirable); and (3) a
person must believe that the rewards will be made available should they be earned.
Vroom’s (1964) original theory was concerned with predicting the amount of effort that
workers would expend on various types of tasks associated with their jobs (i.e., their
12
Reproduced with permission of the copyright owner. Further reproduction prohibited without permission.

13
motivation to work). The original theory has since been expanded to include a prediction
of the level of job performance that would result due to the level o f motivation (Walker et
al. 1977). In their seminal article. Walker et al. further extended the expectancy model,
specifically adapting the model to an industrial sales context. The Walker et al. model is
further explicated below in the discussion related to motivation variables.
The job characteristics model, on the other hand, suggests that performance in a
given task is the result of the properties, or job dimensions, of a given job. The major
emphasis of the job characteristics model is that motivation, satisfaction, and job
performance are a function of the task design (Becherer, Morgan and Richard 1982).
Core job dimensions, or role variables, such as skill variety, task identity, task significance,
autonomy, and feedback, are antecedent to successful task outcomes (Becherer, Morgan
and Richard 1982).
Sales managers have always attempted to understand the determinants of effective
sales performance. Responding to this interest, researchers have examined many possible
antecedents of performance (see Churchill et al. 1985). Unfortunately, these existing
studies produced inconsistent results regarding the determinants of sales performance and
the strength of such relationships.
In a meta-analysis of research examining the determinants of salespeople’s
performance, Churchill et al. (1985) reported on 116 articles with 1,653 associations
between salesperson performance and determinants of that performance. The authors
grouped the determinants of performance into six classes based on the performance model
developed by Churchill, Ford and Walker (1985). These determinants of performance
were; (1) role variables; (2) selling skills; (3) motivation; (4) personal factors;
Reproduced with permission of the copyright owner. Further reproduction prohibited without permission.

14
(5) aptitude; and (6) organizational/environmental factors. More than 50 percent of the
correlations in these articles represented the correlations between aptitude measures and
salesperson performance. There were 407 correlations between personal factors and
performance, 178 between selling skills and performance, 126 between motivation and
performance, and 59 between role variables and performance. Only 51 correlations
between organizational/environmental factors and performance were reported. These six
categories of antecedents of performance are used in this study for the purposes of
organizing and reviewing the current literature related to salesperson performance. Selling
skills and aptitude have been grouped together since skills and aptitudes can overlap in
definition and for conciseness and clarity.
Role Variables
Role variables are characteristics of a specific job that are a result of the way in
which a specific job is designed. Role variables frequently utilized in task performance
research include;
Task identity - the extent to which a job requires the completion of a whole
and identifiable piece of work.
Task significance - the degree to which a job has a substantial impact on the
lives and activities of others.
Autonomy - the degree of fi-eedom and discretion an individual has in scheduling
and determining the procedures for carrying out the work assignment.
Feedback - the extent people obtain direct and clear information regarding the
effectiveness of their performance in a task.
Reproduced with permission of the copyright owner. Further reproduction prohibited without permission.

15
Empirical studies and theoretical articles, related to sales performance,
encompassing role variables and job dimensions are summarized in Table 2.1.
Table 2.1 Role Variables
Author(s) SellingEnvironment
IndependentVariable(s)
Findings/Propositions
Becherer, Morgan and McDonald (1983)
Industrial dataprocessingequipment
Skill variety; task identity; ta^ significance; autonomy, feedback
Identified five variables as distinct antecedents of sales performance.
Behrmanand Perreault, Jr. (1984)
Industrial goods Integration required; locus of control; influence over standards; closeness of supervision; communications frequency; role conflict; role ambiguity need for achievement
Relative to other variables, role ambiguity had greatest impact on job performance.
Evans and Grant (1992)
Banking services Reward structure: salary; commission bonus
Customer satisfaction was greater when service provider was rewarded with bonuses based on performance of selling activities.
Hater and McCuen (1985)
Insurance Other-directedness;verbalintelligence; job- related tension; role ambiguity; task-specific selfesteem
Task-specific self-esteem, and territory potential had positive cfiect on sales performance, whereas job- related tension and verbal intelligence had negative impacts on performance.
John and Weitz (1989)
Manufacturingorganizations
Salarycompensation;incentivecompensation
Salary-based compensation more effective when following conditions exists:(1) difficulty of replacing salespeople is high; (2) it is difficult to accurately assess performance; and (3) an uncertain environment exists.
Kerber and (Campbell (1987)
Computers Organizational turnover, tenure; time spent on major work activities
Longer tenure positively associated with higher objective sales performance.Turnover associated with low sales performance.Of three work activities examined, only one (order processing) exhibited a significant effect on performance.
(table cont.)
Reproduced with permission of the copyright owner. Further reproduction prohibited without permission.

16
Rhoads, Singh and Goodell (1994)
General across two samples: (1) small to medium-sized businesses and (2) a large Fortune 500 firm
Role ambiguity Internal role ambiguity (e.g., demands by managers, feedback from coworkers, and company issues) was more significant in its ^kct (negative) on job satisfaction than was external role ambiguity (e g., family demands, customer interactions, and ethical issues).
Shipley and Kiely (1986)
Industrial goods and services
Salesforce motivators (e.g., self satisfaction in doing a good job, making more money, recognition, keeping job, etc.)
Self satisfaction was found to be the strongest motivating factor (out of 10). Meeting family responsibilities and improving quality of lifestyle were significant motivators. Interestingly, satisfying manager’s expectations was rated as only a mild to moderately strong motivating factor.
Tyagi (1985) Life instuance Job dimensions (skill and variety; autonomy, importance; task identity and feedback) and leadership behaviors (trust and support; goal emphasis; interaction; and psychological influence
Job dimensions have substantial influence on intrinsic motivation of salespeople (especially autonomy and feedback).Leadership behaviors had a more significant impact on extrinsic motivation of salespeople.
In an industrial sales setting (data processing equipment), Becherer et al. (1982)
utilized the job characteristics model to study the impact of several job characteristics on
a salesperson’s motivation to work. They found that core job dimensions, such as task
identity and significance, autonomy, and feedback directly influenced three critical
psychological states (meaningfulness of work, responsibility for outcomes, and knowledge
of results of work activity) which had a direct impact on personal and work outcomes,
specifically internal work motivation, general job satisfaction, and growth
satisfaction. Their findings are generally supportive of the job characteristics model.
Their research supports the concept that job-related factors influence the satisfaction and
Reproduced with permission of the copyright owner. Further reproduction prohibited without permission.

17
motivation of salespeople. The internal motivation, general satisfaction and growth
satisfaction of salespeople are positively related to their perceptions of their psychological
states.
Becherer, Morgan and McDonald (1983) further examined the job characteristics
model in a selling environment by researching the dimensionality o f perceived job
characteristics in the context of industrial sales. Utilizing factor analysis, the authors
found that five factors (job characteristics) emerged in support of the model. These five
factors were; (1) skill variety; (2) task identity; (3) task significance; (4) autonomy; and
(5) job feedback.
Utilizing the job characteristics model, Tyagi (1985) reported on a study of 168
life insurance salespeople examining the relative importance of key job dimensions and
leadership behaviors in motivating salesperson work performance. In keeping with the job
characteristics model, the key job dimensions examined were skill and variety (the extent
to which a job offers the salesperson a chance to use his/her skills and abilities and calls for
a salesperson to engage in a wide range of behavior), autonomy (the fireedom in a given
job to determine the nature of the tasks or problems and to arrive at a course of action),
importance (the extent a person feels the job makes a meaningful contribution to the
organization), task identity (the degree to which the job requires completion of a whole
and identifiable piece of work), feedback (the degree an individual obtains direct and clear
information about the effectiveness of his/her job performance), and agent’s feedback (the
information regarding job performance received fi’om fellow salespeople). Leadership
behaviors examined by Tyagi included trust and support, goal emphasis, interaction,
psychological influence (the extent employees feel that their ideas are sought by
Reproduced with permission of the copyright owner. Further reproduction prohibited without permission.

18
management and taken into consideration when designing jobs and evaluating
performances), and hierarchical influence (the degree to which workers feel that their
manager is successful in getting management to recognize both their problems and
successes). Tyagi found that the key job dimensions have a substantial influence on the
intrinsic motivation of salespeople. In particular, autonomy and feedback were
instrumental in affecting sales performance. By comparison, leadership behaviors had a
significant influence on extrinsic motivation in salespeople. Hierarchical influence had the
greatest impact on this extrinsic motivation.
A central premise of much of the research on role variables is that certain
characteristics of the sales role are conducive to a stressful work situation, and that such
job stress may have a negative impact on a salesperson’s job performance (c.f. Teas 1983).
Behrman and Perreault (1984) proposed a model of the antecedents and consequences of
salesperson role stress (role ambiguity and role conflict), particularly the impact of role
stress on sales performance and satisfaction. Behrman and Perreault posited two
components of role stress: (1) role conflict - “the extent to which the sales rep must find
jointly satisfying solutions to often divergent expectations o f company and customer goals
(p. 12);” and (2) role ambiguity - “the degree to which a sales rep is uncertain about
others’ expectations with respect to the job, the best ways to fulfill known role
expectations, and the consequences of different aspects of role performance (p. 12).”
Behrman and Perreault reported that role ambiguity had a significant negative effect on
both job performance and job satisfaction, while role conflict was significantly related
negatively only to a salesperson’s job satisfaction.
Reproduced with permission of the copyright owner. Further reproduction prohibited without permission.

19
In support of Behrman and Perreault (1984), Roads et al. (1984) further developed
both the external and the internal dimensions of the role ambiguity variable and its impact
on sales performance and job satisfaction. External dimensions consisted of family
expectations and demands, customer expectations, and issues related to ethical situations
that arise in dealing with customers. Internal dimensions consisted of factors such as
autonomy, managerial expectations and demands, issues in dealing with coworkers, and
coworkers expectations and demands.
Another area of research related to role variables, or task design, has been that of
salesforce compensation and its influence on sales performance. Two research studies are
representative. Evans and Grant (1992) concluded that, as service providers begin to
integrate sales responsibilities into the roles of service provision personnel, these service
personnel will engage in actively and aggressively selling services for which they are
additionally compensated (e.g., commission on sales). Barton and Weitz (1987) utilized a
transaction cost analysis framework to develop a model of the role of salary in a sales
compensation plan for industrial organizations. They reported that salary compensation
(as compared with commission compensation) had a greater moderating effect on
variables related to non-selling efforts/activities on sales. For example, the role of salary
decreases as salespeople spend more time on direct selling activities than on non-selling
activities, as salespeople have more selling resources at their disposal, and as customers
have greater information needs. Salary was also found to have a greater impact on sales
performance as it became more difficult to objectively assess a salesperson’s performance.
In a computer sales environment, Kerber and Campbell (1987) explored three
correlates of objective sales performance: (1) tenure; (2) work activities; and (3)
Reproduced with permission of the copyright owner. Further reproduction prohibited without permission.

20
turnover. It can be expected that due to a learning curve, the performance of new
salespeople will be initially low with increases over time as a ftinction of increasing skill.
Thus, longer tenure in an organization was found in Kerber and Campbell’s study to be
associated with higher objective sales performance. It can also be expected that lower
performing salespeople not meeting sales goals will be more likely to leave an
organization. Thus, turnover was associated with low sales performance. Of three work
activities examined in the study (order processing, customer contact, and dealing with
coworkers), only order processing was significantly correlated with performance. This,
however, could be expected since orders being processed directly represent performance.
That is, the more sales, the more orders to process, the higher the level of performance.
In the existing literature, salesforce motivation to expend sales effort is thought to
lead to high salesforce performance (c.f. Walker, Churchill and Ford 1977). Shipley and
Kiely (1986) examined such motivation fi"om the standpoint of Herzberg’s dual factor
theory. The model posits that job performance is determined by workers’ motivation
which, in turn, is a function o f workers’ satisfaction and dissatisfaction arising from factors
associated with the job. Moderately to extremely strong motivators among the salesforce
were such items as personal satisfaction derived from doing a good job, being able to
satisfy customer needs, increased opportunities for promotions, ability to make more
money, ability to keep one’s job, and acknowledgment of effort by managers.
Hafer and McCuen (1985) examined both role variables and personal variables as
antecedents of performance and satisfaction in a service sales force (insurance agents) as
compared to an industrial sales force (industrial salespeople). The authors’ results suggest
that of the personal variables included in the study, task-specific self-esteem had a
Reproduced with permission of the copyright owner. Further reproduction prohibited without permission.

21
significant and positive effect on sales in the industrial sample, while the personal variable
of verbal intelligence had a significant and negative effect on sales. Of the role variables,
only job tension had a significant effect (negative) on sales. In the insurance sample, task-
specific self-esteem was most highly correlated in a positive direction with sales. Role
ambiguity had the greatest negative effect on sales.
Selling Skills and Aptitude
Much marketing research related to sales performance has been concerned with
performance factors external to a salesperson (e.g. environmental factors) and with some
factors internal to a salesperson (e.g. individual differences). It is somewhat intuitive,
however, that before such performance factors can have a significant effect, there must
exist some basic level of selling skill and aptitude within a salesperson. Research related
to selling skills and aptitudes is summarized in Table 2.2.
Table 2.2
Author(s) SellingEnvironmen
t
IndependentVariable(s)
Findings/Propositions
Castleberry and Shepherd (1993)
General Cognitivelisteningskills;Situationalmoderators;andBehavioral listening skills
Listening skills lead to a greater perception of customer’s beliefs and values. This perception leads to the practice of adaptive selling behaviors. These adaptive selling behaviors lead to greater salesperson performance.
DeCormier and Jobber(1993)
Lifeinsurance
Counselor selling method
Counselor selling method had a positive effect on sales effectiveness.
Goolsby, Lagace and Boorom (1992)
Diverseindustries
Psychologicaladaptiveness
(1) Self-monitoring and androgyny were directly related to levels of performance.(2) Intrinsic reward motivation was indirectly related to performance through a need for technical knowledge, providing of information to customers, and controlling of expenses.
(table cont.)
Reproduced with permission of the copyright owner. Further reproduction prohibited without permission.

22
Lambert, Marmorstein and Sharma (1990)
Chemicalindustry
Accuracy of perceptions of customers; salesexperience; age; sales training; education; and gender
Salespersons’ performances were directly related to the accuracy of their predictions of customers’ expected performance levels.
Leong, Busch, and John (1989)
Lifeinsurance
Knowledge bases (scripts) based on specific sales situations: ^ ic a l or less typical situations.
Significant relationships existed between sales performance and the knowledge bases of salespeople.
Predmore and Bonnice (1994)
Telemarketing
Salesperson’s adaptation during a sales interaction.
Salespeople who had more adaptive behaviors were more likely to be successful.
Schuster and Danes (1986)
Travelagency
Task vs. socio- emotional salesperson comments; Types of questions used to control sales conversations.
Customers responded positively to both task (product) and socio-emotional (relationship) comments from salespeople.
Sprio and Weitz (1990)
Diagnostic equipment and supplies
Intrinsicmotivation;Salesexperience;Managementstyles.
The level of a salesperson’s intrinsic motivation had a positive effect on the person’s practice of adaptive selling.The experience of salespeople had a positive effect on the practice of adaptive selling.The practice of adaptive selling was affected by sales management styles.
Sujan, Weitz and Kumar (1994)
Health care andbroadcasting
Fositive/negative feedback;Learningorientation;Performanceorientation;Workingsmart;Working hard
Salesperson productivity depends significantly on developing a learning orientation among salespeople, along with a performance orientation to the selling task
Sujan, Weitz and Sujan (1988)
General: approximatel y 2000 assorted companies.
Adaptiveselling
The authors make several suggestions for improving selling effectiveness through increasing the adaptability of salespeople.
(table cont.)
Reproduced with permission of the copyright owner. Further reproduction prohibited without permission.

23
Weeks and Kahle (1990)
Computers, paint, food, real estate andautomobiles
Time use The more time allocated to calling on established customer, the higher the level of performance.
Weitz (1978) Industrialsales
SalespersonimpressionformationabilitySalespersonstrategyformulationability
(1)The author found no relationship between salesperson performance and impression formulation ability.(2) There was a positive relationship between strategy formulation ability and performance.
Some variance in a salesperson’s performance is related to the environment
in which a salesperson operates and to conditions external to an individual, and thus
cannot be attributed to an individual salesperson’s activities or personality traits (c.f.
Lucas et al. 1975). Conversely, Walker et al. (1977) reviewed factors that can be directly
related to salespeople and proposed that a salesperson’s performance is a function of “(1)
his level of motivation, (2) his sales aptitude, and (3) his perception of how his role should
be performed” (p. 158). Walker et al. (1977) developed models related to the motivation
and role perception components, but did not address the aptitude component. Weitz
(1978), in follow-up research based on the Walker et al. (1977) research, developed a
model to address this aptitude component of performance. This research has become the
conceptual foundation for adaptive selling.
Most empirical research on personal selling has ignored the adaptive capability of
personal selling. Rather than focusing on the antecedents and results of adaptation, this
research has been concerned with finding effective sales behaviors and salespersons’
predispositions to certain behaviors. As Weitz (1979) suggests, this research stream has
been somewhat unsuccessful in establishing specific sales behaviors that are effective over
Reproduced with permission of the copyright owner. Further reproduction prohibited without permission.
24
a wide range of selling situations. Weitz's (1978) model describes a sales process in
which a salesperson’s success in influencing the customer is related to his/her ability to
understand a customer’s decision making process and to perform the following five
activities: (1) develop impressions; (2) formulate strategies; (3) transmit messages; (4)
evaluate reactions; and (5) make appropriate adjustments. In essence, a successful
salesperson possesses the skills, or aptitude, to develop an initial impression of what it will
take to “sell” the customer, then develop an overall selling strategy specifically for this
customer, including sales messages necessary to achieve the selling objective. Next, the
successful salesperson implements the strategy and delivers the associated selling
communications. Following strategy implementation, the salesperson assesses the effect
of the strategy and, if the objective o f the sales interaction is not being realized, makes
appropriate adjustments in the process by modifying the impression of the customer,
changing the sales objectives, changing the strategy implementation method, or altering
the communication style.
In an article often cited in current sales performance research, Spiro and Weitz
(1990) developed a scale to measure the degree to which salespeople practice adaptive
selling. Their scale development identifies five facets of adaptive selling: (1) the
recognition by a salesperson that different sales approaches are needed for different
customers; (2) a salesperson’s confidence in his/her ability to practice a variety of selling
approaches; (3) a salesperson’s confidence in his/her ability to actually alter their approach
during an interaction; (4) the collection of information during an interaction to facilitate
adaptation; and (5) actual use of different selling approaches. Spiro and Weitz, in their
survey of salespeople employed by a national manufacturer of diagnostic equipment and
Reproduced with permission of the copyright owner. Further reproduction prohibited without permission.

25
supplies, found a salesperson’s ability to develop an accurate perception of a customer and
then modify the sales presentation to be highly correlated with sales performance.
In support of adaptive selling as an antecedent to performance, Goolsby et al.
(1992) examined the relationship between psychological adaptiveness and sales
performance. While psychological adaptiveness can be classified as a personal variable, it
is included in the category of selling skills due to its close alignment with adaptive selling.
The authors identify three psychological traits relating to adaptiveness: (1) self-
monitoring - an individual’s predisposition to control the images and impressions that
others form of the person during social interactions; (2) psychological androgyny - the
degree to which an individual exhibits both masculine traits [referred to as instrumental
traits (e.g. aggressiveness, independence, objectivity, competitiveness, and decisiveness)]
and feminine traits [referred to as expressive traits (e.g. emotional, awareness of others’
feelings, cooperative, and sympathetic)]; and (3) intrinsic reward orientation - a desire to
perform in order to satisfy internal needs and a motivation to master the job environment
and look for variety and more appropriate methods for achieving success. Goolsby et al.
found that the ability to modify one’s self-presentation was significantly related to
performance. The ability to express both male (instrumental) and female (expressive)
traits were positively related to sales outcomes. The authors also reported that while an
intrinsic reward orientation was not found to be significantly related to performance, an
extrinsic reward orientation has a pervasive impact on performance. An intrinsic
orientation is predictive of non-interactive aspects of performance in that the orientation is
related to learning technical knowledge about the products, providing information to
customers, and controlling expenses.
Reproduced with permission of the copyright owner. Further reproduction prohibited without permission.

26
The literature supports the idea that one characteristic of better performing
salespeople is that they work smarter (Sujan and Weitz 1987). More specifically, these
better performing salespeople practice adaptive selling (Sujan, Weitz and Sujan 1988).
They alter their sales approaches based on the nature o f and feedback from a specific
customer. Sujan, Weitz and Sujan suggest several ways of helping salespeople to work
smarter, and to be more adaptive. Several of these methods important to this dissertation
include:
(1) Teach salespeople to better categorize customers - Since each individual customer caimot be treated as totally unique due to time constraints, salespeople should stereotype customers to reduce the complexity of the selling fimction.This permits a salesperson to quickly match a customer type with a proven sales technique.
(2) Use expert salespeople from within the company in training programs - This allows idiosyncratic knowledge unique to the selling environment of a company to be imparted to new salespeople.
(3) Help salespeople to manage themselves - Help salespeople set their own goals and quotas and direct themselves toward these goals. In other words, manage themselves.
In additional research related to working smart and effective selling, Sujan, Weitz
and Kumar (1994) suggested that “salespeople are concerned about not only performance
goals but also learning goals and that these two goals differentially motivate their work
behavior (p. 43).” They found that both working smart (behaviors directed toward
developing knowledge about sales situations and utilizing this knowledge in such
situations) and working hard (the overall amount of effort salespeople expend on their job)
resulted in increased sales performance. A learning orientation, in which a salesperson’s
goal is to develop as much knowledge as possible about sales situations, motivated
Reproduced with permission of the copyright owner. Further reproduction prohibited without permission.

27
salespeople to work smart. A performance orientation, in which a salesperson’s goal is to
obtain better outcomes through increased effort, motivated salespeople to work hard.
One key to effective adaptive selling is the accuracy of salespersons’ perceptions
of their customers (Lambert, Marmorstein and Sharma (1990). A more accurate
understanding of a customer’s decision process enables a salesperson to plan and
implement a sales strategy to produce better outcomes (Weitz 1978). Lambert et al.
(1981) reported that the performance of individual salespeople in the chemical industry
was directly related to the accuracy of their predictions of a customer’s expected
performance level regarding such things as; (1) the number of calls a salesperson should
make on the customer; (2) average lead times for both stock items and custom products;
and (3) advance notice of price changes.
Predmore and Bonnice (1994) have suggested that, since neither analyses of
product characteristics nor personal traits have been able to reliably predict sales success,
the critical indicators for high performance are contained within the selling interaction
itself. In a research study grounded in adaptability (Wietz 1978), they propose the use of
a process measure of adaptability and suggest that observed adaptability behaviors are
accurate indicators of sales performance. Predmore and Bonnice reported that salespeople
(telemarketers) who exhibited more adaptive behaviors were more likely to be successful
and would have a greater number of successful sales calls as compared to salespeople who
exhibited less adaptive behaviors.
Several research studies have examined the roles that specific selling skills play in
an individual salesperson’s level of performance. Castleberry and Shepherd (1993)
propose that effective listening skills are essential to successful sales performance. They
Reproduced with permission of the copyright owner. Further reproduction prohibited without permission.

28
indicate that, while many managers consider effective listening to be the number one
weakness for many salespeople, few empirical studies and conceptual articles have focused
on the effective interpersonal listening of salespeople. The authors define interpersonal
listening as “the process by which individuals receive informational messages transmitted
by others (i.e. the salesperson listening to the potential customer to determine his/her
needs (p. 36).” Their model indicates that effective interpersonal listening leads to a more
reliable perception of a customer’s beliefs and values which leads to the practice of
adaptive selling behaviors by a salesperson, resulting in a higher level of performance.
In a recent study, DeCormier and Jobber (1993) examined a particular selling
technique (skill) referred to as the counselor selling method. This sales approach is
essentially an operationalization of several o f the ideas proposed by Weitz’s (1981)
contingency framework. Weitz suggested that much research on sales performance
ignored the opportunity of salespeople to match their behavior to the specific customer
interaction encountered in a given situation. This characteristic is a fundamental tenet of
the counselor selling method. Within the sales process, the counselor selling method
encourages a salesperson to make adjustments to sales behaviors that are dependent upon
cues received from the buyer. The method is similar to processes in the counseling and
therapy field (DeCormier and Jobber). Coimseling is the process concerned with assisting
people to achieve their goals or function more effectively. This idea of assistance is
central to the counselor selling philosophy.
Communication skills have been fi-equently identified by researchers as one
determinant of sales performance (c.f. Schuster and Danes 1986; Riordan, Oliver and
Donnelly 1977). Schuster and Danes (1986) posit that both the way a salesperson makes
Reproduced with permission of the copyright owner. Further reproduction prohibited without permission.

29
task-oriented comments and asks questions is instrumental in high levels of sales
performance. Their research supports the importance of two types of comments and
questioning: (1) task oriented (e.g. closed-ended questions/comments and opinions); and
(2) socio-emotional questions (e.g. comments and questions that build solidarity between
customer and salesperson). Customers responded favorably not only to product related
aspects of the sales conversation and interaction but also to the relationship aspects of the
interaction between themselves and the salesperson. Solidarity comments and asking
closed-ended questions were associated with making a sale, while opinion-type comments
were directly associated with not making a sale.
Salespeople have a number of varied job responsibilities. Moncrief (1986)
identified 121 sales activities which he used to develop a taxonomy of six industrial sales
jobs. One indicator of sales performance is how salespeople balance these activities,
distributing available selling time between established customers and potential customers.
In a study of 239 salespeople spanning five different industries. Weeks and Kahle (1990)
found that, while there was no association between time spent with customers and several
objective measures of performance, there was, overall, a significant association between
time spent in direct selling activities with customer accounts and subjective performance.
This is consistent with the findings of Kerber and Campbell (1987) who reported that only
time spent on direct sales activities with established accounts is significantly associated
with performance.
A salesperson’s effectiveness in a customer interaction has also been evaluated
from a script-theoretic perspective. Leong, Busch and John (1989) traced differences in
salesperson performance to differences in knowledge of the actions and events across sales
Reproduced with permission of the copyright owner. Further reproduction prohibited without permission.

30
situations and a salesperson’s ability to call on relevant previous experience in responding
to the situation. They suggest that, to be effective and adapt well to different sales
situations, salespeople need an extensive knowledge base they can call on to size up sales
situations, classify prospects, and select appropriate sales strategies. Sales performance is
enhanced by two types of knowledge structures; category structures and script structures.
Category structures are related to information needed to classify different types of
customers. This type of information consists of knowledge regarding customer traits,
motives and behaviors. By contrast, script structures include information related to
sequences of events and actions encountered in sales situations. Such script information is
used to guide salesperson behavior. According to the authors, both category and script
structures are needed for a salesperson to “react with the best possible sales approach
contingent on the situation (p. 164).”
Motivation
The literature related to salesperson motivation is summarized in Table 2.3.
Table 2.3
Author(s) SellingEnvironment
IndependentVariable(s)
Findings/Propositions
Teas (1981) Industrial sales Internal/externalorientation;self-esteem; experience; constraints;consideration; initiation of structure; participation; feedback; task significance and autonomy; task variety and completeness; and task complexity
Contrary to expectations, most antecedents of expectancy were not significant. Participation was positively related to the salesperson’s belief that good performance makes possible the realization higher order need fulfillment, improved company relationships, increased performance recognition, and increased job status.
(table cont.)
Reproduced with permission of the copyright owner. Further reproduction prohibited without permission.

31
Walker, Churchill and Ford (1977)
Industrial sales Motivation, aptitude, and role perceptions
The role perceptions of salespeople and their selling aptitudes are positively related to salespersons’ levels of motivation. The level of motivation to perform had a positive effect on employee turnover and absenteeism.
Walker, Churchill and Ford (1977) represents a seminal theoretical discussion of
the determinants of a salesperson’s performance. Teas (1981) is an empirical test of the
Walker, Churchill and Ford model of performance.
Walker, Churchill, and Ford (1977) proposed a model of the motivation and
resulting performance o f industrial salespeople. The authors’ model identified a set of
individual, interpersonal, organizational, and environmental variables that could influence a
salesperson’s level of motivation to expend effort on the sales task which should have a
direct effect on a salesperson’s performance. The proposed model is based on Vroom’s
(1964) expectancy theory in which the strength of a person’s tendency to behave or act in
a specific manner is dependent on that person’s strength of expectancy that the behavior
will result in a given consequence (or outcome) and on the value or attractiveness of the
consequence (or outcome) to the individual.
Walker, Churchill, and Ford’s (1977) proposed model hypotheses that a
salesperson’s level o f performance is a function of three variables; (1) a person’s level of
motivation; (2) a person’s aptitude (or ability) for the sales job; and (3) a person’s
perceptions about how the sales job should be performed. The model indicates that each
of these three determinants of performance is influenced by several antecedent variables.
These variables include personal characteristics of a salesperson (e.g., level of intelligence.
Reproduced with permission of the copyright owner. Further reproduction prohibited without permission.

32
type of personality, level of education, and sales experience), characteristics of the
organization (e.g., product type, compensation practices, supervisory style, and training
programs), and environmental variables (e.g., product demand in the industry, availability
o f materials, and the unemployment rate).
In the model o f the determinants of salesperson performance (Walker et al. 1977),
a salesperson’s job performance has an effect on the kinds and amounts o f rewards that
will be received. The relationship between performance and reward, however, is complex.
First, there are several different dimensions of performance that an organization may
evaluate and reward. For example, a company can evaluate its salespeople on total sales
volume, profitability, attainment of quota, new customer accounts generated, or a
combination of these factors. Additionally, there are a variety of rewards that a company
can offer. The model posits two broad types of rewards. Externally mediated rewards are
rewards controlled and presented by people other than the salesperson (e.g., managers or
customers). External rewards include such things as financial incentives, recognition, and
promotions. Internally mediated rewards are those which a salesperson attains for himself.
Such rewards are related to higher-order needs and consist of such things as feelings of
accomplishment, personal growth, and self-worth. The model suggests that a
salesperson’s perceptions of the kinds and amounts of rewards that are attainable for
various types of job performance, along with the value a salesperson personally places on
the rewards, will strongly influence the salesperson’s motivation to expend effort in the
performance of the sales task.
Teas (1981) provides an empirical test of the Walker, Churchill, Jr., and Ford
(1977) model of performance. To analyze the antecedents of a salesperson’s level of
Reproduced with permission of the copyright owner. Further reproduction prohibited without permission.

33
expectancy, Teas interviewed 171 industrial salespeople employed by three midwestem
corporations to obtain their subjective beliefs regarding organizational, tasks, and
constraint variables. The study found that a salesperson’s task-specific self-esteem,
participation, task variety and completeness, and task complexity are positively related to
a salesperson’s level o f expectancy, while a salesperson’s perceptions of selling constraints
are related negatively to expectancy estimates. Global self-esteem, job experience,
internal/external orientation, consideration, initiation of structure, performance feedback,
and job significance and autonomy were not found to be statistically significant predictors
of the expectancy variable.
Personal Factors
“Personal variables are intra-individual factors that might be related to
salespeople’s performance but which are not part of aptitude, skill level, motivation, and
role perceptions components (Churchill et al. 1985 p. 109).” These personal variables
have included such factors as a salesperson’s age, race, gender, and so forth. Churchill et
al. reported in their meta-analysis that researchers’ interest in these personal characteristics
as predictors of salesperson performance is “pervasive and continuing.” While Churchill
et al.’s classification of personal variables consisted primarily of physical and external
characteristics, the variables of personal perceptions (e.g. self-esteem) and other internal
factors (e.g. emotional reactions to failure, tenacity and Type A behavior), that do not fit
into the groupings of aptitude, skill level, motivation, and role perceptions are included in
this section. These studies, summarized in Table 2.4, include variables such as locus of
control, tenacity, emotional reactions, self-blame, self-esteem, verbal intelligence,
experience, level of effort, and gender.
Reproduced with permission of the copyright owner. Further reproduction prohibited without permission.

34
Table 2.4 Personal Factors
Author(s) SellingEnvironment
IndependentVariables(s)
Findings/Propositions
Avila and Fern (1986)
Computermanufacturer
Locus of controlPlanfiilnessTenacity
(1) Across two selling situations (large systems and small systems), planfiilness was positively and significantly related to quota attairunent(2) In large systems situations, both planfiilness and locus of control were positively relation to performance.
Badovick, Hadaway and Kaminski (1992)
Business forms and supply
Emotional reactions to failure vs. success: selfblame, good, blaming others, competence, and surprise.
(1) While emotional reactions to sales successes and failures have both direct and indirect influence on salesperson motivation (effort), the effects were most apparent for failure situations.(2) Emotional reactions after successful sales efforts had little impact on subsequent motivation.
Bagozzi (1978) Industrial sales Personvariables
Self-esteem,other-directedness,
verbal intelligence Interpersonal variables
Role conflict, role ambiguity Situation variables
Territory potential
(1) Specific self-esteem and territory potential had significant, positive influence on sales performance.(2) Role conflict and verbal intelligence had significant, negative influence on sales performance.
Bagozzi (1980) Industrial sales Task specificself-esteemAchievementmotivationVerbalintelligence
(1) Performance was directly affected by both specific self-esteem and verbal intelligence.(2) Performance was indirectly affected by achievement motivation through job satisfaction.
Bartkus, Peterson and Bellenger (1989)
Real estate sales Type AbehaviorExperience
(1) Type A behavior pattern was found to have a significant positive effect on both work effort and role clarity.(2) Experience had a significant positive effect on role clarity and directly on performance.
Bashaw and Grant (1994)
Industrial sales AgeEducation Family income Tenure
Sales performance was significantly correlated with a salesperson’s tenure, job corrunitment, and career commitment
(table conL)
Reproduced with permission of the copyright owner. Further reproduction prohibited without permission.

35
Commitment(job,organizational and career)
Brown and Peterson (1994)
Direct-selling Effort Performance was directly influenced by both effort and competitiveness, and indirectly through effort by instrumentality and role ambiguity.
Busch and Bush (1978)
Industrial sales Gender There was no significant difference in self-ratings of performance between female and male respondents.
Chonko (1986) General OrganizationalcommitmentMotivation(expectancy)
Both level of organizational commitment and motivation should affect sales outcomes such as turnover, performance, job satisfaction, and customer perceptions.
Cron, JackoCsky and Slocum (1993)
Industrialbuildingproducts
Disengagement(retirement)stage
Pre-retirees are more likely (compared to subsequent leavers and stayers) to decelerate their effort (i.e., ease of work and find interests outside of the job.
Darden, McKee and Hampton (1993)
Department store sales
ParticipativestyleJobinvolvementOrganizationalcommitment
Relationships between antecedent variables and outcomes (job satisfaction and performance) are moderated by employment status (full-time or part-time.
Darmon (1993) Pharmaceuticalproducts
Pastperformance
Relevant experience has a positive effect on potential future performance.
Ingram, Lee and Skinner (1989)
Industrial sales SalespersoncommitmentSalespersonmotivation
(1) There is a positive relationship between effort (motivation) and salesperson performance.(2) TTiere is no significant relationship between effort and organizational commitment.
Lamont and Lundstrom (1977)
Not available PersonalityvariablesPersonalcharacteristics
(1) A relationship between personality variables and sales performance is partially supported.(2) A relationship between personal characteristics is partially supported.
Peterson, Cannito and Brown (1995)
Householdproducts
Voicecharacteristics
(1) Sales performance was significantly related to speaking rate.(2) Fundamental frequency contour was significantly related to sales performance.
Sager and Johnston (1989)
Manufacturing Organizationalcommitment
Organizational commitment is predictive of perceived effort which leads to higher levels of performance.
(table com.)
Reproduced with permission of the copyright owner. Further reproduction prohibited without permission.

36
Saxe and Weitz (1982)
Diverseindustries
SalesorientationCustomerorientation
The relationship between a sales orientation/customer orientation is dependent on the sales situation.
Sujan, Sujan and Bettman (1988)
Fund raising Knowledgestructure
Salesperson knowledge structure (in terms of describing customer types and having appropriate sales strategies) is positively related to effectiveness.
Wotniba (1989) Direct selling Goal-setting (1) Salespeople who set specific goals woik the most hours.(2) Belief in the importance of goals is positively related to effort
Past research has attempted to link salespeople’s’ personality differences to
performance. Avila and Fern (1986) assessed the effect of the selling situation as a
moderator of the personality-sales performance relationship. They reported that in sales
situations involving more complex and capital intensive products characterized by a longer
selling cycle (4-18 months), more people involved in the decision process, more
information needed, and more calls to the same customers, the best performing
salespeople had personalities of high planfiilness, low tenacity, and high locus of control
(i.e., a need for internal/personal control as compared to a need for external/managerial
control of their sales activities). That is, salespeople in a more complex and costly
situation need to feel they have control over the situation, be able to plan their selling
activities over a longer period of time, and be somewhat patient in their relationships with
customers.
Sales situations involving less complex and less costly products are characterized
by relatively short selling cycles (1-3 months), fewer people involved in the decision
process, much less information needed, fewer calls to the same customers, and impersonal
customer relationships. In these situations, the best performing salespeople were those
that were more tenacious or persistent in their dealings with customers.
Reproduced with permission of the copyright owner. Further reproduction prohibited without permission.

37
Badovick et al.’s (1992) research has direct implications for this dissertation. In
their study of the effects of a salesperson’s attributions and emotions on motivation after
both successful and unsuccessful quota performance, the authors found that feelings of
competence (self-efficacy) had a positive effect on task-specific self-esteem. Such feelings
of competence due to past performance appears to be a logical antecedent to more specific
measures of self-perceived ability.
Bagozzi examined the antecedents of sales performance in two widely cited articles
(1978, 1980). Bagozzi (1978) is one of the few research studies that utilizes social
learning theory in an effort to understand salesperson performance. He posited that the
behavior of salespeople is a function of the person, the interactions the person has with
significant others in his or her role set, and forces in the situation. Bagozzi reported that
sales performance was positively and significantly related to a salesperson’s level o f job
satisfaction, both generalized and specific self-esteem, and territory potential. Sales
performance was negatively related to verbal intelligence, and job-related tension. In a
supporting study, Bagozzi (1980) also found a high correlation between sales performance
and self-esteem (generalized and specific) with the expected negative correlation between
performance and verbal intelligence.
Bartkus, Peterson and Bellenger (1989) related salesperson performance to both
Type A behavior and experience. They suggest that Type A behavior patterns are likely to
create high sales effort and performance in that the Type A salesperson expends more
effort, outperforming other behavior types in challenging situations. This effort is the
result of Type A traits. Type A salespeople have both a need to be in control of a
situation and a need for a higher level of autonomy in how the sales job is performed.
Reproduced with permission of the copyright owner. Further reproduction prohibited without permission.

38
Type A salespeople also demonstrate a preference for social comparisons. As a result,
Type A’s can be expected to exhibit enhanced performance in situations where other
individuals evaluate them, as in salesperson-sales manager relationships. Additionally,
Bartkus et al. support Behrman and Perreault’s (1984) proposition that sales experience is
a potentially important predictor of job performance.
Several studies (e.g.. Bashaw and Grant 1994; Chonko 1986; Darden et al. 1993;
Ingram et al. 1989; and Sager and Johnston 1989) have examined the role of salespeople’s
commitments (e.g. organizational commitment) in sales performance. Bashaw and Grant
(1994) studied the effects of three types of work commitment (job, organizational and
career) on a salesperson’s performance. Job commitment is defined as “the extent to
which a person psychologically identifies with or is absorbed by their job (p. 43).”
Organizational commitment is “the relative strength of an employee’s psychological
identification with and involvement in the organization for which they work (p. 43).”
Career commitment is “the extent to which a person is attached psychologically to and
values personal career advancement and achievement (p. 43).” The authors found sales
performance to be significantly correlated with a salesperson’s experience (job tenure) and
commitment to both job and career.
Chonko (1986) defined organizational commitment in terms of an individual’s
attitude as compared to a set of behaviors. Organizational commitment in this context
refers to an individual’s identification with an organization and its goals and wishes to
continue membership in order to facilitate these goals. Such commitment leads to a
predisposition to certain sales behaviors to achieve the organization’s goals, resulting in
higher levels of performance.
Reproduced with permission of the copyright owner. Further reproduction prohibited without permission.

39
While Chonko (1986) found that organizational commitment leads to higher
performance through identification with an organization’s goals, Darden et al. (1993), in a
study of retail salespeople, hypothesized that a person’s employment status (part-time vs.
full-time) will moderate the relationship between organizational commitment and
performance. They reported a stronger positive relationship between organizational
commitment and job performance for full-time salespeople as compared to part-time
salespeople. In a sample of industrial salespeople, Ingram et al. (1989) reported .results
suggesting indirect effects of organizational commitment and job commitment on levels of
performance through a salesperson’s effort expended in the performance of the sales job.
Sager and Johnston (1989) supported these results in a study of manufacturing sales
representatives. They also suggested that organizational commitment has an indirect
impact on sales performance through a salesperson’s perceived effort.
Ingram et al. (1989) and Sager and Johnston (1989) laid the groundwork for
research into the effect of effort on sales performance. In a current study. Brown and
Peterson (1994) found that a salesperson’s level of effort has a direct positive effect on
both job performance and job satisfaction. Brown and Peterson also found that a key
antecedent to level of effort was a salesperson’s level of instrumentality (a task-centered,
individualistic orientation). Salespeople high in instrumentality focus on task
accomplishment and are independent and self-determining (higher effort), whereas
salespeople low in instrumentality have less task focus, are more dependent on others and
less self-determining (lower effort).
Additional research has examined the following personal factors related to sales
performance:
Reproduced with permission of the copyright owner. Further reproduction prohibited without permission.

40
Gender (Busch and Bush 1978) - Female salespeople’s self-evaluation of their
performance was equal to that of male respondents. Female salespeople did, however,
report lower levels of role clarity due to a general absence of acceptance by their male
counterparts.
Retirement stage (Cron et al. 1993) - There were no statistically significant
differences in the objective sales performance among three groups of sales people, who
within three years after the questionnaire was administered, (1) voluntarily left the
organization (subsequent leavers), (2) voluntarily retired (pre-retirees), and (3) stayed
(stayers).
Voice characteristics (Peterson et al. 1995) - Salespeople with faster speaking
rates exhibited higher output performance than salespeople with slower speaking rates.
Sales orientation vs. customer orientation (Saxe and Weitz 1982) - The
effectiveness of a sales (task/goal) orientation vs. a customer (relationship) orientation was
dependent on the nature of the sales situation. Customer-oriented selling is more effective
when salespeople have both organizational and personal resources needed to tailor their
product offerings to customer needs. Customers tend to be the most receptive to this
approach when they need assistance to solve a new/complex problem and when they have
a close, trusting relationship with salespeople. Conversely, a sales orientation is most
effective in more straight-forward buying tasks, where there is no cooperative, on-going
relationship between customer and salesperson, and repeat sales to the same customer are
a minor source of business for the salesperson.
Knowledge structure (Sujan et al. 1988) - The performance literature indicates that
salespeople tend to place customers into categories based on customer characteristics
Reproduced with permission of the copyright owner. Further reproduction prohibited without permission.
41
which permits salespeople to call on established schema for selling to individual customers
(Sujan et al. 1988). Sujan et al. found that both effective and less effective salespeople
have approximately the same number of customer classifications. The more effective
salespeople, however, do produce significantly more descriptors (customer traits) per
category resulting in significantly more sales strategies which lead to higher levels of
performance.
Goal setting (Wotruba 1989) - Most organizations implement goals for their
salespeople. A majority of industrial goods manufacturers use some type of quota to both
evaluate and compensate salespeople (Douthit 1976). Most salespeople also set personal
goals peripheral to assigned sales quotas. In a study of 491 sales agents in direct selling
organizations, Wotruba reported that respondents who set personal and specific earnings
goals worked harder (greater effort) than respondents who set no personal or less specific
goals. Respondents setting specific goals worked the most hours per week. The
relationship between goal setting and performance, however, is not clear in Wotruba’s
research. When performance was measured in earnings per hour, there was no significant
relationship. A significant relationship did exist, however, between overall satisfaction and
goal setting. While this study did not support a direct relationship between goal setting
and performance, it does add to the evidence that goal setting relates to greater effort
which results in higher levels of performance (e.g. Brown and Peterson 1994).
Despite continuing research effort, characterized by the studies reviewed above,
little success has been achieved in the use o f personality and personal characteristics to
predict salesperson performance. A more analytical (or empirical) approach, as compared
to a theoretical approach, was utilized by Lamont and Lundstrom (1977) in an attempt to
Reproduced with permission of the copyright owner. Further reproduction prohibited without permission.

42
identify successful industrial salespeople by personality and personal characteristics. The
authors selected reliable and objective measures of performance from past research and
administered a battery o f personality tests to identify those attributes (both personality and
personal characteristics) related to sales performance. The research examined the impact
of five personality variables (dominance, endurance, social recognition, empathy, and ego
strength) and six personal characteristics (age, height, weight, formal education, number
of outside activities (hobbies), and memberships in civic and professional organizations).
Endurance (the willingness to work long hours and persevere in the face o f great
difficulty) and social recognition (desire to be held in high esteem by acquaintances) were
both significantly related to performance. Empathy (the ability to feel as the other person
does in order to be able to sell a product or service) and ego strength (emotional stability,
resourcefulness, and strong motivation for professional status) were found to be unrelated
to performance. The relationship between dominance (attempts to control the
environment and influence or direct other people) and performance was partially
supported. Of the personal characteristics (age, height, weight, and formal education),
only one variable was found to be significantly related to performance. Salesperson height
is statistically significant and positively related to performance. Outside activities was also
found to be significantly related to performance, but in a negative direction. The more
hobbies salespeople participated in, the less their overall performance levels.
Organizational and Environmental Factors
Organizational and environmental factors are those variables influencing a
salesperson’s performance that are related to a salesperson’s organization, such as the
type of salesforce control system employed by an organization, and the external
Reproduced with permission of the copyright owner. Further reproduction prohibited without permission.

43
environment, such as characteristics of a salesperson’s sales territory. The current
literature related to these organizational and environmental factors is summarized in Table
2.5.
Table 2.5
Authors) SellingEnvironment
IndependentVariableCs)
Findings/Propositions
Bagozzi (1980) Industrial sales Task specific selfesteem Achievement motivation Verbal intelligence
(1) Performance was directly affected by both specific self-esteem and verbal intelligence.(2) Performance was indirectly affected by achievement motivation through job satisfaction.
Beltramini and Evans(1988)
Direct sales Sales contest Sales contests were foimd to be significant in helping or encouraging salespeople to increase sales volume.
Butler and Reese (1991)
Life insurance ManageradaptabilityTask/relationshipbehavior
A high-task and low-relationship management style was associated with higher performance than three other management styles (high-task/high- relationship; low-task/high relationship; and low task/low relationship).
Caballero (1988) Life insurance MerchandiseincentiveT rip/entertainmen t incentive Cash incentive
Any incentive resulted in higher performance than no incentive at all. Trip/entertainment incentives yielded higher performance than cash incentives, which yielded higher performance than merchandise incentives.
Challagalla and Shervani
Industrial sales Types ofmanagementcontrol;
(1) Activity control methods
(2) Capability control methods
(3) Output control methods
Output rewards and capability punishments were negatively related to performance.No other facets of managerial control directly infiuenced salesperson performance.
Cravens, Ingram, LaForge, and Young (1993)
Organizational and consumer selling
Behavior-based control system Outcome-based control system
The authors found a positive relationship between behaviorally oriented control systems and objective sales performance due to an emphasis on professional competence among the salespeople.
Doyle, Pignatelli,andFlorman(1985)
General Informal groups (1) Informal groups develop norms which have a motivational impact on the performance of group members.
(table com.)
Reproduced with permission of the copyright owner. Further reproduction prohibited without permission.

44
(2) The group norms will be either positive or negative relative to organizational goals.(3) The group process can be managed.
Ford, Churchill, and Walker, Jr. (1985)
Machine toolsElectric utilityequipmentPower-generatingequipment
Demographic/life style variables Career cycle variables Psychological variables
Ranking the attractiveness of alternative awards, pay had the highest employee valence followed by promotion, sense of accomplishment, personal growth, recognition, and job security.
Kohli (1989) Industrialproducts
Supervisorybehaviors:
(1) Initiation of structure (task)
(2)Consideration(relationship)
Individual differences among salespeople (self-esteem, need for clarity, experience, and performance) moderated the effects of the two supervisory behaviors on salespeople.
Moncrief, Hart and Robertson (1988)
Food brokers Retail cosmetics sales
Sales contest Salesperson effort will be expended to attain rewarded sales contest objectives (if the rewards are valued) resulting in initial higher performance.
Oliver and Anderson (1994)
Manufacturers’representatives(electroniccomponents)
Behavior-based control system Outcome-based control system
(1)Behavior-control methods, compared to outcome-control methods, were more related to commitment, acceptance of authority, teamwork, participative decision making, and a supportive culture.(2)Behavior-control methods were less related to risk seeking, extrinsic motivation, call activity, and lower relative performance.
Ryans and Weinberg (1979)
Technicalproducts
Company’sregional strengthTerritory potentialConcentrationDispersionCompetitorstrength
Characteristics of sales territories were significantly related to territory performance.
Tanner, Jr. andCastleberry(1990)
Wholesaling Exchange relationship with manager Role conflict
The quality of the vertical exchange relationship between salesperson and manager was positively related to sales performance.
Wotruba and Schoel (1983)
General Sales contest Sales contest were positively related to high performance.
(table cont.)
Reproduced with permission of the copyright owner. Further reproduction prohibited without permission.
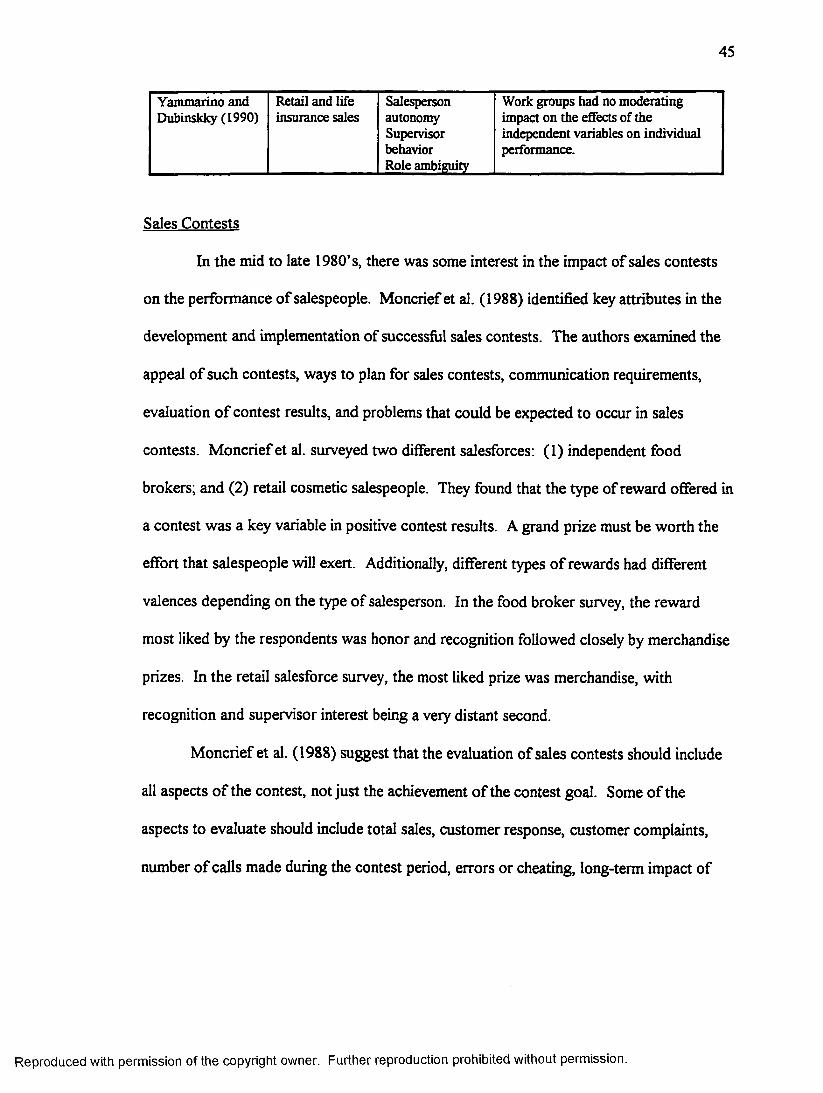
45
Yanunarino and Retail and life Salesperson Work groups had no moderatingDubinskky (1990) insurance sales autonomy impact on the effects of the
Supervisor independent variables on individualbehavior performance.Role ambiguity
Sales Contests
In the mid to late 1980’s, there was some interest in the impact of sales contests
on the performance of salespeople. Moncrief et al. (1988) identified key attributes in the
development and implementation of successful sales contests. The authors examined the
appeal of such contests, ways to plan for sales contests, communication requirements,
evaluation o f contest results, and problems that could be expected to occur in sales
contests. Moncrief et al. surveyed two different salesforces: (1) independent food
brokers; and (2) retail cosmetic salespeople. They found that the type of reward offered in
a contest was a key variable in positive contest results. A grand prize must be worth the
effort that salespeople will exert. Additionally, different types of rewards had different
valences depending on the type of salesperson. In the food broker survey, the reward
most liked by the respondents was honor and recognition followed closely by merchandise
prizes. In the retail salesforce survey, the most liked prize was merchandise, with
recognition and supervisor interest being a very distant second.
Moncrief et al. (1988) suggest that the evaluation of sales contests should include
all aspects o f the contest, not just the achievement of the contest goal. Some o f the
aspects to evaluate should include total sales, customer response, customer complaints,
number of calls made during the contest period, errors or cheating, long-term impact of
Reproduced with permission of the copyright owner. Further reproduction prohibited without permission.

46
the contest, the effects on organizational resources, and the morale o f the salesforce. The
authors indicate that contest results can be very misleading if only the contest period is
evaluated.
In a study of 187 sales managers in a variety of selling organizations, Wotruba and
Schoel (1983) found that sales contests can be significantly effective in improving
salesforce performance. The authors reported that contest performance tended to mirror
the normal performance levels of salespeople in the study. That is, normally high
performers did significantly better on contest objectives than did average performers.
Average performers performed significantly better on contest objectives than did normally
lower performers. In the Wotruba and Schoel study, there were several adverse side
effects to sales contests. Respondents reported pre- and post-contest sales slumps,
reduced cooperation among salespeople during the contest period, deUberate disregard for
organization policies, and increased fiction between management and salespeople during
the contests.
Beltramini and Evans (1988) examined sales contests from the standpoint of
salesperson motivation to perform and job satisfaction. In a study of 933 salespeople
across three companies, the authors researched the respondents' perceived attitudes
regarding sales contests. Beltramini and Evans reported that when respondents were
asked to indicate the extent to which they agreed or disagreed with various performance
benefits they could attain from contests, the benefit o f increased sales volume was found
to be the most likely perceived benefit of a sales contest. All of the perceived contest
benefits (including new customer solicitation, increased sales volume during a seasonal
slump, and improved selling efficiency) were significantly correlated with salespeoples’
Reproduced with permission of the copyright owner. Further reproduction prohibited without permission.

47
level of job satisfaction. Additionally, the study concluded that the contest reward with
the greatest influence on performance was preselected merchandise, and that for maximum
performance results, sales contests should offer the capability for many winners. Caballero
(1988) supports Beltramini and Evans’ (1988) suggestion that non-cash rewards are more
effective than cash rewards in influencing contest sales performance. She found, in a study
of 45 life insurance agents, that non-cash awards consisting of free trips or free
entertainment resulted in a greater number of new clients than did cash awards.
Supervisory Behavior and Control
The meta-analysis by Churchill et al (1985) indicated that most antecedents of
salesperson performance that have been researched exhibit low correlations with
salesperson performance, and account for only a small amount of variance in performance.
Churchill et al. suggested that variables which are controllable by sales managers can have
a greater influence on a salesperson’s performance than can individual characteristics.
Several research studies relate directly to such sales manager control. Yammarino
(1990) conducted a study to examine relationships between salesperson performance and
three factors that are under the control of sales managers: (1) salesperson autonomy; (2)
supervisor behavior; and (3) role-related factors. Additionally, the study looked at the
individual and work group moderating effects on the linkage between these three factors
and sales performance. Yammarino reported that, in general, the three managerially
controllable factors did have a positive influence on salesperson performance. The author
found that the relationships between these factors and sales performance appeared to be
more relevant for individual salespersons (individual effects) as compared to the
relationships within work groups (within groups).
Reproduced with permission of the copyright owner. Further reproduction prohibited without permission.
48
There have been several studies examining the relationship between the type of
salesforce control system employed by an organization and salesperson performance. A
control system is “an organization’s set of procedures for monitoring, directing,
evaluating, and compensating its employees (Anderson and Oliver 1987). In their
theoretical article, Anderson and Oliver (1987) described two such control systems -
behavior-based control and outcome-based control. There are three characteristics of
outcome-based systems: (1) little direct monitoring of salespeople by management; (2)
little effort by management to direct salespersons’ selling activities; and (3) objective
measures of results (as compared to measures of the methods and behaviors utilized to
achieve the results) are used by management to evaluate and compensate salespeople. In
comparison, there are three contrasting characteristics of behavior-based systems: (1)
large amount of management monitoring of salespeople’s activities; (2) high level of
direction of activities by management; and (3) more subjective methods, such as product
knowledge, selling aptitude, and selling behaviors are used to evaluate and compensate
salespeople. Anderson and Oliver suggests that the recommended control strategy is a
function of environment, organization, and salesperson variables. They posit that
behavior-based control should have the most positive impact on performance when there
exists environmental uncertainty, management can frequently observe the activities of
salespeople, and salespeople tend to be risk averse regarding negative outcomes. In
contrast, outcome-based control systems should work best in relatively stable
environments, observation of a salesperson’s activities is difficult and expensive due to the
geographical distance between management and salesperson, and salespeople have
somewhat high expectancies of sales results.
Reproduced with permission of the copyright owner. Further reproduction prohibited without permission.

49
Three studies empirically tested Oliver and Anderson’s (1987) hypotheses
regarding behavior-based versus outcome-based control systems. First, Cravens et al
(1993), in a study of 144 sales organizations representing diverse selling contexts,
reported that behavior-based control systems indirectly influenced sales performance by
increasing the “professional competency” of salespeople. That is, salespeople provided
higher levels of customer support and made a higher number o f and more effective sales
presentations. Additionally, sales executives in the study indicated that behavior-based
control system are much more necessary in the current environment, resulting in a higher
level of activities directed toward the establishment of business-to-business relationships
that will provide greater performance returns over the life of such relationships.
Oliver and Anderson (1994), in a second study, also found support for their
propositions regarding behavior-based versus outcome-based control systems. In a survey
of 2,000 manufacturer’s representatives in the electronic components industry, they found
that “behavior-based philosophies are related to commitment, acceptance of authority,
teamwork and review, a lack of extrinsic motivation, a greater interest in serving the
agency, participative decision making, less use of pay as a control mechanism, and an
iimovative and supportive culture (60).” In general, behavior-based control systems were
much more acceptable to salespeople who worked in supportive organizational cultures
and had a more risk-averse orientation.
In the third test of Oliver and Anderson (1987), Challagalla and Shervani surveyed
270 salespeople in five industrial product divisions of two Fortune 500 organizations.
Salesperson performance was reported to be most correlated with three factors: (1)
timely information provided by management (output information, activity information, and
Reproduced with permission of the copyright owner. Further reproduction prohibited without permission.
50
capability information); (2) rewards for the performance of certain selling activities; and
(3) satisfaction with manager. Factors one and two provide support for Oliver and
Anderson’s behavior-based control system in the current turbulent and unstable selling
environment.
Related to supervisory behaviors, a study was conducted by Kohli (1989)
investigating the effects of two types of managerial behaviors - initiation of structure and
consideration - across salespersons with individual differences in specific self-esteem, need
for clarity, sales experience, and self-perceived performance. Initiation of structure is
related “to the degree to which supervisors define their roles and the roles of their
subordinates in job-related activities, specify procedures, and assign tasks (41).” In other
words, initiation of structure represents a task orientation by management. Consideration
is related to “the degree to which supervisors develop a work climate of psychological
support, mutual trust and respect, helpfulness, and friendliness (43).” In other words, a
consideration style represents a relationship orientation by management. Kohli’s study
included a sample of 127 salespeople in three organizations selling industrial products.
Kohli found that a consideration style of management resulted in much higher levels of job
satisfaction than did an initiating structure style, especially when specific self-esteem
regarding the sales job was high. There was no moderating effect of need for clarity
across the two management styles. When job satisfaction was the dependent variable,
initiating of structure had a much greater impact for salespeople with low experience as
compared to salespeople with high experience. This is somewhat obvious, however, since
experienced salespeople have their own methods of job performance that have been
developed by trial and error and work for them. Thus, such experienced salespeople do
Reproduced with permission of the copyright owner. Further reproduction prohibited without permission.

51
not find the structuring of their sales job by managers to be helpful. The effects of
supervisory behaviors on job satisfaction were significantly different when comparing
salespeople of high and low self-perceived performance. A consideration (relationship)
style was highly related to job satisfaction for high performers, but not to low performing
salespeople in the study. This is most likely due to the fact that self-perceived low
performers feel they are undeserving of considerate treatment by management. Kohli
suggests that, in general, the effects of supervisory behaviors are dependent on the
individual salesperson.
Butler and Reese (1991) also empirically examined the effect o f leadership style
and sales performance to test the Situational Leadership Model (SLM). The SLM
describes four leadership styles related to the combination of a manager’s task orientation
(described above) versus a relationship orientation (described above). The four SLM
styles are; (1) SI - high task, low relationship; (2) S2 - high task, high relationship; (3) S3
- low task, high relationship; and (4) S4 - low task, low relationship. The SLM prescribes
appropriate styles based on the maturity level of employees, which is an employee’s
willingness and ability to focus his/her behavior on a specific task or objective. Mature
employees have the ability to effectively perform a given task and readily accept
responsibility for the task and the related outcomes. Immature employees lack the ability
to successfully perform and tend not to accept personal responsibility for the task. In their
study of 675 salespeople and 41 branch managers in the insurance industry, Butler and
Reese found that, regardless of the task maturity of the salesperson, the SI style of
management (high task, low relationship) was associated with higher performance levels
than any o f the remaining three styles. By comparison, the 82 management style (high
Reproduced with permission of the copyright owner. Further reproduction prohibited without permission.
52
task, high relationship) had a significantly higher adverse eflFect on performance than did
the other styles.
Salesperson-Manager Relationship
Tanner and Castleberry (1990), with vertical exchange theory as the foundation,
posited that the quality of the relationship between salesperson and sales manager would
have a direct effect on salesperson performance. Vertical exchange theory, in a personal
selling context, focuses on the interaction of a sales manager and a salesperson, noting that
such relationships form as a result of the give-and-take that occurs over time.
Salespersons’ behaviors affect sales managers, and motivate managers to engage in
behaviors that have an effect on variables directly affecting performance (e.g., role stress).
In two separate studies, Tarmer and Castleberry found that both role conflict and role
ambiguity (two variables that have a negative relationship to performance) were
significantly less when the quality of the relationship between salesperson and sales
manager was high (i.e., a salesperson and a sales manager had an interactive relationship,
one in which performance feedback was expected by a salesperson and was forthcoming
from a sales manager). Additionally, Tanner and Castleberry reported that, even though
objective performance might not be directly affected, the quality of the salesperson-sales
manager relationship had a positive influence on a manager’s performance evaluation of a
salesperson.
Critique
Sales managers have long attempted to identify and to understand the determinants
of good sales performance. In response to this interest, the literature is replete with
research studies examining many possible such determinants. Over the last 30 years, many
Reproduced with permission of the copyright owner. Further reproduction prohibited without permission.

53
researchers have attempted to predict sales performance using a wide variety of
personality and personal characteristics. Unfortunately, this research related to sales
performance has produced inconsistent findings (Avila and Fern 1986).
Expectancy theory has been the dominant stream of thought in past research in
efforts to understand what factors motivate salespeople to higher levels of effort and
performance. The job characteristics model became more widely used in the late 1980’s in
research involving salesperson performance, particularly the relationship between
motivation and performance (Badovick et al. 1992). These two streams of research,
however, have explained a significant, but small proportion of the variance in sales
outcomes (Churchill et al. 1985). Both of these research paradigms have focused on
personality variables as the key antecedents to a salesperson’s level of performance.
Bagozzi (1978) suggested, however, that “the behavior of salespeople (i.e., their
performance and job satisfaction) will be a function of the person, the interactions the
person has with significant others in his or her role set, and the situation or environment in
which these interactions take place (p. 517).” This would indicate that while personality
factors are important in researching sales performance, these personality factors should be
examined in the normal context of a salesperson’s peer group and the work environment
in which the interactions take place.
In their meta-analysis of 116 research studies related to sales performance,
Churchill et al. (1995) reported generally small correlations between predictor variables
and performance criteria. The average correlation across 1,653 correlations was only
.188; less than four percent, on average, of the variation in salesperson performance. As
suggested by Churchill et al., the fact that so little of the variation in performance is
Reproduced with permission of the copyright owner. Further reproduction prohibited without permission.

54
associated with any single predictor supports the notion that models of the determinants of
salesperson performance must incorporate multiple causes.
Based on the reviews offered by both Bagozzi (1978) and Churchill et al. (1985),
along with the review of more current performance literature, there appears to be a need
for research examining additional personal factors of performance within the job setting.
One personal variable missing from the existing literature that might be useful in adding to
the understanding of sales performance is self-efficacy, or belief by a salesperson that
he/she has the ability to successfully perform a selling task. Self-efficacy and its role in
motivating salespeople to work harder are discussed in the theoretical development
section.
The role of self-efficacy in the performance of a specific task is posited in
Bandura’s (1986) social cognitive theory, a theory that has not been applied by marketing
researchers in attempts to explain a salesperson’s motivation and performance. Bandura
proposed that central to the successful performance of a task is a belief by individuals that
they possess the skills and capabilities to successfully perform the task requirements.
Social cognitive theory can possibly identify additional variables to add to the
understanding of sales performance. Additionally, social cognitive theory provides a
theoretical framework in which to examine these variables in job context as suggested by
Churchill et al. (1985).
Thus, the objective of this dissertation research is to examine both the role of self-
efficacy in a salesperson’s level of performance and the antecedents of this self-efficacy.
Utilizing social cognitive theory, this research develops and tests a model of sales
performance incorporating both personal and job environmental variables.
Reproduced with permission of the copyright owner. Further reproduction prohibited without permission.
CHAPTERS
CONCEPTUAL FRAMEWORK AND HYPOTHESES
Introduction
Three major approaches have been used to explain organizational behavior (Davis
and Luthans 1980). According to the first approach, behavior is explained as a function of
the individual. Internal psychological constructs such as personal motivation and other
personality characteristics are used to explain why people behave as they do. In another
theoretical approach, behavior is explained as a function of an individual’s environment.
Variables external to an individual such as an organization’s social structure are predicted
to be determinant of behaviors. Personality characteristics that individuals bring to an
organization are omitted in this approach. The third theoretical approach is a combination
of the first two. Behavior is a function of both the individual (internal variables) and the
organizational environment (external contingencies). According to this approach, both
internal and external factors must be taken into account in an explanation of behavior. The
theoretical foundation for this combined approach is Bandura’s social cognitive theory.
Social Cognitive Theory
In the social cognitive model of behavior individuals are neither driven by internal
forces nor behaviors automatically formed by external variables. Behavior is explained in
terms of a model in which behavior, cognitive and other personal factors, and
environmental events all interact as determinants of each other (Bandura 1986). In this
social cognitive perspective, an individual is defined in terms of several basic capabilities.
These basic capabilities are briefly described below.
55
Reproduced with permission of the copyright owner. Further reproduction prohibited without permission.
56
Symbolizing
Social cognitive theory suggests that individuals have the capability to use symbols
that allow people to process and transform life experiences into internal models that serve
as guides for future action. Symbolizing capability allows individuals to initiate iimovative
courses o f action, and to test possible actions symbolically, discarding or retaining such
actions based on estimated outcomes. Thus, individuals may avoid trial and error actions
and avoid the costs of errors in behaviors (Bandura 1986). In other words, humans base
many o f their actions on rational thought, which can be a source of failure, but also can be
a source o f successful behaviors.
Forethought
Bandura (1986) indicates that people do not simply react to their immediate
environment. Their behavior is somewhat regulated by forethought or anticipation of
outcomes or consequences. People anticipate the likely consequences of their actions, set
goals for themselves, and plan courses of action for thought-out futures. In other words,
people are purposeful. They motivate themselves and guide their actions by anticipation.
Such forethought is the result of symbolizing capability. Possible future events cannot
serve as determinants of behavior. Their symbolic representation, however, can have a
strong causal effect on one’s current actions. Inner images of desirable future events tend
to drive certain behaviors most likely to bring about their realization. According to
Bandura’s social cognitive theory, people convert future behavioral outcomes into current
motivators of foresightful behavior.
Reproduced with permission of the copyright owner. Further reproduction prohibited without permission.
57
Vicarious Capability
Traditionally, psychological theories have posited that learning occurs only by
performing responses and experiencing their consequences (direct experience) (Bandura
1986). Social learning theory, however, suggests that almost all learning can occur
vicariously by the observation of other peoples’ behaviors and their related outcomes.
Thus, people can, by observation, acquire norms for individual behavior patterns without
having to form such rules gradually by a very tedious trial and error method. In fact, some
complex skills can be achieved only through modeling the behaviors and actions of others.
For example, as children we learn the linguistic skills that constitute a language by being
exposed to the verbal communications of models.
Self-Regulation
Social cognitive theory also posits that individuals are self-regulatory in their
actions (Bandura 1986). That is, people do not behave in a manner simply to suit the
preferences of others. Much individual behavior is motivated and regulated by one’s
internal standards and personal reactions to such behavior. Individuals develop personal
standards with actions and outcomes measured against these standards. Discrepancies
between actual performance and a personal standard result in “evaluative self-reactions,”
which operate to impact future behavior. Thus, if an individual’s actions do not result in
outcomes commensurate with internal standards, future actions are modified so that the
probability of successful outcomes, as measured against internal standards, is enhanced.
Self-Reflection
A characteristic that distinctively identifies humans is the “capability for reflective
self-consciousness (Bandura 1986).” People exhibit a capability to analyze life
Reproduced with permission of the copyright owner. Further reproduction prohibited without permission.

58
experiences and to cognate about their own thought processes. Reflecting on life
experiences and thinking about what they know, people derive what Bandura refers to as
“generic knowledge about themselves and the world around them.” In other words, we
develop understanding through reflection. This allows individuals to monitor their ideas
and actions, predict outcomes or consequences, evaluate the adequacy o f thoughts and
actions based on results, and modify thoughts and actions accordingly.
Of the thoughts that can affect one's behaviors, according to social cognitive
theory, none is more powerful than people’s judgments of their capabilities to effectively
cope with different realities (Bandura 1986). On the basis of self-conceptions of efficacy,
individuals decide what to do, how much effort to invest in specific behaviors, how long to
persevere when outcomes are somewhat less than expected, and whether tasks are
undertaken nervously or with self-confidence (Bandura, 1989). In one’s self-appraisal of
efBcacy, there are several sources of information that must be internally processed through
self-reflective thought (e.g., verbal input fi’om others regarding an individual’s task
performance.)
Central to the outcome of effective performance of a task in social cognitive theory
is a person’s self-efBcacy (Bandura 1986), which is a belief that a person has the
capabilities necessary to successfully perform a specific task. Social cognitive theory
posits that one’s self-efficacy is based on four principal sources of information: vicarious
experiences of observing the performances and subsequent outcomes o f others (i.e.,
modeling the successful behaviors of others performing a like task); physiological states
fi-om which individuals partly judge their capableness to effectively perform, their personal
strengths, and their vulnerability to task dysfunction; past performance attainments in a
Reproduced with permission of the copyright owner. Further reproduction prohibited without permission.

59
similar task; and verbal persuasion by others that one possesses the necessary capabilities
to successfully perform a specific task.
Modeling
Modeling is a type of vicarious learning that plays a prominent role in social
cognitive theory (Bandura 1989; Mischel 1973). The critical claim is that individuals are
not dependent on direct experience of the consequences of their behavior for learning to
take place. Bandura (1977) suggested that the ability to learn by observing others enables
individuals to avoid needless and costly errors. Furthermore, observers can often learn
faster than actual performers of tasks (especially tasks that depend heavily on conceptual
skill) because of the task performer’s need to devote at least some attention to performing
required responses. Such vicarious learning is not restricted to externally modeled
(practiced) behaviors. Positive modeling efifects on performance fi’om covert modeling
(envisioning modeled behaviors) can result through one’s imagination. Kazdin (1976)
found that increases in a person’s assertive behavior can be achieved through such
envisioning of successful behaviors.
Social cognitive theory suggests three antecedents to modeling others’ behaviors
in a specific task (Bandura 1986). First, in addition to formal performance assessments
(e.g. a written performance appraisal by one’s manager), people tend to manage their own
behaviors and to personally assess the outcomes of their behavior in terms of success or
failure. The more that an individual personally manages task behavior, the more likely an
individual is to model the behavior of successful others in a task-centered environment.
When such “self-monitoring” individuals realize that their level of performance is not what
they would like for it to be, their tendency is to observe the behaviors of successful others
Reproduced with permission of the copyright owner. Further reproduction prohibited without permission.
60
and to pattern future task behaviors accordingly. Second, the level of modeling performed
by an individual is a function of one’s level of self-esteem. Rosenberg (1965) defines self
esteem as a person’s attitude toward oneself. People tend to be concerned with their self-
images, especially in relation to comparisons between themselves and others that they
come into contact with. Individuals with a perception of unworthiness are said to have
low self-esteem, while individuals who think highly of themselves are said to have high
self-esteem. Such self-esteem can emerge fi-om one’s evaluation of competence, or fi-om
one’s perceived possession of attributes culturally identified as positive or negative in their
nature. Based on self-esteem invested by a feeling of competence, individuals develop a
sense of pride from achieving set standards of successful task performance. As a result,
individuals with such competency-based self-esteem tend to model the activities of
successful others to assure the achievement of goals. The third factor prerequisite to
modeling the behavior of others is an individual’s similarity to those persons available to
be modeled. By observing other similar people perform successfully, individuals can raise
self-perceptions of their own efficacy that they too possess the capabilities to master
comparable activities. An indication of one’s similarity to others in a group is the level of
acceptance by the group members an individual perceives. The more similar in personal
characteristics to group members an individual is, the higher the level of acceptance of the
individual by other group members (Bandura 1986). Thus:
HI: An individual’s level of self-monitoring will be positively associatedwith one’s level of modeling behavior.
H2: An individual’s level of self-esteem will be positively associated withone’s level of modeling behavior.
Reproduced with permission of the copyright owner. Further reproduction prohibited without permission.

61
H3: An individual’s level of acceptance by other task-group members willbe positively associated with one’s level of modeling behavior.
Self-Efllcacy
Social cognitive theory suggests there are four variables that have an effect on an
individual’s level of self-efficacy (a belief that a person has the capabilities to successfully
perform a specific task): (1) vicarious learning through the observation of successful
behaviors by other (modeling); (2) physiological state, or job tension (physical or somatic
arousal due to stress in intense situations; (3) enactive attainment (past performance in a
specific task; and (4) feedback (specifically verbal feedback) from coworkers including
fellow employees and managers. Three of the precursors of self-efficacy - job tension or
stress (Lusch and Jaworski 1991) , past performance and task performance feedback) have
been shown to have significant effects on an individual’s level of self-efficacy. Individuals
do not, however, rely only on past experience and performance in developing perceptions
of their abilities (self-efficacy) to successfully perform a specific task (Bandura 1986).
Appraisals of one’s self-efficacy are also developed by vicarious experiences. “Seeing or
visualizing other similar people perform successfully can raise self-percepts of efficacy in
observers that they too possess the capabilities to master comparable activities (p.399,
Bandura 1986).” People tend to persuade themselves, even find some comfort, by
thinking that if others can do it, then they should also be able to do it, at least achieve
some improvement in task performance.
The effect of vicarious information on self-efficacy is particularly sensitive in
several situations. A relatively large amount of uncertainty regarding one’s abilities (i.e.,
low self-efficacy) can lead to a much greater effort to model successful behaviors of
Reproduced with permission of the copyright owner. Further reproduction prohibited without permission.

62
successful CO workers and, thus, result in a more significant effect of modeling on one’s
level of self-eflBcacy. Self-efBcacy can be readily altered by relevant modeling influences
when people have had little prior experiences on which to base their self-perceptions of
self-efBcacy. In the absence of such direct knowledge o f their own capabilities, people
tend to rely more on modeled indicators (Bandura 1986). Past experience does not,
however, necessarily nullify the overall effect of modeling on self-efBcacy. Unsuccessful
past experiences can cause feelings of self-doubt. Additionally, members in one’s peer
group can change over time so that social comparative information continues to provide
relevant diagnostic information related to task performance. When past experience has
served to confirm one’s feeling o f low self-efBcacy, modeling influences can boost an
individual’s self-efBcacy by demonstrating effective coping strategies (Bandura, Reese and
Adams 1982).
The impact of vicarious information on self-efBcacy perceptions is particularly
important when tasks, in and of themselves, fail to provide relevant information regarding
one’s task capabilities (Bandura 1986). Salespeople, for example, can evaluate their
performances based on their attainment of sales goals. To adequately assess their selling
capabilities, however, salespeople judge their performances as good or bad, and their
capabilities, relative to the performances of other salespeople within an organization.
Ultimately, most such performances are assessed in terms of social criteria. As a result,
self-efficacy perceptions tend to be based on social comparative information.
As Bandura (1986) pointed out, the ability of individuals to learn by observing
others enables them to avoid needless and costly errors. The basic elements of vicarious
learning are well described in the following statement; “By observing a model of the
Reproduced with permission of the copyright owner. Further reproduction prohibited without permission.

63
desired behavior, an individual forms an idea of how response components must be
combined and sequenced to produce the new behavior. In other words, people guide their
actions by prior notions than by relying on outcomes to tell them what they must do”
(Manz and Sims 1981, p. 106).
Modeling effects can be separated into three types of learning (Manz and Sims
1981). The first type is learning a new behavior by observing a model. In the second
type, a model can have either an inhibitory or a disinhibitory effect on a behavior caused
by observing the consequences of a model’s behavior. The third type of learning is
referred to as a behavioral facilitation effect. A model acts as a cue to an observer to
begin exercising a previously learned behavior. For example, salespeople are taught to
attempt trial closes early in the selling cycle to understand how much additional selling
effort is required to bring a customer to a positive buying decision. When salespeople
observe cohorts attempting early trial closes and customers respond positively by buying,
then observers tend to practice previously learned early trial closes in the next selling
interactions.
According to Bandura (1977), an individual’s self-efficacy expectations (i.e., “the
conviction that one can successfully execute the behavior required to produce the
outcomes.. .” p. 79) can be influenced by a role model. Bandura suggests that there is a
close correspondence between perceived self-efficacy and behavioral change. He
contends that personal perceptions of efficacy will impact the effort that an individual will
expend on a given task. The stronger the perception of self-efficacy held by an individual,
the greater the effort of an individual.
Reproduced with permission of the copyright owner. Further reproduction prohibited without permission.

64
In research examining the effects of a behavioral modeling training program on
increasing the effectiveness of fist-line managers in dealing with their employees, Latham
and Saari (1979) reported significant results in four areas: (1) reaction to the training; (2)
actual learning; (3) behavioral outcomes; and (4) performance criteria. The participants in
the training program indicated that learning management skills through modeling the
behavior of the trainers positively and significantly helped them be better managers and
increased their confidence in their abilities to perform managerial tasks. The study also
found that managers receiving the training in the modeling program performed more
effectively on the job than a control group.
The role of modeling in the development of self-efBcacy is supported in
organizational socialization research by Weiss (1977). Weiss reported that individuals
develop work behavior patterns by observing and modeling the behavior of certain co
workers. Significant correlations were found between employees’ perceptions of their
level of perceived self-efficacy and the extent to which they were able to model the job
behaviors of successful coworkers.
In a study of managers in the manufacturing operation of a major forest products
company, Porras and Anderson (1981) reported that managers were better able to learn
new behavioral skills by observing models successfully using these skills in simulated on-
the-job situations. Additionally, the authors found that the managers’ levels of
expectancy that the new behaviors would result in the achievement of desired goals were
significantly increased through an increase in the managers beliefs in their own capabilities
(self-efficacy).
Reproduced with permission of the copyright owner. Further reproduction prohibited without permission.

65
In additional support for the eflfect of modeling on self-efiScacy, Taylor (1992)
reported that the presentation skills of graduate students were significantly better after
being given opportunities to observe and then practice presentation skills exhibited by
trained presenters. The students who had the modeling training were evaluated more
favorably by their professors in each of six skill areas (verbal behavior, nonverbal
behavior, time management, use of visual aids, providing o f information, and facilitating
discussion) than were students who had not yet received the training. Thus:
H4: Modeling others’ successful behaviors in a given task will be positivelyassociated with an individual’s assessment of their level of self- efficacy.
Physiological State
Social cognitive theory suggests that individuals also rely on internal information
from their physiological state in judging their capabilities to perform given tasks (Bandura
1986). Somatic, or physical, arousal due to stress in intense situations is a cue to
individuals of vulnerability to dysfunction. A high level of physical arousal and stress
tends to be debilitating in terms of task performance. In contrast, individuals tend to
expect success when they are physically calm and are not feeling aversive arousal.
According to Bandura, individuals can arouse in themselves elevated levels of
dysfunctional distress with internal thoughts regarding their lack of task capabilities.
Thus:
H5: An individual’s level of perceived job tension will be negativelyassociated with one’s level of perceived self-efficacy.
Reproduced with permission of the copyright owner. Further reproduction prohibited without permission.

66
Past Performance
According to social cognitive theory, enactive attainments (past successful
performances of specific tasks) provide the most influential source of efBcacy information
because it is based on “authentic mastery experiences” (Bandura, Adams & Beyer 1977).
Past successes cause individuals to raise self-efficacy appraisals, while repeated task
failures cause individuals to lower efficacy appraisals. Such lowered appraisals are
especially true if the task failures occur early in the course of events and do not reflect a
lack of effort or adverse external circumstances by individuals. The weight given to new
task experiences is somewhat dependent on the nature and strength of an individual’s
existing self-perception into which the new experiences will be integrated. After a strong
sense of personal self-efficacy is developed through repeated successes, occasional failures
are unlikely to have much effect on individual’s judgments of their capabilities to perform
specific tasks successfully. In fact, individuals holding high levels of efficacy tend to
attribute intermittent failures to situational factors beyond their control, insufficient effort
on their part, or poor operational strategies. Thus:
H6: Successful past performance of a given task will be positivelyassociated with an individuaPs assessment of their level of self- efficacy.
Feedback
Social cognitive theory suggests that verbal persuasion is used to talk individuals
into believing they posses specific capabilities that will enable them to achieve successful
performances in specific tasks (Bandura 1986). Such verbal persuasion alone will not
result in enduring increases in individuals’ levels of perceived self-efficacy, but can
contribute to an increase in performances through self-efficacy is the verbal input is
Reproduced with permission of the copyright owner. Further reproduction prohibited without permission.

67
realistic. For a personal selling task, the greatest source verbal persuasion is task
performance input from other salespeople and sales managers in organizations.
Individuals verbally persuaded, through task performance feedback, that they are capable
of successfully performing tend to hold higher perceptions of their self-efBcacy and to
exert greater sustained efibrt than do individuals with self-doubts about their capabilities.
Positive feedback conveys a message that performance and/or behavior is on target
and that an individual is meeting organizational standards (PodsakofF and Farh 1989).
With more positive feedback from both coworkers and managers, individuals feel one of
two things. First, they may view any discrepancies between actual performances and
standards as being somewhat minor and increase their expectancy that such discrepancies
are able to made up with additional effort. Second, they may feel that their performances
and behaviors are acceptable which results in increased beliefs of self-efBcacy (Podsakofif
and Farh 1989).
In her review of the implications of self-efficacy for organizational behavior and
human resource management. Gist (1987) indicates that feedback is important in
formulating self-efficacy perceptions that enhance performance motivation. Gist reported
that unfavorable feedback tended to yield negative self-evaluations. In contrast, positive
feedback from coworkers and managers resulted in higher perceived evaluations of self-
efficacy and a greater intensification of effort. Thus:
H7: Positive feedback from coworkers regarding an individuaPs taskperformance will be positively associated with one’s level of self- efficacy.
H8: Positive feedback from managers regarding an individual’s taskperformance will be positively associated with one’s level of self- efficacy.
Reproduced with permission of the copyright owner. Further reproduction prohibited without permission.

68
Expectancy
In a social cognitive view of behavior, the concept of expectancy is important in an
explanation of human behavior. Psychological theory posits that an individual’s
expectations regarding outcomes of actions or behaviors greatly impact one’s actions or
behaviors (Bandura 1986). Bandura clearly establishes differences in perceived self-
efiScacy and outcome expectations. Perceived self-efficacy is a belief by individuals that
they possess certain capabilities to accomplish certain levels of performances. In contrast,
individuals’ outcome expectations are beliefs that certain behaviors will result in specific
results. Social cognitive theory posits that the higher the level of perceived self-efBcacy
that an individual possesses capabilities to effectively perform a specific task, then the
greater the expectation held by the individual that certain behaviors will produce specific
outcomes resulting in successful performance of the task. Thus:
H9: Positive feedback from coworkers regarding an individual’s taskperformance will be positively associated with one’s level of expectancy regarding outcomes of a given task.
HIO: Positive feedback from managers regarding an individual’s task performance will be positively associated with one’s level of expectancy regarding outcomes of a given task.
H ll: An individual’s level of self-efficacy will be positively associated with one’s level of expectancy regarding outcomes of a given task.
Adaptive Selling
Social cognitive theory suggests that that a distinctive human characteristic is
personal agency (Bandura 1989), and posits a model of interactive agency (Bandura
1986). In this agency model, an individual’s behavior is not simply the automatic result of
environmental influences. Rather, an individual has the capability to exert some influence
Reproduced with permission of the copyright owner. Further reproduction prohibited without permission.

69
over outcomes by the application of forethought. That is, an individual can exert some
influence over outcomes by selection of environments and construction of environments.
A person high in perceived self-efBcacy attempts to anticipate likely consequences of
prospective actions in a specific situation, set goals for specific and desired outcomes, and
plan courses o f action that are likely to produce the desirable outcomes such as successfifl
performance. In other words, a person will give some forethought to a situation in
relation to hoped-for outcomes and will develop a plan of action tailored specifically for
the situation in order to successfully achieve the desired outcomes. Individuals high in
self-efBcacy adapt their behaviors to individual situations to produce desired outcomes.
In developing a measure of the degree to which salespeople are predisposed to
practice adaptiveness in customer relationships (adaptive selling), Spiro and Weitz (1990)
suggested that there are six facets of adaptive selling. Two of the aspects are related
directly to a salesperson’s level of self-confidence or self-efBcacy. Salespeople must have
confidence in their ability to use a variety of different sales approaches and to alter sales
presentations during customer interactions.
Bandura (1982) indicated that self-efficacy affects a person’s choice of settings and
activities, skill acquisition, effort expenditure, and the initiation and persistence of coping
efforts in the face of obstacles. Those with higher levels of self-efBcacy tend to engage
more fi-equently in task-related activities and persist longer in coping efforts. In contrast,
individuals with lower levels of self-efBcacy tend to engage in fewer coping efforts and
give up more easily under adversity. Gist (1987) defines this relationship between self-
efficacy and these choices as adaptiveness. According to Gist, this situational
Reproduced with permission of the copyright owner. Further reproduction prohibited without permission.

70
adaptiveness resulting from self-efi5cacy leads to more task mastery experiences and thus,
to better performances in specific tasks calling for a level of adaptiveness. Thus:
H12: An individual’s level of self-eflicacy will be positively associated with one’s practice of adaptive selling in a specific selling situation.
Effort
According to social cognitive theory, individuals with higher levels of self-efBcacy
will tend to expend more effort on a task given their perceptions that they hold the
necessary capabilities to successfully perform the task (Bandura 1986). Additionally,
social cognitive theory posits that self-efBcacy has an indirect effect on one’s effort level
through an individual’s level of expectancy that the added effort will pay off in desired
results.
In a study of the effect of self-efBcacy on task performance, Locke et al. (1984)
found that self-efBcacy had an impact on performance through a significant relationship
with goal commitment. That is, individuals higher in self-efBcacy tended to make
commitments to attaining specific task-related goals. These individuals then worked
harder to accomplish these goals.
Gist (1987) has suggested that self-efBcacy provides an integrating mechanism
between social cognitive theory and goal-setting approaches to performance. According
to Gist, self-efBcacy is developed through social learning processes. This in turn leads to
more productive goal setting (specifically, successful performance of a given task) and
more effort expended to accomplish the goal. Thus:
H13: An individual’s level of self-efTicacy will be positively associated with one’s level of effort in a given task.
Reproduced with permission of the copyright owner. Further reproduction prohibited without permission.
71
H14: An individual’s level of expectancy regarding expected task outcomes will be positively associated with one’s level of effort in a given task.
Current Performance
Personal selling is a communication that permits marketing messages to be adapted
to specific needs and beliefs of individual receivers (customers). Weitz (1978) stresses the
need for adaptiveness in the selling process. Weitz indicates that the selling process
consists of gathering information regarding a specific customer, developing a unique sales
strategy based on this information, transmitting messages tailored to implement the
strategy, evaluating the outcomes of the strategy, and making appropriate adjustments
based on this evaluation. Salespeople have unique opportunities to develop and to
implement sales presentations tailored to each customer. Additionally, salespeople have
opportunities in customer interactions to make rapid adjustments in messages in response
to customers’ reactions and feedback.
Weitz, Sujan and Sujan (1986) define adaptive selling as “the altering of sales
behaviors across customer interactions based on perceived information about the nature of
the selling situation.” Salespeople exhibit high levels of adaptive selling when they use
different sales presentations across sales encounters and when they make adjustments in
presentations during these sales encounters. By comparison, a low level of adaptive
selling is indicated by the use of the same sales presentation during all sales encounters.
As posited by Sprio and Weitz (1990), adaptive selling results in long-term
effectiveness. Empirical support for this proposition is provided by Sujan and Weitz
(1986) who found a significant relationship between working smarter and performance.
Working smarter was operationalized in the study as the practice of adaptive selling.
Reproduced with permission of the copyright owner. Further reproduction prohibited without permission.

72
Predmore and Bonnice (1994) also reported a significant relationship between adaptability
and performance. They found that salespeople who practiced more adaptive behaviors in
customer interactions were more likely to be successful than salespeople who exhibited
less adaptability in customer interactions.
Additionally, adaptive selling is part of a customer orientation by salespeople
toward customers that results in better performance. Customer-oriented selling is the
practice of the marketing concept at the level of an individual salesperson and customer
(Saxe and Weitz 1982). In the marketing concept.
Company-wide acceptance of a consumer orientation requires the sales force to become thoroughly professional in its dealings with prospects customers. A mark of professionalism in sales is that sellers adopt a problem-solving approach to their work. A professional salesperson does not wonder, “What can I sell this individual?” but instead asks,“How can I best solve this person’s problems?” (p. 343).
For effective performance, such a marketing orientation requires not just an organization,
but also an individual salesperson to determine the needs of a customer and to adapt
selling behaviors to satisfying those needs. Part of a customer orientation is adapting sales
presentations to match customer interests (Saxe and Weitz 1982).
It is intuitively logical that the harder individuals work at performing specific task the
better they should perform and achieve desired performance outcomes. There is little
research, however, that examines the relationship between effort and sales performance.
While both salesforce and organizational behavior researchers have uniformly recognized
the importance of effort in conceptual models of performance (Naylor, Pritchard and Dgen
1980; Walker, Churchill and Ford 1977), these models have treated effort as a mediator in
the relationship between motivation and performance. Effort is the mechanism by which
Reproduced with permission of the copyright owner. Further reproduction prohibited without permission.

73
motivation is translated into accomplished work (Brown and Peterson 1994). Naylor,
Pritchard and Ilgen (1980, p. 6) define efibrt as “the amount of energy spent on an act per
unit of time.” In a study consisting o f380 direct salespeople who worked for a national
company selling a durable product line door-to-door. Brown and Peterson reported that
efibrt had a strong positive efiect on sales performance. Thus;
HIS: The level that an individual practices adaptive selling willbe positively associated with one’s level of sales performance.
H16: An individual’s level of effort in the performance of a task will be positively associated with one’s level of current performance.
Summary
In summary, sixteen hypotheses are suggested in the proposed social cognitive
model of sales performance. These structural relationships are presented in Figure 3.1.
Reproduced with permission of the copyright owner. Further reproduction prohibited without permission.
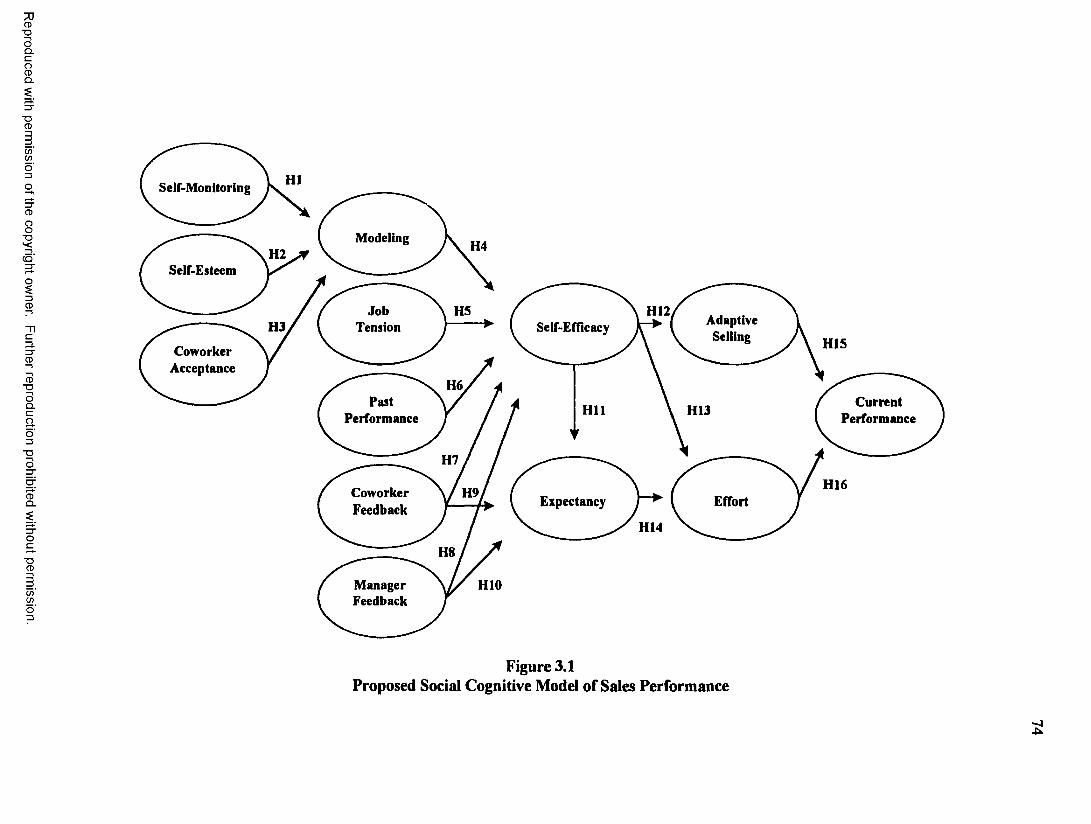
CD■ D
OQ .C
gQ .
■ DCD
C/)C/)
8■ D
( O '
3.3"CD
CD■ D
OQ .Cao3
T3O
CDQ .
T3CD
(/)(/)
HISeir-Monitoring
Modeling H4H2Self-Esteem
JobTension
HS H12 AdaptiveSellingH3 Self-Efficacy
HISCoworkerAcceptance
H6Past
PerformanceCurrent
PerformanceH ll H13
H7
H16CoworkerFeedback
H9Expectancy Effort
H14
H8
ManagerFeedback
HIO
Figure 3.1Proposed Social Cognitive Model of Sales Performance
A

CHAPTER 4
RESEARCH METHOD
Introduction
The methodology to be used in this dissertation study is summarized in Chapter 3.
This review includes overviews of the research design and standards applied in the analysis
of scales utilized in this study.
Research Design
The research design to be used in this study is a cross-sectional survey of
salespeople employed by automobile dealerships in Louisiana that are members of the
Louisiana Automobile Dealers Association (LADA). In this study, the sample is not
random given that all salespeople working in these member dealerships will have an
opportunity to respond to the survey. Thus, the study will include, and will be a census
of, the population of automobile (and truck) salespeople whose employers are
participating members in LADA.
The survey method will be used in the study due to the number of potential
respondents in research and the amount of information that respondents will be asked to
provide. Surveys allow for the collection of data without a researcher, or other trained
surveyor, being onsite in participating dealerships to administer the questionnaires. With
appropriate instructions provided respondents, the surveys can be distributed and collected
by sales managers. Additionally, given the length of the survey form, surveys (in the form
of questionnaires) can be completed by respondents during times that are convenient.
Thus, the survey approach to data collection should not be interruptive to respondents’
work schedules.
75
Reproduced with permission of the copyright owner. Further reproduction prohibited without permission.

76
Proposed Analysis of Measures
To insure the integrity of the measures used in the study, there are several criteria
that will be utilized to examine research data. These data assessments include multivariate
normality, internal consistency and dimensionality, and validity.. The following sections
summarize standards for the data criteria. These criteria are used in the analysis of pretest
data, the results of which are discussed in Chapter 5.
Multivariate Normalitv
When each variable in the study, both individually and in combination with the
other variables, exhibits a normal data distribution, then multivariate normality is present.
Such normality is examined by graphical representations of the data. Additionally,
multivariate normality is assessed in the study through an assessment of Kurtosis and
Skewness statistics. Data with a skewness statistic within a range of ±2.57 and a kurtosis
statistic within a range of ±3.00 meet the requirements of multivariate normality. Data
meeting these normality requirements are important in assessing structural equation
models. Thus, the research data in this study will be assessed for normality to insure
appropriate data for analysis.
Internal Consistencv and Dimensionalitv
Internal consistency of measurement items is the extent to which multiple items are
representative of a single underlying construct. Internal consistency assesses the
interrelatedness between scale items and the stability of factor structure. There are three
basic methods to examine internal consistency: (1) exploratory factor analysis; (2)
reliability; and (3) confirmatory factor analysis. These three methods are discussed below.
Reproduced with permission of the copyright owner. Further reproduction prohibited without permission.

77
The dimensionality of measures (underlying structure) is examined with
exploratory factor analysis (Bearden et al. 1989). The most common approach to
exploratory factor analysis is principal components factor analysis with a varimax rotation.
The primary information provided by exploratory factor analysis used to assess
dimensionality are number of factors extracted, percentage of variance of the underlying
construct extracted, factor loadings of the variables, and structure o f the variables. It is
expected that the number of extracted factors will be equal to the number of theoretical
dimensions, and that the variables will demonstrate simple structures - singularly loading
on their respective factor (Netemeyer et al. 1995). Each variable should exhibit a
minimum loading on a factor of .50, and should not exhibit an extensive loading on
additional factors (cross loadings) (Hair et al. 1995). As suggested by Netemeyer et al.
(1995), the total variance extracted from a dimension by the measures should be greater
than .50.
Internal consistency is assessed with the reliability statistic as indicated by
coefficient alpha (based on the average intercorrelation of scale items and the total number
of items that comprise a measure). Targeted measures of reliability in marketing research,
as indicated by the coefficient alpha statistic, are .70 (Peterson 1994) and .60 for
exploratory research (Nunally 1978). Additional indicators of internal consistency utilized
in this study will be inter-item correlations, which should be greater than .30, and item-to-
total correlations which should be equal to or greater than .50 (Bearden et al. 1989).
The internal consistency of measures are also examined with confirmatory factor
analysis. Several indicators of internal consistency may be assessed with confirmatory
factor analysis, including individual item loadings, composite reliability, and variance
Reproduced with permission of the copyright owner. Further reproduction prohibited without permission.

78
extracted for each construct. Standardized loadings for individual item measures should
be at least .70. Netemeyer et al. (1995) suggest standardized loadings of .77 so that
individual item reliabilities (standardized loadings squared) are greater than .60.
Additionally, confirmatory factor analysis is used to examine composite reliability and
variance extracted of constructs. According to Gerbing and Anderson (1988) and Fomell
and Larcker (1981), composite reliability should exceed .70 and variance extracted should
exceed .50.
Validitv
Validity is defined as the extent to which a measure represents what it is supposed
to measure (Churchill 1979). Two types of validity (construct and discriminant) are
examined in this study. Construct validity is the extent to which measures seem to be
representative of the construct they are supposed to measure. In this study, construct
validity of the measure developed to assess modeling behaviors of salespeople is examined
by the correlation between the new scale and a socialization scale (Jones 1986) that
measures the degree to which new employees have opportunities to leam from more
experienced employees. There should be a correlation between the two scales since the
new modeling scale assesses the degree to which salespeople have opportunities to
observe the sales behaviors of other salespeople.
Discriminant validity is the extent to which two constructs are similar. In this
study, discriminant validity is assessed by examining the confidence intervals around the
phi estimates (the correlations between constructs in a measurement model). Confidence
intervals (95 percent) are calculated by multiplying standard errors of the correlations by
1.96 and then adding and subtracting the results fi"om the phi estimate for a lower and
Reproduced with permission of the copyright owner. Further reproduction prohibited without permission.
79
upper range. The two constructs are said to exhibit discriminant validity if this confidence
interval does not contain a value of “1” (Anderson and Gerbing 1988).
Reproduced with permission of the copyright owner. Further reproduction prohibited without permission.

CHAPTERS
DEVELOPMENT AND EVALUATION OF MEASUREMENT SCALES
Introduction
Chapter Five presents a discussion of the development and evaluation of the
measurement scales used in this research. An overview of the development of a modeling
scale is provided. A summary of all scales used in the dissertation, a description of pretest
procedures, and an examination of the measurement properties of the scales are presented
in this chapter. A sample of the pretest questionnaire including the scale items may be
found in the appendix.
Pretest Procedures
The procedures used in the pretest are summarized in this section. A sample
description, context of the pretest, and data collection procedures are reviewed.
Sample and Context
Salespeople selling cars and trucks (new and used) in automobile dealerships
located in the metroplex area of a mid-size south Louisiana city. Salespeople provided
information regarding information about their sales job and their personal selling
characteristics via a questionnaire.
Data Collection
Respondents in the pretest were the population of salespeople in the dealerships
described above. The initial data collection and support for the study was provided by the
Louisiana Automobile Dealers Association (LADA). An introductory letter from LADA
was mailed to owners and presidents of the dealerships describing the study and
encouraging their participation. A return, postage-paid postcard was included in the
80
Reproduced with permission of the copyright owner. Further reproduction prohibited without permission.

81
letters for dealerships to indicate their willingness to participate in the study. Twelve out
of 20 dealerships indicated that they would participate in the study. The twelve
dealerships employed a total of approximately 120 salespeople of which 96 responded to
the survey for a response rate of 80 percent. Questionnaire packages (cover letter,
instructions, survey forms, and return envelope) were personally delivered to sales
managers and handling instructions explained. The questionnaire packages were
distributed to the salespeople through the sales managers in the dealership. In two
dealerships, questionnaire packages were distributed directly to the salespeople during
sales meetings. To encourage salespeople to respond, a drawing was held for two $100
gift certificates to a well-known steak restaurant. Sales managers were given two weeks
to have salespeople complete the questionnaires. The packages were collected in person
from the sales managers. Sample demographic information is described in Table 5.1.
Table 5.1
Demographic Item Number, Average or Range
Percent of Sample Respondents
Average Age 36-40Gender
Male 89 92.7%Female 7 7.3%
Vehicles Sold - CarsNew cars only 14 14.6%Used cars only 4 4.2%Both new and used cars 76 79.2%Do not sell cars 2 2.1%
Vehicles Sold - TrucksNew trucks only 9 9.4%Used truck only 6 6.3%Both new and used trucks 69 71.9%Do not sell trucks 12 12.5%
(table cont.)
Reproduced with permission of the copyright owner. Further reproduction prohibited without permission.

82
Sales ExperienceAverage total years - selling 11.25Less than one year - selling cars 27 28.1%Less than one year - selling 13 13.5%Average total years - in
dealership2.95
Less than one year - in dealership 40 41.7%Education Level
Some high school 1 1.0%High school graduate 25 26.0%Some college 40 41.7%College graduate 21 21.9%Some graduate school 6 6.3%Graduate degree 2 2.1%
The average age range of the pretest respondent is 36 to 40 years with the sample
predominantly males (89.6%). The majority of respondents sell both new and used cars
and new and used trucks (79.2% and 71.9% respectively. The average automobile
salesperson has 11.25 years of total selling experience and 11.25 years of vehicle sales
experience. Evidence of turnover in dealerships, however, is represented by the 40
respondents (41.7%) with less than one year of tenure with their current dealership.
Additionally, there were 27 salespeople (28.1%) who reported less than one year of
vehicle sales experience. Based on the number of inexperienced vehicle salespeople
responding to the pretest survey, it will be recommended in the proposed final study that
two sales performance models be compared; one representing less experienced salespeople
and one representing salespeople with more tenure in the vehicle sales job. There should
be a sufficient number of respondents in the proposed final study to split the sample for
modeling purposes. Individual measures used in the pretest and assessments of these
measures are discussed in the following sections.
Reproduced with permission of the copyright owner. Further reproduction prohibited without permission.
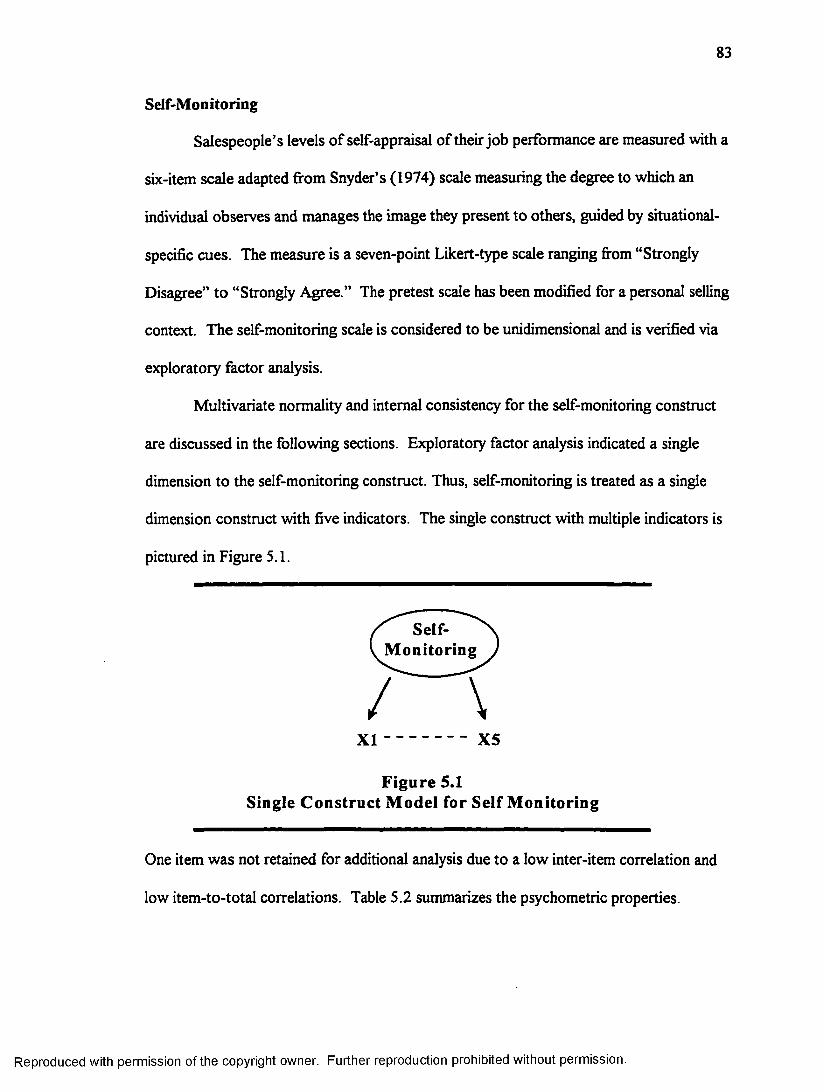
83
Self-Monitoring
Salespeople’s levels of self-appraisal of their job performance are measured with a
six-item scale adapted from Snyder’s (1974) scale measuring the degree to which an
individual observes and manages the image they present to others, guided by situational-
specific cues. The measure is a seven-point Likert-type scale ranging from “Strongly
Disagree” to “Strongly Agree.” The pretest scale has been modified for a personal selling
context. The self-monitoring scale is considered to be unidimensional and is verified via
exploratory factor analysis.
Multivariate normality and internal consistency for the self-monitoring construct
are discussed in the following sections. Exploratory factor analysis indicated a single
dimension to the self-monitoring construct. Thus, self-monitoring is treated as a single
dimension construct with five indicators. The single construct with multiple indicators is
pictured in Figure 5.1.
Self- M onitoring
/X I ----------------- X5
Figure 5.1Single Construct M odel for Self M onitoring
One item was not retained for additional analysis due to a low inter-item correlation and
low item-to-total correlations. Table 5.2 summarizes the psychometric properties.
Reproduced with permission of the copyright owner. Further reproduction prohibited without permission.

84
Multivariate Normality
Normal probability plots indicated that all five scale items are normally distributed.
Additionally, the skewness and kurtosis statistics for the items were within the acceptable
ranges of ± 2.57 and ± 3.00 respectively. All of the items were retained for additional
analysis.
Internal Consistency and Unidimensionalitv
Internal consistency was examined with exploratory factor analysis, coefiGcient
alpha measure of reliability, and confirmatory factor analysis. The exploratory factor
analysis utilized principal components factor analysis with varimax rotation. The single
factor solution indicated that the dimension accounted for 52 percent of the variance with
an eigenvalue of 3.12. All scale items had loadings above .5. Thus, all five of the items
were retained.
Reliability was measured with the coefiGcient alpha statistic, inter-item correlations
and item-to-total correlations. CoefiGcient alpha for the self-monitoring scale was .81 (see
Table 5.2), a reliability acceptable for theoretical research. The inter-item correlations
ranged fi’om .29 to .54. Item-to-total correlations ranged fi'om .49 to .65.
Several measures from a confirmatory factor analysis were used to evaluate
internal consistency and dimensionality. These measures include composite reliability,
average variance extracted, and standardized loadings (see Table 5.2 and Table 5.3). The
composite reliability for the self-monitoring measure was 81, which is in an acceptable
range. The average variance extracted (amount of variance captured by a construct’s
measures relative to random measurement error) was .43. This is less than the desired
level of variance extracted of > .50. The standardized loadings of the items are presented
Reproduced with permission of the copyright owner. Further reproduction prohibited without permission.

85
in Table 5.2. These individual loadings range from .56 to .74 with two of the six items
outside the acceptable loading of > .70, and one item marginally below.
Table 5.2Psychometric Properties for Self-Monitoring
Property ValueNumber of Items 6Mean 27.27Standard Deviation 4.34Variance 18.84Coefficient Alpha .81Composite Reliability .81Average Variance Extracted .43
Table 5.3Standardized Loadings, Means and Standard Deviations
Items StandardizedLoading
Mean StandardDeviation
1 have the ability to alter my behavior if 1 feel that something else is called for
.73 4.64 1.04
I have the ability to control the way 1 come across to customers and to the people 1 work with, depending on the impression I wish to give
.74 4.73 .90
When 1 feel that the image 1 am portraying isn’t working, I can readily change it
.56 4.52 1.11
1 have trouble changing my behavior to suit different people and different situations
.60 4.46 1.21
1 can adjust my behavior to meet the requirements of any situation
.60 4.60 .93
Once I know what the situation calls for, it’s easy for me to regulate my actions accordingly
.68 4.82 .85
Generalized Self-Esteem
Generalized self-esteem is measured with Rosenberg’s (1965) ten-item scale
assessing a person’s overall self-image That is, how a person generally feels about himself
or herself in relation to others he or she comes into contact with each day. Generalized
self-esteem is assumed to be unidimensional.
Reproduced with permission of the copyright owner. Further reproduction prohibited without permission.

86
Multivariate normality and internal consistency for the generalized self-esteem
construct are discussed in the following sections. Exploratory factor analysis indicated a
single dimension to the generalized self-esteem construct. The single construct with
multiple indicators is pictured in Figure 5.2.
GeneralizedSelf-Esteem
X I --------------- X5
Figure 5.2Single Construct Model for Generalized Self-Esteem
Multivariate Normality
Normal probability plots indicated that five of the ten scale items were not
normally distributed. The five items were dropped from the scale. The skewness and
kurtosis statistics for the remaining five items were within the acceptable ranges of ± 2.57
and ± 3.00 respectively. All of the remaining five items were retained for additional
analysis.
Internal Consistency and Unidimensionalitv
Internal consistency was examined with exploratory factor analysis, coeflBcient
alpha measure of reliability, and confirmatory factor analysis. The exploratory factor
analysis utilized principal components factor analysis with varimax rotation. The single
factor solution indicated that the dimension accounted for 54 percent of the variance with
Reproduced with permission of the copyright owner. Further reproduction prohibited without permission.

87
an eigenvalue of 2.70. All scale items had loadings above .5. Thus, all five of the items
were retained.
Reliability was measured with the coefiBcient alpha statistic, inter-item correlations
and item-to-total correlations. Coefficient alpha for the generalized self-esteem scale was
.77 (see Table5.4), a reliability within an acceptable range of > .70. The inter-item
correlations ranged fi'om .15 to .75. Item-to-total correlations ranged fi’om .39 to .78.
Several measures from a confirmatory factor analysis were used to evaluate
internal consistency and dimensionality. These measures include composite reliability,
average variance extracted, and standardized loadings (see Table 5.4 and Table 5.5). The
composite reliability for the generalized self-esteem measure was .80, which is in an
acceptable range. The average variance extracted (amount of variance captured by a
construct’s measures relative to random measurement error) was .46. This is slightly less
than the desired level of variance extracted of > .50. The standardized loadings of the
items are presented in Table5.5. These individual loadings range from .41 to .94 with three
of the three items outside the acceptable loading of > .70.
Table 5.4
Property ValueNumber of Items 5Mean 27.95Standard Deviation 6.27Variance 39.33Coefficient Alpha .77Composite Reliability .80Average Variance Extracted .46
Standardized loadings, means and standard deviations for generalized self-esteem are
summarized in Table 5.5.
Reproduced with permission of the copyright owner. Further reproduction prohibited without permission.

88
Table 5.5Standardized Loadings, Means and Standard Deviations
For Generalized Self-EsteemItems Standardized
LoadingMean Standard
DeviationI feel I do not have much to be proud of .49 5.69 2.02On the whole, I am satisfied with myself .41 5.88 1.08I wish I could have more respect for myself .60 5.15 1.98I certainly feel useless at times .94 5.47 1.79At times I think I am no good at all .80 5.77 1.67
Coworker Acceptance
The coworker acceptance construct will be measured by a scale developed by
Dubinsky et al. (1986) to assess the degree to which a person feels accepted and trusted
by coworkers. The scale has been adapted for salespeople with items generated by the
author. The five item Likert scale is anchored by “Strongly Disagree” and “Strongly
Agree.”
Multivariate normality and internal consistency for the coworker acceptance
construct are discussed in the following sections. Exploratory factor analysis indicated a
single dimension to the coworker acceptance construct. Thus, coworker acceptance is
treated as a single dimension construct with five indicators. The single construct with
multiple indicators is pictured in Figure 5.3. As indicated in the sections below, the five
scale items are normally distributed. Additionally, skewness and kurtosis statistics for the
items are within acceptable ranges. Thus, all five items were retained in the analysis.
Additionally, reliability was acceptable. Three items, however, exhibited standardized
loadings below an acceptable value of .70. Changes to these items are addressed in
Chapter Six.
Reproduced with permission of the copyright owner. Further reproduction prohibited without permission.
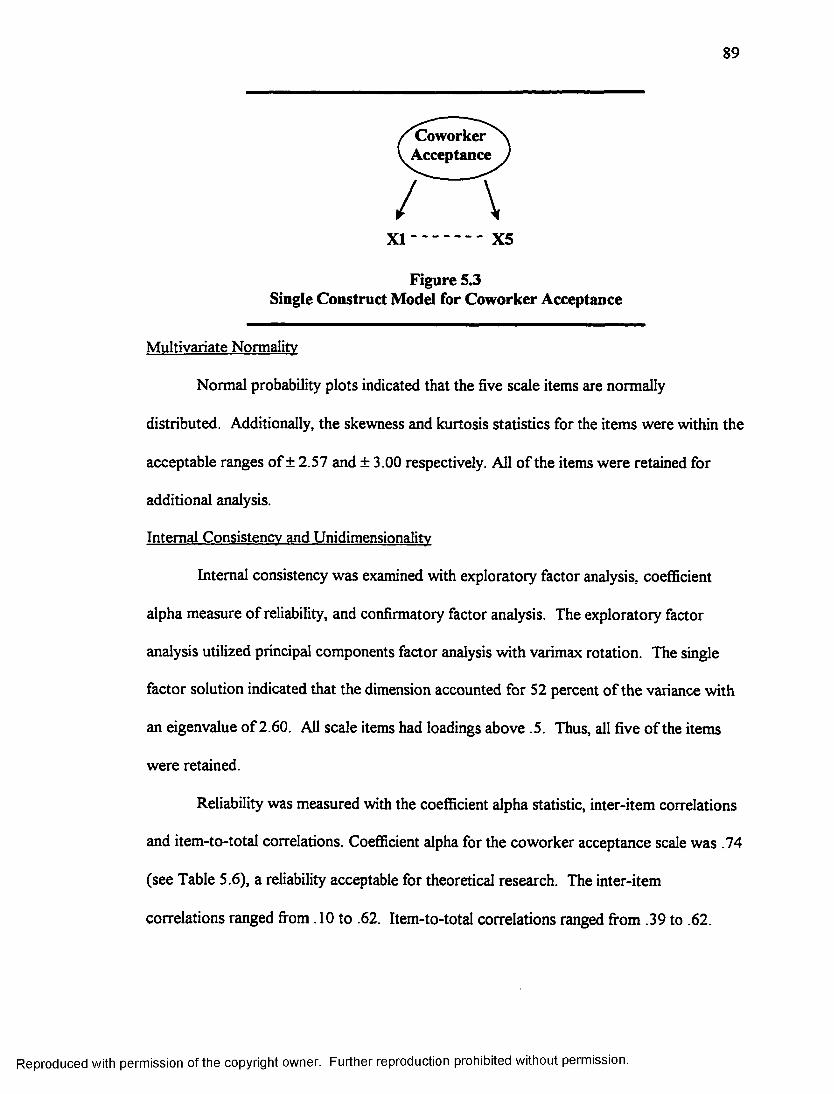
89
CoworkerAcceptance
X I ------------- X5
Figure 5.3Single Construct Model for Coworker Acceptance
Multivariate Normality
Normal probability plots indicated that the five scale items are normally
distributed. Additionally, the skewness and kurtosis statistics for the items were within the
acceptable ranges of ± 2.57 and ±3.00 respectively. All of the items were retained for
additional analysis.
Internal Consistencv and Unidimensionalitv
Internal consistency was examined with exploratory factor analysis, coefiBcient
alpha measure of reliability, and confirmatory factor analysis. The exploratory factor
analysis utilized principal components factor analysis with varimax rotation. The single
factor solution indicated that the dimension accounted for 52 percent of the variance with
an eigenvalue of 2.60. All scale items had loadings above .5. Thus, all five of the items
were retained.
Reliability was measured with the coefiBcient alpha statistic, inter-item correlations
and item-to-total correlations. CoefiBcient alpha for the coworker acceptance scale was .74
(see Table 5.6), a reliability acceptable for theoretical research. The inter-item
correlations ranged from .10 to .62. Item-to-total correlations ranged from .39 to .62.
Reproduced with permission of the copyright owner. Further reproduction prohibited without permission.

90
Several measures from a confirmatory factor analysis were used to evaluate
internal consistency and dimensionality. These measures include composite reliability,
average variance extracted, and standardized loadings (see Table 5.6 and Table 5.7). The
composite reliability for the coworker acceptance measure was .77, which is in an
acceptable range. The average variance extracted (amount of variance captured by a
construct’s measures relative to random measurement error) was .41. This is less than the
desired level of variance extracted of > .50. The standardized loadings of the items are
presented in Table 5.7. These individual loadings range from .38 to .82 with three o f the
three items outside the acceptable loading of > .70.
Table 5.6
Property ValueNumber of Items 5Mean 25.85Standard Deviation 4.91Variance 24.11Coefficient Alpha .74Composite Reliability .77Average Variance Extracted .41
Table 5.7Standardized Loadings, Means and Standard Deviations
Items StandardizedLoading
Mean StandardDeviation
The salespeople 1 woric with actively try to include me in conversations about things at woric
.59 5.18 1.51
Other salespeople in my organization feel relaxed when they are with me
.82 5.86 .99
I have a lot in common with the other salespeople in my organization
.58 4.80 1.57
In many ways 1 am a lot like the other salespeople in my organization
.38 4.38 1.66
The other salespeople 1 work with like me .74 5.64 1.18
Reproduced with permission of the copyright owner. Further reproduction prohibited without permission.

91
Modeling
A major component of the conceptual social learning model of sales performance
is effort by salespeople to become better salespeople and achieve higher levels of
performance by modeling the successful sale’s behaviors of other salespeople they work
with. Part of this dissertation research is the development of a modeling scale to be used
in the construction of the proposed social learning model. Scale development follows the
eight-step process suggested by DeVellis (1991). The following sections will examine the
modeling construct conceptually and review the procedures used to develop the modeling
scale.
Construct Definition
If one’s knowledge could be acquired only through the effects of one’s own
actions, the process of cognitive, social, and behavioral development would be somewhat
tedious and lengthy. Without informative guidance, much of one’s effort to leam
appropriate behavior patterns would become a very costly process (in terms of time and
effort) of trial and error. By observing the behaviors of others, however, we are able to
form rules o f behavior which serve as guides for appropriate and successful behaviors
without the trial and error process. Thus, modeling is defined by Bandura (1986) as the
acquisition of cognitive skills and patterns of behavior by observing the performance of
others.
Traditionally, the modeling process has been conceptualized as consisting of two
dimensions (imitation and identification) (Bandura 1986). Imitation is the process by
which one person matches the actions or behaviors of another person, usually close in
time. Identification involves incorporation of observed personality patterns. For this
Reproduced with permission of the copyright owner. Further reproduction prohibited without permission.

92
research, the imitation aspect of modeling is included since a dissertation objective is to
examine the role that learning successful sale’s behaviors from observation and imitation
have in successful sales performance.
Generation of Item Pool
The initial pool of scale items was developed from Bandura’s (1986)
conceptualization of his social learning theory, the literature related to behavioral
modeling, and input from three professional salespeople based on their understanding and
practice of the modeling concept. With an objective of a scale with around 10 items, this
first pool consisted of 39 items based on DeVellis’(1991) guideline of a beginning pool of
items that is three or four times as large as the final scale.
Measurement Format
The items in the initial pool are measured with a seven-point Likert type scale
which is widely used in instruments measuring opinions, beliefs, and attitudes (DeVellis
1991). The measurement range is anchored with “Strongly Disagree” and “Strongly
Agree.” This measurement format was selected for two reasons: (1) responsiveness to
specific levels of the attribute in question - modeling behavior; and (2) consistency of the
format with other scales in the questionnaire.
Review of Initial Item Pool
The definition of the modeling construct and the relevancy of each item to the
construct was validated by having three experts review the initial pool of items. The
review panel consisted of a management professor whose dissertation and research
interests are in the social learning area; a Ph D. student with an extensive professional
selling background; and a professional salesperson working for an international
Reproduced with permission of the copyright owner. Further reproduction prohibited without permission.

93
manufacturer and distributor of computer systems. Each individual was provided with a
working definition of the modeling construct and then asked to rate each item as to
relevance to the construct as defined. Each item was rated as being highly relevant,
moderately relevant, or low in relevance to the defined construct. From the initial pool of
39 items, 19 items, which all three judges agreed were highly relevant, were retained for
the pretest.
Inclusion of Validation Items
For construct validation, five items firom Jones’ (1986) socialization scale
measuring guided socialization were included in the study. This socialization scale
measures the extent that experienced employees work closely with new employees,
serving as role models of expected job behavior. The concept of guided socialization
includes access to more experienced salespeople in an organization and opportunities to
directly observe the behaviors of these experienced salespeople. Such access and
opportunities for observation should correlate significantly with the modeling scale.
First Administration to Development Sample
The proposed modeling scale was first administered to a dissertation pretest
sample of 100 automobile salespeople. This sample of 100 respondents was drawn fi'om a
population of approximately 130 salespeople representing 10 automobile dealerships
within the metroplex area of a mid-sized city in southern Louisiana. DeVellis (1991)
indicates that a sample size o f less than 300 respondents is sufficient for this first
administration if a single scale is to be extracted fi'om an item pool of 20 or less items.
Reproduced with permission of the copyright owner. Further reproduction prohibited without permission.
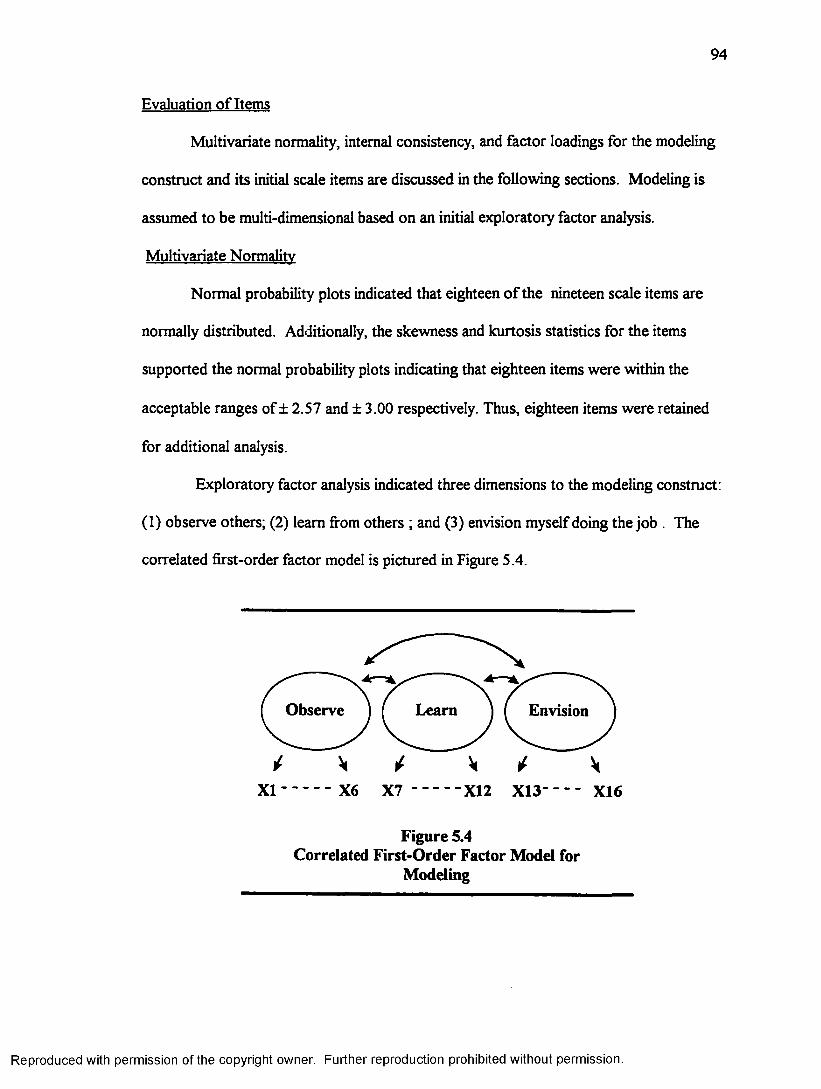
94
Evaluation of Items
Multivariate normality, internal consistency, and factor loadings for the modeling
construct and its initial scale items are discussed in the following sections. Modeling is
assumed to be multi-dimensional based on an initial exploratory factor analysis.
Multivariate Normality
Normal probability plots indicated that eighteen o f the nineteen scale items are
normally distributed. Additionally, the skewness and kurtosis statistics for the items
supported the normal probability plots indicating that eighteen items were within the
acceptable ranges of ± 2.57 and ± 3.00 respectively. Thus, eighteen items were retained
for additional analysis.
Exploratory factor analysis indicated three dimensions to the modeling construct:
(I) observe others; (2) leam from others ; and (3) envision myself doing the job . The
correlated first-order factor model is pictured in Figure 5.4.
Observe Learn Envision
X I X6 X 7 X12 X13--------- X16
Figure 5.4Correlated First-Order Factor Model for
Modeling
Reproduced with permission of the copyright owner. Further reproduction prohibited without permission.

95
Internal Consistencv and Dimensionality
Internal consistency was examined for the three dimensions with exploratory factor
analysis, coefficient alpha measure of reliability, and confirmatory factor analysis. The
exploratory factor analysis utilized principal components factor analysis with varimax
rotation. The factor analysis was unconstrained in terms of factors identified, but was
limited to factors with eigenvalues > 1.00. The three factor solution indicated that the
three dimensions accounted for 66.8 percent of the variance with eigenvalues from 9.25 to
1.23. All but two scale items had loadings above .5 and exhibited simple structure. The
two items were dropped and sixteen items were retained for further analysis..
Reliability was measured with the coefficient alpha statistic, inter-item correlations
and item-to-total correlations. Coefficient alpha reliabilities were computed for each
dimension of the modeling scale. For the three modeling dimensions, reliability ranged
from .81 to .91 (see Table 5.8), all above an acceptable reliability of > .70. The inter-item
correlations ranged from .38 to .83 across the three dimensions. Item-to-total correlations
ranged from .56 to .83 across the three dimensions. These measures, for most of the
sixteen items, are above acceptable criteria for coefficient alpha, inter-item correlations,
and item-to-total correlations, with a few of the items marginally acceptable.
Several measures fi'om a confirmatory factor analysis were used to evaluate
internal consistency and dimensionality. These measures include composite reliability,
average variance extracted, and standardized item loadings (see Table 5.8 and Table 5.9).
The composite reliabilities for the three modeling dimensions ranged firom .83 to .91, all
above an acceptable composite reliability of > .70. The average variance extracted
(amount of variance captured by a construct’s measures relative to random measurement
Reproduced with permission of the copyright owner. Further reproduction prohibited without permission.

96
error) ranged from .55 to 64, all above an acceptable variance extracted of > .50. The
standardized loadings of the items for the three dimensions are presented in Table 5.9.
These individual item loadings range from .63 to .88. Three of the sixteen items are below
an acceptable loading of > .70, with two of the items marginally acceptable. All sixteen
items were retained for further analysis.
Table 5.8
Property Observe Leam EnvisionNumber of Items 6 6 4Mean 30.09 32.81 20.88Standard Deviation 7.37 6.61 4.85Variance 54.29 43.65 23.50Coefficient Alpha .91 .90 .81Composite Reliability .91 .91 .83Average Variance Extracted .64 .62 .55
Table 5.9Standardized Loadings, Means and Standard Deviations
Items StandardizedLoading
Mean StandardDeviation
Observe1 look for selling techniques that other good salespeople use and try to copy them myself
.83 5.06 1.46
1 visualize myself using selling methods that 1 see other good salespeople using
.88 5.20 1.40
Some of my best sales techniques have come from watching other effective salespeople in action
.67 5.03 1.60
1 visualize myself using selling methods that 1 see other good salespeople using
.85 5.32 1.40
1 try to picture in my own mind how successful salespeople in my organization do the job and then be more like them
.84 4.87 1.44
1 try to imitate the selling styles that seem to work best for other salespeople in my organization
.71 4.62 1.55
Leam1 have increased my own sales performance by observing the activities of other salespeople
.85 5.65 1.16
1 have learned to be a better salesperson by watching the techniques of other salespeople
.85 5.72 1.21
1 watch and then practice how effective salespeople deal with difficult prospects
.86 5.70 1.22
(table cont.)
Reproduced with permission of the copyright owner. Further reproduction prohibited without permission.

97
I have learned how to better present the features of my products by watching how other salespeople do it
.78 5.45 1.55
I am better at explaining feature and benefits of my products watching how salespeople I work with do it and then practicing their method
.73 4.79 1.64
I use effective selling techniques that I see other successful salespeople using
.63 5.51 1.28
EnvisionI imitate the actions of successful salespeople 1 v/otk with
.67 4.67 1.73
When I see coworicers performing the job well, I envision myself doing the job as well
.71 5.59 1.41
After observing other successful salespeople selling, I visualize myself doing the same kind of sales job
.85 5.58 1.34
When I see other salespeople being rewarded for doing a good job, I try to imitate their selling methods
.71 5.03 1.55
Factor Loadings
Using LISREL VUE, factor loadings for the three dimensions of co worker
feedback were examined in a second-order factor model (see Figure 5.5). To test that the
Modeling
Observe Learn Envision
XI - X6 X7 X12 X13- -X16
Figure 5.5Second-Order Factor Model for Modeling
three dimensions equally represented the same construct, a second-order model with
unrestrained factor loadings was compared to the same second-order model with factor
loadings constrained to be equal across the three dimensions. Equal chi-square statistics
Reproduced with permission of the copyright owner. Further reproduction prohibited without permission.
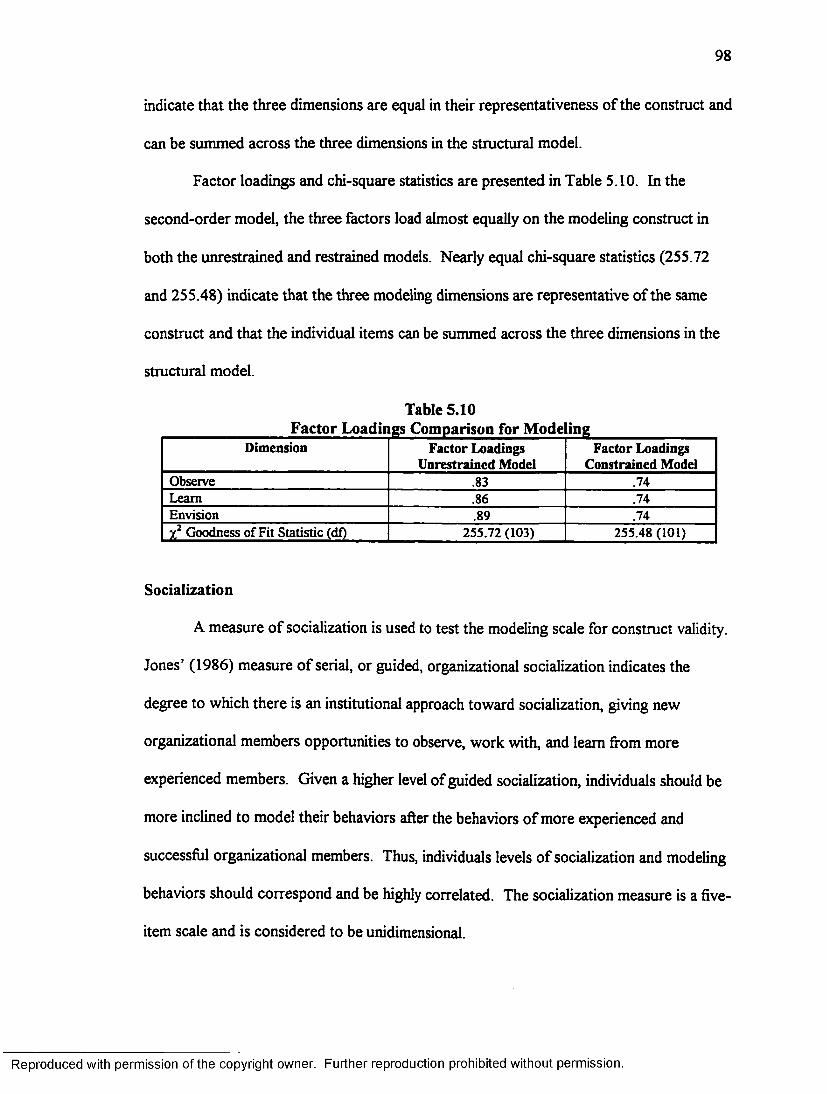
98
indicate that the three dimensions are equal in their representativeness of the construct and
can be summed across the three dimensions in the structural model.
Factor loadings and chi-square statistics are presented in Table S. 10. In the
second-order model, the three factors load almost equally on the modeling construct in
both the unrestrained and restrained models. Nearly equal chi-square statistics (255.72
and 255.48) indicate that the three modeling dimensions are representative of the same
construct and that the individual items can be summed across the three dimensions in the
structural model.
Table 5.10Factor Loadings Comparison for Mode ing
Dimension Factor Loadings Unrestrained Model
Factor Loadings Constrained Model
Observe .83 .74Leam .86 .74Envision .89 .74
Goodness of Fit Statistic (df) 255.72 (103) 255.48 (101)
Socialization
A measure of socialization is used to test the modeling scale for construct validity.
Jones’ (1986) measure of serial, or guided, organizational socialization indicates the
degree to which there is an institutional approach toward socialization, giving new
organizational members opportunities to observe, work with, and leam from more
experienced members. Given a higher level of guided socialization, individuals should be
more inclined to model their behaviors after the behaviors of more experienced and
successful organizational members. Thus, individuals levels of socialization and modeling
behaviors should correspond and be highly correlated. The socialization measure is a five-
item scale and is considered to be unidimensional.
Reproduced with permission of the copyright owner. Further reproduction prohibited without permission.

99
Multivariate normality and internal consistency for the socialization are discussed
in the following sections. Exploratory factor analysis indicated a single dimension to the
socialization construct. Thus, socialization is treated as a single dimension construct with
five indicators. The single construct with multiple indicators is pictured in Figure 5.6.
Socialization
XI X5
Figure 5.6Single Construct Model for Socialization
Multivariate Normality
Normal probability plots indicated that the five scale items are normally
distributed. Additionally, the skewness and kurtosis statistics for the items were within the
acceptable ranges of ± 2.57 and ±3.00 respectively. All of the items were retained for
additional analysis.
Internal Consistencv and Unidimensionalitv
Internal consistency was examined with exploratory factor analysis, coefficient
alpha measure of reliability, and confirmatory factor analysis. The exploratory factor
analysis utilized principal components factor analysis with varimax rotation. The single
factor solution indicated that the dimension accounted for 46 percent of the variance with
Reproduced with permission of the copyright owner. Further reproduction prohibited without permission.

100
an eigenvalue of 2.30. All scale items had loadings above .5. Thus, all five of the items
were retained.
Reliability was measured with the coefficient alpha statistic, inter-item correlations
and item-to-total correlations. Coefficient alpha for the socialization scale was .70 (see
Table 5.11), a reliability acceptable for theoretical research. The inter-item correlations
ranged fi'om .08 to .46. Item-to-total correlations ranged firom .35 to .55.
Several measures firom a confirmatory factor analysis were used to evaluate
internal consistency and dimensionality. These measures include composite reliability,
average variance extracted, and standardized loadings (see Table 5.11 and Table 5.12).
The composite reliability for the socialization measure was .71 which is in an acceptable
range. The average variance extracted (amount of variance captured by a construct’s
measures relative to random measurement error) was .33. This is less than the desired
level of variance extracted of > .50. The standardized loadings of the items are presented
in Table 5.10. These individual loadings range from .38 to .66, all five items below an
acceptable loading of > .70. Thus, all items are unacceptable and the entire socialization
scale must be modified or replaced.
Table 5.11Psychometric Properties for Socia ization
Property ValueNumber of Items 5Mean 24.58Standard Deviation 5.61Variance 31.49Coefficient Alpha .70Composite Reliability .71Average Variance Extracted .33
Reproduced with permission of the copyright owner. Further reproduction prohibited without permission.

101
Table 5.12Standardized Loadings, Means and Standard Deviations
For SocializationItems Standardized
LoadingMean Standard
DeviationManagers and experienced salespeople see advising or training new salespeople as one of their main job responsibilities in this d^ership
.38 4.62 1.80
I am gaining a clear understanding of my role in this dealership &om observing my senior coworkers
.47 4.95 1.61
I have received little guidance from the experienced salespeople in this dealership as to how I should perform my sales job
.65 3.22 1.64
I have little or no access to other salespeople who have performed well in this dealership
.67 2.53 1.41
I have been generally left alone to discover what my sales role should be in this dealership
.66 3.23 1.86
Job Tension
Job tension is measured with a six-item scale that is a combination of three items
developed by Jaworski and Maclnnis (1989) and three items added for the dissertation
pretest in an attempt to increase the reported reliability of .60. The job tension scale
assesses the frequency with which individuals experience stress related to their work, the
job performance evaluation process, and the achievement of goals.
Multivariate normality and internal consistency for the job tension construct are
discussed in the following sections. Exploratory factor analysis indicated two dimensions
to the job tension construct. Only two of the six items, however, loaded on a second
construct, and were dropped from further analysis. Thus, job tension is treated as a single
dimension construct with four indicators. The single construct with multiple indicators is
pictured in Figure 5.7. All four items exhibited normal distributions. The peakedness and
symmetry of the distributions were all within acceptable limits as discussed below. The
four items were retained in the analysis.
Reproduced with permission of the copyright owner. Further reproduction prohibited without permission.

102
Job Tension
X4XI
Figure 5.7 Single Construct Model for Job Tension
Multivariate Normality
Normal probability plots indicated that all four of the retained scale items are
normally distributed. Additionally, the skewness and kurtosis statistics for the items are
within acceptable ranges of ± 2.57 and ±3.00 respectively. All o f the items were retained
for additional analysis.
Internal Consistencv and Unidimensionalitv
Internal consistency was examined with exploratory factor analysis, coeflScient
alpha measure of reliability, and confirmatory factor analysis. The exploratory factor
analysis utilized principal components factor analysis with varimax rotation. The single
factor solution indicated that the dimension accounted for 42 percent of the variance with
an eigenvalue of 2.51. All scale items had loadings above .5. Thus, all four of the items
were retained.
Reliability was measured with the coefiBcient alpha statistic, inter-item correlations
and item-to-total correlations. Coefficient alpha for the job tension scale was .74 (see
Table 5.13), a reliability acceptable for theoretical research. The inter-item correlations
ranged from .34 to .61. Item-to-total correlations ranged fi'om .44 to .61. All items were
Reproduced with permission of the copyright owner. Further reproduction prohibited without permission.

103
above the desired level of > 3 for inter-item correlations. One item was below the desired
level of >.5 for item-to-total correlations. All items were retained for further analysis.
Several measures from a confirmatory factor analysis were used to evaluate
internal consistency and dimensionality. These measures include composite reliability,
average variance extracted, and standardized loading (see Table 5.13 and Table 5.14). The
composite reliability for the job tension measure was .75 which is in an acceptable range.
The average variance extracted (amount of variance captured by a construct’s measures
relative to random measurement error) was .43 The average variance extracted is below
the desired level of variance extracted of > .50. The standardized loadings of the items are
presented in Table 5.12. These individual loadings range from .49 to .77 with two of the
four items below the acceptable loading of > .70.
Table 5.13Psychometric Properties for Jo b Tension
Property ValueNumber of Items 4Mean 10.99Standard Deviation 3.43Variance 11.74Coefficient Alpha .74Composite Reliability .75Average Variance Extracted .43
Table 5.14Standardized Loadings, Means, and Standard Deviations
for Job TensionItems Standardized
LoadingMean Standard
DeviationIf 1 am not meeting my performance goals 1 feel tense
.55 2.24 1.01
When my sales manager is angry with me 1 feel tense
.49 2.88 1.11
When most other salespeople’s attainment is higher than mine
.77 2.84 1.25
When 1 don’t believe that my sales effort will pay off in performance
.77 3.03 1.17
Reproduced with permission of the copyright owner. Further reproduction prohibited without permission.

104
Past Performance
A salesperson’s past performance is assessed with a six-item scale adapted for this
research from Behrman and Perreault (1984). The past performance scale is a self-report
measuring the level of a salesperson’s output performance (e.g., number of units sold) in
the previous year. An issue in performance measurement is the desirability of
salespersons’ self-reports compared to management evaluations or company records.
Behrman and Perreault (1982) argue that individual salespersons have complete
knowledge of their performance and can provide accurate information. Churchill et al.
(1985) indicated that concerns o f upward bias for self-reports of performance are
unfounded.
Multivariate normality and internal consistency for the past performance construct
are discussed in the following sections. Exploratory factor analysis indicated a single
dimension to the past performance construct. The single construct with multiple
indicators is pictured in Figure 5.8.
Figure 5.8Single Construct Model for Past Performance
Reproduced with permission of the copyright owner. Further reproduction prohibited without permission.

105
Multivariate Normality
Normal probability plots indicated that all six of the retained scale items are
normally distributed. Additionally, the skewness and kurtosis statistics for the items are
within acceptable ranges of + 2.57 and ± 3.00 respectively. All of the items were retained
for additional analysis.
Internal Consistencv and Unidimensionalitv
Internal consistency was examined with exploratory factor analysis, Cronbach’s
Alpha measure o f reliability, and confirmatory factor analysis. The exploratory factor
analysis utilized principal components factor analysis with varimax rotation. The single
factor solution indicated that the dimension accounted for 78 percent of the variance with
an eigenvalue o f 4.69. All scale items had loadings above .5. Thus, all five of the items
were retained.
Reliability was measured with the coeflBcient alpha statistic, inter-item correlations
and item-to-total correlations. CoeflBcient alpha for the past performance scale was .94
(see Table 5.15), a reliability acceptable for theoretical research. The inter-item
correlations ranged fi'om .44 to .96. Item-to-total correlations ranged from .51 to .93. All
items were above the desired level of > 3 for inter-item correlations and > 5 for item-to-
total correlations. Thus, all items were retained for further analysis.
Several measures from a confirmatory factor analysis were used to evaluate
internal consistency and dimensionality. These measures include composite reliability,
average variance extracted, and standardized loading (see Table 5.15 and Table 5.16). The
composite reliability for the past performance measure was .94 which is in an acceptable
Reproduced with permission of the copyright owner. Further reproduction prohibited without permission.

106
range. The average variance extracted (amount of variance captured by a construct’s
measures relative to random measurement error) was .75 The average variance extracted
is within the desired level of variance extracted of > .50. The standardized loadings of the
items are presented in Table 5.14. These individual loadings range from .49 to .99 with
one of the six items outside the acceptable loading of > .70.
Table 5.15
Property ValueNumber of Items 6Mean 19.00Standard Deviation 8.47Variance 71.72CoefBcient Alpha .94Composite Reliability .94Average Variance Extracted .75
Table 5.16Standardized Loadings, Means, and Standard Deviations
for Past PerformanceItems Standardized
LoadingMean Standard
DeviationLevel of dollar sales last year .97 3.05 1.65Number of units sold last year .99 3.05 1.61Number of customer complaints last year .49 3.18 1.75My overall selling tactics last year .80 3.37 1.42My sales commissions last year .96 3.06 1.62My sales commissions over last six months .86 3.28 1.65
Coworker Feedback
Co worker feedback is assessed with a combination of four separate scales
developed by Kohli and Jaworski (1994) to measure four dimensions of feedback from
coworkers: (1) positive output feedback; (2) negative output feedback; (3) positive
behavioral feedback; and (4) negative behavioral feedback. The dimensionality of the
combined scale is examined with confirmatory factor analysis.
Reproduced with permission of the copyright owner. Further reproduction prohibited without permission.
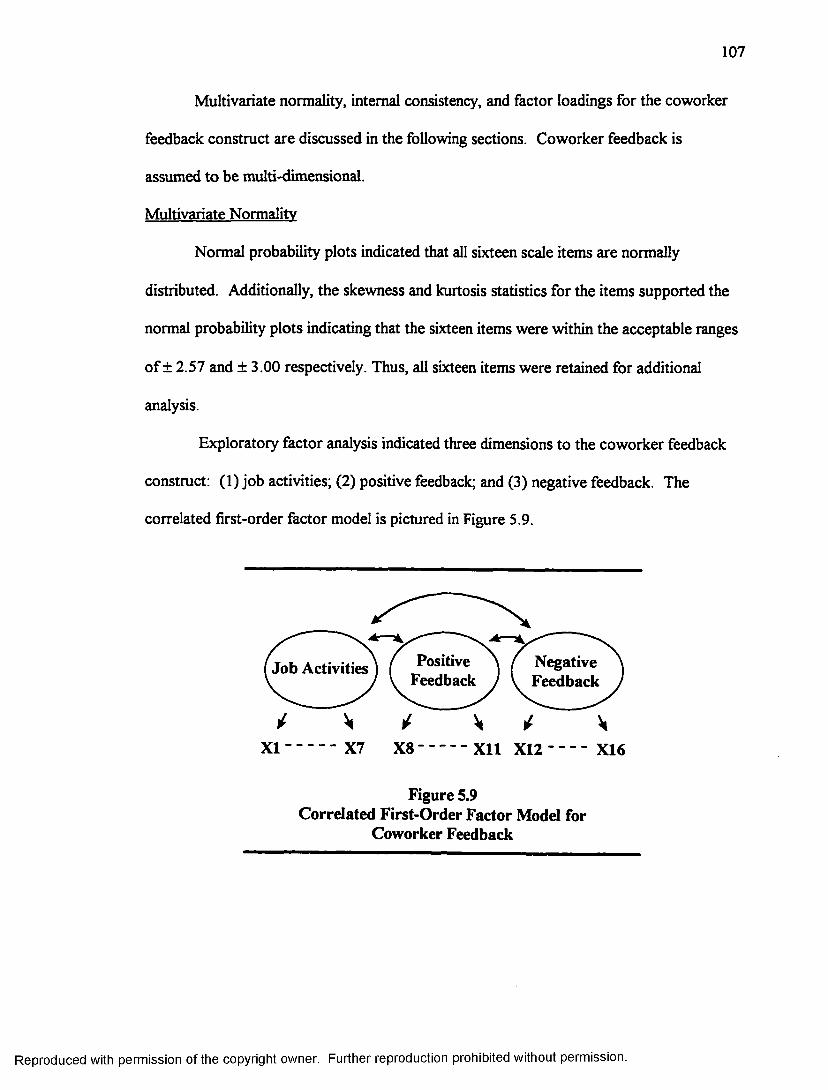
107
Multivariate normality, internal consistency, and factor loadings for the coworker
feedback construct are discussed in the following sections. Coworker feedback is
assumed to be multi-dimensional.
Multivariate Normality
Normal probability plots indicated that all sixteen scale items are normally
distributed. Additionally, the skewness and kurtosis statistics for the items supported the
normal probability plots indicating that the sixteen items were within the acceptable ranges
of ± 2.57 and ±3.00 respectively. Thus, all sixteen items were retained for additional
analysis.
Exploratory factor analysis indicated three dimensions to the coworker feedback
construct: (1) job activities; (2) positive feedback; and (3) negative feedback. The
correlated first-order factor model is pictured in Figure 5.9.
PositiveFeedback
NegativeFeedback
Job Activities
XI X7 X8 X ll X 1 2 - - - - X16
Figure 5.9Correlated First-Order Factor Model for
Coworker Feedback
Reproduced with permission of the copyright owner. Further reproduction prohibited without permission.

108
Internal Consistency and Dimensionality
Internal consistency was examined for the three dimensions with exploratory factor
analysis, coefficient alpha measure of reliability, and confirmatory factor analysis. The
exploratory factor analysis utilized principal components factor analysis with varimax
rotation. The factor analysis was unconstrained in terms of factors identified, but was
limited to factors with eigenvalues > 1.00. The three factor solution indicated that the
three dimensions accounted for 61.8 percent of the variance with eigenvalues fi"om 5.59 to
1.43. All scale items had loadings above .5 and exhibited simple structure. Thus, all
sixteen of the items were retained.
Reliability was measured with the coefficient alpha statistic, inter-item correlations
and item-to-total correlations. Coefficient alpha reliabilities were computed for each
dimension o f the feedback from salespeople scale. For the three feedback dimensions,
reliability ranged fi"om .75 to .88 (see Table 5.17), all above an acceptable reliability of >
.70. The inter-item correlations ranged from .29 to .81 across the three dimensions. Item-
to-total correlations ranged from .42 to .76 across the three dimensions. These measures,
for most of the sixteen items, are above acceptable criteria for coefficient alpha (.70),
inter-item correlations (.30), and item-to-total correlations (.50), with a few of the items
marginal.
Several measures firom a confirmatory factor analysis were used to evaluate
internal consistency and dimensionality. These measures include composite reliability,
average variance extracted, and standardized item loadings (see Table 5.17 and Table
5.18). The composite reliabilities for the three feedback from salespeople dimensions
ranged from .88 to .76, all above an acceptable composite reliability of .70. The average
Reproduced with permission of the copyright owner. Further reproduction prohibited without permission.
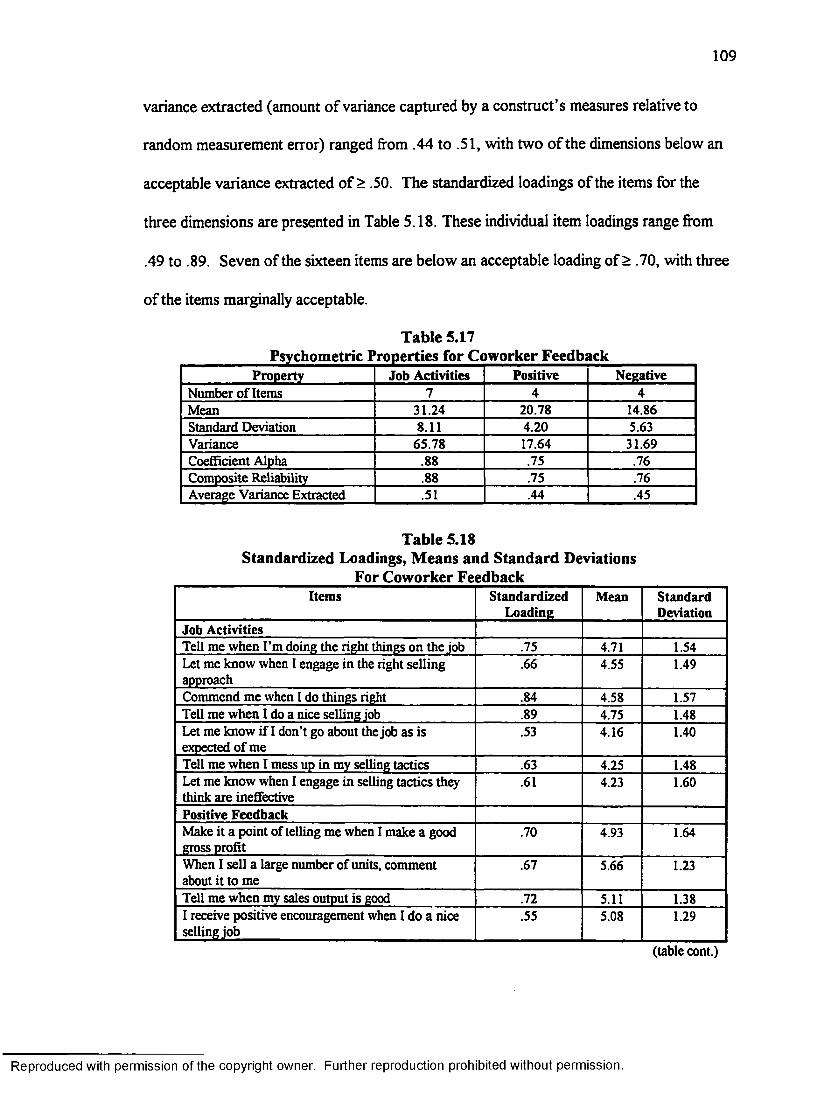
109
variance extracted (amount of variance captured by a construct’s measures relative to
random measurement error) ranged from .44 to .51, with two of the dimensions below an
acceptable variance extracted of > .50. The standardized loadings of the items for the
three dimensions are presented in Table 5.18. These individual item loadings range from
.49 to .89. Seven of the sixteen items are below an acceptable loading of > .70, with three
of the items marginally acceptable.
Table 5.17
Property Job Activities Positive NegativeNumber of Items 7 4 4Mean 31.24 20.78 14.86Standard Deviation 8.II 4.20 5.63Variance 65.78 17.64 31.69CoefBcient Alpha .88 .75 .76Composite Reliability .88 .75 .76Average Variance Extracted .51 .44 .45
Table 5.18Standardized Loadings, Means and Standard Deviations
For Coworker FeedbackItems Standardized
LoadingMean Standard
DeviationJob ActivitiesTell me when I’m doing the right things on the job .75 4.71 1.54Let me know when 1 engage in the right selling approach
.66 4.55 1.49
Commend me when 1 do things right .84 4.58 1.57Tell me when 1 do a nice selling job .89 4.75 1.48Let me know if 1 don’t go about the job as is expected of me
.53 4.16 1.40
Tell me when 1 mess up in my selling tactics .63 4.25 1.48Let me know when 1 engage in selling tactics they think are ineffective
.61 4.23 1.60
Positive FeedbackMake it a point of telling me when 1 make a good gross profit
.70 4.93 1.64
When 1 sell a large number of units, comment about it to me
.67 5.66 1.23
Tell me when my sales output is good .72 5.11 1.381 receive positive encouragement when 1 do a nice selling job
.55 5.08 1.29
(table com.)
Reproduced with permission of the copyright owner. Further reproduction prohibited without permission.
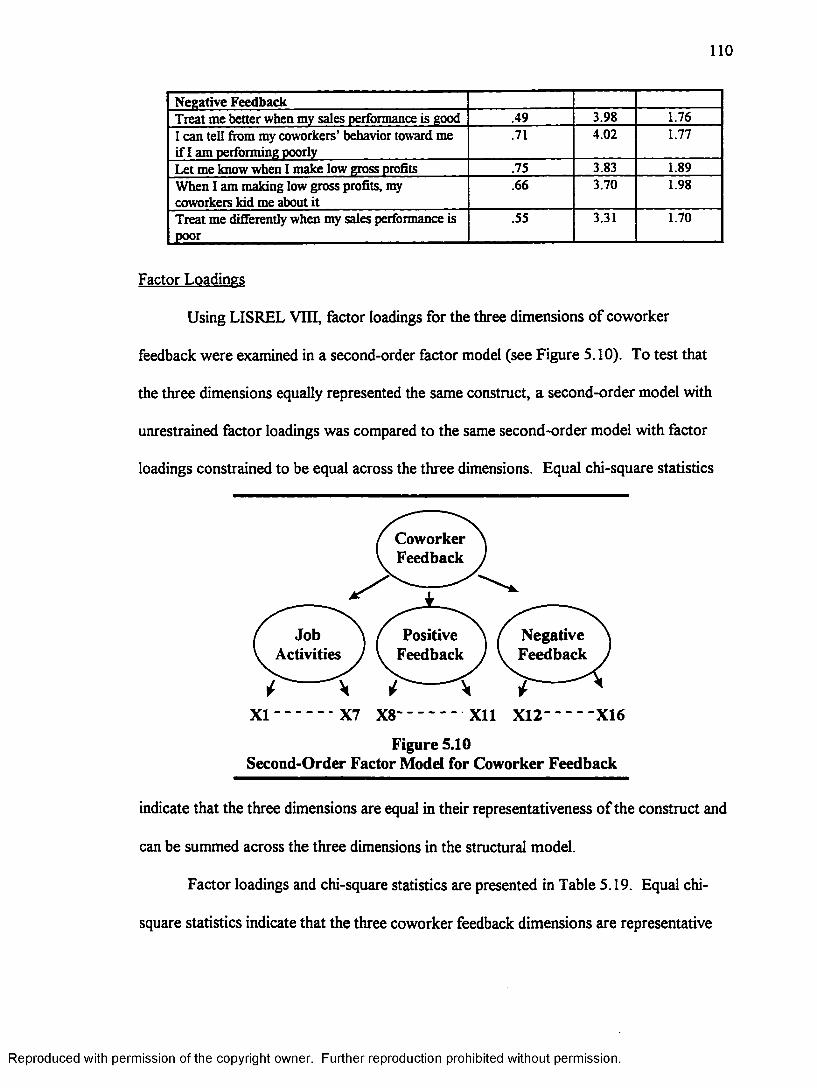
110
Negative FeedbackTreat me better when my sales performance is good .49 3.98 1.76I can tell firom my coworicers’ behavior toward me if I am performing poorly
.71 4.02 1.77
Let me know when I make low gross profits .75 3.83 1.89When I am making low gross profits, ngr coworkers kid me about it
.66 3.70 1.98
Treat me dififerently when my sales performance is poor
.55 3.31 1.70
Factor Loadings
Using LISREL VIQ, factor loadings for the three dimensions of co worker
feedback were examined in a second-order factor model (see Figure 5.10). To test that
the three dimensions equally represented the same construct, a second-order model with
unrestrained factor loadings was compared to the same second-order model with factor
loadings constrained to be equal across the three dimensions. Equal chi-square statistics
CoworkerFeedback
JobActivities
NegativeFeedback
PositiveFeedback
XI - X7 X8- X ll X12- •X16
Figure 5.10Second-Order Factor Model for Coworker Feedback
indicate that the three dimensions are equal in their representativeness of the construct and
can be summed across the three dimensions in the structural model.
Factor loadings and chi-square statistics are presented in Table 5.19. Equal chi-
square statistics indicate that the three coworker feedback dimensions are representative
Reproduced with permission of the copyright owner. Further reproduction prohibited without permission.

Ill
of the same construct and that the individual items can be summed across the three
dimensions in the structural model. The chi-square statistics for the two models of
Coworker Feedback are not equal. The dimension of negative feedback exhibits a very
low factor loading and will be examined for modifications or deletion for the final study.
For the pretest data analysis, the scale items for the three dimensions were summed to
examine the correlation between model constructs.
Table 5.19
Dimension Factor Loadings Unrestrained Model
Factor Loadings Constrained Model
Job Activities .19 .53Positive Feedback .60 .53Negative Feedback .18 .53
Goodness of Fit Statistic (df) 268.78 (87) 286.10 (89)
Manager Feedback
Manager feedback is assessed with a combination of four separate scales
developed by Kohli and Jaworski (1994) to measure four dimensions of feedback from
CO workers: (1) positive output feedback; (2) negative output feedback; (3) positive
behavioral feedback; and (4) negative behavioral feedback. The dimensionality of the
combined scale is examined with confirmatory factor analysis.
Multivariate normality, internal consistency, and factor loadings for the manager
feedback construct are discussed in the following sections. Manager feedback is assumed
to be multi-dimensional.
Multivariate Normalitv
Normal probability plots indicated that fifteen of the sixteen scale items are
normally distributed. Additionally, the skewness and kurtosis statistics for the items
Reproduced with permission of the copyright owner. Further reproduction prohibited without permission.

112
supported the normal probability plots indicating that fifteen items were within the
acceptable ranges of ± 2.57 and ±3.00 respectively. Thus, the fifteen items were retained
for additional analysis.
Exploratory factor analysis indicated three dimensions to the manager feedback
construct: (1) positive feedback; (2) treatment ; and (3) job activities. The correlated
first-order factor model is pictured in Figure 5.11.
PositiveFeedback
JobActivities
Treatment
X I X7 X 8 X12 X 13---------X15
Figure 5.11 Correlated First-Order Factor Model for
Manager Feedback
Internal Consistencv and Dimensionality
Internal consistency was examined for the three dimensions with exploratory factor
analysis, coefiBcient alpha measure of reliability, and confirmatory factor analysis. The
exploratory factor analysis utilized principal components factor analysis with varimax
rotation. The factor analysis was unconstrained in terms of factors identified, but was
limited to factors with eigenvalues > 1.00. The three factor solution indicated that the
three dimensions accounted for 67.5 percent of the variance with eigenvalues from 5.98 to
Reproduced with permission of the copyright owner. Further reproduction prohibited without permission.
113
1.26. All scale items hadioadings above .5 and exhibited simple structure. Thus, all
fifteen of the items were retained.
Reliability was measured with the coefiBcient alpha statistic, inter-item correlations
and item-to-total correlations. CoefiBcient alpha reliabilities were computed for each
dimension of the manager feedback scale. For the three feedback dimensions, reliability
ranged from .79 to .92 (see Table5.20), all above an acceptable reliability of > .70. The
inter-item correlations ranged from .32 to .82 across the three dimensions. Item-to-total
correlations ranged from .55 to .84 across the three dimensions. These measures, for
most of the sixteen items, are above acceptable criteria for coefiBcient alpha, inter-item
correlations, and item-to-total correlations, with a few of the items marginal.
Several measures from a confirmatory factor analysis were used to evaluate
internal consistency and dimensionality. These measures include composite reliability,
average variance extracted, and standardized item loadings (see Table 5.20 and Table
5.21). The composite reliabilities for the three feedback from manager dimensions ranged
from .79 to .92, all above an acceptable composite reliability of > .70. The average
variance extracted (amount of variance captured by a construct's measures relative to
random measurement error) ranged from .43 to .67, with one of the dimensions below an
acceptable variance extracted of > .50. The standardized loadings of the items for the
three dimensions are presented in Table 5.21. These individual item loadings range from
.62 to .91. Six of the fifteen items are below an acceptable loading of > .70, with one of
the items marginally acceptable.
Reproduced with permission of the copyright owner. Further reproduction prohibited without permission.

114
Table 5.20
Property Positive Treatment ActivitiesNumber of Items 7 5 3Mean 39.59 23.55 16.34Standard Deviation 7.91 6.67 4.11Variance 62.52 44.53 16.86Coefficient Alpha .92 .79 .85Composite Reliability .92 .79 .85Average Variance Extracted .64 .43 .67
Table 5.21Standardized Loadings, Means and Standard Deviations
Items StandardizedLoading
Mean StandardDeviation
Positive FeedbackMake it a point of telling me when 1 make a good gross profit
.77 5.73 1.42
When 1 sell a large number of units, comment about it to me
.64 5.96 1.21
Tell me when my sales output is good .65 5.79 1.14Tell me when I’m doing the right things on the job .91 5.39 1.50Let me know when 1 engage in the right selling approach
.86 5.48 1.54
Commend me when 1 do things right .78 5.65 1.26Tell me when 1 do a nice selling job .89 5.54 1.46TreatmentTreat me better when my sales performance is good
.62 5.08 1.78
I can tell from my coworkers’ behavior toward me if 1 am performing poorly
.65 5.06 1.69
Let me know when 1 make low gross profits .65 5.05 1.81When 1 am making low gross profits, my coworkers kid me about it
.70 4.17 1.99
Treat me differently when my sales performance is poor
.66 4.25 1.83
Job ActivitiesLet me know if 1 don’t go about the job as is expected of me
.69 5.43 1.61
Tell me when 1 mess up in my selling tactics .90 5.45 1.51Let me know when 1 engage in selling tactics they think are ineffective
.85 5.47 1.57
Factor Loadings
Using LISREL VIII, factor loadings for the three dimensions of manager feedback
were examined in a second-order factor model (see Figure 5.12). To test that the three
Reproduced with permission of the copyright owner. Further reproduction prohibited without permission.

115
dimensions equally represented the same construct, a second-order model with
unrestrained factor loadings was compared to the same second-order model with factor
loadings constrained to be equal across the three dimensions. Equal chi-square statistics
indicate that the three dimensions are equal in their representativeness o f the construct and
can be summed across the three dimensions in the structural model.
ManagerFeedback
PositiveFeedback
JobActivities
Treatment
XI - X7 X8 X12 X13- ■X15
Figure 5.12Second-Order Factor Model for Manager Feedback
Factor loadings and chi-square statistics are presented in Table 5.22. The chi-
square statistics for the two Manager Feedback models are not equal. The three
dimensions of the construct will be examined for possible scale modifications and item
deletions. The three scales were summed in the pretest data analysis to examine
correlations between model constructs.
Table 5.22
Dimension Factor Loading Unrestrained Model
Factor Loading Constrained Model
Positive Feedback .28 .52Treatment .23 .52Job Activities .21 .52
Goodness of Fit Statistic (df) 232.58 (87) 253.03
Reproduced with permission of the copyright owner. Further reproduction prohibited without permission.

116
Self-Efficacy
Salespeople’s levels of self-efficacy are measured with a nine-item scale adapted
from Jones’ (1986) scale measuring the degree to which individuals feel that they possess
the skills necessary to successfully perform a specific task and have confidence in their
task-related capabilities. The measure is a seven-point Likert-type scale ranging from
“Strongly Disagree” to “Strongly Agree.” The pretest scale has been modified for a
personal selling context. The self-efficacy scale is considered to be unidimensional and is
verified via exploratory factor analysis.
Exploratory factor analysis indicated two dimensions to the self-efficacy construct.
Normality of the scale items was a problem with the self-efficacy scale and six of nine
items were dropped from the analysis. In an additional exploratory factor analysis o f the
remaining three items, two of the items loaded on one factor while the third item loaded
on a second factor. Thus, the self-efficacy scale must be completely modified or replaced
and no further analysis of the scale was performed.
Expectancy
Salespeople’s levels of expectancy are measured with a four-item scale
adapted from House and Dessler (1973) by Teas (1981) measuring the level of
expectations individuals have for the results of putting a lot o f effort into their work. The
measure is a five-point Likert-type scale ranging from “Never” to “Always.” The pretest
scale has been modified for a personal selling context. The expectancy scale is considered
to be unidimensional and is verified via exploratory factor analysis.
Multivariate normality and internal consistency for the expectancy construct are
discussed in the following sections. Exploratory factor analysis indicated a single
Reproduced with permission of the copyright owner. Further reproduction prohibited without permission.

117
dimension to the expectancy construct. Thus, expectancy is treated as a unidimensional
construct with three indicators. The single construct with multiple indicators is pictured in
Figure 5.12.
Expectancy
XI X3
Figure 5.13 Single Construct Model for Expectancy
Multivariate Normality
Normal probability plots indicated that all three of the retained scale items are
normally distributed. Additionally, the skewness and kurtosis statistics for the items are
within acceptable ranges of ± 2.57 and ± 3.00 respectively. All of the items were retained
for additional analysis.
Internal Consistencv and Unidimensionality
Internal consistency was examined with exploratory factor analysis, coefficient
alpha measure of reliability, and confirmatory factor analysis. The exploratory factor
analysis utilized principal components factor analysis with varimax rotation. The single
factor solution indicated that the dimension accounted for 74 percent of the variance with
an eigenvalue of 2.23. All scale items had loadings above .5. Thus, all three of the items
were retained. Reliability was measured with the coefficient alpha statistic, inter-item
correlations and item-to-total correlations. Coefficient alpha for the expectancy scale was
Reproduced with permission of the copyright owner. Further reproduction prohibited without permission.

118
.82 (see Table 5.23), a reliability acceptable for theoretical research. The inter-item
correlations ranged from .52 to .69, all above the minimum acceptable inter-item
correlation of .30. Item-to-total correlations ranged from .62 to .76, all above the
minimum acceptable level o f .50. All items were above the desired level of > 3 for inter
item correlations and >.5 for item-to-total correlations. Thus, all items were retained for
further analysis.
Several measures from a confirmatory factor analysis were used to evaluate
internal consistency and dimensionality. These measures include composite reliability,
average variance extracted, and standardized loading (see Table 5.23 and Table 5.24). The
composite reliability for the expectancy measure was .83, which is in an acceptable range.
The average variance extracted (amount of variance captured by a construct’s measures
relative to random measurement error) was .63. The average variance extracted is within
the desired level of variance extracted of > .50. The standardized loadings of the items are
presented in Table 5.24. These individual loadings range from .69 to .91 with one of the
three items slightly outside the acceptable loading of > .70.
Table 5.23
Property ValueNumber of Items 3Mean 12.69Standard Deviation 2.06Variance 4.24CoefRcient Alpha .82Composite Reliability .83Average Variance Extracted .63
Standardized loadings, means and standard deviations for expectancy are summarized in
Table 5.24 below.
Reproduced with permission of the copyright owner. Further reproduction prohibited without permission.
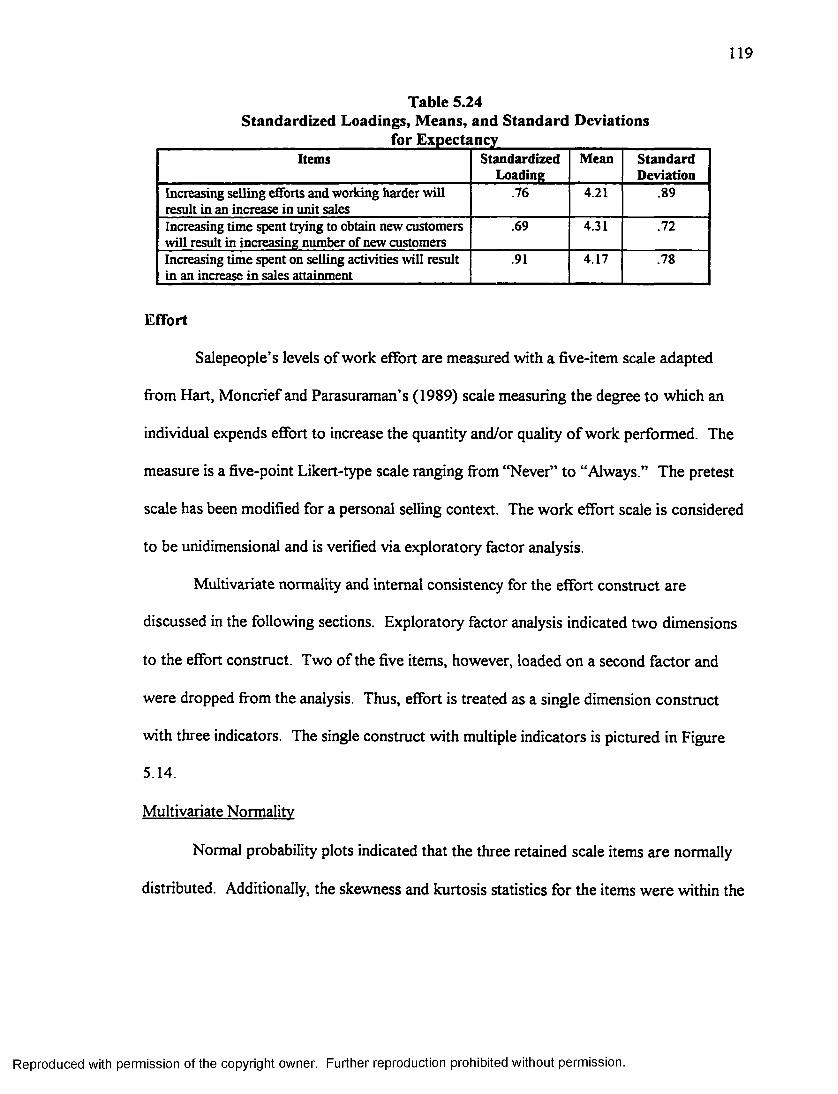
119
Table 5.24Standardized Loadings, Means, and Standard Deviations
Items StandardizedLoading
Mean StandardDeviation
Increasing selling eSbrts and working harder will result in an increase in unit sales
.76 4.21 .89
Increasing time spent trying to obtain new customers will result in increasing number of new customers
.69 4.31 .72
Increasing time spent on selling activities will result in an increase in sales attainment
.91 4.17 .78
Effort
Salepeople’s levels of work effort are measured with a five-item scale adapted
from Hart, Moncrief and Parasuraman’s (1989) scale measuring the degree to which an
individual expends effort to increase the quantity and/or quality o f work performed. The
measure is a five-point Likert-type scale ranging from “Never” to “Always.” The pretest
scale has been modified for a personal selling context. The work effort scale is considered
to be unidimensional and is verified via exploratory factor analysis.
Multivariate normality and internal consistency for the effort construct are
discussed in the following sections. Exploratory factor analysis indicated two dimensions
to the effort construct. Two of the five items, however, loaded on a second factor and
were dropped from the analysis. Thus, effort is treated as a single dimension construct
with three indicators. The single construct with multiple indicators is pictured in Figure
5.14.
Multivariate Normalitv
Normal probability plots indicated that the three retained scale items are normally
distributed. Additionally, the skewness and kurtosis statistics for the items were within the
Reproduced with permission of the copyright owner. Further reproduction prohibited without permission.
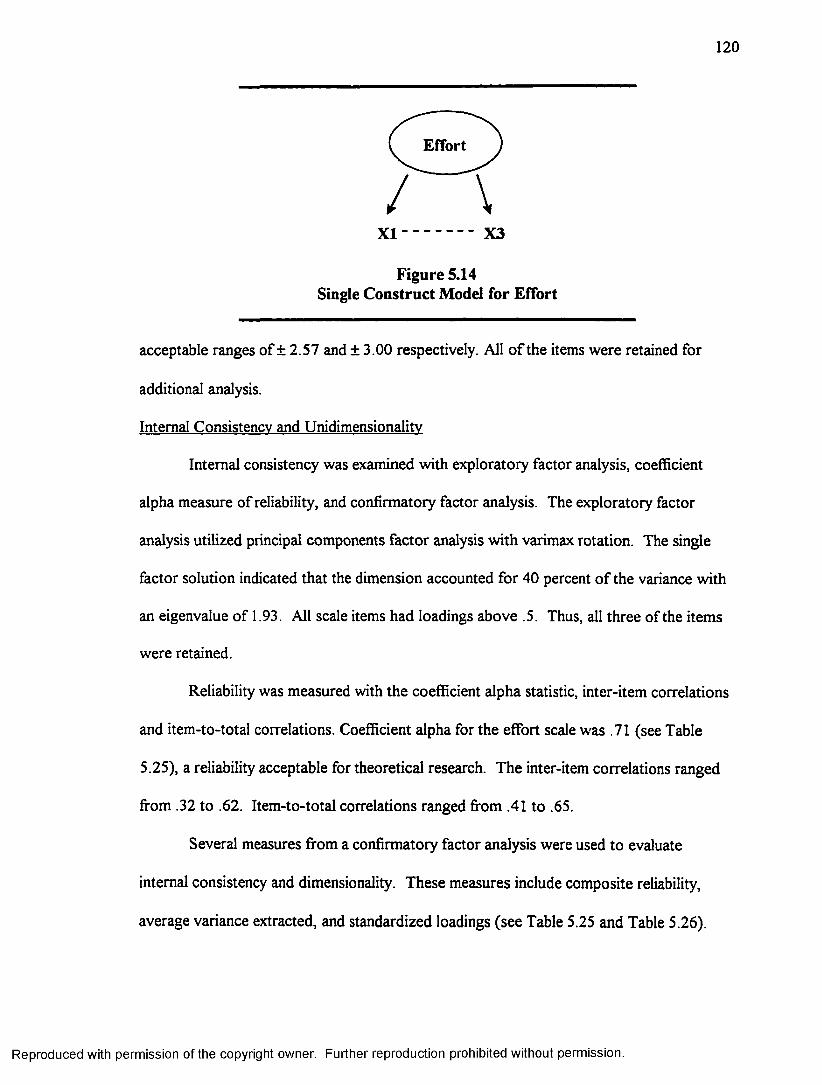
120
Effort
XI X3
Figure 5.14 Single Construct Model for Effort
acceptable ranges of ± 2.57 and ±3.00 respectively. All of the items were retained for
additional analysis.
Internal Consistencv and Unidimensionalitv
Internal consistency was examined with exploratory factor analysis, coefficient
alpha measure of reliability, and confirmatory factor analysis. The exploratory factor
analysis utilized principal components factor analysis virith varimax rotation. The single
factor solution indicated that the dimension accounted for 40 percent of the variance with
an eigenvalue of 1.93. All scale items had loadings above .5. Thus, all three of the items
were retained.
Reliability was measured with the coefficient alpha statistic, inter-item correlations
and item-to-total correlations. Coefficient alpha for the effort scale was .71 (see Table
5.25), a reliability acceptable for theoretical research. The inter-item correlations ranged
from .32 to .62. Item-to-total correlations ranged from .41 to .65.
Several measures from a confirmatory factor analysis were used to evaluate
internal consistency and dimensionality. These measures include composite reliability,
average variance extracted, and standardized loadings (see Table 5.25 and Table 5.26).
Reproduced with permission of the copyright owner. Further reproduction prohibited without permission.

121
The composite reliability for the effort measure was .74 which is in an acceptable range.
The average variance extracted (amount of variance captured by a construct’s measures
relative to random measurement error) was .33. This is less than the desired level of
variance extracted of > .50. The standardized loadings of the items are presented in Table
5.26. These individual loadings range from .47 to .91 with one of the three items well
outside the acceptable loading of > .70 and one item marginally unacceptable.
Table 5.25
Property ValueNumber of Items 3Mean 4.06Standard Deviation .19Variance .04Coefficient Alpha .71Composite Reliability .74Average Variance Extracted .33
Table 5.26Standardized Loadings, Means and Standard Deviations
For EffortItems Standardized
LoadingMean Standard
DeviationHow often do you increase the amount of work you do? .47 3.84 .70How often do you perform the most professional job? .91 4.15 .75How often do you make sure your sales effort is considered top quality by top management?
.68 4.19 .89
Adaptive Selling
Thirteen items selected from the 16-item scale developed by Spiro and Weitz
(1990) will be used to measure the degree to which salespeople practice adaptive selling -
the degree to which they alter their sales presentations across and during customer
interactions in response to the perceived nature of the sales situation. The self-report scale
assesses several facets of adaptive selling; (1) recognition that different sales approaches
Reproduced with permission of the copyright owner. Further reproduction prohibited without permission.
122
are needed for different customers; (2) confidence in one’s ability to use a variety of
approaches; and (3) actual use of different selling approaches.
The original 13 items used in the pretest have a reliability of .43. Utilizing item-
total correlations to delete ineffective items results in a modified scale of seven items with
a reliability (alpha) of .72.
Multivariate normality, internal consistency, and factor loadings for the adaptive
selling construct are discussed in the following sections. Adaptive selling is assumed to be
multi-dimensional.
Multivariate Normalitv
Normal probability plots indicated that nine of the thirteen scale items are normally
distributed. Additionally, the skewness and kurtosis statistics for the items supported the
normal probability plots indicating that nine of the items were within the acceptable ranges
of ± 2.57 and ± 3.00 respectively. Thus, nine of the thirteen items were retained for
additional analysis.
Exploratory factor analysis indicated three dimensions to the adaptive selling
construct: (1) can alter sales approach (can alter); (2) treat different customers differently
(do alter); and (3) recognize that different customers require different sales approaches
(recognize). The correlated first-order factor model with three dimensions and a total of
nine indicators is pictured in Figure 5.15. Internal consistency and dimensionality are
discussed in the following sections. Psychometric properties and standardized loadings,
means and standard deviations for the adaptive selling scale are summarized in the tables
that follow the model.
Reproduced with permission of the copyright owner. Further reproduction prohibited without permission.

123
RecognizeDo AlterCan Alter
/ \ / \ i \X I X3 X 4 ----------X6 X7 X9
Figure 5.15 Correlated First-Order Factor Model for
Adaptive Sdling
Internal Consistencv and Dimensionality
Internal consistency was examined for the three dimensions with exploratory factor
analysis, coefficient alpha measure of reliability, and confirmatory factor analysis. The
exploratory factor analysis utilized principal components factor analysis with varimax
rotation. The factor analysis was unconstrained in terms of factors identified, but was
limited to factors with eigenvalues > 1.00. The three factor solution indicated that the
three dimensions accounted for 60.7 percent of the variance with eigenvalues from 2.60 to
1.21. All scale items had loadings above .5 and exhibited simple structure. Thus, all nine
of the items were retained.
Reliability was measured with the coefficient alpha statistic, inter-item correlations
and item-to-total correlations. Coefficient alpha reliabilities were computed for each
dimension of the adaptive selling scale. For the three adaptive selling dimensions,
reliability ranged from .55 to .62 (see Table 5.27), all below an acceptable reliability of >
.70. The inter-item correlations ranged from . 14 to .49 across the three dimensions. Two
Reproduced with permission of the copyright owner. Further reproduction prohibited without permission.

124
of the items exhibited inter-item correlations below the minimum acceptable correlation of
.30. Item-to-total correlations ranged from .25 to .54 across the three dimensions. Seven
of the nine items exhibited item-to-total correlations below the minimum item-to-total
correlation of .50. These measures are generally below acceptable criteria for coefficient
alpha, inter-item correlations, and item-to-total correlations. Thus, the adaptive selling
measures will be examined for possible item modifications.
Several measures from a confirmatory factor analysis were used to evaluate
internal consistency and dimensionality. These measures include composite reliability,
average variance extracted, and standardized item loadings (see Table 5.27 and Table
5.28). The composite reliabilities for the three adaptive selling dimensions ranged from
.60 to .62, all below an acceptable composite reliability of > .70. The average variance
extracted (amount of variance captured by a construct’s measures relative to random
measurement error) ranged from .34 to .44, all below an acceptable variance extracted of
> .50. The standardized loadings of the items for the three dimensions are presented in
Table 5.27. These individual item loadings range from .32 to .98. Seven of the nine items
are below an acceptable loading of > .70.
Table 5.27Psychometric Properties for Aadaptive Selling
Property Can Alter Do Alter RecognizeNumber of Items 3 3 3Mean 16.08 14.59 17.47Standard Deviation 3.54 4.37 2.91Variance 12.52 19.11 8.44Coefficient Alpha .60 .62 .55Composite Reliability .60 .63 .60Average Variance Extracted .34 .37 .44
Reproduced with permission of the copyright owner. Further reproduction prohibited without permission.

125
Table 5.28Standardized Loadings, Means and Standard Deviations
Items StandardizedLoading
Mean StandardDeviation
Can AlterWhen I feel that my sales approach is not working, I can easily change to another approach
.45 5.69 1.35
I like to experiment with different sales approaches .61 5.03 1.81I can easily use a wide variety of selling approaches .67 5.35 1.55Do AlterI treat all customers pretty much the same .72 3.78 2.23Most buyers can be dealt with in pretty much the same maimer
.47 2.88 1.77
I do not change my approach from one customer to another
.60 2.75 1.78
RecognizeI try to understand how one customer differs from another
.32 5.66 1.34
I vary my approach from situation to situation .98 5.80 1.16Each customer requires a unique approach .50 6.01 1.46
Factor Loadings
Using LISREL VTQ, factor loadings for the three dimensions of adaptive selling
were examined in a second-order factor model (see Figure 5.16). To test that the three
dimensions equally represented the same construct, a second-order model with
unrestrained factor loadings was compared to the same second-order model with factor
loadings constrained to be equal across the three dimensions. Equal chi-square statistics
indicate that the three dimensions are equal in their representativeness of the construct and
can be summed across the three dimensions in the structural model.
Factor loadings and chi-square statistics are presented in Table 5.29. The equal
chi-square statistics indicate that the three adaptive selling dimensions are representative
of the same construct and that the individual items can be summed across the three
dimensions in the structural model.
Reproduced with permission of the copyright owner. Further reproduction prohibited without permission.

126
AdaptiveSelling
Can Alter Do Alter Recognize
XI X3 X4 X6 X7- ■X9
Figure 5.16Second-Order Factor Model for Adaptive Selling
Table 5.29
Dimension Factor Loading Unrestrained Model
Factor Loading Constrained Model
Can Alter .63 .41Do Alter .43 .41Recognize .89 .41
Goodness of Fit Statistic (df) 45.52 (24) 42.57 (26)
Current Performance
Current performance was measured and self-reported with a six-item scale adapted
from Behrman and Perreault (1982). The current performance scale is a measure of a
salesperson’s output performance (e.g., number of units sold) in the current year. The
current performance scale is assumed to be unidimensional which is assessed using
exploratory factor analysis.
Multivariate normality and internal consistency for the current performance
construct are discussed in the following sections. Exploratory factor analysis indicated
two dimensions to the current performance construct. Only one item, however, loaded on
a second factor and was dropped from the analysis. Thus, current performance is treated
Reproduced with permission of the copyright owner. Further reproduction prohibited without permission.

127
as a single dimension construct with five indicators. The single construct with multiple
indicators is pictured in Figure 5.17.
Figure 5.17Single Construct Model for Current Performance
Multivariate Normalitv
Normal probability plots indicated that all five o f the retained scale items are
normally distributed. Additionally, the skewness and kurtosis statistics for the items are
within acceptable ranges of ± 2.57 and ± 3.00. All of the items were retained for
additional analysis.
Internal Consistencv and Unidimensionalitv
Internal consistency was examined with exploratory factor analysis, coefficient
alpha measure of reliability, and confirmatory factor analysis. The exploratory factor
analysis utilized principal components factor analysis with varimax rotation. The single
factor solution indicated that the dimension accounted for 62 percent of the variance with
an eigenvalue o f 3.69. All scale items had loadings above .5. Thus, all five of the items
were retained.
Reliability was measured with the coefficient alpha statistic, inter-item correlations
and item-to-total correlations. Coefficient alpha for the current performance scale was .91
Reproduced with permission of the copyright owner. Further reproduction prohibited without permission.

128
(see Table 5.30), a reliability acceptable for theoretical research. The inter-item
correlations ranged from .53 to .85. Item-to-total correlations ranged from .41 to .65.
Several measures from a confirmatory factor analysis were used to evaluate
internal consistency and dimensionality. These measures include composite reliability,
average variance extracted, and standardized loadings (see Table 5.30 and Table 5.31).
The composite reliability of the current performance measure was .91, which is in an
acceptable range. The average variance extracted (amount of variance captured by a
construct’s measures relative to random measurement error) was .68. The average
variance extracted is within the desired level of variance extracted of > .50. The
standardized loadings of the items are presented in Table 5 .31. These individual loadings
range from .60 to .92 with one of the five items well outside the acceptable loading of >
.70.
Table 5.30
Property ValueNumber of Items 5Mean 13.20Standard Deviation 4.84Variance 23.43Coefficient Alpha .91Composite Reliability .91Average Variance Extracted .68
Table 5.31Standardized Loadings, Means and Standard Deviations
For Current PerformanceItems Standardized
LoadingMean Standard
DeviationYour level of dollar sales so far in 1997 .91 2.44 1.06Ntunber of units you have sold so far in 1997 .86 2.44 1.02Yoiu" overall sales techniques so far in 1997 .58 2.93 0.88Your sales commissions so far in 1997 .90 2.43 1.05Your sales commissions over the past 6 months in 1997
.79 2.64 1.09
Reproduced with permission of the copyright owner. Further reproduction prohibited without permission.

129
Manager-Rated Performance
Manager-rated performance is a six-item scale adapted from Behrman and
Perreault (1982) measuring the output performance (e.g., number of units sold) of a
salesperson for the current year as rated by the salesperson’s manager. Manager-rated
performance is reported to be unidimensional which is confirmed with exploratory factor
analysis.
Multivariate normality and internal consistency for the manager-rated performance
construct are discussed in the following sections. Exploratoiy factor analysis indicated
two dimensions to the manager-rated performance construct. Only one o f the seven items,
however, loaded on a second factor and were dropped from the analysis. Thus, manager
rated performance is treated as a single dimension construct with six indicators. The
single construct with multiple indicators is pictured in Figure 5.18.
( Manager-Rated ) X ^ rform an ce/
/ VX I X6
Figure 5.18 Single Construct Model for
Manager-Rated Performance
Multivariate Normality
Normal probability plots indicated that the six scale items are normally distributed.
Additionally, the skewness and kurtosis statistics for the items were within the acceptable
ranges of ± 2.57 and ±3.00 respectively. All of the items were retained for additional
analysis.
Reproduced with permission of the copyright owner. Further reproduction prohibited without permission.

130
Internal Consistencv and Unidimensionalitv
Internal consistency was examined with exploratory factor analysis, coefiBcient
alpha measure of reliability, and confirmatory factor analysis. The exploratory factor
analysis utilized principal components factor analysis with varimax rotation. The single
factor solution indicated that the dimension accounted for 74 percent of the variance with
an eigenvalue of 4.44. All scale items had loadings above .5. Thus, all six o f the items
were retained.
Reliability was measured with the coefficient alpha statistic, inter-item correlations
and item-to-total correlations. Coefficient alpha for the effort scale was .93 (see Table
5.32), a reliability greater than the minimum acceptable reliability of .70. The inter-item
correlations ranged from .55 to .86. Item-to-total correlations ranged fi"om .72 to .89.
Several measures from a confirmatory factor analysis were used to evaluate
internal consistency and dimensionality. These measures include composite reliability,
average variance extracted, and standardized loadings (see Table 5.32 and Table 5.33).
The composite reliability for the manager-rated performance measure was .93 which is in
an acceptable range. The average variance extracted (amount of variance captured by a
construct’s measures relative to random measurement error) was .69. This is above the
desired level of variance extracted of > .50. The standardized loadings for the six items
that comprise the manager -rated performance scale are presented in Table 5.33. These
individual loadings for the six items in the scale range from .69 to .95. One o f the six
items exhibited a marginally low loading below the minimum acceptable loading of > .70.
The item was retained for additional analysis.
Reproduced with permission of the copyright owner. Further reproduction prohibited without permission.

131
Table 5.32
Property ValueNumber of Items 6Mean 19.71Standard Deviation 5.89Variance 34.65CoefBcient Alpha .93Composite Reliability .93Average Variance Extracted .69
Table 5.33Standardized Loadings, Means and Standard Deviations
Items StandardizedLoading
Mean StandardDeviation
The level of dollar sales .90 3.16 1.14Number of units sold to-date in 1995 .85 3.16 1.21Salesperson’s overall selling tactics .69 3.53 1.04Salesperson’s overall selling ability .72 3.71 1.12Salesperson’s sales commissions to-date in 1995 .95 3.13 1.56Salesperson’s sales commission increases over the past 6 months
.83 3.02 1.17
Discriminant Validity
Discriminant validity between the model constmcts was examined by evaluating
the confidence intervals around the correlations between constructs for the presence of a
“1” (Bagozzi and Phillips 1982). The presence of a “1” is an indication that two
constructs are highly correlated and do not exhibit discriminant validity. To assess the
confidence intervals, a confirmatory factor analysis was utilized treating each construct
(with summed scale indicators) as an independent, correlated variable. The phi estimates
between constructs along with the confidence intervals are reported in Table 5.34. No
confidence intervals around the correlations between model constructs include a value of
“1”. Thus, all model constructs are considered to exhibit discriminant validity.
Reproduced with permission of the copyright owner. Further reproduction prohibited without permission.

132
Table 5.34 Phi Estimates Between Constructs
(Confidence Interval)
Self- S e lf- C ow orker M odel Jo b P ast S a lesp rsn M anagerM o nito r E steem A ccept T en s io n Perfo rm F eed b ack Feedback
S e lf- 1.00M o n ito r
S e lf- -.11 1.00E stee m (-.3 1 . .09)
C o w o rk er .19 .14 1.00A c cep t (-.0 1 . .39) ( - 0 6 . .34)M o d e l .18 -.0 9 .17 1.00
(0 . .36) ( - 2 7 . .09) (-.01. .3 5 )Jo b .49 -.42 .08 .20 1.00
T en s io n (.2 7 . .71) (- .6 4 . - (-.12 . .20 ) (0 . .40).02 )
P a s t .19 -.0 4 -.13 .11 .11 1.00P e rfo rm (.0 1 . .37) ( - 2 2 . .14) (-.31 . .0 5 ) (- 0 5 . .27) (- .0 7 , .2 9 )
S a lesp rsn .09 .02 .56 .05 .1 2 -.20 1.00F eed b ack (-.0 9 . .27) ( - .1 6 . .20) (.36 . .7 6 ) ( - 1 3 . .23) (- .0 6 . .30) (-.3 8 . - .0 4 )M a n a g e r .14 -.0 8 .32 .06 .35 .05 .54 1.00F eed b ack (- 04 . .32) ( - 2 6 . .10) (.12 . .52 ) (-.1 2 . .24) ( .1 5 . .5 5 ) ( - 1 1 . 2 1 ) (.3 6 . .72)
S e lf- .01 .35 .16 .13 .04 -.06 .04 -.06E fficacy ( - 1 9 . .21) ( .1 5 . .55) (- 04 . .3 6 ) (-.0 5 . .31) (- .1 6 . .24) ( - 2 4 , .1 2 ) ( - 1 4 . .22) (- 2 4 . .12)E x p ec t -.06 -.1 6 .23 .32 .19 -.07 .29 .21
( - .2 6 . . 14) ( - .3 6 . .04) (.03 . .3 3 ) ( 1 4 . .50) (-.0 1 . .3 9 ) (-.3 5 , .11) ( .1 1 . .47) (.03 . .39)E ffo rt .06 .21 -.04 .09 -.0 5 .06 .11 -.08
( - 1 4 . .26) ( - .0 1 . .43) ( - .2 6 . . 18) ( - 1 1 . 2 9 ) ( - .2 7 . . 17) (-.1 2 . .24 ) (-.0 9 , .31) ( - .2 8 , . 12)A d ap tiv e .37 -.0 8 .15 .30 .3 6 .00 .20 .27
S e llin g (.1 7 . .57) ( - 2 6 . . 10) (-.03. .3 3 ) ( 1 2 . .48) ( .1 6 . .56) ( - .1 6 , . 16) (.0 2 , .38) (.09 , .45)C u rre n t .10 .16 .23 .16 -.0 5 .29 -.05 -.02P erfo rm (-.0 8 . .28) (- 0 2 . .34) (.05 . .4 1 ) (-.0 2 . .34) ( - .2 3 . . 13) ( .1 1 . .4 7 ) ( - .2 3 , . 13) (-.20 , .16 )
M gr-R a ted .05 -.0 7 .07 -.05 -.01 .09 .01 .20P e rfo rm ( - 1 3 . .23) ( - .2 5 . .11) ( - 1 1 . 2 5 ) ( - .2 1 , .1 1 ) ( - .1 9 , .1 7 ) (-.0 7 , .25) (-.1 5 . .17) (.02, .38)S o c ia l .05 .15 .36 .39 .0 7 .03 .35 .42iza tio n ( - 1 5 . .25) ( - .0 5 . .35) (.14 . .5 8 ) ( 1 9 . .59) (-.1 5 , .29) (-.1 5 , .21) ( 1 4 . .55) (.22, .62)
Self- E x p ec t Effort A dap tive C u rre n t M gr-R a ted SocialEfficacy S elling P erfo rm P erform ization
S e lf- 1.00E fficacyE x p ec t .14 1.00
(-.0 6 . .34)E ffo rt .49 -.23 1.00
( 27 . .71) ( - 4 3 . -.0 3 )
A d ap tiv e .19 .16 .20 1.00S e llin g ( .0 1 . .37) ( - .0 2 . .34) (.00 . .40 )C u rre n t .41 .15 .40 .09 1.00P erfo rm (.2 1 . .61) ( - .0 3 . .33) (.20, .6 0 ) (-.0 9 . .27)
M g r-R a ted .15 .06 -.01 .13 .43 1.00P erfo rm (-.1 3 . .33) (- .1 2 . .34) ( - 2 1 . .1 9 ) (- 0 3 . .21) ( .2 5 . .6 1 )S o c ia l .11 .22 .11 .13 .19 -.01 1.00iza tio n (-.09 . .31) ( .0 2 . .42) (-.11 . .33 ) (-.0 7 . .33) ( - .0 1 . .3 9 ) ( - .2 1 . .1 9 )
Reproduced with permission of the copyright owner. Further reproduction prohibited without permission.

CHAPTER 6
PROPOSED FINAL STUDY
Introduction
The proposed methodology, measurement, and model analysis of the final
dissertation research project are outlined in Chapter 6. Additionally, the chapter includes
a calendar o f the projected time Iframe for completion of the dissertation research.
The following sections highlight the proposed procedures for the final dissertation
study. Included are descriptions of the proposed sample, the context of the research, and
data collection procedures, along with proposed modifications to measurement scales
based on the pretest data analysis.
Sample
The sample will consist of automobile (including trucks) salespeople in automobile
dealerships throughout Louisiana that are members of the Louisiana Automobile Dealers
Association (approximately 200 dealerships). Respondents will be both new and more
experienced salespeople (based on tenure in an automobile sales job) who will provide
information related to their work behaviors, the sales job, performance feedback from
coworkers and sales managers, sales performance, and internal feelings about themselves.
Automobile salespeople were chosen for the study for three reasons. First, a larger
sample of respondents can be more readily contacted than with other types of salespeople.
There are approximately 1500 automobile salespeople in Louisiana, and the Louisiana
Automobile Dealers Association is cooperating by encouraging member dealerships to
participate in the study. Second, automobile salespeople have a high level of control over
their sales activities and have opportunities each day to observe the sales behaviors of
133
Reproduced with permission of the copyright owner. Further reproduction prohibited without permission.

134
other salespeople in a dealership. Third, automobile dealerships are structurally organized
so that salespeople work under supervision of sales managers and have frequent
opportunities to receive performance feedback from managers.
Context
The research study will be conducted in a personal selling (automobiles) context.
Automobile dealerships recruit, train, and motivate salespeople. The automobile
salespeople work toward target sales goals and have a high level of individual control over
their work behaviors (e.g., effort). Additionally, much of the sales training is in the form
of on-the-job training, an environment in which newer salespeople should look to more
experienced salespeople for effective sales techniques and behaviors.
The proposed dissertation research does, however, have the capability of greater
generalization by extending the study, in the future, to other types of organizations other
than selling organizations (e.g., service organization, teaching institutions). Medical care
institutions represent a reachable sample that can provide a comparison of the proposed
model in service versus selling organizations.
Data Collection
Respondents will be obtained from the population of salespeople in all Louisiana
automobile dealerships that are members of the Louisiana Automobile Dealers
Association. All salespeople will be given an opportunity to respond to the salesperson
questionnaire. Dealerships will be invited and encouraged to participate by letter from the
Executive Vice-President of the Louisiana Automobile Dealers Association to dealership
owners. Dealerships wishing to participate in the study will respond via postage-paid
return cards included in the initial letter. These participating dealerships will then be
Reproduced with permission of the copyright owner. Further reproduction prohibited without permission.

135
contacted to arrange for the delivery, distribution, and collection of the questionnaire
packages. The packages will contain a cover letter outlining the objectives of the study
and thanking dealership management for their participation in the study; a set of
instructions for administering the questionnaire in each dealership; questionnaires for both
salespeople and managers; and return, postage-paid envelopes for returning the
questionnaires. An appropriate incentive will be offered in each responding dealership to
encourage the completion and return of questionnaires.
Proposed Measurement
The following sections summarize the proposed measures to be used in the final
data collection and analysis for this dissertation. Sources of the proposed scales are
reviewed and modifications to scale items unsatisfactory in the pretest are suggested.
Self-Monitoring
The extent that salespeople individually monitor the images they present to others
will be measured with a scale adapted from Snyder (1974). The self-monitoring scale was
tested with six items measuring the degree to which a salesperson observes and manages
the image they present to others guided by situational-specific cues. An analysis of the
measurement properties of the six items indicated that no modifications to the scale are
required. Thus, all six items will be retained in the final data collection. However, the six
items will be reworded to more specifically apply in a personal selling context. These
items are listed below.
Pretest Item Status Proposed Modified ItemIn my business situation, I have the ability Reword If I am not reaching my sales goals, Ito alter my behavior if I feel that some- have the ability to change my sellingthing else is called for. style.
Reproduced with permission of the copyright owner. Further reproduction prohibited without permission.
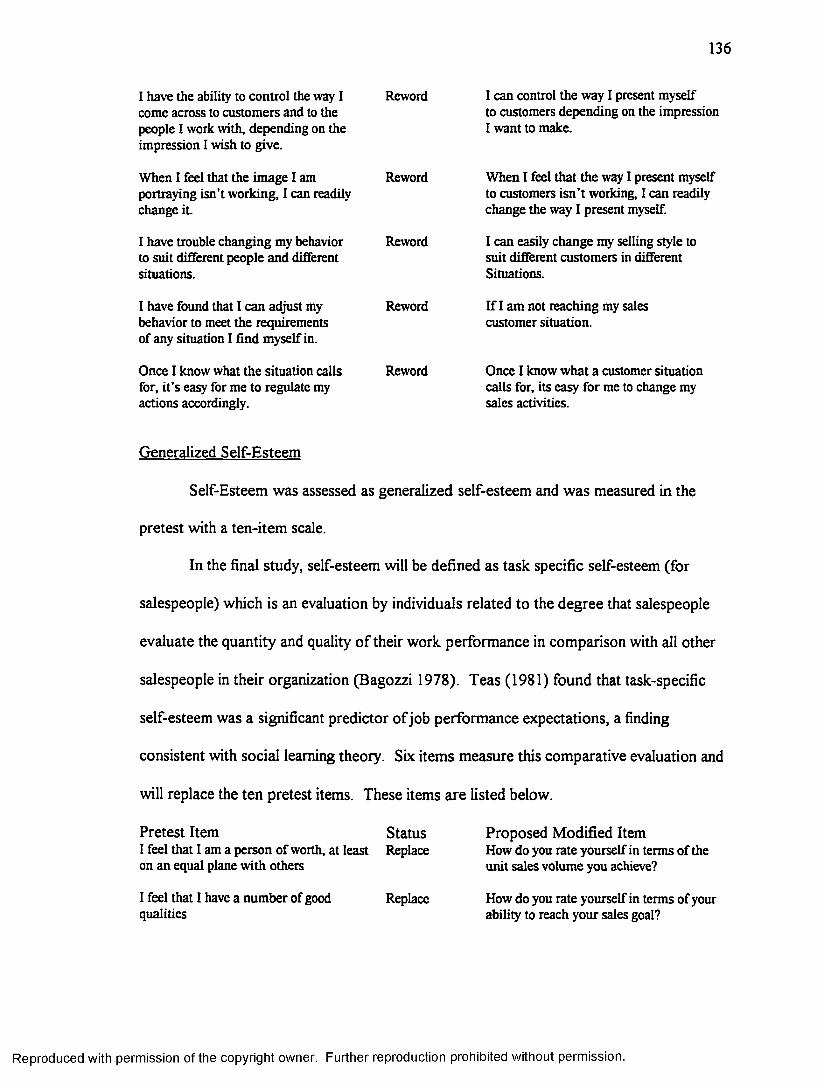
136
I have the ability to control the way I Reword come across to customers and to the people I work with, depending on the impression I wish to give.
When I feel that the image I am Rewordportraying isn’t working, I can readily change it.
I have trouble changing my behavior Rewordto suit different people and differentsituations.
I have found that I can adjust my Rewordbehavior to meet the requirements of any situation I find myself in.
Once I know what the situation calls Rewordfor, it’s easy for me to regulate my actions accordingly.
I can control the way I present myself to customers depending on the impression I want to make.
When I feel that the way I present myself to customers isn’t working, I can readily change the way I present myself.
I can easily change my selling style to suit different customers in different Situations.
If I am not reaching my sales customer situation.
Once I know what a customer situation calls for, its easy for me to change my sales activities.
Generalized Self-Esteem
Self-Esteem was assessed as generalized self-esteem and was measured in the
pretest with a ten-item scale.
In the final study, self-esteem will be defined as task specific self-esteem (for
salespeople) which is an evaluation by individuals related to the degree that salespeople
evaluate the quantity and quality of their work performance in comparison with all other
salespeople in their organization (Bagozzi 1978). Teas (1981) found that task-specific
self-esteem was a significant predictor of job performance expectations, a finding
consistent with social learning theory. Six items measure this comparative evaluation and
will replace the ten pretest items. These items are listed below.
Pretest Item StatusI feel that I am a person of worth, at least Replace on an equal plane with others
I feel that I have a number of good Replacequalities
Proposed Modified ItemHow do you rate yourself in terms of theunit sales volume you achieve?
How do you rate yourself in terms of your ability to reach your sales goal?
Reproduced with permission of the copyright owner. Further reproduction prohibited without permission.

137
AU in ali, I am inclined to feel that I Replaceam a failure
I am able to do things as well as most Replaceother people
How do you rate yourself in terms of quality of your sales performance in regard to customer relations?How do you rate yourself in terms of quality of your sales performance in regard to knowledge of your vehicles, competitor’s products, and customer needs?How do you rate yourself in terms of the potential you have for reaching the top in sales volume in your dealership?
1 feel 1 do not have much to be proud of Replace
1 have a positive attitude about myself Delete
On the whole, I am satisfied with myself Delete
I wish I could have more respect for Deletemyself
I certainly feel useless at times Delete
At times 1 think 1 am no good at all Delete
Coworker Acceptance
Coworker acceptance is measured in the pretest with a scale developed by
Dubinsky et al. (1986) to assess the degree to which a person feels accepted and trusted
by coworkers. Dubinsky’s two-item scale has been adapted for salespeople with three
items added for the pretest. All five items will be retained for the final study, with some
proposed modifications as suggested below.
StatusPretest Item The salespeople 1 work with actively try Rewordto include me in conversations about things at work
Other salespeople in my organization Retainfeel relaxed when they are with me
1 have a lot in common with the other Rewordsalespeople in my organization
In many ways I am a lot like the Replaceother salespeople in my organization
The other salespeople 1 work with Retainlike me
Proposed Modified Item The salespeople 1 work with include me in their conversations
My fellow salespeople and I have some things in common
1 can identify with most of the other salespeople I work with
Reproduced with permission of the copyright owner. Further reproduction prohibited without permission.

138
Modeling
The modeling construct was measured with a nineteen-item scale developed for
this study. The modeling scale has three dimensions (observe others, learn from others,
and envision oneself performing as others) and measures the extent salespeople imitate the
sales behaviors of other salespeople in an organization to learn effective sales techniques
and to improve their own performance. Three of the items will be dropped from the final
study due to low factor loadings with sixteen items retained for the final study; four items
as is, and 12 items reworded. The items are listed below.
Pretest Item Status• OBSERVEI look for selling techniques that other Rewordgood salespeople use and try to copy them myself
I visualize myself using selling methods Rewordthat I see other good salespeople using
Some of my best sales techniques Rewordhave come from watching other effective salespeople in action
1 visualize myself doing the job like Retainother successful salespeople in my organization
I try to picture in my own mind how Retainsuccessful salespeople in my organization do the job and then be more like them
I try to imitate the selling styles that Rewordseem to work best for other salespeople in my organization
• LEARNI have increased my own sales Retainperformance by observing the activities of other salespeople
I have learned to be a better sales- Retainperson by watching the techniques of other salespeople
Proposed Modified Item
I look for selling techniques that other good salespeople use and try to use them myself
I can visualize myself using selling methods that I see other good salespeople using
I have gotten some of my sales techniques from watching other good salespeople in action
1 try to use some of the selling methods that seem to work well for other salespeople in this dealership
Reproduced with permission of the copyright owner. Further reproduction prohibited without permission.
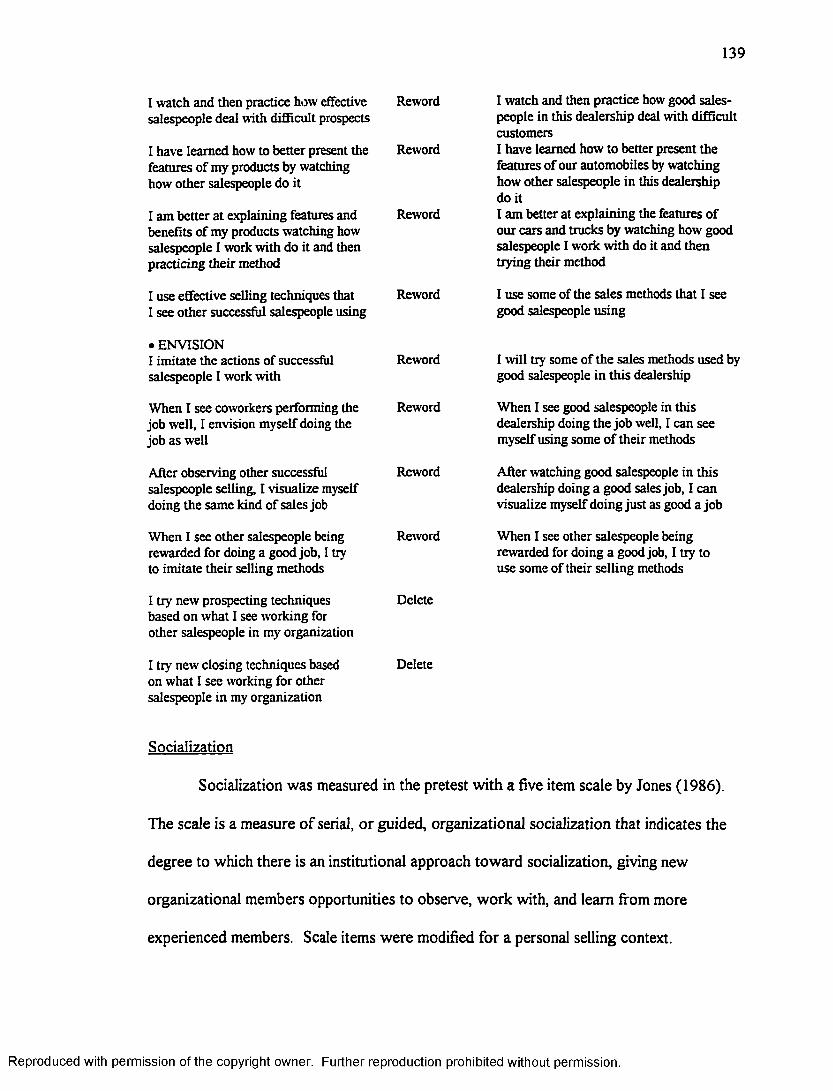
139
I watch and then practice how effective Rewordsalespeople deal with difficult prospects
I have learned how to better present the Rewordfeatures of my products by watching how other salespeople do it
I am better at explaining features and Rewordbenefits of my products watching how salespeople I woric with do it and then practicing their method
I use effective selling techniques that RewordI see other successful salespeople using
• ENVISIONI imitate the actions of successful Rewordsalespeople I work with
When I see coworkers performing the Rewordjob well, I envision myself doing the job as well
After observing other successful Rewordsalespeople selling, I visualize myself doing the same kind of sales job
When I see other salespeople being Rewordrewarded for doing a good job, I try to imitate their selling methods
I try new prospecting techniques Deletebased on what I see working for other salespeople in my organization
I try new closing techniques based Deleteon what I see working for other salespeople in my organization
I watch and then practice how good salespeople in this dealership deal with difficult customersI have learned how to better present the features of our automobiles watchinghow other salespeople in this dealership do itI am better at explaining the features of our cars and trucks by watching how good salespeople I work with do it and then trying their method
I use some of the sales methods that I see good salespeople using
I will try some of the sales methods used by good salespeople in this dealership
When I see good salespeople in this dealership doing the job well, I can see myself using some of their methods
After watching good salespeople in this dealership doing a good sales job, I can visualize myself doing just as good a job
When I see other salespeople being rewarded for doing a good job, I try to use some of their selling methods
Socialization
Socialization was measured in the pretest with a five item scale by Jones (1986).
The scale is a measure of serial, or guided, organizational socialization that indicates the
degree to which there is an institutional approach toward socialization, giving new
organizational members opportunities to observe, work with, and learn from more
experienced members. Scale items were modified for a personal selling context.
Reproduced with permission of the copyright owner. Further reproduction prohibited without permission.
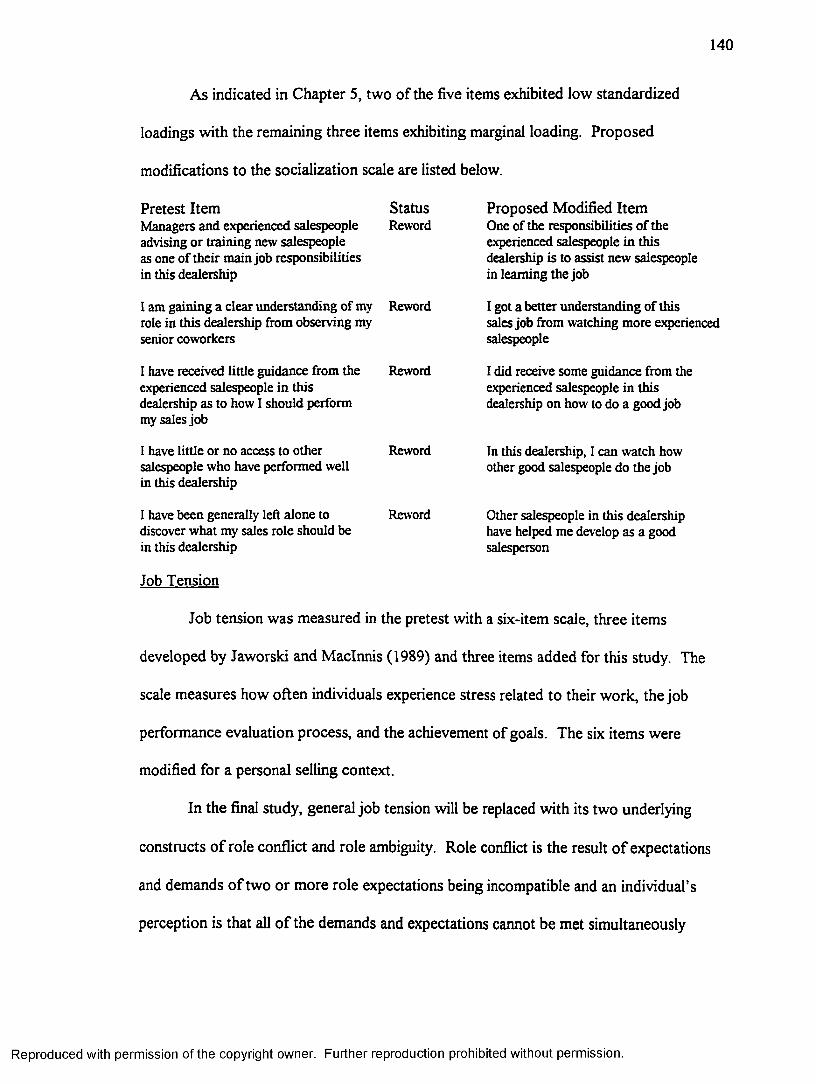
140
As indicated in Chapter 5, two of the five items exhibited low standardized
loadings with the remaining three items exhibiting marginal loading. Proposed
modifications to the socialization scale are listed below.
Proposed Modified Item One of the responsibilities of the experienced salespeople in this dealership is to assist new salespeople in learning the job
I got a better understanding of thissales job from watching more experiencedsalespeople
1 did receive some guidance from the experienced salespeople in this dealership on how to do a good job
In this dealership, 1 can watch how other good salespeople do the job
Other salespeople in this dealership have helped me develop as a good salesperson
Pretest Item StatusManagers and experienced salespeople Rewordadvising or training new salespeople as one of their main job responsibilities in this dealership
I am gaining a clear understanding of my Reword role in this dealership from observing my senior coworkers
1 have received little guidance from the Reword experienced salespeople in this dealership as to how 1 should perform my sales job
1 have little or no access to other Rewordsalespeople who have performed well in this dealership
1 have been generally left alone to Reworddiscover what my sales role should be in this dealership
Job Tension
Job tension was measured in the pretest with a six-item scale, three items
developed by Jaworski and Maclnnis (1989) and three items added for this study. The
scale measures how often individuals experience stress related to their work, the job
performance evaluation process, and the achievement of goals. The six items were
modified for a personal selling context.
In the final study, general job tension will be replaced with its two underlying
constructs of role conflict and role ambiguity. Role conflict is the result of expectations
and demands of two or more role expectations being incompatible and an individual’s
perception is that all of the demands and expectations cannot be met simultaneously
Reproduced with permission of the copyright owner. Further reproduction prohibited without permission.

141
(Rizzo et al. 1970). Role ambiguity results when individuals perceive that they do not
possess sufficient or complete information regarding their job role to adequately perform
job functions (Rizzo et al. 1970).
Role conflict and role ambiguity can have negative effects on job performance
(Walker et al. 1975). Role conflict and ambiguity lead to a condition o f psychological
stress and tension in a job that can result in less effort and job performance (Churchill et
al. 1985). Additionally, such job tension caused by conflict and ambiguity can result in
lower levels of an individual’s self-efficacy regarding their capabilities to successfully
perform a job (Bandura 1977). The hypotheses related to the effects o f role conflict and
role ambiguity are
H5a: An individual’s level of perceived role conflict will be negatively associated with one’s level of perceived self-efficacy.
H5b: An individual’s level of perceived role ambiguity will be negatively associated with one’s level of perceived self-efficacy.
In the final study, role conflict and role ambiguity will be measured with scales
developed by Chonko, Howell and Bellenger (1986). Item responses for the role conflict
scale range fi-om 1 (no agreement) to 5 (complete agreement). For the role ambiguity
scale, responses range from 1 (not at all certain) to 5 (completely certain). The proposed
scale items to be used in the final study are listed below.
Role Conflict - Job
How much agreement would you say there is between you and your job requirements on:
... .the amount of work you are expected to do and the amount you actually do.
... .the number of customers you are expected to serve and the number you actually serve
... .the number of non-work tasks you are expected to perform and the number you actually perform.
... .the amount of leisure time you expect to have and the amount you actually have.
Reproduced with permission of the copyright owner. Further reproduction prohibited without permission.

142
Role Conflict - Manager
How much agreement would you say there is between you and your sales manager on;
... .how often you should report to your manager.
... .how far you should bend the rules to satisfy customers.
... .how much service you should provide to customers.
... .how much authority you have in making decisions.
... .how much authority you have in negotiating prices with customers.
... .what “acceptable” sales performance is for you.
Role Conflict - Customer
H ow much agreement would you say there is between you and your customers
... .your performance in serving customer needs.
... .how much service you should provide to customers.
... .how you resolve customer complaints.
... .how far you should bend the rules to satisfy customers.
Role Ambiguity - Job
H ow certain are you about:
... .how best to serve customers.
....how much time you should spend on various aspects of your job.
....how to resolve customer complaints.
... .how to fill out required paperwork.
... .how to plan and organize your daily work activities.
... .how to handle unusual customer problems or situations.
... the extent to which you can bend the rules to satisfy customers.
Role Ambiguity - Manager
How certain are you about:
.. the extent to which you can make decisions without your manager’s approval.
.. where to get assistance in doing your job.
...your dealership’s rules and regulations.
.. .how yoiu- sales manager will evaluate your performance.
.. .how satisfied your sales manager is with your sales performance.
.. .how your sales manager expects you to allocate your work time.
R ole Ambiguity - Customer
....how satisfied your customers are with your performance.
... .what your customers expect of you in performing your job.
... .how your customers feel that you match a vehicle with their personal needs.
on:
Reproduced with permission of the copyright owner. Further reproduction prohibited without permission.
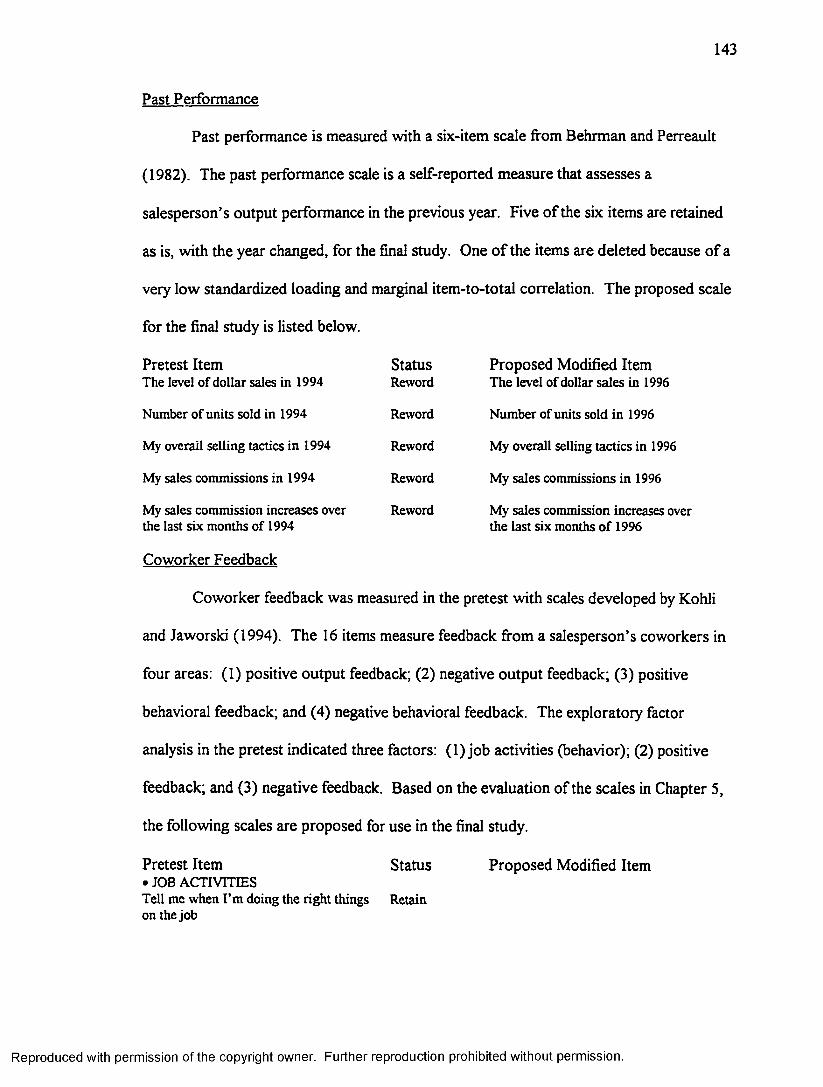
143
Past Performance
Past performance is measured with a six-item scale from Behrman and Perreault
(1982). The past performance scale is a self-reported measure that assesses a
salesperson’s output performance in the previous year. Five of the six items are retained
as is, with the year changed, for the final study. One of the items are deleted because of a
very low standardized loading and marginal item-to-total correlation. The proposed scale
for the final study is listed below.
Pretest ItemThe level of dollar sales in 1994
StatusReword
Proposed Modified Item The level of dollar sales in 1996
Number of units sold in 1994 Reword Number of units sold in 1996
My overall selling tactics in 1994 Reword My overall selling tactics in 1996
My sales commissions in 1994 Reword My sales commissions in 1996
My sales commission increases over the last six months of 1994
Reword My sales commission increases over the last six months of 1996
Coworker Feedback
Coworker feedback was measured in the pretest with scales developed by Kohli
and Jaworski (1994). The 16 items measure feedback from a salesperson’s coworkers in
four areas: (1) positive output feedback; (2) negative output feedback; (3) positive
behavioral feedback; and (4) negative behavioral feedback. The exploratory factor
analysis in the pretest indicated three factors: (1) job activities (behavior); (2) positive
feedback; and (3) negative feedback. Based on the evaluation of the scales in Chapter 5,
the following scales are proposed for use in the final study.
Pretest Item Status Proposed Modified Item• JOB ACTIVITIESTell me when I’m doing the right things Retain on the job
Reproduced with permission of the copyright owner. Further reproduction prohibited without permission.

144
Let me know when I engage in the right Reword selling approach
Commend me when 1 do things right Retain
Tell me when I do a nice selling job Retain
Let me know if I don’t go about the job Rewordas is expected of me
Tell me when I mess up in my selling Rewordtactics
• POSmVE FEEDBACKMake it a point of telling me when I Rewordmake a good gross profit
When 1 sell a large number of units. Rewordcomment about it to me
Tell me when my sales output is good Retain
I receive positive encouragement when Reword1 do a nice selling job
• NEGATIVE FEEDBACKTreat me better when my sales Rewordperformance is good
1 can tell from my coworkers’ Rewordbehaviors toward me if I am performing poorly
Let me know when I make low Rewordgross profits
Let me know when I use the right sales tactic with a customer
Let me know if I’m not doing the sales job as I should be
Let me know if I mess up a sale by using a poor sales tactic
Congratulate me when I make a good gross profit on a car or truck sale
Congratulate me when I sell a large number of units
Let me know when 1 do a nice job in selling a vehicle
Treat me difierently when my sales performance is low
When I am performing poorly, my fellow salespeople behave differently around me
Let me know when I make a low gross profit on a sale
Manager Feedback
Manager feedback was measured in the pretest with scales developed by Kohli and
Jaworski (1994). The 16 items measure feedback from a salesperson’s manager in four
areas; (I) positive output feedback; (2) negative output feedback; (3) positive behavioral
feedback; and (4) negative behavioral feedback. The exploratory factor analysis in the
pretest identified three factors: (1) positive feedback; (2) treatment; and (3) job activities.
Based on the evaluation of the scales in Chapter 5, the following scales are proposed for
use in the final study.
Reproduced with permission of the copyright owner. Further reproduction prohibited without permission.

145
• POSITIVE FEEDBACKMake it a point of telling me when I make Reworda good gross profit
When I sell a large number of units. Rewordcomments about it to me
Tell me when my sales output is good Reword
Tells me when I’m doing the right Retainthings on the job
Lets me know when I engage in the Retainright selling approach
Commend me when I do things right Reword
Tell me when I do a nice selling job Reword
• TREATMENTTreat me better when my sales Rewordperformance is good
I can tell from my coworkers’ behavior Rewordtoward me if I am performing poorly
Let me know when I make low Rewordgross profits
When I am making low gross profit, my Rewordcoworkers kid me about it
Treat me differently when my sales Deleteperformance is poor
• JOB ACTIVITIESLet me know if I don’t go about the Rewordjob as is expected of me
Tell me when I mess up in my Retainselling tactics
Let me know when I engage in Retainselling tactics they think areineffective
Tells me when I make a good gross profit
Congratulates me when I sell a large number of units
Tells me when my sales output is good
Lets me know when I do things right when selling to a customer
Tells me when I do a nice selling job
Treats me differently when my sales performance is good than when my sales performance is poor I can tell fiom my manager’s behavior toward me if I am performing poorly
Tells me when I make low gross profits
When I am making low gross profit, my sales manager kids me about it
Lets me know if I do not do the right kind of selling job
Self-Efficacy
Self-efficacy was measured in the pretest with nine items from Jones’ (1986) scale
measuring the degree that individuals feel they possess the skills necessary to successfully
Reproduced with permission of the copyright owner. Further reproduction prohibited without permission.

146
perform a specific task. As indicated in the scale evaluation in Chapter 5, responses to six
of the nine items were not normally distributed. In an additional exploratory factor
analysis o f the remaining three items, two of the items loaded on one factor while the third
item loaded on a second factor. Thus, the entire self-eflRcacy scale will be replaced with
Chowdhury’s (1993) seven-item measure of self-efficacy in a selling task as modified by
Sujan, Weitz and Kumar (1994). Weitz and Kumar reported a reliability of .77 for the
adapted scale. The scale items are listed below.
Pretest ItemWhen I compare myself to the best salesperson in this dealership, I believe this ^ e s job is well within the scope of my selling abilities
StatusReplace
Compared to the other salespeople in this Replace organization, I did not experience any problems in adjusting to work at this dealership
Compared to the other salespeople in this Replace dealership, I believe that 1 am qualihed for this sales job
Compared to the other salespeople in this Replace dealership, 1 have the technical knowledge 1 need to sell automobiles
1 feel confident that my skills and abilities equal or exceed those of the salespeople I work with in this dealership
Replace
My past experiences and accomplishments Replace increase my confidence that I will be able to perform successfully in this dealership
1 could have handled a more challenging Replacejob than the one I am doingProfessionally speaking, my job Deleteexactly satisfies my expectations ofmyself
Compared to the other salespeople in this Delete dealership, I have the practical experience I need to sell automobiles
Proposed Modified Item I am good at selling cars and/or trucks
It is difhcult for me to put pressure on a customer
1 know the right thing to do in selling situations
1 find it difficult to convince a car or truck buyer that has a different viewpoint than mine
My temperament is not well-suited for selling cars or trucks
1 am good at finding out what car or truck buyers want
It is easy for me to get car or truck buyers to see my point of view
Reproduced with permission of the copyright owner. Further reproduction prohibited without permission.
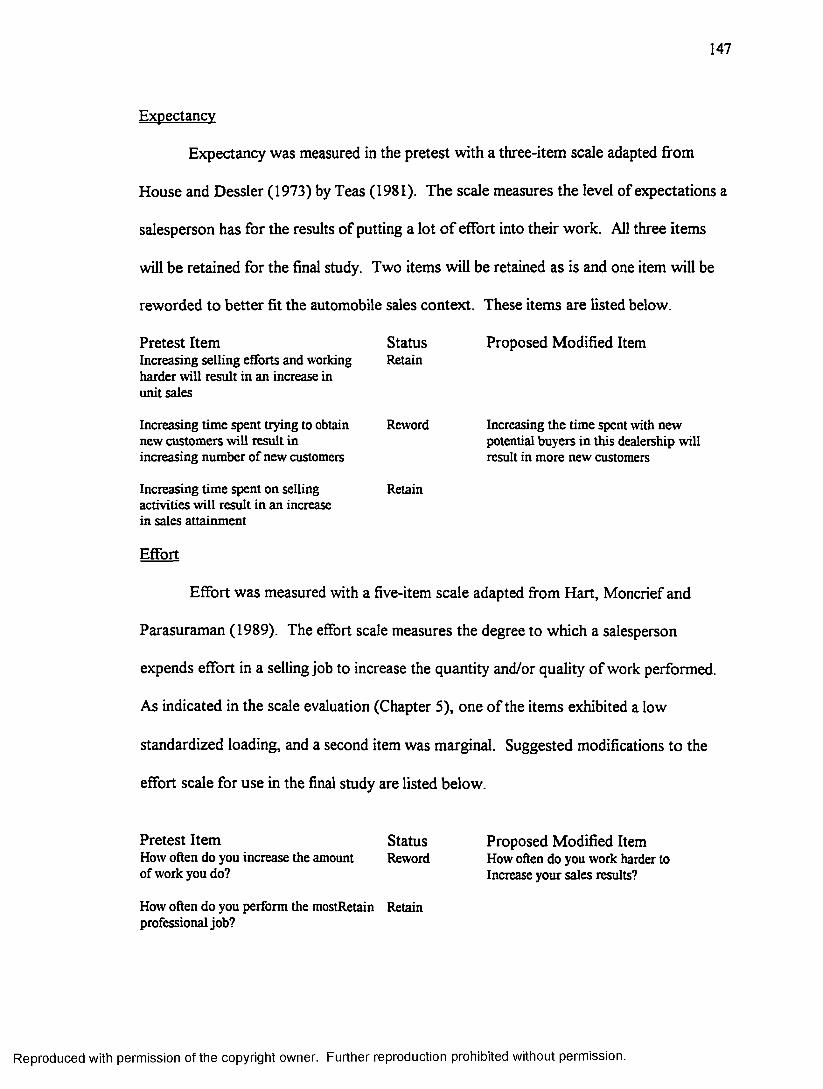
147
Expectancy
Expectancy was measured in the pretest with a three-item scale adapted from
House and Dessler (1973) by Teas (1981). The scale measures the level of expectations a
salesperson has for the results of putting a lot o f effort into their work. All three items
will be retained for the final study. Two items will be retained as is and one item will be
reworded to better fit the automobile sales context. These items are listed below.
Proposed Modified Item
Increasing the time spent with new potential buyers in this dealership will result in more new customers
Pretest Item StatusIncreasing selling efforts and working Retainharder will result in an increase in unit sales
Increasing time spent trying to obtain Rewordnew customers will result in increasing number of new customers
Increasing time spent on selling Retainactivities will result in an increase in sales attaiiunent
Effort
Effort was measured with a five-item scale adapted from Hart, Moncrief and
Parasuraman (1989). The effort scale measures the degree to which a salesperson
expends effort in a selling job to increase the quantity and/or quality of work performed.
As indicated in the scale evaluation (Chapter 5), one of the items exhibited a low
standardized loading, and a second item was marginal. Suggested modifications to the
effort scale for use in the final study are listed below.
Pretest Item StatusHow often do you increase the amount Rewordof work you do?
How often do you perform the mostRetain Retain professional job?
Proposed Modified Item How often do you work harder to Increase your sales results?
Reproduced with permission of the copyright owner. Further reproduction prohibited without permission.

148
How often do you make sure your sales eftbrt is considered top quality by top management?
Reword How often do you make sure yoursales job is considered top quality by your sales manager?
Adaptive Selling
Thirteen items selected from the 16-item adaptive selling scale developed by Spiro
and Weitz (1990) are used to measure the extent to which salespeople practice adaptive
selling - altering sales presentations across and during customer interactions in response to
the perceived nature of a sales situation. Consistent with the original scale’s three
dimensions, the pretest scale exhibited three dimensions (recognition that different sales
approaches are needed for different customers; confidence in one’s ability to use a variety
of approaches; and actual use of different selling approaches). The pretest scales and
proposed modifications for the final study are listed below.
Status Proposed Modified ItemPretest Item• CAN ALTERWhen I feel that my sales approach is not Reword working, I can easily change to another approach
I like to experiment with different Rewordsales approaches
I can easily use a wide variety of selling Rewordapproaches
• DO ALTERI treat all customers pretty much the Retainsame
Most buyers can be dealt with in Rewordpretty much the same manner
I do not change my approach from Rewordone customer to another
•RECOGNIZE1 try to imderstand how one customer Reworddiffers from another
I vary my approach from situation Retainto situation
When I feel that my sales approach is not working with a customer, I have the ability to change my approach
I like to try different sales approaches with different customers
I have the ability to use a variety of selling approaches depending on the customer situation
The same sales approach works for most car or truck buyers
I do not usually change my sales approach from one customer to another.
I know that customers are different and that I must use different sales approaches with different car or truck buyers
Reproduced with permission of the copyright owner. Further reproduction prohibited without permission.

149
Each customer requires a unique approach
Current Performance
Reword I believe that each car or truck buyer isdifferent and requires a different sales approach
A seven-item scale (Behrman and Perreault 1982) was adapted for use in the
pretest. The performance scale measures a salesperson’s overall sales performance in the
current year. Salespeople were asked to rate their own performance for comparison to
their managers’ ratings of their performance using the same scale. In an exploratory factor
analysis (Chapter 5), one of the seven items loaded singly on a second factor and will be
dropped from the final study. The six-item scale and proposed modifications for the final
study are listed below.
Pretest Item StatusThe level of dollar sales in 1995 Retain
Number of units sold last year in 1995 Retain
The number of customer complaints Deletein 1995
My overall selling tactics in 1995 Reword
My sales commissions in 1995 Retain
My sales commission increases over Retainthe last 6 months of 1995
Proposed Modified Item The level of dollar sales in 1997
Number of units sold so far in 1997
My sales techniques in 1997
My sales commissions in 1997
My sales commission increases over the previous 6 months in 1997
Manager-Rated Current Performance
A manager’s rating of a salesperson’s performance is measured in the pretest with
the same seven-item scale used in a salesperson’s self-reported rating (Behrman and
Perreault 1982). An additional item was added in the pretest asking sales managers to
report total units that salespeople had sold to-date in 1995. This item will be deleted in
the final study since salespeople in automobile dealerships participating in the pretest were
Reproduced with permission of the copyright owner. Further reproduction prohibited without permission.

150
not, in practice, assigned unit sales goals, and there is a wide disparity in units sold based
on job tenure. The seven-item scale to be used in the final study is listed below.
Pretest ItemThe level of dollar sales
StatusRetain
Proposed Modified Item
Number of units sold to-date in 1997
The salesperson’s overall selling methods
The salesperson’s sales commissions to-date in 1997
The salesperson’s sales commission increases over the previous 6 months
Number of units sold to-date in 1995 Retain
The number of customer complaints Delete
The salesperson’s overall selling tactics Reword
The salesperson’s overall selling ability Retain
The salesperson’s sales conunissions Retainto-date in 1995
The salesperson’s sales commission Retainincreases over the past 6 months
How many total units has the Deletesalesperson sold to-date in 1995?
Proposed Analysis
The following sections propose a plan for analyzing the data in the final
dissertation study. Included is a brief description of the proposed model analysis (both
measurement and structural).
Measurement Model
In Chapter 5, pretest responses were examined for multivariate normality,
reliability, and dimensionality. Final response data will be evaluated with these same
criteria.
Structural Model
The modified proposed structural model is presented in Figure 6.1. Several
criteria will be used in evaluating the structural model. The model will be examined for
model fit (GFI, AGFl, NNFI and CFI). Levels of fit should be in the range of .90 to be
Reproduced with permission of the copyright owner. Further reproduction prohibited without permission.
151
acceptable. Hypotheses will be examined with model path estimates. Hypotheses will be
accepted if t-values associated with path estimates are greater than 1.96 (alpha = .05).
It is anticipated, based on the pretest data, that the social learning model can differ
based on the level of sales experience of the respondents. To develop a more complete
understanding of the impact of the variables in the social learning model on sales
performance, it is proposed that two models be compared, one for experienced automobile
salespeople (two or more years of experience in selling automobiles) and one for relatively
inexperienced salespeople (less than two years of experience in selling automobiles.
Reproduced with permission of the copyright owner. Further reproduction prohibited without permission.
CHAPTER 7
FINAL STUDY: DATA COLLECTION AND EVALUATION OF MEASUREMENT SCALES
Introduction
Chapter 7 presents the research procedures and analyses of the measurement
models in the final dissertation study proposed in Chapter 6. The first section includes the
data collection procedures and a summary of the sample characteristics. The second
section includes analyses of the multivariate normality, internal consistency and
dimensionality, and discriminant validity for each construct in the measurement model.
The final section includes an overview of the measurement properties of the scales in the
final study.
Procedures in Final Study
The following sections summarize the procedures utilized in the final dissertation
research study. Included are descriptions of data collection procedures and the final
sample.
Data Collection
Respondents in the final study were salespeople employed by automobile dealers in
Louisiana that are members in the Louisiana Automobile Dealers Association (LADA).
Support for the final study was provided by the LADA. Dealerships that participated in
the pretest were excluded from the final study. An effort was made to include dealerships
with eight or more salespeople to control for possible differences in organizational
behavior between salespeople in smaller dealerships and salespeople in larger dealerships.
152
Reproduced with permission of the copyright owner. Further reproduction prohibited without permission.

153
Owners or general managers in the dealerships were sent an introductory letter
from the LADA’s executive vice president asking for the dealers’ participation in the
study. Included in this initial mailing to the dealers were an overview of the study and a
stamped, self-addressed postcard to indicate their participation in the research project.
Questionnaires were then mailed to appropriate contacts (owners, general
managers, or sales managers) in participating dealerships to be distributed to salespeople.
Included in each package were an introductory letter, detailed information about the
study, suggestions for explaining the study to the salespeople, distribution of
questionnaires, collection of completed questionnaires, and returning the completed survey
packages (see Appendix B). An opportunity to win two $75.00 cash prizes was offered to
salespeople as an incentive to complete and return the questionnaires. Sales managers
were asked to have the questionnaires completed and returned within four weeks of
receipt of survey packages.
Sample Characteristics
Forty-one out of 72 dealerships indicated that they would participate in the study.
Based on input from the responding dealerships, a total of 600 questionnaires were mailed
to the contacts. A total o f432 usable questionnaires were returned for a response rate of
72 percent. Sample demographic information for the final study is summarized in Table
7.1.
The average age of respondents in the final study is in the 36 to 40 range, with the
sample predominantly males (369 respondents - 85,4%). The majority of respondents sell
both new and used cars and new and used trucks (76.8% and 68.1% respectively).
Reproduced with permission of the copyright owner. Further reproduction prohibited without permission.
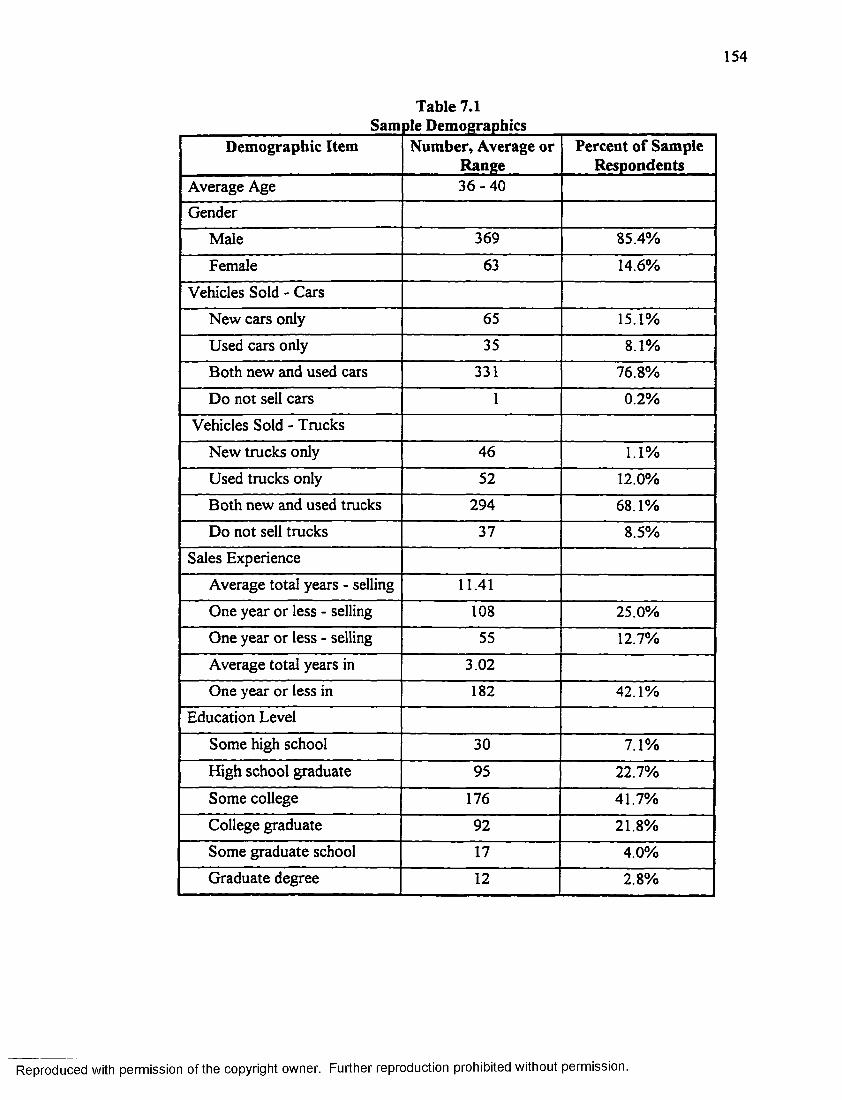
154
Table 7.1
Demographic Item Number, Average or Range
Percent of Sample Respondents
Average Age 36-40
Gender
Male 369 85.4%
Female 63 14.6%
Vehicles Sold - CarsNew cars only 65 15.1%
Used cars only 35 8.1%Both new and used cars 331 76.8%
Do not sell cars 1 0.2%Vehicles Sold - Trucks
New trucks only 46 1.1%Used trucks only 52 12.0%Both new and used trucks 294 68.1%Do not sell trucks 37 8.5%
Sales Experience
Average total years - selling 11.41One year or less - selling 108 25.0%One year or less - selling 55 12.7%Average total years in 3.02One year or less in 182 42.1%
Education Level
Some high school 30 7.1%
High school graduate 95 22.7%Some college 176 41.7%College graduate 92 21.8%Some graduate school 17 4.0%Graduate degree 12 2.8%
Reproduced with permission of the copyright owner. Further reproduction prohibited without permission.

155
The average responding automobile salesperson has 11.41 years of total selling
experience and 6.36 years of vehicle sales experience. Evidence of the large turnover in
this sales area is evidenced by the percentage of respondents (42.1%) with one year or less
of tenure with their current dealership. Additionally, there was a large percentage of
respondents (25.0%) who reported one year or less of vehicle sales experience. Individual
measures used in the final study and assessments of these measures are discussed in the
following section.
Measurement Model Analyses and Results
The following sections describe the analyses and results of the measurement scales
utilized in the final study. Item normality, internal consistency and dimensionality, and
discriminant validity are assessed for each measure. Evidence of internal consistency is
provided by composite reliability and coefficient alpha. Additionally, average variance
extracted, which assesses the amount of variance captured by a construct’s measure
relative to measurement error, was examined for each construct, along with standardized
item loadings. Average variance extracted estimates of .50 or higher indicate validity for a
construct’s measure. Standardized item loadings should be .70 or higher (Fomell and
Larcker 1981).
Self-Monitoring
A salesperson’s level of self-monitoring in the social learning theory model of sales
performance was measured with a scale adapted from Snyder (1974). The single
dimension, six-item scale measures the degree to which individuals monitor the self-image
they present to others. The measure is a seven-point Likert-type scale anchored with
“Strongly Disagree” and “Strongly Agree.” The pretest analysis of the scale indicated that
Reproduced with permission of the copyright owner. Further reproduction prohibited without permission.
156
no modifications to the scale were required. The six items were, however, reworded to
more specifically apply in a personal selling context. Multivariate normality and internal
consistency for the self-monitoring construct are discussed in the following sections.
Item Normalitv
Normality probability plots indicated that all six o f the measurement items are
normally distributed. Additionally, the skewness and kurtosis statistics for the items are
within acceptable ranges of ± 2.57 and ±3.00 respectively. All of the items were retained
for further analysis.
Internal Consistencv and Dimensionalitv
Internal consistency was examined with exploratory factor analysis, Cronbach’s
Alpha measure of reliability, and confirmatory factor analysis. The exploratory factor
analysis utilized principal components factor analysis with varimax rotation. The single
factor solution indicated that the dimension accounted for 59 percent of the variance with
an eigenvalue of 3.53. All scale items exhibited factor loadings above .5 and were retained
at this point.
Reliability was measured with the coefficient alpha statistic, inter-item correlations
and item-to-total correlations. Coefficient alpha for the six-item self-monitoring scale was
.84 (see Table 7.2). Inter-item correlations ranged from .29 to .68. Item-to-total
correlations ranged from .47 to .73.
Several measures from a confirmatory factor analysis were used to evaluate
internal consistency and dimensionality. These measures include composite reliability,
average variance extracted, and standardized item loadings (see Table 7.3 and Table 7.4).
Standardized loadings ranged from .49 to .84. One item exhibited a low loading (i.e., less
Reproduced with permission of the copyright owner. Further reproduction prohibited without permission.

157
than .70) and was not retained in the final analysis. The composite reliability for this five-
item self-monitoring measure was .86, which is in an acceptable range. The average
variance extracted (the amount of variance captured by a construct’s measures relative to
random measurement error) was .56.
Table 7.2
Property Value
Number of items 5Mean 4.83
Standard Deviation .24
Variance .06
CoefiBcient Alpha .86
Composite Reliability .86
Average Variance Extracted .56
Table 7.3Standardized Loadings, Means and Standard Deviations
Items StandardizedLoading
Mean StandardDeviation
I know if I am not reaching my sales goals and will try to change my selling style
NotRetained
I can control the way I present myself to customers depending on the impression I want to make
.71 4.96 1.00
I know when the way I present myself to customers isn’t working and will try to change the way I present myself
.68 4.82 111
I always try to be sure that my selling style suits different customers in different situations
.80 5.09 0.89
If 1 am not reaching my sales goals, I change my selling activities and try something else
.72 4.64 1.10
I try to understand what a customer situation call for, then try to change my selling approach to match the situation
.84 4.99 0.90
Reproduced with permission of the copyright owner. Further reproduction prohibited without permission.

158
Task Specific Self-Esteem
A salesperson’s level of task specific self-esteem was measured with a scale
adapted fi-om Bagozzi (1978). The single dimension, six-item scale measures the degree
to which salespeople evaluate the quantity and quality of their work performance in
comparison with all other salespeople in their organization. Salespeople rate themselves
as compared to all the other salespeople in a dealership from being in the top 10 percent of
salespeople to being in the bottom 10 percent of salespeople. Item normality and internal
consistency for the task specific self-esteem construct are discussed in the following
sections.
Item Normalitv
Normal probability plots indicated that all six of the measurement items are
normally distributed. Additionally, the skewness and kurtosis statistics for the items are
within acceptable ranges of ± 2.57 and ± 3.00 respectively. All of the items were retained
for further analysis in the final study.
Internal Consistencv and Dimensionalitv
Internal consistency was examined with exploratory factor analysis, Cronbach’s
Alpha measure o f reliability, and confirmatory factor analysis. The exploratory factor
analysis utilized principal components factor analysis with varimax rotation. The single
factor solution indicated that the dimension accounted for 61 percent of the variance with
an eigenvalue of 3.68. All scale items exhibited loadings above .5 and were retained for
additional analysis.
Standardized loadings ranged fi-om .46 to .85. One item exhibited a low loading
(i.e., less than .70) and was not retained in the final analysis. Reliability was measured
Reproduced with permission of the copyright owner. Further reproduction prohibited without permission.

159
with the coefiBcient alpha statistic, inter-item correlations and item-to-total correlations.
Coefficient alpha for the five-item task-specific self-esteem scale was .88 (see Table 7.4).
Inter-item correlations ranged fi"om .28 to .73. Item-to-total correlations ranged fi-om .43
to .80.
Several measures fi-om a confirmatory factor analysis were used to evaluate
internal consistency and dimensionality. These measures include composite reliability,
average variance extracted, and standardized item loadings (see Table 7.4 and Table 7.5).
The composite reliability for the task specific self-esteem measure was .87, which is in an
acceptable range. The average variance extracted (the amount of variance captured by a
construct’s measures relative to random measurement error) was .61.
Table 7.4
Property ValueNumber of items 5Mean 41.41
Standard Deviation 7.38Variance 54.46
Coefficient Alpha .88Composite Reliability .87
Average Variance Extracted .61
Table 7.5Standardized Loadings, Means and Standard Deviations
Items StandardizedLoading
Mean StandardDeviation
How do you rate yourself in terms of the unit sales volume you achieve?
.73 6.95 2.01
How do you rate yourself in terms of your ability to reach your sales goals?
.83 7.46 1.66
(table cont.)
Reproduced with permission of the copyright owner. Further reproduction prohibited without permission.

160
How do you rate yourself in terms of the quality of your sales performance in regard to customer relations?
.75 7.98 1.45
How do you rate yourself in terms of quality of your performance in regard to management of time, plaiming, and overall ability?
.81 7.39 1.59
How do you rate yourself in terms of quality of your sales performance in regard to knowledge of your vehicles, competitors’ products, and customers’ needs?
.78 7.38 1.74
How do you rate yourself in terms of the potential you have for reaching the top in sales volume for all salespeople in your dealership?
NotRetained
Coworker Acceptance
A salesperson’s perception of coworker acceptance in the social learning theory
model of sales performance was measured with a scale adapted from Dubinsky et al.
(1986). The single dimension, five-item scale measures the degree to which individuals
feels accepted and included in the social group by coworkers. The scale is anchored by
“Strongly Disagree” and “Strongly Agree.” The pretest analysis of the scale indicated that
no modifications to the scale were required. Three of the five items were, however,
reworded to more specifically apply in a personal selling context. Item normality and
internal consistency for the coworker acceptance construct are discussed in the following
sections.
Item Normalitv
Normality probability plots indicated that four of the five measurement items were
normally distributed. Additionally, the skewness and kurtosis statistics for these four
items are within acceptable ranges of ± 2.57 and ± 3.00 respectively. The item exhibiting
a departure from normality was not retained in the final analyses.
Internal Consistencv and Dimensionalitv
Internal consistency was examined with exploratory factor analysis, Cronbach’s
Alpha measure of reliability, and confirmatory factor analysis. The exploratory factor
Reproduced with permission of the copyright owner. Further reproduction prohibited without permission.

161
analysis utilized principal components factor analysis with varimax rotation. The single
factor solution indicated that the dimension accounted for 67 percent of the variance with
an eigenvalue o f 2.67. All four remaining scale items exhibited loadings above .5 and
were retained for further analysis.
Reliability was measured with the coefficient alpha statistic, inter-item correlations
and item-to-total correlations. Coefficient alpha for the self-monitoring scale was .81 (see
Table 7.6). Inter-item correlations ranged from .50 to .62. Item-to-total correlations
ranged from .63 to .69.
Several measures from a confirmatory factor analysis were used to evaluate
internal consistency and dimensionality. These measures include composite reliability,
average variance extracted, and standardized item loadings (see Table 7.6 and Table 7.7).
The composite reliability for the self-monitoring measure was .81, which is in an
acceptable range. The average variance extracted (the amount of variance captured by a
construct’s measures relative to random measurement error) was .59. Standardized
loadings ranged from .69 to .79.
Table 7.6
Property ValueNumber of items 3Mean 23.59Standard Deviation 3.44Variance 11.82Coefficient Alpha .81
Composite Reliability .81Average Variance Extracted .59
Reproduced with permission of the copyright owner. Further reproduction prohibited without permission.

162
Table 7.7Standardized Loadings, Means and Standard Deviations
For Coworker Acceptance: Final Stud:yItems Standardized
LoadingMean Standard
DeviationThe salespeople I work with include me in their conversations about things at work
NotRetained
Other salespeople in my organization feel relaxed when they are with me
.74 6.03 1.04
My fellow salespeople and 1 have some things in common
.79 5 77 1.05
I can identify with most of the other salespeople 1 work with
.77 5.85 1.05
The other salespeople I work with like me NotRetained
Modeling
The modeling scale was developed specifically for this study. The 17-item scale
measures the degree that, to achieve higher levels of performance, salespeople observe and
utilize the successful sale’s behaviors of other salespeople they work with. The Likert-
type measure is anchored by “Strongly Disagree” and “Strongly Agree.” Item normality
and internal consistency for the modeling construct are discussed in the following sections.
Item Normalitv
Normality probability plots indicated that all measurement items were normally
distributed. Additionally, the skewness and kurtosis statistics for these 17 items were
within acceptable ranges of ± 2.57 and ± 3.00 respectively. All items were retained for
additional analyses.
Internal Consistencv and Dimen.sinnality
Internal consistency was examined with exploratory factor analysis, Cronbach’s
Alpha measure of reliability, and confirmatory factor analysis. The exploratory factor
analysis utilized principal components factor analysis with varimax rotation. Exploratory
Reproduced with permission of the copyright owner. Further reproduction prohibited without permission.

163
factor analysis indicated two dimensions to the modeling construct: (1) observe other
salespeople and (2) utilize observed activities. Eigenvalues were 11.01 for the “observe”
dimension and 1.13 for the “utilize” dimension. The two factors accounted for 71 percent
of the modeling construct’s variance. All scale items exhibited loadings above .5. Two
items, however, loaded on a third factor and were not retained in the final study.
Reliability was measured with the coefficient alpha statistic, inter-item correlations
and item-to-total correlations. CoefiBcient alpha for the two dimensions of the modeling
scale were .95 and .93 respectively (see Table 7.8). Inter-item correlations for the
“observe” dimension ranged from .58 to .79, and from .58 to .79 for the “utilize”
dimension. Item-to-total correlations ranged from .71 to .86 across the two factors.
Several measures from a confirmatory factor analysis were used to evaluate
internal consistency and dimensionality. These measures include composite reliability,
average variance extracted, and standardized item loadings (see Table 7.8 and Table 7.9).
The composite reliabilities were .95 for the “observe” factor and .92 for the “utilize”
factor which are in an acceptable range. The average variance extracted (the amount of
variance captured by a construct’s measures relative to random measurement error) was
.68 for the “observe” factor and .67 for the “utilize” factor. Standardized loadings ranged
from .70 to .90 across the two modeling dimensions.
Table 7.8Psychometric Properties for Modeling: Final Studly
Property Observe UtilizeNumber of Items 9 6Mean 48.71 33.58Standard Deviation 11.20 7.29Variance 125.40 53.16Coefficient Alpha .95 .93
(table cont.)
Reproduced with permission of the copyright owner. Further reproduction prohibited without permission.

164
Composite Reliability .95 .92Average Variance Extracted .68 .67
Table 7.9Standardized Loadings, Means and Standard Deviations
Items StandardizedLoading
Mean StandardDeviation
ObserveI watch and then practice how other good salespeople in this dealership deal with difficult customers
.79 5.46 1.52
I have learned how to better present the featines of our vehicles by watching how other salespeople in this dealership do it
.76 5.46 1.52
I am better at explaining the features of our cars and trucks by watching how other good salespeople I work with do it and then trying their method
.75 5.04 1.60
When I see other salespeople in this dealership being rewarded for doing a good job, 1 try to use some of their selling methods
.82 5.26 1.51
I look for selling techniques that other good salespeople in this dealership use and try to use them myself
.90 5.58 1.36
I can visualize myself using some of the selling methods that I see other good salespeople in this dealership using
.86 5.52 1.38
I have learned some of my sales techniques from watching other good salespeople in this dealership in action
.87 5.57 1.43
I can visualize myself doing the job like other successful salespeople in my dealership
.79 5.67 1.37
I try to picture in my own mind how successful salespeople in my dealership do the job and then be more like them
.86 5.16 1.55
UtilizeI usually try some of the sales methods used by good salespeople in this dealership
.70 5.50 1.52
When 1 see good salespeople in this dealership doing a good job, 1 can see myself using some of their sales method
.77 5.66 1.40
I have learned some sales techniques by watching how other successful salespeople I work with do it
.79 5.91 1.27
1 have learned to be a better salesperson by watching the techniques of other good salespeople in this dealership
.85 5.58 1.50
I sometimes tiy to use some of the sales methods that I see other good salespeople in this dealership using
.89 5.48 1.40
1 try to use some of the selling methods that seem to work well for other salespeople in this dealership
.90 5.46 1.44
Reproduced with permission of the copyright owner. Further reproduction prohibited without permission.

165
Socialization
A measure of socialization was included in the study to test the modeling scale for
construct validity. The single dimension, five-item scale (Jones 1986) indicates the degree
to which there is an institutional approach toward socialization, giving new organizational
members opportunities to observe, work with, and leam from more experienced
organizational members. The seven-point Likert-type scale ranges in responses fi'om
“Strongly Disagree” to “Strongly Agree.” The pretest analysis of the scale indicated that
no modifications to the scale were required. Item normality and internal consistency for
the self-monitoring construct are discussed in the following sections.
Item Normalitv
Normality probability plots indicated that all five of the measurement items were
normally distributed. Additionally, the skewness and kurtosis statistics for the items are
within acceptable ranges of ± 2.57 and ± 3.00 respectively. All of the items were retained
for additional analysis.
Internal Consistencv and Dimensionalitv
Internal consistency was examined with exploratory factor analysis, Cronbach’s
Alpha measure of reliability, and confirmatory factor analysis. The exploratory factor
analysis utilized principal components factor analysis with varimax rotation. The single
factor solution indicated that the dimension accounted for 63 percent of the variance with
an eigenvalue of 3.13. All scale items exhibited factor loadings above .5 and were retained
in the final study.
Reliability was measured with the coefficient alpha statistic, inter-item correlations
and item-to-total correlations. Coefficient alpha for the socialization scale was .87 (see
Reproduced with permission of the copyright owner. Further reproduction prohibited without permission.
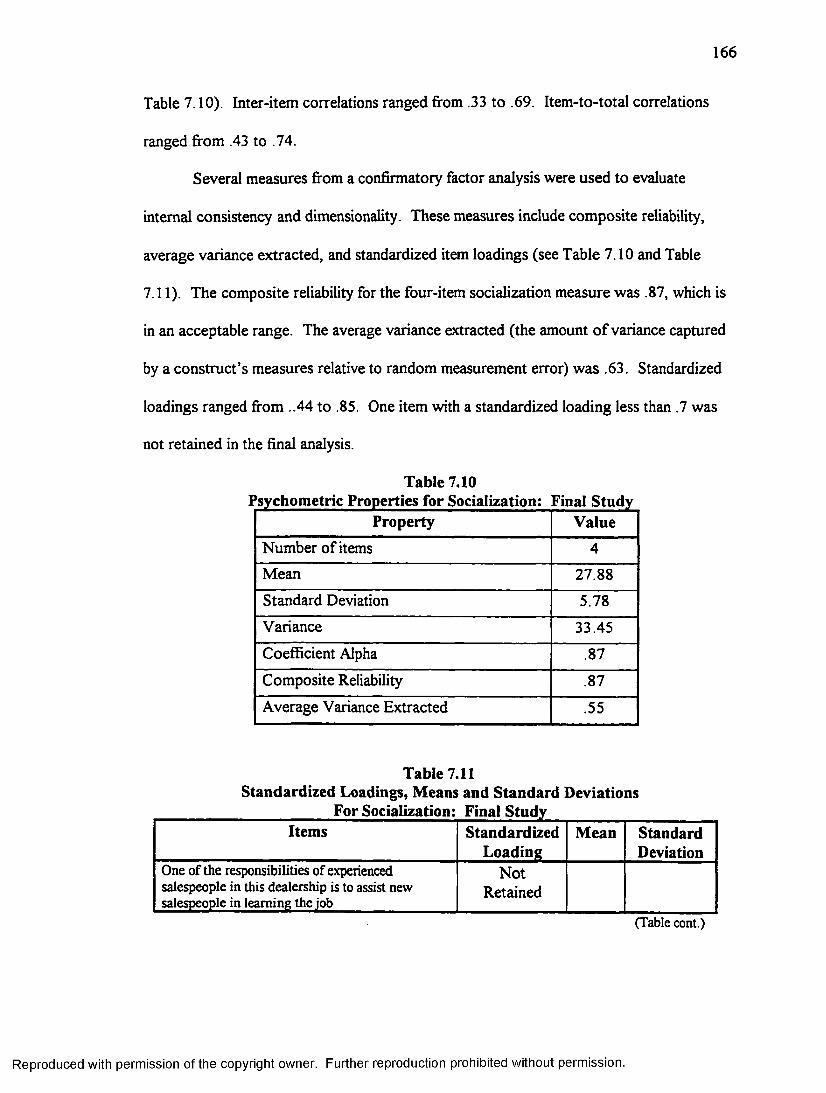
166
Table 7.10). Inter-item correlations ranged from .33 to .69. Item-to-total correlations
ranged from .43 to .74.
Several measures from a confirmatory factor analysis were used to evaluate
internal consistency and dimensionality. These measures include composite reliability,
average variance extracted, and standardized item loadings (see Table 7.10 and Table
7.11). The composite reliability for the four-item socialization measure was .87, which is
in an acceptable range. The average variance extracted (the amount of variance captured
by a construct’s measures relative to random measurement error) was .63. Standardized
loadings ranged from .44 to .85. One item with a standardized loading less than .7 was
not retained in the final analysis.
Table 7.10
Property ValueNumber of items 4Mean 27.88Standard Deviation 5.78Variance 33.45Coefficient Alpha .87
Composite Reliability .87
Average Variance Extracted .55
Table 7.11Standardized Loadings, Means and Standard Deviations
Items StandardizedLoading
Mean StandardDeviation
One of the responsibilities of experienced salespeople in this dealership is to assist new salespeople in learning the job
NotRetained
(Table cont.)
Reproduced with permission of the copyright owner. Further reproduction prohibited without permission.

167
1 got a better understanding of my sales job from watching more experienced salespeople
.77 5.66 1.36
When I first started, I received some guidance from the experienced salespeople in the dealership on how to do a good job
.74 5.50 1.64
In this dealership, I can watch how other good salespeople do the job
.82 5.69 1.22
Other salespeople in this dealership have helped me develop as a better salesperson
.85 5.47 1.54
Role Ambiguity
Role ambiguity was measured in the final study with a scale developed by Chonko,
Howell and Bellenger (1986). The 16 items used in the final study measure an individual’s
perception that he or she does not possess sufficient information to adequately perform the
job role (i.e.. Does not have a clear understanding as to what the job actually is ). The
five-point Likert-type scale is anchored with “Not At All Certain” to “Completely
Certain.” The ambiguity measure, as used in the final study, is multidimensional
(ambiguity related to the job role, one’s sales manager, and customers). Item normality
and internal consistency for the role ambiguity construct are discussed in the following
sections.
Item Normalitv
Normality probability plots indicated that 15 of the 16 measurement items were
normally distributed. Additionally, the skewness and kurtosis statistics for these 15 items
were within acceptable ranges of ± 2.57 and ±3.00 respectively. One item exhibited a
departure from normality and was not retained in the final study.
Internal Consistencv and Dimensionalitv
Internal consistency was examined with exploratory factor analysis, Cronbach’s
Alpha measure of reliability, and confirmatory factor analysis. The exploratory factor
Reproduced with permission of the copyright owner. Further reproduction prohibited without permission.

168
analysis utilized principal components factor analysis with varimax rotation. Exploratory
factor analysis indicated three dimensions to the role ambiguity construct: (1) role, (2)
manager, and (3) personal. Only two items loaded on the “personal” factor. These two
items, however, loaded as high on the factor as items loaded on the other two factors and
explained as much variance in the ambiguity construct as did the second factor with five
items. Thus, the two-item factor was retained since a single measure will be summed
across all three factors in the final model analysis. Eigenvalues were 6.75, 1.47 and 1.37
respectively. The three factors accounted for 64 percent of the role ambiguity construct’s
variance. All scale items exhibited loadings above .5
Reliability was measured with the coefiBcient alpha statistic, inter-item correlations
and item-to-total correlations. CoefiBcient alpha for the three dimensions of the role
ambiguity scale were .88, .87 and .79 respectively (see Table 7.12). Inter-item
correlations ranged from .31 to .75 across the three dimensions. Item-to-total correlations
ranged from .55 to .79 across the two factors.
Several measures from a confirmatory factor analysis were used to evaluate
internal consistency and dimensionality. These measures include composite reliability,
average variance extracted, and standardized item loadings (see Table 7.12 and Table
7.13). The composite reliabilities were .88 for the “role” factor, .88 for the “manager”
factor, and .79 for the “personal” factor, all in an acceptable range. The average variance
extracted (the amount of variance captured by a construct’s measures relative to random
measurement error) was .50 for the “role” factor, .59 for the “manager” factor, and .66 for
the “personal” factor. Standardized loadings ranged from .58 to .86 across the three role
ambiguity dimensions.
Reproduced with permission of the copyright owner. Further reproduction prohibited without permission.

169
Table 7.12Psychometric Properties for Role Ambiguity: Final Situdy
Property Role Manager PersonalNumber of Items 8 5 2Mean 33.35 20.79 6.94Standard Deviation 4.81 4.02 2.40Variance 23.10 16.18 5.77CoefiBcient Alpha .88 .87 .79Composite Reliability .88 .88 .79Average Variance Extracted .50 .59 .66
Table 7.13Standardized Loadings, Means and Standard Deviations
For Role Ambiguityn Final StudyItems Standardized
LoadingMean Standard
DeviationRole - How certain are you about;what your customers expect of you in performing your job
.68 4.33 0.73
how your customers feel that you match a vehicle with their personal needs
.68 4.35 0.68
how satisfied your customers are with your performance
.58 4.30 0.75
how to resolve customer complaints .80 4.01 0.89how best to serve customers .71 4.28 0.74how to handle unusual customer problems or situations
.77 3.96 0.93
how much time you should spend on various aspects of your job
.69 4.02 0.86
how to plan and organize your daily work activities
.62 4.12 0.91
Manager - How certain are you about:how your sales manager will evaluate your sales performance
.86 4.07 1.07
how satisfied your sales manager is with your sales performance
.80 4.02 1.05
your dealership’s rules and regulations .72 4.35 0.95how your sales manager expects you to allocate your work time
.79 4.03 0.96
where to get assistance in doing your sales job .65 4.33 0.90Personal - How certain are you about:the extent to which ;you can bend the rules to satisfy customers
.79 3.45 1.28
the extent to which you can make decisions without your manager’s approval
.82 3.49 1.36
Reproduced with permission of the copyright owner. Further reproduction prohibited without permission.
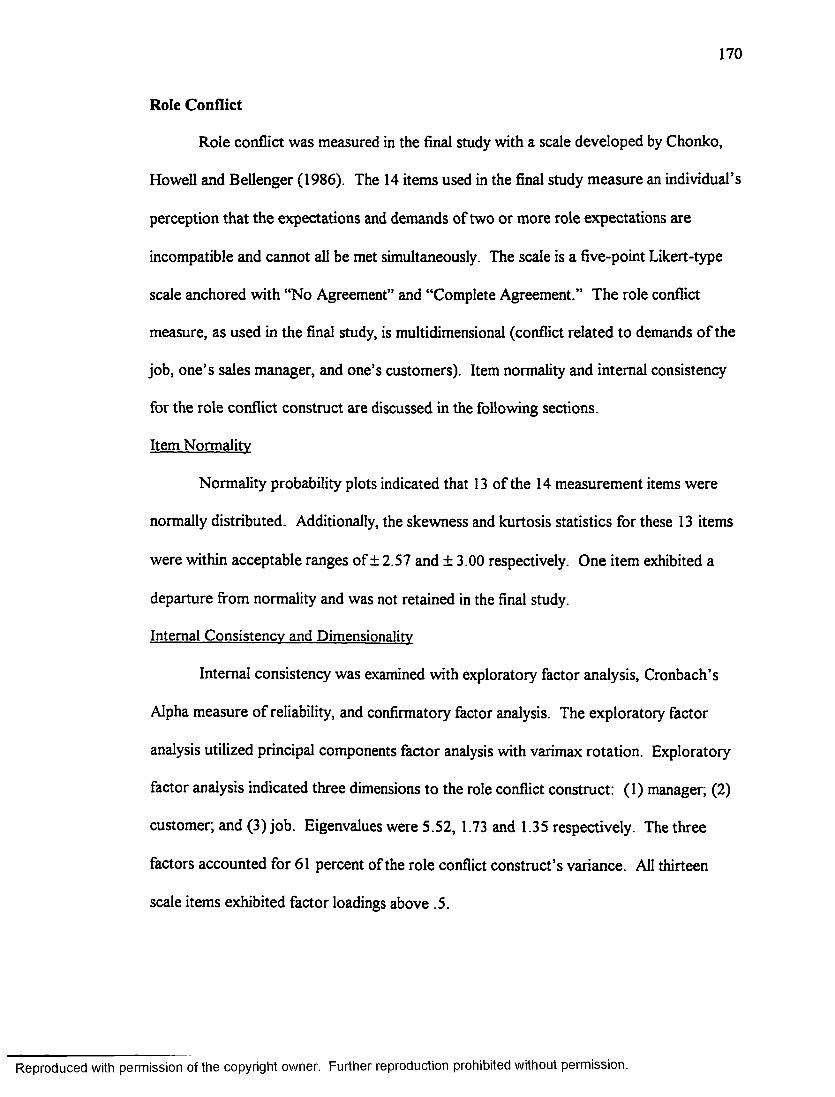
170
Role Conflict
Role conflict was measured in the final study with a scale developed by Chonko,
Howell and Bellenger (1986). The 14 items used in the final study measure an individual’s
perception that the expectations and demands of two or more role expectations are
incompatible and cannot all be met simultaneously. The scale is a five-point Likert-type
scale anchored with “No Agreement” and “Complete Agreement.” The role conflict
measure, as used in the final study, is multidimensional (conflict related to demands of the
job, one’s sales manager, and one’s customers). Item normality and internal consistency
for the role conflict construct are discussed in the following sections.
Item Normalitv
Normality probability plots indicated that 13 of the 14 measurement items were
normally distributed. Additionally, the skewness and kurtosis statistics for these 13 items
were within acceptable ranges of ± 2.57 and ± 3.00 respectively. One item exhibited a
departure from normality and was not retained in the final study.
Internal Consistencv and Dimensionalitv
Internal consistency was examined with exploratory factor analysis, Cronbach’s
Alpha measure of reliability, and confirmatory factor analysis. The exploratory factor
analysis utilized principal components factor analysis with varimax rotation. Exploratory
factor analysis indicated three dimensions to the role conflict construct: (1) manager; (2)
customer; and (3) job. Eigenvalues were 5.52, 1.73 and 1.35 respectively. The three
factors accounted for 61 percent of the role conflict construct’s variance. All thirteen
scale items exhibited factor loadings above .5.
Reproduced with permission of the copyright owner. Further reproduction prohibited without permission.

171
Reliability was measured with the coefficient alpha statistic, inter-item correlations
and item-to-total correlations. CoefiBcient alpha for the three dimensions of the role
conflict scale were .86, .85 and .78 respectively (see Table 7.14). Inter-item correlations
ranged from .40 to .74 across the three dimensions. Item-to-total correlations ranged
from .51 to .76 across the two factors.
Several measures fi-om a confirmatory factor analysis were used to evaluate
internal consistency and dimensionality. These measures include composite reliability,
average variance extracted, and standardized item loadings (see Table 7.14 and Table
7.15). The composite reliabilities were .86 for the “manager” factor, .85 for the
“customer” factor, and .79 for the “job” factor, all in an acceptable range. The average
variance extracted (the amount of variance captured by a construct’s measures relative to
random measurement error) was .52 for the “manager” factor, .65 for the “customer”
factor, and .50 for the “job” factor. Standardized loadings ranged from .55 to .88 across
the three role conflict dimensions. Two items with standardized loadings less than .60
were not retained for analysis of the final model.
Table 7.14Psychometric Properties for Role Conl lict: Final Study
Property Manager Customer JobNumber of Items 6 3 4MeanStandard Deviation 4.81 4.02 2.40Variance 23.10 16.18 5.77Coefficient Alpha .86 .85 .78Composite Reliability .86 .85 .79Average Variance Extracted .52 .65 .50
Reproduced with permission of the copyright owner. Further reproduction prohibited without permission.

172
Table 7.15Standardized Loadings, Means and Standard Deviations
Items StandardizedLoading
Mean StandardDeviation
Manager - How much agreement would you say there is between you and your sales manager on:how often you should report to your manager .68 3.87 1.09how far you should bend the rules to satisfy customers
.56 3.45 1.20
how much service you should provide to customers
.71 4.20 0.99
how much authority you have in making decisions
.79 3.46 1.31
how much authority you have in negotiating prices with customers
.73 3.68 1.32
what “acceptable” sales performance is for you
.83 3.94 1.06
Customer - How much agreement would you say there is between you and your customers on:your performance in serving customer needs .83 4.36 0.77how much service you should provide to customers
.88 4.29 0.80
how you resolve customer complaints .70 4.25 0.72Job - How much agreement would you say there is between you and your job requirements on:the amount of work you are expected to do and the amount you actually do
.81 3.73 1.02
the number of customers you are expected to serve and the number you actually serve
.79 3.70 0.96
the number of non-work tasks you are expected to perform and the number you actually perform
.63 3.51 1.12
the amount of leisure time you expect to have and the amount you actually have
.55 2.91 1.26
Past Performance
A salesperson’s level of past performance in the final study was measured with a
scale adapted from Behrman and Perreault (1982). The single dimension, five-item scale
is a self-report measure that assesses a salesperson’s performance in the previous year.
The five-point Likert-type scale is anchored with “Far Below My Objectives” to “Far
Reproduced with permission of the copyright owner. Further reproduction prohibited without permission.

173
Above My Objectives. The pretest analysis o f the scale indicated that no modifications to
the scale were required with the exception of the reporting year being changed. Item
normality and internal consistency for the past performance construct are discussed in the
following sections.
Item Normalitv
Normal probability plots indicated that the five measurement items were normally
distributed. Additionally, the skewness and kurtosis statistics for these five items are
within acceptable ranges of ± 2.57 and ± 3.00 respectively.
Internal Consistencv and Dimensionalitv
Internal consistency was examined with exploratory factor analysis, Cronbach’s
Alpha measure o f reliability, and confirmatory factor analysis. The exploratory factor
analysis utilized principal components factor analysis with varimax rotation. The single
factor solution indicated that the dimension accounted for 82 percent of the variance with
an eigenvalue of 4.09. All five scale items exhibited loadings above .5 and were retained
in the final study.
Reliability »vas measured with the coefficient alpha statistic, inter-item correlations
and item-to-total correlations. Coefficient alpha for the past performance scale was .94
(see Table 7.16). Inter-item correlations ranged from .67 to .93. Item-to-total
correlations ranged from .75 to .91.
Several measures from a confirmatory factor analysis were used to evaluate
internal consistency and dimensionality. These measures include composite reliability,
average variance extracted, and standardized item loadings (see Table 7.16 and Table
7.17). The composite reliability for the past performance measure was .94, which is in an
Reproduced with permission of the copyright owner. Further reproduction prohibited without permission.

174
acceptable range. The average variance extracted (the amount of variance captured by a
construct’s measures relative to random measurement error) was .77. Standardized
loadings ranged from .75 to .96.
Table 7.16Psychometric Properties for Past Performance: Final Study
Property Value
Number of items 5Mean 15.12Standard Deviation 5.26
Variance 27.63
CoefiBcient Alpha .94
Composite Reliability .94
Average Variance Extracted .77
Table 7.17Standardized Loadings, Means and Standard Deviations
Items StandardizedLoading
Mean StandardDeviation
Your level of dollar sales in 1996 .95 2.95 1.17Number of units you sold in 1996 .96 2.96 1.19Your overall sales techniques in 1996 .75 3.21 1.04Your sales commissions in 1996 .91 2.98 1.22Your sales commission increases over the last 6 months in 1996
.80 3.03 1.18
Coworker Feedback
Coworker feedback was measured in the final study with scales developed by
Kohli and Jaworski (1992). The 16 items used in the final study measure feedback from a
salesperson’s coworkers in four areas: (1) positive output feedback; (2) negative output
feedback; (3) positive behavioral feedback; and (4) negative behavioral feedback. The
exploratory factor analysis in the pretest indicated three factors: (1) job activities
Reproduced with permission of the copyright owner. Further reproduction prohibited without permission.

175
(behaviors); (2) positive feedback; and (3) negative feedback. In the final model,
however, only the positive output feedback factor was examined since this was the
primary area of interest in the study based on Social Cognitive Theory. The eight-item
scale is a seven-point Likert-type scale ranging fi'om “Strongly Disagree” to “Strongly
Agree. Item normality and internal consistency for the coworker feedback construct are
discussed in the following sections.
Item Normalitv
Normal probability plots indicated that the 16 measurement items were normally
distributed. Additionally, the skewness and kurtosis statistics for these 16 items were
within acceptable ranges of ± 2.57 and ± 3.00 respectively.
Internal Consistencv and Dimensionalitv
Internal consistency was examined with exploratory factor analysis, Cronbach’s
Alpha measure of reliability, and confirmatory factor analysis. The exploratory factor
analysis utilized principal components factor analysis with varimax rotation. Exploratory
factor analysis extracted three dimensions to the coworker feedback construct: (I) good
performance; (2) poor performance; and (3) behaviors. Eigenvalues were 6.30, 3.80 and
1.44 respectively. The three factors accounted for 72 percent of the coworker feedback
construct’s variance. All scale items exhibited factor loadings above .5.
Reliability was measured with the coefficient alpha statistic, inter-item correlations
and item-to-total correlations. Coefficient alpha for the three dimensions of the co worker
feedback scale were .93, .86 and .92 respectively (see Table 7.18). Inter-item correlations
ranged from .30 to .90 across the three dimensions. Item-to-total correlations ranged
from .52 to .89 across the three factors.
Reproduced with permission of the copyright owner. Further reproduction prohibited without permission.
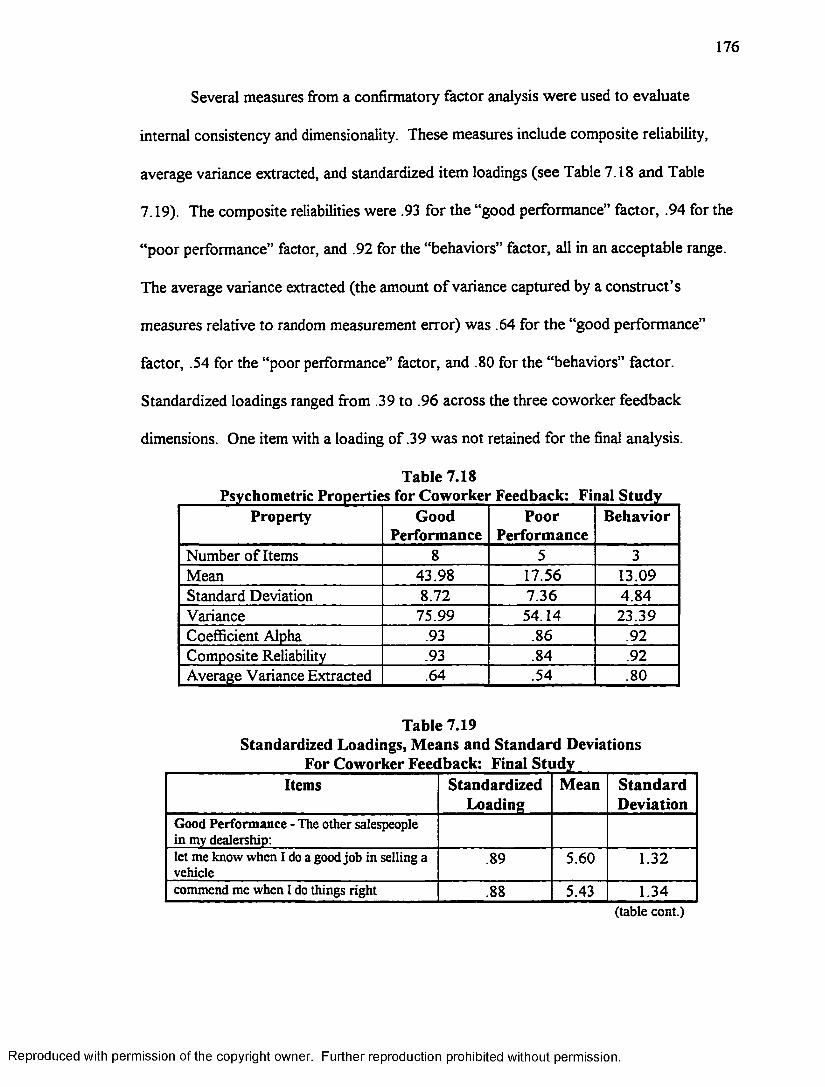
176
Several measures from a confirmatory factor analysis were used to evaluate
internal consistency and dimensionality. These measures include composite reliability,
average variance extracted, and standardized item loadings (see Table 7.18 and Table
7.19). The composite reliabilities were .93 for the “good performance” factor, .94 for the
“poor performance” factor, and .92 for the “behaviors” factor, all in an acceptable range.
The average variance extracted (the amount o f variance captured by a construct’s
measures relative to random measurement error) was .64 for the “good performance”
factor, .54 for the “poor performance” factor, and .80 for the “behaviors” factor.
Standardized loadings ranged from .39 to .96 across the three coworker feedback
dimensions. One item with a loading of .39 was not retained for the final analysis.
Table 7.18
Property GoodPerformance
PoorPerformance
Behavior
Number o f Items 8 5 3Mean 43.98 17.56 13.09Standard Deviation 8.72 7.36 4.84Variance 75.99 54.14 23.39Coefficient Alpha .93 .86 .92Composite Reliability .93 .84 .92Average Variance Extracted .64 .54 .80
Table 7.19Standardized Loadings, Means and Standard Deviations
Items StandardizedLoading
Mean StandardDeviation
Good Performance - The other salespeople in my dealership;let me know when I do a good job in selling a vehicle
.89 5.60 1.32
commend me when I do things right .88 5.43 1.34(table cont.)
Reproduced with permission of the copyright owner. Further reproduction prohibited without permission.

177
congratulate me when I sell a large number of units
.69 5.92 1.14
tell me when I do a nice selling job .89 5.59 1.24tell me when my sales output is good .72 5.58 1.25congratulate me when I make a good gross profit on a car or truck sale
.72 5.64 1.24
tell me when I’m doing the right things on the job
.83 5.28 1.50
let me know when I use the right sales approach with a customer
.74 4.94 1.53
Poor Performance - The other salespeople in my dealership:treat me differently when my sales performance is not good
.71 3.21 1.78
behave differently around me when 1 am performing poorly
.57 3.42 1.75
treat me differently when my sales performance is good
.39 4.01 1.81
let me know when I am generally making low gross profits
.96 3.43 1.88
let me know when I make a low gross profit on a car or truck sale
.90 3.49 1.91
Behaviors - The other salespeople in my dealership:let me know when I use an ineffective sales approach
.94 4.38 1.75
let me know if I mess up a sale by using a wrong sales approach
.96 4.35 1.76
let me know if I’m not doing the sales job as 1 should be
.77 4.36 1.72
Manager Feedback
Manager feedback was measured in the final study with scales developed by Kohli
and Jaworski (1992). The seven-point Likert-type measures are anchored by “Strongly
Disagree” and “Strongly Agree.” The 16 items used in the final study measure feedback
from a salesperson’s coworkers in four areas: (1) positive output feedback; (2) negative
output feedback; (3) positive behavioral feedback; and (4) negative behavioral feedback.
The exploratory factor analysis in the pretest indicated three factors: (1) positive
feedback; (2) treatment; and (3) job activities. In the final model analysis, however, only
the positive feedback factor was included since positive manager feedback is the primary
Reproduced with permission of the copyright owner. Further reproduction prohibited without permission.

178
area of interest based on Social Cognitive Theory. Item normality and internal consistency
for the manager feedback construct in the final study are discussed in the following
sections.
Item Normalitv
Normality probability plots indicated that the 15 of the 16 measurement items were
normally distributed. Additionally, the skewness and kurtosis statistics for these 15 items
were within acceptable ranges of ± 2.57 and ±3.00 respectively. One item exhibited a
departure firom normality and was not retained for additional analysis.
Internal Consistencv and Dimensionalitv
Internal consistency was examined with exploratory factor analysis, Cronbach’s
Alpha measure of reliability, and confirmatory factor analysis. The exploratory factor
analysis utilized principal components factor analysis with varimax rotation. Exploratory
factor analysis extracted three dimensions to the manager feedback construct; (1)
positive; (2) activities; and (3) negative. Eigenvalues for the three factors were 7.05, 2.98
and 1.52 respectively. The three factors accounted for 72 percent of the manager
feedback construct’s variance. All scale items exhibited factor loadings above .5.
Reliability was measured with the coefficient alpha statistic, inter-item correlations
and item-to-total correlations. Coefficient alpha for the three dimensions of the manager
feedback scale were .95, .87 and .83 respectively (see Table 7.20). Inter-item correlations
ranged from .39 to .83 across the three dimensions. Item-to-total correlations ranged
from .65 to .88 across the three factors.
Several measures from a confirmatory factor analysis were used to evaluate
internal consistency and dimensionality. These measures include composite reliability.
Reproduced with permission of the copyright owner. Further reproduction prohibited without permission.
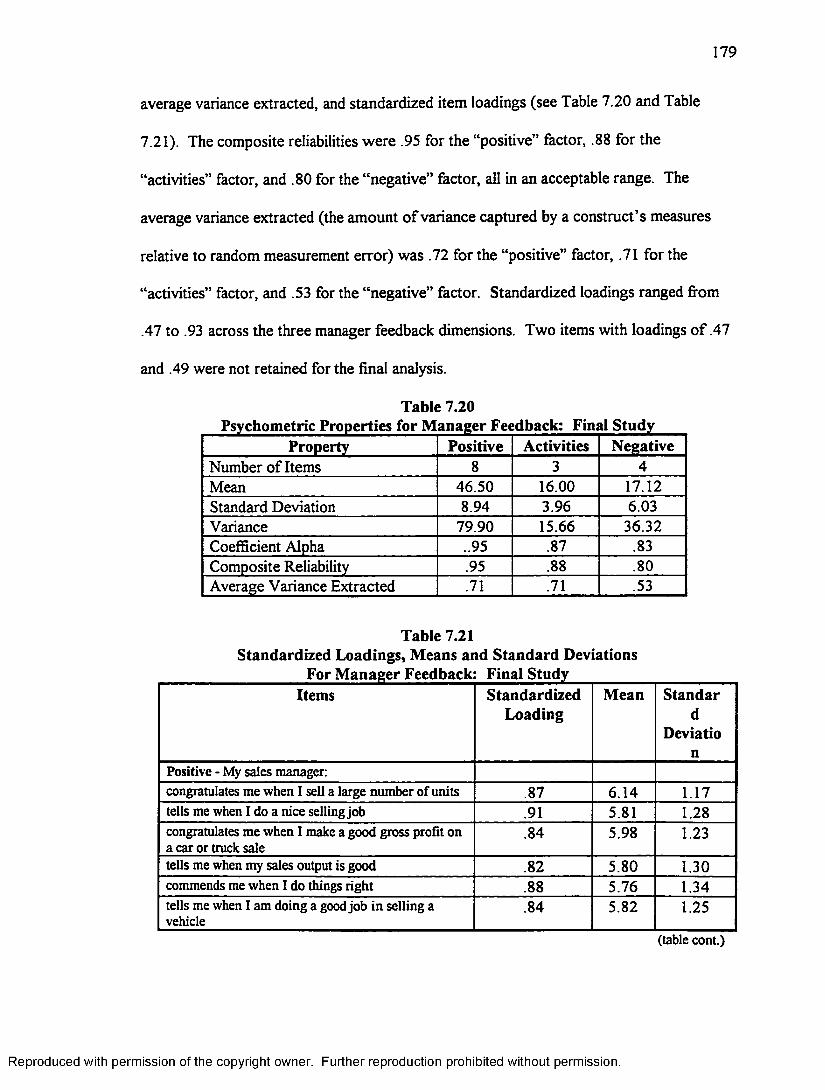
179
average variance extracted, and standardized item loadings (see Table 7.20 and Table
7.21). The composite reliabilities were .95 for the “positive” factor, .88 for the
“activities” factor, and .80 for the “negative” factor, all in an acceptable range. The
average variance extracted (the amount of variance captured by a construct’s measures
relative to random measurement error) was .72 for the “positive” factor, .71 for the
“activities” factor, and .53 for the “negative” factor. Standardized loadings ranged from
.47 to .93 across the three manager feedback dimensions. Two items with loadings of .47
and .49 were not retained for the final analysis.
Table 7.20
Property Positive Activities NegativeNumber of Items 8 3 4Mean 46.50 16.00 17.12Standard Deviation 8.94 3.96 6.03Variance 79.90 15.66 36.32Coefficient Alpha .95 .87 .83Composite Reliability .95 .88 .80Average Variance Extracted .71 .71 .53
Table 7.21Standardized Loadings, Means and Standard Deviations
Items StandardizedLoading
Mean Standard
Deviation
Positive - My sales manager:congratulates me when I sell a large number of units .87 6.14 1.17tells me when I do a nice selling job .91 5.81 1.28congratulates me when I make a good gross profît on a car or truck sale
.84 5.98 1.23
tells me when my sales output is good .82 5.80 1.30commends me when I do things right .88 5.76 1.34tells me when I am doing a good job in selling a vehicle
.84 5.82 1.25
(table cont.)
Reproduced with permission of the copyright owner. Further reproduction prohibited without permission.
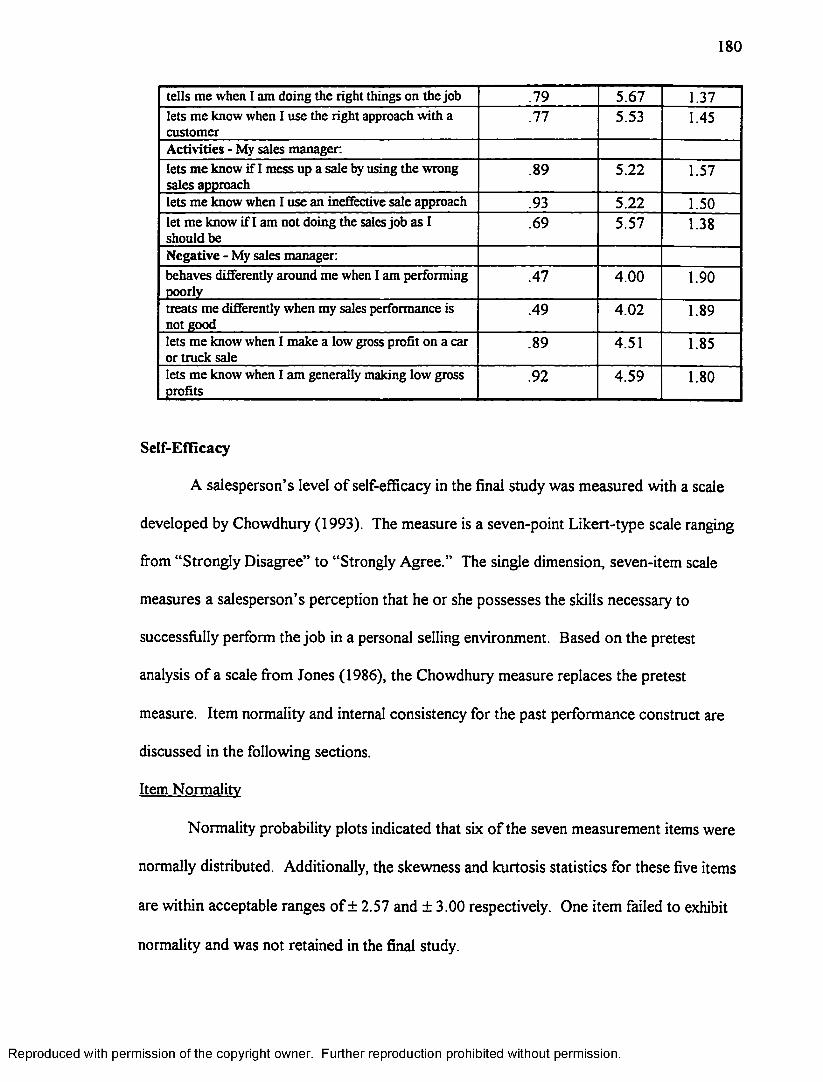
180
tells me when 1 am doing the right things on the Job .79 5.67 1.37lets me know when I use the right approach with a customer
.77 5.53 1.45
Activities - My sales manager;lets me know if I mess up a sale by using the wrong sales approach
.89 5.22 1.57
lets me know when I use an ineffective sale approach .93 5.22 1.50let me know if I am not doing the sales job as I should be
.69 5.57 1.38
Negative - My sales manager:behaves differently aroimd me when I am performing poorly
.47 4.00 1.90
treats me differently when my sales performance is not good
.49 4.02 1.89
lets me know when I make a low gross profit on a car or truck sale
.89 4.51 1.85
lets me know when I am generally making low gross profits
.92 4.59 1.80
Self-Efiîcacy
A salesperson’s level of self-efEcacy in the final study was measured with a scale
developed by Chowdhury (1993). The measure is a seven-point Likert-type scale ranging
from “Strongly Disagree” to “Strongly Agree.” The single dimension, seven-item scale
measures a salesperson’s perception that he or she possesses the skills necessary to
successfully perform the job in a personal selling environment. Based on the pretest
analysis of a scale from Jones (1986), the Chowdhury measure replaces the pretest
measure. Item normality and internal consistency for the past performance construct are
discussed in the following sections.
Item Normalitv
Normality probability plots indicated that six of the seven measurement items were
normally distributed. Additionally, the skewness and kurtosis statistics for these five items
are within acceptable ranges of ± 2.57 and ± 3.00 respectively. One item failed to exhibit
normality and was not retained in the final study.
Reproduced with permission of the copyright owner. Further reproduction prohibited without permission.
181
Internal Consistency and Dimensionality
Internal consistency was examined with exploratory factor analysis, Cronbach’s
Alpha measure of reliability, and confirmatory factor analysis. The exploratory factor
analysis utilized principal components factor analysis with varimax rotation. The single
factor solution indicated that the dimension accounted for 43 percent of the variance with
an eigenvalue of 2.55. Four scale items exhibited loadings above .5 while one item was
marginal in its loading (.49) and one item was significantly lower (.45). All six items were
retained for additional analysis.
Reliability was measured with the coefficient alpha statistic, inter-item correlations
and item-to-total correlations. Coefficient alpha for the self-efGcacy scale was .71 (see
Table 7.18). Inter-item correlations ranged from . 19 to .55. Item-to-total correlations
ranged from .34 to .48. All six items were retained at this point.
Several measures from a confirmatory factor analysis were used to evaluate
internal consistency and dimensionality. These measures include composite reliability,
average variance extracted, and standardized item loadings (see Table 7.18 and Table
7.19). . Standardized loadings ranged from .27 to .75. Three items exhibited standardized
loading less than .7 and were not retained. The composite reliability for the remaining
three-item self-efficacy measure was .79, which is in an acceptable range. The average
variance extracted (the amount of variance captured by a construct’s measures relative to
random measurement error) was .55. This three-item self-efficacy scale was retained for
the final model analysis.
Reproduced with permission of the copyright owner. Further reproduction prohibited without permission.

182
Table 7.22
Property Value
Number of items 338.90
Standard Deviation 6.62
Variance 43.77
Coefficient Alpha .78
Composite Reliability .79
Average Variance Extracted .55
Table 7.23Standardized Loadings, Means and Standard Deviations
Items StandardizedLoading
Mean StandardDeviation
I am good at selling cars and/or trucks .73 6.21 0.93It is difficult for me to put pressure on a customer
Not Retained
I know the right thing to do in selling situations .73 5.81 1.01I find it difficult to convince a car or truck buyer that has a different viewpoint fi’om mine
Not Retained
My temperament is not well-suited for selling cars or trucks
Not Retained
1 am good at finding out what car or truck buyers want
.76 6.19 0.92
It is easy for me to get a car or truck buyer to see my point of view
Not Retained
Expectancy
A salesperson’s level of expectancy in the final study was assessed with a scale
adapted fi-om House and Dessler (1973) by Teas (1981). The single dimension, three-item
scale measures the level of expectation a salesperson has for the results of putting a high
level of effort into their work. The measure is a five-point Likert-type scale anchored by
“No Chance” to “Certain to Occur.” The pretest analysis o f the scale indicated that no
Reproduced with permission of the copyright owner. Further reproduction prohibited without permission.

183
modifications to the scale were required. One item, however, was reworded to better fit
the automobile personal selling environment. Item normality and internal consistency for
the expectancy construct are discussed in the following sections.
Item Normalitv
Normal probability plots indicated that all three of the measurement items were
normally distributed. Additionally, the skewness and kurtosis statistics for the items are
within acceptable ranges of ± 2.57 and ± 3.00 respectively. All of the items are retained
for inclusion in the final study.
Internal Consistencv and Dimensionalitv
Internal consistency was examined with exploratory factor analysis, Cronbach’s
Alpha measure of reliability, and confirmatory factor analysis. The exploratory factor
analysis utilized principal components factor analysis with varimax rotation. The single
factor solution indicated that the dimension accounted for 68 percent of the variance with
an eigenvalue of 2.05. All scale items exhibited loadings above .5 and were retained in the
final study.
Reliability was measured with the coefficient alpha statistic, inter-item correlations
and item-to-total correlations. Coefficient alpha for the expectancy scale was .76 (see
Table 7.24). Inter-item correlations ranged from .47 to .55. Item-to-total correlations
ranged from .57 to .64.
Several measures from a confirmatory factor analysis were used to evaluate
internal consistency and dimensionality. These measures include composite reliability,
average variance extracted, and standardized item loadings (see Table 7.24 and Table
7.25). The composite reliability for the expectancy measure was .77, which is in an
Reproduced with permission of the copyright owner. Further reproduction prohibited without permission.

184
acceptable range. The average variance extracted (the amount of variance captured by a
construct’s measures relative to random measurement error) was .53. Standardized
loadings ranged from .68 to .80.
Table 7.24 Psychometric Properties for Expectancy : Final Study
Property Value
Number of items 3Mean 12.91
Standard Deviation 1.81
Variance 3.28
Coefficient Alpha .76
Composite Reliability .77
Average Variance Extracted .53
Table 7.25Standardized Loadings, Means and Standard Deviations
Items StandardizedLoading
Mean StandardDeviation
Increasing your selling efforts and working harder will result in an increase in your unit sales
.68 4.37 0.70
Increasing the time you spend with new potential car or truck buyers will result in more new customers
.70 4.12 0.83
Increasing the time you spend on selling activities will result in an increase in your overall sales attainment
.80 4 36 0.66
Effort
A salesperson’s level of effort in the final study was assessed with a scale adapted
from Hart, Moncrief and Parasuraman (1989). The single dimension, four-item scale
measures the degree to which a salesperson expends effort in a selling job to increase the
quantity and/or quality of work performed. The five-point Likert-type scale ranges from
“Never” to “Always.” The pretest analysis of the scale indicated that no modifications to
Reproduced with permission of the copyright owner. Further reproduction prohibited without permission.

185
the scale were required. Two items, however, were reworded to better fit the automobile
personal selling environment. Item normality and internal consistency for the expectancy
construct are discussed in the following sections.
Item Normalitv
Normality probability plots indicated that all four o f the measurement items were
normally distributed. Additionally, the skewness and kurtosis statistics for the items are
within acceptable ranges of ± 2.57 and ± 3.00 respectively. All of the items are retained
for further analysis.
Internal Consistencv and Dimensionality
Internal consistency was examined with exploratory factor analysis, Cronbach’s
Alpha measure of reliability, and confirmatory factor analysis. The exploratory factor
analysis utilized principal components factor analysis with varimax rotation. The single
factor solution indicated that the dimension accounted for 59 percent of the variance with
an eigenvalue of 2.35. All scale items exhibited loadings above .5 and were retained in the
final study.
Several measures from a confirmatory factor analysis were used to evaluate
internal consistency and dimensionality. These measures include composite reliability,
average variance extracted, and standardized item loadings (see Table 7.26 and Table
7.27). Standardized loadings ranged from .58 to .75. One item exhibiting a low
standardized loading was not retained. A second item exhibiting a marginally low
standardized loading was retained to maintain a three-item scale. The composite reliability
for the revised three-item effort measure was .76, which is in an acceptable range. The
Reproduced with permission of the copyright owner. Further reproduction prohibited without permission.

186
average variance extracted (the amount of variance captured by a construct’s measures
relative to random measurement error) was .52.
Reliability was measured with the coeflScient alpha statistic, inter-item correlations
and item-to-total correlations. Coefficient alpha for the effort scale was .76 (see Table
7.26). Inter-item correlations ranged fi’om .42 to .59. Item-to-total correlations ranged
fi’om .55 to .59.
Table 7.26
Property Value
Number of items 3Mean 17.42
Standard Deviation 2.05
Variance 4.22
Coefficient Alpha .76
Composite Reliability .76
Average Variance Extracted .52
Table 7.27Standardized Loadings, Means and Standard Deviations
Items StandardizedLoading
Mean StandardDeviation
How often do you work harder to increase your sales results?
.60 4.33 0.71
How often do you increase the amount of work you do in any given week?
Not Retained
How often do you perform the most professional job you are capable of performing?
.78 4.54 0.59
How often do you make sure your sales job is considered top quality by your sales manager?
.76 4.60 .62
Adaptive Selling
Thirteen items from the adaptive selling measure developed by Spiro and Weitz
(1990) were used in the final study to measure the extent to which salespeople practice
Reproduced with permission of the copyright owner. Further reproduction prohibited without permission.

187
adaptive selling - altering sales presentations across and during customer interactions in
response to the perceived nature of a sales situation. The pretest scale exhibited three
dimensions: (1) recognition that different sales approaches are needed for different
customers; (2) confidence in one’s ability to use a variety of approaches; and (3) actual
use of different selling approaches. Seven of the pretest items were reworded in the final
study for a better fit personal selling context and for clarity. The seven-point Likert-type
scale was anchored with “Strongly Disagree” and “Strongly Agree.” Item normality and
internal consistency for the adaptive selling construct in the final study are discussed in the
following sections.
Item Normalitv
Normal probability plots indicated that the 11 of the 13 measurement items were
normally distributed. Additionally, the skewness and kurtosis statistics for these 11 items
were within acceptable ranges of ± 2.57 and ± 3.00 respectively. Two items exhibited a
departure from normality and were not retained for additional analysis.
Internal Consistencv and Dimensionalitv
Internal consistency of the 10 remaining items was examined with exploratory
factor analysis, Cronbach’s Alpha measure of reliability, and confirmatory factor analysis.
The exploratory factor analysis utilized principal components factor analysis with varimax
rotation. Exploratory factor analysis extracted three dimensions to the adaptive selling
construct: (1) recognition that different sales approaches are needed for different
customers and does alter approaches (adapts); (2) does not alter sales approaches (does
not adapt); and (3) difficult to adapt (difficult). Eigenvalues for the three factors were
4.34, 1.45 and 1.00 respectively. The three factors accounted for 62 percent of the
Reproduced with permission of the copyright owner. Further reproduction prohibited without permission.

188
adaptive selling construct’s variance. All scale items exhibited factor loadings above .5.
One item relating to “difficult to adapt,” however, cross-loaded on two dimensions and
was not retained for additional analysis in the final study.
Reliability was measured with the coefficient alpha statistic, inter-item correlations
and item-to-total correlations. Coefficient alpha for the three dimensions of the adaptive
selling scale were .82, .66 and .83 respectively (see Table 7.28). Inter-item correlations
ranged fi'om .26 to .59 across the three dimensions. Item-to-total correlations ranged
fi"om .38 to .66 across the three factors.
Several measures from a confirmatory factor analysis were used to evaluate
internal consistency and dimensionality. These measures include composite reliability,
average variance extracted, and standardized item loadings (see Table 7.28 and Table
7.29). The composite reliabilities were .82 for the “adapts” factor and .68 for the “does
not adapt” factor. Only one item loaded on the third factor, “difficult,” and composite
reliability was not calculated. The average variance extracted (the amount of variance
captured by a construct’s measures relative to random measurement error) was .44 for the
“adapts” factor and .44 for the “does not adapt” factor. Standardized loadings ranged
from .31 to .83 across these two dimensions. Due to low standardized loadings (less than
.60), two items in factor one and one item in factor two were not retained for additional
analysis in the final study. Additionally, only a single item loaded on factor three. As a
result of these low loadings and low scale reliabilities, a single factor measure of adaptive
selling (adapts) with five items was retained for final model analysis. Psychometric
properties and standardized loadings for adaptive selling are summarized in Table 7.28 and
Table 7.29.
Reproduced with permission of the copyright owner. Further reproduction prohibited without permission.

189
Table 7.28
Property Adapts Does Not DifficultNumber of Items 6 3 1Mean 35.10 12.62 4.83Standard Deviation 5.75 4.65 1.88Variance 33.03 21.67 3.54Coefficient Alpha .82 .66 -
Composite Reliability .82 .68 -
Average Variance Extracted .44 .43 -
Table 7.29Standardized Loadings, Means and Standard Deviations
For Adaptive Sellin g: Final StudyItems Standardized
LoadingMean Standard
DeviationAdaptsI am confident that I can effectively change my sales approach when necessary
.73 5.99 1.13
Based on the customer I am working with, I am very flexible in the selling approach I can use
.73 5.93 1.24
When I feel that my sales approach is not working with a customer, I have the ability to change my approach
.61 6.05 1.12
I believe that customers are different and that I must use different sales approaches with different car or truck buyers
.70 5.70 1.47
Each car or truck buyer is different and requires a different sales approach
.61 5.87 1.54
I vary my sales approach from customer situation to customer situation
.57 5.56 1.43
Does not adaptI do not usually change my sales approach from one customer to another
.83 4.51 2.01
The same sales approach works for most car or truck buyers
.63 4.62 1.95
I treat all customers pretty much the same .46 3.49 2.09DifficultI find it difficult to adapt my selling style to certain customer
- 4.83 1.88
Reproduced with permission of the copyright owner. Further reproduction prohibited without permission.

190
Current Performance
A salesperson’s level of current performance in the final study was measured with
a scale adapted from Behrman and Perreault. (1982). The single dimension, six-item scale
is a self-report measure that assesses a salesperson’s performance in the current year.
Responses on the five-point Likert-type scale can range from “Far Below My Objectives”
to “Far Above My Objectives.” The pretest analysis of the scale indicated that no
modifications to the scale were required with the exception of the reporting year being
changed. Item normality and internal consistency for the past performance construct are
discussed in the following sections.
Item Normalitv
Normal probability plots indicated that the five measurement items were normally
distributed. Additionally, the skewness and kurtosis statistics for these five items are
within acceptable ranges of ± 2.57 and ± 3.00 respectively.
Internal Consistencv and Dimensionalitv
Internal consistency was examined with exploratory factor analysis, Cronbach’s
Alpha measure of reliability, and confirmatory factor analysis. The exploratory factor
analysis utilized principal components factor analysis with varimax rotation. The single
factor solution indicated that the dimension accounted for 73 percent of the variance with
an eigenvalue of 3.65. All five scale items exhibited loadings above .5 and were retained
for additional analysis.
Several measures from a confirmatory factor analysis were used to evaluate
internal consistency and dimensionality. These measures include composite reliability,
average variance extracted, and standardized item loadings (see Table 7.30 and Table
Reproduced with permission of the copyright owner. Further reproduction prohibited without permission.

191
7.31). Standardized loadings ranged from .58 to .91. One item exhibited a low
standardized loading and was not retained. The composite reliability for the revised four-
item current performance measure was .92, which is in an acceptable range. The average
variance extracted (the amount o f variance captured by a construct’s measures relative to
random measurement error) was .75.
Reliability was measured with the coefficient alpha statistic, inter-item correlations
and item-to-total correlations. Coefficient alpha for the current performance scale was .91
(see Table 7.30). Inter-item correlations ranged from .66 to .83. Item-to-total
correlations ranged from .76 to .84.
Table 7.30
Property ValueNumber of items 4Mean 12.89Standard Deviation 4.35Variance 18.96Coefficient Alpha .92
Composite Reliability .92
Average Variance Extracted .75
Table 7.31Standardized Loadings, Means and Standard Deviations
Items StandardizedLoading
Mean StandardDeviation
Your level of dollar sales in 1997 .92 2.44 1.06Number of units you sold in 1997 .86 2.44 1.02Your overall sales techniques in 1997 Not RetainedYour sales commissions in 1997 .90 2.43 1.05Your sales commission increases over the last 6 months in 1997
.79 2.64 1.09
Reproduced with permission of the copyright owner. Further reproduction prohibited without permission.

192
Discriminant Validity
Discriminant validity between the model constructs in the final study was examined
with two methods. First, the confidence intervals around the correlations between
constructs were examined for the presence of a “ 1” (Bagozzi and Phillips 1982). The
presence o f a “ 1” is an indication that two constructs are highly correlated and do not
exhibit discriminant validity. To assess the confidence intervals, a confirmatory factor
analysis was utilized treating each construct (with single summed scale indicators) as
independent, correlated variables. In this evaluation, each factor for constructs with
multiple dimensions was treated as a separate construct. The phi estimates between
constructs along with the confidence intervals are reported in Appendix C.
Discriminant validity between model constructs was also assessed by comparing
the squared correlation between two constructs with the lesser o f the two variances
extracted related to the constructs. For discriminant validity, the squared correlation
should be less than the lesser variance extracted (Fomell and Larcker 1981). With the
exception o f constructs that represent multiple factors of a single scale, no confidence
intervals around the correlations between model constructs include a value of “ 1.”
Additionally, all squared correlations are less then the lesser variance extracted for any
two constructs. Thus, all model constructs are considered to exhibit discriminant validity.
Reproduced with permission of the copyright owner. Further reproduction prohibited without permission.
CHAPTERS
STRUCTURAL MODEL AND HYPOTHESES EVALUATIONS
Introduction
This chapter reviews the initial evaluation of the proposed structural model,
respecification of the proposed model, and evaluations of the hypotheses. Included is a
summary of the procedures and criteria used to evaluate the proposed structural model
along with an evaluation of a respecified model. Hypotheses are examined within the
context of the proposed model. Additionally, a submodel examines a particular area of
interest, modeling the behaviors of others.
Structural Model Evaluation
The proposed structural model was estimated using LISREL 8 with a correlation
matrix as input (see Appendix B). A correlation matrix was considered to be appropriate
for this study since the objective of the research was to understand the pattern of
relationships existing between the model constructs, not to examine total variances of
model constructs (Hair et al. 1992). A two-step approach (Anderson and Gerbing 1988)
was used whereby the measurement model was estimated in one stage and the structural
model was estimated and respecified in a second stage. Results of the estimation of the
measurement model in the final study was reported in Chapter 7. From these analyses, it
was determined that eight model constructs (self-monitoring, task specific self-esteem,
coworker acceptance, past performance, self-esteem, expectancy, effort, and current
performance) would be represented with a single item, summed scale indicator. Lambda
loadings for each of these single item indicators were set to the square root of the scale’s
composite reliability. Associated error terms for each of these single item indicators were
193
Reproduced with permission of the copyright owner. Further reproduction prohibited without permission.
194
set to (1 - composite reliability of the scale). Two constructs with two dimensions
(modeling and adaptive selling) were represented with two single item, summed scale
indicators. Lambda loadings for these two constructs were set to the square root of the
composite reliabilities for the scales and associated errors for each of the summed
indicators were set to (1 - composite reliability). Four model constructs (role conflict, role
ambiguity, coworker feedback, and manager feedback) were multi-dimensional with three
dimensions each. For coworker feedback and manager feedback, only the single factors of
interest (positive feedback) were included in the final model analysis and were represented
with single item summed scales. Lambda loadings for these single factor constructs were
set at the square root of the scales composite reliabilities. Associated errors for the
summed indicators were set to (1 - composite reliability).
For each of the two multidimensional, three-factor scales (role conflict and role
ambiguity), two second-order models, one with the gamma paths fi-ee and one with the
gamma paths equated, were estimated to assess the equality of chi-square between the two
measurement models. Nearly equal chi-squares (for both role conflict and role ambiguity)
indicated that a single averaged indicator across the three factors could be used to
represent the constructs. Lambda loadings for these two constructs were set to the square
root of the composite reliability for each second order construct and associated errors
were set to 1 - the composite reliability of each construct. The proposed structural model
was evaluated as follows.
Measures of both overall fit and structural fit were used to evaluate the proposed
model. Overall fit, using multiple criteria (Bagozzi and Yi 1989; Bollen 1990) was
assessed across several fit indices (e.g., GFI, AGFI, NNFI and CFI). Indices of at least
Reproduced with permission of the copyright owner. Further reproduction prohibited without permission.

195
.90 are considered to be acceptable (Bollen 1990). To evaluate structural fit, the
parameters of the model and for the structural equations were examined. Model paths
with t-values greater than 1.65 were considered to be significant at the .05 level. The
value represents the amount of variance explained in the endogenous constructs. R
values greater than .50 were desirable. Results of the evaluation of the structural model
are reported in the following sections.
Overall Model Fit
The structural model (see Figure 8.1) was evaluated with LISREL 8 to compute fit
indices and to examine overall model fit. Overall fit indices for the proposed structural
model are presented in Table 8.1. As indicated, the fit statistics for the proposed model
are very low, certainly not above the targeted .90 level. Absolute fit statistics (GFI,
AGFI, and RMSEA) suggest that the structural model does not fit the data. Relative fit
statistics (CFI, NFI, and NNFI) suggest that the structural model can be respecified in
order that a better fit to the data is achieved. To examine areas for possible
respecification, the structural fit of the proposed model was assessed.
Table 8.1Structural Model Fit Statistics
Measures of Fit Structural ModelGoodness of Fit (degrees of freedom) 430.43 (68) p=.00
on 0.83AGFI 0.66Comparative Fit Index (CFI) 0.78Non-Normed Fit Index (NNFI) 0.61Normed Fit Index (NFI) 0.76Root Mean Square Error of Approximation (RMSEA)
0.13
Reproduced with permission of the copyright owner. Further reproduction prohibited without permission.

CD■ DOQ.C
gQ.
■DCD
C/)C/)
8■D
CD
3.3"CD
CD■DOQ.C
aO3"Oo
CDQ.
■DCD
C/)C/)
Self-Monitoring
Self-Esteem
ModelingCoworkerAcceptance
RoleConflict
AdaptiveSellingSelf-Efficacy
RoleAmbiguity
CurrentPerformance
PastPerformance
EffortExpectancyCoworkerFeedback
ManagerFeedback Figure 8.1
Social Cognitive Theory Structural Model
197
Structural Model Fit
The structural model fit was assessed with two criteria; (1) statistical significance
of model path coefficients; and (2) the amount of variance explained (R^) in the
endogenous constructs. Statistical significance of the model path coefficients was
determined by comparing the t-values of the path estimates to a t-value o f 1.65.
Estimated path values greater than 1.65 were considered significant at p<.05. Table 8.2
lists the path estimates and t-values for each of the paths in the proposed structural model.
Ten of the seventeen paths were determined to be significant at the .05 level. Of the seven
paths found not to be significant, one was related to modeling and its effect on a
salesperson’s level of self-efficacy. This suggests that modeling the behaviors of other
salespeople may not have as great an effect on how sales people feel regarding their
abilities to successfully perform selling tasks as was hypothesized. Additionally, the path
between coworker feedback and self-efficacy was not significant. This suggests, that
compared to the effect of manager feedback, coworker feedback is much less important in
its effect on a person’s level of self-efficacy. The non-significance between adaptive
selling and a person’s level of current performance suggests that the ability to adapt to
individual customers does not have an impact on performance. The current performance
measure, however, was surveyed in the early part of 1998, a time of the year in which
vehicle sales are historically slow leading to sales performance somewhat less than the
average performance throughout the year. Additionally, this lack of a significant effect
might be due to the study context of auto salespeople. Potential auto buyers might have
different reasons for buying a particular auto, but the buyers tend to be homogenous in
Reproduced with permission of the copyright owner. Further reproduction prohibited without permission.

198
that the overriding reason for buying is most likely transportation and customer styles
require very little adaptation in selling styles by salespeople.
Table 8.2
Path Estimate t-valueSelf-monitoring -> Modeling .18 3.20'Task-specific Self-esteem ->■ Modeling -.15 2.91'Coworker Acceptance -> Modeling .21 3.67'Modeling Self-efficacy .03 0.66Role Conflict -> Self-efficacy -.04 -0.59Role Ambiguity -*■ Self-efficacy .75 12.72'Past Performance -*■ Self-efficacy .05 111Coworker Feedback -> Self-efficacy -.02 -0.30Manager Feedback -> Self-efficacy .12 2.03'Coworker Feedback -> Expectancy .02 0.30Manager Feedback -*■ Expectancy .13 1.86'Self-efficacy -> Expectancy .23 3.68'Self-efficacy -^Adaptive Selling .20 3.89'Self-efficacy —>■ Effort .48 8.35'Expectancy -* Effort .30 4.92'Adaptive Selling -*■ Current Performance .02 0.40Effort -^Current Performance .09 1.46
p<.05
The second method used to assess structural fit was R , representing the amount of
explained variance associated with the dependent relationships in the model. Table 8.3
summarizes the values for the six endogenous constructs. The R^ for effort and for
current performance (.60 and .64 respectively) were high, while the variance explained for
modeling was acceptable (.50). The variances explained for self-efficacy, expectancy, and
adaptive selling (.45, .28, and .42) were not as high as would be desirable (>.50).
Table 8.3for Structural Equations
Endogenous Construct for Structural EquationsModeling .50Self-Efficacy .45Expectancy .28Adaptive Selling .43Effort .60Ciurent Performance .64
Reproduced with permission of the copyright owner. Further reproduction prohibited without permission.

199
Overall model fit, which was very low, and evaluations of the model path estimates
indicate that possible respecification of the model could possibly yield a better fit to the
data. While standardized item loadings were assessed for possible modifications (Table
8.4), the loadings were all acceptable since they were valued at the square root of a scale’s
alpha coefficient. Thus, a primary source of potential modifications to the model are in
the model paths.
Table 8.4
Summed Scale Item StandardizedLoading
Self-monitor .93Task specific self-esteem .94Coworker acceptance .92Modeling
Model-observe .95Model-utilize .94
Role conflict .77Role ambiguity .81Past performance .97Coworker feedback
Coworker-good .73Coworker-poor .71Coworker-approach .73
Manager feedbackManager-good .82Manager-behavior .79Manager-treatment .75
Self-efficacy .88Expectancy .92Adaptive selling
Adapt-vary approach .82Adapt-difhcult to vary .85
Effort .87Current performance .95
Model Respecification
Based on an evaluation of the model, modifications were deemed necessary in the
structural model. The two criteria used to examine possible respecification were
Reproduced with permission of the copyright owner. Further reproduction prohibited without permission.

200
modification indices and residuals. Modification indices were calculated for each
parameter not estimated in the model. These modification indices indicated the reduction
in model chi-square possible if paths were added to the model. Residuals, indicative of
prediction error, highlight areas in which the projected correlation matrix did not equal the
correlation matrix derived from the survey data. A modification index of 3.84 or above is
considered to be significant (p<.05). A residual of 2.58 or greater is considered to be
significant. The modification indices and residuals (Table 8.5) suggest that a better model
fit could be achieved by repecifying the model in three areas: (1) removing the modeling
construct and replacing the modeling - self-efficacy path with three direct paths from self
monitoring, self-esteem, and coworker acceptance to self-efficacy; (2) deleting the current
performance construct from the model; and (3) adding three additional paths to the model
(self-monitoring -> adaptive selling, coworker acceptance -> expectancy, and role
ambiguity -> effort).
Table 8.5 Modification Indices and Residuals
Model Path Modification Index ResidualSelf-monitor -> Self-efificacy 19.35 3.50Task specific self-esteem -> Self-efficacy 45.21 6.70Coworker acceptance —> Self-efficacy 18.06 3.95Self-monitor -> Adapts 42.95 9.99Coworker acceptance -> Expectancy 2.51 1.97Role ambiguity -> Effort 30.36 5.79
Such modifications should be made, however, only when the changes can be
conceptually supported. In this case, it is felt that the model respecifications are
appropriate for several reasons. First, a person who closely monitors his or her activities
and performance results could develop higher levels of self-efficacy by adjusting activities
Reproduced with permission of the copyright owner. Further reproduction prohibited without permission.

201
to more closely coincide with coworkers who achieve superior outcomes through specific
job activities. Such an individual is, in fact, modeling the behaviors of other successful
salespeople they work with. Second, a person high in task-specific self-esteem should
exhibit a more positive perception of self-efificacy since the individual believes his or her
results, quality o f work, ability to reach sales goals, and potential for reaching the top in
sales volume are high when compared to other salespeople in an organization. Third,
individuals who feel they are accepted by their work group could feel that they have the
capability to successfully perform a job since any group of coworkers is usually reluctant
to include poor performers in a social group.
The three respecifications are examined in three stages. In the first respecification
(see Figure 8.2), the three suggested direct paths from self-monitoring, self-esteem, and
coworker acceptance to self-efificacy were added to the model while retaining the
modeling - self-efificacy relationship. The respecification resulted in a reduction in chi-
square from 430.43 to 410.92 (see Table 8.6) with the same number of model constructs.
This suggests that modeling does not mediate the effects of the three constructs on self-
efificacy and can be removed from the model.
In the second respecification (see Figure 8.3), the modeling construct was
removed, retaining the three direct paths from self-monitoring, self-esteem, and coworker
acceptance to self-efificacy. A further reduction in chi-square from 410.92 to 174.28 (see
Table 8.6) provides additional evidence that modeling does not mediate the relationships
and has no significant effect on a salesperson’s level of self-efificacy.
In the third respecification (see Figure 8.4), the additional model modifications
(deleting the current performance construct and adding three additional model paths) were
Reproduced with permission of the copyright owner. Further reproduction prohibited without permission.

CD■ DOQ.C
gQ.
■DCD
C/)C/)
8■D
CD
3.3"CD
CD■DOQ.C
aO3"OO
CDQ.
■ DCD
C/)C/)
Scif-Monitoring
Sclf-Estccm
ModelingCoworkerAcceptance
RoleConflict
AdaptiveSellingRole
AmbiguityCurrent
PerformancePast
PerformanceEffortExpectancy
CoworkerFeedback
ManagerFeedback Figure 8.2
Respecified Model 1 tos

CD■ D
OQ.C
gQ.
■ DCD
C/)C/)
CD
8■D( O '
3.3"CD
CD■DOQ.C
aO3"OO
CDQ.
■DCD
(/)(/)
ScIf-Monitoring
Sclf-Estccm
CoworkcrAcceptance
RoleConflict
RoleAmbiguity
PastPerformance
CoworkerFeedback
ManagerFeedback
AdaptiveSelling
Self-Efficacy
CurrentPerformance
Expectancy Effort
Figure 83Respect Fied Model 2
§

CD■ D
OQ.C
gQ.
■DCD
C/)C/)
8■D( O '
3.3"CD
CD■DOQ.C
aO3"OO
CDQ.
■DCD
(/)(/)
Scif-Monitoring
Self-Esteem
CoworkcrAcceptance
Expectancy
RoleConflict
Self-EfficacyEffort
RoleAmbiguity
AdaptiveSellingPast
Performance
CoworkerFeedback
ManagerFeedback Figure 8.4
Respecified Model 3
g

205
examined for their effects on overall model fit. These model respecifications resulted in an
additional reduction in chi-square firom 174.28 to 34.25 (see table 8.6). With the
modeling and current performance constructs removed and the three additional paths
included in the structural model, the final respecified model provided a better overall fit to
the data. The for the primary construct of interest, self-efficacy, is .62. The for the
endogenous constructs is summarized in Table 8.7. Of the 15 paths in the respecified
structural model, eight are statistically significant (see Table 8.8).
Table 8.6
Measures of Fit
ProposedModel
Respecified Model 1
Respecified Model 2
Respecified Model 3
430.43 (68) p=.00 410.92(65) p=.00 174.28 (38) p=.00 34.25 (29) p=.23GFI .83 .83 .93 .98A on .66 .66 .81 .94CFI .78 .79 .89 1.00NNFI .61 .61 .73 .99NFI .76 .77 .87 .97RMSEA .13 13 .11 .03
Table 8.7for Endogenous Constructs: Respecified Structural Mode
Endogenous Construct R*Self-efficacy .62Expectancy .10Effort .28Adaptive selling .39
Table 8.8
Path Estimate t-valueSelf-monitor -> Self-efficacy .09 1.46Self-monitor -» Adaptive selling .48 7.35"Esteem -> Self-efficacy .30 5.15Coworker acceptance Self-efficacy .09 1.39Coworker acceptance -> Expectancy .11 1.46Role conflict —> Self-efficacy -.08 -1.14Role ambiguity ->■ Self-efficacy .56 5 97'Role ambiguity -> Effort .36 2.41"Past performance -> Self-efficacy .00 0.01
(table com.)
Reproduced with permission of the copyright owner. Further reproduction prohibited without permission.

206
Coworker feedback -> Self-efBcacy .13 1.68'Manager feedback -> Self-efficacy .06 1.02Self-efficacy Expectancy .20 2 61'Self-efficacy -> Effort .14 1.36Self-efficacy Adaptive selling .23 3AYExpectancy -*■ Effort .29 4.49'
p = , .05
The final respecified structural model along with path estimates is depicted in Figure 8.5.
Evaluation of Hypotheses
In the structural model, as originally proposed, seventeen hypotheses were tested.
The acceptance of each hypothesis was based on the statistical significance of the
hypothesis’ related model path and the direction (positive or negative) of the relationship
between constructs. Eight of the model paths were found to be statistically significant,
thus eight hypotheses were accepted. Each hypothesis is discussed in the following
sections.
Modeling
The first three hypotheses examined a salesperson’s modeling of coworkers’ sales
behaviors to leam more effective sales methods leading to better outcomes of selling
efforts. The first hypothesis was defined as
H I: An individual’s level of self-monitoring will be positively associatedwith one’s level of modeling behavior.
In the proposed model, the path estimate of .18 was significant (t-value = 3.20). In the
respecified model, however, the modeling construct along with this model path was
removed. Thus, this hypothesis was not supported and a person’s level of self-monitoring
did not appear to have a positive effect on the level of behavior modeling.
It was also hypothesized that an individual’s level of self-esteem (task specific)
would have a positive effect on a person’s level o f behavior modeling. Salespeople who
Reproduced with permission of the copyright owner. Further reproduction prohibited without permission.

CD■ DOQ.C
gQ.
■DCD
C/)C/)
8■D
CD
3.3"CD
CD■DOQ.C
aO3"Oo
CDQ.
■DCD
C/)C/)
.48Scir-Monitoring
.09
Sclf-Estccm .30*
.11CoworkcrAcceptance .09 Expectancy .29*
-.08 .20*RoleConflict .14*Self-Efflcacy Effort.56* .23*Role
Ambiguity .36*
AdaptiveSellingPast
Performance
.13.
CoworkcrFeedback
.06,
ManagerFeedback Figure 8.5
Respecified Social Cognitive Theory Model
208
feel good about the job they do and their results relative to other salespeople in an
organization should observe the sales behaviors of these coworkers to solidify their
memberships in the workgroups. This hypothesis was defined as
H2: An individual’s level of self-esteem will be positively associated withone’s level of modeling behavior.
In the proposed model, the path estimate of -.15 as significant (t-value = -2.91). The
effect, however, was negative rather than positive indicating that a person with a higher
level of task-specific self-esteem will exhibit less modeling behaviors. Additionally, this
path was not retained in the respecified model. Thus, this hypothesis was rejected and
self-esteem is not supported, in the revised model, as having a positive effect on one’s
modeling of others’ behaviors.
It was also hypothesized that a person’s level of acceptance by coworkers in an
organization would be positively related to one’s behavior modeling activities. This
hypothesis was defined as
H3: An individual’s level of acceptance by other task-group memberswill be positively associated with one’ level of modeling behavior.
In the proposed model, the path estimate of .21 was statistically significant (t-value =
3.67). In the respecified model, however, this path was not retained. Thus, the hypothesis
that coworker acceptance is positively associated with one’s modeling activities is not
supported.
In the exploratory model, acceptance by one’s coworkers was found to have a
significant effect (path estimate = .32 and t-value = 3.13) on a person’s modeling activities
while both self-monitoring (path estimate = .08 and t-value = .77) and self-esteem (path
estimate = -.04 and t-value = -.77) were found to have no significant effects on behavior
Reproduced with permission of the copyright owner. Further reproduction prohibited without permission.

209
modeling activities. This exploratory submodel is discussed in more detail in the Future
Research section.
Self-Efficacy
The second set of hypotheses related to a person’s level of self-efBcacy and
perception that he or she had capabilities to successfully perform a sale’s task. This set of
hypotheses examined the effects of six antecedent constructs on self-efBcacy. The first
hypothesis was defined as
H4: Modeling others’ successful behaviors in a given task will bepositively associated with an individual’s assessment of their level of self-efficacy.
In the proposed model, the path estimate of .03 was not statistically significant (t-
value = .66) In the respecified model, the path was not retained. Thus, the hypothesis
that one’s modeling activity has a positive effect on self-efficacy is not supported,
indicating there are other factors affecting a person’s level of self-efficacy.
In addition, it was hypothesized that an individual’s level of role conflict will
exhibit a positive relationship to self-efficacy. This relationship was hypothesized to be
positive because higher scores on the role conflict measure indicate higher levels of
agreement between a salesperson and job requirement resulting in less role conflict. This
hypothesis was defined as
H5: An individual’s perceived level of agreement with others’expectations of job activities will be positively associated with one’s level of perceived self-efficacy.
The path estimate of -.08 was not statistically significant (t-value = -1.14). ffigh levels of
agreements between an individual and job requirements did not appear to have an effect
on self-efficacy. Additionally, the relationship, being negative, was in the opposite
Reproduced with permission of the copyright owner. Further reproduction prohibited without permission.

210
direction of that hypothesized. Intuitively, it seems that such agreement might have no
effect on self-efficacy since such disagreements related to job requirements seem to have
little effect on more veteran salespeople high in their perceived abilities to perform well.
Thus, this hypothesis is not supported.
The sixth hypothesis related to the effect of role ambiguity on one’s level of self-
efficacy suggesting that role ambiguity will have a positive effect on self-efficacy. Again,
as with role conflict, a positive effect was hypothesized because higher scores on the role
ambiguity measure indicated higher levels of a salesperson’s certainty regarding different
aspects of the sales job. This hypothesis was stated as
H6: An individual’s perceived level of understanding of job activitieswill be positively associated with one’s level of perceived self-efficacy.
The path estimate of .56 was highly significant (t-value = 5.97). Higher levels of certainty
regarding functions of the selling task were associated with higher levels o f self-efficacy.
Salespeople that have a clear understanding of how a sales job is to be performed, in terms
of job activities, tend to exhibit a greater perception that they have the capabilities to
successfully perform the job. It appears that such an understanding allows salespeople to
match specific selling skills with certain functional job requirements. Thus, the hypothesis
is empirically supported.
It was also hypothesized that salespeople who had experienced successful sales
performance in the past year would feel they had the capability to successfully perform the
sales job in the future, exhibiting higher levels o f self-efficacy. This hypothesis was
defined as
Reproduced with permission of the copyright owner. Further reproduction prohibited without permission.

211
H7: Successful past performance of a given task will be positivelyassociated with an individual’s assessment of their level of self-efficacy.
The beta path estimate of .00 was certainly not statistically significant (t-value = 0.01)
indicating a lack of support for this hypothesis. Past sales performance did not appear to
affect a salesperson’s feeling that he or she had the capability to successfully perform the
sales job. This lack of a significant finding could be due to the tendency of the salespeople
in the survey to attribute poor performance to external factors rather than to their own
ability to successfully perform the sales job. In conversations with some respondents,
many felt that poor performance was a result of a dealership not performing activities to
draw potential vehicle buyers into the firm (e.g., adequate advertising). Thus, this
hypothesis was rejected.
It was also hypothesized that positive feedback from a salesperson’s fellow
salespeople and sales manager would have positive effects on the salesperson’s perceived
capabilities to successfully perform the sales job. That is, the more that coworkers
(salespeople and sales managers) indicated to a salesperson that he or she was doing the
right kind of sales job, the more a salesperson would believe that he or she was capable of
good performance. The two hypotheses were defined as
H8: Positive feedback from coworkers regarding an individual’s taskperformance will he positively associated with one’s level of self-efficacy.
H9: Positive feedback from managers regarding and individual’s taskperformance will he positively associated with one’s level of self-efficacy.
For the effect of feedback from coworkers on one’s level of self-efficacy, the
gamma parameter estimate o f . 13 was significant (t-value = 1.68). Positive feedback from
Reproduced with permission of the copyright owner. Further reproduction prohibited without permission.

212
coworkers had a positive effect on a person’s level of self-efBcacy. Thus, this hypothesis
was supported.
The path estimate related to the effect of feedback from sales managers on levels
of self-efficacy was .06 and was statistically significant (t-value = 1.02). Thus, the
hypothesis regarding manager feedback was not accepted. This lack o f a significant
finding is somewhat surprising given the positive results from past studies (e.g., Kohli and
Jaworski 1994). It may be due, however, to the context of the study. In most of the
participating vehicle dealerships, there was not a strong manager-employee relationship
between sales managers and salespeople. The primary task of these sales managers was to
promote sales of specific vehicle types, not to directly manage the day-to-day activities of
salespeople. With such weak management relationships, it would appear that feedback
from managers is not extremely important in building self-confidence in salespeople. It is
possible that salespeople in the dealerships had much closer bonds to their immediate
cohorts than to managers.
Expectancy
The next set of hypotheses related to a person’s level of expectancy regarding job
outcomes based on an individual’s level of self-efficacy and positive feedback from both
fellow salespeople and sales managers. This set of hypotheses examined the effects of
three antecedent constructs on expectancy. The first hypothesis was defined as
HIO: Positive feedback from coworkers regarding an individual’s task performance will be positively associated with one’s level of expectancy regarding outcomes of a given task.
This hypotheses states that input from one’s fellow salespeople that he or she is
doing the right sales job (i.e., performing the right activities) and that their fellow
Reproduced with permission of the copyright owner. Further reproduction prohibited without permission.

213
salespeople appreciate the good results being achieved, the salesperson should exhibit a
perception that doing the right things will lead to good outcomes in the job. In the
structural model, as originally proposed, the gamma estimate was -.05 indicating a
negative effect of coworker feedback on expectancy. The estimate was not, however,
significant (t-value = -.62). In the respecified model, this path was not retained and it
appeared that coworker feedback indirectly had an effect on expectancy through self-
efBcacy. Thus, the hypothesis was not supported.
The next hypothesis suggested that positive feedback from sales managers
regarding a salesperson’s sales activities and outcomes will result in a salesperson
developing higher expectations that the activities will result in good outcomes. This
hypothesis was stated as
H ll: Positive feedback from managers regarding an individual’s task performance will be positively associated with one’s level of expectancy regarding outcomes of a given task.
The path estimate related to this hypothesis was .06 in the respecified model and
was not statistically significant (t-value = 1.02). Thus, the hypothesis was not accepted.
As with job feedback from coworkers, feedback from managers appeared to have, rather
than a direct effect, an indirect effect, through self-efficacy, on a salesperson’s level of
expectancy regarding job outcomes. As discussed earlier, however, the effect of manager
feedback on one’s self-efficacy was not significant. Again, this lack of a significant finding
could be due to the weak manager-salesperson relationships existing in most of the
respondent dealerships.
The next hypothesis was indicative of the relationship between self-efficacy and
expectancy. This hypothesis suggested that a salesperson’s level of self-efficacy would
Reproduced with permission of the copyright owner. Further reproduction prohibited without permission.

214
have a positive effect on that person’s level o f expectancy. Thus, this hypothesis was
expressed as
H12: An individual’s level of self-efficacy will be positively associated with one’s level of expectancy regarding outcomes of a given task.
The beta path estimate of .20 was statistically significant (t-value = 2.61) indicating that
salespeople holding perceptions that they have the capabilities to perform their sales jobs
successfully will have higher levels of expectancy, believing that their efforts will pay off in
higher levels of sales performance. Thus, this hypothesis was supported.
Adaptive Selling
Adaptive selling was the ability of salespeople to adapt their selling styles (or
methods) to better fit specific potential buyers or customer situations. It was hypothesized
that adaptive selling would be a direct function of self-efficacy. Salespeople with higher
levels of beliefs in their capabilities should be more willing to try different sales
techniques/presentations to address specific customer situations. This hypothesis was
expressed as
H13: An individual’s level of self-efficacy will be positively associated with one’s practice of adaptive selling in a specific selling situation.
In the respecified structural model, the beta path estimate of .23 was statistically
significant (t-value = 3.47). Thus, the hypothesis was supported. A salesperson’s level of
self-efficacy did have a positive effect on that salesperson’s willingness to vary his or her
sales approach based on different customer situations. More confident salespeople
exhibited a greater ability to adapt sales presentations to specific customer situations.
Reproduced with permission of the copyright owner. Further reproduction prohibited without permission.

215
Effort
Effort was defined as the activity of working both longer and harder on a task to
achieve better outcomes. It was hypothesized that salespeople would exert more effort in
their selling tasks if, first, they were confident they had the abilities to successfully perform
the selling tasks, and second, they held high levels of expectancy that such extra efforts
would pay off in higher outcome levels. The first hypothesis regarding effort was
expressed as
H14: An individual’s level of self-efficacy will be positively associated with one’s level of effort in a given task.
The beta parameter estimate for the relationship between self-efficacy and effort
was . 14. The path estimate was not statistically significant (t-value = 1.36) indicating that
self-efficacy did not result in higher levels of effort in the selling task. The path estimate,
however, was only marginally non-significant. Thus, the hypothesis was marginally
supported. These was some indication that the level of self-efficacy does have a slight,
positive relationship to the level of effort.
It was also hypothesized that the level of effort in a selling task will be positively
associated with the level of expectancy. When salespeople hold expectancies that efforts
will result in good outcomes, the salespeople will work harder and longer at selling tasks.
This hypothesis was stated as
HIS: An individual’s level of expectancy regarding expected task outcomes will be positively associated with one’s level of effort in a given task.
Reproduced with permission of the copyright owner. Further reproduction prohibited without permission.
216
The beta path estimate for this relationship between expectancy and effort was .29.
The path estimate was statistically significant (t-value = 4.49). Thus, the hypothesis is
supported in the respecified model. While self-efficacy was somewhat marginal in its
effect on effort, the level of expectancy regarding outcomes was very significant in its
impact on effort. These findings might be evidenced in the study because the effect of
self-efficacy on effort is indirect through expectancy. Salespeople appeared to hold higher
levels of expectancy (based on high levels self-efficacy) and then exhibited higher levels of
effort rather than expending effort based on their sales abilities.
Current Performance
Current performance was a salesperson’s level of attainment through
approximately one-half of a calendar year. It was hypothesized that sales performance
would be directly related to both salespeople’s abilities to adapt selling methods to specific
customers and their efforts in their respective selling tasks. These two hypotheses were
expressed as
H16: The degree to which and individual practices adaptive sellingwill be positively associated with one’s level of sales performance.
H17: An individual’s level of effort in the performance of a task will be positively associated with one’s level of current performance.
In the respecified model, both beta paths related to current performance were not
retained. This was likely because current performance was measured part way through a
calendar year (July and August) and in a time period (late Summer) typically characterized
by slow vehicle sales. In fact, the latter half of the year are usually when significant
vehicle sales are recorded by the dealerships. Thus, it is not unusual for a salesperson’s
Reproduced with permission of the copyright owner. Further reproduction prohibited without permission.

217
performance to be somewhat low during the period that data was collected for the final
study. The two hypotheses, however, were not supported. It appeared that salespeople in
the study, even though not performing at high levels during the data collection period, did
exhibit high levels of efifort in their sales jobs and did practice adaptive selling skills based
on customer situations.
Summary
Seventeen structural hypotheses were tested in the final study. A summary of the
evaluations of these hypotheses is reported in Table 8.9.
Table 8.9Respecified Model
Hypothesis Effect+/-
Results
Hi: Self-monitoring-> Modeling + Not retained. RejectedH2: Self-esteem -» Modeling 4- Not retained. RejectedH3 ; Coworker acceptance Modeling 4- Not retained. RejectedH4: Modeling -> Self-efBcacy 4- Not retained. RejectedH5; Role conflict -> Self-efficacy - Non-significant, RejectedH6: Role ambiguity -> Self-efficacy 4- Significant, SupportedH7; Past performance -> Self-efficacy 4- Non-significant, RejectedH8: Coworker feedback —> Self-efficacy 4- Significant, SupportedH9: Manager feedback —> Self-efficacy 4- Non-significant, RejectedHIO: Coworker feedback —> Expectancy 4- Not retained. RejectedHll : Manager feedback —> Expectancy 4- Not retained. RejectedH12: Self-efficacy —> Expectancy 4- Significant, SupportedH13: Self-efficacy -> Adaptive selling 4- Significant, SupportedH14: Self-efficacy -> Effort 4- Marginally SupportedH15: Expectancy -> Effort 4- Significant, SupportedH16: Adaptive selling -*■ Current
performance4- Not retained. Rejected
H17: EffortCurrent performance 4- Not retained. Rejected
Conclusions regarding the relationships tested in the study and subsequent findings are
discussed in the next chapter.
Reproduced with permission of the copyright owner. Further reproduction prohibited without permission.
CHAPTER 9 CONCLUSIONS AND FUTURE RESEARCH
Introduction
This chapter summarizes the results of this research study along with potential
areas for future research related to sales performance. Included are an interpretation of
the findings, a summary of both theoretical and managerial contributions of the study,
limitations associated with the study, and suggestions for possible future research in the
sales area.
Findings and Theoretical Contributions
As discussed in the introduction, while each of the paths in the social cognitive
model represented a hypothesis to be tested in this study, the dissertation addressed three
general research questions. First, what is the role o f modeling the behavior of other
salespeople in developing a higher level of belief in one’s own capabilities to successfully
perform a sales task? Second, what are the antecedents of modeling behaviors and what is
the relative contribution of each factor to the overall level of behavior modeling a
salesperson attempts? Third, does social cognitive theory provide additional explanation
of effective performance by salespeople?
Based on the proposed social cognitive model, four specific questions were
examined. What is the impact of a salesperson’s belief that he or she possesses certain
capabilities to successfully perform on one’s ultimate performance? What are the
determinants of this belief in one’s capabilities and what are their relative importances?
What are the relative importances of the factors that lead a salesperson to actively practice
behavior modeling? Which source of performance feedback (manager or coworker) has
218
Reproduced with permission of the copyright owner. Further reproduction prohibited without permission.
219
greater influence on the level of salespeople’s beliefs in their capabilities to successfully
perform a selling task? These questions are addressed in the following sections.
Self-efficacy
As discussed in the introduction to this study, Bandura’s social cognitive theory
posits that a person’s belief that he or she possesses the capabilities necessary for
successful performance of a task (self-efficacy) is a major factor in the level of effort an
individual will exhibit in the task. By comparison, Vroom’s expectancy theory, widely
used in personal selling research, suggests that a person’s level of motivation (defined as
effort in a given task) has a significant effect on performance outcomes (Churchill, Ford
and Walker 1997). A primary objective of this study was to examine the association
between self-efficacy and effort.
The first research question was stated as. What is the impact of a salesperson’s
belief that he or she possesses certain capabilities to successfully perform on one’s
ultimate performance?
The respecified structural model in the study indicated that a salesperson’s level of
self-efficacy has a marginal direct influence on the level of effort a salesperson will expend
in a selling task. Self-efficacy did, however, exhibit a substantial indirect effect on a
salesperson’s level of effort, a variable demonstrated to have a significant effect on sales
performance in past research (see Churchill, Ford and Walker 1997). Salespeople in the
study who perceived they had capabilities to successfully perform appeared to hold higher
levels of expectancy that their efforts would result in successful sales performances. As a
result, salespeople holding higher levels of expectancy regarding sales outcomes also
Reproduced with permission of the copyright owner. Further reproduction prohibited without permission.

220
exhibited higher levels of efifort in their sales jobs (i.e., the salespeople worked harder and
longer as compared to salespeople with lower levels o f expectancy).
Additionally, self-efiBcacy was found to have a significant effect on a salesperson’s
practice of adaptive selling techniques. Adaptive selling has demonstrated a strong effect
on a salesperson’s performance in past studies (see Spiro and Weitz 1990). Thus, while
the measure of current performance was not retained in the revised model, study results
indicate that self-efiBcacy may have indirect effects on a salesperson’s current performance
through higher levels of efifort and in greater use of adaptive selling skills. This finding
should be a theoretical contribution supporting this specific aspect o f social cognitive
theory and its use in examining job behaviors of salespeople. Additionally, this finding
supports the use of both expectancy theory and social cognitive theory in personal selling
research. One problem with past sales research has been the lack of significant findings or
conflicting results across research studies (Churchill, Ford and Walker 1997). These two
theories, utilized together, can possibly provide a greater explanation of salesperson
behaviors and performance outcomes. Research studies based on expectancy theory have
omitted the role of self-efficacy and its effect on expectancy theory variables.
The second research question addressed the determinants of a salesperson’s level
of self-efficacy. This question was stated as. What are the determinants of this belief in
one’s capabilities and what are their relative importances? Social cognitive theory
suggested four factors (modeling, job stress, past performance and positive feedback) that
should positively impact one’s belief in his or her capabilities.
First, modeling is the act of learning successful job activities vicariously by
observing activities performed by other successful salespeople and then practicing these
Reproduced with permission of the copyright owner. Further reproduction prohibited without permission.

221
observed behaviors in one’s own sales activities. This study did not find that behavior
modeling, in and of itself, was a significant factor in a salesperson’s level of self-efficacy.
As indicated in the respecified structural model, it appeared that the three factors (self
monitoring, self-esteem and coworker acceptance) associated with a person’s modeling
activities had a more direct impact on that person’s level of self-efficacy. While this
finding does not support social cognitive theory in this personal selling context, it was
found that these three factors were directly associated with self-efficacy. It might be that
salespeople implicitly observe the actions of fellow salespeople and subconsciously utilize
sales behaviors they feel will contribute to their successful performances.
An additional finding in the study was that a salesperson’s level of self-monitoring
has a very large influence on the salesperson’s level of adaptive selling. This finding
suggests that salespeople who monitor their activities, performances, and images relative
to those people they work with tend to have higher levels of adaptive selling, more
purposely altering sales presentations and techniques to more closely align with specific
customer situations. There is no research currently supporting this relationship, which
suggests additional research in the area of adaptive selling.
Second, social cognitive theory suggested that the level of tension, or stress, that a
person felt on the job would be negatively associated with an individual’s belief that he or
she had the capabilities to successfully perform a given task. High levels of stress and
tension should be somewhat debilitating to a person’s task performance in that persons
tend to arouse in themselves elevated levels of dysfunctional distress with internal
thoughts regarding their lack of task capabilities. For the final study, job tension was
divided into its two underlying constructs of role conflict and role ambiguity. Role
Reproduced with permission of the copyright owner. Further reproduction prohibited without permission.

222
conflict represents how much agreement there is between salespeople and others
(specifically their personal feelings, sales managers, and customers) regarding expectations
for activities associated with the sales job. Role ambiguity represented how certain
salespeople were regarding what the sales job, in general, actually was.
In summary, this study partially supported social cognitive theory. Role ambiguity
was found to have a very substantial effect on salespeople’s levels of self-efficacy.
Salespeople with high levels of role ambiguity tended to exhibit perceptions of high levels
of self-efficacy. While this relationship intuitively suggests a negative association, higher
responses in the questionnaire indicated more certainty that respondents understood their
roles related to their sales jobs. Thus, higher levels of certainty were positively related to
higher levels of self-efficacy in the study. The effect of role conflict on self-eflScacy was
not, however, supported. In fact, the relationship in the respecified model exhibited a
nonsignificant negative effect. The negative effect of role conflict on self-efficacy is
surprising since respondents, on average, indicated positive perceptions regarding their
agreement with job requirements and expectations of others. The lack of a significant
effect, however, suggests that levels of self-efficacy were not affected by a lack of role
conflict between the salespeople and other significant people (sales managers, family and
customers). It appeared that salespeople in the study perceived somewhat positive
feelings that there was agreement between them and others regarding job expectations.
On the other hand, such levels of agreement were not associated with perceptions o f self-
efficacy. Thus, the study supported the relationship between the role ambiguity aspect of
job tension and self-efficacy, but not the relationship between the role conflict aspect of
job tension and self-efficacy. It appears that, while salespeople’s levels of self-efficacy are
Reproduced with permission of the copyright owner. Further reproduction prohibited without permission.

223
influenced by their understanding of and agreement with their sales roles in their
organizations, a lack of agreement regarding job expectations does not influence
salespeople’s beliefs that they have the capabilities to successfully perform the sales job.
Third, it is surprising that salespeople’s past performances had no effect on their
perceived levels of self-efiBcacy. Successful past sales experiences should contribute to
feelings of confidence that sales jobs will be performed successfully in the future. The
study found, however, that while successful salespeople held high levels of self-efficacy,
even salespeople who had not performed well in the past year held high levels of self-
efficacy. In follow-up telephone calls to several salespeople who had responded to the
study, it appeared that they tended to attribute low levels of performance to factors
outside their personal control (e.g., insufiBcient advertising by the dealer to draw potential
buyers into the dealership) rather than to a personal lack of sales capabilities.
Fourth, effects of positive feedback on salespeople’s levels of self-efficacy were
examined from two perspectives. Coworker feedback was job and performance input
received by a person from other salespeople in the dealership. Manager feedback was job
and performance input received by a salesperson from his or her sales manager in a
dealership. The study found that feedback from one’s fellow salespeople had a marginally
significant effect on self-efficacy, while feedback from sales managers had no significant
influence on self-efiBcacy. This finding may not be surprising, however, in the context of
the study. Vehicle dealerships exhibit little direct sales manager - salesperson
organizational structure. While sales managers in the dealerships exhibited some forms of
leadership (e.g., conducting sales education seminars), the managers did not manage
salespeople in terms of sales or quota performance. Salespeople were paid commission
Reproduced with permission of the copyright owner. Further reproduction prohibited without permission.

224
only and salespeople who performed well and made a livable income tended to remain
with a dealership while salespeople who performed poorly tended to exit a dealership
within a few months. Thus, sales managers in responding dealerships had little reason, or
even occasion, to directly address sales activities and outcomes with the salespeople.
Thus, salespeople's primary opportunities for job feedback were from other salespeople in
a dealership. It appeared that coworker feedback was much more relevant to a
salesperson’s feeling of self-efBcacy than manager feedback. Due to the specific context
of the study, however, the relationship between job feedback and self-efficacy needs to be
examined in additional settings with stronger managerial relationships between sales
managers and salespeople.
Modeling
Social cognitive theory indicates there are three factors (self-monitoring, task-
specific self-esteem and coworker acceptance) that lead salespeople to actively observe
the sales activities of other salespeople and to incorporate some successful behaviors into
their own selling techniques. The third research question addressed the effects of the three
factors (self-monitoring, task-specific self-esteem and coworker acceptance) on modeling
activities and their relative importances. Since the modeling construct was not retained in
the respecified model, the relationships between self-monitoring, self-esteem, and
CO worker acceptance were examined in a separate exploratory model.
First, salespeople who exhibit higher levels of self-monitoring (i.e., observe and
manage the image presented to others and personally appraise their job performances in
relation to other salespeople) should tend to observe and imitate, to some degree, sales
activities of successful salespeople they work with. This observation and imitation of
Reproduced with permission of the copyright owner. Further reproduction prohibited without permission.

225
behaviors should result in a salesperson’s image being more consistent with the image of
other salespeople in an organization. Self-monitoring, however, exhibited almost no
influence on a salesperson’s level of modeling activities. This could suggest that even
though salespeople tend to monitor and regulate their images, this self-regulation is more
important with customers, as suggested by the large effect of self-monitoring on adaptive
selling, than with coworkers in an organization. Task-specific self-esteem also exhibited
little effect on modeling activities of salespeople. The nonsignificant effect was also in the
opposite direction (negative) of the hypothesized relationship. This finding, in the context
of the study, suggests that salespeople high in self-esteem regarding a specific sales job do
not recognize a need to model the sales behaviors of other salespeople in an organization.
The third factor related to modeling, coworker acceptance, was found to have a significant
influence on a salesperson’s modeling activities. As compared to self-monitoring and self
esteem, coworker acceptance might be important to salespeople in terms of establishing
solid relationships with workgroups rather than vicariously learning more effective sales
techniques. The importance of these organizational relationships could lead salespeople to
closely observe and imitate the behaviors of fellow salespeople to maintain a high level of
acceptance by other salespeople.
It is interesting that, overall, responding salespeople exhibited high levels of
modeling activities (5.41 with a response scale of one to seven) but that the modeling
activities had no direct influence on sales activities. There was, however, a significant
difference (F-value of 11.74 and p-value of .001) in the levels of modeling between newer
salespeople and more experienced salespeople in the dealerships. For salespeople with
less than two years of experience selling vehicles, the level of modeling activities (5.67)
Reproduced with permission of the copyright owner. Further reproduction prohibited without permission.

226
was significantly higher than for salespeople with two or more years of experience (5.20).
This suggests that less experienced salespeople do look to more tenured salespeople in an
organization to leam more effective sales techniques.
In summary, modeling was not found, in this study, to be a useful construct in
understanding a salesperson’s perceived level o f self-eflBcacy. The fact, however, that
responding salespeople did exhibit modeling activities suggests that modeling should be
examined further for relationships in personal selling environments.
Summary
This dissertation study contributed to the application and testing of theory in
several ways.
First, the study proposed and tested a conceptual model, grounded in social cognitive
theory, of the determinants of salespeople’s levels of self-efficacy. The study supported
several theoretical relationships, that role ambiguity and positive feedback fi-om coworkers
demonstrate substantial influence on salespeople’s perceptions of their self-efficacy.
Another contribution of the study was an examination of the effects that a
salesperson’s self-efiRcacy has on sales task performance. Salespeople were found to exert
more effort (working harder and longer) in the job when their beliefs in their capabilities
were higher. Additionally, such salespeople demonstrated much higher levels of adaptive
selling skills which have been shown to have positive effects on ultimate sales performance
(e.g., Sujan, Weitz and Kumar 1994).
Finally, this study supported the combined use of both social cognitive theory and
expectancy theory in research attempting to explain the performance of salespeople. One
finding of the study was that self-efficacy has a substantial influence on a salesperson’s
Reproduced with permission of the copyright owner. Further reproduction prohibited without permission.

227
expectancy that sales efifort will pay ofif through successful outcomes (social cognitive
theory), which in turn is directly associated with a salesperson’s level of effort in the job
(expectancy theory). While not supported in this study, both effort and the use of
adaptive selling techniques should result in higher levels of ultimate sales performance.
Managerial Contributions
The findings of this study are also relevant in the practice of marketing, especially
in the area of sales management. First, a contribution to marketing management is a
general understanding of the role of self-efiBcacy in influencing the amount of effort that a
salesperson will expend in successfully performing a selling task. Since self-efficacy has
such influence directly on a salesperson’s effort and indirectly through its impact on
expectancy in the job, it is important that an organization’s sales training program provide
opportunities for salespeople to develop greater levels of self-efficacy. An oft-used adage
regarding personal selling hold true in this regard, “Success breeds success.” As one
dealership president indicated, young new salespeople must quickly develop confidence
that they can successfully sell cars and we try to accomplish this by making it as easy as
possible for them to make a few sales in the first 30 days. Once they see how its done and
feel they can do it, they usually become fairly successful in the car business and make a
good living at it.
Another managerial contribution of this study is an understanding of how positive
feedback from other salespeople and sales managers in organizations affects salespeople’s
beliefs in their capabilities. When other salespeople indicate to a salesperson that he or she
is doing a good job, it seems to be believed. When sales managers indicate to a
salesperson that he or she is doing well, it appears to have no impact, in terms of self
Reproduced with permission of the copyright owner. Further reproduction prohibited without permission.

228
efficacy, on salespeople. This finding suggests that sales managers, at least in the context
of the study (vehicle dealerships), should develop closer working relationships with their
salespeople and should communicate more positively more fi-equently with their
salespeople. This is in contrast to sales manager - salesperson relationships observed in
several dealerships during the data collection phase of this study. In these dealerships, it
was observed that sales managers were very critical of the performance of salespeople,
and were critical on a fi’equent basis, especially during daily or weekly sales meetings.
Limitations
Several limitations of this study should be addressed. First, this study was
conducted in a very specific context of salespeople in vehicle dealerships. Such a context
may not be representative of other personal selling environments. Only a small percentage
of a dealership’s salesforce is successful in terms of earnings that represent a middle-
income standard of living. Thus, turnover rates in the dealerships are extremely high
which result in a large portion of the respondents being relatively inexperienced
salespeople.
Second, the nature of the sample in the study may not be representative of
salespeople in general due to unique salesforce characteristics discussed in the study. As a
result, the generalizability of the findings is somewhat limited to personal selling in a
specific business type. The findings could be different in other personal selling contexts.
A third limitation of the study is the method used to collect respondent data.
Questionnaires and instructions were mailed to owners, general managers or sales
managers in the respondent dealerships. These contacts were asked to explain the study
to the salespeople, distribute the questionnaires, and collect the completed surveys. As a
Reproduced with permission of the copyright owner. Further reproduction prohibited without permission.

229
result, it is possible that the quality of explanation and instructions varied from dealership
to dealership and that the study was taken with varying seriousness from dealership to
dealership. Such variation could lead to some variation in the accuracy of responses.
Future Research
There are several areas of research related to personal selling that might offer
additional explanation as to salesperson performance. First, the role of self-efiBcacy
should be examined in the context of other performance models. These models, based on
expectancy theory, exclude such social cognitive theory variables. Historically, these
models have explained only a small amount of the variance in performance.
Complementing these models with social cognitive theory could possibly result in a better
understanding of the factors affecting sales performance.
Another area for additional future research is replication of the study to validate
the revised conceptual model. The proposed model in the study was respecified and
should be tested with an additional sample. Additionally, the construct measures used in
the study should be refined.
Future research should examine the generalizability of the findings in the study.
The revised model should be evaluated in other personal selling contexts with other types
of businesses.
Finally, the study explains only a small part of the variance in a salesperson’s level
of self-efiBcacy. Self-eflBcacy has such an influence on expectancy, effort, and adaptive
selling that additional research should examine the effects of additional variables on self-
efiBcacy. Additionally, the conceptual model developed in this study could be applied to
Reproduced with permission of the copyright owner. Further reproduction prohibited without permission.

230
any other business context to examine the level of effort and adaptiveness that employees
exert in any task.
Reproduced with permission of the copyright owner. Further reproduction prohibited without permission.

BIBLIOGRAPHY
Anderson, James C. and David W. Gerbing (1988), “Structural Equation Modeling in Practice: A Review and Recommended Two-Step Approach,” Psychological Bulletin, 103 (May), 411-423.
Anderson, Erin and Richard L. Oliver (1987), “Perspectives on Behavior-Based Versus Outcome-Based Salesforce Control Systems,” Journal of Marketing, 51 (4), 76- 88 .
Avila, Ramon A. and Edward F. Fern (1986), “The Selling Situation as a Moderator of the Personality-Sales Performance Relationship: an Empirical Investigation,” Journal of Personal Selling & Sales Management, 6 (November), 53-63.
_________, ________ and O. Karl Mann (1988), “Unraveling Criteria for Assessing thePerformance of Salespeople: A Causal Analysis,” Journal of Personal Selling, 8 (May), 45-54.
Badovick, Gordon J., Farrand J. Hadaway and Peter F. Kaminski (1992), “Attributions and Emotions: The Effects on Salesperson Motivation after Successful vs. Unsuccessful Quota Performance,” Journal of Personal Selling & Sales Management, 12 (Summer), 1-11.
Bagozzi, Richard P. (1977), “Structural Equation Models in Experimental Research,” Journal of Marketing Research, 14, 209-226.
________ (1978), “Salesforce Performance and Satisfaction as a Function ofIndividual Difference, Interpersonal, and Situational Factors,” Journal of Marketing Research, 15 (4), 517-531.
(1980), “Performance and Satisfaction in an Industrial Sales Force: AnExamination of Their Antecedents and Simultaneity,” Journal of Marketing, 44 (2), 65-77.
(1980), Causal Models in Marketing, New York: John Wiley & Sons.
Bandura, Albert (1977), Social Learning Theory, Englewood Cliffs, New Jersey; Prentice-Hall.
________ ( 1986), Social Foundations of Thought and Action, Englewood Cliffs, NewJersey: Prentice-Hall.
(1989), “Human Agency in Social Cognitive Theory,” AmericanPsychologist, AA {9), 1175-1184.
231
Reproduced with permission of the copyright owner. Further reproduction prohibited without permission.

232
Bartkus, Kenneth R., Mark F. Peterson and Danny N. Bellenger (1989), “Type ABehavior, Experience, and Salesperson Performance,” Journal of Personal Selling & Sales Management, 9 (Summer), 11-18.
Bashaw, R. Edward and E. Stephen Grant (1994), “Exploring the Distinctive Nature of Work Commitments: Their Relationships with Personal Characteristics, Job Performance, and Propensity to Leave,” Journal of Personal Selling & Sales Management, 14 (Spring), 41-56.
Becherer, Richard C., Fred W. Morgan and John P. McDonald (1983), “TheDimensionality of the Industrial Sales Job,” Journal of Personal Selling and Sales Management, 3 (1), 36-50.
________ , ________ and Lawrence M. Richard (1982), “The Job Characteristics ofIndustrial Salespersons: Relationship to Motivation and Satisfaction,” Journal of Marketing, 46 (4), 125-135.
Behrman, Douglas N. and William D. Perreault, Jr. (1984), “A Role Stress Model of the Performance and Satisfaction o f Industrial Salespersons,” Journal of Marketing, 48(4), 9-21.
Beltramini, Richard F. and Kenneth R. Evans (1988), “Salesperson Motivation toPerform and Job Satisfaction: A Sales Contest Participant Perspective,” Journal of Personal Selling & Sales Management, 8 (August), 35-42.
Bentler, Peter M. (1990), “Comparative Fit Indexes in Structural Models,” Psychological Bulletin. 107 (2), 238-246.
________ and Douglas G. Bonett (1980), “Significance Tests and Goodness ofFit in the Analysis of Covariance Structures,” Psychological Bulletin, 88 (3), 588-606.
Brown, Steven P. and Robert A. Peterson (1994), “The Effect of Effort on SalesPerformance and Job Satisfaction,” Journal of Marketing, 58 (April), 70-80.
Busch, Paul and Ronald F. Bush (1978), “Women Contrasted to Men in the Industrial Salesforce: Job Satisfaction, Values, Role Clarity, Performance, and Propensity to Leave,” Journal of Marketing Research, 15 (3), 438-448.
Business Week (1983), “Lanier Aims to Win Back Its Office Leadership,” May 16, 133- 136.
Butler, John K. and Richard M. Reese (1991), “Leadership Style and Sales Performance: A Test of the Situational Leadership Model,” Journal of Personal Selling & Sales Management, 11 (Summer), 37-46.
Reproduced with permission of the copyright owner. Further reproduction prohibited without permission.

233
Caballero, Maijorie J. (1988), “A Comparative Study of Incentives in a Sales Force Contest,” Journal of Personal Selling and Sales Management, 8 (2), 55-58.
Castleberry, Stephen B. and C. David Shepherd (1993), “Effective Interpersonal Listening and Personal Selling,” Journal of Personal Selling and Sales Management, 13 (1), 35-49.
Challagalla, Goutam N. and Tasadduq A. Shervani (1996), “Dimensions and Types of Supervisory Control; Effects on Salesperson Performance and Satisfaction,” Journal of Marketing, 60 (1), 89-105.
Chonko, Lawrence B. (1986), “Organizational Commitment in the Sales Force,” Journal of Personal Selling & Sales Management, 6 (November), 19-27.
________ , Roy D. Howell and Danny N. Bellenger (1986), “Congruence in Sales ForceEvaluations: Relation to Sales Force Perceptions of Conflict and Ambiguity,” Journal of Personal Selling & Sales Management, 6 (May), 35-48.
Churchill, Jr., Gilbert A., Neil M. Ford, Steven W. Hartley, and Orville C. Walker, Jr. (1985), “The Determinants of Salesperson Performance: A Meta-Analysis,” Journal of Marketing Research, 22 (May), 103-118.
________ (1979), “A Paradigm for Developing Better Measures of MarketingConstructs,” Journal of Marketing Research, 16 (1), 64-73.
Comer, James M. (1984), “A Psychometric Assessment of a Measure of SalesRepresentatives’ Journal of Marketing Research, 21 (2),221-225.
Cravens, David W., Thomas N. Ingram, Raymond W. LaForge, and Clifford E. Young (1993), “Behavior-Based and Outcome-Based Salesforce Control Systems,” Journal of Marketing, 57 (4), 47-59.
Cron, William L., Ellen F. Jackofsky and John W. Slocum, Jr. (1993), “Job Performance and Attitudes of Disengagement Stage: Salespeople Who are about to Retire,” Journal of Personal Selling & Sales Management, 13 (Spring), 1-13.
Dalrymple, Douglas, J. and William L. Cron (1992), Sales Management, Fourth edition, John Wiley & Sons, Inc.: New York.
Darden, William R., Daryl McKee and Ronald Hampton (1993), “SalespersonEmployment Status as a Moderator in the Job Satisfaction Model: A Frame of Reference Perspective,” Journal of Personal Selling & Sales Management, 13 (Summer), 1-15.
Reproduced with permission of the copyright owner. Further reproduction prohibited without permission.

234
Darmon, Rene Y. (1993), “Where Do the Best Sales Force Profit Producers ComeYroml” Journal of Personal Selling & Sales Management, 13 (Summer), 17-29.
Davis, Tim R. and Fred Luthans (1980), “A Social Learning Approach to Organizational Academy of Management Review, 5 (2), 281-190.
DeCormier, Ray A. and David Jobber (1993), “The Counselor Selling Method: Concepts and Constructs,” Journal of Personal Selling and Sales Management, 13 (4), 39- 59.
DeVellis, Robert F. (1991), Scale Development, London: Sage Publications.
Doyle, Stephen X., Charles Pignatelli and Karen Florman (1985), “The HawthorneLegacy and the Motivation of Salespeople,” Journal of Personal Selling & Sales Management, 5 (November), 1-6.
Douthit, James C (1976), “The Use of Sales Quotas by Industrial Firms,” Journal of the Academy of Marketing Science, 4 (Spring), 136.
Dubinsky, Alan J., Roy D. Howell, Thomas N. Ingram, and Danny Bellenger (1986), “Salesforce SocMxzaXion," Journal of Marketing, 50 (October), 192-207.
Evans, Kenneth R. and John A. Grant (1992), “Compensation and Sales Performance of Service Personnel: A Service Transaction Perspective,” Journal of Personal Selling and Sales Management, 12 (2), 39-49.
Ford, Neil M., Gilbert A. Churchill, Jr. and Orville C. Walker, Jr. (1985), “Differences in the Attractiveness of Alternative Rewards Among Industrial Salespeople:
Evidence," Journal of Business Research, 13 (April), 123-128.
Fomell, Claes and David F. Larcker (1981), “Evaluating Structural Equation Models with Unobservable Variables and Measurement Error,” Journal of Marketing Research, 18 (February), 39-50.
Futrell, Charles M. and A. Parasuraman (1984), “The Relationship o f Satisfaction and Performance to Salesforce Turnover,” Journal of Marketing, 48 (4), 33-40.
Ginter, Peter M. and Donald D. White (1982), “A Social Learning Approach to Strategic Management: Toward a Theoretical Foundation,” Academy of Management Review, 7 (2), 253-261.
Gist, Marilyn E. (1987), “Self-EfiBcacy Implications for Organizational Behavior and Human Resource Management,” Academy of Management Review, 12 (3), 472-485.
Reproduced with permission of the copyright owner. Further reproduction prohibited without permission.

235
Goolsby, Jerry R., Rosemary R. Lagace and Michael L. Boorom (1992), “Psychological Adaptiveness and Sales Performance,” Journal of Personal Selling & Sales Performance, 12 (Spring), 51-66.
Hackman, Richard J. and Edward E. Lawler (1971), “Employee Reactions to Job Characteristics,” Journal of Applied Psychology, 55, 259-286.
Hafer, John and Barbara A. McCuen (1985), “Antecedents of Performance andSatisfaction in a Service Sales Force as Compared to an Industrial Sales Force,” Journal of Personal Sellling and Sales Management, 5 (November), 7-17.
Hair, Joseph F., Jr., Rolph E. Anderson, Ronald L. Tatham, and William C. Black (1992), Multivariate Data Analysis, New York: Macmillan Publishing Company.
Hart, Sandra Hile, William C. Moncrief and A. Parasuraman (1989), “An EmpiricalInvestigation of Salespeople’s Performance, Effort and Selling Method During a Sales Contest,” Journal of the Academy of Marketing Science, 17 (Winter), 29-39.
House, Robert J. and Gary Dressier (1973), “The Path-Goal Theory of Leadership:Some Post Hoc and A Priori Tests,” Contingency Approaches to Leadership, Carbondale, Illinois: Southern Illinois University Press.
Hunt, Shelby D., Lawrence B. Chonko and Van R. Wood (1985), “Organizational Commitment and Marketing,” Journal of Marketing, 49 (1), 112-126.
Ingram, Thomas N., Keun S. Lee and Steven J. Skinner (1989), “An EmpiricalAssessment of Salesperson Motivation, Commitment, and Job Outcomes,” Journal of Personal Selling & Sales Management, 9 (Fall), 25-33.
Jaworski, Bernard J. and Deborah J. Maclnnis (1989), “Marketing Jobs and Management Controls: Toward a Framework,” Journal of Marketing Research, 26 (November), 406-419.
John, George and Barton Weitz (1989), “Salesforce Compensation: An Empirical Investigation of Factors Related to Use of Salary Versus Incentive CoraperndXion,” Journal of Marketing Research, 26 (1), 1-14.
Jones, Gareth R. (1986), “Socialization Tactics, Self-Efficacy, and Newcomers’Adjustments to Organizations,” Academy of Management Journal, 29 (June),
262-279.
Kazdin, A.E. (1976), “Effects of Covert Modeling and Model Reinforcementon Assertive Behavior,” Journal of Abnormal Psychology, 83, 240-252.
Reproduced with permission of the copyright owner. Further reproduction prohibited without permission.

236
Kerber, Kenneth W. and James P. Campbell (1987), “Correlates of ObjectivePerformance Among Computer Salespeople: Tenure, Work Activities, and Turnover,” Journal of Personal Selling and Sales Management, 7 (3), 39-50.
Kohli, Ajay K. (1989), “Effects of Supervisory Behavior: The Role of Individual Differences Among Salespeople,” Journal of Marketing, 53 (4), 40-50.
Kohli, Ajay K. and Bernard J. Jaworski (1994), “The Influence of Coworker Feedback on Salespeople,” yowma/ of Marketing, 58 (October), 82-94.
Lambert, Douglas M., Howard Marmorstein and Arun Sharma (1990), The Accuracy of Salespersons’ Perceptions of their Customers: Conceptual Examination and an Empirical Study,” Journal of Personal Selling and Sales Management, 10 (February), 1-9.
Lamont, Lawrence M. and William J. Lundstrom (1977), “Identifying SuccessfulIndustrial Salesmen by Personality and Personal Characteristics,” Journal of Marketing Research, 14(4), 517-529.
Latham, Gary P. and Lise M. Saari (1979), “Application of Social-Learning Theory to Training Supervisors Through Behavioral Modeling,” Journal of Applied Psychology, 64 (3), 239-246.
Leong, Siew Meng, Paul S. Busch, and Deborah Roedder John (1989), “KnowledgeBases and Salesperson Effectiveness: A Script-Theoretic Analysis,” Journal of Marketing Research, 26 (2), 164-178.
Locke, Edwin A., Elizabeth Frederick, Cynthia Lee, and Philip Bobko (1984), “Effect of Self-Efficacy, Goals, and Task Strategies on Task Performance,” Journal of Applied Psychology, 69 (2), 241-251.
Lucas, Henry C., Charles B. Weinberg and Kenneth W. Clowes (1975), “Sales Response as a Function of Territorial Potential and Sales Representative Workload,” Journal of Marketing Research, 12 (3), 298-305.
Lusch, Robert F. and Bernard J. Jaworski (1991), “Management Controls, Role Stress, and Retail Store Manager Performance,” Journal of Retailing, 67 (4), 397-419.
Manz, Charles C. and Henry P. Sims, Jr. (1981), “Vicarious Learning: The Influence of Modeling on Organizational Behavior,” Academy of Management Review, 6 (1), 105-113.
Mischel, W. (1973), “Toward a Cognitive Social Learning Reconceptualization of Personality,” Psychological Review, 80, 252-283.
Reproduced with permission of the copyright owner. Further reproduction prohibited without permission.

237
Moncrief. William C. (1986), “Selling Activity and Sales Position Taxonomies for Industrial Salesforces,” Journal of Marketing Research, 23 (3), 291-300.
________, Sandra H. Hart and Daniel Robertson (1988), “Sales Contests: A New Lookat an Old Management Tool,” Journal of Personal Selling & Sales Management, 8 (November), 55-61.
Naylor, James C., Robert D. Pritchard and Daniel R. Ilgen (1980), A Theory of Behavior in Organizations, New York: Academy Press.
Netemeyer, Richard J., Scot Burton and Donald R. Lichtenstein (1995), “Trait Aspects of Vanity: Measurement and Relevance to Consumer Behavior,” Journal of Consumer Research, 21 (4), 612-626.
Nunnally, J.C. (1978), Psychometric Theory, New York, New York: McGraw Hill Book Company.
Oliver, Richard L. and Erin Anderson (1994), “An Empirical Test of the Consequences of Behavior- and Outcome-Based Sales Control Systems," Journal of Marketing, 58 (October), 53-67.
Peterson, Robert A., Michael P. Cannito and Steven P. Brown (1995), “An Exploratory Investigation of Voice Characteristics and Selling Effectiveness,” Journal of Personal Selling & Sales Management, 15 (Winter), 1-15.
PodsakofF, Philip M. and Jiing-Lih Farh (1989), “Effects of Feedback Sign andCredibility on Goal Setting and Task Performance,” Organizational Behavior and Human Decision Processes, 44, 45-67.
Porras, Jerry 1. and Brad Anderson (1981), “Improving Managerial EffectivenessThrough Modeling-Based Training,” Organizational Dynamics, Spring, 60-77.
Predmore, Carolyn E. and Joseph G. Bonnice (1994), “Sales Success as Predicted by A Process Measure of Adaptability,” Journal of Personal Selling and Sales Management, 14 (4), 55-65.
Rhoads, Gary K., Jagdip Singh and Phillips W. Goodell (1984), “The MultipleDimensions of Role Ambiguity and Their Impact Upon Psychological and Behavioral Outcomes of Industrial Salespeople,” Journal of Personal Selling and Sales Management, 14(3), 1-24.
Riordan, Oliver, Richard L. Oliver and James H. Donnelly, Jr. (1977), “The UnsoldProspect: Dyadic and Attitudinal Determinants,” Journal of Marketing Research, 14 (4), 530-537.
Reproduced with permission of the copyright owner. Further reproduction prohibited without permission.
238
Rizzo, John R., Robert J. House and Sidney I. Lirtzman (1970), “Role Conflict andAmbiguity in Complex Organizations,” Administrative Science Quarterly, (15) June, 150-163.
Rosenberg, Morris (1965), Society and the Adolescent Self-Image, Princeton, New Jersey: Princeton University Press.
Ryans, Adrian B. and Charles B. Weinberg (1979), “Territory Sales Response,” Journal of Marketing Research, 16 (4), 453-465.
Sager, Jeffrey K. and Mark W. Johnston (1989), “Antecedents and Outcomes ofOrganizational Commitment: A Study of Salespeople,” Journal of Personal Selling & Sales Management, 9 (Spring), 30-41.
Saxe, Robert and Barton A. Weitz (1982), “The SOCO Scale: A Measure o f theCustomer Orientation o f Salespeople,” Journal of Marketing Research, 19 (3), 343-351.
Schuster, Camille P. and Jeffrey E. Danes (1986), “Asking Questions: SomeCharacteristics of Successful Sales Encounters,” Journal of Personal Selling and Sales Management, 6 (1), 17-27.
Shepherd, C. David and Leslie M. Fine (1994), “Role Conflict and Role AmbiguityReconsidered,” Journal of Personal Selling & Sales Management, 14 (Spring), 57-65.
Shipley, David D. and Julia A. Kiely (1986), “Industrial Salesforce Motivation andHerzberg’s Dual Factor Theory: A UK Perspective,” Journal of Personal Selling and Sales Management, 6 (1), 9-16.
Spiro, Rosann L. and Barton A. Weitz (1990), “Adaptive Selling: Conceptualization,Measurement, and Nomological Validity,” Journal of Marketing Research, 27 (1), 61-69.
Sujan, Harish, Mita Sujan and James R. Bettman (1988), “Knowledge StructureDifferences Between More Effective and Less Effective Salespeople,” Journal of Marketing Research, 25 (1), 81-86.
_, Barton A. Weitz and Mita Sujan (1988), “Increasing Sales Productivity byGetting Salespeople to Work Smarter,” Journal of Personal Selling and Sales Management, 8 (August), 9-19.
and Nirmalya Kumar (1994), “Learning Orientation, WorkingSmart, and Effective Selling,” Journal of Marketing, 58 (3), 39-52.
Reproduced with permission of the copyright owner. Further reproduction prohibited without permission.

239
Tanner, John F. and Stephen B. Castleberry (1990), “Vertical Exchange Quality and Performance: Studying the Role of the Sales Manager,” Journal of Personal Selling & Sales Management, 10 (Spring), 17-27.
Taylor, Paul (1992), “Improving Graduate Student Seminar Presentations Through Training,” Teaching of Psychology, 19 (4), 236-239.
Teas, R. Kenneth (1981), “An Empirical Test o f Models o f Salespersons’ JobExpectancy and Instrumentality Perceptions,” Journal of Marketing Research, 18 (2), 209-226.
Tyagi, Pradeep K. (1985), “Relative Importance of Key Job Dimensions and Leadership Behaviors in Motivating Salesperson Work Performance,” Journal of Marketing, 49 (3), 76-86.
________ (1985), “Organizational Climate, Inequities, and Attractiveness ofSalesperson Rewards,” Journal of Personal Selling & Sales Management, 5 (November), 31-37.
Vroom, Victor H. (1964), Work and Motivation, New York, New York: Wiley.
Walker, Orville C., Gilbert A. Churchill, and Neil M. Ford (1977), “Motivation and Performance in Industrial Selling: Present Knowledge and Needed Research,’ Journal of Marketing Research, 14(2), 156-168.
_______ , _________, and________ (1975), “Organizational Determinants of theIndustrial Salesman’s Role Conflict and Ambiguity,” Journal of Marketing,(39) 1, 32-39.
Weeks, Willian A. and Lynn R. Kahle (1990), “Salespeople’s Time Use andPerformance,” Journal of Personal Selling and Sales Management, 10 (February), 29-37.
Weiss, Howard M. (1977), “Subordinate Imitation of Supervisor Behavior: The Role of Modeling in Organizational Socialization,” Organizational Behavior and Human Performance, 19, 89-105.
Weitz, Barton A. (1978), “The Relationship Between Salesperson Performance andUnderstanding of Customer Decision Making,” Journal of Marketing Research,15 (4), 501-516.
(1979), “A Critical Review of Personal Selling Research: The Need for aContingency Approach,” in Critical Issues in Sales Management: State-of-the- Art and Future Research Needs, G. Albaum and G. Churchill, eds. Eugene, OR:
College of Business Administration, University of Oregon.
Reproduced with permission of the copyright owner. Further reproduction prohibited without permission.

240
(1981), “Efifectiveness in Sales Interactions: A Contingency Framework,’Journal of Marketing, 45 (1), 85-103.
________ , Harish Sujan and Mita Sujan (1986), “Knowledge, Motivation, andAdaptive Behavior: A Framework for Improving Selling Efifectiveness,” Journal of Marketing, 50 (October), 174-191.
Wood, Robert and Albert Bandura (1989), “Social Cognitive Theory of Organizational MdmgemexA,” Academy of Management Review, 14(3), 361-384.
Wotruba, Thomas R. and Donald J. Schoel (1983), “Evaluation of Salesforce ContestVQVîorïazsizQ,'' Journal of Personal Selling & Sales Management, 3 (May), 1-10.
________ (1989), “The Efifect of Goal-Setting on the Performance of Independent SalesAgents in Direct Selling,” Journal of Personal Selling & Sales Management, 9 (Spring), 22-29.
Yammarino, Francis J. and Alan J. Dubinsky (1990), “Salesperson Performance and Managerially Controllable Factors: An Investigation of Individual and Work Group Effects,” Journal of Management, 16 (March), 87-106.
Reproduced with permission of the copyright owner. Further reproduction prohibited without permission.

APPENDIX A
FINAL STUDY SURVEY INSTRUMENTS
241
Reproduced with permission of the copyright owner. Further reproduction prohibited without permission.

242
u x x x LOUISIANA AUTOMOBILE DEALERS ASSOCIATIONRobert 0 . Israel
Executive Vice-President
cxccunvK CQMMcrra
80UCNF0A0.INC
APCENCAUX FOFO. INC
M ay 30, 1997
haAP€R MOTORS. INC
mwneeeii Pw »Pr*de«
KARTER-MAILAAO UNCOUMieflCURY. INC
OAAfURO ChCVKXET-CEa INC
SUPERIOR FORO.WC Zaamn
DEEP so u th P0NTUC>auiOC INC Hawns
OonM Sorgaran. ■BERGERON CWf8L£R-PUrUOUTH.VOLVO. w C
CXJCOTE O ^frrS tE M yM O U T K INC
The LADA is assisting Robert M cM urrian, a Ph.D. candidate in Marketing at LSU. in his dissertation research project. Robert’s research project is a study o f several factors that contribute to a salesperson's successful sales perform ance and how these factors are attained. He would like to use autom obile salespeople in Louisiana in his study.
This study should be o f interest to LADA m em bers. It will provide guidelines which can be used in screening potential salespeople and will address important topics that m ight be part o f sales training programs to assist salespeople in attaining early success in their career. Thus, LADA is asking all o f o u r mem bers to assist in this study by having your salespeople participate in the survey. For our participation, a copy o f the results o f the study will be made available to LADA and to our members requesting a copy a t no cost. An overview o f the study is enclosed.
juwN rar uoTOns. INC.
RED RN£R MOTOR COUPUrr rdfaENSON MOTOR COUPWIV
HUSOHJIOPKINS AUTOPIEX M O
O c n M C -S M WaON SHETIER OLOSMOmUE-aUlCKOMEVROlEr. INC. Oowey
DON SH£n.ER R O . INC SuWSIM start SCARO MOTORS. IN C
StMof IVtfpMTTJRPtN PONTUC-lSUaj COMPANY
CSortWMIaWHITE fOAGUMCQLN'MERCURY: iNC
TRUCK OCAURS OfVSION
lawwSgfwartJr LOUIS SCHWARTZ INC
HAOA STATE OdieCTOR
8 0 8 POST GHRYSLER-fLYMOUTH.jEEP-€AQLE
Completion o f the questionnaire requires only about 30 minutes o f your salespeople’s tim e, and can be answered after w ork hours. Please indicate your interest in taking part in the study by completing the enclosed self-addressed and stamped postcard and returning to Robert. He will contact each o f you personally by phone or by mail to explain the study in m ore detail and to arrange for distribution o f the questionnaire form s.
The cost o f the study to our members is only a few minutes o f your time, while the feedback from the study can be invaluable. I ask that you please agree to participate in this project and assist Robert when he contacts you. Please return the postcard as soon as possible. Robert would like to begin delivering questionnaires to dealerships in June.
Thank you for y our assistance and participation. Should you have any questions please give me a call, or you may call Robert directly at (817)531-6500.
Sincerely,
Executive Vice-President
Enclosures
7526 Picardy Avenue • Baron Rouge. LA 70808 ' • (504) 769-5500 • (800) 375-LAOA (5232) • FAX (504) 769-2085
Reproduced with permission of the copyright owner. Further reproduction prohibited without permission.

243
SALESPERSON PERFORMANCE AN OVERVIEW OF THE RESEARCH STUDY
Background
One of the factors in effective sales performance is a salesperson’s level of self-confidence. This self- confidence is a belief by a salesperson that he or she has the capability and skill to successfully perform a selling job. High self-confidence results in salespeople working harder to achieve sales goals. It has been suggested that such self-confidence, or belief in one’s capabilities comes from a person’s work environment. It has been proposed that beliefs regarding a person’s capabilities are learned from four principal sources of information in the work environment: (1) past performance in a job; (2) observing successful performances of people one works with and then modeling their job behaviors and activities; (3) verbal feedback from managers and coworkers that a person is doing a good job; and (4) one’s level of stress or tension on the job.
Objective of the Study
The objective of the study is to examine the impact of salespeople’s levels of self-confidence on their sales performance. The study will focus on the relative importance of the four sources of self-confidence identified above. This is important to sales managers in the hiring and the training of salespeople. The study will provide a method of evaluating a person’s chance of success in a selling job that can be used in screening job applicants. Additionally, the study will provide suggestions that might be incorporated into sales training programs to give salespeople (especially new salespeople) the best chance of early success in a personal selling job.
Method of the Study
Salespeople in auto dealerships in Louisiana that are members of the Louisiana Automobile Dealers Association will be invited to respond to a written questionnaire. The questionnaire requires approximately 20 to 30 minutes to complete. The questionnaires will be mailed or personally delivered to sales managers for distribution to their salespeople. The completed questionnaires will be collected by the sales managers who will return the questionnaires in an addressed, postage paid envelope. The responses from your salespeople will be kept strictly confidential. The only individual who will see the responses will be the researcher.
Output
The purpose of the study is the completion of the researcher’s doctoral degree in Marketing from Louisiana State University. The results of the study will be provided at no cost to the Louisiana Automobile Dealers Association and to member dealerships participating in the study.
Thank you for your participation in the study. There is no cost to your dealership for participating in the study other than the time required for your salespeople to complete the questionnaire. Should you need additional information, please give Robert McMurrian a call at (817) 531-6500.
Reproduced with permission of the copyright owner. Further reproduction prohibited without permission.

244
L S UL o u i s i a n a S t a t e U n i v e r s i t y* S O o W ( C m » N l C * L C O L U f C l
f . /. Ourso College o f B u im e is Adminis tra tion • Department o f frtarketing
July 29. 1997
Dear LADA Member:
Thank you for your dealership’s participation in our survey of automobile salespeople throughout Louisiana. The study is being done in association with Louisiana Automobile Dealers Association and has two objectives. First, the study will provide you with information on characteristics of successful salespeople. This should assist in developing training programs for your new salespeople that will give them opportunities for early success in their sales career. Additionally, the study should provide you with information that will help you improve opportunities for your veteran salespeople to realize both their personal and their financial selling goals. Second, the study will complete the requirements for my Ph.D. degree in Marketing from LSU.
Enclosed are questionnaires and envelopes for each of your salespeople. Attached with this letter are the following items to assist you in administering the survey to your salespeople and returning the surveys to me:
(1) Suggestions for distributing the questionnaires, explaining the study to your salespeople, having them complete the questionnaires, and collecting the completed questionnaires.
(2) An overview of the study that you can use to explain the study to your salespeople.
(3) Suggestions for returning the completed questionnaires to me.
Information provided by your salespeople will be kept strictly confidential. Their questionnaires will be combined with those of other salespeople in dealerships throughout Louisiana. No dealership participating in the study will be identified by name. There are no questions in the survey that reflect your sa lespeople’s feelings regarding your dealersh ip or your m anagem ent team . An overview of the findings in the study will be sent to you upon completion of the project which is targeted for November. 1997.
Again, thank you for your dealership’s participation in the study. Should you have any questions regarding the study, the questionnaire, or the process for administering the questionnaires to your salespeople, please give me a call at (317)531-6500.
Robert McMurrianProject Director and Ph.D. Candidate Louisiana State University
Reproduced with permission of the copyright owner. Further reproduction prohibited without permission.

245
Overview of the Automobile Salesperson Survey
The study is being conducted in association with Louisiana Automobile Dealers Association. Member dealerships throughout Louisiana are participating in the study. There are two purposes of the survey. First, we want to know how real salespeople feel about what it takes to be successful in a sales career. This information will assist dealerships in their training programs to help new salespeople become more successful earlier in their career, and will suggest ways to improve opportunities for more veteran salespeople to realize both personal and financial goals in their sales jobs. Second, the survey will complete the requirements for the project director's Ph.D. degree in Marketing at Louisiana S tate University.
All responses will be kept strictly confidentiality. No individual responses will be reported to dealerships. Each dealership will receive a report of the results which will be a composite of the responses of all salespeople throughout Louisiana. No salesperson and no dealership will be identified in the study.
Reproduced with permission of the copyright owner. Further reproduction prohibited without permission.
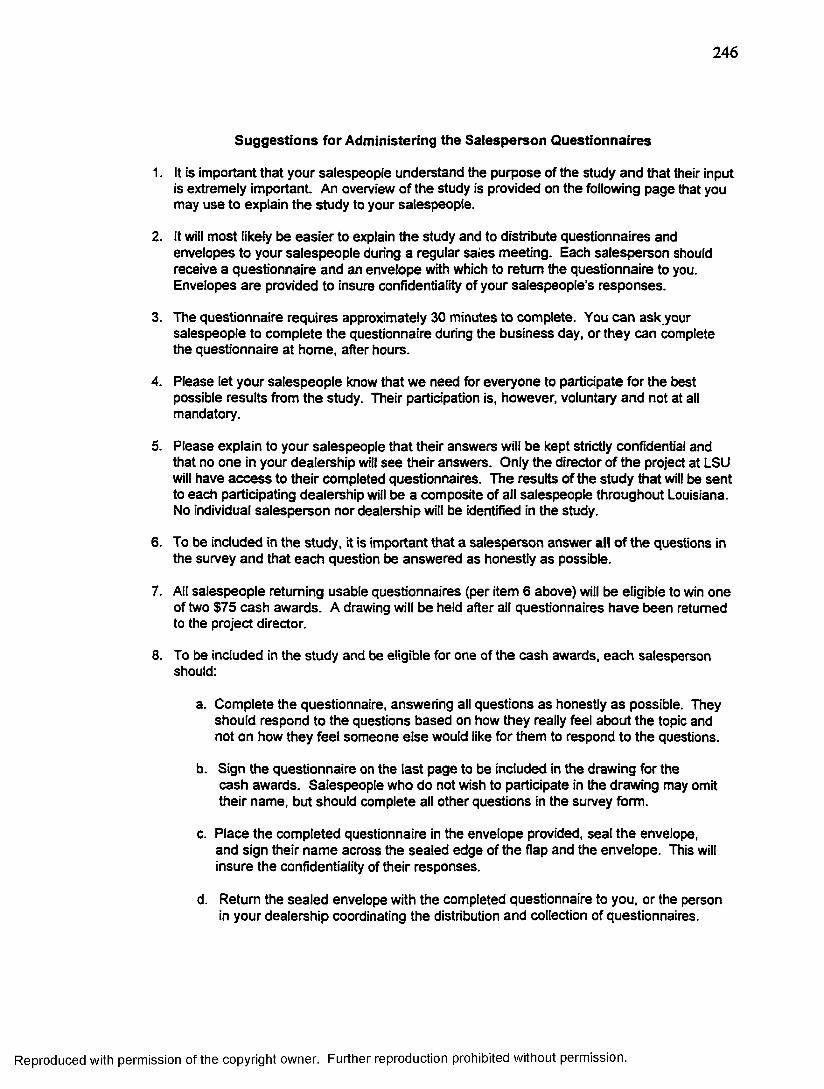
246
Suggestions for Administering the Salesperson Questionnaires
1. It is Important that your salespeople understand the purpose of the study and that their input is extremely important. An overview of the study is provided on the following page that you may use to explain the study to your salespeople.
2. It will most likely be easier to explain the study and to distribute questionnaires and envelopes to your salespeople during a regular sales meeting. Each salesperson should receive a questionnaire and an envelope with which to return the questionnaire to you. Envelopes are provided to insure contidentiality of your salespeople's responses.
3. The questionnaire requires approximately 30 minutes to complete. You can ask your salespeople to complete the questionnaire during the business day, or they can complete the questionnaire at home, after hours.
4. Please let your salespeople know that we need for everyone to participate for the best possible results from the study. Their participation is, however, voluntary and not at all mandatory.
5. Please explain to your salespeople that their answers will be kept strictly confidential and that no one in your dealership will see their answers. Only the director of the project at LSU will have access to their completed questionnaires. The results of the study that will be sent to each participating dealership will be a composite of all salespeople throughout Louisiana. No individual salesperson nor dealership will be identified in the study.
6. To be included in the study, it is important that a salesperson answer all of the questions in the survey and that each question be answered as honestly as possible.
7. All salespeople returning usable questionnaires (per item 6 above) will be eligible to win one of two $75 cash awards. A drawing will be held after all questionnaires have been returned to the project director.
8. To be included in the study and be eligible for one of the cash awards, each salesperson should:
a. Complete the questionnaire, answering all questions as honestly as possible. They should respond to the questions based on how they really feel about the topic and not on how they feel someone else would like for them to respond to the questions.
b. Sign the questionnaire on the last page to be included in the drawing for the cash awards. Salespeople who do not wish to participate in the drawing may omit their name, but should complete all other questions in the sun/ey form.
c. Place the completed questionnaire in the envelope provided, seal the envelope, and sign their name across the sealed edge of the flap and the envelope. This will insure the confidentiality of their responses.
d. Return the sealed envelope with the completed questionnaire to you, or the person in your dealership coordinating the distribution and collection of questionnaires.
Reproduced with permission of the copyright owner. Further reproduction prohibited without permission.

247
9. Suggestions for returning your dealership’s completed questionnaires follow.
To Return Completed Questionnaires
A metered postage label along with a return mailing address label are included in this package. Please place completed questionnaires in the box or package that you received them in, affix the postage label along with the return address label to the package or box and return your questionnaires via regular mail.
Should the original package or box be unusable for the return mailing, please use a suitable envelope, package or box.
Completed questionnaires should be retumed to
Robert McMuman School of Business Texas Wesleyan University 1201 Wesleyan Fort Worth, TX 76105
If you have any questions regarding the return of the completed questionnaires, please give me (Robert McMurrian) a call at (817) 531-6500.
Reproduced with permission of the copyright owner. Further reproduction prohibited without permission.

248
AUTOMOBILE SALESPERSON SURVEY
Sponsored by Louisiana State University
In association with Louisiana Automobile Dealers Association
Department of Marketing College of Business Administration
Baton Rouge, Louisiana 70803 (504)388-8468
Salesperson Survey
In association with the Louisiana Automobile Dealers Association, we are conducting a statewide study of automobile salespeople to better understand certain factors that contribute to your success in selling. Our goal is to obtain information from automobile salespeople that will enable dealerships in Louisiana to better train new salespeople and continue to improve your opportunities to realize both your personal and frnancial selling goals.
In order for this project to be successful, we need your help. Please take a few minutes to complete this questionnaire; then, for confidentiality, place it in the envelope provided, seal the envelope, print your name across the back flap where it is sealed to the envelope, and return it to the person coordinating the study in your dealership. Your participation is important because it ensures that your organization will be truly represented in the results of the study. For your participation, you will have an opportimity to win one of two S75 cash awards based on a random drawing from the names of participating salespeople who return usable questiormaires.
Your responses will be kept strictly confidential. Your responses will not be reported to anyone in your dealership. Only the project director at Louisiana State University will see your responses. Your responses will be used by combining them with responses from salespeople from other dealerships throughout Louisiana. You are asked to identify yourself by name on the questionnaire so that we can enter your name in the cash drawing and track questionnaires that are not retumed. No one within your organization will see your responses. Please answer all questions as honestly as possible.
Thank you for your participation and cooperation.
Robert McMurrian Daryl McKee, Ph.D.Project Director Project ConsultantLouisiana State University Louisiana State University
Reproduced with permission of the copyright owner. Further reproduction prohibited without permission.

249
Instructions for Completing the Salesperson Questionnaire
1. Please read the instructions provided for each section of the questionnaire.
2. For your questionnaire to be valid and included in the study (to be eligible for one of the two S75 cash awards), you should answer all questions in the questionnaire. If you are not absolutely sure about how to respond to an item, circle the number that comes closest to describing how you feel or what you think about the statement.
3. Please respond to all items as honestly as possible. Please answer based on how you feel or what you personally believe, not what you think others want you to feel or believe.
4. All items in the questionnaire ask you to respond by placing a circle around the number best indicating how you feel or what you believe about the statements.
5. Should you wish to change a response to an item in the questionnaire, mark through the circled number you want to change with an “X” and place a circle around the number of your choice.
6. Some questions might seem to be very similar in wording to other questions. Please answer each question as honestly as you can without regard for other similar worded questions.
7. When you have completed all of the questions, place your questionnaire in the envelope provided with the questioimaire, seal the envelope, and write your name across the sealed part of the flap and the envelope. This is to insure the confidentiality of your answers.
8. Return the envelope with your completed questionnaire to the person coordinating the study in your dealership.
Thank you for your participation in the study. We appreciate your time and effort to complete the questionnaire.
Your responses will be kept strictly confidential. Your responses will not be reported to anyone in your dealership. Only the project director at Louisiana State University will see your responses.
Reproduced with permission of the copyright owner. Further reproduction prohibited without permission.
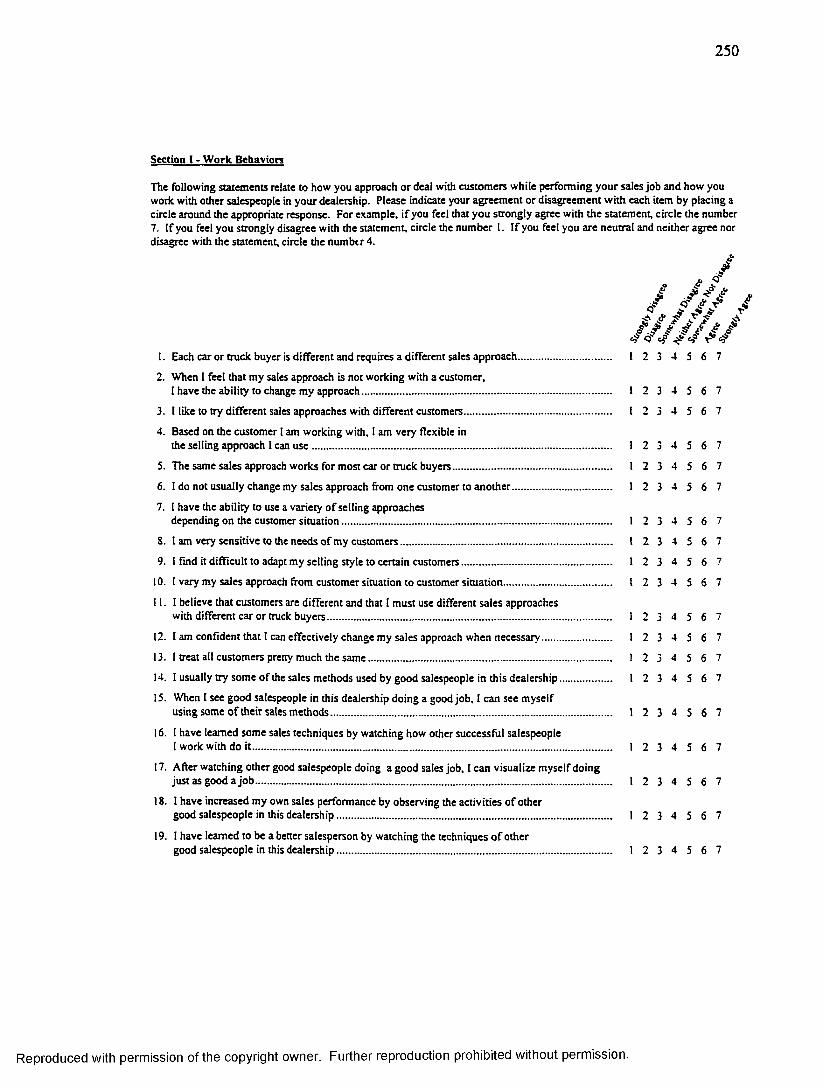
250
Section I - Work Behaviors
The following statem ents relate to how you approach o r deal with custom ers while perform ing yo u r sales job and how you work with other salespeople in your dealership. Please indicate your agreem ent o r disagreem ent w ith each item by placing a circle around the appropriate response. For example, i f you feel that you strongly agree with the statem ent, circle the number7. I f you feel you strongly disagree with the statem ent, circle the num ber I. I f you feel you are neutral and neither agree nor disagree with the statement, circle the num ber 4.
O'
2. W hen I feel that m y sales approach is not working with a customer, I have the ability to change m y approach..................................................
3. I like to n y different sales approaches with different custom ers.........
4. Based on the custom er I am w orking with, I am very flexible inthe selling approach I can u s e .......................................................................
5. The same sales approach w orks for m ost car o r truck buyers.........................
6. I do not usually change my sales approach from one customer to another..
7. I have the ability to use a variety o f selling approachesdepending on the customer situation ......................................................................
8. I am very sensitive to the needs o f m y custom ers................................................................. .
9. I find it d ifficult to adapt m y selling style to certain custom ers.........................................
10. I vary my sales approach from custom er situation to customer situation....................... .
I I I believe that customers are different and that I m ust use different sales approaches with different car o r truck buyers................................................................................................
12. I am confident that I can effectively change my sales approach when necessary.......
13. I treat all custom ers pretty much the sam e ..............................................................................
14. I usually try som e o f the sales methods used by good salespeople in this dealership.
15. When I see good salespeople in this dealership doing a good job , I can see m yself using some o f their sales m ethods.............................................................................................
16. I have learned som e sales techniques by watching how other successful salespeopleI work with do it.............................................................................................................................................. .
17. After w atching other good salespeople doing a good sales job, I can visualize m yself doing ju st as good a jo b .............................................................................................................................................
18. 1 have increased m y own sales performance by observing the activities o f othergood salespeople in this dealersh ip .............................................................................................................
19. I have learned to be a better salesperson by watching the techniques o f other good salespeople in this dealership ...............................................................................
1 2 3 4 5 6 7
1 2 3 4 5 6 7
1 2 3 4 5 6 7
1 2 3 4 5 6 7
1 2 3 4 5 6 7
1 2 3 4 5 6 7
1 2 3 4 5 6 7
I 2 3 4 5 6 7
1 2 3 4 5 6 7
I 2 3 4 5 6 7
1 2 3 4 5 6 7
1 2 3 4 5 6 7
1 2 3 4 5 6 7
1 2 3 4 5 6 7
1 2 3 4 5 6 7
1 2 3 4 5 6 7
1 2 3 4 5 6 7
1 2 3 4 5 6 7
1 2 3 4 5 6 7
Reproduced with permission of the copyright owner. Further reproduction prohibited without permission.

251
/ 4
20. I watch and then practice how o ther good salespeople in this dealershipdeal with difficult custom ers....................................................................................................................
21. I have learned how to b en er present the features o f our vehicles by watching howother salespeople in this dealership do it..............................................................................................
22. I am better at explaining the features o f our cars and trucks by watching how othergood salespeople I w ork with do it and then trying their m ethod.................................................
23. W hen I see other salespeople in this dealership being rewarded for doing a good jo b .I try to use some o f their selling m eth o d s........................................................................................... .
24. I sometimes try to use som e o f the sales m ethods that I see other good salespeoplein this dealership usin g ..............................................................................................................................
25. I look for selling techniques that other good salespeople in this dealership useand try to use them m y se lf .......................................................................................................................
26. I can visualize m yself using som e o f the selling methods that 1 see other good salespeople in this dealership using ....................................................................................................... .
27. 1 have learned some o f m y sales techniques from watching other goodsalespeople in this dealership in a c tio n ................................................................................................
28. I can visualize m yself doing the job like other successful salespeople in my dealership .........
29. 1 try to picture in my ow n m ind how successful salespeople in m y dealership dothe jo b and then be m ore like th em .......................................................................................................
30. 1 try to use some o f the selling m ethods that seem to work well for other salespeoplein this dealership..........................................................................................................................................
31. My fellow salespeople are the kind 1 would like to have around ..................................................
32. Overall, 1 am dissatisfied with the salespeople 1 work w ith ...........................................................
33. I get along with the salespeople I work w ith ......................................................................................
34. I am happy with my relationship with the salespeople I work w ith .............................................
35. The salespeople I w ork w ith are b o rin g ..............................................................................................
36. The salespeople I w ork w ith are stim ulating ......................................................................................
37. One o f the responsibilities o f experienced salespeople in this dealership is toassist new salespeople in learning the j o b ...........................................................................................
38. 1 got a better understanding o f m y sales job &om watching m ore experienced salespeople
39. W hen 1 first started, 1 received som e guidance from the experienced salespeople in the dealership on how to do a good jo b .......................................................................................................
40. In this dealership, 1 can watch how other good salespeople do the jo b .......................................
41. O ther salespeople in this dealership have helped me develop as a better salesperson...........
/ /2 3 4 5 6 7
4 5 6 7
4 5 6 7
4 5 6 7
4 5 6 7
2 3 4 5 6 7
4 5 6 7
2 3 4 5 6 7
(Please continue)
Reproduced with permission of the copyright owner. Further reproduction prohibited without permission.

252
Section II - Your Sales Job
The follow ing questions ask how you feel about the am o u n t and quality o f work that you do in selling autom obiles. Please indicate how you feel about each o f the items by c irc ling the appropriate response.
H ow o ften d o you . . .
/ / / / /1. work harder to increase your sales resu lts? 1 2 3 4 5
2. increase the am ount o f work you do in any given w e e k ? 1 2 3 4 5
3. perform the m ost professional jo b you are capable o f perform ing? 1 2 3 4 5
4. m ake sure your sales job is considered top quality b y your sales m anager? 1 2 3 4 5
The follow ing statem ents are about your expectations regard ing your sales job . Please indicate how you feel about each item by placing a circle around the m ost appropriate response.
H ow often do you feel th a t ......
/ / / / /5. doing things as well as I am capable results in h ig h er sales vo lum e................................................... 1 2 3 4 5
6. doing things as well as I am capable gets good resu lts in less t im e .................................................... 1 2 3 4 5
7. putting forth as m uch effort as possible results in h ig h er sales v o lum e............................................. 1 2 3 4 5
8. putting forth as m uch effort as possible gets good results in less tim e............................................... 1 2 3 4 5
Please respond to the following questions by indicating your feeling regarding the likelihood o f the results actually occurring.
W h at is th e likelihood th a t ^ d"
9. increasing your selling efforts and working harder w ill result in an increase in your unit sales? 1 2 3 4 5
10. increasing the time you spend with new potential c a r o r truck buyers will result in morenew cu sto m ers? .................................................................................................................................................... 1 2 3 4 5
11, increasing the tim e you spend on selling activities will result in an increase inyour overall sales attainm ent?.......................................................................................................................... 1 2 3 4 5
(Please continue)
Reproduced with permission of the copyright owner. Further reproduction prohibited without permission.

253
The following statem ents are related to how you feel about your sales skills and abilities. Please indicate your response to each item by circling the appropria te number.
f â y12. 1 am good at selling cars and/or trucks 1 2 3 4 5 6 7
13. It is difficult for m e to pu t pressure on a custom er 1 2 3 4 5 6 7
14. 1 know the right th ing to do in selling situations 1 2 3 4 5 6 7
15. I find it difficult to convince a car or truck buyer that has a different view point from m ine 1 2 3 4 5 6 7
16. My tem peram ent is n o t w ell-suited for selling cars o r tru c k s ................................................................ 1 2 3 4 5 6 7
17. I am good at finding o u t w hat a car or truck buyer w ants....................................................................... 1 2 3 4 5 6 7
18. It is easy for m e to ge t a car o r truck buyer to see my point o f v ie w 1 2 3 4 5 6 7
The following statem ents are related to how often you m ight feel som e tension in your sales job . Please respond to each item by placing a circle around the m ost appropriate response that indicates how you fell about the sta tem enc
19. 1 feel some tension Just in dealing with custom ers som e d a y s 1 2 3 4 5
20. 1 feel some tension w hen m y sales m anager is evaluating my sales perfo rm ance 1 2 3 4 5
21. I feel some tension i f I am no t making as m uch m oney in this jo b as 1 w ould l ik e 1 2 3 4 5
22. I feel some tension i f I believe that my sales m anager is not happy with m e 1 2 3 4 5
23. 1 feel some tension i f m ost other salespeople in this dealership are sellingmore units than m e ................................................................................................................................................. 1 2 3 4 5
24. 1 feel some tension i f I don’t believe that m y efforts will pay o f f in m ore sa les................................ 1 2 3 4 5
(Please Continue)
Reproduced with permission of the copyright owner. Further reproduction prohibited without permission.
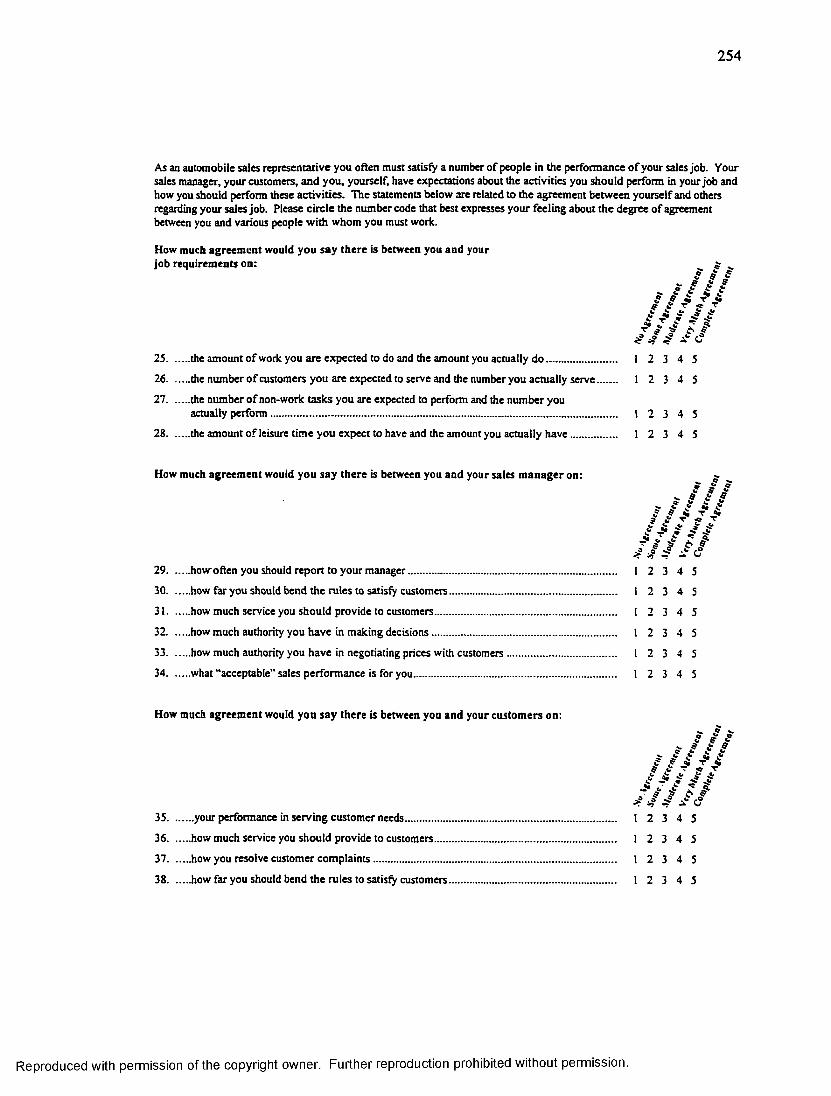
254
As an autom obile sales representative you often m ust satisfy a num ber o f people in the perform ance o f your sales Job. Your sales manager, your customers, a n d you . yourself, have expectations about the activities you sh ou ld perform in your job and how you should perform these activ ities. T he statements below are related to th e agreem ent betw een yourself and oAers regarding your sales job. Please c irc le the num ber code that best expresses your feeling about th e degree o f agreement between you and various people w ith w hom you must work.
How m uch ag ree m e n t w ould y o u sa y th e re is betw een you an d yourjo b requ irem en ts on : ÿ ^
i #2 5.........the am ount o f work you a re expected to do and the am ount you actually d o ............................. 1 2 3 4 5
2 6 .........the n iunber o f customers you are expected to serve and the num ber you actually se rv e 1 2 3 4 5
2 7........the num ber o f non-work tasks you are expected to perform and the num ber youactually p e rfo rm ............................................................................................................................................. 1 2 3 4 5
2 8........± e am ount o f leisure tim e y o u expect to have and the amount you actually h a v e ..................... 1 2 3 4 5
How much a g reem en t w ould y o u sa y th e re is betw een you a n d y o u r sales m a n a g e r on : ^
, #2 9 ........ho w o ften you should report to your m an ag er...................................................................................... 1 2 3 4 5
3 0 ........how far you should bend the ru les to satisfy custom ers...................................................................... 1 2 3 4 5
3 1.........how m uch service you should provide to custom ers.......................................................................... 1 2 3 4 5
3 2 .........how m uch authority you have in m aking decisions............................................................................ 1 2 3 4 5
3 3 .........how m uch authority you have in negotiating prices with custom ers............................................. 1 2 3 4 5
3 4 ........what “ acceptable” sales perform ance is for you.................................................................................... 1 2 3 4 5
How much agreem ent would you say there is between you and your custom ers on:
i f
/ m3 5 ........your perform ance in serv ing custom er needs........................................................................................ 1 2 3 4 5
3 6........how m uch service you should provide to custom ers........................................................................... 1 2 3 4 5
3 7 ........how you resolve custom er c o m p la in ts .................................................................................................... 1 2 3 4 5
3 8 ........how far you should bend th e ru les to satisfy custom ers..................................................................... 1 2 3 4 5
Reproduced with permission of the copyright owner. Further reproduction prohibited without permission.

255
How much agreem ent would you say there is between y o u r personal principles and:
â !3 9 .........how often you try to sell a vehicle to a custom er even i f you feel the vehicle is -i- - j . o
not exactly w hat the custom er really wants........................................................................................... 1 2 3 4 5
4 0 .........how often you feel pressure to stretch the truth in order to m ake a s a le ....................................... 1 2 3 4 5
4 1.........how often you feel pressure to apply the “hard sell” in order to m ake a s a le ............................. 1 2 3 4 5
In your job as an autom obile salesperson you may not alw ays be clear as to w hat your m anager and yo u r custom ers expect o f you. In general, salespeople tend to be more clear on som e things than others. Very few salespeople are equally certain about all aspects o f their Job. Please indicate your degree o f certain ty regarding the following statem ents by placing a circle around the appropriate num ber code.
How certain are you about:
4 2 .........how best to serve custom ers....................................................................................................................... 1 2 3 4 5
4 3.........how m uch tim e you should spend on various aspects o f your j o b .................................................. 1 2 3 4 5
4 4 .........how to resolve custom er com plain ts....................................................................................................... 1 2 3 4 5
4 5.........how to fill out required paperw ork........................................................................................................... 1 2 3 4 5
4 6.........how to plan and organize your daily work activ ities........................................................................... 1 2 3 4 5
4 7.........how to handle unusual custom er problems or situations................................................................... 1 2 3 4 5
4 8.........the extent to which you can bend the rules to satisfy custom ers..................................................... 1 2 3 4 5
4 9 ........ the extent to which you can m ake decisions w ithout your m anager’s ap p ro v a l.......................... 1 2 3 4 5
5 0 ........ where to get assistance in doing your sales jo b 1 2 3 4 5
5 1........ your dealership’s rules and regulations................................................................................................... 1 2 3 4 5
5 2........ how your sales m anager will evaluate your sales perform ance........................................................ 1 2 3 4 5
5 3 ........ how satisfied your sales m anager is with your sales perform ance.................................................. 1 2 3 4 5
5 4 ........ how your sales m anager expects you to allocate yo u r work tim e 1 2 3 4 5
5 5........ how satisfied your customers are with your perform ance 1 2 3 4 5
5 6 ........ w hat your customers expect o f you in perform ing your j o b ............................................................. 1 2 3 4 5
5 7........ how your customers feel that you match a vehicle with their personal needs............................ 1 2 3 4 5
Reproduced with permission of the copyright owner. Further reproduction prohibited without permission.

256
Below are several statem ents regard ing the salespeople you w ork with in y o u r dealership. Please indicate how you feel about each item by placing a circle aro im d the most appropriate response. a
/ / / / / / /58. The salespeople I w ork w ith include me in their conversations about th ings at w o rk 1 2 3 4 5 6 7
59. O ther salespeople in m y organization feel relaxed when they are w ith m e 1 2 3 4 5 6 7
60. M y fellow salespeople and I have some things in com m on 1 2 3 4 5 6 7
61. I can identify with m ost o f the other salespeople I w ork w ith 1 2 3 4 5 6 7
62. The other salespeople I w o rk w ith like m e 1 2 3 4 5 6 7
Section 111 - F eed b ack F ro m O th e rs
In your sales jo b you know how you are perform ing based on your sales a tta inm ent compared to yo u r sales goals. A nother way you m ay get information ab o u t your perform ance is through the input o f people you work w ith. This section contains statements about perform ance inform ation you receive from both other sa lespeople you work w ith and your sales m anager. Please indicate your level o f agreem ent or disagreem ent regarding the fo llow ing statements for both the salespeople you work with and your m anager by p lacing a circle around the num ber that is m ost appropriate. The first se t o f responses relates to the salespeople you w ork with. T h e second set o f responses relates to your sa les m anager.
T he o th e r sa lespeople in m y d e a le rsh ip : ^
1. congratulate me when I m ake a good gross profrt on a car o r truck s a l e 1 2 3 4 5 6 7
2. congratulate me when 1 sell a large num ber o f u n its 1 2 3 4 5 6 7
3. treat me differently w hen m y sales perform ance is g ood I 2 3 4 5 6 7
4. tell m e w hen m y sales ou tp u t is good 1 2 3 4 5 6 7
5. behave differently around m e when I am perform ing p o o rly I 2 3 4 5 6 7
6. let m e know when 1 m ake a low gross profit on a car o r truck s a le 1 2 3 4 5 6 7
7. let m e know when I am generally making low gross profits 1 2 3 4 5 6 7
8. treat m e differently w hen m y sales performance is not good 1 2 3 4 5 6 7
9. tell me when I ’m doing the right things on the j o b 1 2 3 4 5 6 7
10. let m e know when 1 do a g ood jo b in selling a v e h ic le 1 2 3 4 5 6 7
Reproduced with permission of the copyright owner. Further reproduction prohibited without permission.
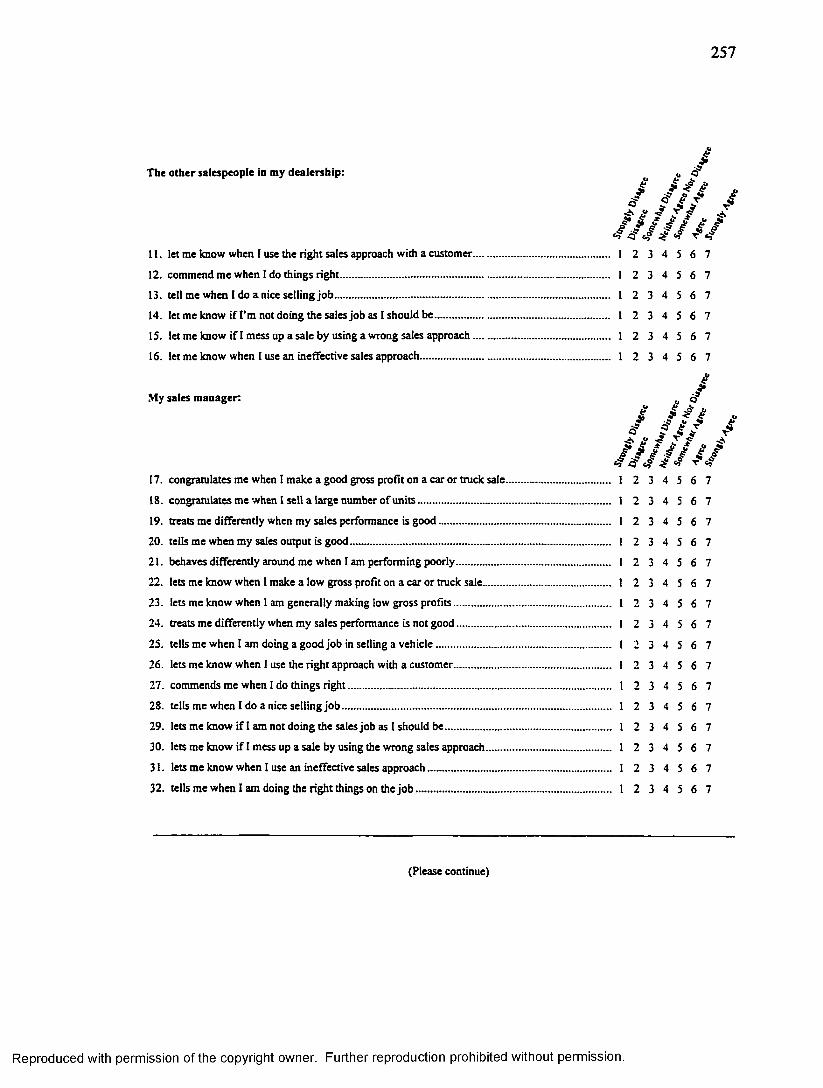
257
T he o th e r sa lespeople in m y d e a le rsh ip :
/ / / /. M M
11. let m e know when 1 use the right sales approach w ith a custom er 1 2 3 4 5 6 7
12. com m end m e w hen I do things rig h t 1 2 3 4 5 6 7
13. tell me w hen I do a nice selling jo b ............................................................................................................... 1 2 3 4 5 6 7
14. let m e know if I’m not doing the sales jo b as I should b e ....................................................................... 1 2 3 4 5 6 7
15. let me know if I m ess up a sale by using a w rong sales ap p ro ach 1 2 3 4 5 6 7
16. let me know when I use an ineffective sales approach............................................................................ 1 2 3 4 5 6 7
M y sales m an ag er:
. i / i
/ / / W i /
i
17. congratulates m e when I m ake a good gross profit on a car o r truck sale 1 2 3
18. congratulates m e w hen I sell a large num ber o f u n its I 2 3
19. treats me differently when m y sales perform ance is g o o d 1 2 3
20. tells m e w hen m y sales output is g ood .......................................................................................................... 1 2 3
21. behaves differently around m e when 1 am perform ing poorly ............................................................... 1 2 3
22. lets m e know w hen I m ake a low gross profit on a car o r truck sale.................................................... I 2 3
23. lets m e know when 1 am generally making low gross p ro fits ................................................................ 1 2 3
24. treats me differently when m y sales perform ance is not g o o d ............................................................... 1 2 3
25. tells m e w hen I am doing a good jo b in selling a v e h ic le ....................................................................... 1 2 3
26. lets m e know w hen 1 use the right approach with a custom er................................................................ I 2 3
27. comm ends m e w hen I do things r ig h t........................................................................................................... 1 2 3
28. tells m e w hen I do a nice selling jo b ............................................................................................................. 1 2 3
29. lets m e know if I am not doing the sales job as I should b e ................................................................... 1 2 3
30. lets m e know i f I mess up a sale by using the w rong sales approach.................................................. 1 2 3
31. lets m e know w hen I use an ineffective sales approach 1 2 3
32. tells m e w hen I am doing the righ t things on the j o b 1 2 3
5 6 7
5 6 7
5 6 7
5 6 7
5 6 7
5 6 7
5 6 7
5 6 7
5 6 7
5 6 7
5 6 7
5 6 7
5 6 7
5 6 7
5 6 7
5 6 7
(Please continue)
Reproduced with permission of the copyright owner. Further reproduction prohibited without permission.

258
Section IV - Sales Performance
This section lists several item s related to your sales perform ance so far in 1997. Please indicate how your would rate yourselfon each perform ance item so far in 1997 by placing a circle around the response that you feel is m ost appropriate. Please usethe following scale:
FB = Far below m y objectives SA = Slightly above my objectivesSB = Slightly below m y objectives FA = Far above my objectivesA = A chieving m y objectives
1. Your level o f dollar sales so far in 1 9 9 7 FB SB A SA FA
2. N um ber o f units you have sold so far in 1 9 9 7 FB SB A SA FA
3. Your overall sales techniques so far in 1997 FB SB A SA FA
4. Your sales comm issions so far in 1997 FB SB A SA FA
5. Your sales com m ission increases over the past 6 m onths in 1997 FB SB A SA FA
The items below are related to your sales perform ance last year in 1996. If you w ere in your current sales job, or a different sales job prior to jo in ing this dealership, please indicate how you would rate yourself for 1996 by placing a circle around the response that you feel is m ost appropriate. I f you were not in a sales jo b prior to this job , please circle NA for not applicable. Please use the follow ing scale;
FB = Far below m y objective SA = Slightly above my objectivesSB = Slightly below m y objectives FA = Far above my objectivesA = A chieved m y objectives NA = Not applicable
6. The level o f your dollar sales in 1996............................................................................................................FB SB A SA FA NA
7. Num ber o f units you sold in 1996...................................................................................................................FB SB A SA FA NA
8. Your overall sales techniques in 1996.............................................................................. .............................FB SB A SA FA NA
9. Y our sales comm issions in 1996....................................................................................... ..............................FB SB A SA FA NA
10. Your sales commission increases over the last 6 m onths in 1996........................... ..............................FB SB A SA FA NA
(Please continue)
Reproduced with permission of the copyright owner. Further reproduction prohibited without permission.

259
Section V - Salesperion Feelings
The following statem ents in this section relate to how you feel about yourself. For questions 1 - 5, please indicate how you rate yourself com pared to all other salespeople in your dealership by p lacing a circle around the num ber representing your preferred answer. For exam ple, on question I. if you feel you are in the top 20 percent o f all salespeople in your dealership, place a circle around the num ber 20 at the Top % end o f the rating scale. I f you feel you are right in the m iddle, place a circle around the num ber 50 a t the M iddle % o f the rating scale.
Com pared to all the o th e r salespeople in ycu r dealership:
1. How do you rate yourself in term s o f the unit sales volume you achieve?
Top % Middle % Bottom %
10------- 20-------30-------40--------50------40-------- 30----- 20-------- 10
2. How do you rate yourself in term s o f your ability to reach your sales goal?
Top % Middle % Bottom %
10-------20-------30-------40--------50------ 40-------- 30----- 20-------- 10
3. How do you rate yourself in term s o f the quality o f your sales perform ance in regard to custom er relations?
Top % Middle % Bottom %
10------- 20-------30-------40--------50---- 40--------- 3 0----- 20------- 10
4. How do you rate yourself in term s o f quality o f your perform ance in regard to m anagem ent o f tim e, planning, and overall ability?
Top % Middle % Bottom %
10-------20-------30-------40--------50------ 40-------- 30----- 20-------- 10
5. How do you rate yourself in term s o f quality o f your sales perform ance in regard to knowledge o f your vehicles, com petitors’ products, and custom ers’ needs?
Top % Middle % Bottom %
10-------20-------30-------40--------50---- 40---------30----- 20------- 10
(Please continue)
Reproduced with permission of the copyright owner. Further reproduction prohibited without permission.
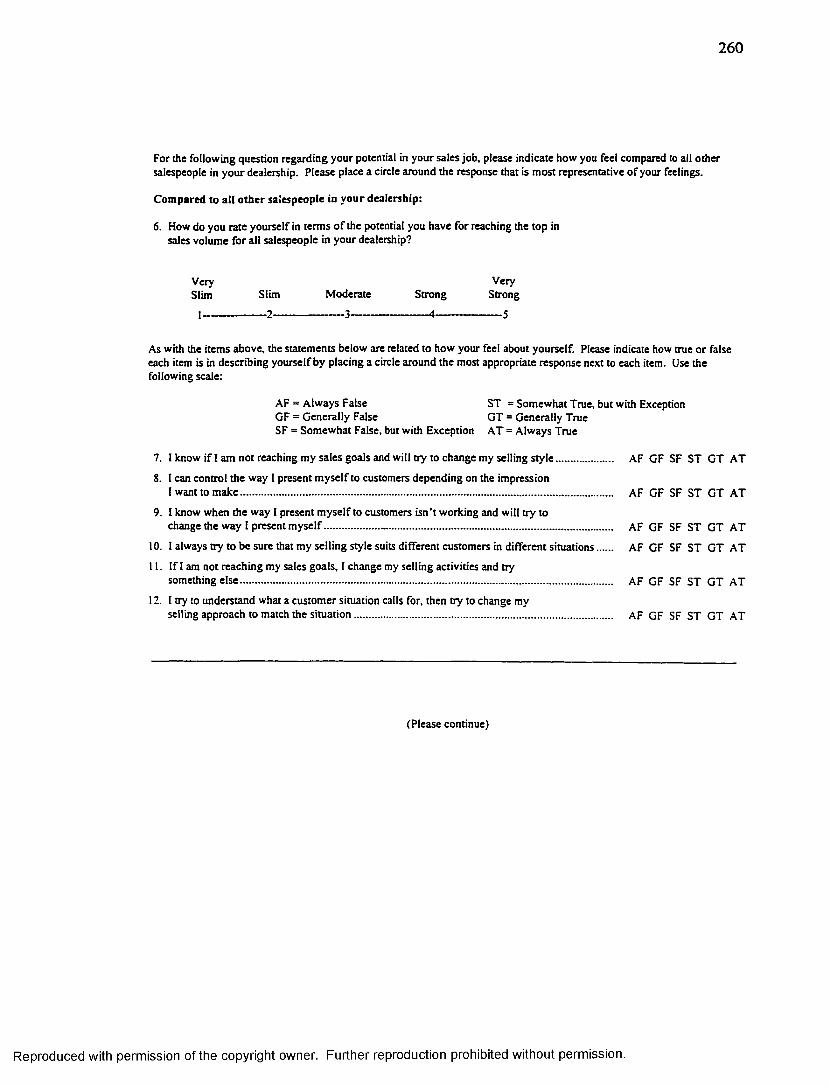
260
For the follow ing question regarding your potential in your sales job , please indicate how you feel compared to all o ther salespeople in y o u r dealership. Please place a circle around the response that is m ost representative o f your feelings.
C o m p ared to a ll o th e r sa lespeople in y o u r dealersh ip :
6. How do you rate yourself in term s o f the potential you have for reaching the top in sales voliune fo r all salespeople in your dealership?
Very VerySlim Slim M oderate Strong Strong
-2 --------------------- 3------------------------ 4-
As with the items above, the statem ents below are related to how your feel about yourself. Please indicate how true o r false each item is in describing yourse lf by placing a circle around the m ost appropriate response next to each item. Use the following scale:
AF = A lw ays False ST = Som ew hat True, but with ExceptionGF = G enerally False G T = G enerally TrueSF = Som ew hat False, but with Exception A T = A lw ays True
7. I know if I am not reaching m y sales goals and will try to change m y selling s ty le AF GF SF ST G T A T
8. I can control the w ay I present m y se lf to customers depending on the im pressionI want to m ak e ....................................................................................................................................................... AF GF SF ST G T A T
9. I know when the w ay I present m y se lf to customers isn’t w orking and will try tochange the w ay I present m y se lf ..................................................................................................................... AF GF SF ST G T A T
10. I always try to be sure that m y selling style suits different custom ers in different situations AF GF SF ST G T A T
11. If 1 am not reaching my sales goals, 1 change my selling activities and trysom ething e ls e ....................................................................................................................................................... AF GF SF ST G T A T
12. 1 try to understand what a custom er situation calls for, then try to change myselling approach to match the s itu a tio n ......................................................................................................... AF GF SF ST G T AT
(Please continue)
Reproduced with permission of the copyright owner. Further reproduction prohibited without permission.
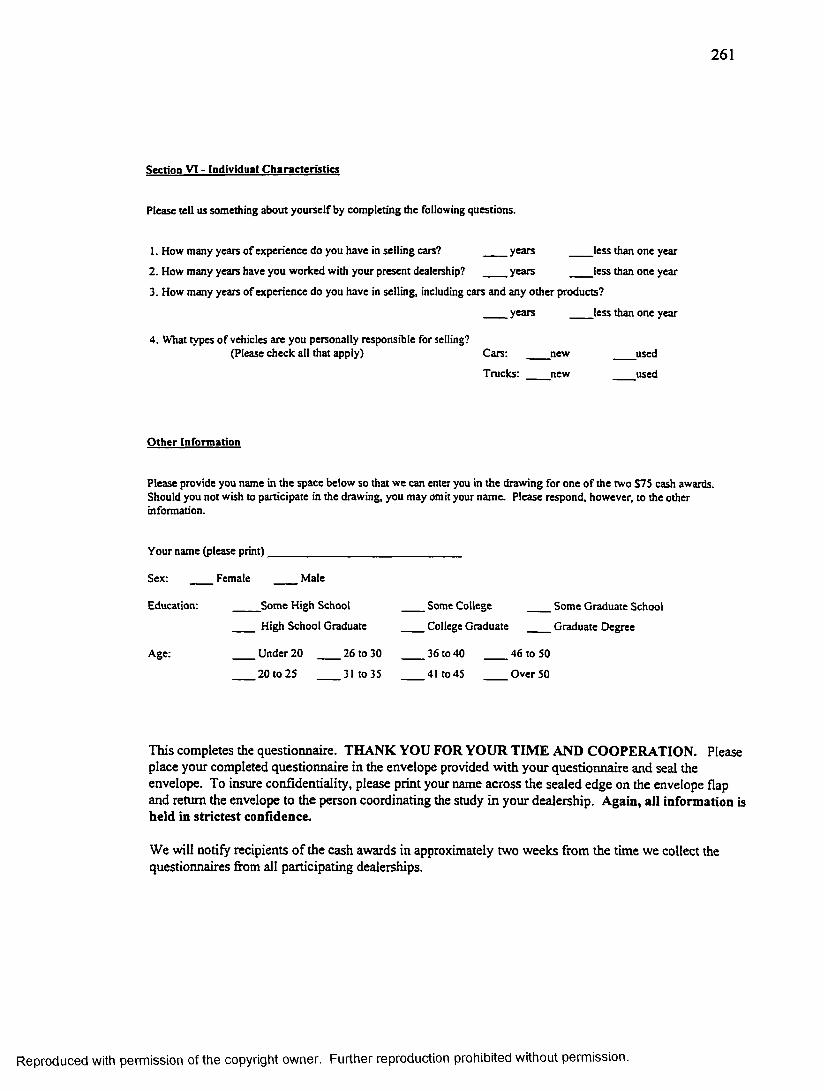
261
Section VI - Individual Characteristics
Please tell us som ething about y o u rse lf by com pleting the following questions.
1. How m any years o f experience do you have in selling cars? years less than one year
2. How m any years have you w orked with your present dealership? years less than one year
3. How m any years o f experience do you have in selling, including cars and any o th er products?
years less than one year
4 . What types o f vehicles are you personally responsible for selling?(Please check all that apply) Cars: new used
Trucks: new used
O th e r In fo rm atio n
Please provide you nam e in th e space below so that w e can enter you in the draw ing fo r one o f the two S75 cash awards. Should you not wish to participate in the drawing, you m ay omit your nam e. Please respond, however, to the other information.
Y our nam e (please p rin t) .
Sex: Female Male
Education: _____ Som e High School ____ Some College Som e G raduate School
High School G raduate College G raduate G raduate Degree
Age: ____ U nder 20 26 to 30 ____ 36 to 40 _____46 to 50
20 to 25 31 to 35 ____ 41 to 45 O ver 50
This completes the questionnaire. THANK YOU FOR YOUR TIME AND COOPERATION. Please place your completed questionnaire in the envelope provided with your questionnaire and seal the envelope. To insure confidentiality, please print your name across the sealed edge on the envelope flap and return the envelope to the person coordinating the study in your dealership. Again, all information is held in strictest confidence.
We will notify recipients of the cash awards in approximately two weeks from the time we collect the questionnaires from all participating dealerships.
Reproduced with permission of the copyright owner. Further reproduction prohibited without permission.

APPENDIX B
CORRELATION MATRIX
262
Reproduced with permission of the copyright owner. Further reproduction prohibited without permission.
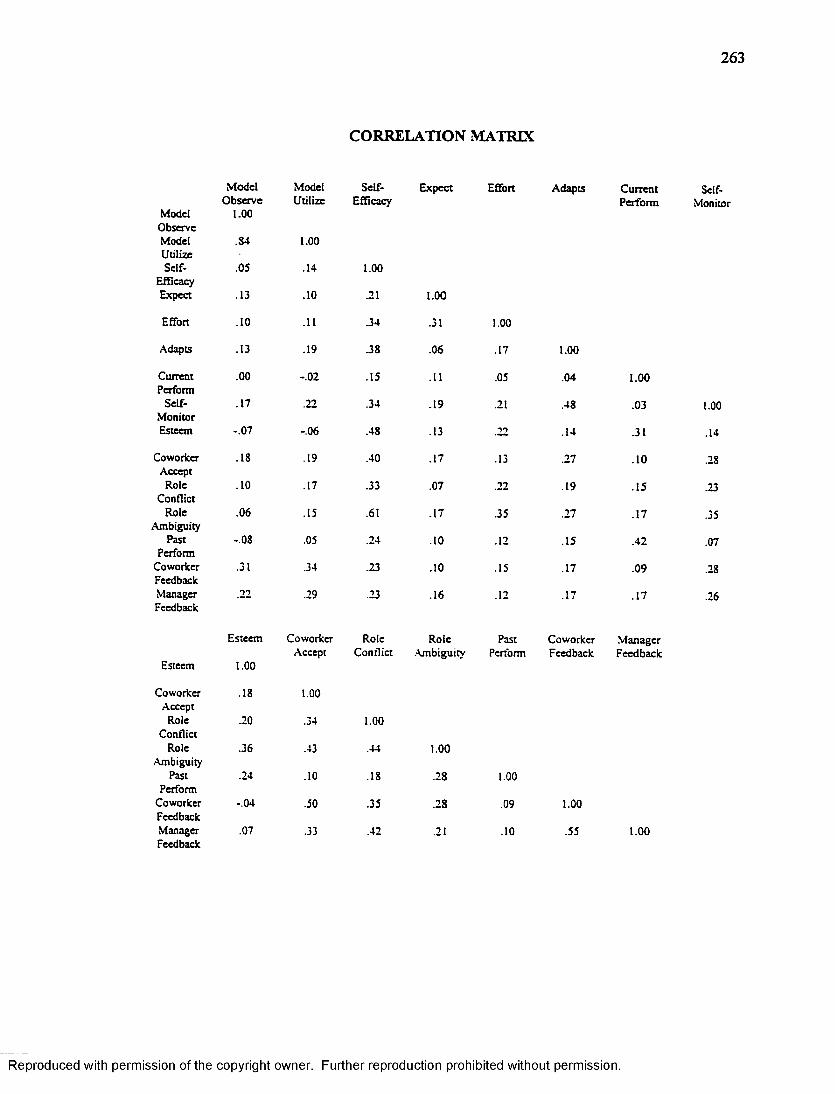
CORRELATION MATRIX
263
M odel Model Self- E xpect Effort AdaptsO bserve Utilize Efficacy
Model 1.00ObserveModel .84 1.00UtilizeSelf- .05 .14 1.00
EfficacyExpect .13 .10 .21 1.00
Effort .10 .11 .34 .31 1.00
Adapts .13 .19 .38 .06 .17 1.00
Current .00 -.02 .15 .11 .05 .04Perform
Self- .17 .22 .34 .19 .21 .48M onitorEsteem -.07 -.06 .48 .13 .22 .14
Coworker .18 .19 .40 .17 .13 .27Accept
Role .10 .17 .33 .07 .22 .19Conflict
Role .06 .15 .61 .17 .35 .27Ambiguity
Past -.08 .05 .24 .10 .12 .15Perform
Coworker .31 .34 .23 .10 .15 .17FeedbackM anager .22 .29 .23 .16 .12 .17Feedback
Esteem Coworker Role Role Past CoworkerAccept Conflict .•Vmbiguity Perform Feedback
Esteem 1.00
Coworker .18 1.00Accept
Role .20 .34 1.00Conflict
Role .36 .43 .44 1.00Ambiguity
Past .24 .10 .18 .28 1.00Perform
Coworker -.04 .50 .35 .28 .09 1.00FeedbackManager .07 .33 .42 .21 .10 .55Feedback
C urren tPerform
Self-Monitor
1.00
.03
.31
.10
.15
.17
.42
.09
.17
1.00
.14
.28
.23
.35
.07
.28
.26
1.00
Reproduced with permission of the copyright owner. Further reproduction prohibited without permission.

VITA
Robert McMurrian received his Bachelor of Science degree in Business
Administration in 1968, and his Master of Business Administration degree in 1969, from
Louisiana Tech University. Upon graduation, he was employed by the IBM Corporation
for which he worked in sales and sales management for sixteen years. He has been a sales
consultant for both large and small organizations and has been a partner in a computer
service company. During his business career, he received the Sales and Marketing
Executives’ award as outstanding salesperson and was elected to Outstanding Young Men
of America.
He entered the Ph.D. program in the Department o f Marketing at Louisiana State
University in 1992 and will receive his doctoral degree in August, 1998. He has served as
an assistant professor and director of graduate programs in the School of Business at
Texas Wesleyan University since 1996. Beginning in September, 1998, he will become an
assistant professor of marketing in the College of Business at the University of Tampa.
Academically, he has published in the Journal of Marketing, the Journal of Applied
Psvchologv. and in the proceedings of the American Marketing Association. Additionally,
Robert serves on the editorial board of Advances in Business Marketing and Purchasing.
264
Reproduced with permission of the copyright owner. Further reproduction prohibited without permission.

DOCTORAL EXAMINATION AND DISSERTATION REPORT
Candidates Robert Chapman McMurrian
Major Field: Business Administration (Marketing)
Title of Dissertation: A Social Cognitive Theory Model ofSalesperson Performance
Approved:
ffessor
Graduate SchoolDe,
EXAMINING COMMITTEE;
M L ,a
/V. /c—
Date of Examination:
Reproduced with permission of the copyright owner. Further reproduction prohibited without permission.

IMAGE EVALUATION TEST TARGET (Q A -3 )
f/
/
y
%
1.0
l.l
1.25
“ l ala KâIf Ui
1.4
m2.2
2.0
1.8
1.6
15 0 m m
V
V
o/ /
/
■A/ A P P L I E D IIV M G E . I n c
1653 East Main Street ^ Roctiester, NY 14609 USA
Ptione: 716/482-03(X)Fax; 716/283-5989
0 1993. Applied Image. Inc.. Ail Rights Reserved
Reproduced with permission of the copyright owner. Further reproduction prohibited without permission.