Embed Size (px)
Citation preview

THE INFLUENCE OF SALARY, WORKING ENVIRONMENT AND
CAREER DEVELOPMENT TOWARDS EMPLOYEE SATISFACTION
(A CASE STUDY OF PT XYZ CIKARANG)
By:
Fadhlan Imam Vidani
014201300044
A Skripsi presented to
Faculty of Business President University
in partial fulfillment of the requirements for
Bachelor Degree in Economics Major in Management
May 2017
i
PANEL OF EXAMINERS
APPROVAL SHEET
The Panel of Examiners declare that the Skripsi entitled “THE INFLUENCE OF
SALARY, WORKING ENVIRONMENT AND CAREER DEVELOPMENT
TOWARDS EMPLOYEE SATISFACTION (A CASE STUDY OF PT XYZ
CIKARANG)” that was submitted by Fadhlan Imam Vidani, majoring in
Management from the Faculty of Business was assessed and approved to have
passed the Oral Examination on May17th, 2017.
Liswandi, S.Pd., MM.
Chair- Panel of Examiners
Dr. Drs. Bruno Rumyaru, M.m
Examiner 1
Grace Amin, S.Psi, M.Psi, Psikolog
Examiner 2
ii
SKRIPSI ADVISER
RECOMMENDATION LETTER
This Skripsi entitled “THE INFLUENCE OF SALARY, WORKING
ENVIRONMENT AND CAREER DEVELOPMENT TOWARDS
EMPLOYEE SATISFACTION (A CASE STUDY OF PT XYZ
CIKARANG)” prepared, and submitted by Fadhlan Imam Vidani in partial
fulfillment of the requirements for the degree of Bachelor in the Faculty of
Business has been reviewed and found to have satisfied the requirements for a
Skripsi fit to be examined. I therefore recommend this Skripsi for Oral Defense.
Cikarang, May12th, 2017
Acknowledged by, Recommended by,
Dr. Dra. Genoveva, M.M Grace Amin, S.Psi, M.Psi, Psikolog
Head of Management Skripsi Advisor
Study Program

iii
DECLARATION OF
ORIGINALITY
I, declare that this Skripsi, entitled “THE INFLUENCE OF SALARY,
WORKING ENVIRONMENT AND CAREER DEVELOPMENT
TOWARDS EMPLOYEE SATISFACTION (A CASE STUDY OF PT XYZ
CIKARANG)” is, to the best of my knowledge and belief, an original piece of
work that has not been submitted, either in a whole or in a part, to another
university to obtain a degree.
Cikarang, May 12th, 2017
Fadhlan Imam Vidani

iv
ACKNOWLEDGEMENT
First of all, I would like to say countless thanks to The Fully Enlighten One and
The Only God, Allah SWT for the meaningful uncountable lessons and
experience from the beginning of my life until the future of my life, including this
Skripsi process. Fortunately, Allah SWT always blessed me to the day I have been
waiting to finish my study and graduate in President University, finally has come.
I would like to deliver my gratitude and appreciation to all the people that always
give me support to finish my study and research, especially to:
1. There will be no words to deliver my gratitude, how thankful I am to my
parents, a never tired couple who always support me materially and
spiritually, also love me unconditionally. Big thanks to my big family,
which I cannot mention one by one, for the love given to me.
2. My skripsi advisor, Grace Amin, S.Psi, M.Psi, Psikolog, who always gives
me supports and uncountable valuable advises during my skripsi process
until the end.
3. To my Mibil squad, which are Luqman Gandy Dewanto, Rido Bagas
Julianto, Rifki Fauzan Afrianda, Ghilmansyah Amri, Hanif Keanugraha,
Fajar Putra Ryanda, Yoga Sendra Irawan, Muhammad Alief Ramdhani,
Ageng Jaya Putra and Rizky Perdana. I would like to say thank you to
annoy me during the campus life, and also we share laugh together, but
more on the make fun of me. In the inside I really say thank you for
cheering me up, spending time together and giving me many of lessons.
4. To all my lovely sisters and brothers from Pusako, Mulyani Fitri, Sri
Ariani, Ventika Aurora, Ginsi Trianesti, Okie Friandi, and all the members
of Pusako. Thanks for every single moment we shared during the college
life in President University.
5. To my palu’s brother, Sultan Beybar, Muhammad Alief Ramdhani, Ageng
Jaya Putra, Farhan Abdullah, Ardiansyah Bakti. I would like to say thank
you for cheering me up, spending time together and for everything.

v
6. To my 4th level squad, thank you for the video, thank you for the time that
we shared during the college life in President University.
7. To all International Business students, thank you for all the corporation
and help until the last semester in the campus.
8. To all my beloved and close friends from other concentrations and majors
which I cannot mention one by one.
9. To PT XYZ employees, thank you for the contribution to fill my
questionnaire. Without your participation and help, I will not be able to
continue, even finish this skripsi, so I deliver my gratitude and I really
appreciate for all of your support.
.
Cikarang, May 12th, 2017
Fadhlan Imam Vidani

vi
TABLE OF CONTENTS
PANEL OF EXAMINERS APPROVAL SHEET ................................................... i
SKRIPSI ADVISER RECOMMENDATION LETTER ........................................ ii
DECLARATION OF ORIGINALITY .................................................................. iii
ACKNOWLEDGEMENT ..................................................................................... iv
TABLE OF CONTENTS ....................................................................................... vi
LIST OF TABLE ................................................................................................... ix
LIST OF FIGURES ................................................................................................ x
ABSTRACT ........................................................................................................... xi
CHAPTER I INTRODUCTION ............................................................................. 1
1.1 Background of Study ..................................................................................... 1
1.2 Problem Identification ................................................................................... 6
1.3 Statement of Problem .................................................................................... 6
1.4 Research Objectives ...................................................................................... 7
1.5 Significance of Study .................................................................................... 7
1.6 Scope and Limitation .................................................................................... 8
1.7 Organization of the Research ........................................................................ 8
CHAPTER II LITERATURE REVIEW ............................................................... 10
2.1 Introduction ................................................................................................. 10
2.2 Employee Satisfaction ................................................................................. 10
2.3 Salary .......................................................................................................... 11
2.4 Working Environment ................................................................................. 12
2.5 Career Development.................................................................................... 13
2.6 Previous Research ....................................................................................... 14
2.7 Research Gaps ............................................................................................. 15
CHAPTER III RESEARCH METHODOLOGY ................................................. 16
3.1 Theoretical Framework ............................................................................... 16
3.2 Research Framework ................................................................................... 17
3.3 Hypothesis ................................................................................................... 18
3.4 Operational Definitions of Variables .......................................................... 19
vii
3.5 Instrument (Questionnaire) ......................................................................... 20
3.6 Sampling ..................................................................................................... 21
3.7 Validity Test ................................................................................................ 23
3.8 Reliability Test ............................................................................................ 23
3.8. Descriptive Analysis .................................................................................. 25
3.8.1. Mean .................................................................................................... 25
3.8.2. Standard Deviation .............................................................................. 25
3.9 Classic Assumption Test ............................................................................. 26
3.9.1 Normality Test ..................................................................................... 26
3.9.2. Multicollinearity Test .......................................................................... 27
3.9.3 Heteroscedascity Test........................................................................... 27
3.10 Multiple Linear Regression Analysis ........................................................ 27
3.11 Hypothesis Testing .................................................................................... 28
3.11.1 T-test .................................................................................................. 28
3.11.2 F-test ................................................................................................... 28
3.11.3 Adjusted R square .............................................................................. 28
CHAPTER IV ANALYSIS AND INTERPRETATION ...................................... 29
4.1 Company Profile ......................................................................................... 29
Vision and Mission ....................................................................................... 30
Organizational Structur ................................................................................. 31
Product of PT XYZ ....................................................................................... 33
4.2 Pre-Test ....................................................................................................... 36
4.2.1 Validity Testing .................................................................................... 36
4.2.2 Reliability Testing ................................................................................ 37
4.3. Demographic Profile .................................................................................. 38
4.3.1 Age ....................................................................................................... 38
4.3.2 Gender .................................................................................................. 38
4.3.3 Education.............................................................................................. 39
4.3.4 Working Period .................................................................................... 40
4.4 Descriptive Analysis ................................................................................... 40
4.5 Classic Assumption Test ............................................................................. 41
viii
4.5.1 Normality Test ..................................................................................... 41
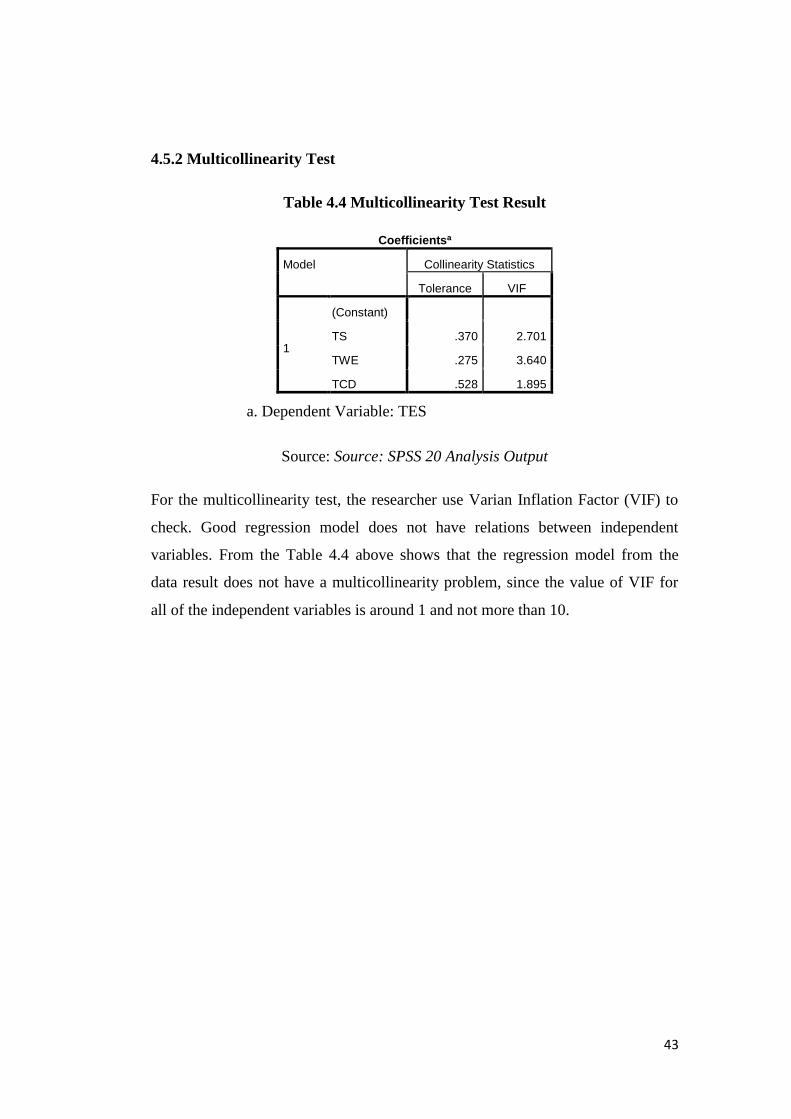
4.5.2 Multicollinearity Test ........................................................................... 43
4.5.3 Heteroscedascity Test........................................................................... 44
4.6 Multiple Linear Regression Analysis .......................................................... 45
4.7 Hypothesis Testing ...................................................................................... 46
4.7.1 Significance T-Test .............................................................................. 46
4.7.2 Significance F-Test .............................................................................. 48
4.7.3 Adjusted R Square ............................................................................... 48
4.8 Interpretation of the Result ......................................................................... 49
4.8.1 Salary on Employee Satisfaction ......................................................... 49
4.8.2 Working Environment on Employee Satisfaction................................ 50
4.8.3 Career Development on Employee Satisfaction .................................. 50
CHAPTER V CONCLUSION AND RECOMMENDATION ............................. 51
5.1 Conclusion .................................................................................................. 51
5.2 Recommendation......................................................................................... 52
5.2.1 Company .............................................................................................. 52
5.2.2 Future Research .................................................................................... 52
REFERENCES ...................................................................................................... 53
Book .................................................................................................................. 53
Thesis and Dissertations .................................................................................... 54
Journals ............................................................................................................. 55
Electronic Resources ......................................................................................... 58
APPENDIX ........................................................................................................... 59
ix
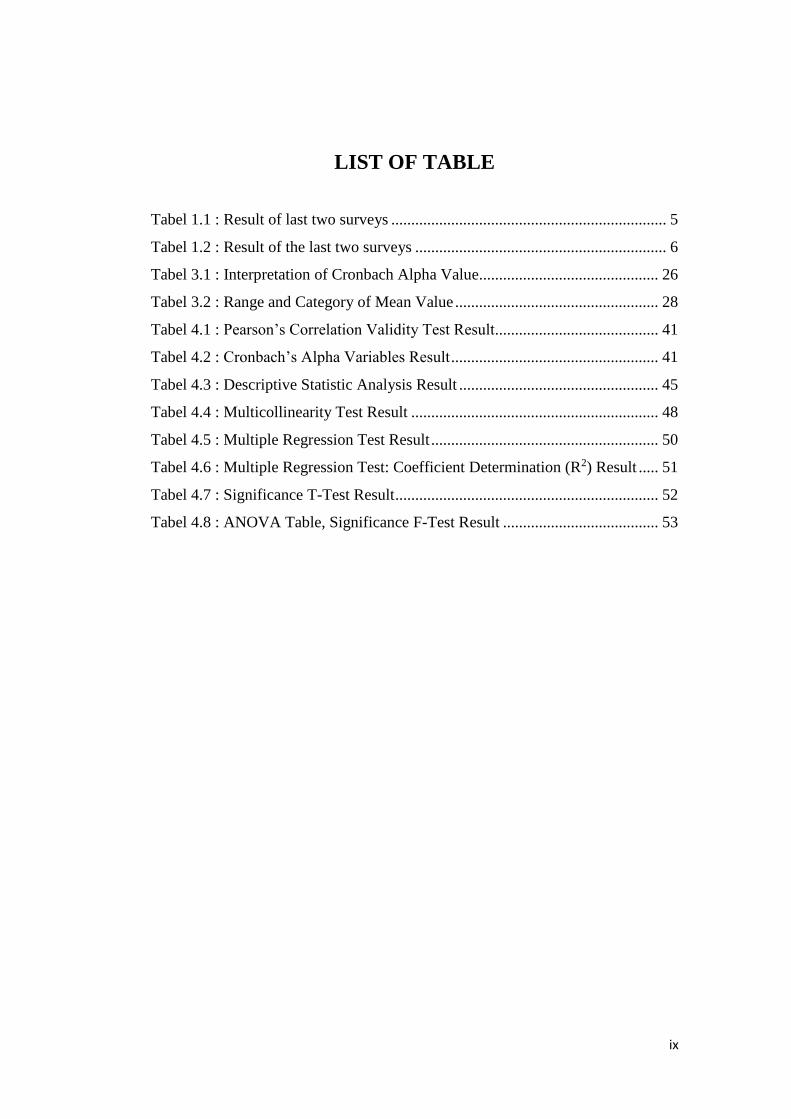
LIST OF TABLE
Tabel 1.1 : Result of last two surveys ..................................................................... 5
Tabel 1.2 : Result of the last two surveys ............................................................... 6
Tabel 3.1 : Interpretation of Cronbach Alpha Value............................................. 26
Tabel 3.2 : Range and Category of Mean Value ................................................... 28
Tabel 4.1 : Pearson’s Correlation Validity Test Result ......................................... 41
Tabel 4.2 : Cronbach’s Alpha Variables Result .................................................... 41
Tabel 4.3 : Descriptive Statistic Analysis Result .................................................. 45
Tabel 4.4 : Multicollinearity Test Result .............................................................. 48
Tabel 4.5 : Multiple Regression Test Result ......................................................... 50
Tabel 4.6 : Multiple Regression Test: Coefficient Determination (R2) Result ..... 51
Tabel 4.7 : Significance T-Test Result .................................................................. 52
Tabel 4.8 : ANOVA Table, Significance F-Test Result ....................................... 53
x
LIST OF FIGURES
Figure 3.1 Theoretical Framework ........................................................................ 16
Figure 3.2 Research Framework ........................................................................... 17
Figure 4.1 Age ....................................................................................................... 42
Figure 4.2 Gender.................................................................................................. 42
Figure 4.3 Education ............................................................................................. 43
Figure 4.4 Working Period .................................................................................... 44
Figure 4.5 P-P Plot Graph, Normality Test Result ............................................... 46
Figure 4.6 Histogram, Normality Test Result ....................................................... 47
Figure 4.7 Scatter Plot, Heteroscedascity Test Result .......................................... 49
xi
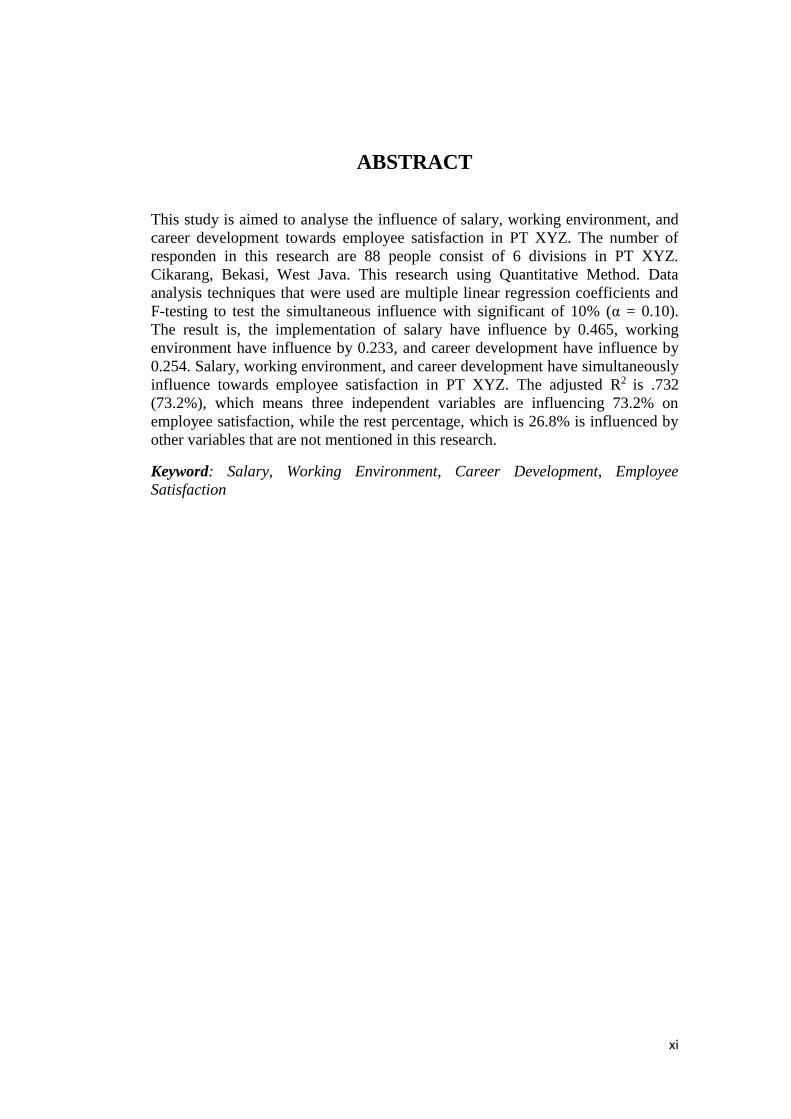
ABSTRACT
This study is aimed to analyse the influence of salary, working environment, and
career development towards employee satisfaction in PT XYZ. The number of
responden in this research are 88 people consist of 6 divisions in PT XYZ.
Cikarang, Bekasi, West Java. This research using Quantitative Method. Data
analysis techniques that were used are multiple linear regression coefficients and
F-testing to test the simultaneous influence with significant of 10% (α = 0.10).
The result is, the implementation of salary have influence by 0.465, working
environment have influence by 0.233, and career development have influence by
0.254. Salary, working environment, and career development have simultaneously
influence towards employee satisfaction in PT XYZ. The adjusted R2 is .732
(73.2%), which means three independent variables are influencing 73.2% on
employee satisfaction, while the rest percentage, which is 26.8% is influenced by
other variables that are not mentioned in this research.
Keyword: Salary, Working Environment, Career Development, Employee
Satisfaction
1
CHAPTER I
INTRODUCTION
1.1 Background of Study
Nowadays, the major problem that usually occurs in several countries are related
with the economic issues. However, the advancement of industry may lead to the
economic development which reduces the impact of economic issues. Industrial
development already happened in some of countries including, Africa, Indonesia,
India, China, and many other countries. Consequently, the development of
industry becomes the main focus and important aspect for every country all
around the world. Industrial development could have been established by the
support of several different aspects. Human resource, as one of the aspects, plays
the key role to obtain the industrial development. In other word, the
manufacturing industry needs to have an excellent human resource as the work
force (Rani and Khan, 2014).
In order to create an excellent human resource, the company must have a good
human resource management. According to Nyameh Jerome (2013), human
resource management is departments that are related with people who work inside
the organization. The management may include training, compensation,
communication, administration, employee motivation, and many other functions.
In other words, human resource management is any kind of administrative
activities to manage people that work inside the company.
Human resource management have one main aspect which is the measurement of
employee satisfaction. The company needs to ensure the employees are happy to
work which may lead to high rate of employee satisfaction. Every employee
expects to have a career in a good working environment (Sageer, Rafat, et al,
2012).

2
Furthermore, the company needs to provide a good environment to increase the
capability of the employee. The employee motivation and commitment will be
built easily and the employee also have a feeling of belongingness towards the
company. The employee’s productivity will increase which eventually lead to the
achievement of the company’s goal. In order to do that, the company need to
provide a good working environment for the employee. As the result, both
employer and employee will get a good output since the organization productivity
will increase and the employee turnover rate will decrease so does employee feel
satisfied to work in the company (Rani and Khan, 2014).
Employee satisfaction included the perception of the employee in it as stated by
Sageer, Rafat, et al (2012). In addition, the employee’s positive perspective about
the eagerness and feel of belongingness also described in the term of satisfaction
of employee. The feeling of the employee to work inside the company whether the
employee feels pleased or not, this is presented by the real opinion of the
employee on how they feel regarding their working condition. Sageer, Rafat, et al
(2012) also further explain that the company’s success has direct link to the
satisfaction of the employee who included in the actualization of the goals of the
company, that the talented people who retained by the company is one of the key
element to achieve the success of company. Several studies demonstrate that the
more employee feel satisfied with their work, will impact to the decreasing of
turnover and absenteeism. This is proven by 50% of the decreasing of turnover
and the increasing of customer satisfaction to an average of 95% and have
lowering the labor cost for about 12%.
As stated by Sageer, Rafat, et al (2012), the quality of product mostly depends on
the skill of labors and on site supervisors, employee play a significant role in the
success and outcome of the product and the company, as well as the profit and
growth are stimulated directly and primarily by customer loyalty. Customer
loyalty is direct consequence of customer satisfaction, well the customer
satisfaction is heavily influenced by customer perceptions of the value of services
they receive, and the value is created by satisfied, loyal and productive employees.
3
There is no specific limitation on how the employee reach the full satisfaction and
it may show different characteristics from each employee. The employee
sometime need to adjust or even change their behaviors in order to execute their
duties or responsibilities to be more effective, so the greater of job satisfaction
will be achieved. There are several things that related to the increasing of
employee satisfaction, for example maintain good relationship with the
colleagues, high salary, good working conditions, and training and career
developments. Those things will affect the level of employee satisfaction. In
general, how pleased the employee toward their work is explained by employee
satisfaction. To measure the satisfaction of employee in the workplace and
investigate what the employee are satisfied by is critical to the success and this is
may result in the increasing of the company’s profitability for having competitive
advantages. Therefore, researching the employee satisfaction in terms of different
factors and on various areas (such as manufacturing industry) will enrich the
literature and contribute to organizations (Aydin and Ceylan, 2009).
PT XYZ is a company engaged in manufacturing and engineering focus on
customized oriented. The company was established in 1983 with the status as a
subsidiary. As one of Indonesia’s leading company in heavy equipment
manufacturing & engineering, PT XYZ provides solutions based on customer’s
specific needs. With a vision to be the best engineering & energy logistic
company in the region, providing outstanding products & service quality to
achieve sustainable profitability & growth, PT XYZ business competence lies on
the ability to fulfill customer’s requirement through a breakthrough design and
innovation, in order to optimize the productivity. Equipped with the latest
technology on manufacturing system and qualified engineering, PT XYZ will
ensure the production runs faster, more efficient and reliable to deliver the product
as it’s scheduled. As a completed cycle of the best solutions, PT XYZ also gives
more value by facilitating customers with excellent after sales services (source:
PT XYZ, 2016).

4
In last three decades, an unprecedented degree of change has experienced by
manufacturing industries, implicate the drastic changes in management
approaches, product and process technologies, the expectation of customer, as
well as the competitive behavior (Wakjira and Singh, 2012). Depending on the
market position, several things such as Innovation of technology, quality
improvement and cost reduction have been manufacturing industries’ focus on
product-related strategies (Lay, Copani, et al, 2010).
The vision of the company to be the best engineering company in the region,
providing outstanding products & service quality to achieve sustainable
profitability & growth. In order to realize the vision of the company along with
the increase of production, one of the steps taken by PT XYZ is holding a survey
to employee once every two years. The survey was conducted to measure the level
of employee satisfaction and to investigate the employee expectations as an input
to implement improvements and development in PT XYZ.
The loyalty and the productivity of employee will increase as long as they feel
satisfied with their work, and this is will affect the customer satisfaction as well as
the productivity of organization. As appointed by Aydin and Ceylan (2008),
supplying the expectations of employee in order to approach the employee
satisfaction should be the thing that company need to try.
Table 1.1 Result of last two surveys
Division Index (%)
2014 2016
Marketing & Sales 71.24 66.57
Parts & Service 72.03 67.55
Plant Operation 70.21 64.80
Engineering 67.48 70.22
HC,GA,ESR 76.59 71.15
Business Management
& Development 69.57 65.47
Finance & Accounting 63.64 61.59
Sources: Human Capital Department of PT XYZ (2016)

5
For the last four years (last two surveys), the index of employee satisfaction in PT
XYZ has decreased significantly. In 2014, the index has reached to the level 70.42
%, while in 2016, the index has decreased to the level 66.22% (Human Capital
Department of PT XYZ, 2016). From the data, the index of Marketing and Sales
division decreased from 71.24% to 66.57%, Parts and Service division decreased
from 72.03% to 67.55%, Plant Operation division has decreased significantly
from 70.21% to 64.80%, HC,GA,ESR division decreased 76.59% to 71.15,
Business Management & Development division decreased from 69.57% to
65.47%, Finance & Accounting division decreased from 63.64% to 61.59%,
while only Engineering division increased from 67.48% to 70.22% from the last
two surveys.
According to Sageer, Rafat, et al (2012), they defined the factors that determine
employee satisfaction of the employees. The factors are salary, working
environment and career development.
Table 1.2 Result of the last two surveys
Division Index (%)
2014 2016
Salary 64.81 61.91
Working Environment 65.14 62.76
Career Development 66.02 60.73
Sources: Human Capital Department of PT XYZ (2016)
Table 1.2 shows that the decrease in salary, working environment, and career
development factors from the last two surveys. Based on the data, salary
decreased from 64.81% in 2014 to 61.91% in 2016, working environment
decreased from 65.14% in 2014 to 62.76% in 2016, while career development
decreased from 66.02% in 2014 to 60.73% in 2016. From the data above, we
know that there is a problem in salary, working environment, and career
development with the satisfaction of employee in PT XYZ. High satisfaction will
affect employee’s positive attitude toward their job. On the other hand, low
satisfaction will lead to negative attitude of employee in viewing their job.
6
Because, in achieving a success, the company need to keep the employee satisfied
toward their job. Then, high working efficiency will create, if the expectation of
employee over the job satisfaction is reached. If employee is not satisfied enough
toward their job, the possibility of the employee leaving the company will be
higher (Ngoc Diem, 2016).
1.2 Problem Identification
In the process of preparation of this study, the researchers found some problems
that occur in PT XYZ, supported by information and data from Human Capital
Department. Some of these problems include:
1. The company salary system is considered still problematic for employees
and ultimately affects the level of employee satisfaction.
2. Unconducive working environment will make employees feel
uncomfortable at work and ultimately affect the level of employee
satisfaction.
3. The level career path is still quite low with lack of training and promotion
and also affects the level of employee satisfaction.
Based on the example of the problems that occur, continuity of satisfaction of
employee performance is highly dependent on the satisfaction of salary, working
environment, and career development.
1.3 Statement of Problem
To solve the problem mentioned in the background of the research, the researcher
attempts to answer as many as four questions to get the problems solved. They
are:
1. Is there any significant influence from Salary towards Employee
Satisfaction?
2. Is there any significant influence from Working Environment towards
Employee Satisfaction?
7
3. Is there any significant influence from Career Development towards
Employee Satisfaction?
4. Is there any simultaneous significant influence from Salary, Working
Environment and Career Development towards Employee Satisfaction?
1.4 Research Objectives
The objective of this research is as follow:
1. To convince if there is any significant influence from Salary towards
Employee Satisfaction.
2. To convince if there is any significant influence from Working
Environment towards Employee Satisfaction.
3. To convince if there is any significant influence from Career Development
towards Employee Satisfaction.
4. To convince if there is any simultaneous significant influence from Salary
and Benefit, Working Environment and Career Development towards
Employee Satisfaction.
1.5 Significance of Study
1. Company
The researcher hopes that the research study can be a benchmark for the company
regarding the satisfaction of employee.
2. Future Researcher
The researcher hopes that the result of this research would offer enlightenment to
the future researchers who are willing to choose similar topic of research.
8
1.6 Scope and Limitation
In each study, scope and limitations need to be set so that the researcher's results
are more specific and relevant to current conditions in a particular field of study.
Therefore, the researcher has determined the scope and limitations of this research
only on PT XYZ. This research will use questionnaire to gathered the data for the
researcher, and it will distribute to the employees in 6 divisions at head office of
PT XYZ and have join PT XYZ more than one years. This research was
conducted in three months (April – May) 2017.
1.7 Organization of the Research
The organization of the research in this paper is as follows.
1. Introduction
In this chapter, researcher explains the background of research, related
activities, major problems in research and objectives as well as research
benefits.
2. Literature Review
In this chapter, the second chapter describes all relevant theories and studies
of related variables that affect the topic of this study. There are also research
gaps from various studies previously held by other researchers.
3. Methodology
In this chapter, researcher shows the tools used and the techniques used in this
study.
4. Data Analysis
In this chapter, the data used to complete the study will be processed and
compare the results according to the theory in the methodology.
9
5. Conclusion and Recommendation
In this chapter, once all is known, and the results are shown, the researcher
concludes everything corresponds to the main problem in the introduction.
Researchers also provide recommendations to future researchers about the
weakest variables in this study that may be of concern to them.
10
CHAPTER II
LITERATURE REVIEW
2.1 Introduction
This chapter explains the theories underlying this study. The dependent variable
and each independent variable. Research gaps are also discussed in this chapter as
previous research or pivot in this study.
2.2 Employee Satisfaction
Based on Sharma, Chuen, et al (2016), employee satisfaction can be described as
a gratitude feeling that employees have from the job, which means the employee
feel happy to work in the company or not. Then, employee satisfaction can be
defined as the satisfaction of the employee when performing the work in a
company.
Employee satisfaction as the effective orientation that an employee has towards
his or her work, it may also be recognized as the individual’s perception and
evaluation of the overall work environment. A common feature that connects
these definitions is that employee satisfaction is concerned with what people in an
organization feel about their overall work, (Mafini and Pooe, 2013). According to
Masood, Ain, et al (2014) employee satisfaction is a significant variable that is
able to give estimation about general emotion and thinking forms of employees
about their job and workplace. Thus, employee satisfaction related to hopes of the
employee about the workplace and his approaches forward his job.
There are several elements of employee satisfaction. The first element is the
common satisfaction with the work which consists of work condition, working
time and company reputation. The second element is employee relationship which
consists of the relationship among employees, and interview with the employee.

11
The third element is remuneration, benefits and organizational culture which
include incentive and benefits, and rewards and can be in the form of praise,
promotion, education, permanent jobs, supportive atmosphere and culture in the
company. The fourth element is employee loyalty once those employees feel
satisfied with the result they will be loyal to their Company (Hatane, 2015).
2.3 Salary
The most important thing that can help to increase the employee satisfaction is
salary. Followed by the way of Ruby’s thinking, once the employee decided to
increase their salary, they should accomplish the best performance. Salary actually
stands for the compensation that has been given to the office employee,
professionals, managers, foreman, technical staff and supplementary that has been
work in an organization or company. The employee can be paid by weekly,
monthly, even annually according to their performance (Ruby, 2012).
According to Amadeo (2012) salary refer to money that provided by member of
staff to the employees in exchange for accomplish specified of their responsibility.
There two types of salary structures: first is a hierarchical and compressed.
Hierarchical pay structures are highly disseminated; a small number of individuals
receive a significant amount of cash, while the other employees make a portion of
that amount. This type of pay structure is often used to create a competitive work
environment to reward success. On the other hand, a compacted salary structure is
concentrate; all employees receive similar payment. The rationale for using a
compacted pay structure is the promotion of consistency between employees.
Moreover, in every case, awareness needs to be illustrated to individuals’
perspective about their payment and effort in relation to others within the same
organization (Fullard, 2012)
Based on the thought of Ngoc Diem (2016), the salary is a system to express of
how precious an employee is in the organization. Fundamentally, it is already
mentioned that the salary one of the most important thing in order to maintain and
preserve human resources, especially the capable people. A reasonable salary uses
12
the basis of an agreement that is stated in the treaty or implicit agreement between
the employers and the superior. Salary also considered as one of the crucial
determinants for employee satisfaction because it is accomplishing employee
needs from their fundamental needs to the higher-level of needs.
2.4 Working Environment
Based on the Ruchi Jain (2014) statement, the work environment is the
environment where the employee working on. While according to the statement
of Bushiri (2014), working environment is the correlation among employees and
the environment in which people are works. Working environment has to be
suitable with the satisfaction of employee because it is a good method to motivate
the employees to produce higher revenue. Bushiri (2014) also mentioned about
the working environment that it is differentiated into three sub-environments
which are; technical environments, human environments, and organizational
environments. First technical environment permits employees to complete the
activities for the period of their work which can be in the shape of instruments,
tools, technological infrastructure, additional physical and technical feature of
accompany or organization. Then human environment allowed the employee to
present an informal communication to substitute the knowledge and thoughts in
the works space.
Following the thinking of Raziq and Maulabakhsh (2014), the working
environment consists of two comprehensive scopes such as occupation and
situation. Work consist of the entire diversity of the job characteristics such as the
method of the job conceded and finished, including the responsibilities like the
training activity, manage on one of individual work that connected with their
activity, the logic of accomplishment from work, the diversity of responsibility
and the intrinsic worth of the responsibilities. There is a constructive connection
between work environment and intrinsic feature of satisfaction. Additionally, they
explained the second dimension of satisfaction that well known as the situation
includes the physical working and social working circumstances.

13
Raziq and Maulabakhsh (2014) also stated that the parts of working environment
are also about the wellbeing of employees, the protection of their career, maintain
the relation with the colleague, acknowledgement to the best achievement,
motivation to performing well and contribution in the assessment of making
process of the dense. When the employees recognize that the dense revolves
became an important, they determine have a high rank of dedication and the
wisdom of ownership for their organization.
2.5 Career Development
As stated by Pratiwi (2015), in developing career, the employee need to improve
the individual work ability in order to achieve its desired career. Thus, can be
concluded individual continuously increasing their personal efforts to realize the
goal of career planning in which adjusted to the organization’s conditions. Kaya
and Ceylan (2014) explained that career is the process in which it can create the
accumulation of experiences arising from jobs, tasks, and the positions of the
person or even from the transitions such as promotions, transfers through these
positions. As well as the career development have direct link to personal and
organizational goals.
People faced successes and failures related to the experiences of their job and by
this condition it also provide the development of their career (Kaya and Ceylan,
2014). Career development program have been implemented by many
organizations, so the organization will be able to retain which employee is good.
This program helps the organization to educate the employee on how their effort
help them to achieve their desired career and contribute to the organization at the
same time.Getting promoted or moving up to the higher corporate position is not
the only condition to develop career, but how individual can find a place to
express their best effort and contribute the the success of company is the best
execution in career development (Long, Xuan, et al 2014).
The continuous improvement and development of the skill of employees,
competencies, knowledge, and attitudes are the important things that career

14
development program have to make sure. According to Saleem and Amin (2013)
this is a crucial thing to maintain and develop the individual and the organization
as a whole, so the choice of the company to invest in the development of career of
the employee must be a good choice. Long, Xuan, et al (2014) stated that in work
the personal satisfaction and the term of fulfillment demanded more by employee
nowadays. So the employee would prefer to gain the opportunity for self-
development and to be empowered.
2.6 Previous Research
1. Ngoc Diem, 2016 had made a research about “The factors affecting
employee satisfaction and loyalty” had a purpose to explore the factors
that affecting the satisfaction of employee in the people committee of Binh
Tan District, Vietnam. The research using quantitative method with the
purpose is to test measurement and structural model. In the research, the
result comes up with factor to measure the employee satisfaction. The
result indicated a positive correlation between satisfaction of employee
with salary and career development.
2. Masood, Ain, et al 2014 conducted a research about “factors affecting
employee satisfaction of the public and private sector organizations”. The
purpose of the research is to find out the factors that affect employee
satisfaction and how much is the intensity. The research was using
quantitative method with regression analysis. The research can help us to
better understand about the satisfaction level of employee and how we can
motivate employees to perform their job efficiently and effectively. The
result of the research shows significant influence of working environment
and salary on employee satisfaction and job performance.
3. Tomazevic, Seljak, et al 2013 had made the research entitled “Factors
influencing employee satisfaction in the police service: the case of
Slovenia. The purpose of the research is to examine the factors of
employee satisfaction and identify the impact of the groups of factors on
employee satisfaction. The measurement of satisfaction of all employees
15
in the Slovenian police is based on the comprehensive on-line
questionnaire. Factor analysis was used to formulate the facets of
satisfaction. Multiple linear regression analysis was performed to identify
the predictors of facets of employee satisfaction. The result of the research
shows that salary and working environment have an influence with
employee satisfaction with different levels of intensity.
2.7 Research Gaps
This study aims to analyse the influence of salary, working environment and
career development towards employee satisfaction in PT XYZ. There are many
factors that influence employee satisfaction and it founded on (Ngoc Diem, 2016)
discussed about the factors affecting employee satisfaction and loyalty, (Masood,
Ain, et al 2014) discussed about factors affecting employee satisfaction of the
public and private sector organizations, and (Tomazevic, Seljak, et al 2013)
discussed about factors influencing employee satisfaction in police service. From
those studies, researcher found different variables that influence employee
satisfaction. Therefore, the researcher decides to combine those factors and find
the relationship on employee satisfaction. It becomes the research gap of this
study. In addition, the case study location also becomes research gap because the
researcher uses different location to do the research.

16
CHAPTER III
RESEARCH METHODOLOGY
The targets in this review are the focus on the amount of salary, work
environment and career development that can affect employee satisfaction. Then,
this search can be accessed as the research objective for this research. This
research is categorized as quantitative research.
3.1 Theoretical Framework
Figure 3.1 Theoretical Framework
Source: Adaptation from Sageer, Rafat, et al (2012).
Salary
(X1)
1. Basic Salary
2. Proportionate
3. Bonus
4. Medical Insurance
Working Environment
(X2)
1. Physical Environment
2. Mental Environment
3. Social Environment
Career Development
(X3)
1. Promotion
2. Coaching
3. Appraisal
4. Training
Employee
Satisfaction
(Y)
1. Satisfaction
2. Expectation
3. pride
H1
H2
H3
H4

17
3.2 Research Framework
The Research Methods Framework section is a resource designed to help
researchers of all types design a custom research methodology for their particular
project. While the research framework is organized into seven components with
clear linkages, the process of developing a good research design is an iterative and
often messy process. Each of the nine components is linked to the previous and
subsequent components and all components are linked to the conceptual
framework.
Figure 3.2 Research Framework
Source: Adaptation from Sekaran and Bougie (2013)
18
3.3 Hypothesis
H01: There is no significant and influence of salary towards employee
satisfaction.
Ha1: There is a significant influence of salary on employee satisfaction.
H02: There is no significant influence of working environment towards employee
satisfaction.
Ha2: There is a significant influence of working environment towards employee
satisfaction.
H03: There is no significant influence of career development towards employee
satisfaction.
Ha3: There is a significant influence of career development towards employee
satisfaction.
H04: There is no simultaneously significant influence of salary, working
environment, and career development towards employee satisfaction.
Ha4: There is a simultaneously significant influence of salary, working
environment and caree development towards employee satisfaction.

19
3.4 Operational Definitions of Variables
An operational definition is the operational definition from each variables include
the indicator from the definition.
Variable Definition Indicator
Salary
(X1)
Refer to money that provided by
employer to employees in
exchange for performing specified
service (Amadeo, 2012)
1. Basic salary
2. Proportionate
3. Bonus
4. Medical Insurance
Working
Environment
(X2)
The work environment can be
described as the environment in
which people are working (Jain,
2014)
1. Physical
Environment
2. Mental Environment
3. Social Environment
Career
Development
(X3)
A continuous process through
which individuals through
personal efforts in order to realize
the goal of career planning
tailored to the conditions of the
organization (Pratiwi, 2015)
1. Promotion
2. Coaching
3. Appraisal
4. Training
Employee
Satisfaction
(X4)
A significant variable that is able
to give estimation about general
emotion and thinking forms of
employees about their job and
workplace (Masood, Ain, et al,
2014)
1. Satisfaction
2. Expectation
3. Pride

20
3.5 Instrument (Questionnaire)
There are questionnaire that were distributed to several employee in PT XYZ
which consist of 5 different value. Those value are StronglyDisagree with a value
of 1, Disagree with a value of 2, Neutral with a value of 3, Agree with a value of
4, Strongly Agree with a value of 5 (Sekaran and Bougie, 2013). The instrument
is shown as follow:
NO Salary SD D N A SA
1. The basic salary is enough to cover your
most basic expenses.
2. I feel that my salary is proportionate to the
work that I do.
3. Giving bonuses by the company encouraged
me to perform better.
4.
The medical insurance of the company
covers all the possible injuries caused during
the work.
NO Working Environment SD D N A SA
1.
My workplace provides an undisturbed
environment so that I can concentrate on my
work.
2. The facilities provided by the company are
adequate and easy to use.
3. I am satisfied at working relationship with
the people around me.
4. Spirit of cooperation and teamwork exist in
the organization.
5. I usually find it easy when accomplishing the
task.

21
6. My superior always challenge me with the
task each day.
NO Career Development SD D N A SA
1. I get the opportunity of promotion and career
development in this organization.
2. My superior does Coaching and Counseling
in the employee development process.
3. I understand the scoring system of work done
by the company.
4.
The company gives me the opportunity to
attend training that suitable to needs of the
job.
NO Employee Satisfaction SD D N A SA
1. I am satisfied with my current work.
2. I feel satisfied when I do my job well.
3. My job in this organization has met my
expectations.
4. I am proud to tell people that I am part of this
organization.
3.6 Sampling
The data are collected from several respondents of PT XYZ Head Office,
Cikarang. The questionnaire are distributed to 30 respondents in the pre-test to
analyze the validity and reliability. The primary data from 88 respondents become
the sample size and analyzed by using multiple regression analysis. Then, the
validity and reliability test will be analyzed. Before analyzing by using multiple
regression analysis, there were a classical assumption tests that done by using the

22
data of 88 questionnaires. The tools that used in this research are Microsoft Excel
2013 and SPSS software.
Sample means a portion of a population that selected by particular procedure
which represent the population. The sampling method that used in this research is
simple random sampling techniques. This method is used in this research because
the population is not homogeneous.
Based on the opinion of Sugiyono (2013), “Simple random sampling is used when
the population has a member or element homogeneity.” In order to determine the
number of members, there are a calculation by using a formula of total sample.
The formula come from Taro Yaname and Slovin, which refers from the opinion
of Riduwan and Engkos (2013), “The technique of sampling using the formula of
Taro Yaname Slovin and when the population is already known”. As for the
formula is as follows:
Where:
n = Sample
N = Population
d2 = Precision (10% or 0.1)
So,
n = N = 692 = 88 samples
N.d2 + 1 692 x (0.1)2 + 1
𝑛 =N
N. d2 + 1

23
3.7 Validity Test
All the result of questionnaires need to pass through the validity test. Baes on Hair
et al (2010), validity means the extent in the form of scale of set of measure that
accureately represent the concept of interest. Validity test usually used to measure
the accuracy of all the question in the questionnaires. According to Cohen (2013),
which cited by Adi (2016), a quantitatvie research need to possess a measure for
standard error which are inbuilt and has to be acknowledge.
Based on Cohen (2007), each question in the questionnaire can be stated as valid
if the significant level is >α (0.05), in this research, the researcher use α (0.10)
significant level. In a quantitative research, to improve the validity the sampling
must be done carefully which include the appropriate statistical treatment of the
data. Each question can be stated valid if the value of all the data is above the r
table estimation. The validity formula is as follows:
(Source: Hadinata, 2016)
Where:
Df = degree of freedom
n = number of respondents
3.8 Reliability Test
Since the development of inconsistentcy can not be substantial, the main thing to
do is assess the reliability test. Reliability test has a purposed to depict the general
consistency of estimation and look for the connection’s reply between respondent
(Malhotra, 2010). Reliability test will be used to check how reliable the
questionnaire. Cronbach Alpha is the reliability coefficient which shows how well
all the things in a set that have positive connection to each other (Sekaran and
Bougie, 2010).
Df = n-2

24
According to Hair (2010), reliability means an appraisal of the consistency level
between several various estimations of a variable. The correlation of inter-item
exceeds 0.30, while the correlation of item-to-total should exceed 0.50, and the
lower limit of Cronbach’s alpha is 0.70. Cronbach’s alpha has a positive
relationship with the total number of item in scale because the increasing number
of items. The reliability formula is as follows:
Where:
k = number of items
r = average correlation between any two items
α = reliability of the average or sum
Table 3.1. Interpretation of Cronbach Alpha Value
Source: Hadinata (2015)
Cronbach's alpha Internal consistency
α ≥ 0.9 Excellent
0.8 ≤ α < 0.9 Good
0.7 ≤ α < 0.8 Acceptable
0.6 ≤ α < 0.7 Questionable
0.5 ≤ α < 0.6 Poor
α < 0.5 Unacceptable
25
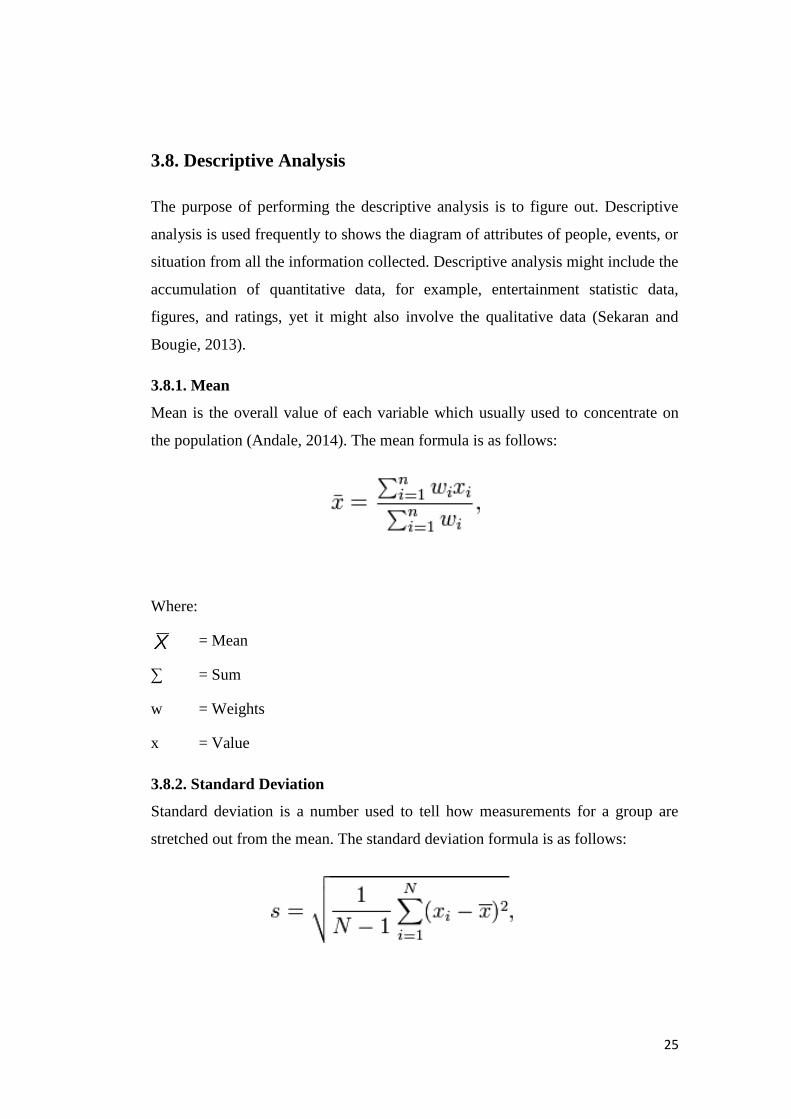
3.8. Descriptive Analysis
The purpose of performing the descriptive analysis is to figure out. Descriptive
analysis is used frequently to shows the diagram of attributes of people, events, or
situation from all the information collected. Descriptive analysis might include the
accumulation of quantitative data, for example, entertainment statistic data,
figures, and ratings, yet it might also involve the qualitative data (Sekaran and
Bougie, 2013).
3.8.1. Mean
Mean is the overall value of each variable which usually used to concentrate on
the population (Andale, 2014). The mean formula is as follows:
Where:
= Mean
∑ = Sum
w = Weights
x = Value
3.8.2. Standard Deviation
Standard deviation is a number used to tell how measurements for a group are
stretched out from the mean. The standard deviation formula is as follows:

26
The sample standard deviation is used when a sample of data is analyzed. In this
equation:
s = sample standard deviation
N = number of scores in a sample
N-1 = degrees of freedom or Bessel's correction
x = value of a sample
= mean or average of the sample
Table 3.2. Range and Category of Mean Value
Range Category
4.21 – 5.00 Strongly Agree
3.41 – 4.20 Agree
2. 61 – 3.40 Neutral
1.81 – 2.60 Disagree
1.00 – 1.80 Strongly Disagree
Source: (Laksita, 2016)
3.9 Classic Assumption Test
3.9.1 Normality Test
The normal probability plot graph is the source to get tests for normality. The data
that can be expressed in normality is by looking at the distribution of data on the
diagonal axis of the graph, or the histogram perspective of the remaining reason
for the normality test decision. If the data displayed does not provide a normal
pattern of how the data should be, then the regression model does not meet the
assumption of normality. If the data spreads around the diagonal line or histogram
graph shows the normal distribution pattern, then the regression model meets the
presumption of normality (Susanto, 2013).

27
3.9.2. Multicollinearity Test
According (Susanto, 2013), The multicollinearity test focuses on the verification
of the regression model that finds correlation between the independent variables.
A good regression model should have no correlation between independent
variables. Techniques for detecting the presence or absence of multicolinearity in
the regression model see the values of Variance Inflation Factor (VIF), and
tolerance values. If the tolerance value is close to 1, and the VIF value around the
number 1 and not more than 10, it can be concluded there is no multicollinearity
between the independent variables in the regression model.
3.9.3 Heteroscedascity Test
A good regression model is a model not in heteroscedascity. The reason for
heteroscedascity if the information above and below the number 0 on the Y axis,
the data does not form a certain pattern. The heteroscedascity test for the
accidental variance regression model of building inequality one observation to
another observation (Susanto, 2013).
3.10 Multiple Linear Regression Analysis
Regression analysis is a study used to describe the dependent variable at at least
one independent variable, to assess the regression of the dependent variable with
more than one independent variable called multiple regressions, a condition when
the study used at least two independent variables in the regression analysis Linear
(Malhotra, 2010). Multiple regressions can be formulated as:
Y= a + b1X1 + b2X2 + b3X3
Where:
Y defined as dependent variable (Employee Satisfaction)
X1 = coefficient of variable (Salary)
X2 = coefficient of variable (Working Environment)
X3 = coefficient of variable (Career Development)
28
3.11 Hypothesis Testing
3.11.1 T-test
This test aims to see whether the independent variables partially influence the
dependent variable partially (Malhotra, 2010). T-test usually use table coefficient,
which is used to know influence of each independent variable to dependent
variable. If significant <0.10, then do not reject Ha and reject H0. If not, if
significant> 0.10, reject Ha and do not reject H0
3.11.2 F-test
F-test aims to test the overall model of multiple regression. This test determines
whether there is a significant relationship between the dependent variable and the
independent variable. If F test indicates that the level of significance is less than
(<0.10), Reject H0 occurs and concludes that the relationship between variables
does exist, or vice versa (Malhotra, 2010).
3.11.3 Adjusted R square
Coefficient of determination is also often called R square. This is the goodness of
fit of the regression equation, which gives the percentage of total variation in the
dependent variable. The R2 value is between 0 and 1, and the conformity model is
better if R2 gets closer 1. Single regression uses single R square, whether multiple
regression models use adjusted R boxes suggested by (Malhotra, 2010).
29
CHAPTER IV
ANALYSIS AND INTERPRETATION
This chapter is about to present the analysis as well as interpretation the result of
the research.
4.1 Company Profile
According to information from Human Capital Department, PT XYZ is a
company engaged in manufacturing and engineering. PT XYZ is a subsidiary that
strives to meet customer needs by providing solutions and design products to
optimize their company's productivity. PT XYZ was established on February 8,
1983. PT XYZ is a subsidiary of PT OPQ located in Cakung. In 1984, PT XYZ
began manufacturing products in the form of tipping trailers, Komatsu forklifts,
Genset 105-305 KVA and John Deere farm tractor. To demonstrate the existence
of the company, PT XYZ exported in 1988. PT XYZ exports its products in the
form of Komatsu forklift frame for Komatsu Forklift Mtg located in USA. A year
later, PT XYZ expanded its production facilities by 4800m2. Besides, it also
exports forklift frame to Komatsu Japanese forklift. In the same year, PT XYZ
also exported Heavy Duty Off-Highway Dump Truck to Komatsu Ltd. Japan. In
1990 PT XYZ exported Frame Forklift to Sumitomo Yale in USA and Japan.
Seeing the enormous development of production and the need for a place for the
manufacturing process, then in 1992 PT XYZ expansion in Citeureup, West Java
area of 6000 m2. In the same year PT XYZ produced crane stacker and fuel tank
trailers as well as exported Small Excavator Arm and Blade to Summitomo
company in Japan.Through the existence and commitment of the company in
meeting the needs of consumers, then in 1994 PT XYZ awarded 'Supplier of
Excellent' by Komatsu Ltd. in Japan. A year later, precisely in 1995 PT XYZ
exported the Patria Forklift Truck to Germany.
30
Excessive exports and customer demand in fulfillment, then in 1998 PT XYZ
formed Patria Europe in Rotterdam. This European Patri manufactures Bucket for
PC 650, 1000, Clamp Shell Bucket 10 m, Water Tank Volvo BM 35A. In 2003
PT XYZ obtained ISO 9001: 2000 SAI Global-Australia certificate for XYZ
product. And in 2008 PT XYZ started to produce its new product, which is
refueler (Rigid Truck and Trailer Model) with capacity 8kl, 11kl, 25kl and 40 kl
to supply PT PERTAMINA needs. For the efficiency and effectiveness of the
company, PT XYZ moved the factory and head office from initially located in
Cakung to Cikarang. And starting in 2008 the location of PT XYZ is located in
Jababeka area road XI H 30-40, Cikarang-Bekasi (Source: Human Capital
Department).
PT XYZ does not know the word surrender, the company believes in a phrase
"What Business We Are In". Besides that, PT XYZ always develop and update.
With the spirit of the company, in 2009 PT XYZ was certified "U-Stamp" and "T-
Stamp" provided by American Engineers (ASME). Besides also based on the
quality of the products that become the main focus of the company, PT XYZ get
and has held ISO 9001: 2008 certificate on the quality Management System issued
by SAI Global. In 2010 PT XYZ won the Diamond Trophy in the Quality Control
Circle (QCC) of the 14th National Productivity Quality Assembly (QCC). Not
only that, to improve its quality, PT XYZ refers to the stadar that has been made
by Astra Green Company which includes Green Strategy, Green Process, Green
Product and Green Employee (Source: Human Capital Department).
Vision and Mission
Vision: To be the best engineering & energy logistic company in the region,
providing outstanding product and services quality to achieve sustainable
profitability & growth.
Mission: Provide sustainable value added for the stakeholders.

31
Organizational Structur
Organizational structure is a system that consists of explicit and implicit
institutional rules and policies designed to outline how various work roles and
responsibilities are delegated, controlled and coordinated. Organizational
structure also determines how information flows from level to level within the
company.
(Source: Human Capital Department)
Corporate
Legal
Corporate
Commnication
Business
Management
Development
Board of
Directors
Buss.Dev Q.M.S M.I.S
Parts &
Service
P.S.S P.S.B.O C.S
Engineering Design R&D
Finance &
Accounting
Finance
& Acc
Procure
ment
HC, GA,
ESR
H.C.D H.C.G.S GA &
ESR
Board of
Commisioner
s
MKT &
SALES
MKT.A
DM
Non
Mining
Mining P.M H.C.D
Plant
Operation
P.C Manufa
cturing
P.E Q.C Subcont
.Dev
32
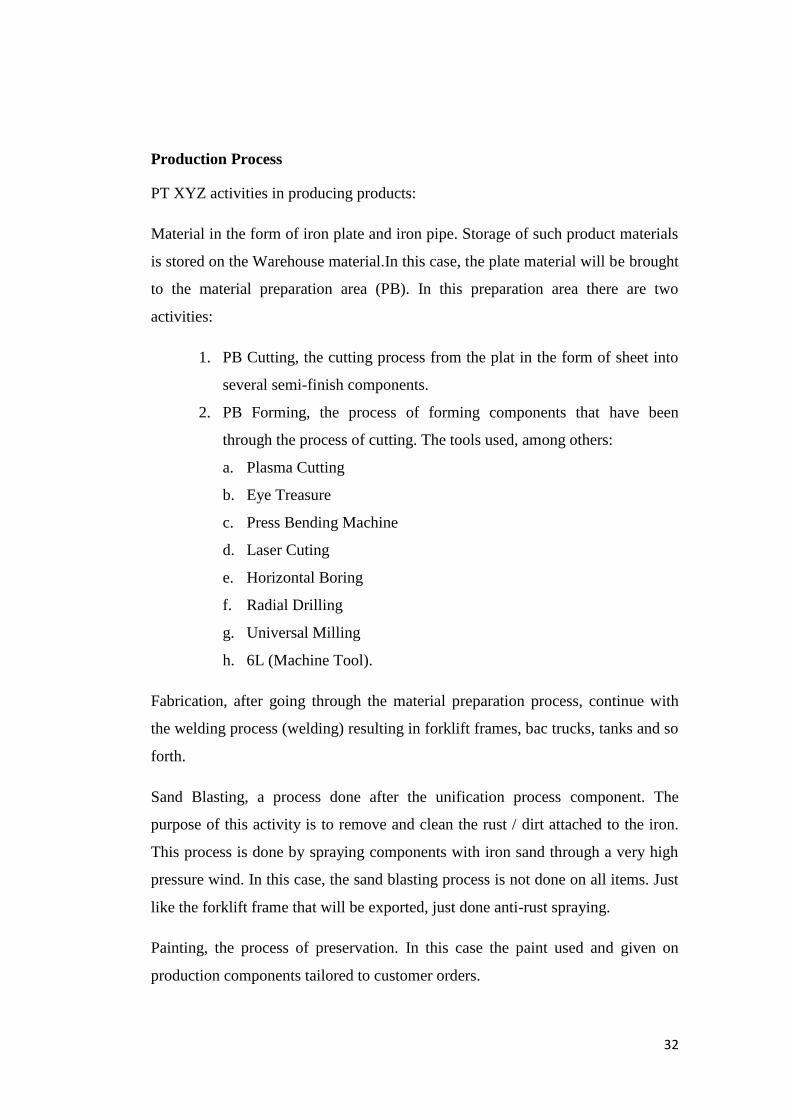
Production Process
PT XYZ activities in producing products:
Material in the form of iron plate and iron pipe. Storage of such product materials
is stored on the Warehouse material.In this case, the plate material will be brought
to the material preparation area (PB). In this preparation area there are two
activities:
1. PB Cutting, the cutting process from the plat in the form of sheet into
several semi-finish components.
2. PB Forming, the process of forming components that have been
through the process of cutting. The tools used, among others:
a. Plasma Cutting
b. Eye Treasure
c. Press Bending Machine
d. Laser Cuting
e. Horizontal Boring
f. Radial Drilling
g. Universal Milling
h. 6L (Machine Tool).
Fabrication, after going through the material preparation process, continue with
the welding process (welding) resulting in forklift frames, bac trucks, tanks and so
forth.
Sand Blasting, a process done after the unification process component. The
purpose of this activity is to remove and clean the rust / dirt attached to the iron.
This process is done by spraying components with iron sand through a very high
pressure wind. In this case, the sand blasting process is not done on all items. Just
like the forklift frame that will be exported, just done anti-rust spraying.
Painting, the process of preservation. In this case the paint used and given on
production components tailored to customer orders.

33
Assembling, the process of merging between forklift frames, frames towing
tractor with meshing ordered. As for the truck and tank is done on existing trucks.
In accordance with the ISO 9001 quality that has been obtained by PT XYZ,
every process of activity will be monitored to product quality. Therefore, before
entering into the next stage of production process is always done inspection. This
is done so that the resulting product has good quality and satisfy the customer.
Product of PT XYZ
PT XYZ is a manufacturing and engineering company that manufactures heavy
equipment and related components. There are the products and market segments
entered by PT XYZ:
1. Mining
(Source: Human Capital Department)
2. Industrial and Construction
(Source: Human Capital Department)

34
3. Forestry and Agro
(Source: Human Capital Department)
4. Oil and Gas
(Source: Human Capital Department)
5. Attachment
(Source: Human Capital Department)

35
6. Original Equipment Manufacturing.
(Source: Human Capital Depatment)

36
4.2 Pre-Test
Before proceeding to the real test, there had been conducted a pre-test to test out
the validity and reliability, to determine the validity of each items the r table value
must exceed the number of 0.306. It can proceed to reliability test.
4.2.1 Validity Testing
Table 4.1 Pearson’s Correlation Validity Test Result
Variables Items
Pearson
Correlation
R-
Table
(10%)
Remarks
Salary S1
.799 0.306 VALID
S2 .821 0.306 VALID
S3 .702 0.306 VALID
S4 .590 0.306 VALID
Working
Environment WE1
.608 0.306 VALID
WE2 .674 0.306 VALID
WE3 .602 0.306 VALID
WE4 .519 0.306 VALID
WE5 .827 0.306 VALID
WE6 .777 0.306 VALID
Career
Development CD1 .789 0.306 VALID
CD2 .741 0.306 VALID
CD3 .815 0.306 VALID
CD4 .784 0.306 VALID
Employee
Satisfaction ES1 .497 0.306 VALID
ES2 .842 0.306 VALID
ES3 .762 0.306 VALID
ES4 .812 0.306 VALID
Source: SPSS 20 Analysis Output
According to the Pearson correlation value for df = 30-2 or 28 indicates that the
minimum value of α (alpha) of each item should be 0.306 in the 0.10 level of
significance. Looking at the table above, this indicates that each item in each
variable is considered valid.

37
4.2.2 Reliability Testing
Table 4.2 Cronbach’s Alpha Variables Result
Variables Cronbach’s alpha Description
(X1) Salary 0.712 Reliable
(X2) Working Environment 0.749 Reliable
(X3) Career Development 0.783 Reliable
(Y) Employee Satisfaction 0.702 Reliable
Source: SPSS 20 Analysis Output
As shown by (Hair, 2010), the minimum limit for a reliable variable is at 0.70.
From the table above the results of the reliability test for Table 4.2. Interpretation
of Alpha Cronbach Value as in Salaries with 0.712, 0.749 Work Environment, and
Career Development with alpha value of 0.783 cronbach which means they have
an acceptable level of reliability.
38
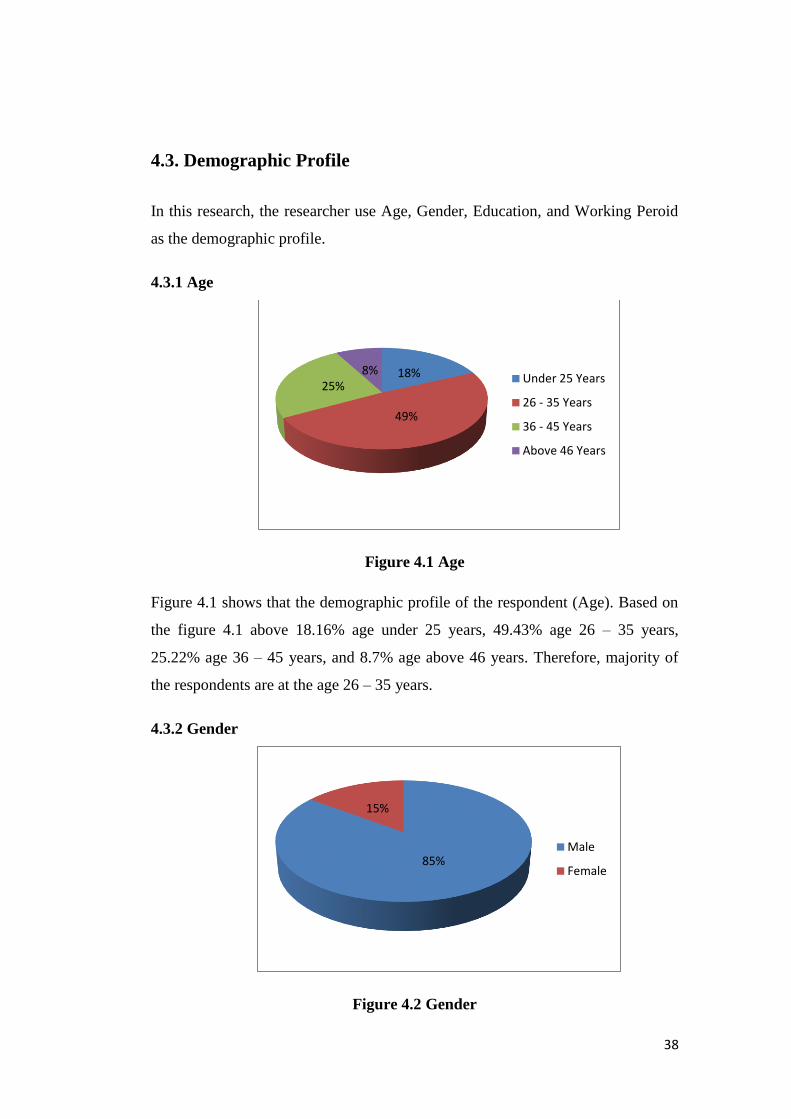
4.3. Demographic Profile
In this research, the researcher use Age, Gender, Education, and Working Peroid
as the demographic profile.
4.3.1 Age
Figure 4.1 Age
Figure 4.1 shows that the demographic profile of the respondent (Age). Based on
the figure 4.1 above 18.16% age under 25 years, 49.43% age 26 – 35 years,
25.22% age 36 – 45 years, and 8.7% age above 46 years. Therefore, majority of
the respondents are at the age 26 – 35 years.
4.3.2 Gender
Figure 4.2 Gender
18%
49%
25%8%
Under 25 Years
26 - 35 Years
36 - 45 Years
Above 46 Years
85%
15%
Male
Female
39
Figure 4.2 shows that the demographic profile of the respondent (Gender). Based
on the figure 4.2 above 85% are male, and 15% are female. Therefore, majority of
the respondents are male.
4.3.3 Education
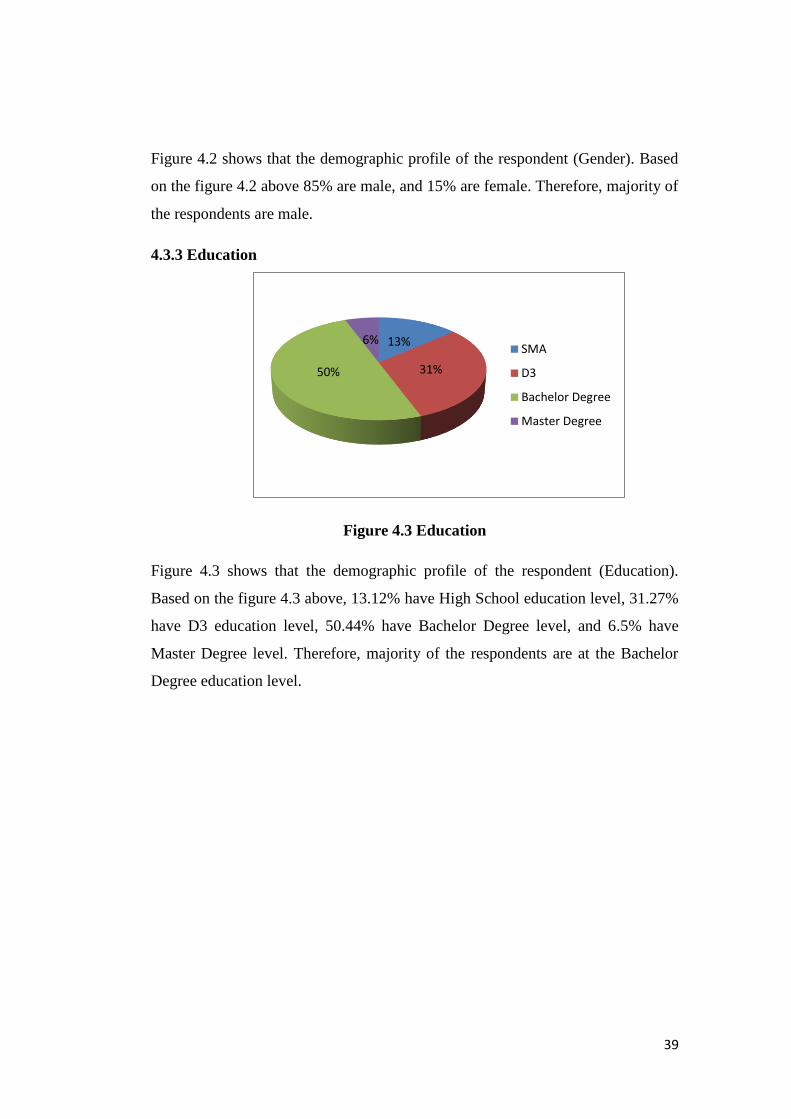
Figure 4.3 Education
Figure 4.3 shows that the demographic profile of the respondent (Education).
Based on the figure 4.3 above, 13.12% have High School education level, 31.27%
have D3 education level, 50.44% have Bachelor Degree level, and 6.5% have
Master Degree level. Therefore, majority of the respondents are at the Bachelor
Degree education level.
13%
31%50%
6%SMA
D3
Bachelor Degree
Master Degree

40
4.3.4 Working Period
Figure 4.4 Working Period
Figure 4.4 shows that the demographic profile of the respondent (Working
Period). Based on the figure 4.3 above, 19.17% working period under 5 years,
47.41% working period 6 – 15 years, 26.23% working period 16 – 25 years, and
8.7% working period above 26 years. Therefore, majority of the respondents are
at the working period 6 – 15 years.
4.4 Descriptive Analysis
Based on the mean table which was mentioned in methodology, Table 4.3 below
shows that employee satisfaction is the most dominant factor in this research with
the mean value is 3.6648 in the agree category, followed by career development
with 3.5739 mean value, which means it is in the agree category, and salary with
3.5114 mean value, and the last one is working environment with 3.3314 mean
value is in the agree category. Based on the Table 4.3, employee satisfaction is the
variable with the most significant influence towards employee satisfaction.
19%
47%
26%
8%Under 5 years
6 - 15 years
16 - 25 years
Above 26 years
41
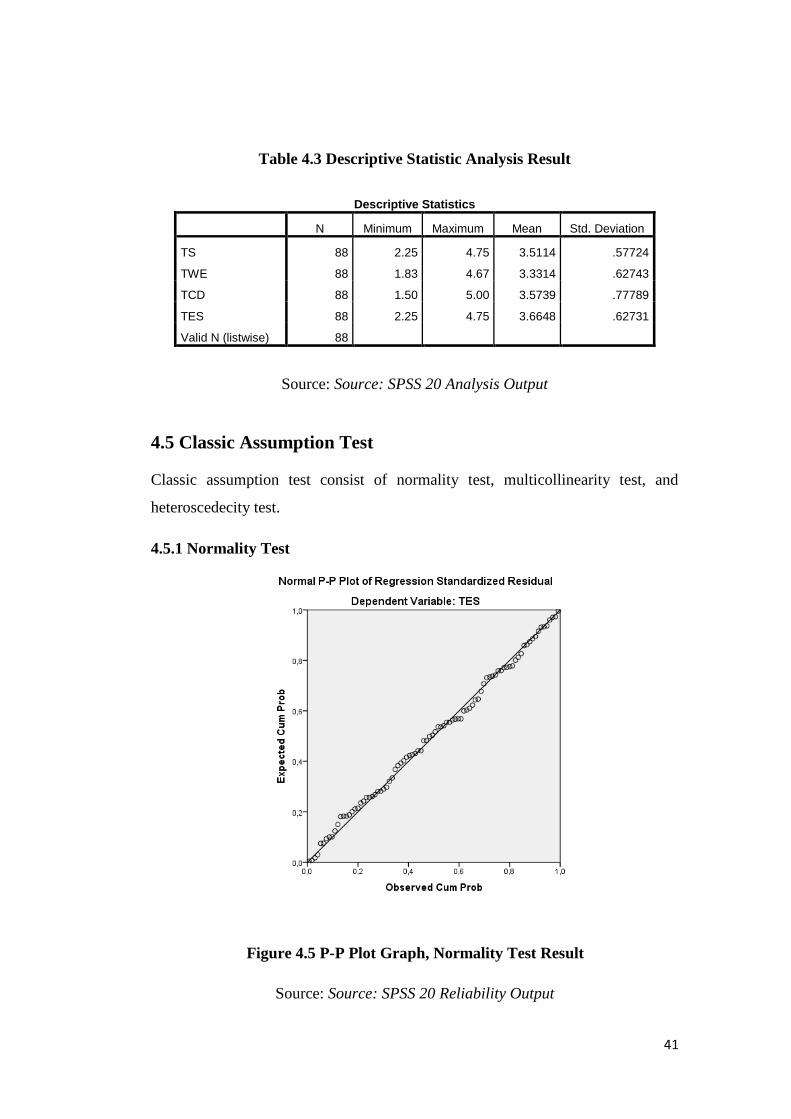
Table 4.3 Descriptive Statistic Analysis Result
Descriptive Statistics
N Minimum Maximum Mean Std. Deviation
TS 88 2.25 4.75 3.5114 .57724
TWE 88 1.83 4.67 3.3314 .62743
TCD 88 1.50 5.00 3.5739 .77789
TES 88 2.25 4.75 3.6648 .62731
Valid N (listwise) 88
Source: Source: SPSS 20 Analysis Output
4.5 Classic Assumption Test
Classic assumption test consist of normality test, multicollinearity test, and
heteroscedecity test.
4.5.1 Normality Test
Figure 4.5 P-P Plot Graph, Normality Test Result
Source: Source: SPSS 20 Reliability Output

42
As seen to figure 4.5 above, it shows that the regression has met the normality
assumptions since the P-P plot showing that there is a normality distribution in
this research. The data flows around the diagonal line and keeping up with the
diagonal line which is upward.
Figure 4.6 Histogram, Normality Test Result
Source: Source: SPSS 20 Analysis Output
Based on figure 4.6, it shown that the data was distributed normally. The line on
histogram is described in the stable form of bell shape. However, there is a gap in
between the bar charts or to be so called as an outlier on the histogram, which
means some of the respondent did not fill the questionnaire in true.
43
4.5.2 Multicollinearity Test
Table 4.4 Multicollinearity Test Result
Coefficientsa
Model Collinearity Statistics
Tolerance VIF
1
(Constant)
TS .370 2.701
TWE .275 3.640
TCD .528 1.895
a. Dependent Variable: TES
Source: Source: SPSS 20 Analysis Output
For the multicollinearity test, the researcher use Varian Inflation Factor (VIF) to
check. Good regression model does not have relations between independent
variables. From the Table 4.4 above shows that the regression model from the
data result does not have a multicollinearity problem, since the value of VIF for
all of the independent variables is around 1 and not more than 10.

44
4.5.3 Heteroscedascity Test
Figure 4.7 Scatter Plot, Heteroscedascity Test Result
Source: Source: SPSS 20 Analysis Output
The data in this research will fulfill the heteroscedascity assumption test if the
data spread above and below number 0 in Y axis, the data does not form any
specific patterns. The figure 4.7 above shows that the spread of the data is not
creates any clear specific pattern. The points are also spread between 0 and Y
axis. Therefore, there is no heteroscedascity exist.

45
4.6 Multiple Linear Regression Analysis
The result of multiple linear regression on Table defines that all of three
independent variables are significant influence occurs towards employee
satisfaction.
Table 4.5 Multiple Regression Test Result
Coefficientsa
Model Unstandardized Coefficients Standardized
Coefficients
T Sig.
B Std. Error Beta
1
(Constant) .347 .222 1.565 .121
TS .465 .099 .428 4.693 .000
TWE .233 .106 .233 2.203 .030
TCD .254 .062 .315 4.114 .000
a. Dependent Variable: TES
Source: Source: SPSS 20 Analysis Output
From the Table 4.5 above, the written standardized form of the equation is as
follows:
Y= .347 + .465 X1 + .233 X2 + .254 X3
Where:
Y = Employee Satisfaction
X1 = Salary
X2 = Working Environment
X3 = Career Development
The result of multiple linear regression on Table 4.5 defines that all of three
independent variables are significant influence occurs towards employee
satisfaction. The detail as followed:

46
1. The regression coefficient of Salary is .000, which is less than α (0.10).
Therefore, the conclusion is that every 1% increased of Salary will
able to increase the employee satisfaction by 46.5%.
2. The regression coefficient of Working Environment is .030, which is
less than α (0.10). Therefore, the conclusion is that every 1% increased
of Working Environment will able to increase the employee
satisfaction by 23.3%.
3. The regression coefficient of Career Development is .000, which is
less than α (0.10). Therefore, the conclusion is that every 1% increased
of Career Development will able to increase the employee satisfaction
by 25.4%.
4.7 Hypothesis Testing
Hypothesis testing consist of T-tes, F-tes, and Adjusted R square.
4.7.1 Significance T-Test
Table 4.6 Significance T-Test Result
Coefficientsa
Model Unstandardized Coefficients Standardized
Coefficients
T Sig.
B Std. Error Beta
1
(Constant) .347 .222 1.565 .121
TS .465 .099 .428 4.693 .000
TWE .233 .106 .233 2.203 .030
TCD .254 .062 .315 4.114 .000
a. Dependent Variable: TPI
Source: Source: SPSS 20 Analysis Output
Table 4.6 above shows that all of the independent variables are significant, here
are the results :

47
1. The significant value of Salary is .000 or lower than 0.10, which shows
that the variable have significant influence on employee satisfaction. In
this case, Ha1 is accepted and H01 is rejected.
H01: There is no a significant influence of Salary towards employee
satisfaction.
Ha1: There is a significant influence of Salary towards employee
satisfaction.
2. The significant value of Working Environment is .030 or lower than 0.10,
which shows that the variable have significant influence on employee
satisfaction. In this case Ha2 is accepted and H02 is rejected.
H02: There is no a significant influence of Working Environment towards
employee satisfaction.
Ha2: There is a significant influence of Working Environment towards
employee satisfaction.
3. The significant value of Career Development is .000 or lower than 0.10,
which shows that the variable have a significant influence on employee
satisfaction. In this case, Ha3 is accepted and H03 is rejected.
H03: There is no a significant influence of Career Development towards
employee satisfaction.
Ha3: There is a significant influence of Career Development towards
employee satsifaction.

48
4.7.2 Significance F-Test
Table 4.7 ANOVA Table, Significance F-Test Result
ANOVAa
Model Sum of Squares Df Mean Square F Sig.
1
Regression 25.368 3 8.456 80.098 .000b
Residual 8.868 84 .106
Total 34.236 87
a. Dependent Variable: TES
b. Predictors: (Constant), TCD, TS, TWE
Source: Source: SPSS 20 Analysis Output
The table above shows the result of F-test. Since the significance level is .000 or
lower than 0.10, with F value calculated around 80.098. This means that all
variables (Salary, Working Environment and Career Development) in this
research are silmutaneously significant towards employee satisfaction. Therefore,
Ha4 is accepted and H04 is rejected.
H04: There is no a simultaneously significant influence of salary, working
environment and career development towards employee satisfaction.
Ha4: There is a simultaneously significant influence of salary, working
environment and career development towards employee satisfaction.
4.7.3 Adjusted R Square
Table 4.8 Multiple Regression Test: Coefficient Determination (R2) Result
Model Summaryb
Model R R Square Adjusted R
Square
Std. Error of the
Estimate
Durbin-Watson
1 .861a .741 .732 .32492 2.151
a. Predictors: (Constant), TCD, TS, TWE
b. Dependent Variable: TES
Source: Source: SPSS 20 Analysis Output

49
Based on Table 4.8 shown above, the adjusted R2is .732, which means there is a
quite high correlation between independent variables (Salary, Working
Environment, Career Development) towards dependent variable (Employee
Satisfaction). The adjusted R2is .732 (73.2%), which means three independent
variables are influencing 73.2% on employee satisfaction, while the rest
percentage, which is 26.8% is influenced by other variables that are not mentioned
in this research.
4.8 Interpretation of the Result
Salary, Working Environment, and Career Development are shown to be
significantly connected to employee satisfaction. Besides, the variables have
shown to have to have big impact, from the R square it is writtend that it is 73.2%
in total, so that means that is only 26.8% of other unknown variables that can
influence the employee satisfaction. Based on the ANOVA table result, it shows
that the result F-value is 80.098 at .000 value of significance, which can be
explained where null hypothesis H04 is rejected and alternative hypothesis Ha4 is
accepted.
4.8.1 Salary toward Employee Satisfaction
Based on the result of the data analysis, it can be explained that t-test result of
Salary is 4.693 at .000 significance value. Since the significance value is less than
0.10, this proves that Salary plays a role on employee satisfaction.From the t-test
result, the researcher rejects null hypothesis (H01) and accept the alternative
hypothesis (Ha1). Then, based on regression coefficient result, if the value of
Salary increases in one unit while the other variable remains constant, then the
value of employee satisfaction will increase as many 4.693 units. This also proved
that the result is in-line with previous research from (Ngoc Diem, 2016) that
conducted the research in the people committe of Binh Tan District, Ho Chi Minh
city, Vietnam where the researcher found that Salary positively influence on
employee satisfaction. The result of this research also in-line with previous
research from (Tomazevic, Seljak, et al 2013) that conducted the research about

50
the factors that influence employee satisfaction in police service of slovania where
the researcher found that salary have an influence with employee satisfaction.
4.8.2 Working Environment toward Employee Satisfaction
Based on the result of the data analysis, it can be explained that t-test result of
Working Environment is 2.203 at .030 significance value. Since the significance
value is less than 0.10, this proves that Working Environment plays a role on
employee satisfaction.From the t-test result, the researcher rejects null hypothesis
(H02) and accept the alternative hypothesis (Ha2). Then, based on regression
coefficient result, if the value of Working Environment increases in one unit while
the other variable remains constant, then the value of employee satisfaction will
increase as many 2.203 units. This also proved that the result is in-line with
previous research from (Masood, Ain, et al 2014) that conducted the research
about factors affecting employee sastisfaction of the public and private sector
organizations of pakistan where the researcher found that Working Environment
positively influence on employee satisfaction. The result of this research also in-
line with previous research from (Tomazevic, Seljak, et al 2013) that conducted
the research about the factors that influence employee satisfaction in police
service of slovania where the researcher found that working environment have an
influence with employee satisfaction.
4.8.3 Career Development toward Employee Satisfaction
Based on the result of the data analysis, it can be explained that t-test result of
Career Development is 4.114 at .000 significance value. Since the significance
value is less than 0.10, this proves that Career Development plays a role on
employee satisfaction. From the t-test result, the researcher rejects null hypothesis
(H03) and accept the alternative hypothesis (Ha3). Then, based on regression
coefficient result, if the value of Salary increases in one unit while the other
variable remains constant, then the value of employee satisfaction will increase as
many 4.114 units. This also proved that the result is in-line with previous research
from (Ngoc Diem, 2016) that conducted the research in the people committe of
Binh Tan District, Ho Chi Minh city, Vietnam where the researcher found that
career development positively influences on employee satisfaction.

51
CHAPTER V
CONCLUSION AND RECOMMENDATION
5.1 Conclusion
This research examines the influence of Salary, Working Environment and Career
Development towards Employee Satisfaction at PT XYZ. From the result, all of
these variables were affecting and have a significant influence towards Employee
Satisfaction.
For hypothesis testing, the researcher preferred to use multiple linear regression
model as the statistical tools. Based on the previous research, it shows that the
result are similar or in-line with the following variables. From the researcher
findings on the previous chapter, the conclusion taken from this research is as
follows:
1. Salary has significance level less than significance value; this means
that salary has significant influence towards employee satisfaction at
PT XYZ.
2. Working Environment has significance level less than significance
value; this means that working environment has significant influence
towards employee satisfaction at PT XYZ.
3. Career Development has significance level less than significance
value; this means that the career development has significant
influence towards employee satisfaction at PT XYZ.
4. Salary, Working Environment and Career Development have
significance level less than significance value; this means that salary,
working environment, and career development has simultaneous
significant influence towards employee satisfaction at PT XYZ.

52
5.2 Recommendation
There are three independent variables which are Salary, Working Environment
and Career Development that have a significant influence towards employee
satisfaction in PT XYZ.
5.2.1 Company
1. Based on the data and result the researcher recommend for PT XYZ to
keep maintaining a good system for the salary, because there is a problem
with salary system like salaries earned by the old employees who have
worked more than 10 years lower in comparison to new employee and we
know that salary is one of the key element that decided prosperity of
employee and also affect the satisfaction of employee.
2. PT XYZ also maintains a good working environment, for example,
reviewing the layout of working space and evaluates the safety equipment.
3. Career development also has the influence to the satisfaction of employee,
because of that, PT XYZ should review the system of the promotion and
make sure there is a counseling and coaching between superior and
subordinate.
5.2.2 Future Research
1. For future research, it is needed doing a further research in other factors
besides Salary, Working Environment, and Career Development and it
will grasp more information on employee satisfaction.
2. The future researcher can use other instrument beside questionnaire, such
as interview. This method can gather more accurate data and information.
3. The next research is recommended to get bigger sample size. So the result
can be generalized to a population.

53
REFERENCES
Book
Hair, J.F., (2010). Multivariate data analysis. (7th edition). New Jersey: Pearson
Education Inc.
Malhotra, N.K. (2010). Marketing Research: an Applied Orientation (6th edition),
Pearson.
Riduwan., Engkos. A. K. (2010). Skala Pengukuran Variable-Variable Penelitian,
Bandung : Alfabeta.
Sekaran, U., Bougie, R. (2010). Research Methods for Business: A Skill Building
Approach(5thed.). West Sussex, UK: John Wiley & Sons Ltd.
Sekaran, U., Bougie, R. (2013). Research Methods for Business: A Skill Building
Approach(6th revised edition). UK: John Wiley & Sons Ltd.
Sugiyono. (2010). Metode Penelitian Pendidikan (Pendekatan Kuantitatif,
Kualitatif, dan R&D), Bandung : Alfabeta.

54
Thesis and Dissertations
Bushiri, C. P. (2014). The Impact of Working Environment on Employee’s
Performance: The Case of Institute of Finance Management in Dar Es
Salaam Region (Master Degree in Human Resources Management).
Tanzania: University of Tanzania.
Cohen, L., & Manion, L., & Morrison, K. (2007) Research Methods in Education,
6thedition. Pearson.
Fullard, J. (2012). Investigating Player Salaries and Performance in the National
Hockey League (Degree of Master of Arts in Appied Health Sciences). St.
Catharines. Ontario.
Laksita, N. (2016). Analysis of Consumer’s Attitude and Consumer’s Perception
TowardsPurchase Decision (Bachelor’s Thesis in Management).
Ngoc, N. T. N. (2016). The Factors Affecting Employee’s Satisfaction and
Loyalty: An Evidence from People’s Committee of Binh Tan Distrct, Ho
Chi Minh City(Master Degree in Public Administration). Vietnam:
University of Tampere.
Pratiwi, D. I. E. (2015). Effect of Compensation and Career Development on the
Performance of Employees with Work Motivation as Moderating
Variable (Bachelor Degree in Economic). Surakata: Muhammadiyah
Surakarta of University.
Ruby, M. (2012). Impact of Indirect Compensation on Employee Productivity: A
Case of Central University College (Degree of Master of Business
Administration). Kwame Nkrumah University.
Susanto, A. (2013). Pengaruh Promosi, Harga, dan Inovasi Produk Terhadap
Keputusan Pembelian pada Batik Tulis Karangmlati Demak
55
Journals
Aydin, B. and Ceylan, A. (2008). The Employee Satisfaction in Metalworking
Manufacturing: How do Organization Culture and Organizational
Learning Capacity Jointly Affect it. Journal of Industrial Engineering
and Management, Nos 1-2, pp. 143-168.
Aydin, B. and Ceylan, A. (2009). A Research Analysis on Employee Satisfaction
in terms of Organization Culture and Spiritual Leadership. Journal of
Business and Management,vol. 4 No. 3, pp. 159-168.
Hatane, S. E. (2015). Employee Satisfaction and Performance as Intervening
Variables of Learning Organization on Financial Performance. Journal of
Business and Social Science pp. 619-628.
Jain, R, (2015). Impact of Working Environment on Job Satisfaction.
International Journal of Scientific and Research Publication, Vol. 4
Issues 1p. 547.
Jerome, N. (2013). Impact of Sustainable Human Resource Management and
Organizational Performance. International Journal of Asian Social
Science, Vol. 3 No. 6 pp. 1287-1292.
Kaya, C. and Ceylan, B. (2014). An Emperical Study on the Role of Career
Development Programs in Organization Commitment on Job Satisfaction
of employee. American Journal of Business and Management, Vol. 3
No.3, pp. 178-191.
Lay, G., Copani, G., and Biege, S. (2010). The Relevance of Service in European
Manufacturing Industries. Journal of Service Management, Vol. 21 No 5.
pp. 715-726.
Long, C. S., Xuan, S.S., Rasid, S. Z. and Kowang, T. W. (2014). An Analysis on
Academicians Job Satisfaction in the Perspective of HRD Practices..
International Education Studies, Vol. 7 No. 7, pp. 85-95.

56
Mafini, C. and R.I Pooe, D. (2013). The Relationship between Employee
Satisfaction and Organizational Performance: Evidence from South
African Government Department. Journal of Industrial Psychology, Vol.
39 No.1.
Masood, A., Ain, Q. U., Aslam, R., and Rizwan, M. (2014). Factor Affecting
Employee Satisfaction of the Public and Private Sector Organization of
Pakistan. International Journal of Human Resource Studies, Vol. 4 No. 2,
pp. 97-121.
Rani, P, and Khan, M. S. (2014). Impact of Human Resource Development on
Organizational Performance. Journal of Management, Vol. 4Issues. 12,
pp. 85-87.
Raziq, A, and Maulabakhsh, R. (2015). Impact of Working Environment on Job
Satisfaction. Procedia Economics and Finance23 , pp. 717-725.
Rudzi, M., Muhammad, I. M. B, and Rahman, B. A. (2013). Organizational
Rewards System and Employee’s Satisfaction at Telekom Malaysia
Berhad. Journal of Educational and Social Research, Vol. 3 No. 3, pp.
281-288.
Sageer, A., Rafat, S., and Agarwal, P. (2012). Identification of Variables
Affecting Employee Satisfaction and Their Impact on the Organization.
Journal of Business and Management, Vol. 5 Issues. 1, pp. 32-39.
Saleem, S, and Amin, S. (2013). The Impact of Organizational Support for Career
Development and Supervisory Support on Employee Performance: An
Empirical Study from Pakistan Acedemic Sector. European Journal of
Business and Management, Vol 5 No. 5, pp. 194-207.

57
Sharma, P., Kong, T. T. C.and Kingshott, R PJ. (2016). Internal Service Quality
as a Driver of Employee Satisfaction, Commitment, and Performance.
Journal of Service Management, Vol. 27 Issues. 5, pp. 773-797.
Tomazevic, N., Seljak, J. and Aristovnik, A. (2016). Factors Influencing
Employee Satisfaction in the Police Service: The Case of Slovenia. Vol.
437 No. 2, pp. 209-227.
Wakjira, M. W, and Singh, A. P. (2012). Total Productive Maintenance: A Case
Study In Manufacturing Industry.Global Journal of Researches in
Engineering, Vol. 12 Issues 1, pp. 25-32.

58
Electronic Resources
Andale (2013), Pearson Correlation: Definition and Easy Steps for Use.
Retrieved on February 14th , 2017
http://www.statisticshowto.com/what-is-the-pearson-correlation-
coefficient
Andale (2014). Weighted Mean: Formula: How to Find Weighted Mean.
Retrieved on Desember 1st, 2016
http://www.statisticshowto.com/weighted-mean/.
59
APPENDIX
Appendix 1
Pre-Test Data

60

61
Real Test Data
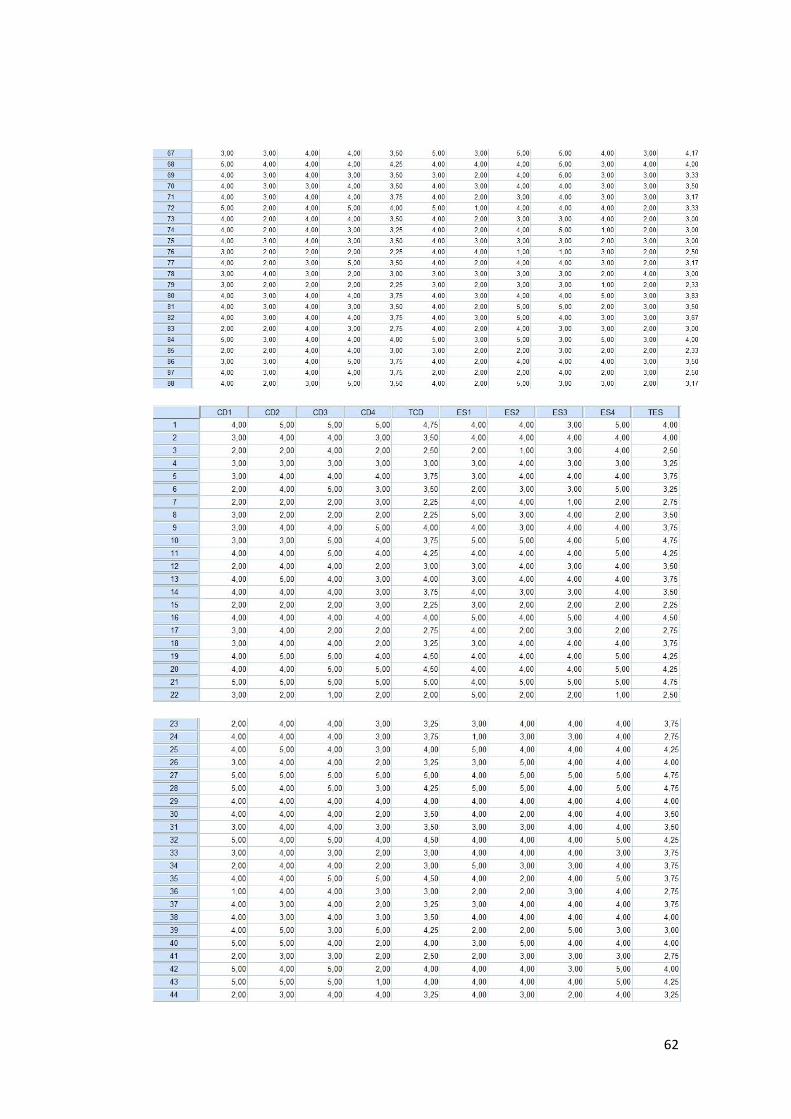
62

63
64
Appendix 2
Questionnaire Form
Selamat pagi/siang/sore,
Saya mahasiswa President University Jurusan Management. Saya sedang
melakukan penelitian untuk penyusunan skripsi.
Pada kesempatan ini, kami mengharapkan partisipasi Bapak/Ibu sebagai
seorang karyawan dari perusahaan untuk mengisi kuesioner ini. Jawaban
Bapak/Ibu akan menjadi masukan yang sangat berharga bagi kepentingan
penelitian ini.
Penelitian ini mengenai kepuasan karyawan. Penelitian ini bertujuan untuk
mengetahui pengaruh gaji, lingkungan kerja, dan pengembangan karir terhadap
kepuasan karyawan PT XYZ.
Jawaban yang Bapak/Ibu berikan tidak memiliki nilai benar ataupun salah.
Kami mengharapkan kejujuran Bapak/Ibu dalam menjawab setiap pertanyaan,
karena keakuratan hasil penelitian ini didasari oleh jawaban yang anda berikan.
Bapak/Ibu tidak perlu khawatir akan jawaban yang diberikan karena tujuan dari
kuesioner ini semata-mata hanya untuk mendukung pengumpulan data dalam
rangka penulisan laporan penelitian. Atas partisipasi Bapak/Ibu, Saya ucapkan
terima kasih.
Hormat Saya,
Fadhlan Imam Vidani

65
Format Kuesioner
Berilah tanda Cek (√) pada jawaban yang dianggap paling sesuai dengan keadaan
Anda atau yang mewakili situasi Anda saat ini.
• Karakteristik Responden
1. Jenis kelamin:
Laki-Laki Perempuan
2. Usia:
< 25 Tahun 36 Tahun – 45 Tahun
26 Tahun – 35 Tahun > 46 Tahun
3. Pendidikan terakhir:
SMU/Sederajat S1
D3 S2
4. Masa kerja di perusahaan ini:
< 5 Tahun 3. > 16 tahun – 25 tahun
6 Tahun – 15 Tahun 4. > > 26 Tahun
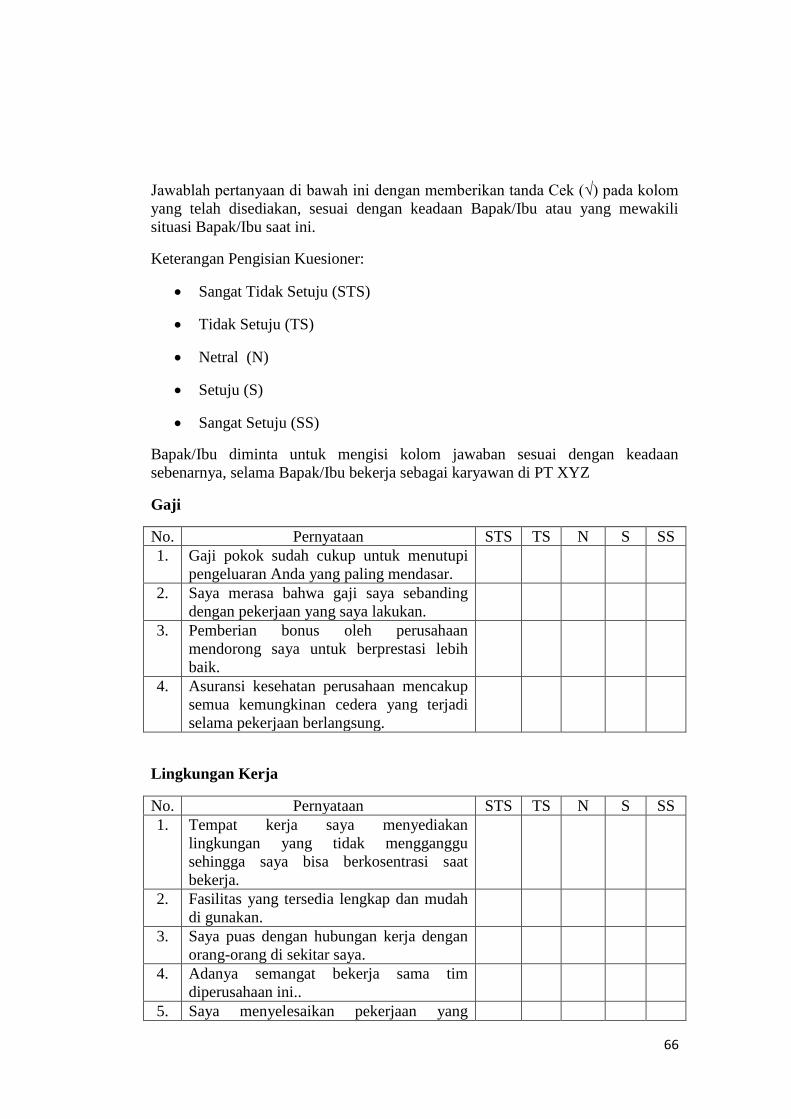
66
Jawablah pertanyaan di bawah ini dengan memberikan tanda Cek (√) pada kolom
yang telah disediakan, sesuai dengan keadaan Bapak/Ibu atau yang mewakili
situasi Bapak/Ibu saat ini.
Keterangan Pengisian Kuesioner:
• Sangat Tidak Setuju (STS)
• Tidak Setuju (TS)
• Netral (N)
• Setuju (S)
• Sangat Setuju (SS)
Bapak/Ibu diminta untuk mengisi kolom jawaban sesuai dengan keadaan
sebenarnya, selama Bapak/Ibu bekerja sebagai karyawan di PT XYZ
Gaji
No. Pernyataan STS TS N S SS
1. Gaji pokok sudah cukup untuk menutupi
pengeluaran Anda yang paling mendasar.
2. Saya merasa bahwa gaji saya sebanding
dengan pekerjaan yang saya lakukan.
3. Pemberian bonus oleh perusahaan
mendorong saya untuk berprestasi lebih
baik.
4. Asuransi kesehatan perusahaan mencakup
semua kemungkinan cedera yang terjadi
selama pekerjaan berlangsung.
Lingkungan Kerja
No. Pernyataan STS TS N S SS
1. Tempat kerja saya menyediakan
lingkungan yang tidak mengganggu
sehingga saya bisa berkosentrasi saat
bekerja.
2. Fasilitas yang tersedia lengkap dan mudah
di gunakan.
3. Saya puas dengan hubungan kerja dengan
orang-orang di sekitar saya.
4. Adanya semangat bekerja sama tim
diperusahaan ini..
5. Saya menyelesaikan pekerjaan yang
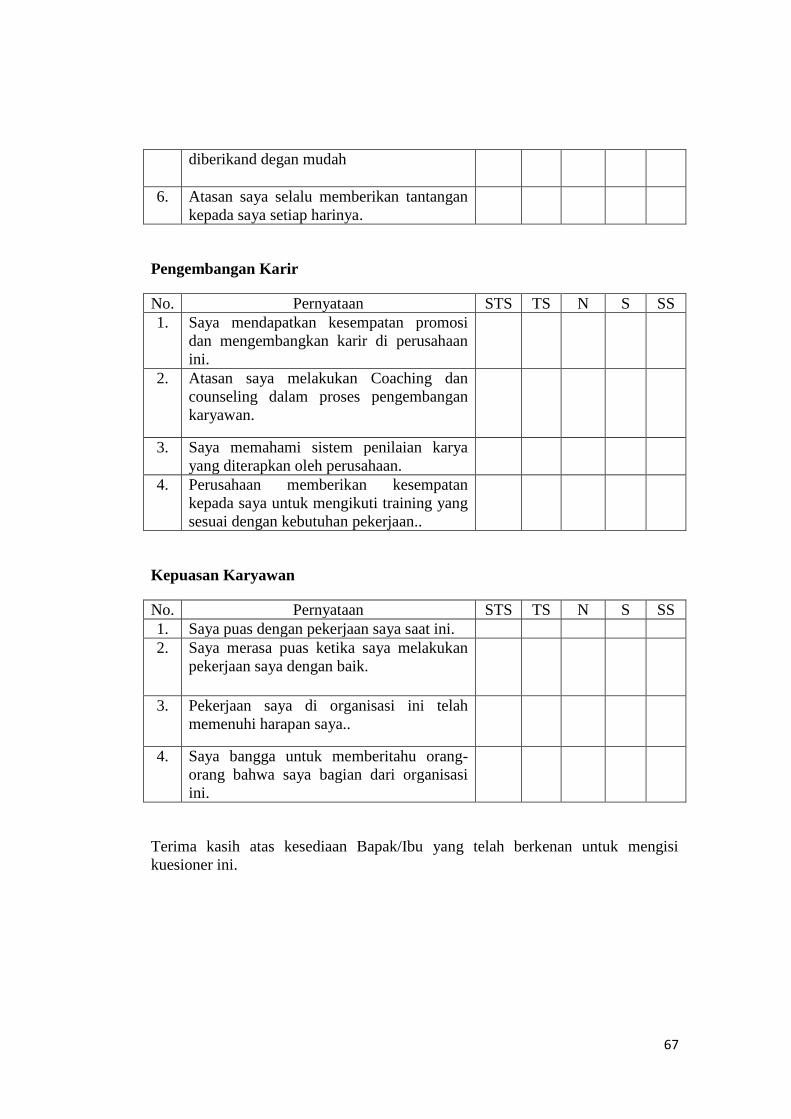
67
diberikand degan mudah
6. Atasan saya selalu memberikan tantangan
kepada saya setiap harinya.
Pengembangan Karir
No. Pernyataan STS TS N S SS
1. Saya mendapatkan kesempatan promosi
dan mengembangkan karir di perusahaan
ini.
2. Atasan saya melakukan Coaching dan
counseling dalam proses pengembangan
karyawan.
3. Saya memahami sistem penilaian karya
yang diterapkan oleh perusahaan.
4. Perusahaan memberikan kesempatan
kepada saya untuk mengikuti training yang
sesuai dengan kebutuhan pekerjaan..
Kepuasan Karyawan
No. Pernyataan STS TS N S SS
1. Saya puas dengan pekerjaan saya saat ini.
2. Saya merasa puas ketika saya melakukan
pekerjaan saya dengan baik.
3. Pekerjaan saya di organisasi ini telah
memenuhi harapan saya..
4. Saya bangga untuk memberitahu orang-
orang bahwa saya bagian dari organisasi
ini.
Terima kasih atas kesediaan Bapak/Ibu yang telah berkenan untuk mengisi
kuesioner ini.

68
Appendix 3
Realibility Test
RELIABILITY
/VARIABLES=S1 S2 S3 S4
/SCALE('ALL VARIABLES') ALL
/MODEL=ALPHA.
Scale: ALL VARIABLES
Case Processing Summary
N %
Cases
Valid 30 100,0
Excludeda 0 ,0
Total 30 100,0
a. Listwise deletion based on all variables in the
procedure.
Reliability Statistics
Cronbach's
Alpha
N of Items
,712 4
RELIABILITY
/VARIABLES=WE1 WE2 WE3 WE4 WE5 WE6
/SCALE('ALL VARIABLES') ALL
/MODEL=ALPHA.
Scale: ALL VARIABLES
Case Processing Summary
N %
Cases
Valid 30 100,0
Excludeda 0 ,0
Total 30 100,0
a. Listwise deletion based on all variables in the
procedure.

69
Reliability Statistics
Cronbach's
Alpha
N of Items
,749 6
RELIABILITY
/VARIABLES=CD1 CD2 CD3 CD4
/SCALE('ALL VARIABLES') ALL
/MODEL=ALPHA.
Scale: ALL VARIABLES
Case Processing Summary
N %
Cases
Valid 30 100,0
Excludeda 0 ,0
Total 30 100,0
a. Listwise deletion based on all variables in the
procedure.
Reliability Statistics
Cronbach's
Alpha
N of Items
,783 4
RELIABILITY
/VARIABLES=ES1 ES2 ES3 ES4
/SCALE('ALL VARIABLES') ALL
/MODEL=ALPHA.
Scale: ALL VARIABLES
Case Processing Summary
N %
Cases
Valid 30 100,0
Excludeda 0 ,0
Total 30 100,0
a. Listwise deletion based on all variables in the
procedure.

70
Reliability Statistics
Cronbach's
Alpha
N of Items
,702 4
Validity Test
CORRELATIONS
/VARIABLES=S1 S2 S3 S4 TS
/PRINT=TWOTAIL NOSIG
/MISSING=PAIRWISE.
Correlations
Correlations
S1 S2 S3 S4 TS
S1
Pearson Correlation 1 ,534** ,460* ,263 ,799**
Sig. (2-tailed) ,002 ,010 ,160 ,000
N 30 30 30 30 30
S2
Pearson Correlation ,534** 1 ,446* ,342 ,821**
Sig. (2-tailed) ,002 ,013 ,064 ,000
N 30 30 30 30 30
S3
Pearson Correlation ,460* ,446* 1 ,217 ,702**
Sig. (2-tailed) ,010 ,013 ,250 ,000
N 30 30 30 30 30
S4
Pearson Correlation ,263 ,342 ,217 1 ,590**
Sig. (2-tailed) ,160 ,064 ,250 ,001
N 30 30 30 30 30
TS
Pearson Correlation ,799** ,821** ,702** ,590** 1
Sig. (2-tailed) ,000 ,000 ,000 ,001
N 30 30 30 30 30
**. Correlation is significant at the 0.01 level (2-tailed).
*. Correlation is significant at the 0.05 level (2-tailed).
CORRELATIONS
/VARIABLES=WE1 WE2 WE3 WE4 WE5 WE6 TWE
/PRINT=TWOTAIL NOSIG
/MISSING=PAIRWISE.
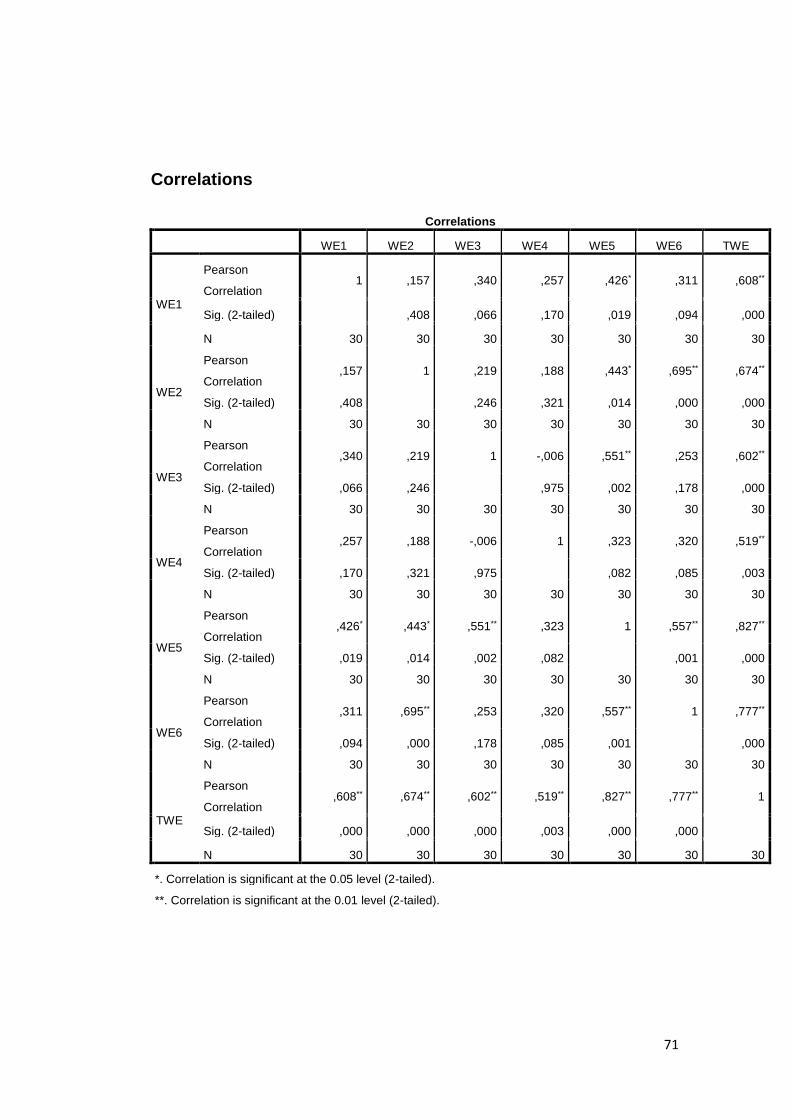
71
Correlations
Correlations
WE1 WE2 WE3 WE4 WE5 WE6 TWE
WE1
Pearson
Correlation 1 ,157 ,340 ,257 ,426* ,311 ,608**
Sig. (2-tailed) ,408 ,066 ,170 ,019 ,094 ,000
N 30 30 30 30 30 30 30
WE2
Pearson
Correlation ,157 1 ,219 ,188 ,443* ,695** ,674**
Sig. (2-tailed) ,408 ,246 ,321 ,014 ,000 ,000
N 30 30 30 30 30 30 30
WE3
Pearson
Correlation ,340 ,219 1 -,006 ,551** ,253 ,602**
Sig. (2-tailed) ,066 ,246 ,975 ,002 ,178 ,000
N 30 30 30 30 30 30 30
WE4
Pearson
Correlation ,257 ,188 -,006 1 ,323 ,320 ,519**
Sig. (2-tailed) ,170 ,321 ,975 ,082 ,085 ,003
N 30 30 30 30 30 30 30
WE5
Pearson
Correlation ,426* ,443* ,551** ,323 1 ,557** ,827**
Sig. (2-tailed) ,019 ,014 ,002 ,082 ,001 ,000
N 30 30 30 30 30 30 30
WE6
Pearson
Correlation ,311 ,695** ,253 ,320 ,557** 1 ,777**
Sig. (2-tailed) ,094 ,000 ,178 ,085 ,001 ,000
N 30 30 30 30 30 30 30
TWE
Pearson
Correlation ,608** ,674** ,602** ,519** ,827** ,777** 1
Sig. (2-tailed) ,000 ,000 ,000 ,003 ,000 ,000
N 30 30 30 30 30 30 30
*. Correlation is significant at the 0.05 level (2-tailed).
**. Correlation is significant at the 0.01 level (2-tailed).
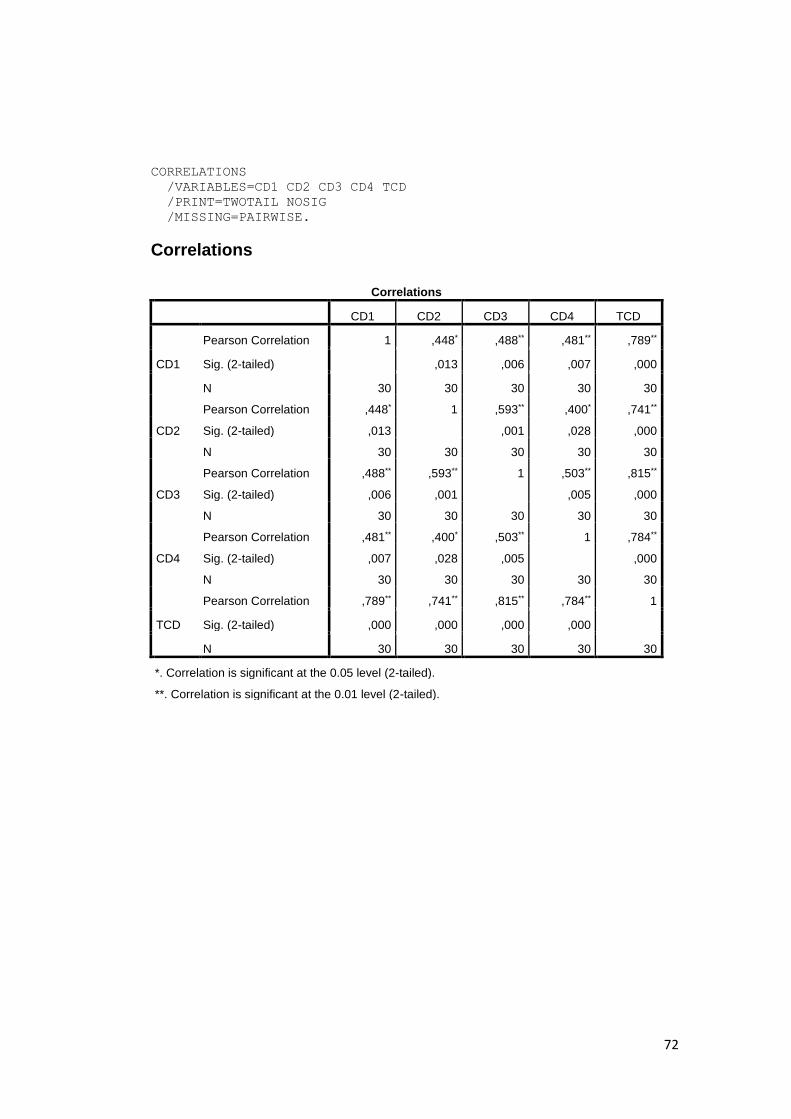
72
CORRELATIONS
/VARIABLES=CD1 CD2 CD3 CD4 TCD
/PRINT=TWOTAIL NOSIG
/MISSING=PAIRWISE.
Correlations
Correlations
CD1 CD2 CD3 CD4 TCD
CD1
Pearson Correlation 1 ,448* ,488** ,481** ,789**
Sig. (2-tailed) ,013 ,006 ,007 ,000
N 30 30 30 30 30
CD2
Pearson Correlation ,448* 1 ,593** ,400* ,741**
Sig. (2-tailed) ,013 ,001 ,028 ,000
N 30 30 30 30 30
CD3
Pearson Correlation ,488** ,593** 1 ,503** ,815**
Sig. (2-tailed) ,006 ,001 ,005 ,000
N 30 30 30 30 30
CD4
Pearson Correlation ,481** ,400* ,503** 1 ,784**
Sig. (2-tailed) ,007 ,028 ,005 ,000
N 30 30 30 30 30
TCD
Pearson Correlation ,789** ,741** ,815** ,784** 1
Sig. (2-tailed) ,000 ,000 ,000 ,000
N 30 30 30 30 30
*. Correlation is significant at the 0.05 level (2-tailed).
**. Correlation is significant at the 0.01 level (2-tailed).
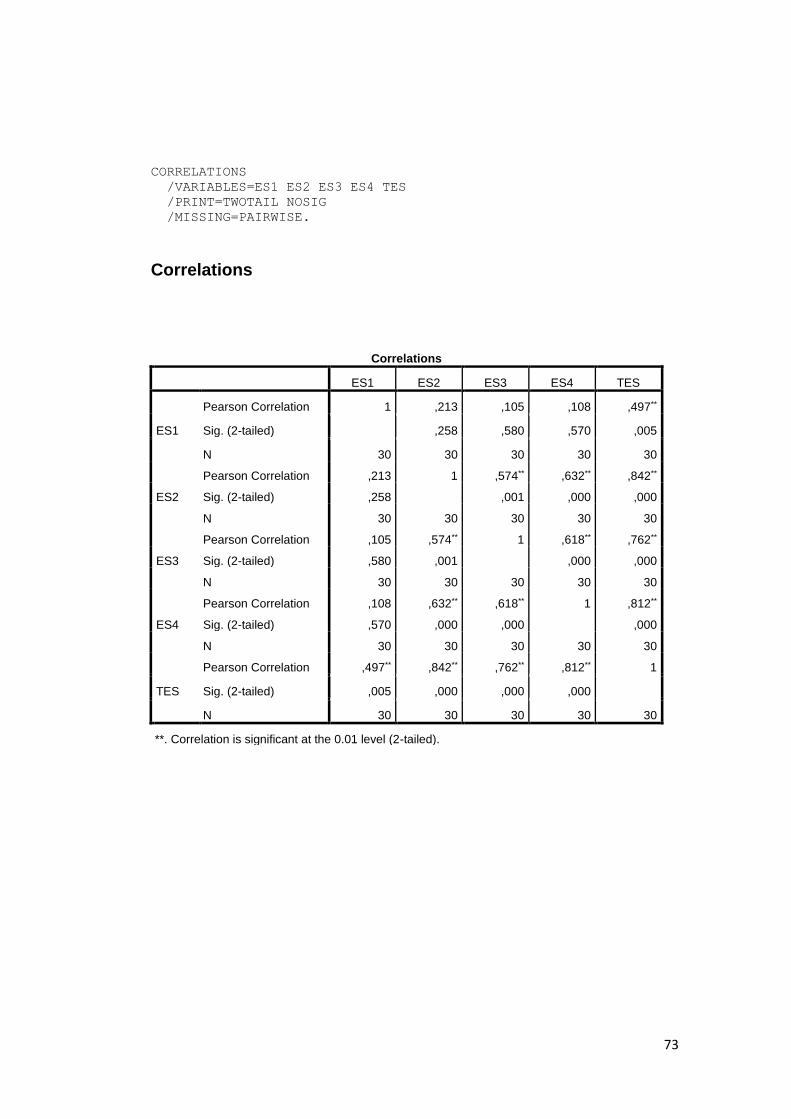
73
CORRELATIONS
/VARIABLES=ES1 ES2 ES3 ES4 TES
/PRINT=TWOTAIL NOSIG
/MISSING=PAIRWISE.
Correlations
Correlations
ES1 ES2 ES3 ES4 TES
ES1
Pearson Correlation 1 ,213 ,105 ,108 ,497**
Sig. (2-tailed) ,258 ,580 ,570 ,005
N 30 30 30 30 30
ES2
Pearson Correlation ,213 1 ,574** ,632** ,842**
Sig. (2-tailed) ,258 ,001 ,000 ,000
N 30 30 30 30 30
ES3
Pearson Correlation ,105 ,574** 1 ,618** ,762**
Sig. (2-tailed) ,580 ,001 ,000 ,000
N 30 30 30 30 30
ES4
Pearson Correlation ,108 ,632** ,618** 1 ,812**
Sig. (2-tailed) ,570 ,000 ,000 ,000
N 30 30 30 30 30
TES
Pearson Correlation ,497** ,842** ,762** ,812** 1
Sig. (2-tailed) ,005 ,000 ,000 ,000
N 30 30 30 30 30
**. Correlation is significant at the 0.01 level (2-tailed).

74
Appendix 4
Multiple Regression
1. Descriptive Analysis
Descriptive Statistics
N Minimum Maximum Mean Std. Deviation
TS 88 2,25 4,75 3,5114 ,57724
TWE 88 1,83 4,67 3,3314 ,62743
TCD 88 1,50 5,00 3,5739 ,77789
TES 88 2,25 4,75 3,6648 ,62731
Valid N (listwise) 88
2. Multiple Regression
Model Collinearity Statistics
Tolerance VIF
1
(Constant)
TS ,370 2,701
TWE ,275 3,640
TCD ,528 1,895
3. Significance t-test
Model Unstandardized Coefficients Standardized
Coefficients
t Sig.
B Std. Error Beta
1
(Constant) ,347 ,222 1,565 ,121
TS ,465 ,099 ,428 4,693 ,000
TWE ,233 ,106 ,233 2,203 ,030
TCD ,254 ,062 ,315 4,114 ,000
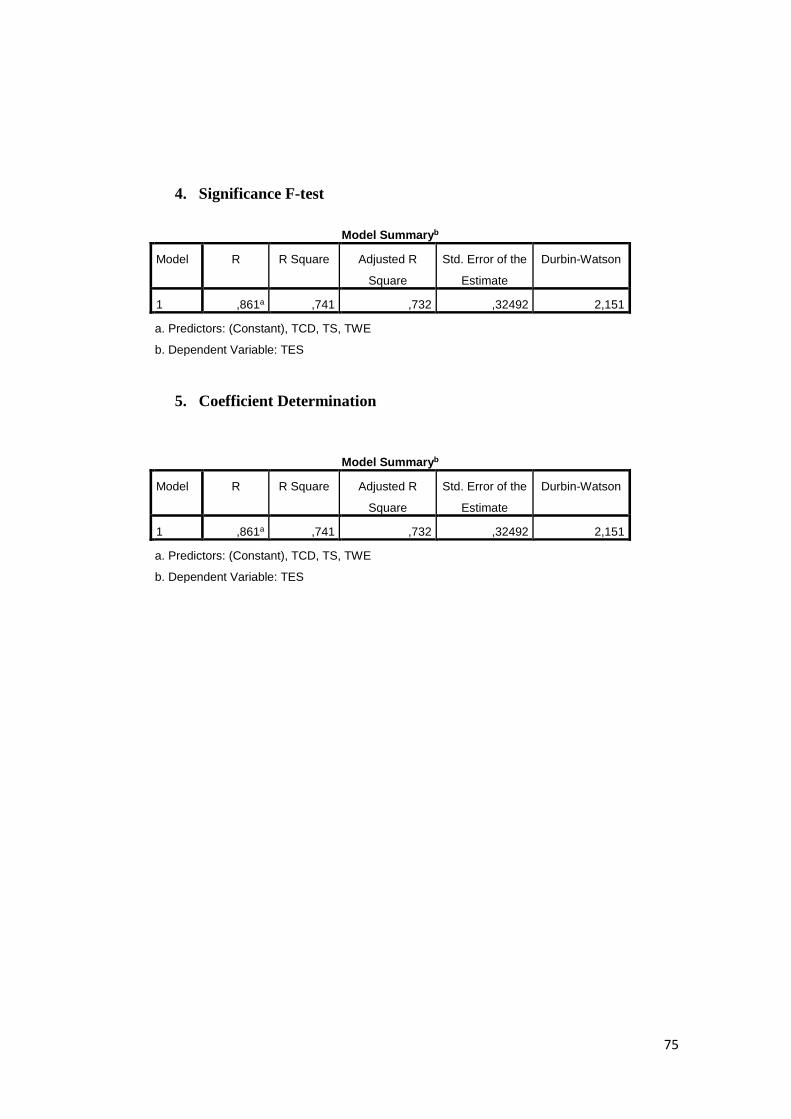
75
4. Significance F-test
Model Summaryb
Model R R Square Adjusted R
Square
Std. Error of the
Estimate
Durbin-Watson
1 ,861a ,741 ,732 ,32492 2,151
a. Predictors: (Constant), TCD, TS, TWE
b. Dependent Variable: TES
5. Coefficient Determination
Model Summaryb
Model R R Square Adjusted R
Square
Std. Error of the
Estimate
Durbin-Watson
1 ,861a ,741 ,732 ,32492 2,151
a. Predictors: (Constant), TCD, TS, TWE
b. Dependent Variable: TES

76
R TABLE

77