Embed Size (px)
Citation preview
A SIMPLIFIED BATHYMETRIC SURVEY SYSTEM USING A MODIFIED SOUNDER
GPS
Theodore L. Huscher, P.G., Geologist and David Griffith, Water Quality Specialist,
USDA-Natural Resources Conservation Service, Lincoln, NE
Abstract
Nebraska NRCS improved the accuracy of bathymetric reservoir surveys and simplified field
data collection and data analysis used to calculate sedimentation rates and stage storage
determinations for dam rehabilitation work, using a sonar-based depth finder GPS unit with 3-D
recording/mapping capability. Portability of the unit and set-up time was improved by mounting
the unit’s monitor and external antennae onto the lid of a standard 5-gallon bucket. The bucket
provides cable storage and protection until used. The unit and battery were modified to use
vehicle power adapters, resulting in a readily chargeable and transportable system that is easily
set up for field use by a two-person field crew, rather than previous method requiring three or
four persons, adding efficiency of operation. With proper software, data are translated into an
up-to-date survey of reservoir bathymetry. Data must be corrected for the depth of transducer
below water level, the measured reservoir water level, and errant shallows readings caused by
minimal depths or false shallow readings due to signal reflection off vegetation. Shallows,
vegetation, and other non-germane features are visually confirmed in the field before data
synthesis in the office. Technical aspects of system set up, and advantageous features, use of the
equipment, helpful suggestions and cautions are highlighted, presenting optimal utilization of
this system.
PRACTICE AND PROCEDURES
The Nebraska USDA-Natural Resources Conservation Service (NRCS) adapted a Garmin
GPSmap 536s1 sounder/depth finder system to a standard 5-gallon bucket lid-mount for quicker,
more efficient bathymetric survey data collection (Figure 1). This system provides for ease of
transport, set up and storage (Figure 2), and needs only a boat and two people to operate (Figure
3). Utilizing a high sensitivity global positioning system (GPS) receiver and dual-beam
transducer (sonar transponder) (Figure 4) to plot location and water depth, the system transfers
stored data using a Secure Digital (SD) card for rapid download to a computer. Data processing
involves opening the *.adm file extension, and loading it into the MapSource® software
program, transferring it and saving the data as a text file.
1 The use of trade names of all commercial products mentioned in this paper shall not be construed as
endorsements by the USDA-NRCS of these products. They are presented for informational purposes only.
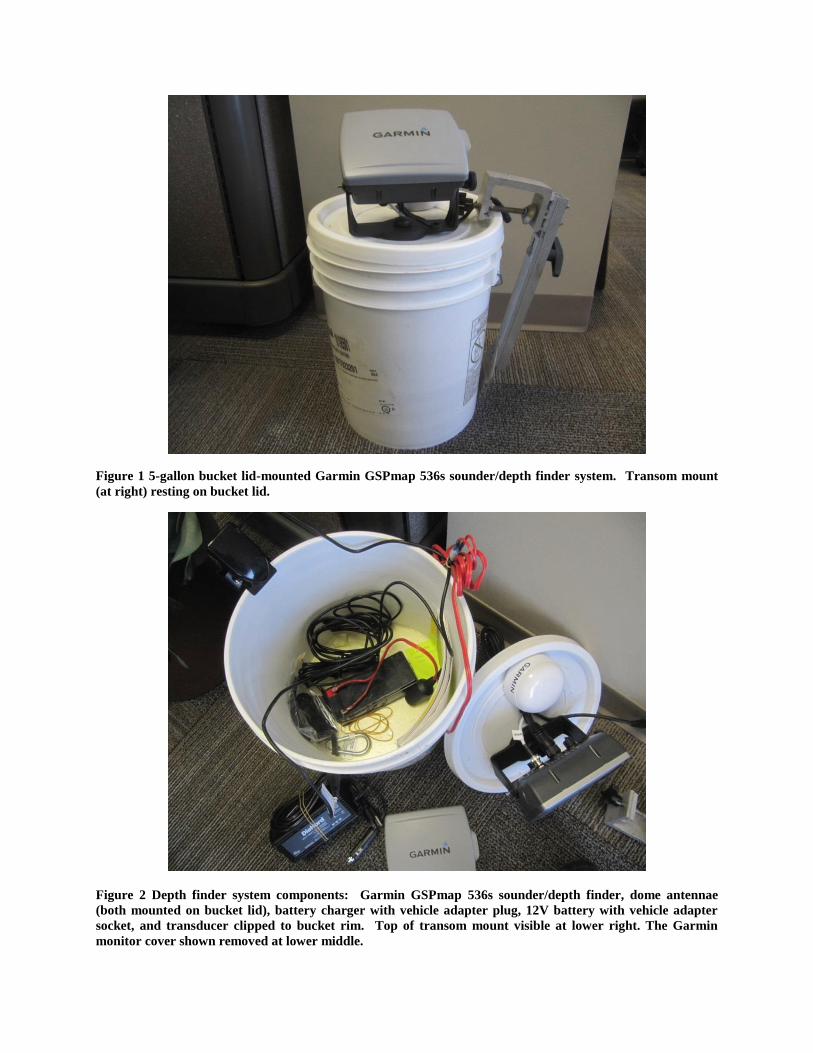
Figure 1 5-gallon bucket lid-mounted Garmin GSPmap 536s sounder/depth finder system. Transom mount
(at right) resting on bucket lid.
Figure 2 Depth finder system components: Garmin GSPmap 536s sounder/depth finder, dome antennae
(both mounted on bucket lid), battery charger with vehicle adapter plug, 12V battery with vehicle adapter
socket, and transducer clipped to bucket rim. Top of transom mount visible at lower right. The Garmin
monitor cover shown removed at lower middle.
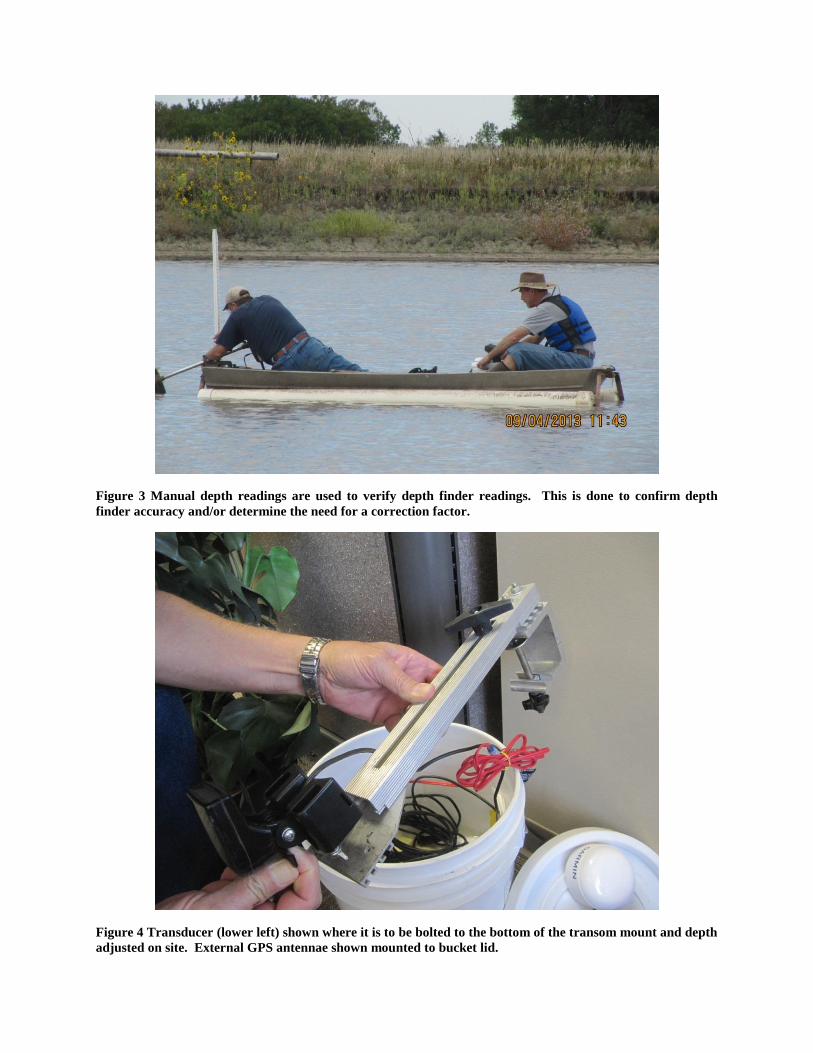
Figure 3 Manual depth readings are used to verify depth finder readings. This is done to confirm depth
finder accuracy and/or determine the need for a correction factor.
Figure 4 Transducer (lower left) shown where it is to be bolted to the bottom of the transom mount and depth
adjusted on site. External GPS antennae shown mounted to bucket lid.
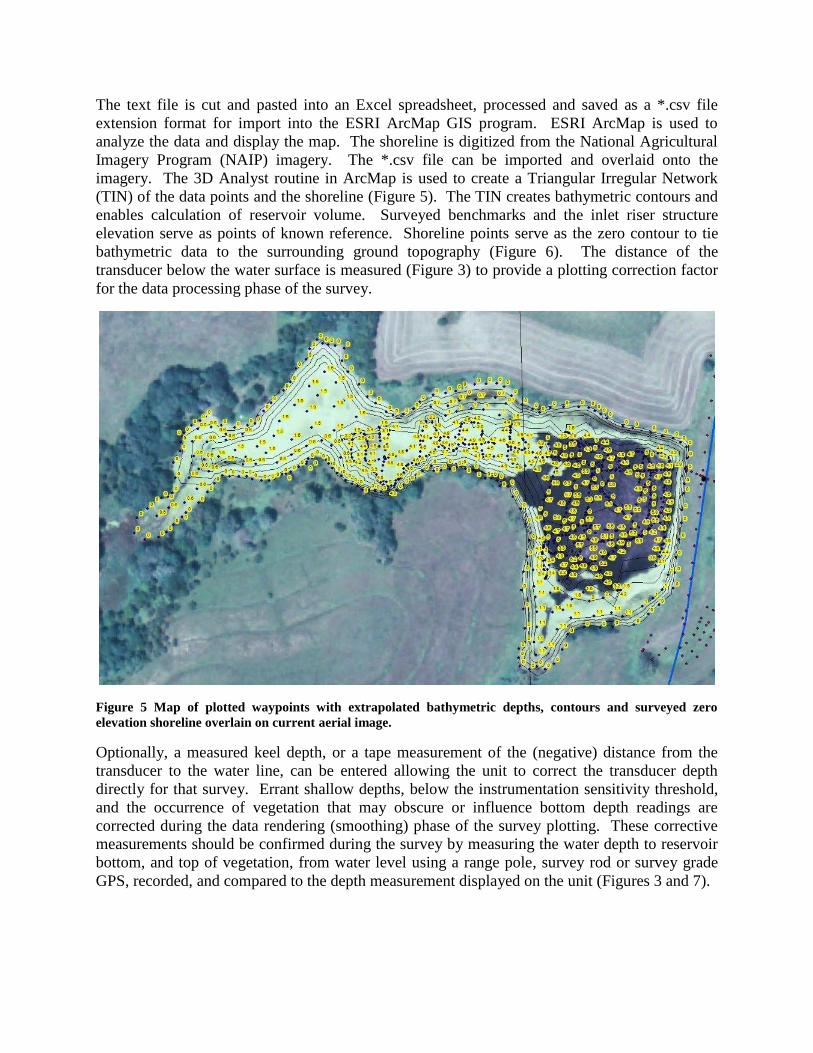
The text file is cut and pasted into an Excel spreadsheet, processed and saved as a *.csv file
extension format for import into the ESRI ArcMap GIS program. ESRI ArcMap is used to
analyze the data and display the map. The shoreline is digitized from the National Agricultural
Imagery Program (NAIP) imagery. The *.csv file can be imported and overlaid onto the
imagery. The 3D Analyst routine in ArcMap is used to create a Triangular Irregular Network
(TIN) of the data points and the shoreline (Figure 5). The TIN creates bathymetric contours and
enables calculation of reservoir volume. Surveyed benchmarks and the inlet riser structure
elevation serve as points of known reference. Shoreline points serve as the zero contour to tie
bathymetric data to the surrounding ground topography (Figure 6). The distance of the
transducer below the water surface is measured (Figure 3) to provide a plotting correction factor
for the data processing phase of the survey.
Figure 5 Map of plotted waypoints with extrapolated bathymetric depths, contours and surveyed zero
elevation shoreline overlain on current aerial image.
Optionally, a measured keel depth, or a tape measurement of the (negative) distance from the
transducer to the water line, can be entered allowing the unit to correct the transducer depth
directly for that survey. Errant shallow depths, below the instrumentation sensitivity threshold,
and the occurrence of vegetation that may obscure or influence bottom depth readings are
corrected during the data rendering (smoothing) phase of the survey plotting. These corrective
measurements should be confirmed during the survey by measuring the water depth to reservoir
bottom, and top of vegetation, from water level using a range pole, survey rod or survey grade
GPS, recorded, and compared to the depth measurement displayed on the unit (Figures 3 and 7).
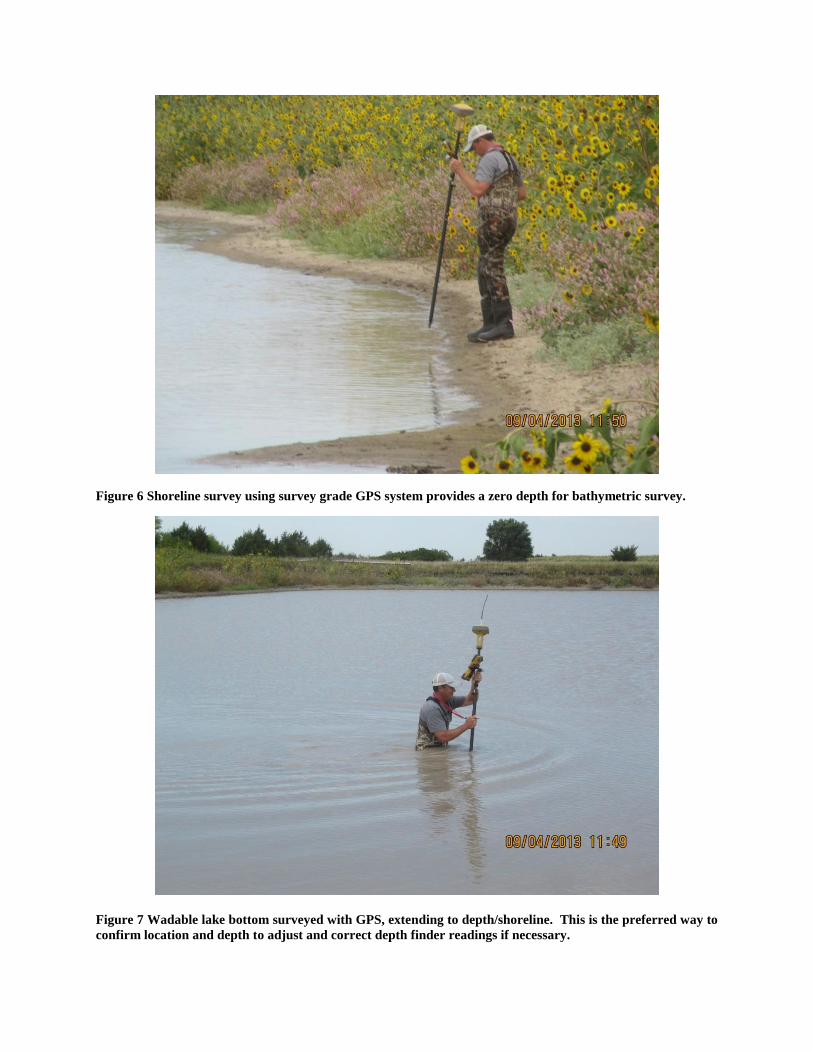
Figure 6 Shoreline survey using survey grade GPS system provides a zero depth for bathymetric survey.
Figure 7 Wadable lake bottom surveyed with GPS, extending to depth/shoreline. This is the preferred way to
confirm location and depth to adjust and correct depth finder readings if necessary.
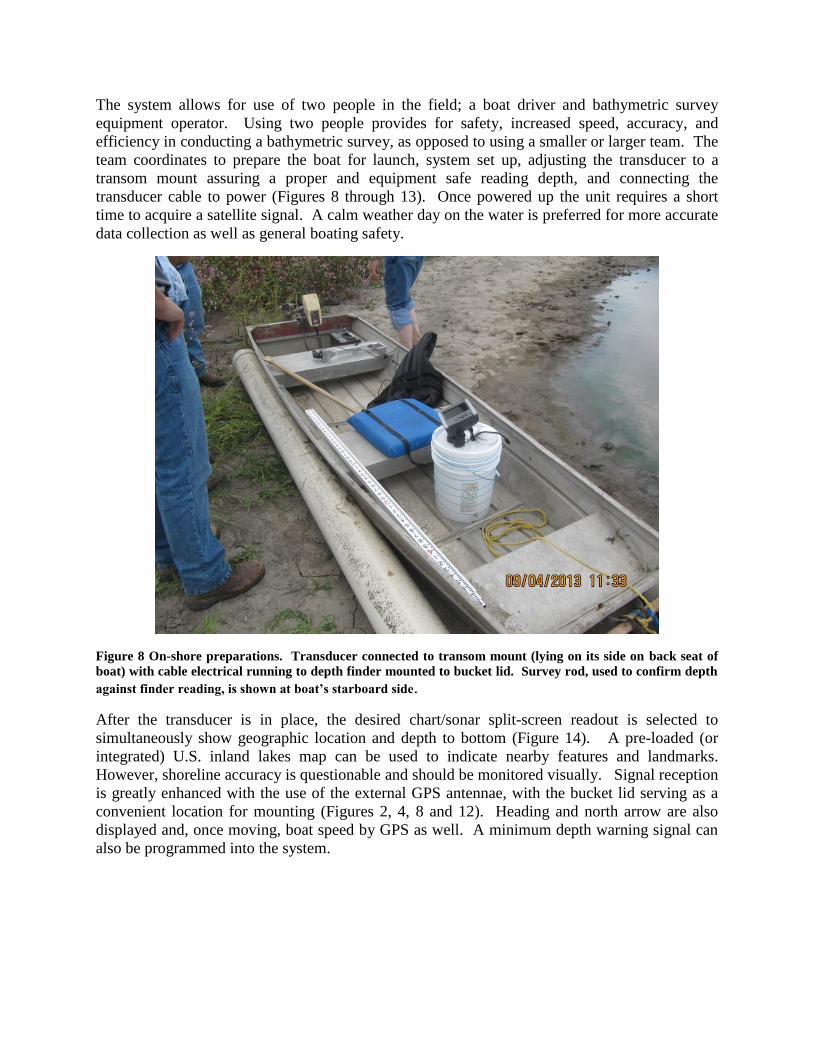
The system allows for use of two people in the field; a boat driver and bathymetric survey
equipment operator. Using two people provides for safety, increased speed, accuracy, and
efficiency in conducting a bathymetric survey, as opposed to using a smaller or larger team. The
team coordinates to prepare the boat for launch, system set up, adjusting the transducer to a
transom mount assuring a proper and equipment safe reading depth, and connecting the
transducer cable to power (Figures 8 through 13). Once powered up the unit requires a short
time to acquire a satellite signal. A calm weather day on the water is preferred for more accurate
data collection as well as general boating safety.
Figure 8 On-shore preparations. Transducer connected to transom mount (lying on its side on back seat of
boat) with cable electrical running to depth finder mounted to bucket lid. Survey rod, used to confirm depth
against finder reading, is shown at boat’s starboard side.
After the transducer is in place, the desired chart/sonar split-screen readout is selected to
simultaneously show geographic location and depth to bottom (Figure 14). A pre-loaded (or
integrated) U.S. inland lakes map can be used to indicate nearby features and landmarks.
However, shoreline accuracy is questionable and should be monitored visually. Signal reception
is greatly enhanced with the use of the external GPS antennae, with the bucket lid serving as a
convenient location for mounting (Figures 2, 4, 8 and 12). Heading and north arrow are also
displayed and, once moving, boat speed by GPS as well. A minimum depth warning signal can
also be programmed into the system.
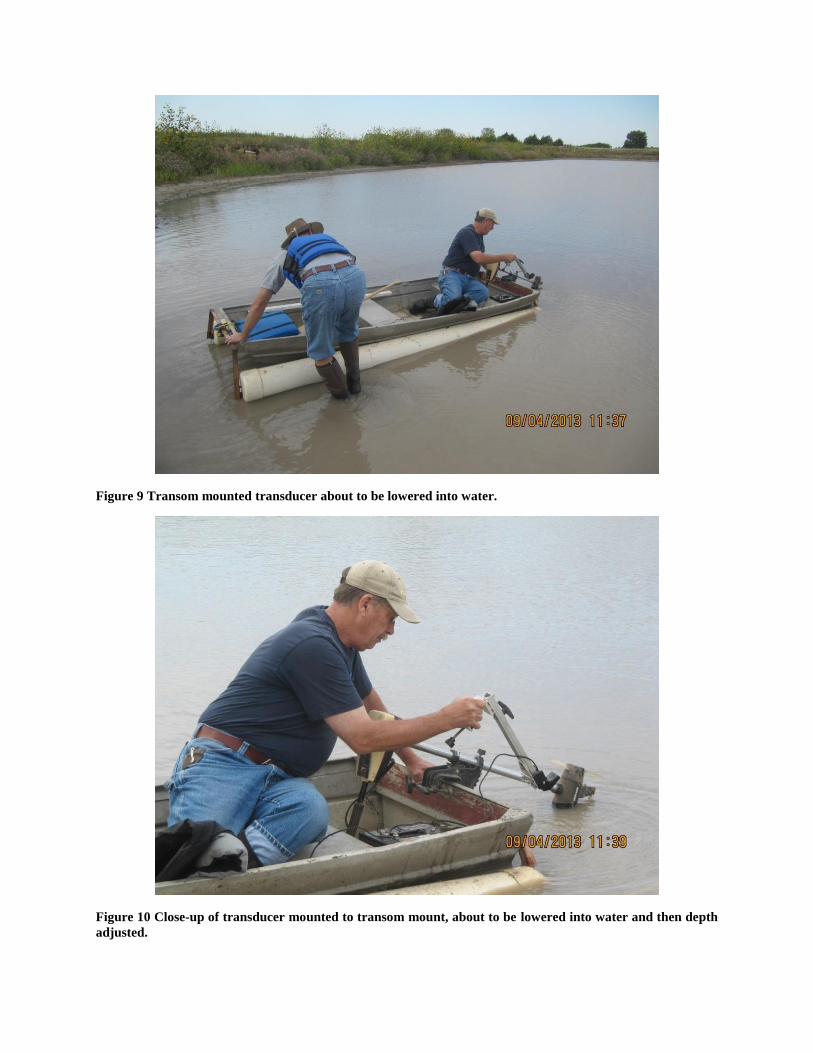
Figure 9 Transom mounted transducer about to be lowered into water.
Figure 10 Close-up of transducer mounted to transom mount, about to be lowered into water and then depth
adjusted.
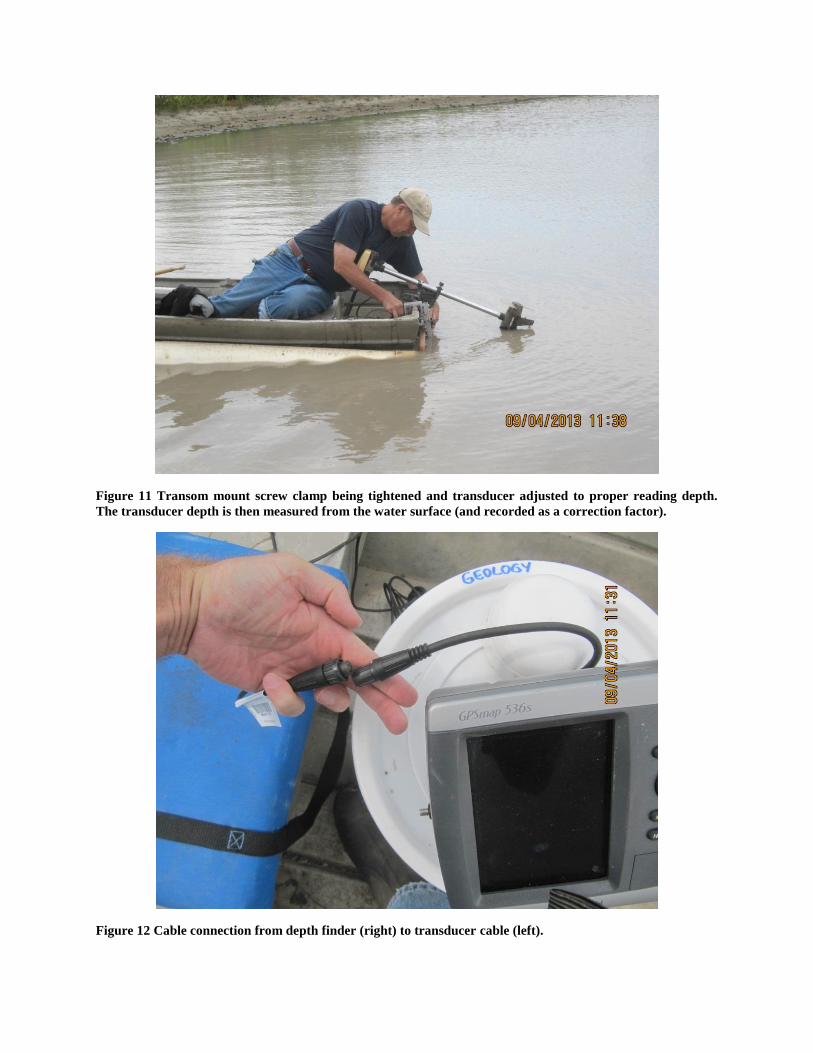
Figure 11 Transom mount screw clamp being tightened and transducer adjusted to proper reading depth.
The transducer depth is then measured from the water surface (and recorded as a correction factor).
Figure 12 Cable connection from depth finder (right) to transducer cable (left).
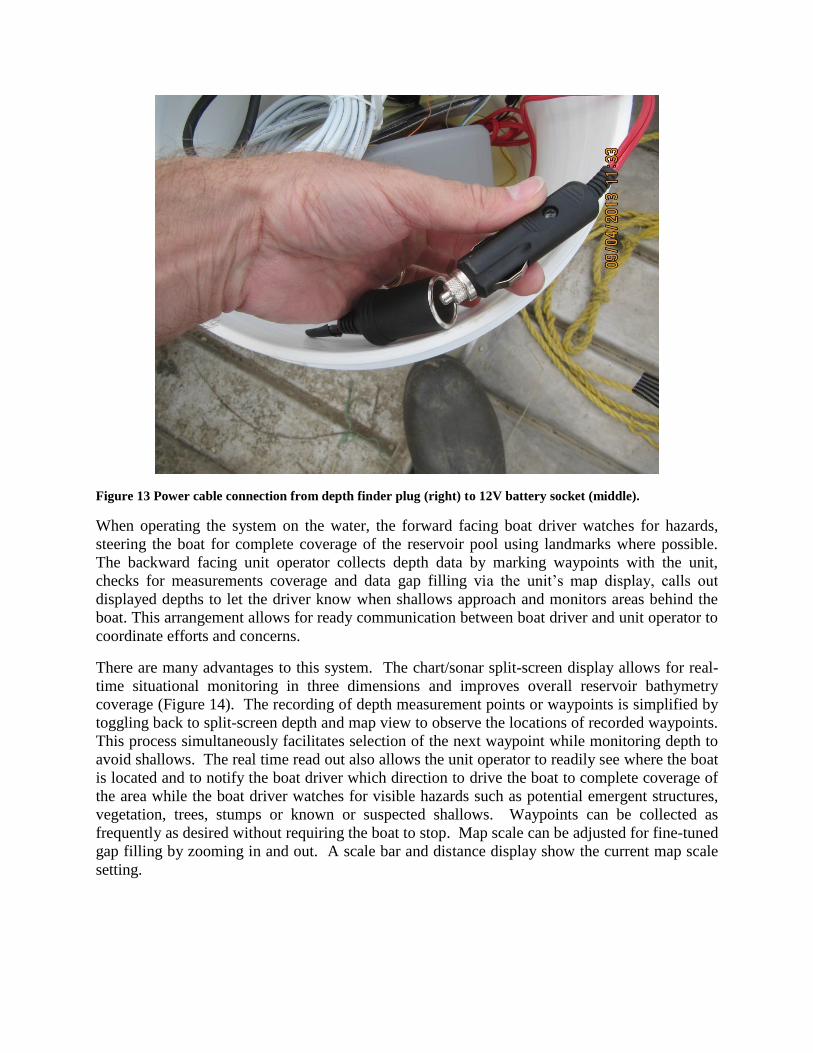
Figure 13 Power cable connection from depth finder plug (right) to 12V battery socket (middle).
When operating the system on the water, the forward facing boat driver watches for hazards,
steering the boat for complete coverage of the reservoir pool using landmarks where possible.
The backward facing unit operator collects depth data by marking waypoints with the unit,
checks for measurements coverage and data gap filling via the unit’s map display, calls out
displayed depths to let the driver know when shallows approach and monitors areas behind the
boat. This arrangement allows for ready communication between boat driver and unit operator to
coordinate efforts and concerns.
There are many advantages to this system. The chart/sonar split-screen display allows for real-
time situational monitoring in three dimensions and improves overall reservoir bathymetry
coverage (Figure 14). The recording of depth measurement points or waypoints is simplified by
toggling back to split-screen depth and map view to observe the locations of recorded waypoints.
This process simultaneously facilitates selection of the next waypoint while monitoring depth to
avoid shallows. The real time read out also allows the unit operator to readily see where the boat
is located and to notify the boat driver which direction to drive the boat to complete coverage of
the area while the boat driver watches for visible hazards such as potential emergent structures,
vegetation, trees, stumps or known or suspected shallows. Waypoints can be collected as
frequently as desired without requiring the boat to stop. Map scale can be adjusted for fine-tuned
gap filling by zooming in and out. A scale bar and distance display show the current map scale
setting.
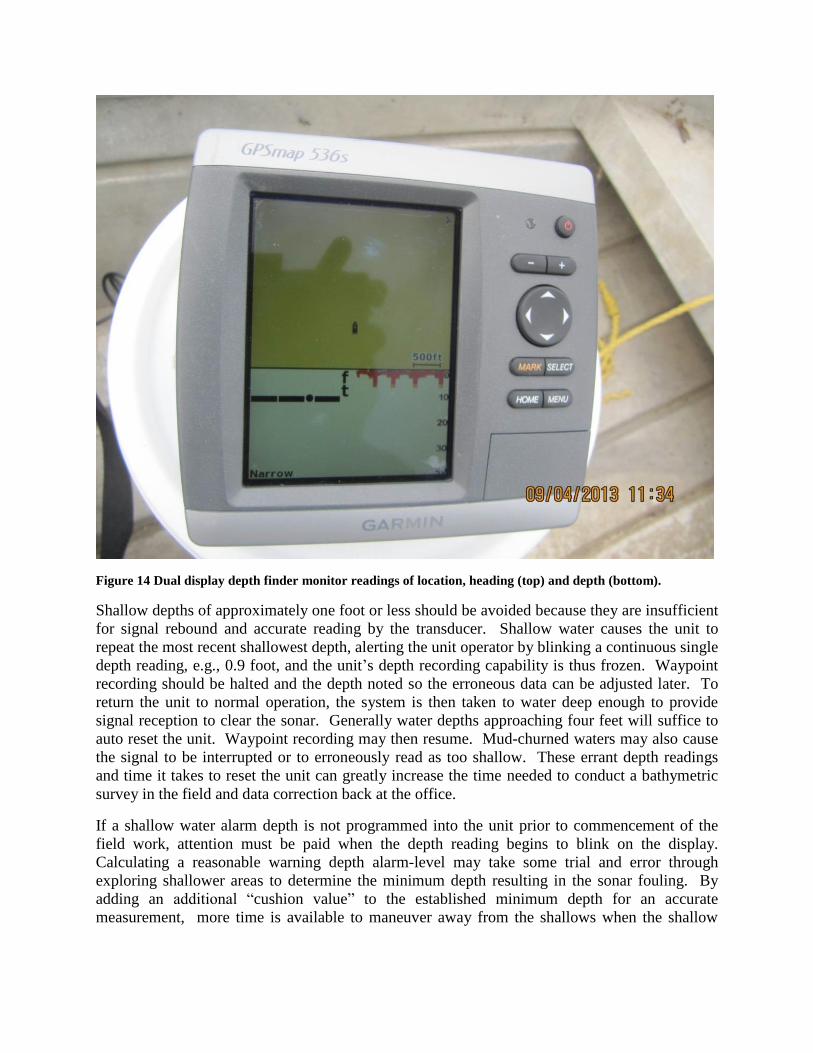
Figure 14 Dual display depth finder monitor readings of location, heading (top) and depth (bottom).
Shallow depths of approximately one foot or less should be avoided because they are insufficient
for signal rebound and accurate reading by the transducer. Shallow water causes the unit to
repeat the most recent shallowest depth, alerting the unit operator by blinking a continuous single
depth reading, e.g., 0.9 foot, and the unit’s depth recording capability is thus frozen. Waypoint
recording should be halted and the depth noted so the erroneous data can be adjusted later. To
return the unit to normal operation, the system is then taken to water deep enough to provide
signal reception to clear the sonar. Generally water depths approaching four feet will suffice to
auto reset the unit. Waypoint recording may then resume. Mud-churned waters may also cause
the signal to be interrupted or to erroneously read as too shallow. These errant depth readings
and time it takes to reset the unit can greatly increase the time needed to conduct a bathymetric
survey in the field and data correction back at the office.
If a shallow water alarm depth is not programmed into the unit prior to commencement of the
field work, attention must be paid when the depth reading begins to blink on the display.
Calculating a reasonable warning depth alarm-level may take some trial and error through
exploring shallower areas to determine the minimum depth resulting in the sonar fouling. By
adding an additional “cushion value” to the established minimum depth for an accurate
measurement, more time is available to maneuver away from the shallows when the shallow
water alarm is activated as the system alerts the crew to the hazard. This results in minimizing
unnecessary delays and maximizing field time productivity.
Monitoring current depth read outs is critical to look for drop offs, channels, and to avoid
shallows, the latter of which can cause problems for the boat motor propeller and sonar system.
The display scrolls the “bottom” surface across the screen while reading depths and adjusting the
scale when greater depths are encountered. An alert team is one that monitors shallows both
visually from the boat and by watching the unit’s depth display. Hazards are thus avoided and
the survey will proceed in an overall safer and more time-efficient manner.
If sonar reflects off benthic aquatic vegetation rather than the bottom, an erroneous (too shallow)
depth reading may result. Conducting periodic soundings with a measured weighted line or
survey rod can help validate bottom depths while measurements from the water surface to the top
of the plants can help determine an average height of subaqueous vegetation (Figures 3 and 7).
A correction factor can be calculated accordingly where depth measurements appear to be too
shallow due to vegetation reflection readings. This correction factor must be added later into the
bathymetric survey plot with special attention to areas with vegetation that are visually
confirmed and noted, as previously discussed.
The internal storage capacity of the lidded 5-gallon bucket allows for a convenient, mostly
buoyant place to store cables, the 12 volt dry cell battery, operator’s manual, tape measure and
charger (removed before taking into boat) (Figure 2). The lid-mounting of the system monitor
and external GPS antennae (Figures 1 and 2) provides a ready-made recording station for the
seated unit operator. The 12-volt dry cell battery can be wired to a vehicle power outlet (socket
or “female”) adapter (Photo 13). Some commercially available 12-volt battery chargers come
with a versatile quick connect harness adapter for use with a vehicle power adapter “male” plug.
The depth finder unit’s power wiring harness can be wired to terminate as a vehicle power
adapter plug. This battery adapter system provides for greater versatility for charging the battery
in the office, on the road or in the field from a vehicle’s power outlet. It also enables quick
connection to the depth finder unit.
RESULTS
Nebraska NRCS bathymetric surveys were previously conducted by a three person boat crew
consisting of; a boat driver, a technician to type depth measurements into a survey grade GPS
rover unit as soundings were called out by a third person using a survey rod to sound the bottom.
Often a fourth person was needed onshore to set up and guard a GPS base station reception unit
to prevent tampering or theft. The previous system also required a near or complete stop of the
drifting boat to obtain an accurate depth sounding measurement and GPS fix to establish
location, all of which added time to complete the field survey data acquisition.
The changes implemented simplify how Nebraska NRCS conducts its bathymetric reservoir
surveys. The time required conducting surveys, and the number of necessary personnel is
dramatically reduced. The streamlining of data collection, and utilization of state-of-the-practice
sonar equipment result in a significant increase in time efficiency, improve personnel safety in
the field, and more precise bathymetric mapping.


![[REDACTED] FINAL 2009 BATHYMETRIC SURVEY OF PILOT](https://img.pdfslide.us/doc/110x75/61ca8c4f0953c566e845b7a5/redacted-final-2009-bathymetric-survey-of-pilot-.jpg)