Embed Size (px)
Citation preview

Page 1 of 20
BATHYMETRIC SURVEY OF YANKEE
MEADOW RESERVOIR
PROJECT ID: CEEN_CPST_005
by
Phantom Engineers
Mitch Clark
Jared Court
Elodie Ence
Jenessa Pace
Team Mentor
Gus Williams Ph.D. – BYU Civil Engineering Department
Capstone Final Report
Submitted To
Harold Mitchell
Yankee Meadows Reservoir Co.
Department of Civil and Environmental Engineering
Brigham Young University
March 31, 2021

Page 2 of 20
EXECUTIVE SUMMARY With increasing frequency, there have been wildfires in the watershed area for Yankee Meadow
Reservoir at Dixie State national forest (near Parowan, Utah). These wildfires have caused a large
deposit of sediment to be carried into the reservoir through rainwater and snow melt, thus
decreasing the total water storage capacity of the reservoir. Furthermore, the water storage that is
present in the reservoir is difficult to access due to the thick yet fine sediment that rests within the
storage basin.
The purpose of Phantom Engineer’s project was to create a topographical (contour) map of the
shoreline up to the high-water mark. The topographical map of the shoreline will later be combined
with sonar data gathered by the Bureau of Reclamation to create a full bathymetric map of the
reservoir. The finished bathymetric map of the reservoir will enable water engineers in the area to
know how much water is stored in the reservoir at any given time. This data could also prove
useful for future research into the amount of additional sediment that builds up due to future fires,
mudslides, excess water years, etc.
This document will discuss the process and procedures which Phantom Engineers implemented in
completing the shoreline topographic map and history of the reservoir. Our project was to be
completed in several general stages:
1. Gathering GPS and drone data
2. Creating a 3D model from that data
3. Using the model to create a topographical map
The rest of this document delves into specific details on the completion of our project. First the
proposed work plan, and schedule will be presented. Followed by a description of the facilities,
tools, data and equipment needed to complete the project. Next, the proposed budget, deliverables
and performance standards will be presented.

Page 3 of 20
TABLE OF CONTENTS
BATHYMETRIC SURVEY OF YANKEE MEADOW RESERVOIR ........................................................... 1
EXECUTIVE SUMMARY .......................................................................................................................... 2
INTRODUCTION ...................................................................................................................................... 4
ORIGINAL STATEMENT OF WORK ................................................................................................................ 4
PROJECT DETAILS ........................................................................................................................................ 4
PROJECT BACKGROUND ............................................................................................................................... 5
ASSUMPTIONS & LIMITATIONS .................................................................................................................... 5
BODY OF REPORT ................................................................................................................................... 5
DESIGN, ANALYSIS & RESULTS .................................................................................................................... 6
DESIGN- ......................................................................................................................................................................... 6
ANALYSIS- ..................................................................................................................................................................... 8
RESULTS ........................................................................................................................................................................ 8
LESSONS LEARNED ....................................................................................................................................... 8
FINAL REPORT GUIDELINES ......................................................................................................................... 9
CONCLUSION ............................................................................................................................................ 9
APPENDICES ...........................................................................................................................................14
SCHEDULE ...................................................................................................................................................14
TEAM QUALIFICATIONS ..............................................................................................................................17

Page 4 of 20
INTRODUCTION
ORIGINAL STATEMENT OF WORK
In the past few years, there have been wildfires in the watershed area for Yankee Meadow
Reservoir. These wildfires have caused a large amount of sediment to be carried into the
reservoir, thus decreasing the amount of water storage capacity of the reservoir. The purpose of
Phantom Engineer’s project is to create a topographical map of the shoreline up to the high-water
mark. The topographical map of the shoreline will later be combined with sonar data gathered by
the Bureau of Reclamation to create a full bathymetric map of the reservoir. The finished
bathymetric map of the reservoir will enable water engineers in the area to know how much
water is stored in the reservoir at any given time. The rest of this document will discuss the plan
for completing the shoreline topographic map and history of the reservoir. Our project will be
completed in different tasks. These tasks are: Gathering GPS and drone data, creating a 3D
model from that data, and using the model to create a topographical map. The rest of this
document delves into more specific details on the completion of our project. First the proposed
work plan, and schedule will be presented. Followed by a description of the facilities, tools, data
and equipment needed to complete the project. Next, the proposed budget, deliverables and
performance standards will be presented.
PROJECT DETAILS
This project was conducted by students with experience surveying, documenting, and analyzing
reservoirs in the Western United States. The means, methods, and students associated with this
project were specifically selected based on the needs of Yankee Meadows Reservoir. The need
for this project (as discussed above) was highlighted by a fire near Brian Head and the
surrounding area of the reservoir.
To create an adequate map, data was collected by use of a drone and also by GPS survey
equipment. Using both of these data collecting measures ensured an accurate, complete map of
the reservoir. These methods also allow for more information to be gathered and added to the
existing data at a later date. This will help with further studies of the reservoir using sonar which
would have been a part of our project if the landscape had been more permitting.

Page 5 of 20
Analysis of the data collected was crucial and, as such, took time. In order to properly put
together a “living” map, the team took their time in order to do it correctly the first time. Also,
using some of the software that was needed had to be coordinated with other students who also
had a need of the software and computers.
PROJECT BACKGROUND
This project began as a result of decreased capacity of the Yankee Meadows Reservoir as a result
of sedimentation buildup. The cause of this sedimentation increase was a fire which decreased
vegetation in the area surrounding the reservoir. The lack of vegetation allowed or the soil to erode
more easily. Furthermore, the snow and rain runoff which fill the reservoir were carriers of
sediment. Due to this increased sediment in the basin there is a smaller volume of water that the
reservoir can contain – this project was born out of an intent to measure the new total capacity of
the reservoir.
There is other use for this information in the future, such as erosion of the water source,
sedimentation buildup, total water content, etc. This project, for instance, will aid in further
investigation of the reservoir by use of sonar, and as stated above, the data and map provided are
able to adapt and envelope new information that is added to them. This opens up the possibility of
use for this project for many years to come.
ASSUMPTIONS & LIMITATIONS
Assumptions for this project are that the desired contour map can be exact to a 1-meter scale, and
another is that this project will be beneficial to the water district. An assumption that later created
issues with data collection in the field was that the equipment would work as planned and
practiced. Another assumption that should have been checked before entering the field was good
flying weather for the drone. Finally, an assumption that proved wrong was that the field work for
this project would only take one day rather than two, but due to unforeseen circumstances, data
collection in the field took two trips.
Limitations can be categorized into general limitations, and field exploration limitations. Field
exploration limitations encountered were the driving distance, rules of taking one car per person

Page 6 of 20
due to COVID-19 restrictions, packing meals, and coordinating an entire day for all the team
members to drive three hours to and from the reservoir to gather data. Another general data
collection limitation was that cell phones have poor reception at the reservoir, so calling offsite
graduate students to ask questions during data collection was nearly impossible. During the first
field exploration, the weather was a limitation which inhibited collecting drone data due to high
velocity winds, and the GPS equipment was not working correctly. The second field exploration
also presented limitations such as getting a car stuck on rocks, and only having one drone pilot
available instead of two.
General limitations encountered were the lack of training on specific equipment, and having had
to share a software license with a master's student, because we were limited to when the model
could be worked on. The only time possible to work on the model was when the graduate student
was not on the computer, which was not very often.
PROJECT DETAILS
DESIGN, ANALYSIS & RESULTS
DESIGN-
Due to the small area of the reservoir, it was decided to use six locations around the reservoir as
our data points and target locations for the drone. The original plan for the six locations was as
follows in the figure below.

Page 7 of 20
During the second attempt to gather the necessary data, our design was changed slightly. In order
to quickly but accurately get adequate coverage of the reservoir, we kept six data points but
changed the locations. Those changes are noted below in the next figure.

Page 8 of 20
The data was gathered by two different means – both of which function as a way to ensure the
accuracy of the point cloud map. The first type or means of data was obtained through the use of
a Phantom Drone. Using this drone required that students hold a drone pilots license, and a high-
level software was installed on the application that the drone runs through. As this drone collected
data, there were targets placed in the pre-determined locations around the reservoir shown in the
above figure. These targets served as reference points for the rest of the data. The key concept is
that the targets placed on the ground are surveyed and correlated with GPS satellites. The known
information on the targets included the latitude and longitude location, along with the elevation of
each individual target. As the drone was flown around the reservoir it would take approximately 4
pictures per second. Using the drone, these pictures were taken in several patterns over several
flights. This was designed to make sure that every inch of the reservoir would be photographed.
Our drone pilot flew a total of six flights, each with their own distinct path covering the whole
surface area of the reservoir and some of the surrounding areas. This data type was later correlated
with the next data type.
The second type of data collected was the GPS survey data mentioned in the previous paragraph.
The data from a GPS unit in the surveying equipment is critical to the overall process. As
described above, without this GPS data, there would be no way to accurately portray the drone
data in order to create a living map of the reservoir. A GPS unit was loaned from the Civil
Engineering Structures Lab and technical help was provided by a friend of Dr. Mitchell. Data
was collected by taking GPS points in the center of each established target location and in other
key areas surrounding the reservoir area. These GPS points stored the latitude, longitude, and
elevation of each target location. Combining these points with the data collected using the drone
completed the system that would make a cloud map possible.
Once data collection was complete and the masking of the map was finished, a point cloud file
was developed in both LAS and PCD format. These two formats allow for future teams to take
an expedition onto the reservoir and collect the elevation or sedimentation buildup using sonar or
lidar technology to bounce signals off of the base of the water containment, and collect
information on the floor of the body of water. The sonar/lidar data that is obtained could be
added to the data collected by the Phantom Engineers team seamlessly.

Page 9 of 20
ANALYSIS-
We went through the drone pictures to “mask” the reservoir. The water was hidden in each picture
using a tool so only shoreline was left. This created a higher quality model when we inserted the
pictures in the software. Adding in this step helped create a more accurate and detailed model of
the reservoir. When masking was not implemented on past models, the software did not know what
to do with the images of the reservoir. It appeared as though there were specks of water in the sky
and on the shoreline. This model of Yankee Meadows Reservoir will consist of the shoreline with
an empty space in the model where the reservoir sits.
The second time we visited Yankee Meadow Reservoir, we were supposed to obtain one GPS
point for the base station and other points around the reservoir. We accidentally recorded four
points as the base station. The software uses the base station to find the correct GPS location and
references the other points. Had we used four base points in the model, it would have turned out
very skewed. We fixed this by deleting the other points recorded as the base station.
The more GPS points we had around the reservoir, the more accurate the model was in the end.
We originally were going to obtain only six data points but we recorded other significant locations
due to Dr. Mitchell’s wishes. Therefore, our model was more precise and detailed with all of the
data points.
We used Arc GIS to create a map from Metashape model. This map can help the community better
understand the impact that water volume can have. Through the map, they can understand the
importance of water and learn how to better regulate the use of water for livestock, local water
resources, and other uses. This could also benefit tourism that come as water is used for fishing,
hunting, camping, etc.
Sedimentation decreases the volume capacity of the reservoir. It is important to be aware of
sedimentation inflow due to fires since it has negative side effects environmentally, economically,
and physically.
RESULTS-
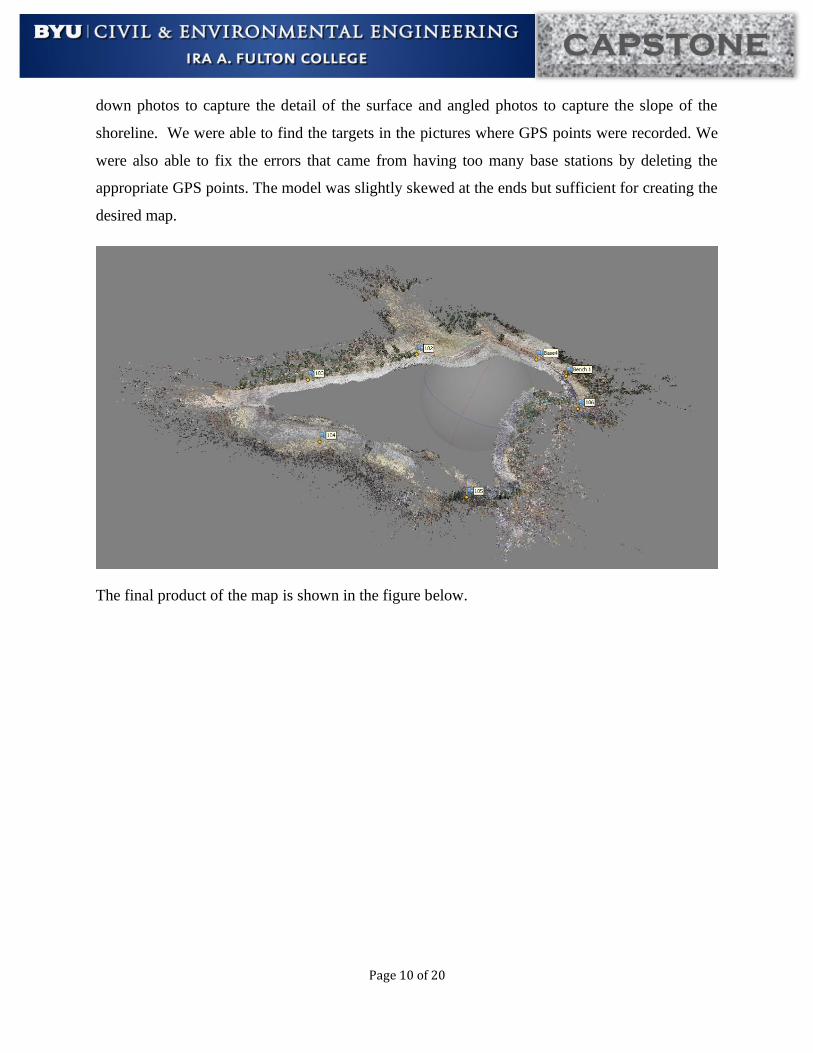
The model from the software is shown below. The drone pictures were good quality that helped
us create the model in the software. The 3-D model was better quality since we had a lot of straight
Page 10 of 20
down photos to capture the detail of the surface and angled photos to capture the slope of the
shoreline. We were able to find the targets in the pictures where GPS points were recorded. We
were also able to fix the errors that came from having too many base stations by deleting the
appropriate GPS points. The model was slightly skewed at the ends but sufficient for creating the
desired map.
The final product of the map is shown in the figure below.

Page 11 of 20
LESSONS LEARNED
As we worked on this project our biggest lesson was on the importance of complete understanding
and full view of scope. On our first visit to the reservoir Elodie and Jenessa had significant
experience in flying drones and taking points, however Jared and Mitch had not extended their
Page 12 of 20
training beyond the basics of the surveying equipment that the team was using. They both also
assumed that their knowledge of other survey equipment would transfer to this newer system. As
a result of this lack of depth our team could not accomplish all that we needed to on our first trip
to the site. When we returned, our team’s greater interest in learning the fine details of surveying
helped us to successfully accomplish all that was necessary after further preparation and planning.
Another lesson that was learned over the course of these two semesters is how hard it is to work
in groups during a global pandemic. In a small way, we all got a taste of what it would be like in
industry trying to navigate protocols, rules, and changes that come with different projects. We also
had the opportunity to learn what it would be like to work with people in other areas of the country
as we worked together remotely as much as possible. With the implementation of the universities
COVID-19 regulations, we had to adjust our approach to gathering, analyzing, and completing the
data portions of our project. This is similar to what would be expected of engineers working with
others that are not in the same office. In some ways, doing a project amidst the virus was very
irritating. However, it taught us a good lesson on patience, and charity as we worked together to
accomplish everything.
As our project has progressed, there are several aspects of our approach that we feel has allowed
us to succeed in meeting our goals in completing this project in a timely and accurate manner. The
first aspect of our approach that we feel has made a difference is that of planning. As our team has
remained in continual contact and ensured regular meetings, we have been able to work largely in
the “important, non-urgent" category of work. Our team also participated in the assignment to get
to know each other by sharing personal difficulties from our developmental years. Because of
participation in this activity, we have had greater understanding of each other and our ability to
work together has increased dramatically.
Our lessons learned came from both successes and failures, and in summary we have learned the
importance of training, planning, and ensuring that each team member feels connected to the group
as a whole.

Page 13 of 20
CONCLUSION
Over the course of the past two semesters, we have learned as a team the importance of both
planning ahead, and improvising in the field in order to have a successful project. During the first
semester (fall 2020), we learned the impact that good planning and communication can have on
our ability to deliver the high quality of work that we demand of ourselves, and our sponsor
expects. In the second semester (winter 2021), we learned the importance of hard work and
thinking ahead. There were several times we had to scramble to accomplish all of the tasks that
were expected. However, towards the end of the semester, we all worked hard together to finish
the project and ensure that a good product was available to be delivered to our sponsor. We are
proud of the work that was accomplished during these two semesters especially due to the
restrictions due to COVID-19.
For our project, we were able to collect data through surveying and drone footage. That data was
analyzed and workshopped in a way that a good, living map was made. That map was then
processed in ArcGIS to provide a single map showing the potential high water mark of the
reservoir. This map and the data can be presented to our sponsor and the Yankee Meadows
Reservoir Co. with the expectation that they can continue to use our work for many years to come.

Page 14 of 20
APPENDICES
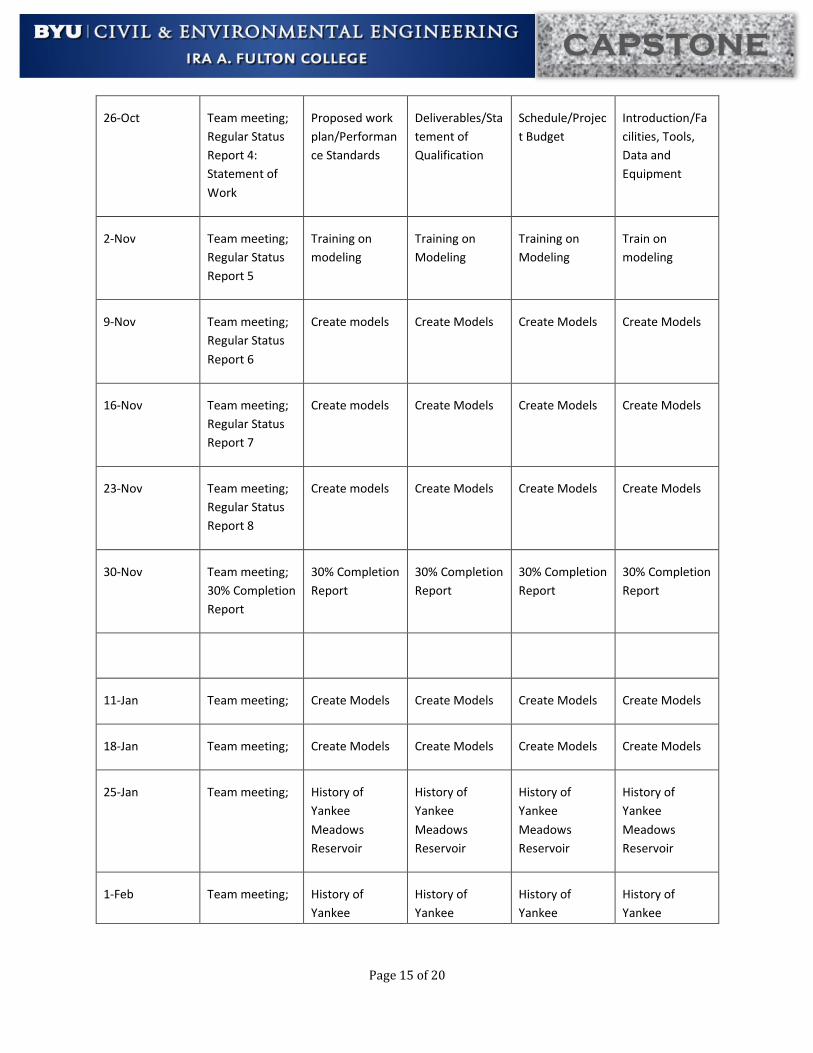
SCHEDULE
Week of: All Jared Mitch Elodie Jenessa
7-Sep Team meeting; Training on
Project
Training on
Project
Contact Bryce
for drones
Contact Dr.
Hotchkiss
14-Sep Team meeting;
Field visit to
Yankee
Meadows
Reservoir
GPS equipment GPS equipment Cars/Drones Drones/Contact
Dr. Hotchkiss
21-Sep Team meeting; GPS equipment GPS equipment Drones Drones
28-Sep Team meeting; Lead on WIG Lead on WIG Drones Drones
5-Oct Team meeting;
Regular Status
Report 1
Training on GPS
from Todd
Osborn
GPS Training on GPS
from Todd
Osborn
GPS
12-Oct Team meeting;
Field visit to
Yankee
Meadows
Reservoir;
Regular Status
Report 2
GPS
equipment/fish
y crackers
GPS/Muffins Charge
drones/cards
Drones
19-Oct Team meeting
w/ Harold
Mitchell;
Regular Status
Report 3
Export GPS data Export drone
data
Contact Izaak
for model info
Drones
Page 15 of 20
26-Oct Team meeting;
Regular Status
Report 4:
Statement of
Work
Proposed work
plan/Performan
ce Standards
Deliverables/Sta
tement of
Qualification
Schedule/Projec
t Budget
Introduction/Fa
cilities, Tools,
Data and
Equipment
2-Nov Team meeting;
Regular Status
Report 5
Training on
modeling
Training on
Modeling
Training on
Modeling
Train on
modeling
9-Nov Team meeting;
Regular Status
Report 6
Create models Create Models Create Models Create Models
16-Nov Team meeting;
Regular Status
Report 7
Create models Create Models Create Models Create Models
23-Nov Team meeting;
Regular Status
Report 8
Create models Create Models Create Models Create Models
30-Nov Team meeting;
30% Completion
Report
30% Completion
Report
30% Completion
Report
30% Completion
Report
30% Completion
Report
11-Jan Team meeting; Create Models Create Models Create Models Create Models
18-Jan Team meeting; Create Models Create Models Create Models Create Models
25-Jan Team meeting; History of
Yankee
Meadows
Reservoir
History of
Yankee
Meadows
Reservoir
History of
Yankee
Meadows
Reservoir
History of
Yankee
Meadows
Reservoir
1-Feb Team meeting; History of
Yankee
History of
Yankee
History of
Yankee
History of
Yankee

Page 16 of 20
Meadows
Reservoir
Meadows
Reservoir
Meadows
Reservoir
Meadows
Reservoir
8-Feb Team meeting; Final Report Final Report Final Report Final Report
15-Feb Team meeting; Final Report Final Report Final Report Final Report
22-Feb Team meeting; Final Report Final Report Final Report Final Report
1-Mar Team meeting; Final Report Final Report Final Report Final Report
8-Mar Team meeting; Final Report Final Report Final Report Final Report
15-Mar Team meeting; Final Report Final Report Final Report Final Report
22-Mar Team meeting; Final Report Final Report Final Report Final Report
29-Mar Team meeting; Final Report Final Report Final Report Final Report

Page 17 of 20
TEAM QUALIFICATIONS

Page 18 of 20

Page 19 of 20

Page 20 of 20