Embed Size (px)
Citation preview
1
A Simplified 2-D GC SystemFor the Analysis of Complex
Samples
This presentation describes the design and application of a simplified 2-D GC system basedon a Deans switch, a single GC oven, and no cryogenic focusing. The technique affordsanalysts very high resolving power. Simplified 2-D GC can be used to accomplish theseparation of specific analytes from very complex matrices where, on any single column, theanalytes coelute with several other compounds, making their analysis difficult or impossible.This approach can, in many applications, solve difficult analytical problems with a relativelylow cost, easy to use system.
Contents of this presentation:•Overview of Agilent’s “Simplified 2-D GC”•Application examples: - Aromatics and Oxygenates in Gasoline per EU methods EN12177 and EN13132 - 4,6-Dimethyldibenzothiophene (low ppm) in diesel with FID - Trace (ppb) thiophene in benzene with FID - Purity of denatured fuel ethanol (blending stock for RFG)•Overview of Method Developers Tools•Identification of Organophosphorous Pesticides in Citrus Peel Oils
2
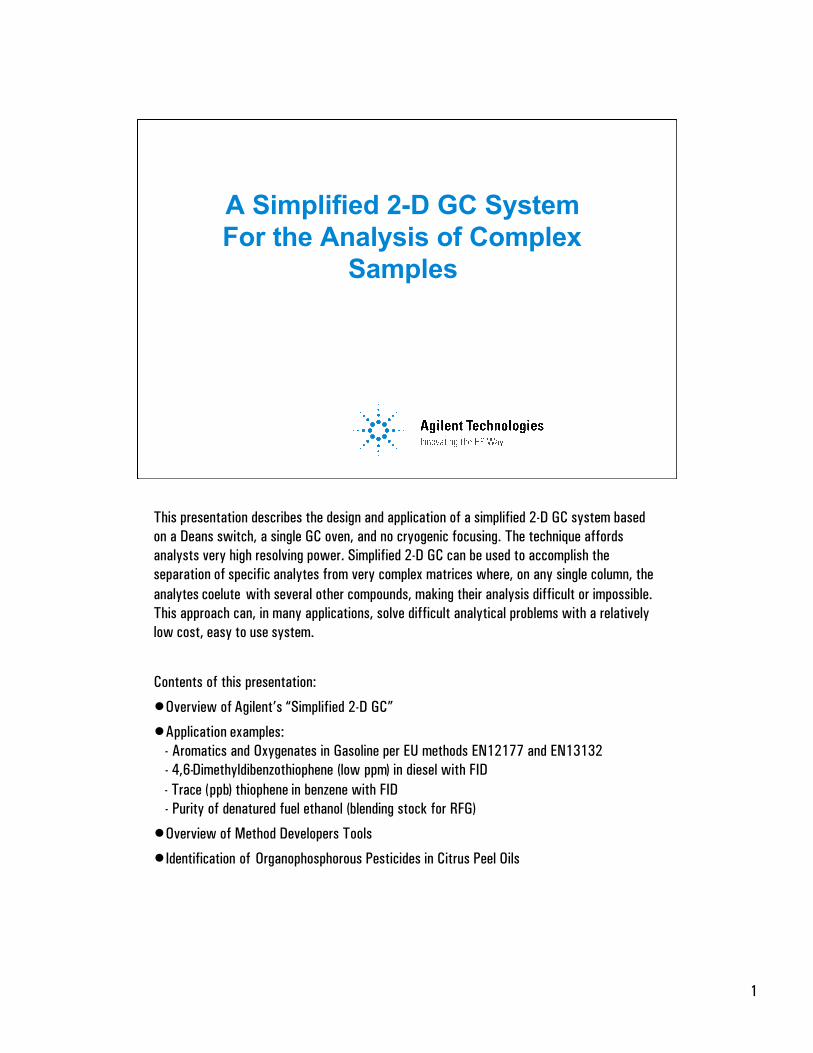
GC Analysis in Complex Matrices
• In complex sample matrices, there are often too manyoverlapping compounds to allow resolution of thecompound(s) of interest, even with the highest resolutioncolumns available.
• Must use some approach which gives selectivity
– Selective sample prep like SPE
– Selective stationary phase like Carbowax
– Selective element detector like FPD, AED, NPD etc.
– Spectral detector like GC-MS or GC-IR
– Multidimensional (2-D) GC
Complex sample matrices like petroleum products, flavor oils, and concentrated enviromentalextracts contain so many compounds that it is often impossible to completely separatespecific compounds of interst. In these cases, the method must incorporate other approachesto solve the problem. Tradition approaches usually involve increasing the method selectivitythrough sample preparation, column stationary phase, element selective detection or massselective detection. These approaches can often be used in combination to attack difficultproblems.Multidimensional (2-D) GC adds another dimension (pun intended) to the separation schemethat can greatly increase the resolution of a specific analyte(s) from other compounds in thesample matrix. In many cases, the 2-D GC approach is sufficient by itself to solve theproblem. It is, however, compatible with the other approachs listed above and can becombined with them to solve the most difficult problems.
3
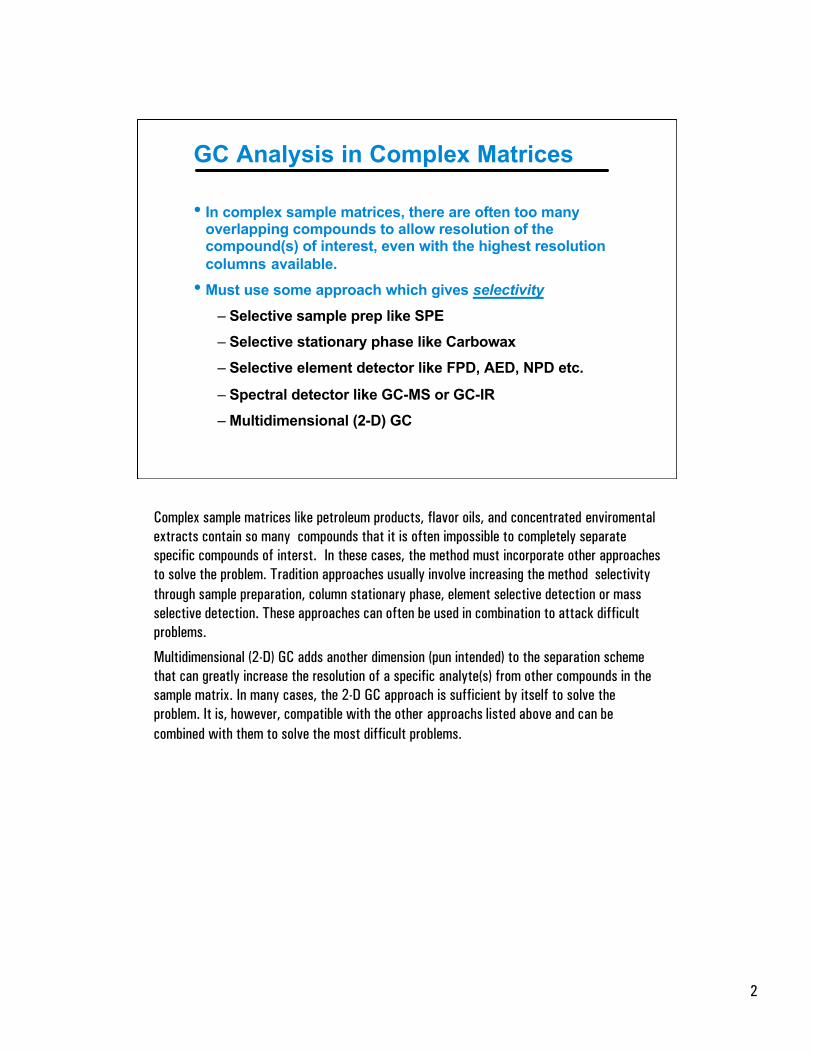
Example: Diesel Fuel
0 5 10 15 20
There are thousands of compounds in diesel
Diesel fuel is a good example of a complex matrix. There are thousands of differentcompounds in diesel, ranging from alkanes to alkenes to aromatics to heteroatomic sulfur,nitrogen, and oxygen compounds. The probability of completely resolving a single compoundof interest from all others in the sample is low. Some combination of the techniques listed onthe previous slide would probably be necessary to accurately measure a specific analyte.Later in this presentation, a method to isolate a specific sulfur compound using 2-D GC isshown.
4
Multidimensional (2-D) GC
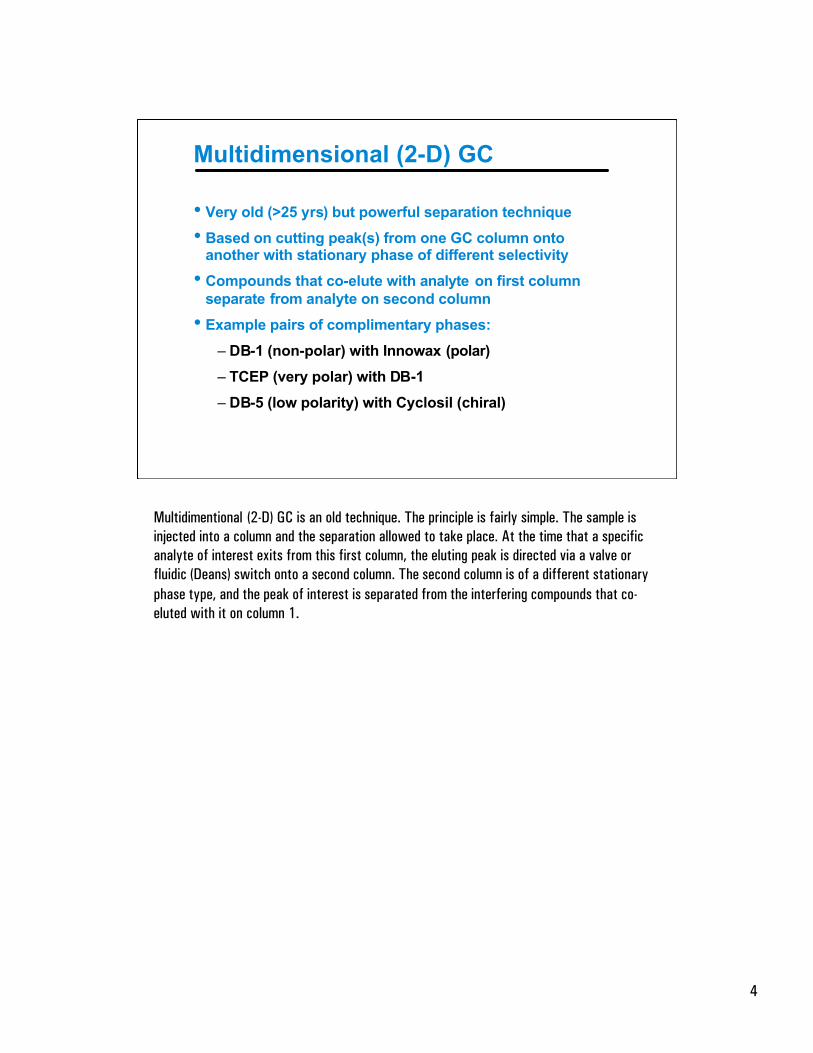
• Very old (>25 yrs) but powerful separation technique
• Based on cutting peak(s) from one GC column ontoanother with stationary phase of different selectivity
• Compounds that co-elute with analyte on first columnseparate from analyte on second column
• Example pairs of complimentary phases:
– DB-1 (non-polar) with Innowax (polar)
– TCEP (very polar) with DB-1
– DB-5 (low polarity) with Cyclosil (chiral)
Multidimentional (2-D) GC is an old technique. The principle is fairly simple. The sample isinjected into a column and the separation allowed to take place. At the time that a specificanalyte of interest exits from this first column, the eluting peak is directed via a valve orfluidic (Deans) switch onto a second column. The second column is of a different stationaryphase type, and the peak of interest is separated from the interfering compounds that co-eluted with it on column 1.
5
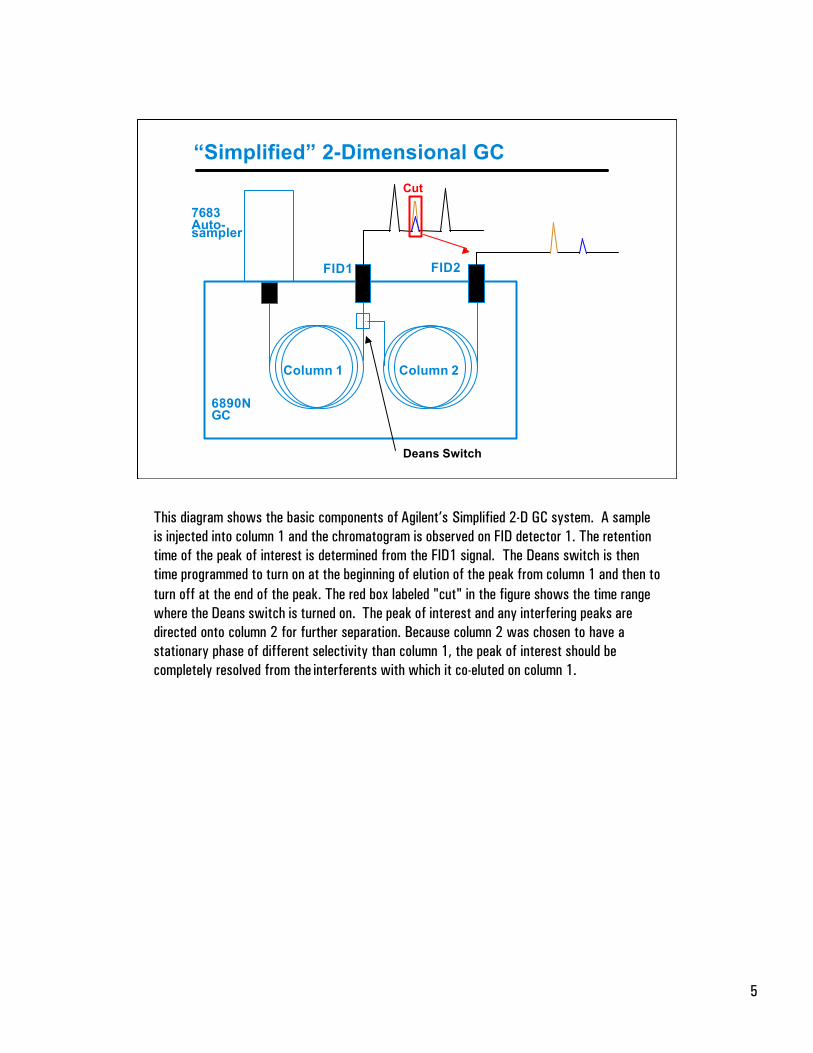
“Simplified” 2-Dimensional GC
Cut
Deans Switch
7683Auto-sampler
6890NGC
FID1 FID2
Column 1 Column 2
This diagram shows the basic components of Agilent’s Simplified 2-D GC system. A sampleis injected into column 1 and the chromatogram is observed on FID detector 1. The retentiontime of the peak of interest is determined from the FID1 signal. The Deans switch is thentime programmed to turn on at the beginning of elution of the peak from column 1 and then toturn off at the end of the peak. The red box labeled "cut" in the figure shows the time rangewhere the Deans switch is turned on. The peak of interest and any interfering peaks aredirected onto column 2 for further separation. Because column 2 was chosen to have astationary phase of different selectivity than column 1, the peak of interest should becompletely resolved from the interferents with which it co-eluted on column 1.
6
Early 2-D GC Had Some Challenges
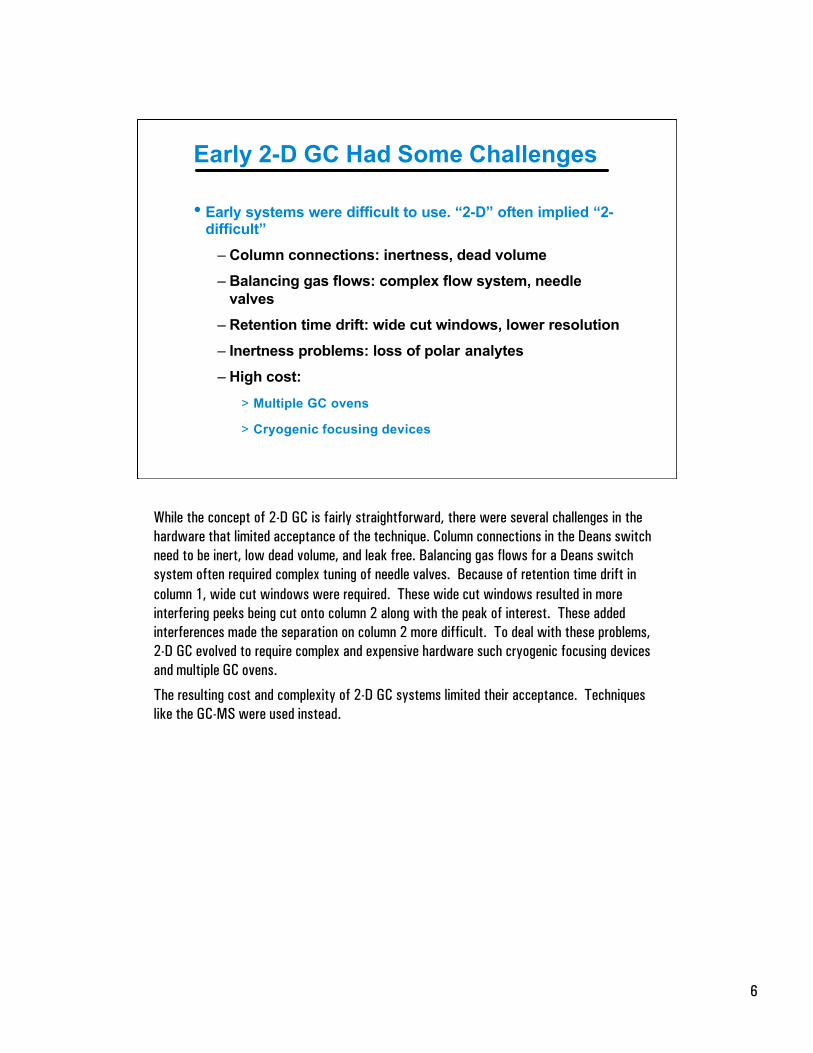
• Early systems were difficult to use. “2-D” often implied “2-difficult”
– Column connections: inertness, dead volume
– Balancing gas flows: complex flow system, needlevalves
– Retention time drift: wide cut windows, lower resolution
– Inertness problems: loss of polar analytes
– High cost:
> Multiple GC ovens
> Cryogenic focusing devices
While the concept of 2-D GC is fairly straightforward, there were several challenges in thehardware that limited acceptance of the technique. Column connections in the Deans switchneed to be inert, low dead volume, and leak free. Balancing gas flows for a Deans switchsystem often required complex tuning of needle valves. Because of retention time drift incolumn 1, wide cut windows were required. These wide cut windows resulted in moreinterfering peeks being cut onto column 2 along with the peak of interest. These addedinterferences made the separation on column 2 more difficult. To deal with these problems,2-D GC evolved to require complex and expensive hardware such cryogenic focusing devicesand multiple GC ovens.The resulting cost and complexity of 2-D GC systems limited their acceptance. Techniqueslike the GC-MS were used instead.
7
Why 2-D GC? What’s Changed?
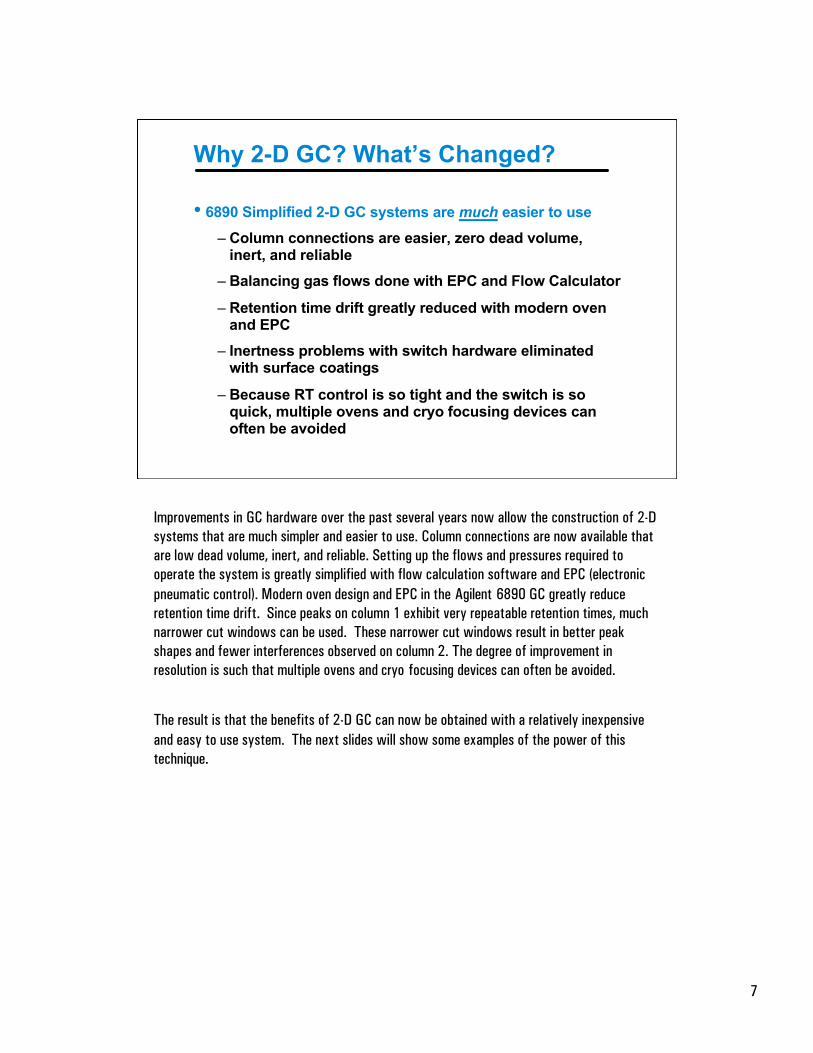
• 6890 Simplified 2-D GC systems are much easier to use
– Column connections are easier, zero dead volume,inert, and reliable
– Balancing gas flows done with EPC and Flow Calculator
– Retention time drift greatly reduced with modern ovenand EPC
– Inertness problems with switch hardware eliminatedwith surface coatings
– Because RT control is so tight and the switch is soquick, multiple ovens and cryo focusing devices canoften be avoided
Improvements in GC hardware over the past several years now allow the construction of 2-Dsystems that are much simpler and easier to use. Column connections are now available thatare low dead volume, inert, and reliable. Setting up the flows and pressures required tooperate the system is greatly simplified with flow calculation software and EPC (electronicpneumatic control). Modern oven design and EPC in the Agilent 6890 GC greatly reduceretention time drift. Since peaks on column 1 exhibit very repeatable retention times, muchnarrower cut windows can be used. These narrower cut windows result in better peakshapes and fewer interferences observed on column 2. The degree of improvement inresolution is such that multiple ovens and cryo focusing devices can often be avoided.
The result is that the benefits of 2-D GC can now be obtained with a relatively inexpensiveand easy to use system. The next slides will show some examples of the power of thistechnique.
8
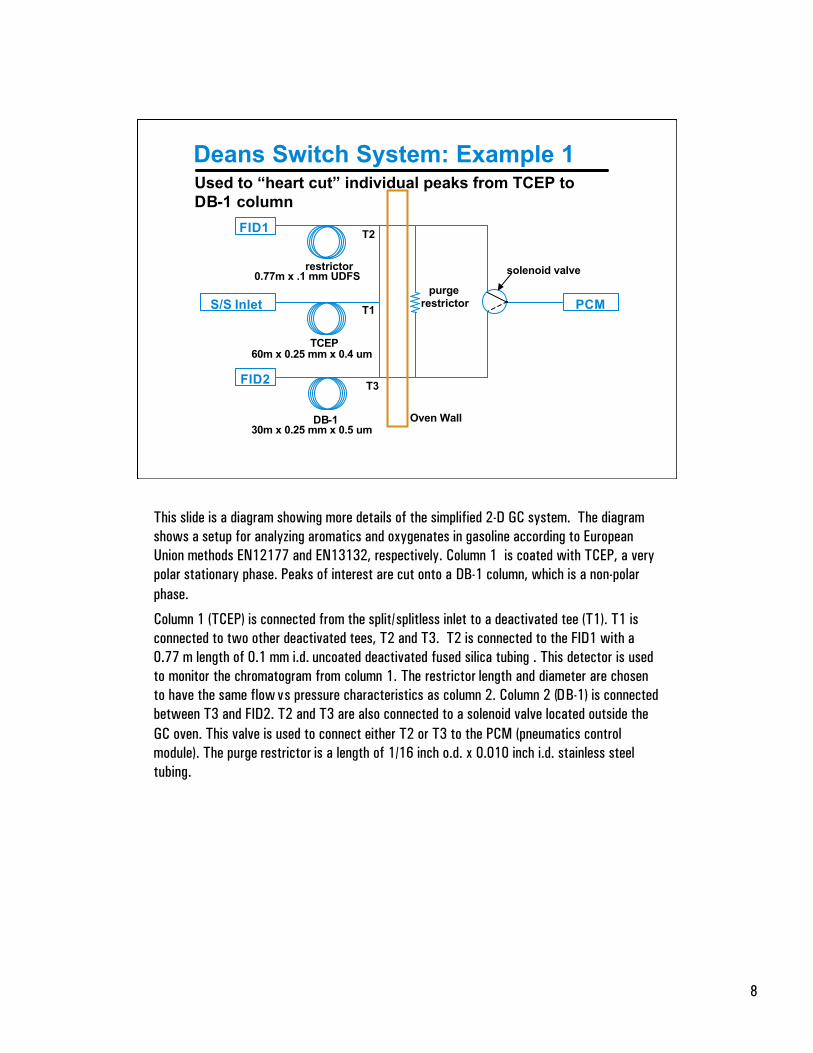
Deans Switch System: Example 1
FID1
S/S Inlet
FID2
PCMrestrictor
solenoid valverestrictor
TCEP
DB-130m x 0.25 mm x 0.5 um
60m x 0.25 mm x 0.4 um
0.77m x .1 mm UDFS
Used to “heart cut” individual peaks from TCEP toDB-1 column
Oven Wall
purge
T3
T2
T1
This slide is a diagram showing more details of the simplified 2-D GC system. The diagramshows a setup for analyzing aromatics and oxygenates in gasoline according to EuropeanUnion methods EN12177 and EN13132, respectively. Column 1 is coated with TCEP, a verypolar stationary phase. Peaks of interest are cut onto a DB-1 column, which is a non-polarphase.Column 1 (TCEP) is connected from the split/splitless inlet to a deactivated tee (T1). T1 isconnected to two other deactivated tees, T2 and T3. T2 is connected to the FID1 with a0.77 m length of 0.1 mm i.d. uncoated deactivated fused silica tubing . This detector is usedto monitor the chromatogram from column 1. The restrictor length and diameter are chosento have the same flow vs pressure characteristics as column 2. Column 2 (DB-1) is connectedbetween T3 and FID2. T2 and T3 are also connected to a solenoid valve located outside theGC oven. This valve is used to connect either T2 or T3 to the PCM (pneumatics controlmodule). The purge restrictor is a length of 1/16 inch o.d. x 0.010 inch i.d. stainless steeltubing.
9
Oxygenates in Gasoline
FID
S/S Inlet
FID
PCMrestrictor
solenoid valve (off)restrictor
TCEP
DB-1
3 mL/min
4 mL/min
1 mL/min
3 mL/min
2 mL/min
(trickle purge)(<< 1mL/min)
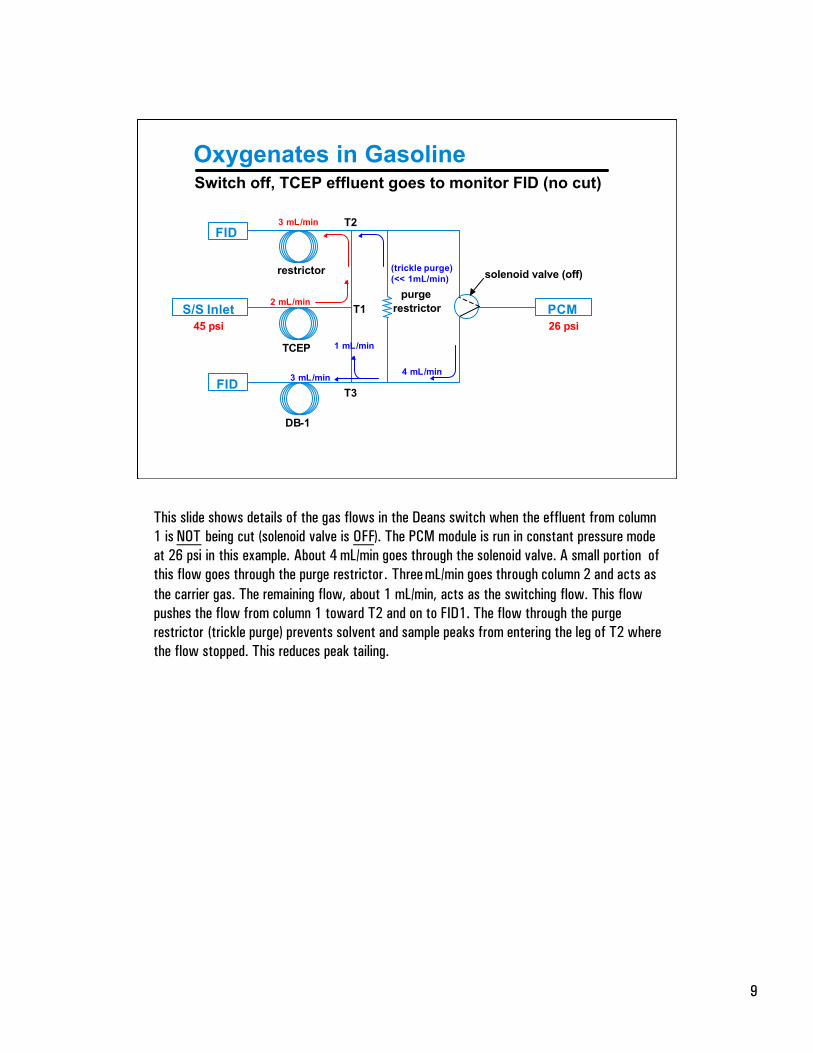
Switch off, TCEP effluent goes to monitor FID (no cut)
45 psi 26 psi
purge
T3
T2
T1
This slide shows details of the gas flows in the Deans switch when the effluent from column1 is NOT being cut (solenoid valve is OFF). The PCM module is run in constant pressure modeat 26 psi in this example. About 4 mL/min goes through the solenoid valve. A small portion ofthis flow goes through the purge restrictor. Three mL/min goes through column 2 and acts asthe carrier gas. The remaining flow, about 1 mL/min, acts as the switching flow. This flowpushes the flow from column 1 toward T2 and on to FID1. The flow through the purgerestrictor (trickle purge) prevents solvent and sample peaks from entering the leg of T2 wherethe flow stopped. This reduces peak tailing.
10
Oxygenates in Gasoline
FID 1
S/S Inlet
FID 2
PCMrestrictor
solenoid valve (on)restrictor
TCEP
DB-1
3 mL/min
4 mL/min
1 mL/min
3 mL/min
2 mL/min
(trickle purge)(<< 1mL/min)
45 psi 26 psi
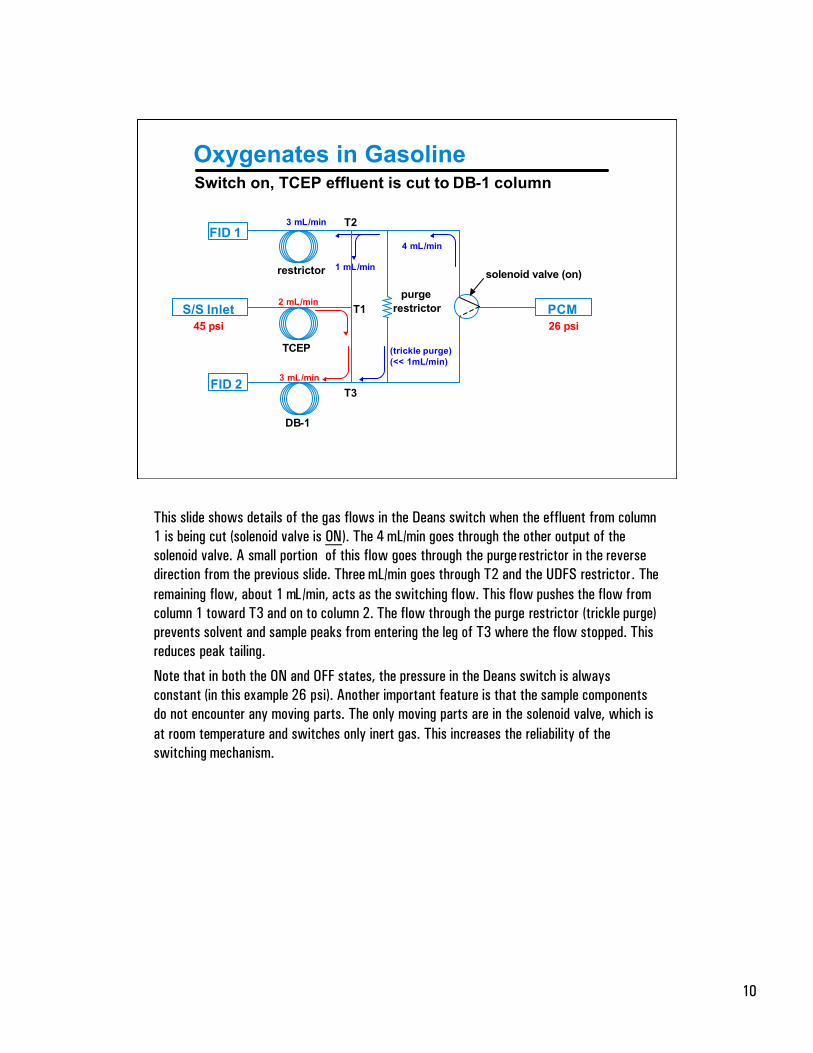
Switch on, TCEP effluent is cut to DB-1 column
purge
T3
T2
T1
This slide shows details of the gas flows in the Deans switch when the effluent from column1 is being cut (solenoid valve is ON). The 4 mL/min goes through the other output of thesolenoid valve. A small portion of this flow goes through the purge restrictor in the reversedirection from the previous slide. Three mL/min goes through T2 and the UDFS restrictor. Theremaining flow, about 1 mL/min, acts as the switching flow. This flow pushes the flow fromcolumn 1 toward T3 and on to column 2. The flow through the purge restrictor (trickle purge)prevents solvent and sample peaks from entering the leg of T3 where the flow stopped. Thisreduces peak tailing.Note that in both the ON and OFF states, the pressure in the Deans switch is alwaysconstant (in this example 26 psi). Another important feature is that the sample componentsdo not encounter any moving parts. The only moving parts are in the solenoid valve, which isat room temperature and switches only inert gas. This increases the reliability of theswitching mechanism.
11
ETBE in Gasoline
4 6 8 10 12 14 16 18 200
50
100150
200
250
300
350
400
4 6 8 10 12 14 16 18 20
1414.5
1515.5
16
16.517
17.518
4 6 8 10 12 14 16 18 200
50100150200250
300350400450
These chromatograms show the hydrocarbons thatcome over during the ETBE cut. Note no interferencewith ETBE measurement
TCEP: Gasoline
DB-1: Gasoline Only
DB-1: ETBE Only
Cut
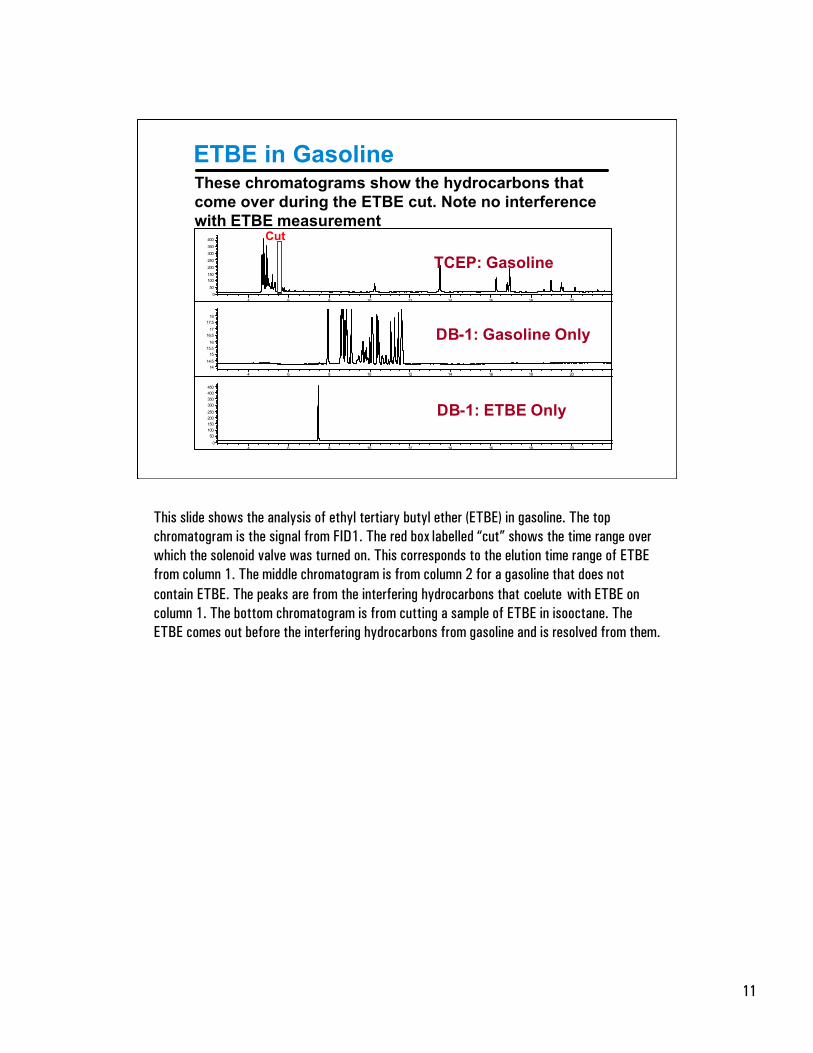
This slide shows the analysis of ethyl tertiary butyl ether (ETBE) in gasoline. The topchromatogram is the signal from FID1. The red box labelled “cut” shows the time range overwhich the solenoid valve was turned on. This corresponds to the elution time range of ETBEfrom column 1. The middle chromatogram is from column 2 for a gasoline that does notcontain ETBE. The peaks are from the interfering hydrocarbons that coelute with ETBE oncolumn 1. The bottom chromatogram is from cutting a sample of ETBE in isooctane. TheETBE comes out before the interfering hydrocarbons from gasoline and is resolved from them.
12
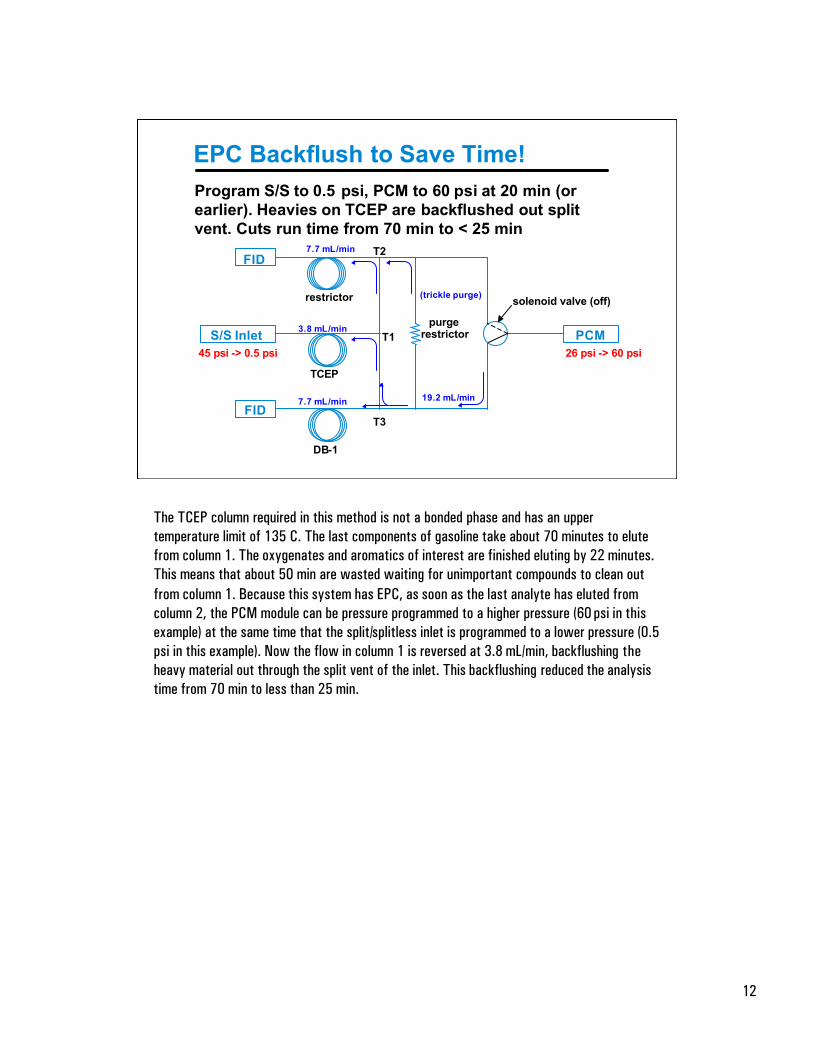
EPC Backflush to Save Time!Program S/S to 0.5 psi, PCM to 60 psi at 20 min (orearlier). Heavies on TCEP are backflushed out splitvent. Cuts run time from 70 min to < 25 min
FID
S/S Inlet
FID
PCMrestrictor
solenoid valve (off)restrictor
TCEP
DB-1
7.7 mL/min
19.2 mL/min7.7 mL/min
3.8 mL/min
(trickle purge)
45 psi -> 0.5 psi 26 psi -> 60 psi
purge
T3
T2
T1
The TCEP column required in this method is not a bonded phase and has an uppertemperature limit of 135 C. The last components of gasoline take about 70 minutes to elutefrom column 1. The oxygenates and aromatics of interest are finished eluting by 22 minutes.This means that about 50 min are wasted waiting for unimportant compounds to clean outfrom column 1. Because this system has EPC, as soon as the last analyte has eluted fromcolumn 2, the PCM module can be pressure programmed to a higher pressure (60 psi in thisexample) at the same time that the split/splitless inlet is programmed to a lower pressure (0.5psi in this example). Now the flow in column 1 is reversed at 3.8 mL/min, backflushing theheavy material out through the split vent of the inlet. This backflushing reduced the analysistime from 70 min to less than 25 min.
13
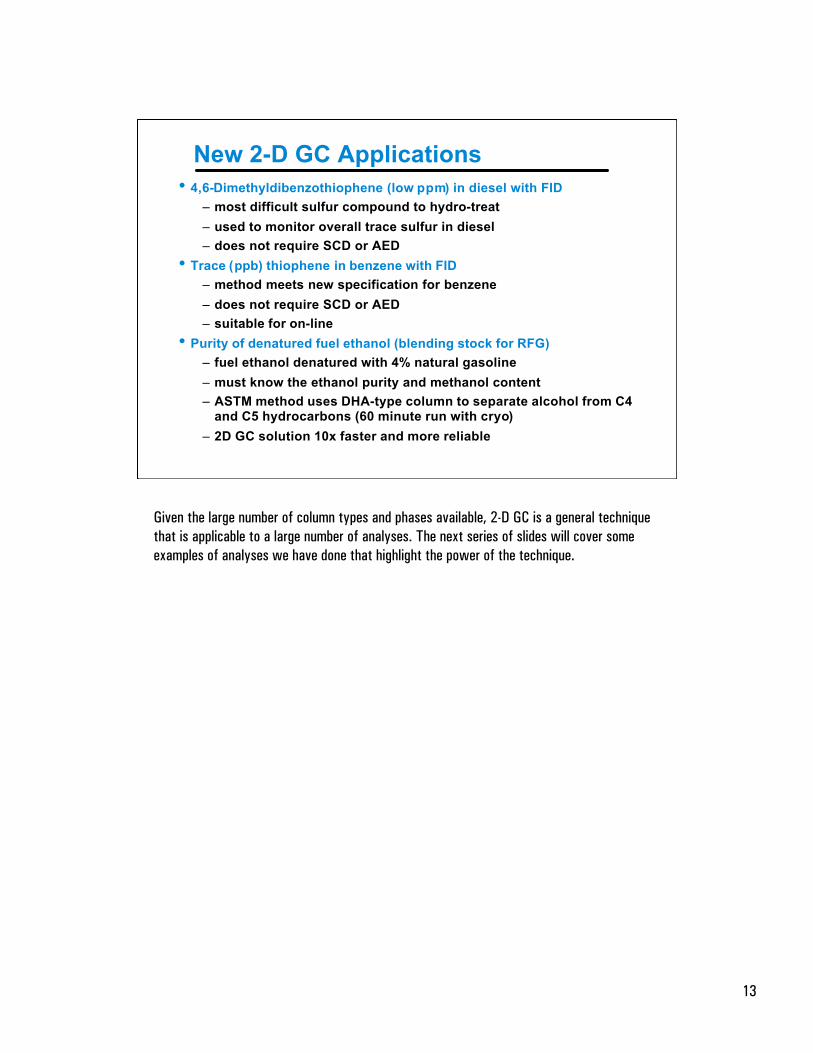
New 2-D GC Applications• 4,6-Dimethyldibenzothiophene (low ppm) in diesel with FID
– most difficult sulfur compound to hydro-treat
– used to monitor overall trace sulfur in diesel– does not require SCD or AED
• Trace (ppb) thiophene in benzene with FID– method meets new specification for benzene
– does not require SCD or AED– suitable for on-line
• Purity of denatured fuel ethanol (blending stock for RFG)– fuel ethanol denatured with 4% natural gasoline
– must know the ethanol purity and methanol content– ASTM method uses DHA-type column to separate alcohol from C4
and C5 hydrocarbons (60 minute run with cryo)
– 2D GC solution 10x faster and more reliable
Given the large number of column types and phases available, 2-D GC is a general techniquethat is applicable to a large number of analyses. The next series of slides will cover someexamples of analyses we have done that highlight the power of the technique.
14
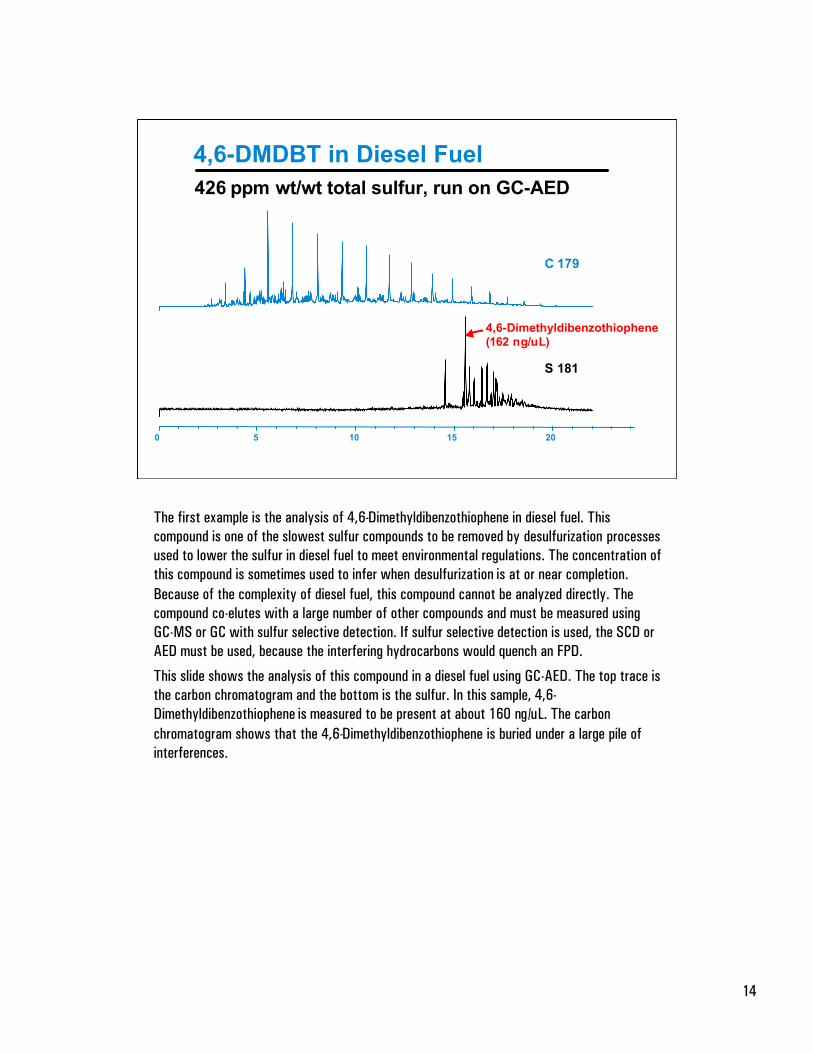
4,6-DMDBT in Diesel Fuel
0 5 10 15 20
C 179
S 181
426 ppm wt/wt total sulfur, run on GC-AED
4,6-Dimethyldibenzothiophene(162 ng/uL)
The first example is the analysis of 4,6-Dimethyldibenzothiophene in diesel fuel. Thiscompound is one of the slowest sulfur compounds to be removed by desulfurization processesused to lower the sulfur in diesel fuel to meet environmental regulations. The concentration ofthis compound is sometimes used to infer when desulfurization is at or near completion.Because of the complexity of diesel fuel, this compound cannot be analyzed directly. Thecompound co-elutes with a large number of other compounds and must be measured usingGC-MS or GC with sulfur selective detection. If sulfur selective detection is used, the SCD orAED must be used, because the interfering hydrocarbons would quench an FPD.This slide shows the analysis of this compound in a diesel fuel using GC-AED. The top trace isthe carbon chromatogram and the bottom is the sulfur. In this sample, 4,6-Dimethyldibenzothiophene is measured to be present at about 160 ng/uL. The carbonchromatogram shows that the 4,6-Dimethyldibenzothiophene is buried under a large pile ofinterferences.
15
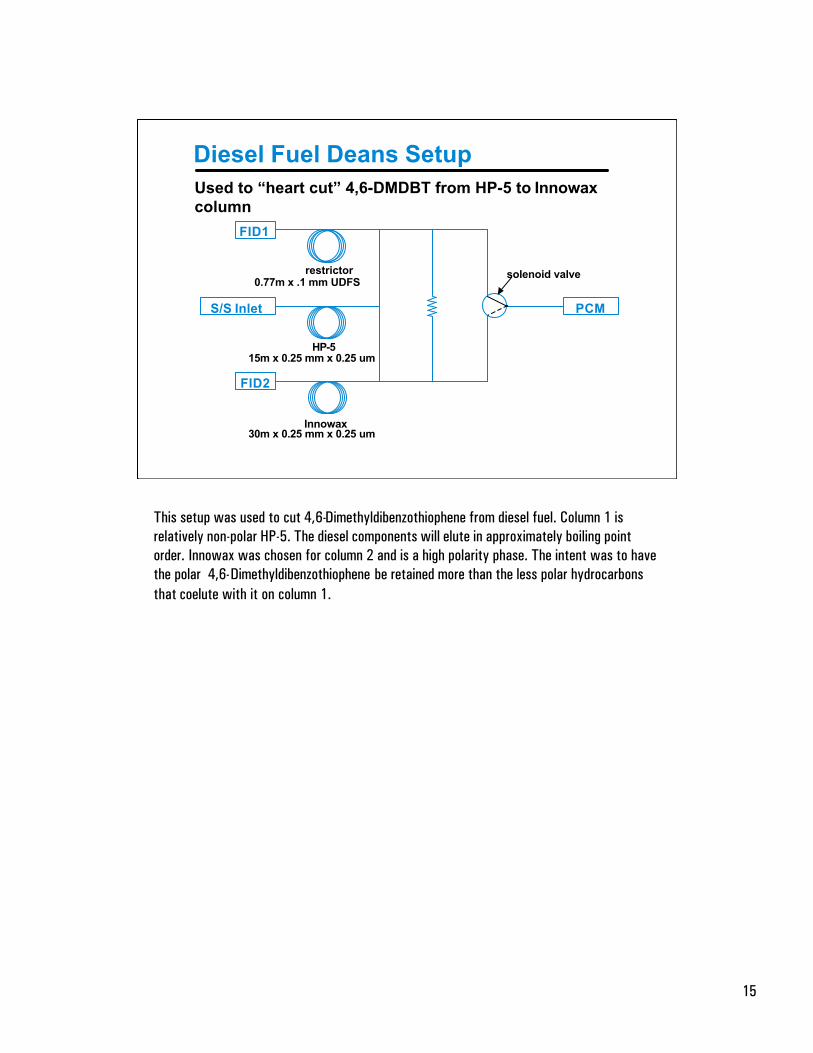
Diesel Fuel Deans SetupUsed to “heart cut” 4,6-DMDBT from HP-5 to Innowaxcolumn
FID1
S/S Inlet
FID2
PCM
solenoid valverestrictor
HP-5
Innowax30m x 0.25 mm x 0.25 um
15m x 0.25 mm x 0.25 um
0.77m x .1 mm UDFS
This setup was used to cut 4,6-Dimethyldibenzothiophene from diesel fuel. Column 1 isrelatively non-polar HP-5. The diesel components will elute in approximately boiling pointorder. Innowax was chosen for column 2 and is a high polarity phase. The intent was to havethe polar 4,6-Dimethyldibenzothiophene be retained more than the less polar hydrocarbonsthat coelute with it on column 1.
16
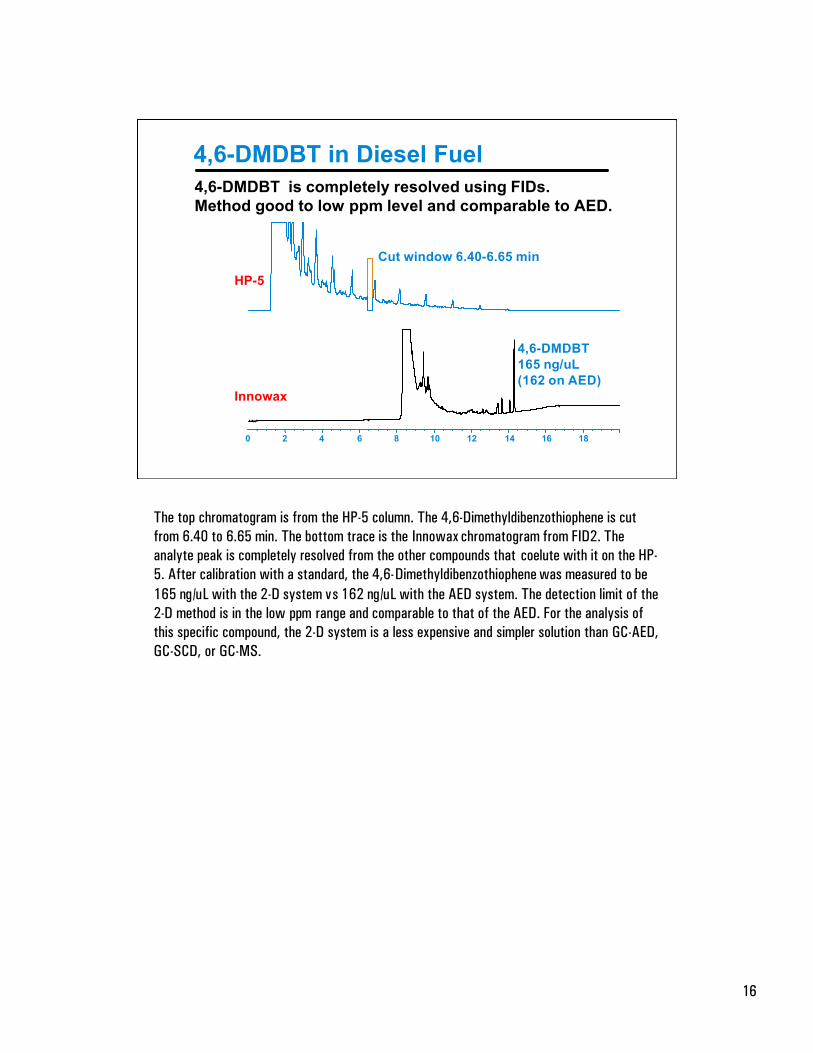
4,6-DMDBT in Diesel Fuel
0 2 4 6 8 10 12 14 16 18
Cut window 6.40-6.65 min
4,6-DMDBT165 ng/uL(162 on AED)
4,6-DMDBT is completely resolved using FIDs.Method good to low ppm level and comparable to AED.
HP-5
Innowax
The top chromatogram is from the HP-5 column. The 4,6-Dimethyldibenzothiophene is cutfrom 6.40 to 6.65 min. The bottom trace is the Innowax chromatogram from FID2. Theanalyte peak is completely resolved from the other compounds that coelute with it on the HP-5. After calibration with a standard, the 4,6-Dimethyldibenzothiophene was measured to be165 ng/uL with the 2-D system vs 162 ng/uL with the AED system. The detection limit of the2-D method is in the low ppm range and comparable to that of the AED. For the analysis ofthis specific compound, the 2-D system is a less expensive and simpler solution than GC-AED,GC-SCD, or GC-MS.
17
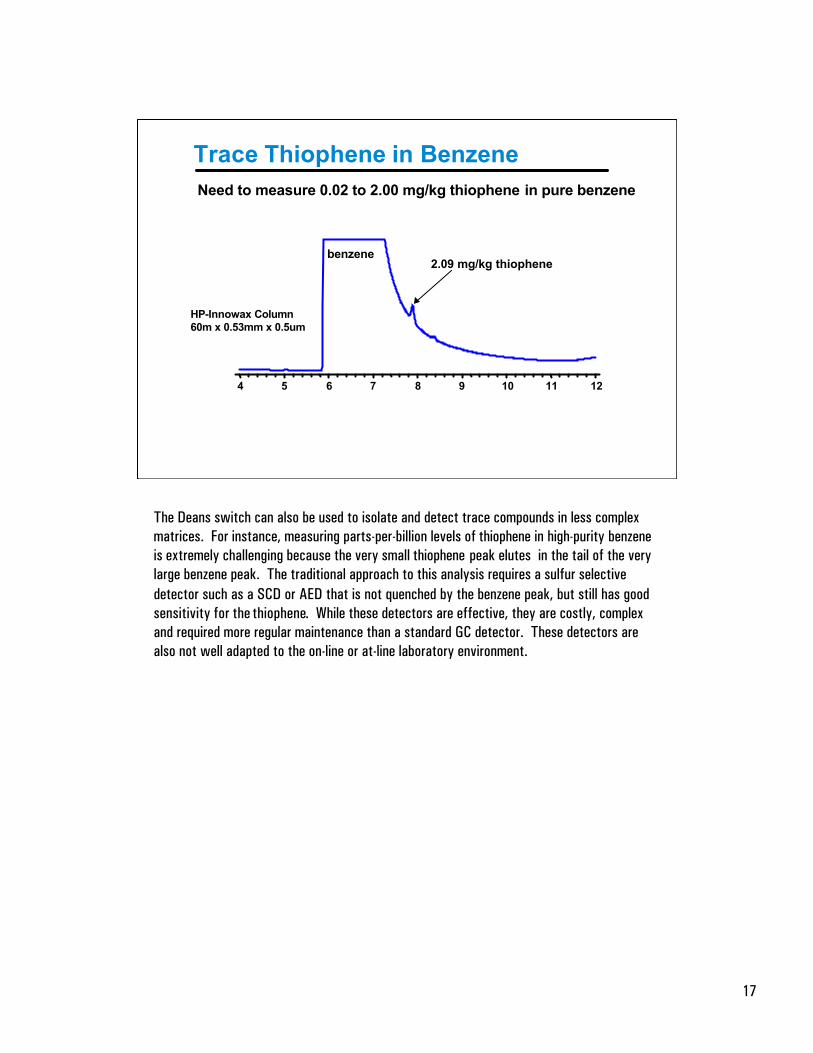
Trace Thiophene in Benzene
4 5 6 7 8 9 10 11 12
2.09 mg/kg thiophenebenzene
Need to measure 0.02 to 2.00 mg/kg thiophene in pure benzene
HP-Innowax Column60m x 0.53mm x 0.5um
The Deans switch can also be used to isolate and detect trace compounds in less complexmatrices. For instance, measuring parts-per-billion levels of thiophene in high-purity benzeneis extremely challenging because the very small thiophene peak elutes in the tail of the verylarge benzene peak. The traditional approach to this analysis requires a sulfur selectivedetector such as a SCD or AED that is not quenched by the benzene peak, but still has goodsensitivity for the thiophene. While these detectors are effective, they are costly, complexand required more regular maintenance than a standard GC detector. These detectors arealso not well adapted to the on-line or at-line laboratory environment.
18
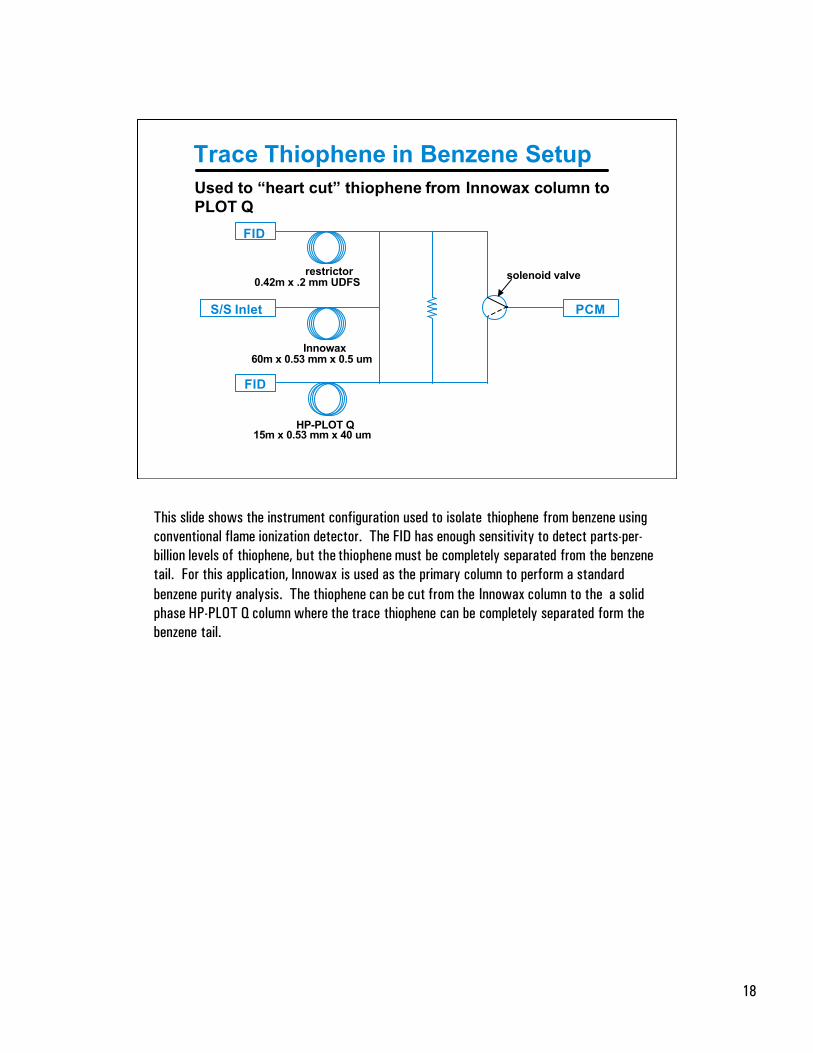
Trace Thiophene in Benzene SetupUsed to “heart cut” thiophene from Innowax column toPLOT Q
FID
S/S Inlet
FID
PCM
solenoid valverestrictor
Innowax
HP-PLOT Q15m x 0.53 mm x 40 um
60m x 0.53 mm x 0.5 um
0.42m x .2 mm UDFS
This slide shows the instrument configuration used to isolate thiophene from benzene usingconventional flame ionization detector. The FID has enough sensitivity to detect parts-per-billion levels of thiophene, but the thiophene must be completely separated from the benzenetail. For this application, Innowax is used as the primary column to perform a standardbenzene purity analysis. The thiophene can be cut from the Innowax column to the a solidphase HP-PLOT Q column where the trace thiophene can be completely separated form thebenzene tail.
19
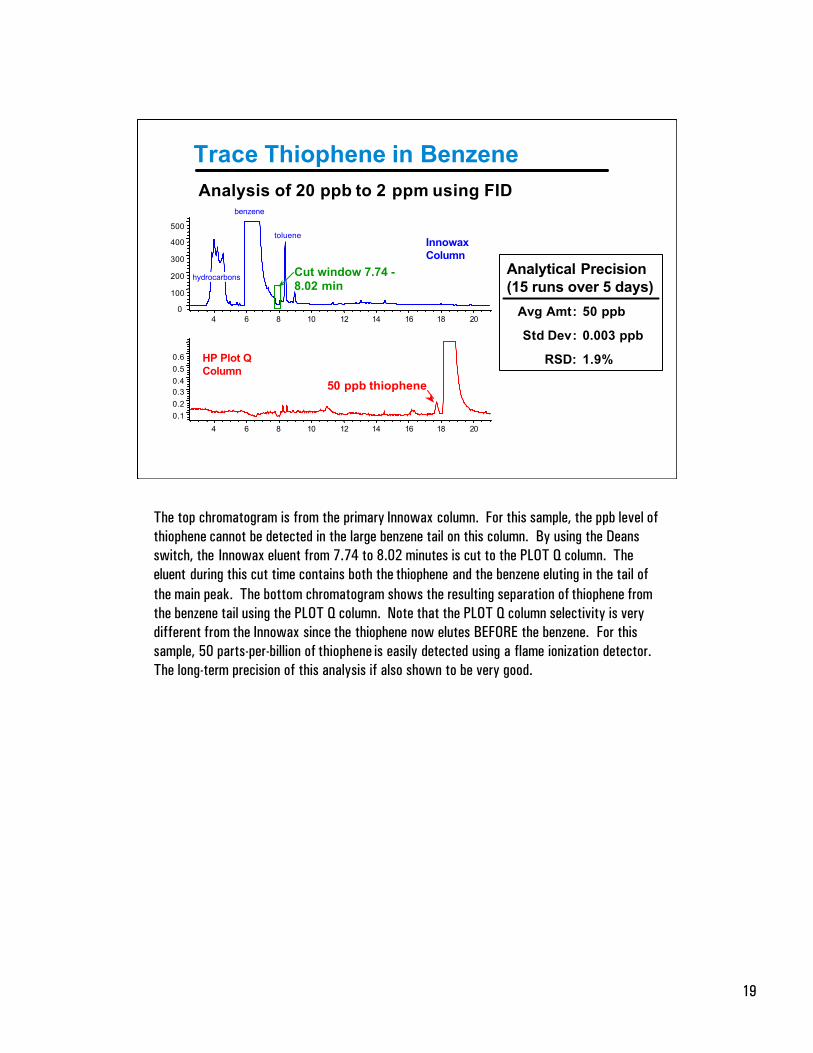
Trace Thiophene in Benzene
Analytical Precision(15 runs over 5 days)
Avg Amt: 50 ppb
Std Dev: 0.003 ppb
RSD: 1.9%
4 6 8 10 12 14 16 18 200
100
200
300
400
500
Cut window 7.74 -8.02 min
4 6 8 10 12 14 16 18 20
0.10.20.30.40.50.6
50 ppb thiophene
HP Plot QColumn
InnowaxColumn
Analysis of 20 ppb to 2 ppm using FID
hydrocarbons
benzene
toluene
The top chromatogram is from the primary Innowax column. For this sample, the ppb level ofthiophene cannot be detected in the large benzene tail on this column. By using the Deansswitch, the Innowax eluent from 7.74 to 8.02 minutes is cut to the PLOT Q column. Theeluent during this cut time contains both the thiophene and the benzene eluting in the tail ofthe main peak. The bottom chromatogram shows the resulting separation of thiophene fromthe benzene tail using the PLOT Q column. Note that the PLOT Q column selectivity is verydifferent from the Innowax since the thiophene now elutes BEFORE the benzene. For thissample, 50 parts-per-billion of thiophene is easily detected using a flame ionization detector.The long-term precision of this analysis if also shown to be very good.
20
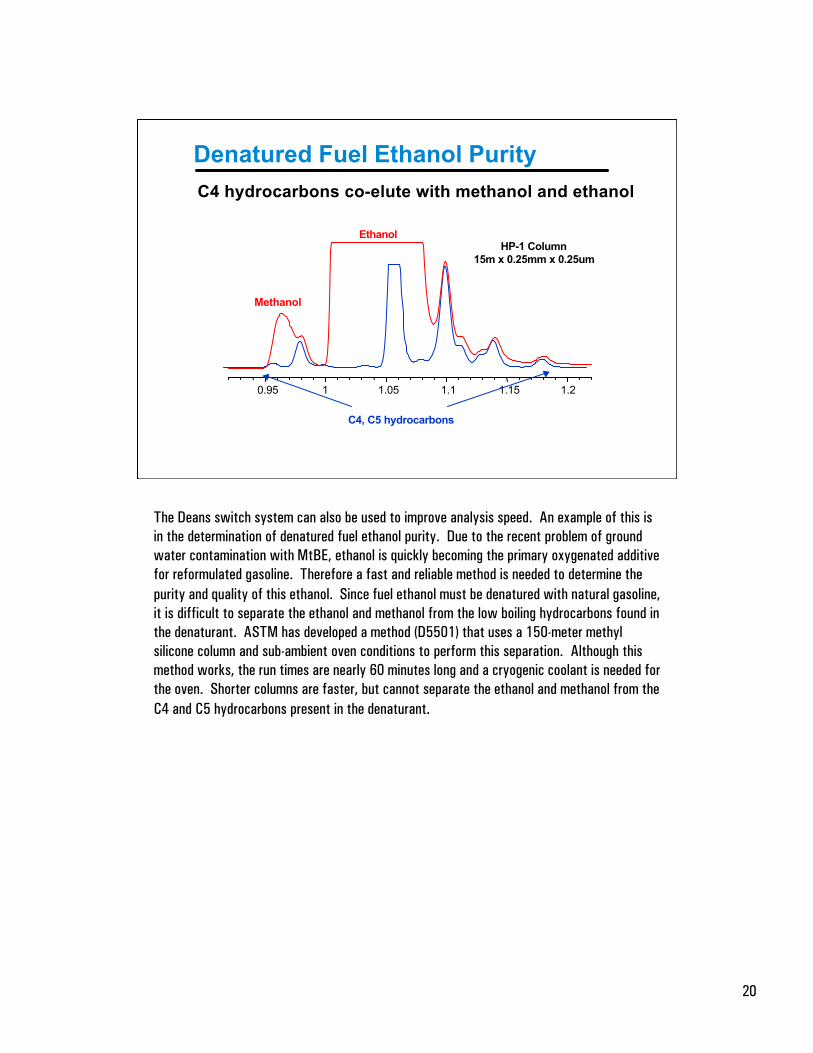
Denatured Fuel Ethanol Purity
0.95 1 1.05 1.1 1.15 1.2
Methanol
Ethanol
C4, C5 hydrocarbons
C4 hydrocarbons co-elute with methanol and ethanol
HP-1 Column15m x 0.25mm x 0.25um
The Deans switch system can also be used to improve analysis speed. An example of this isin the determination of denatured fuel ethanol purity. Due to the recent problem of groundwater contamination with MtBE, ethanol is quickly becoming the primary oxygenated additivefor reformulated gasoline. Therefore a fast and reliable method is needed to determine thepurity and quality of this ethanol. Since fuel ethanol must be denatured with natural gasoline,it is difficult to separate the ethanol and methanol from the low boiling hydrocarbons found inthe denaturant. ASTM has developed a method (D5501) that uses a 150-meter methylsilicone column and sub-ambient oven conditions to perform this separation. Although thismethod works, the run times are nearly 60 minutes long and a cryogenic coolant is needed forthe oven. Shorter columns are faster, but cannot separate the ethanol and methanol from theC4 and C5 hydrocarbons present in the denaturant.
21
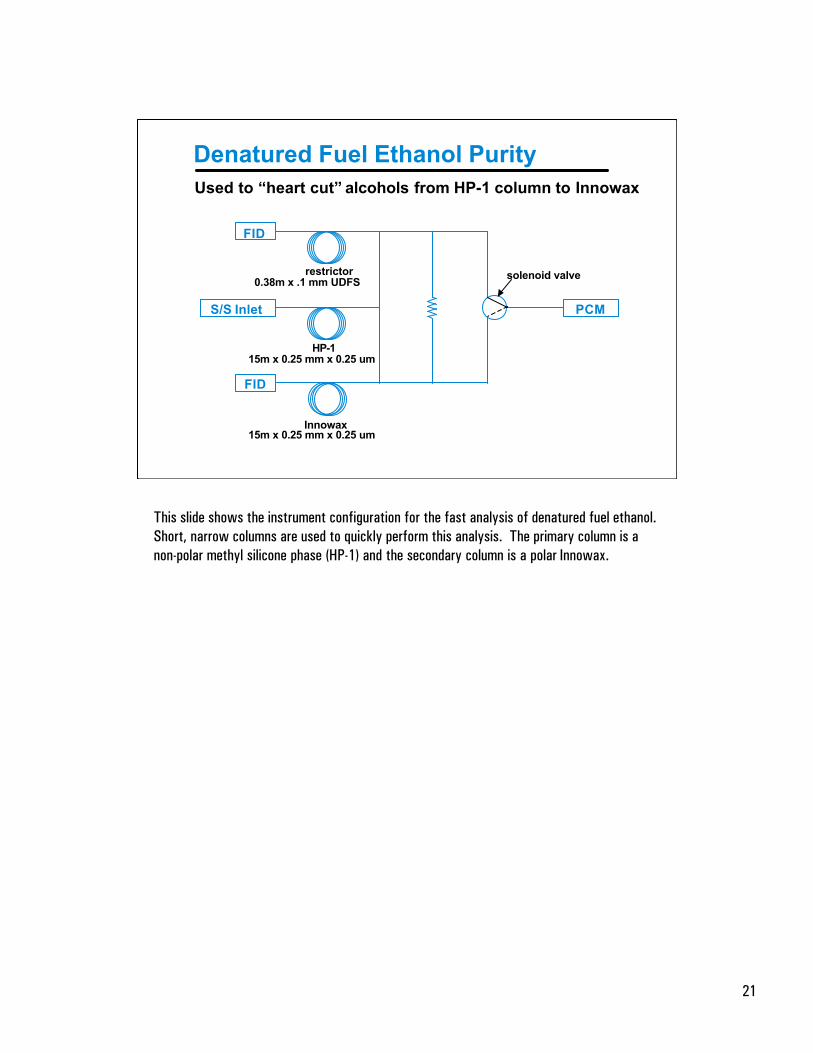
Denatured Fuel Ethanol PurityUsed to “heart cut” alcohols from HP-1 column to Innowax
FID
S/S Inlet
FID
PCM
solenoid valverestrictor
HP-1
Innowax15m x 0.25 mm x 0.25 um
15m x 0.25 mm x 0.25 um
0.38m x .1 mm UDFS
This slide shows the instrument configuration for the fast analysis of denatured fuel ethanol.Short, narrow columns are used to quickly perform this analysis. The primary column is anon-polar methyl silicone phase (HP-1) and the secondary column is a polar Innowax.
22
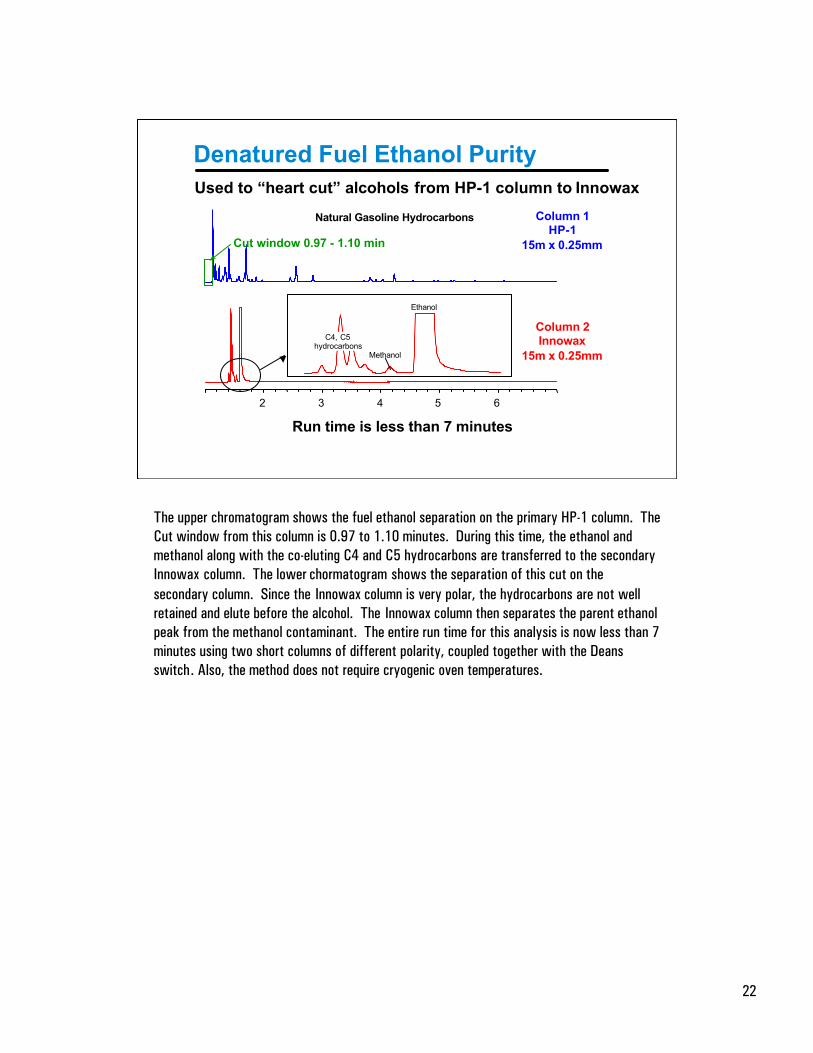
Denatured Fuel Ethanol PurityUsed to “heart cut” alcohols from HP-1 column to Innowax
2 3 4 5 6
Natural Gasoline Hydrocarbons
Cut window 0.97 - 1.10 min
Ethanol
C4, C5 hydrocarbons
Methanol
Column 1HP-1
15m x 0.25mm
Column 2Innowax
15m x 0.25mm
Run time is less than 7 minutes
The upper chromatogram shows the fuel ethanol separation on the primary HP-1 column. TheCut window from this column is 0.97 to 1.10 minutes. During this time, the ethanol andmethanol along with the co-eluting C4 and C5 hydrocarbons are transferred to the secondaryInnowax column. The lower chormatogram shows the separation of this cut on thesecondary column. Since the Innowax column is very polar, the hydrocarbons are not wellretained and elute before the alcohol. The Innowax column then separates the parent ethanolpeak from the methanol contaminant. The entire run time for this analysis is now less than 7minutes using two short columns of different polarity, coupled together with the Deansswitch. Also, the method does not require cryogenic oven temperatures.
23
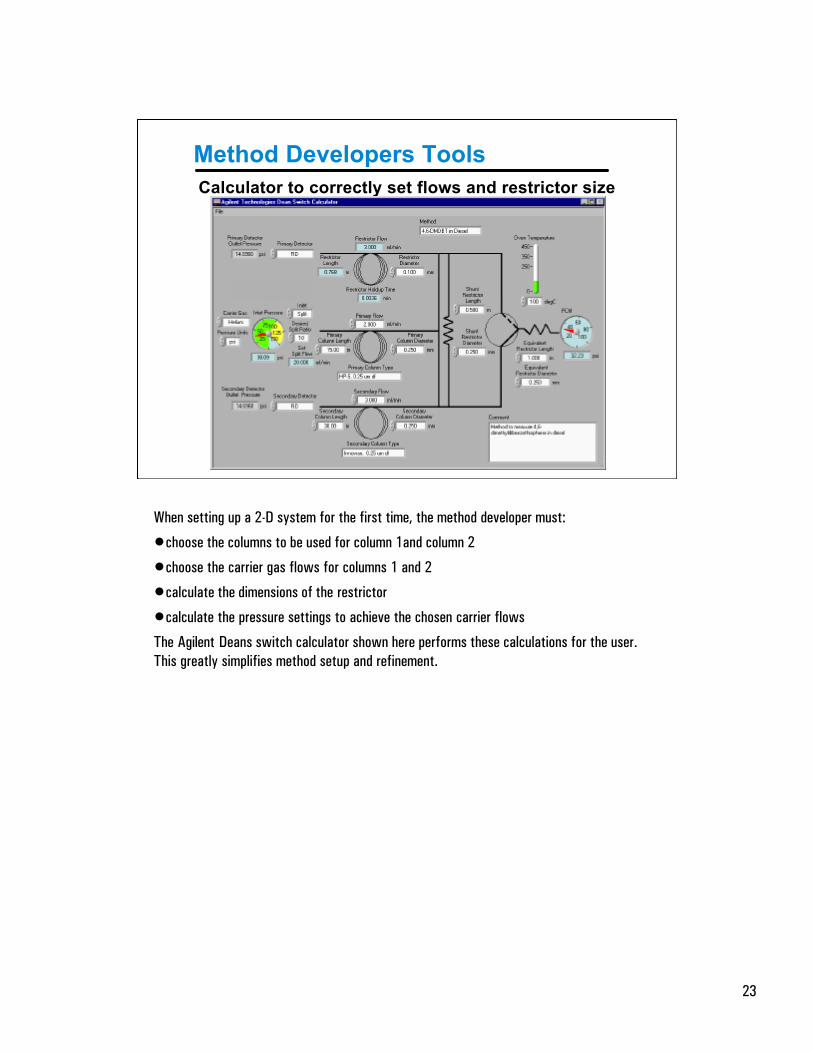
Method Developers ToolsCalculator to correctly set flows and restrictor size
When setting up a 2-D system for the first time, the method developer must:•choose the columns to be used for column 1and column 2•choose the carrier gas flows for columns 1 and 2•calculate the dimensions of the restrictor•calculate the pressure settings to achieve the chosen carrier flowsThe Agilent Deans switch calculator shown here performs these calculations for the user.This greatly simplifies method setup and refinement.
24
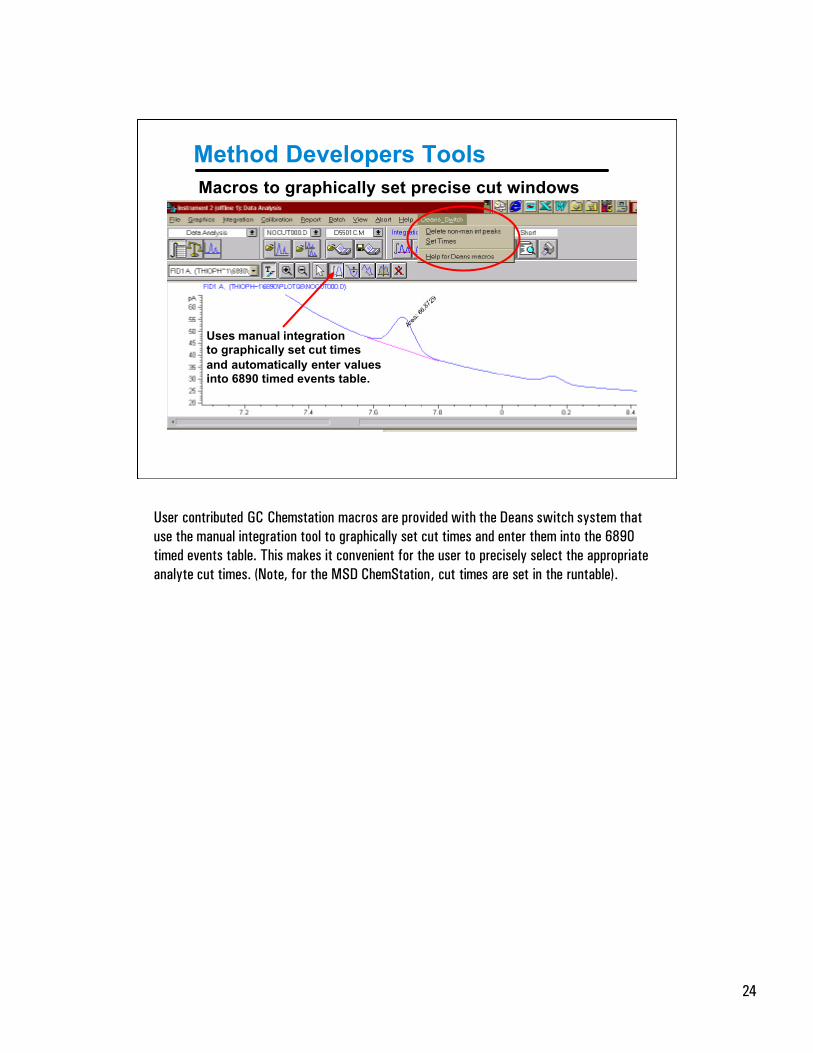
Method Developers ToolsMacros to graphically set precise cut windows
Uses manual integrationto graphically set cut timesand automatically enter values into 6890 timed events table.
User contributed GC Chemstation macros are provided with the Deans switch system thatuse the manual integration tool to graphically set cut times and enter them into the 6890timed events table. This makes it convenient for the user to precisely select the appropriateanalyte cut times. (Note, for the MSD ChemStation, cut times are set in the runtable).
25
Identification ofOrganophosphorus Pesticides
in Citrus Peel Oils
This application shows the usefulness of the 2-D GC approach when combined with bothelement selective and mass selective detetection. A 6890N GC is configured with 2phosphorus mode FPDs, an MSD, a Deans switch, and an effluent splitter. The system isused to find and identify phosphorus compounds in the very challenging matrix of citrus oils.The 2-D GC technique is used to obtain a clean mass spectrum of any detected phosphoruscompounds for accurate identification.
26
Problem
• Organophosphorus (OP) pesticides are often present incitrus oils and need to be measured
• Citrus oil matrix is very complex and causes seriouschromatographic interferences with identification andconfirmation of OPs
• GC screening for OP compounds with phosphorusselective detector (FPD or AED) is useful, but offers limitedidentification and confirmation capability
• GC-MS would be desirable for identification andconfirmation, but oil matrix interferences cause problemswith spectral interferences
Pesticide residues are sometimes present in citrus oils. Food manufacturers that use citrusoils in their products want to be certain that there are no unacceptably high levels of theseresidues present in the oils they purchase. Of specific concern are the organophosphorus (OP)pesticides, which are often used to protect citrus crops. The FPD in phosphorus mode candetect OP compounds to very low levels, even in the challenging matix of citrus oils.Confirmation and identification of the compounds is more difficult, however. The applicationdescribed here shows how 2-D GC can be used to greatly simplify the mass spectralidentification of the OPs by separating the pesticides from the oil matrix.
27
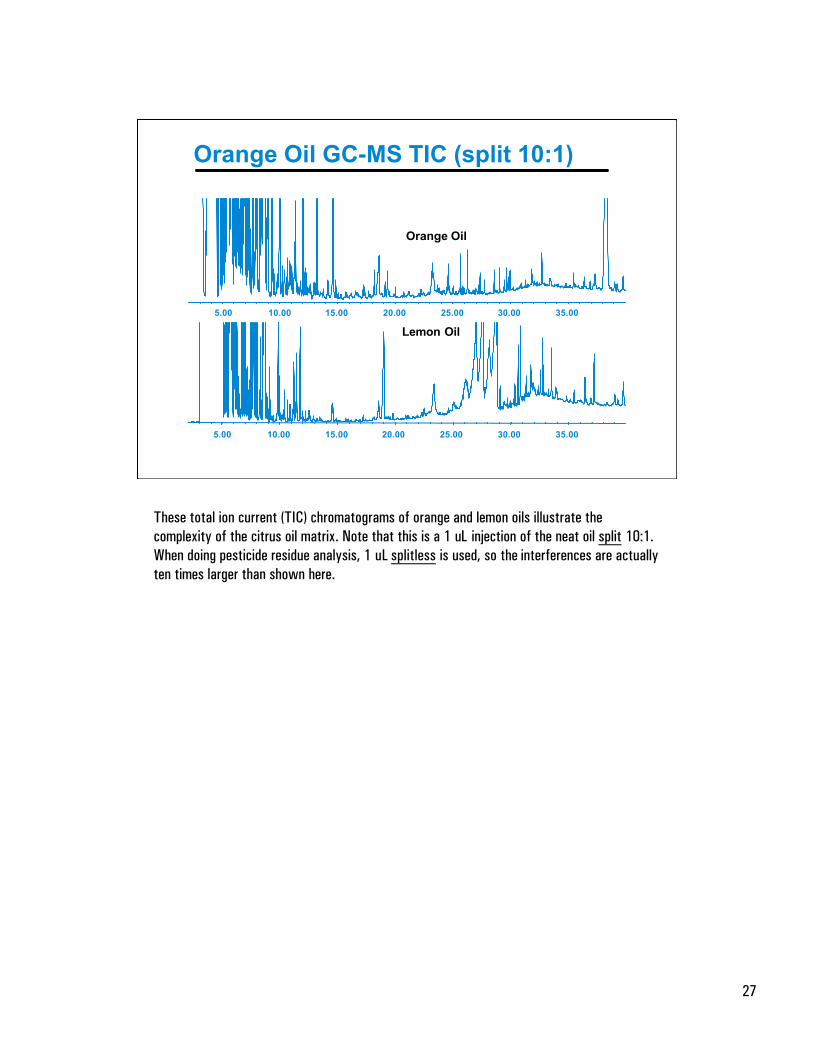
Orange Oil GC-MS TIC (split 10:1)
5.00 10.00 15.00 20.00 25.00 30.00 35.00
5.00 10.00 15.00 20.00 25.00 30.00 35.00
Orange Oil
Lemon Oil
These total ion current (TIC) chromatograms of orange and lemon oils illustrate thecomplexity of the citrus oil matrix. Note that this is a 1 uL injection of the neat oil split 10:1.When doing pesticide residue analysis, 1 uL splitless is used, so the interferences are actuallyten times larger than shown here.
28
Orange Oil GC-MS and GC-FPD
5.00 10.00 15.00 20.00 25.00 30.00 35.00
5.00 10.00 15.00 20.00 25.00 30.00 35.00
GC-MS (TIC)
1uL split 10:1
GC-FPD (P)
1uL splitless
50-100 ppb of OP compound
Is it a pesticide?
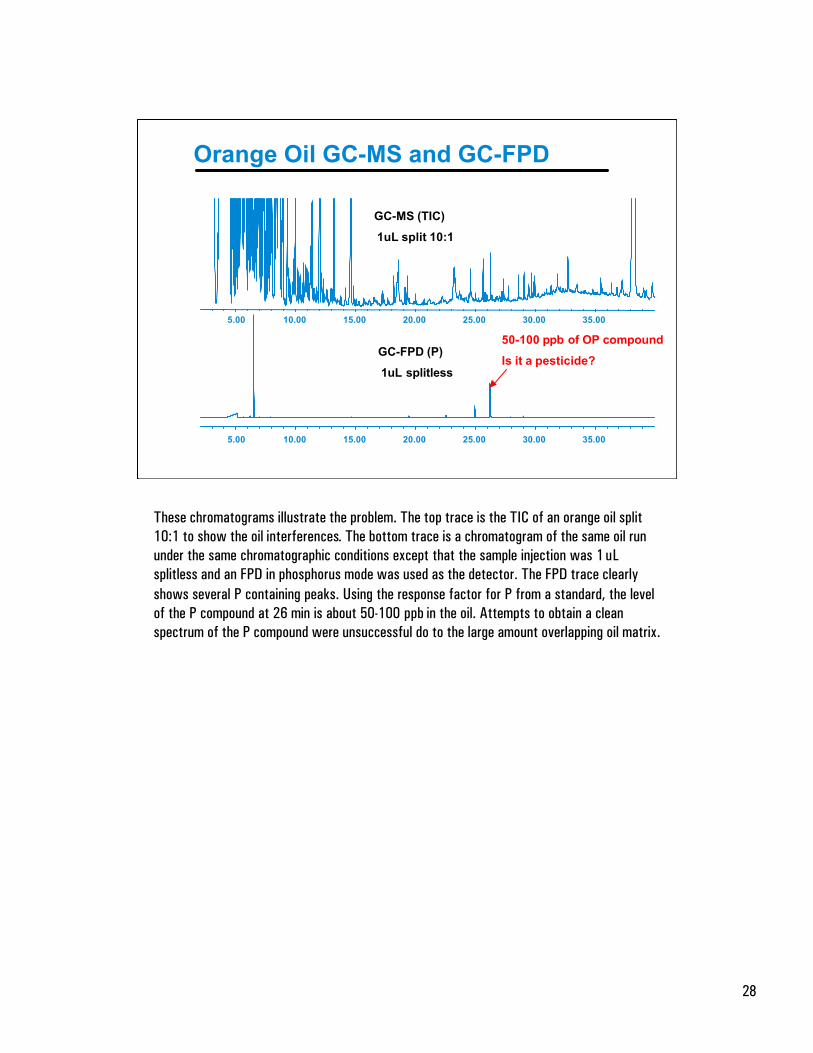
These chromatograms illustrate the problem. The top trace is the TIC of an orange oil split10:1 to show the oil interferences. The bottom trace is a chromatogram of the same oil rununder the same chromatographic conditions except that the sample injection was 1 uLsplitless and an FPD in phosphorus mode was used as the detector. The FPD trace clearlyshows several P containing peaks. Using the response factor for P from a standard, the levelof the P compound at 26 min is about 50-100 ppb in the oil. Attempts to obtain a cleanspectrum of the P compound were unsuccessful do to the large amount overlapping oil matrix.
29
System Configuration
Deans Switch7683Auto-sampler
6890NGC
5973NMSD
FPD1 FPD2
Column 1 Column 2
Effluent Splitter
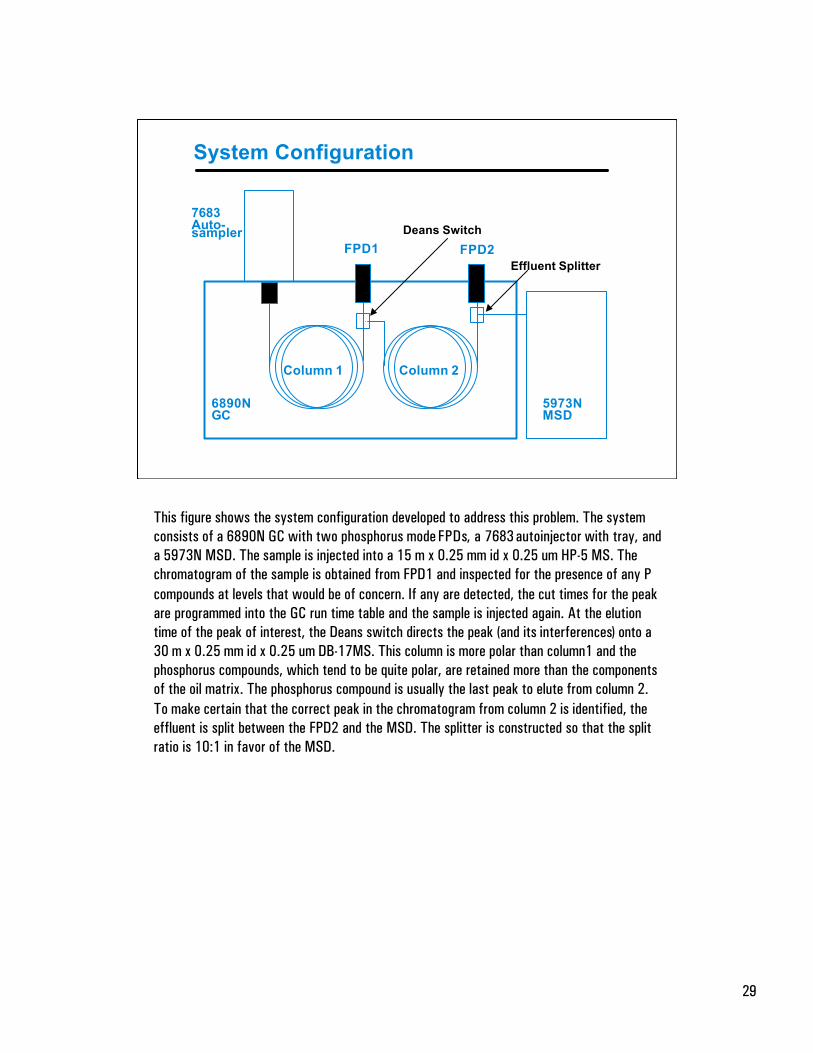
This figure shows the system configuration developed to address this problem. The systemconsists of a 6890N GC with two phosphorus mode FPDs, a 7683 autoinjector with tray, anda 5973N MSD. The sample is injected into a 15 m x 0.25 mm id x 0.25 um HP-5 MS. Thechromatogram of the sample is obtained from FPD1 and inspected for the presence of any Pcompounds at levels that would be of concern. If any are detected, the cut times for the peakare programmed into the GC run time table and the sample is injected again. At the elutiontime of the peak of interest, the Deans switch directs the peak (and its interferences) onto a30 m x 0.25 mm id x 0.25 um DB-17MS. This column is more polar than column1 and thephosphorus compounds, which tend to be quite polar, are retained more than the componentsof the oil matrix. The phosphorus compound is usually the last peak to elute from column 2.To make certain that the correct peak in the chromatogram from column 2 is identified, theeffluent is split between the FPD2 and the MSD. The splitter is constructed so that the splitratio is 10:1 in favor of the MSD.
30
OP Pesticides, Deans SetupEffluent from second column split between MSD and FPD in10:1 ratio
FPD1
S/S Inlet
FPD2
PCM
solenoid valverestrictor
HP-5MS
DB-17MS30m x .25 mm x 0.25 um
15m x .25 mm x 0.25 um
0.83 m x .1 mm UDFS
3.5 mL/min
3.5 mL/min
2.19 mL/min
39.3 psig 33.6 psig
MSD3.9 mL/min
0.39 mL/min
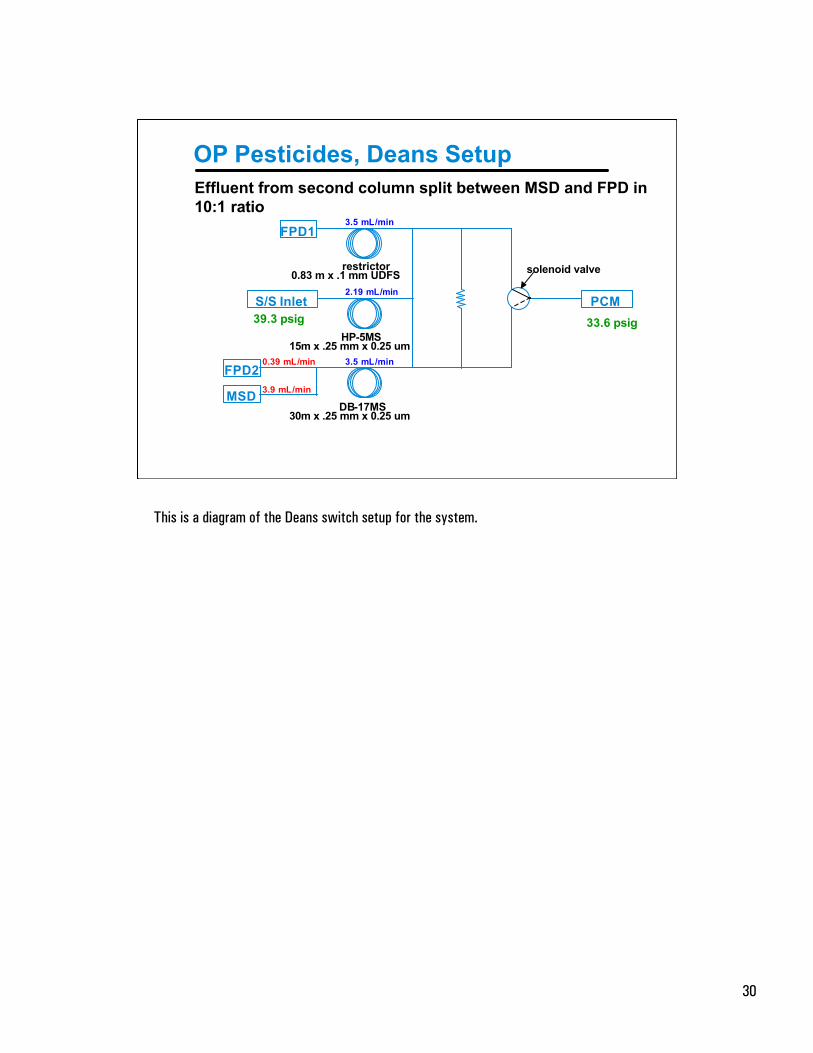
This is a diagram of the Deans switch setup for the system.
31
GC Conditions For OP Analysis
Length (m)I. D.(um) Film (um)Inlet Pressure (psi)Injection Volume (uL)Mode
Init Oven Temp (ºC)Init Oven Hold (min)
Rate (ºC/min) Final Temp (ºC) Final Hold (min)
HP-5MS15250.25
39.271
Splitless
702
DB-17MS302500.2533.6NANA
25 150 03 200 08 280 10
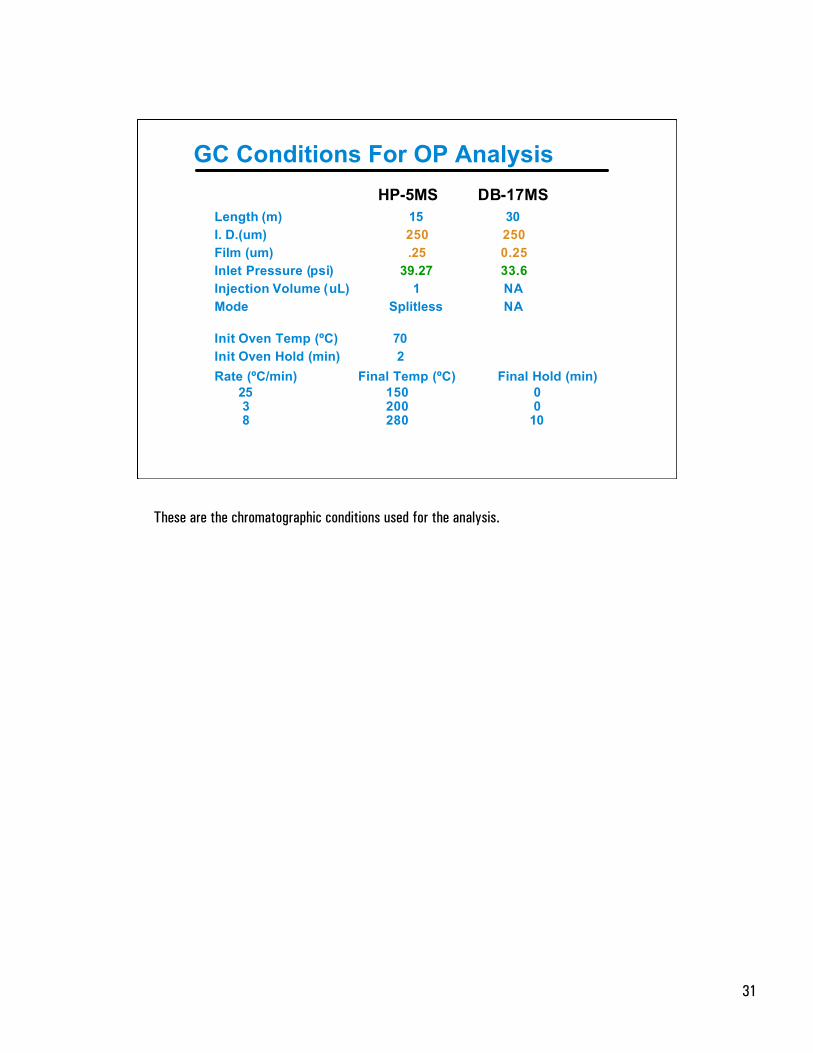
These are the chromatographic conditions used for the analysis.
32
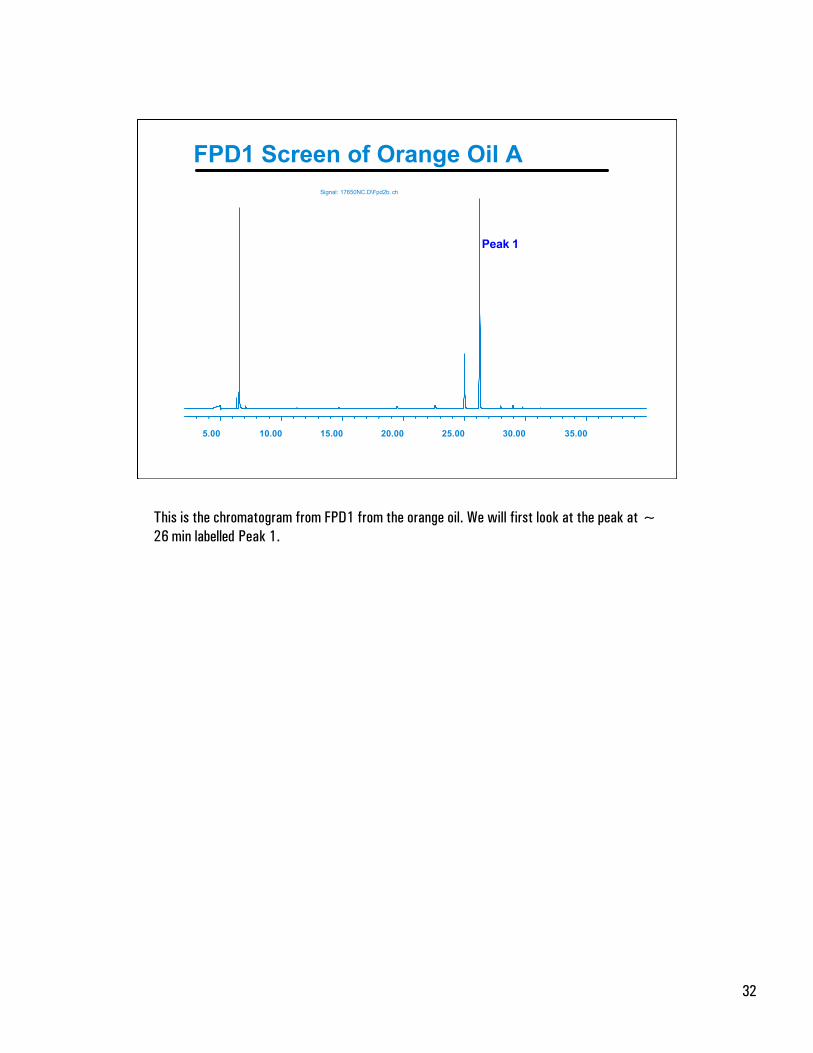
FPD1 Screen of Orange Oil A
5.00 10.00 15.00 20.00 25.00 30.00 35.00
Signal: 17650NC.D\Fpd2b. ch
Peak 1
This is the chromatogram from FPD1 from the orange oil. We will first look at the peak at ~26 min labelled Peak 1.
33
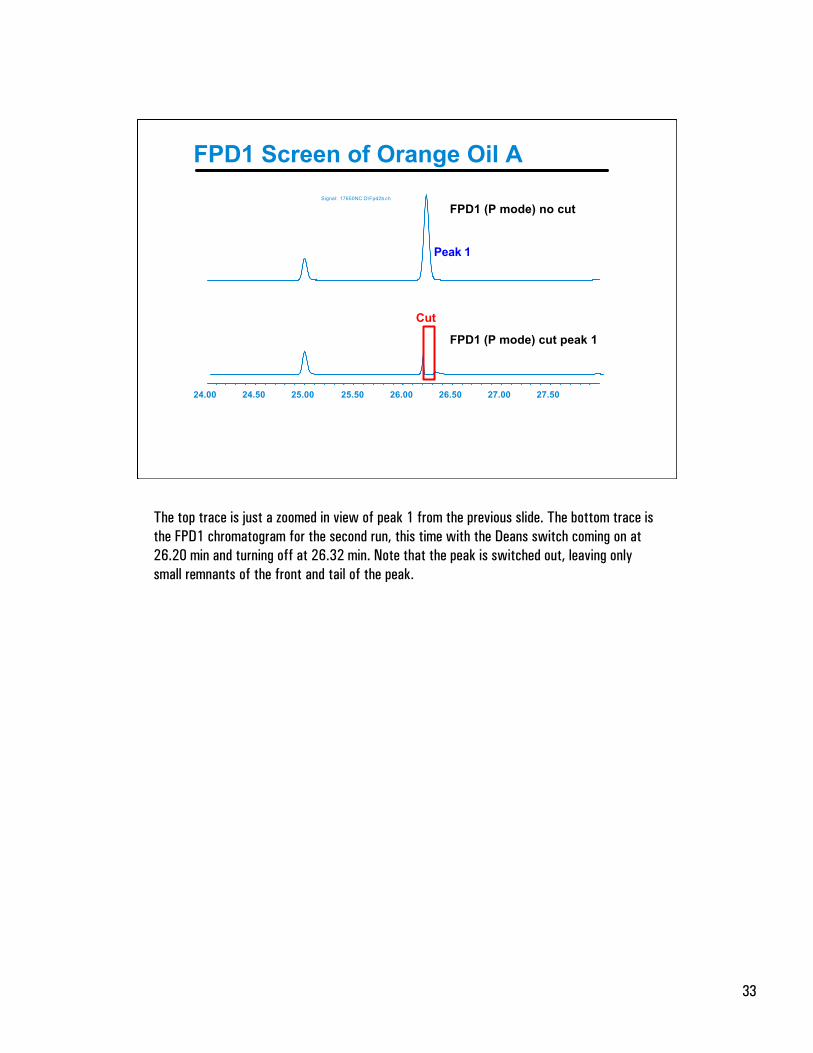
FPD1 Screen of Orange Oil A
24.00 24.50 25.00 25.50 26.00 26.50 27.00 27.50
Signal: 17650NC.D\Fpd2b.ch
FPD1 (P mode) no cut
FPD1 (P mode) cut peak 1
Cut
Peak 1
The top trace is just a zoomed in view of peak 1 from the previous slide. The bottom trace isthe FPD1 chromatogram for the second run, this time with the Deans switch coming on at26.20 min and turning off at 26.32 min. Note that the peak is switched out, leaving onlysmall remnants of the front and tail of the peak.
34
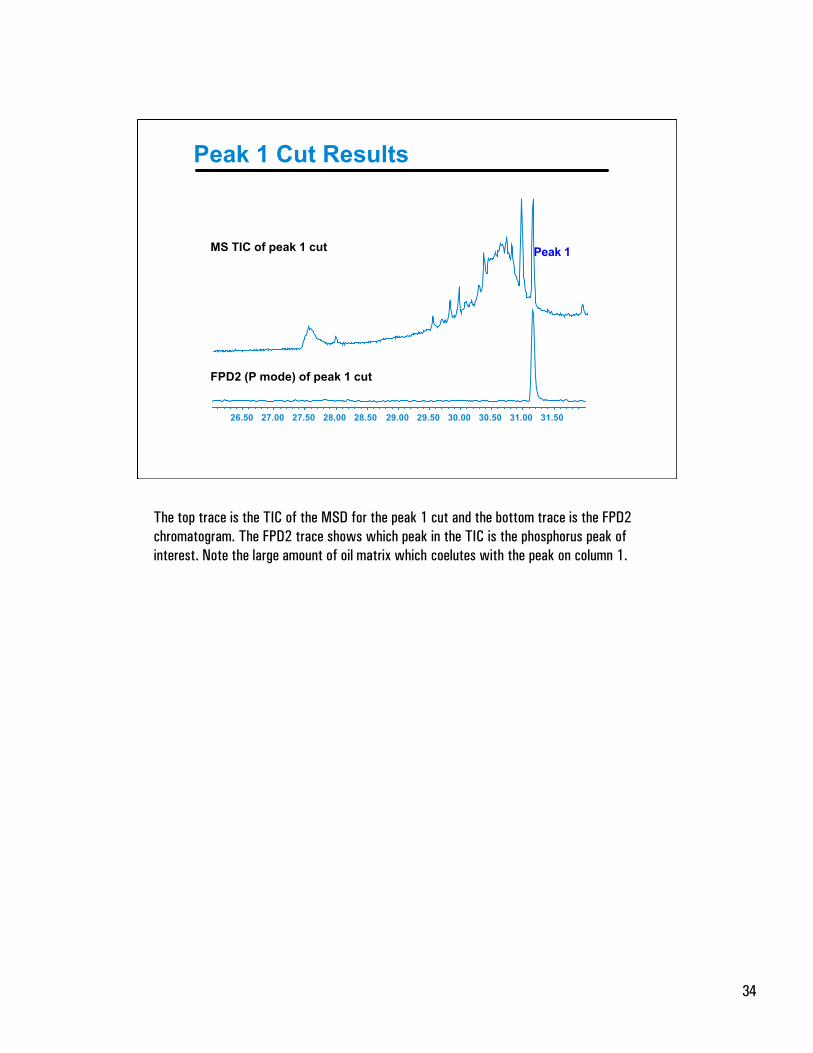
Peak 1 Cut Results
26.50 27.00 27.50 28.00 28.50 29.00 29.50 30.00 30.50 31.00 31.50
Peak 1MS TIC of peak 1 cut
FPD2 (P mode) of peak 1 cut
The top trace is the TIC of the MSD for the peak 1 cut and the bottom trace is the FPD2chromatogram. The FPD2 trace shows which peak in the TIC is the phosphorus peak ofinterest. Note the large amount of oil matrix which coelutes with the peak on column 1.
35
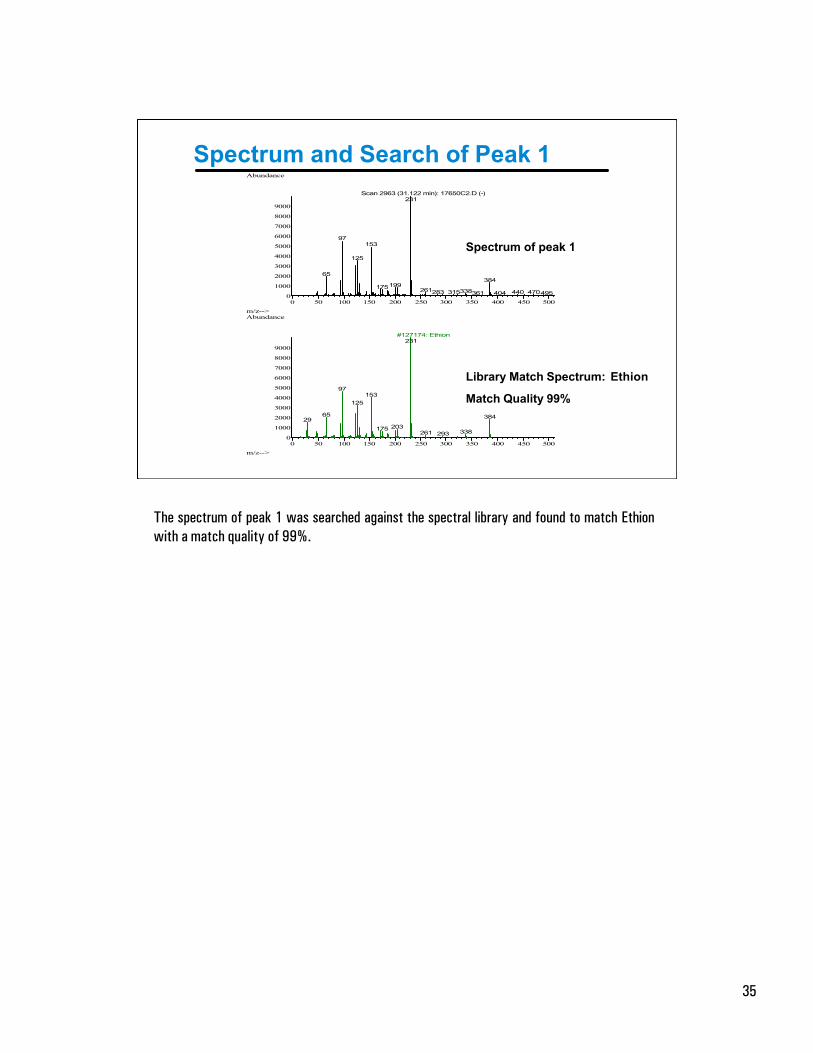
Spectrum and Search of Peak 1
0 50 100 150 200 250 300 350 400 450 5000
1000
2000
3000
4000
5000
6000
7000
8000
9000
m/z-->
Abundance
Scan 2963 (31.122 min): 17650C2.D (-)231
97153
125
65384
199175 261 338283 470315 440 495361 404
0 50 100 150 200 250 300 350 400 450 5000
1000
2000
3000
4000
5000
6000
7000
8000
9000
m/z-->
Abundance
#127174: Ethion231
97153
125
65 38429203175 338261 293
Spectrum of peak 1
Library Match Spectrum: Ethion
Match Quality 99%
The spectrum of peak 1 was searched against the spectral library and found to match Ethionwith a match quality of 99%.
36
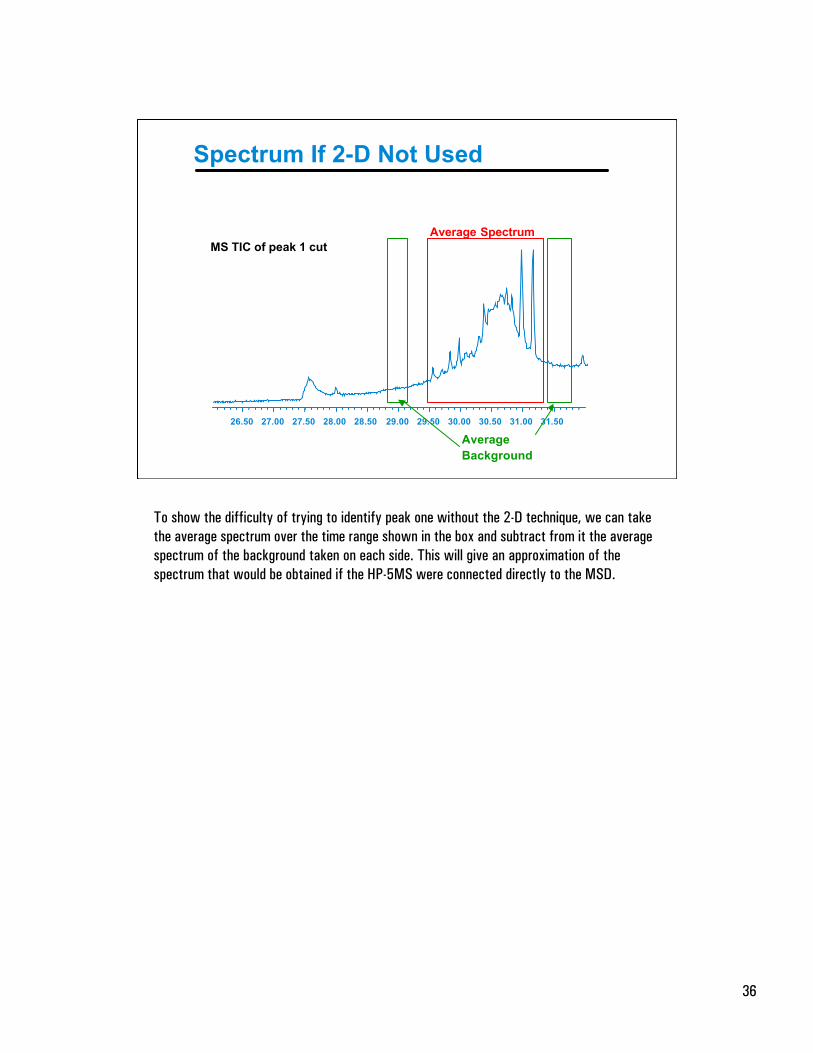
Spectrum If 2-D Not Used
26.50 27.00 27.50 28.00 28.50 29.00 29.50 30.00 30.50 31.00 31.50
MS TIC of peak 1 cutAverage Spectrum
AverageBackground
To show the difficulty of trying to identify peak one without the 2-D technique, we can takethe average spectrum over the time range shown in the box and subtract from it the averagespectrum of the background taken on each side. This will give an approximation of thespectrum that would be obtained if the HP-5MS were connected directly to the MSD.
37
Spectrum Unusable Without 2-D
50 100 150 200 250 300 350 400 450 5000
1000
2000
3000
4000
5000
6000
7000
8000
9000
m/z-->
Abundance
Average of 29.399 to 31.203 min.: 17650C2.D (-)93
135
67231
161 195 384 451285255114 305 338362 497406 47147
50 100 150 200 250 300 350 400 450 5000
1000
2000
3000
4000
5000
6000
7000
8000
9000
m/z-->
Abundance
#2848: .alpha.-Farnesene41
93
69
119
161 189
Spectrum of peak 1without 2-D separation
Library Match: Ethion not listed intop 20 hits. Best match (30%) wasalpha-Farnesene
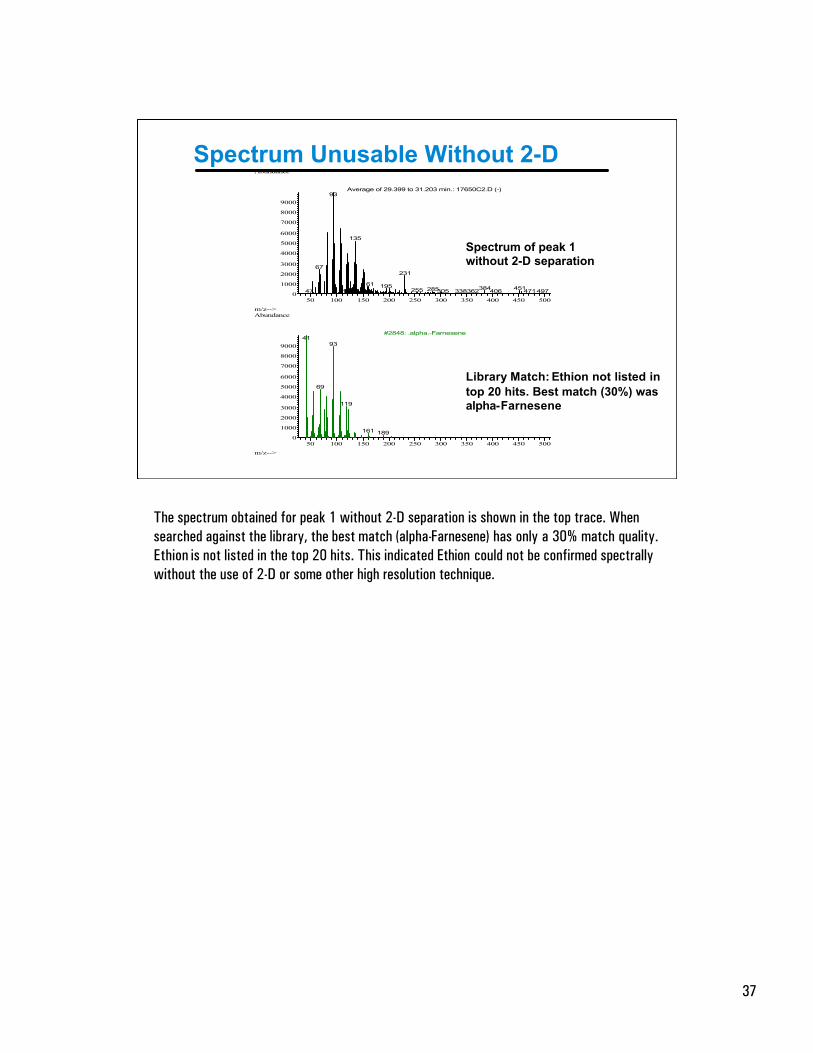
The spectrum obtained for peak 1 without 2-D separation is shown in the top trace. Whensearched against the library, the best match (alpha-Farnesene) has only a 30% match quality.Ethion is not listed in the top 20 hits. This indicated Ethion could not be confirmed spectrallywithout the use of 2-D or some other high resolution technique.
38
FPD1 Screen of Lemon Oil A
5.00 10.00 15.00 20.00 25.00 30.00 35.00
Signal: QLEMONC.D\FPD2B.CH
Peak 1
~50-100 ppb of unknownpesticide estimated fromFPD response
Peak 2
~125-250 ppb of unknownpesticide estimated from FPDresponse
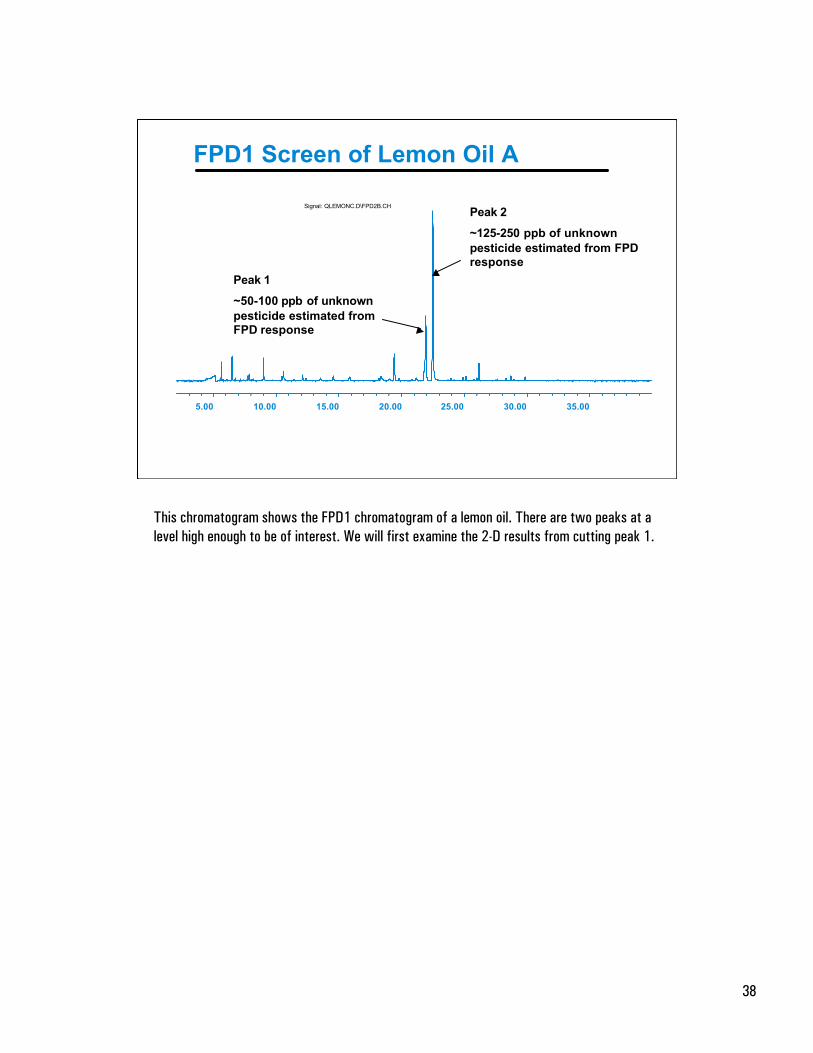
This chromatogram shows the FPD1 chromatogram of a lemon oil. There are two peaks at alevel high enough to be of interest. We will first examine the 2-D results from cutting peak 1.
39
Lemon Oil, Peak 1 Cut Results
25.50 26.00 26.50 27.00 27.50 28.00 28.50
MS TIC of peak 1 cut
FPD2 (P mode) of peak 1 cut
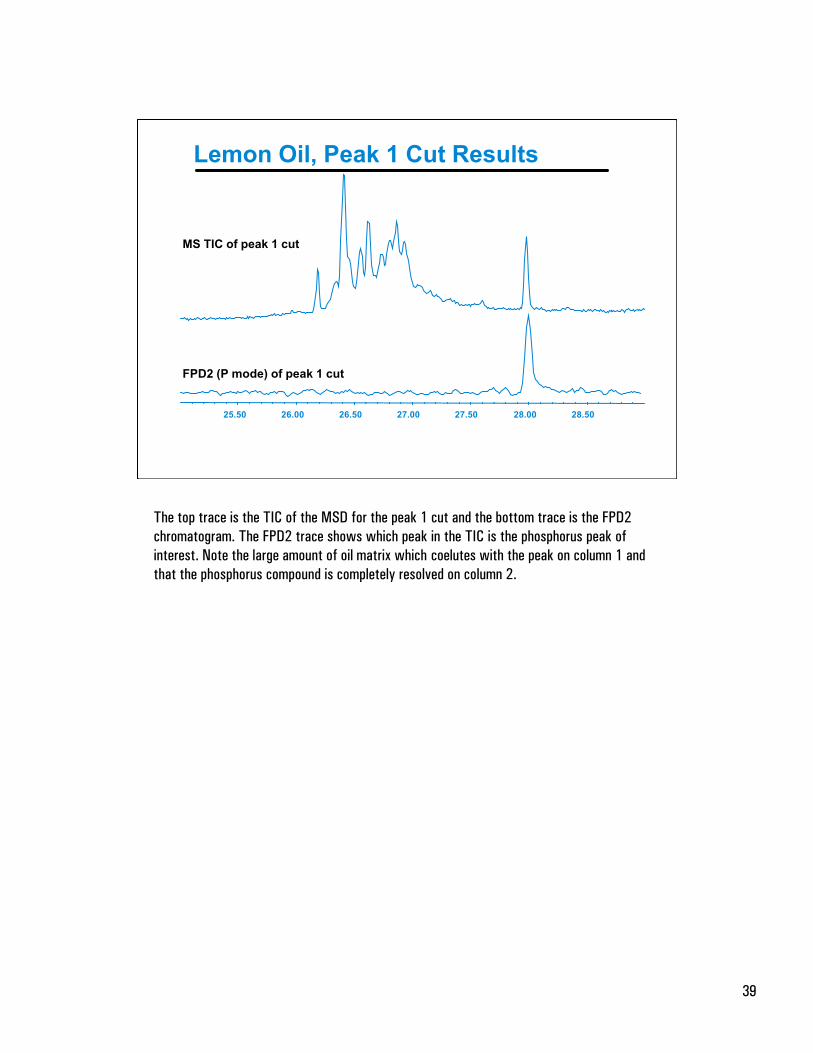
The top trace is the TIC of the MSD for the peak 1 cut and the bottom trace is the FPD2chromatogram. The FPD2 trace shows which peak in the TIC is the phosphorus peak ofinterest. Note the large amount of oil matrix which coelutes with the peak on column 1 andthat the phosphorus compound is completely resolved on column 2.
40
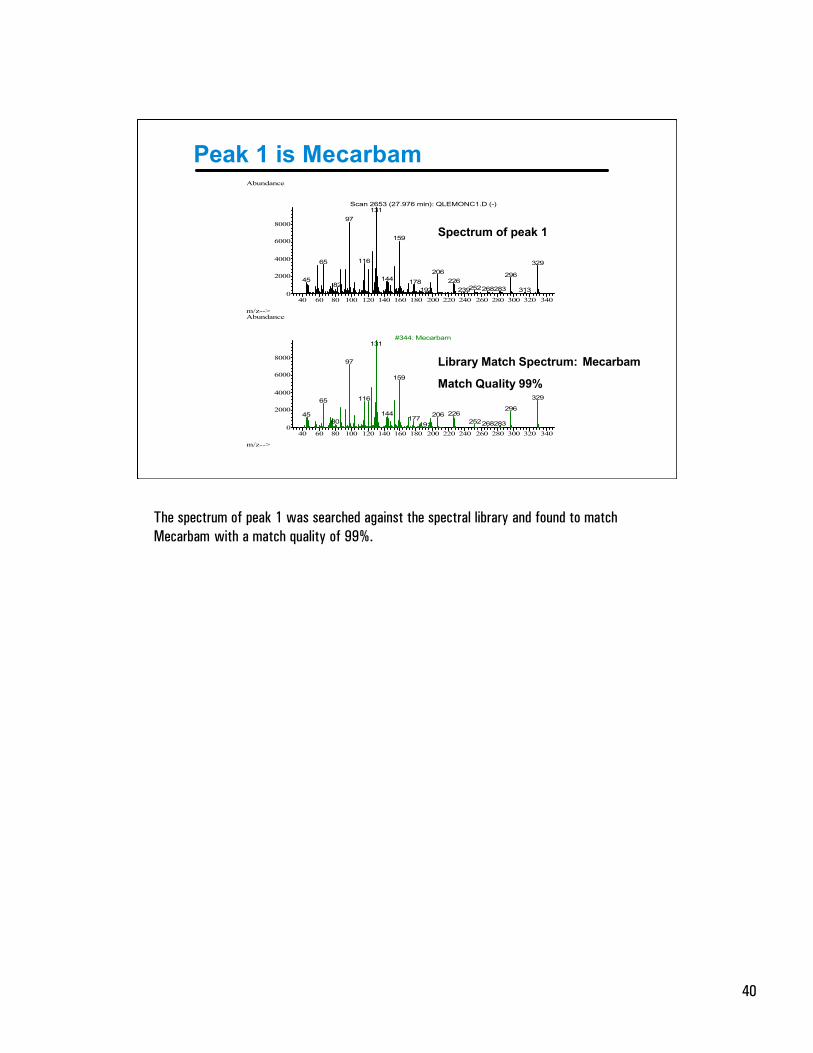
Peak 1 is Mecarbam
40 60 80 100 120 140 160 180 200 220 240 260 280 300 320 3400
2000
4000
6000
8000
m/z-->
Abundance
Scan 2653 (27.976 min): QLEMONC1.D (-)131
97
159
11665 329206 296
14445 22617882 252 283268192 313239
40 60 80 100 120 140 160 180 200 220 240 260 280 300 320 3400
2000
4000
6000
8000
m/z-->
Abundance
#344: Mecarbam131
97
159
32911665296
226144 20645177 25280 283268191
Spectrum of peak 1
Library Match Spectrum: Mecarbam
Match Quality 99%
The spectrum of peak 1 was searched against the spectral library and found to matchMecarbam with a match quality of 99%.
41
FPD1 Screen of Lemon Oil A
5.00 10.00 15.00 20.00 25.00 30.00 35.00
Signal: QLEMONC.D\FPD2B.CHPeak 2
~125-250 ppb of unknownpesticide estimated fromFPD response
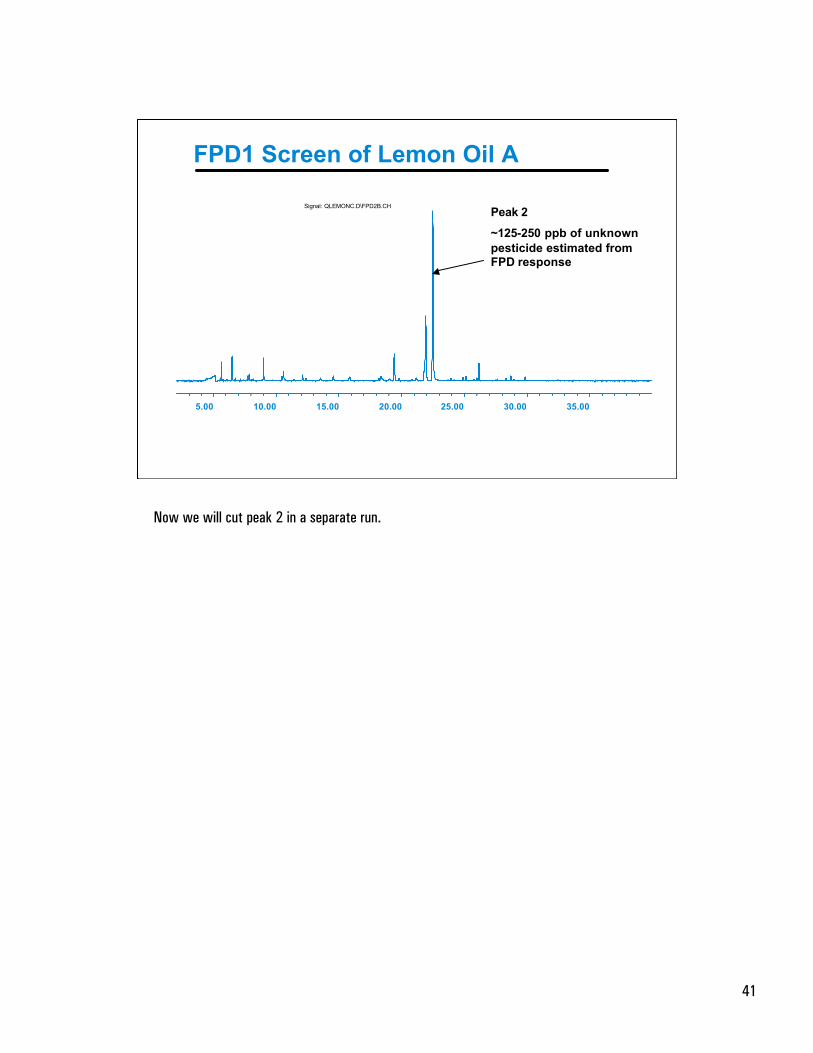
Now we will cut peak 2 in a separate run.
42
Lemon Oil, Peak 2 Cut Results
25.00 25.50 26.00 26.50 27.00 27.50 28.00 28.50 29.00 29.50
MS TIC of peak 2 cut
FPD2 (P mode) of peak 2 cut
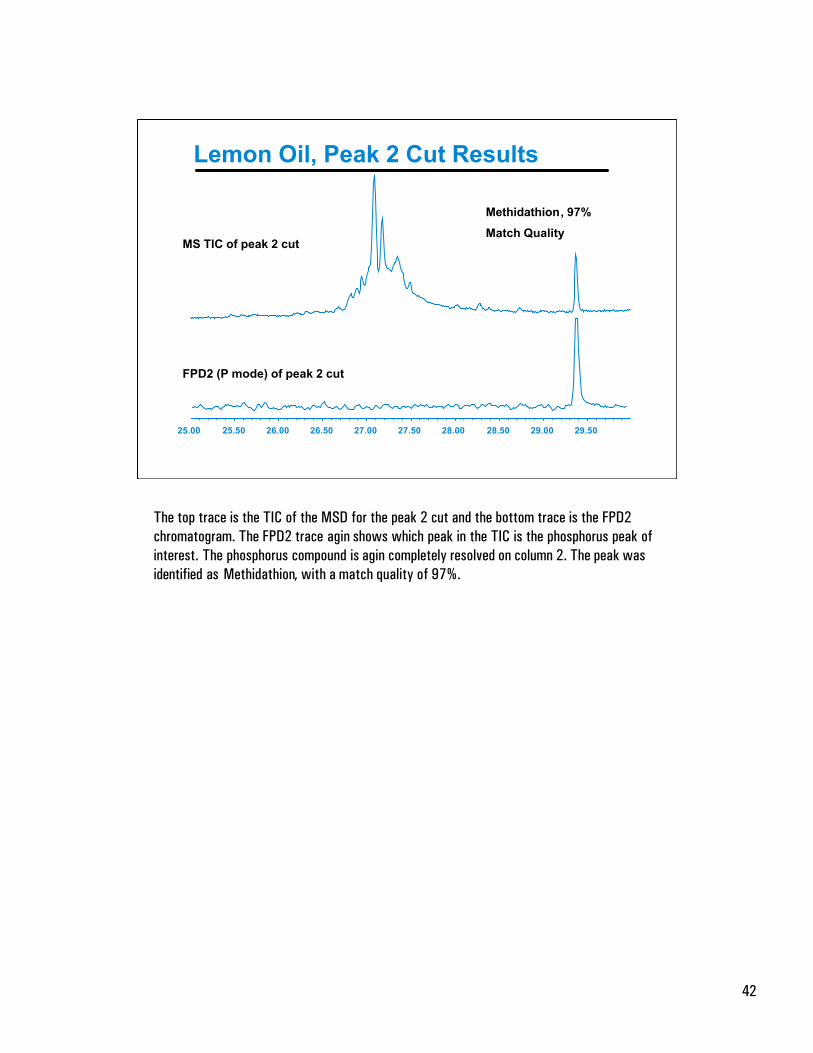
Methidathion, 97%
Match Quality
The top trace is the TIC of the MSD for the peak 2 cut and the bottom trace is the FPD2chromatogram. The FPD2 trace agin shows which peak in the TIC is the phosphorus peak ofinterest. The phosphorus compound is agin completely resolved on column 2. The peak wasidentified as Methidathion, with a match quality of 97%.
43
Summary
• Developments in GC hardware in recent years have madeDeans switch systems easier to construct, use, andmaintain.
• Single oven, non-cryo systems can often solve the problem
• 2-D GC is a powerful tool that can be used by itself orcombined with other selective techniques to solve difficultseparation problems.
Simplified 2-D GC systems offer the analyst a cost effective, powerful tool for addressingdifficult separation problems. It can be used by itself or in conjunction with other techniquesand should be considered whenever an analysis requires the separation of a compound or afew compounds from a difficult matrix.


![Evaluation of a Simplified Method for GC/MS Qualitative ...€¦ · is the confirmation of GC/MS data by parallel analysis of the sample with a selective detector [1,2], which provides](https://img.pdfslide.us/doc/110x75/6109c369ae59fa4c4c1ede26/evaluation-of-a-simplified-method-for-gcms-qualitative-is-the-conirmation.jpg)