Embed Size (px)
Citation preview
Pertanika J. Sci. & Techno!. 10(2): 187 - 199 (2002)ISSN: 0128-7680
© Universiti Putra Malaysia Press
A Simple GIS Data for Tree Management inUniversiti Putra Malaysia's Arboretum
Kamarozaman Jusoff & Iwan SetiawanForest Production Department
Faculty ofForestryUniversiti Putra Malaysia, 43400 UPM Serdang
Email: [email protected]
Received: 20 April 1999
ABSTRAK
Lokasi pokok dan cm-cm pokok adalah elemen-elemen berharga sistemperbandaran pokok. Dengan mencipta data pokok dalam sistem informasiGeografi, pengguna mempunyai akses kepada data digital lain yang bolehdigunakan dalam hubungan dengan pengkalan data pokok. Satu k~ian telahdikendalikan di tempat semaian pokok Universiti Putra Malaysia. Maklumattentang posisi pokok dan maklumat ciri-cirinya (dimensi pokok) untuk 434pokok di kawasan tempat semaian boleh diperolehi dengan mudah daripadapengkalan data Sistem Informasi Geografi yang ringkas. Pangkalan data GISboleh dikendalikan dengan mudahnya bersama parameter-parameter lain jugaspesies dan lokasi. Sebagai pengurusan rutin, ia hanyalah satu langkah keciluntuk melengkapkan ukuran-ukuran pokok piawai dengan data yang berguna,subjektif seperti yang digunakan untuk merekod keadaan pokok atau tindakanpengurusan daripada pengurusan yang wujud, mungkin untuk meramalpertumbuhan, hasil balak dan juga impak landskap. Keseluruhan kawasantapak kajian adalah kira-kira 5.7 hektar. Pembahagian famili daripada kawasanmengandungi 12 famili, 19 genus dan 15 spesies. Hopea odorata adalahjumlahspesies pokok yang paling tinggi dengan pembahagian diameter daripada4.2cm hingga 65.7 cm. Kira-kira 75 pokok di dalam kawasan tersebut didapatimati disebabkan oleh sistem pengairan yang tidak sempurna. Kerja melabeldan mengecat pokok mesti dilakukan untuk mengawasi pertumbuhannya,mortaliti dan pengukuran kedudukan pokok masa hadapan.
ABSTRACT
Tree location and tree attributes are valuable elements of municipal treemanagement systems. By creating the tree data in Geographic InformationSystem, users have access to other digital data that can be used in conjunctionwith tree database. A study was conducted at the Universiti Putra Malaysia'sarboretum with an objective to establish a computerized information system forUniversiti Putra Malaysia's arboretum. Information about tree position andtheir attributes information (tree dimension) for 434 trees in arboretum areacan be easily retrieved from a simple Geographic Information System database.The GIS database can cope just as easily with other parameters besides speciesand location. As for routine management, it is only a small step to complementstandard tree measurements, with data of a useful, subjective kind, such as thatused to record tree condition or management action from existing measurement,perhaps to predict growth, timber yields and even landscape impact. The totalarea of study site is about 5.7 ha. Family distribution from the area consistedof 12 families, 19 genus and 15 species. Hopea odorata was the highest number
Kamaruzaman Jusoff & lwan Setiawan
of the tree species present with diameter distribution ranging from 4.2 cm to65.7 cm. About 75 trees inside the area were found dead due to water loggingand improper drainage. Labeling or painting of trees should be done in orderto monitor their growth, mortality and future tree stand measurement.
Keywords: Geographic Information System, database, tree management,arboretum
INTRODUCTION
Trees have served as sources of untold wealth from primitive times to today.They contribute to worldwide comfort and convenience by providing manyusable materials for construction and industrial purposes, attractive woods forfurniture, potent medicines for healing, fuels for heating and valuable sustenancefor all types of wildlife.
Trees provide shade from intense sun, shelter from the wind, act as a barrieragainst sound, contribute importantly to erosion control and to dust removalfrom the air. Trees, when they are properly selected, placed and maintained,can greatly improve the microclimate of urban areas. Therefore, trees are animportant part of human lives-around homes, schools, shopping centers, placesof work, along streets and highways, in the city centres, parks and otherlandscaped areas such as arboretum (Minkler 1980; Harris 1983; James 1990and Boyce 1995).
Tree location and tree attributes are valuable elements of arboretum treemanagement system. By creating the tree data in GIS, users have access toother digital data that can be used in co~unctionwith tree database. Theseelements, if used together, will help in the cost effectiveness of tree management(Goodwin 1996). With a GIS database, recording for each tree dimension in thecollection will be maintained in an electronic database, and detailed plantinglocations will be plotted on a digital map. Therefore, the establishment of asimple geographic information system database that have the capability toexpand, rapidly update and retrieve information (both graphic and nongraphic information) will be a useful tool for the proper planning andmanagement of the arboretum.
The general objective of this study is therefore, to establish a computerizedinformation system for UPM's arboretum. The specific objectives of this studyare two-fold, namely: (i) To establish an initial GIS database and to producedigital map for the arboretum in UPM and (ii) To develop an inventory of treespecies and their growth, in term of diameter and height.
MATERIALS AND METHODS
Site Description
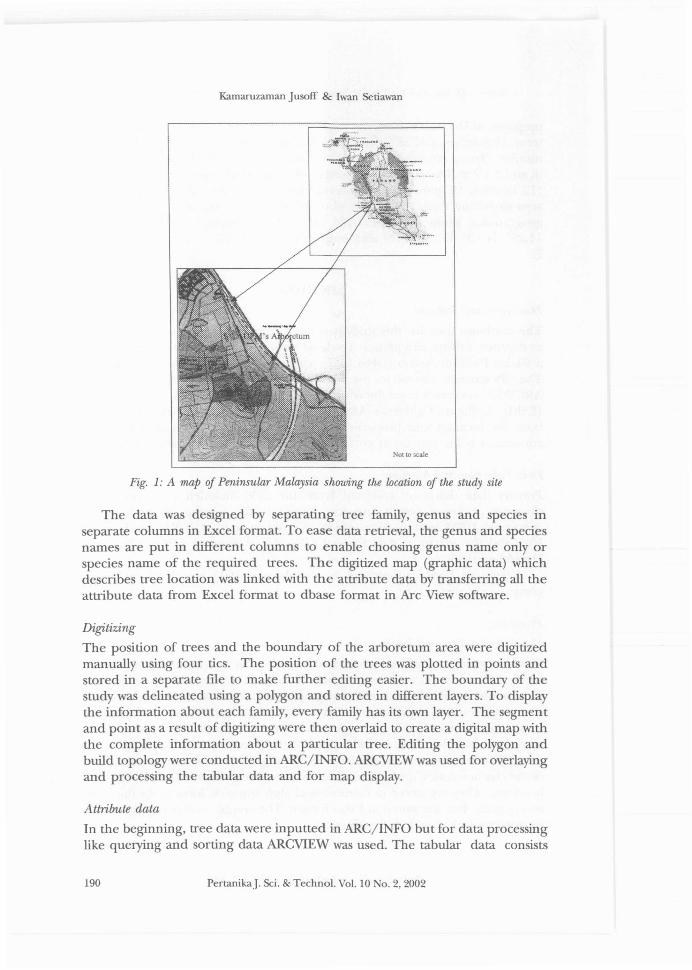
The study was conducted at the Universiti Putra Malaysia's arboretum. Thetotal area of study site is about 5.7 ha (Fig. 1). Based on a tree inventory
188 PertanikaJ. Sci. & Techno\. Vol. 10 No.2, 2002
A Simple GIS Database for Tree Management in Universiti Putra Malaysia's Arboretum
prepared in December 1996, the number of trees inside the area is about 1107trees, 15 families, and 28 species with Acacia mangium constituting the highestnumber. There are two types of tree spacing available in this study i.e. 6 x 12m and 3 x 2 m. Due to the time constraint in this study, only a total of 434 trees(12 families, 19 genus and 15 species) were enumerated and mapped in thearea excluding Acacia mangium planted with a spacing of 3 m x 2 m. Thegeographical position of the UPM arboretum is located at latitudes 3° 00'11.28" N - 3° 00' 27.43" N and longitude :101° 43' 22.11" E - 101° 43' 30.73"E.
METHOD
Hardware and Software
The hardware used for this study is a microcomputer and its accessories suchas digitizer, printer and plotter. To determine the position of the area studied,a Global Position System (GPS) Geo explorer II was used with 30 m accuracy.The GIS software selected for use in this study was ARC/INFO version 3.4.2 andARCVIEW version 3.1, produced by Environmental System Research Institute(ESRI), Redlands, California. ARC/INFO and Arc View were used to translateboth the location and properties of spatial features into digital form. Dataconversion is the process of creating digital map files from other sources.
Data Collection and Mapping
Primary data that were collected from the field included measurement ofdiameter at breast height and tree position and spacing. Secondary datacomprised UPM land-use map which was obtained from UPM DevelopmentUnit and the inventory data from the Faculty of Forestry UPM collected inDecember 1996.
A map of UPM's arboretum at a scale of 1:1000 was developed usingcompass and meter tape.
Procedure
Database Structure and Design
Database structure has been performed in such a way that information can onlybe derived as required. The database structure consists of digital graphic(arboretum digitized map) and non graphic data that describe map features,tree attributes such as diameter, height and species. Graphic data use four typesof graphic elements to depict map features and annotation (i.e. points, lines,area, and symbols). They include digital descriptions of map features, logicalgeographic relationships among features. Non graphic data are representationsof the characteristics, qualities or relationships of map features and geographiclocations. They are stored in conventional alphanumeric formats. In this studynon graphic data was stored in Excel format. The graphic and non graphic dataformats are linked with GIS technology.
PertanikaJ. &i. & Techno!' Vo!' 10 No.2, 2002 189
Kamaruzaman Jusolf & lwan Setiawan
Fig. 1: A map of Peninsular Malaysia showing the wcation of the study site
The data was designed by separating tree family, genus and species inseparate columns in Excel format. To ease data retrieval, the genus and speciesnames are put in different columns to enable choosing genus name only orspecies name of the required trees. The digitized map (graphic data) whichdescribes tree location was linked with the attribute data by transferring all theattribute data from Excel format to dbase format in Arc View software.
Digitizing
The position of trees and the boundary of the arboretum area were digitizedmanually using four tics. The position of the trees was plotted in points andstored in a separate file to make further editing easier. The boundary of thestudy was delineated using a polygon and stored in different layers. To displaythe information about each family, every family has its own layer. The segmentand point as a result of digitizing were then overlaid to create a digital map withthe complete information about a particular tree. Editing the polygon andbuild topology were conducted in ARC/INFO. ARCVIEWwas used for overlayingand processing the tabular data and for map display.
Attribute data
In the beginning, tree data were inputted in ARC/INFO but for data processinglike querying and sorting data ARCVIEW was used. The tabular data consists
190 PertanikaJ. &i. & Techno!. Vo!. 10 No.2, 2002
A Simple GIS Database for Tree Management in Universiti Putra Malaysia's Arboretum
of the number of trees, diameter of trees (Years of measurement 1996 and1999), height (measured in 1996), family, genus and species. The tabular datawere incorporated with the spatial data resulting from digitizing in ARCVIEW.
RESULTS AND DISCUSSION
Pattern of Tree DistrilnLtion (Family, Genus and Species)
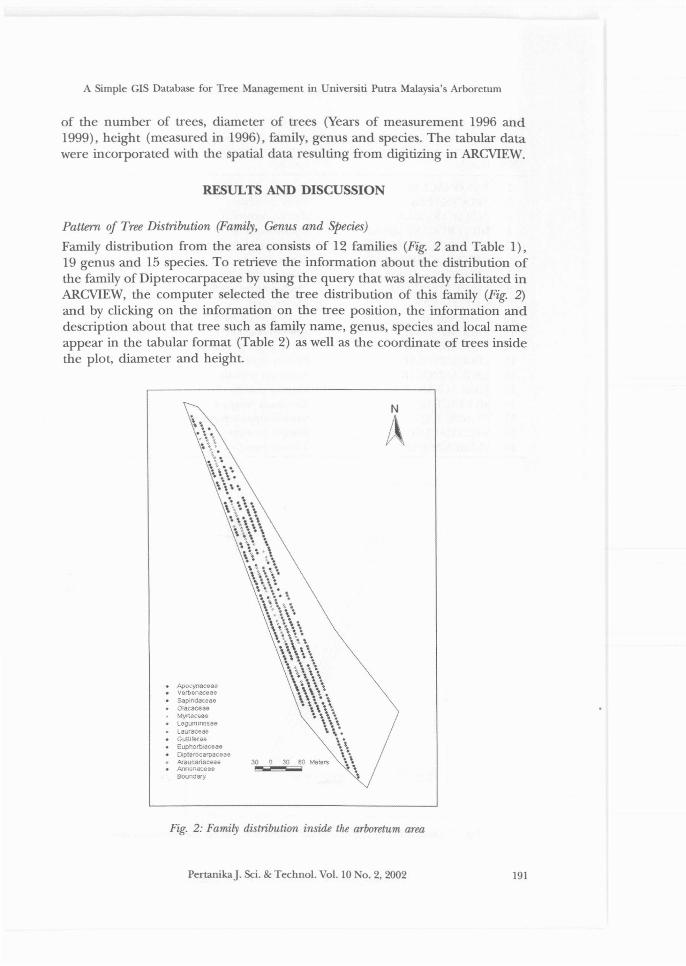
Family distribution from the area consists of 12 families (Fig. 2 and Table 1),19 genus and 15 species. To retrieve the information about the distribution ofthe family of Dipterocarpaceae by using the query that was already facilitated inARCVIEW, the computer selected the tree distribution of this family (Fig. 2)and by clicking on the information on the tree position, the information anddescription about that tree such as family name, genus, species and local nameappear in the tabular format (Table 2) as well as the coordinate of trees insidethe plot, diameter and height.
~oC'ynsc~ee
Vetbenaceee• SspmdaGeae
OlaC3ceae.Myrtaceaeu~gurnJnosee
Lauraceaa• Gultlferal3• Euphorbeec6ae• Dlpterocarpaceee
AraucariaceaoAnnonaceaeBoundary
30 0 30 eo Metel'5
N
Fig. 2: Family distribution inside the arboretum area
PertanikaJ. Sci. & Techno!. Va!. 10 0.2, 2002 191
Kamaruzaman Jusoff & lwan Setiawan
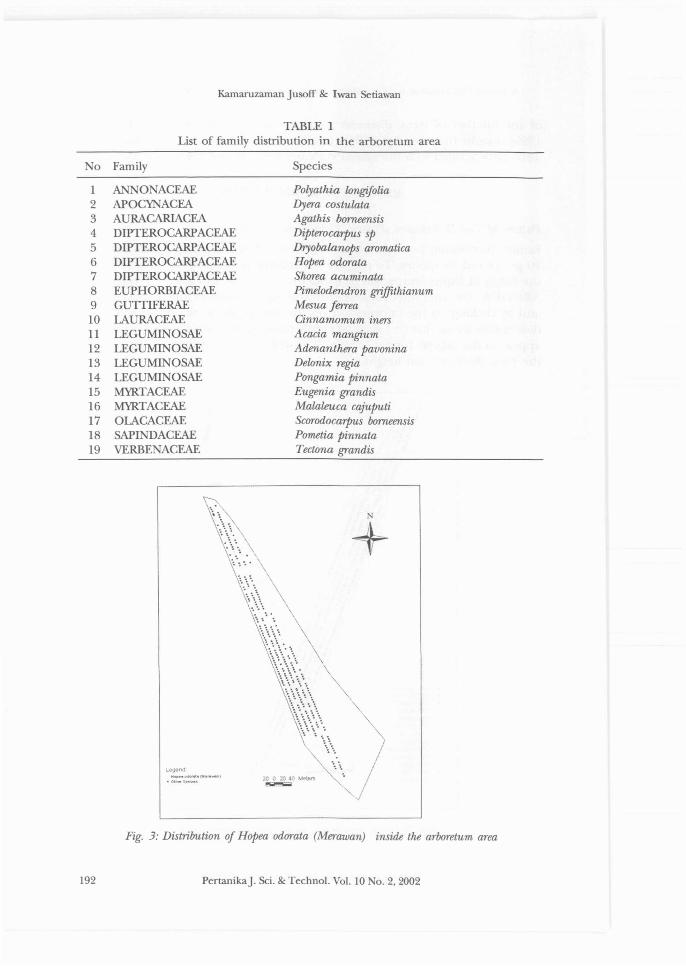
TABLE IList of family distribution in the arboretum area
o Family Species
1 ANNONACEAE2 APOCYNACEA3 AURACARIACEA4 DIPTEROCARPACEAE5 DIPTEROCARPACEAE6 DIPTEROCARPACEAE7 DIPTEROCARPACEAE8 EUPHORBlACEAE9 GUTTlFERAE10 LAURACEAE11 LEGUMINOSAE12 LEGUMINOSAE13 LEGUMINOSAE14 LEGUMlNOSAE15 MYRTACEAE16 MYRTACEAE17 OLACACEAE18 SAPINDACEAE19 VERBE ACEAE
L(o<j8nj_~_.. ()t__)
.!'tNr~_.
Polyathia longifoliaDyera costulataAgathis borneensisDipterocarpus spDryobalanops aromaticaHopea odorataShorea acuminataPimelodendron griffithianumMesua ferreaCinnamomum inersAcacia mangiumAdenanthera pavoninaDelonix regiaPongamia pinnataEugenia grandisMalaleuca cajuputiScorodoca7pus borneensisPometia pinnataTectona grandis
N
+
192
Fig. 3: Distribution of Hopea odorata (Merawan) inside the arboretum area
PertanikaJ. Sci. & Techno\. Vol. 10 No.2, 2002
A Simple GIS Database for Tree Management in Universiti Putra Malaysia's Arboretum
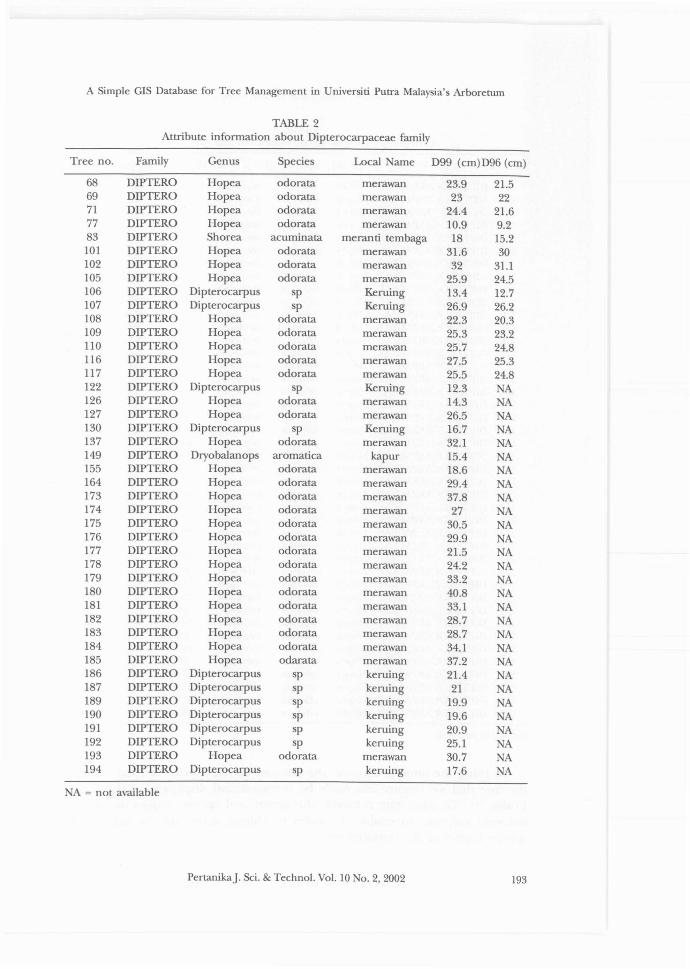
TABLE 2Attribute information about Dipterocarpaceae family
Tree no. Family Genus Species Local Name D99 (cm)D96 (cm)
68 DIPTERO Hopea odorata merawan 23.9 21.569 DIPTERO Hopea odorata merawan 23 2271 DIPTERO Hopea odorata merawan 24.4 21.677 DIPTERO Hopea odorata merawan 10.9 9.283 DIPTERO Shorea acuminata meranti tembaga 18 15.2101 DIPTERO Hopea odorata merawan 31.6 30102 DIPTERO Hopea odorata merawan 32 31.1105 DIPTERO Hopea odorata merawan 25.9 24.5106 DIPTERO Dipterocarpus sp Kerning 13.4 12.7107 DIPTERO Dipterocarpus sp Kerning 26.9 26.2108 DIPTERO Hopea odorata merawan 22.3 20.3109 DIPTERO Hopea odorata merawan 25.3 23.2110 DIPTERO Hopea odorata merawan 25.7 24.8116 DIPTERO Hopea odorata merawan 27.5 25.3117 DIPTERO Hopea odorata merawan 25.5 24.8122 DIPTERO Dipterocarpus sp Kerning 12.3 A126 DIPTERO Hopea odorata merawan 14.3 A127 DIPTERO Hopea odorata merawan 26.5 NA130 DIPTERO Dipterocarpus sp Kerning 16.7 NA137 DIPTERO Hopea odorata merawan 32.1 NA149 DIPTERO Dryobalanops aromatica kapur 15.4 NA155 DIPTERO Hopea odorata merawan 18.6 A164 DIPTERO Hopea odorata merawan 29.4 A173 DIPTERO Hopea odorata merawan 37.8 A174 DIPTERO Hopea odorata merawan 27 A175 DIPTERO Hopea odorata merawan 30.5 NA176 DIPTERO Hopea odorata merawan 29.9 NA177 DIPTERO Hopea odorata merawan 21.5 NA178 DIPTERO Hopea odorata merawan 24.2 NA179 DIPTERO Hopea odorata merawan 33.2 A180 DIPTERO Hopea odorata merawan 40.8 A181 DIPTERO Hopea odorata merawan 33.1 A182 DIPTERO Hopea odorata merawan 28.7 A183 DIPTERO Hopea odorata merawan 28.7 NA184 DIPTERO Hopea odorata merawan 34.1 NA185 DIPTERO Hopea odarata merawan 37.2 NA186 DIPTERO Dipterocarpus sp kerning 21.4 NA187 DIPTERO Dipterocarpus sp kerning 21 NA189 DIPTERO Dipterocarpus sp kerning 19.9 A190 DIPTERO Dipterocarpus sp kerning 19.6 A191 DIPTERO Dipterocarpus sp kerning 20.9 A192 DIPTERO Dipterocarpus sp kerning 25.1 NA193 DIPTERO Hopea odorata merawan 30.7 NA194 DIPTERO Dipterocarpus sp kerning 17.6 NA
NA = not available
PertanikaJ. Sci. & Techno!. Vo!. 10 No.2, 2002 193
Kamaruzaman Jusoff & Iwan Setiawan
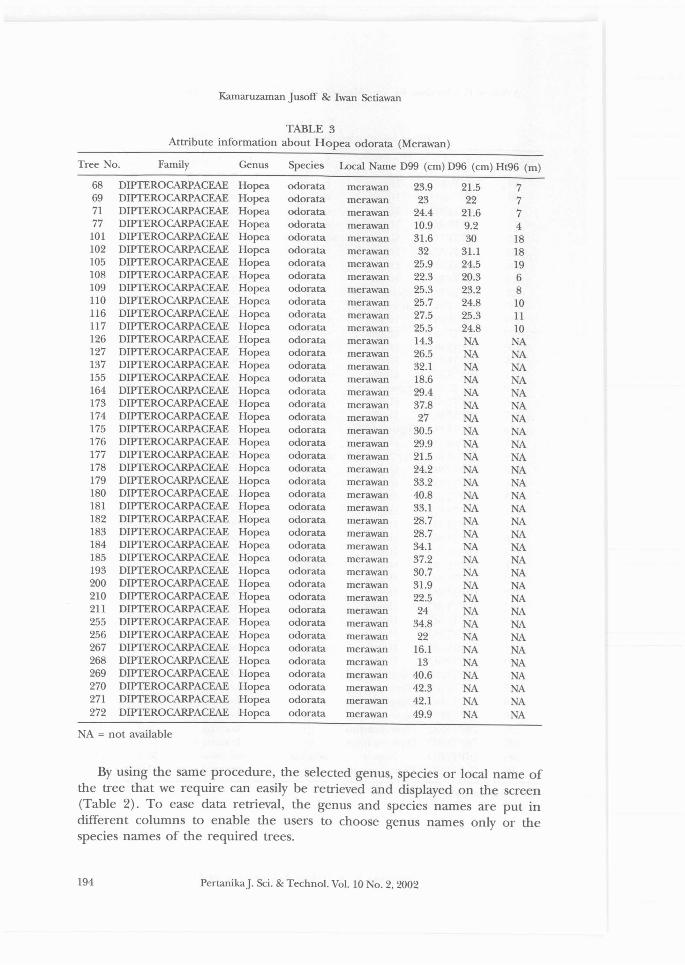
TABLE 3Attribute information about Hopea odorata (Merawan)
Tree No. Family Genus Species Local Name D99 (em) D96 (em) Ht96 (m)
68 DIPTEROCARPACEAE Hopea odorata merawan 23.9 21.5 769 DIPTEROCARPACEAE Hopea odorata merawan 23 22 771 DIPTEROCARPACEAE Hopea odorata merawan 24.4 21.6 777 DIPTEROCARPACEAE Hopea odorata merawan 10.9 9.2 4
101 DIPTEROCARPACEAE Hopea odorata merawan 31.6 30 18102 DIPTEROCARPACEAE Hopea odorata merawan 32 31.1 18105 DIPTEROCARPACEAE Hopea odorata merawan 25.9 24.5 19108 DIPTEROCARPACEAE Hopea odorata merawan 22.3 20.3 6109 DIPTEROCARPACEAE Hopea odorata merawan 25.3 23.2 8110 DIPTEROCARPACEAE Hopea odorata merawan 25.7 24.8 10116 DIPTEROCARPACEAE Hopea odorata merawan 27.5 25.3 11117 DIPTEROCARPACEAE Hopea odorata merawan 25.5 24.8 10126 DIPTEROCARPACEAE Hopea odorata merawan 14.3 NA NA127 DIPTEROCARPACEAE Hopea odorata merawan 26.5 NA NA137 DIPTEROCARPACEAE Hopea odorata merawan 32.1 NA NA155 DIPTEROCARPACEAE Hopea odorata merawan 18.6 NA NA164 DIPTEROCARPACEAE Hopea odorata merawan 29.4 NA NA173 DIPTEROCARPACEAE Hopea odorata merawan 37.8 NA NA174 DIPTEROCARPACEAE Hopea odorata merawan 27 NA NA175 DIPTEROCARPACEAE Hopea odorata merawan 30.5 NA NA176 DIPTEROCARPACEAE Hopea odorata merawan 29.9 NA NA177 DIPTEROCARPACEAE Hopea odorata merawan 21.5 NA NA178 DIPTEROCARPACEAE Hopea odorata merawan 24.2 NA NA179 DIPTEROCARPACEAE Hopea odorata merawan 33.2 NA NA180 DIPTEROCARPACEAE Hopea odorata merawan 40.8 NA NA181 DIPTEROCARPACEAE Hopea odorata merawan 33.1 NA NA182 DIPTEROCARPACEAE Hopea odorata merawan 28.7 NA NA183 DIPTEROCARPACEAE Hopea odorata merawan 28.7 NA NA184 DIPTEROCARPACEAE Hopea odorata merawan 34.1 NA NA185 DIPTEROCARPACEAE Hopea odorata merawan 37.2 NA NA193 DIPTEROCARPACEAE Hopea odorata merawan 30.7 NA NA200 DIPTEROCARPACEAE Hopea odorata merawan 31.9 NA NA210 DIPTEROCARPACEAE Hopea odorata merawan 22.5 NA NA211 DIPTEROCARPACEAE Hopea odorata merawan 24 NA NA255 DIPTEROCARPACEAE Hopea odorata merawan 34.8 NA NA256 DIPTEROCARPACEAE Hopea odorata merawan 22 NA NA267 DIPTEROCARPACEAE Hopea odorata merawan 16.1 NA NA268 DIPTEROCARPACEAE Hopea odorata merawan 13 NA NA269 DIPTEROCARPACEAE Hopea odorata merawan 40.6 NA NA270 DIPTEROCARPACEAE Hopea odorata merawan 42.3 NA NA271 DIPTEROCARPACEAE Hopea odorata merawan 42.1 NA NA272 DIPTEROCARPACEAE Hopea odorata merawan 49.9 NA NA
NA = not available
By using the same procedure, the selected genus, species or local name ofthe tree that we require can easily be retrieved and displayed on the screen(Table 2). To ease data retrieval, the genus and species names are put indifferent columns to enable the users to choose genus names only or thespecies names of the required trees.
194 PertanikaJ. Sci. & Technol. Vol. 10 No.2, 2002
A Simple GIS Database for Tree Management in Universiti Putra Malaysia's Arboretum
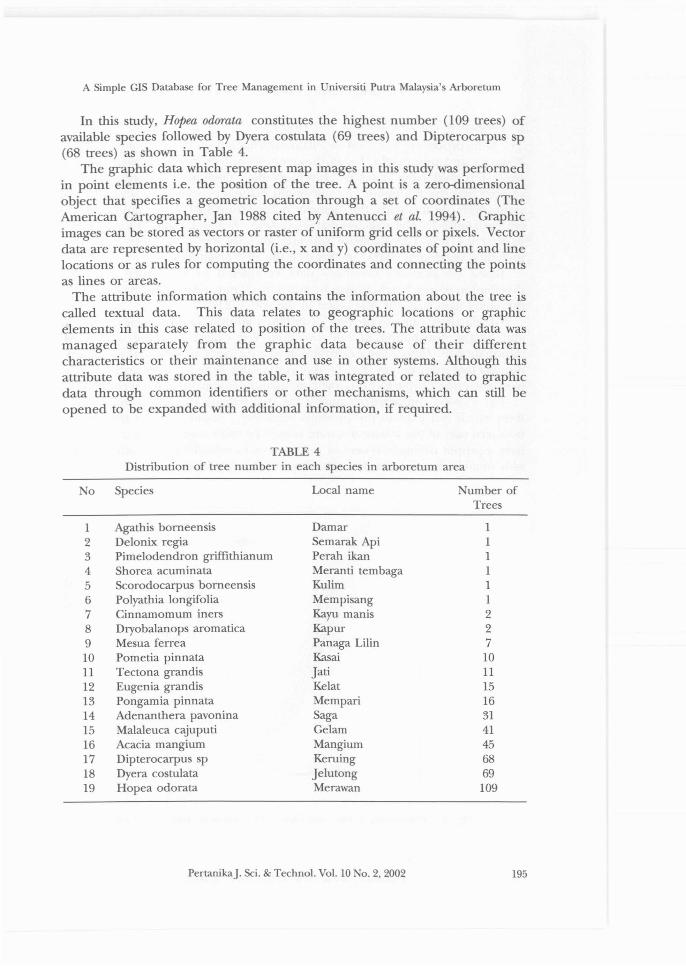
In this study, Hopea odorata constitutes the highest number (109 trees) ofavailable species followed by Dyera costulata (69 trees) and Dipterocarpus sp(68 trees) as shown in Table 4.
The graphic data which represent map images in this study was performedin point elements i.e. the position of the tree. A point is a zero-dimensionalobject that specifies a geometric location through a set of coordinates (TheAmerican Cartographer, Jan 1988 cited by Antenucci et at. 1994). Graphicimages can be stored as vectors or raster of uniform grid cells or pixels. Vectordata are represented by horizontal (i.e., x and y) coordinates of point and linelocations or as rules for computing the coordinates and connecting the pointsas lines or areas.
The attribute information which contains the information about the tree iscalled textual data. This data relates to geographic locations or graphicelements in this case related to position of the trees. The attribute data wasmanaged separately from the graphic data because of their differentcharacteristics or their maintenance and use in other systems. Although thisattribute data was stored in the table, it was integrated or related to graphicdata through common identifiers or other mechanisms, which can still beopened to be expanded with additional information, if required.
TABLE 4Distribution of tree number in each species in arboretum area
o Species
1 Agathis bomeensis2 Delonix regia3 Pimelodendron griffithianum4 Shorea acuminata5 Scorodocarpus bomeensis6 Polyathia longifolia7 Cinnamomum iners8 Dryobalanops aromatica9 Mesua ferrea10 Pometia pinnata11 Tectona grandis12 Eugenia grandis13 Pongamia pinnata14 Adenanthera pavonina15 Malaleuca cajuputi16 Acacia mangium17 Dipterocarpus sp18 Dyera costulata19 Hopea odorata
Local name
DamarSemarak ApiPerah ikanMeranti tembagaKulimMempisangKayu manisKapurPanaga LilinKasaiJatiKelatMempariSagaGelamMangiumKerningJelutongMerawan
umber ofTrees
111111227101115163141456869
109
PertanikaJ. &i. & Technol. Vol. 10 0.2, 2002 195
Kamaruzaman Jusoff & Iwan Setiawan
Distrilrution of Tree Diameter and Tree Height
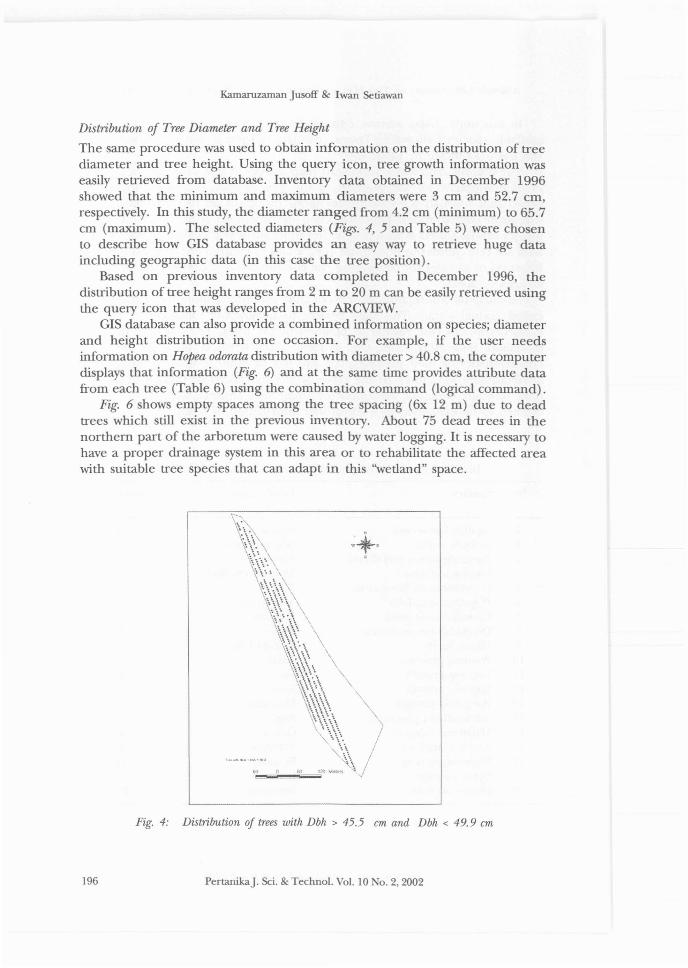
The same procedure was used to obtain information on the distribution of treediameter and tree height. Using the query icon, tree growth information waseasily retrieved from database. Inventory data obtained in December 1996showed that the minimum and maximum diameters were 3 cm and 52.7 cm,respectively. In this study, the diameter ranged from 4.2 cm (minimum) to 65.7cm (maximum). The selected diameters (Figs. 4,5 and Table 5) were chosento describe how GIS database provides an easy way to retrieve huge dataincluding geographic data (in this case the tree position).
Based on previous inventory data completed in December 1996, thedistribution of tree height ranges from 2 m to 20 m can be easily retrieved usingthe query icon that was developed in the ARCVIEW.
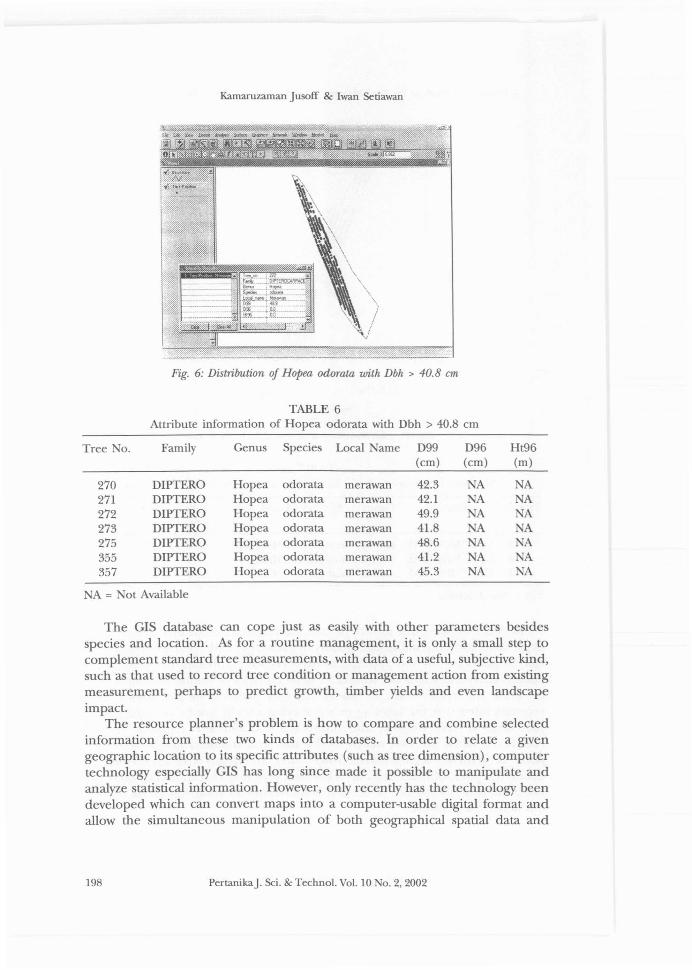
GIS database can also provide a combined information on species; diameterand height distribution in one occasion. For example, if the user needsinformation on Hopea odorata distribution with diameter> 40.8 cm, the computerdisplays that information (Fig. 6) and at the same time provides attribute datafrom each tree (Table 6) using the combination command (logical command).
Fig. 6 shows empty spaces among the tree spacing (6x 12 m) due to deadtrees which still exist in the previous inventory. About 75 dead trees in thenorthern part of the arboretum were caused by water logging. It is necessary tohave a proper drainage system in this area or to rehabilitate the affected areawith suitable tree species that can adapt in this "wetland" space.
Fig. 4: Distribution of trees with Dbh > 45.5 em and Dbh < 49.9 em
196 PertanikaJ. Sci. & Techno\. Vo\. 10 No.2, 2002
t",u-n!'C'h"lt''''·T,... .".,D.~'U.'<...
A Simple GIS Database for Tree Management in Universiti Putra Malaysia's Arboretum
\;..,~\ .,\.\\
\\.. :,~ ..... \
\\~~}\\"'\ \
,,'.\
\'\.
\\
\!
!
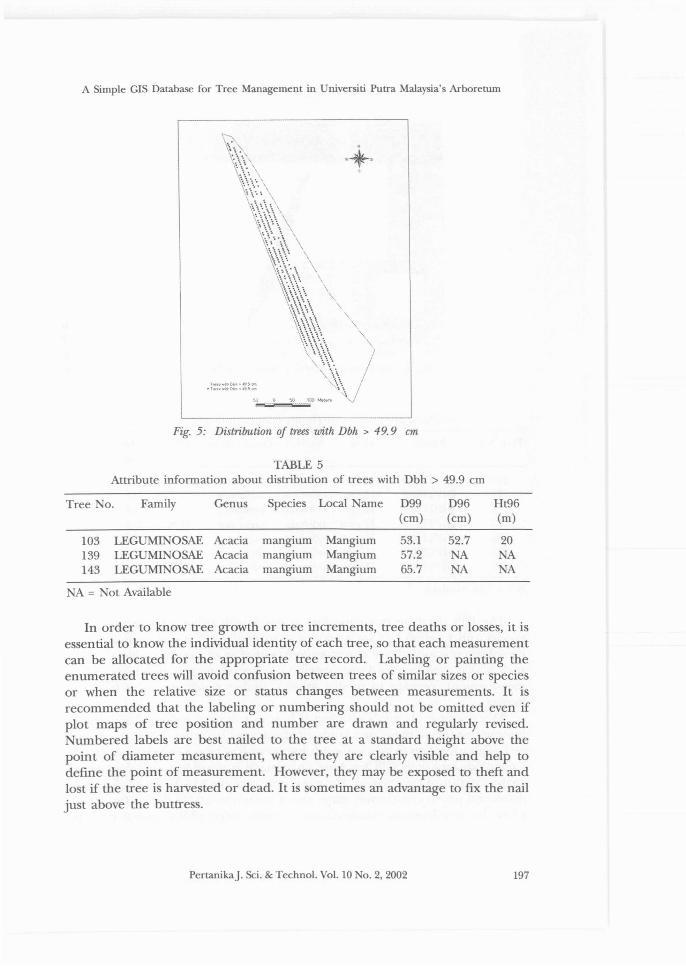
~,oo~,~\·j.....................-Fig. 5: DistrilJution of trees with Dbh > 49.9 em
TABLE 5Attribute information about distribution of trees with Dbh > 49.9 em
Tree o. Family Genus Species Local arne D99 D96 Ht96(em) (em) (m)
103 LEGUMINOSAE Acacia mangium Mangium 53.1 52.7 20139 LEGUMINOSAE Acacia mangium Mangium 57.2 A NA143 LEGUM! OSAE Acacia mangium Mangium 65.7 NA A
NA=
In order to know tree growth or tree increments, tree deaths or losses, it isessential to know the individual identity of each tree, so that each measurementcan be allocated for the appropriate tree record. Labeling or painting theenumerated trees will avoid confusion between trees of similar sizes or speciesor when the relative size or status changes between measurements. It isrecommended that the labeling or numbering should not be omitted even ifplot maps of tree position and number are drawn and regularly revised.Numbered labels are best nailed to the tree at a standard height above thepoint of diameter measurement, where they are clearly visible and help todefine the point of measurement. However, they may be exposed to theft andlost if the tree is harvested or dead. It is sometimes an advantage to fIx the nailjust above the buttress.
PertanikaJ. Sci. & Techno\. Va\. 10 o. 2, 2002 197
Kamaruzaman Jusoff & Iwan Setiawan
. .;. .~;-.
._-'-_.~-_.Fig. 6: DistrilJution of Hopea odarata with Dbh > 40.8 em
TABLE 6Attribute information of Hopea odorata with Dbh > 40.8 em
Tree o. Family Genus Species Local Name D99 D96 Ht96(em) (em) (m)
270 DIPTERO Hopea odorata merawan 42.3 NA NA271 DIPTERO Hopea odorata merawan 42.1 NA NA272 DIPTERO Hopea odorata merawan 49.9 A A273 DIPTERO Hopea odorata merawan 41.8 NA A275 DIPTERO Hopea odorata merawan 48.6 NA NA355 DIPTERO Hopea odorata merawan 41.2 NA NA357 DIPTERO Hopea odorata merawan 45.3 NA NA
NA= ot Available
The GIS database can cope just as easily with other parameters besidesspecies and location. As for a routine management, it is only a small step tocomplement standard tree measurements, with data of a useful, subjective kind,such as that used to record tree condition or management action from existingmeasurement, perhaps to predict growth, timber yields and even landscapeimpact.
The resource planner's problem is how to compare and combine selectedinformation from these two kinds of databases. In order to relate a givengeographic location to its specific attributes (such as tree dimension), computertechnology especially GIS has long since made it possible to manipulate andanalyze statistical information. However, only recently has the technology beendeveloped which can convert maps into a computer-usable digital format andallow the simultaneous manipulation of both geographical spatial data and
198 PertanikaJ. Sci. & Techno\. Vo\. 10 No.2, 2002
A Simple GIS Database for Tree Management in Universiti Putra Malaysia's Arboretum
related attribute data. This now makes it possible for the resource planner torapidly produce a combination of maps and tables that show where and what.
The users concerned with tree surveys will be satisfied to use the system asa library me, simply retrieving information as partial lists under headings ofspecies, locations, age classes, conditions, etc. It is useful, in these circumstances,to retain blank entry points in each tree record so that further parameters canbe added in future years. Other facilities enable the users to delete obsoleteinformation, such as when trees are removed or die or to extend the file to newentries keeping the data bank continuously updated.
CONCLUSIONS
Information about tree position and their attribute information (tree dimension)for 434 trees in the arboretum area can be easily stored, retrieved, analyzed anddisplayed in a simple GIS database. Tree stand management can also bedepicted both in spatial and tabular criteria in a simple and comprehensivemanner using a digital map of tree location which can be stored in ARCVIEW.
The information about the distribution of the tree family, genus or speciesas well as the coordinate of trees inside the plot, diameter, and height of therequired tree, can be retrieved easily by using the query that was developed inARCVIEW. Family distribution in the area consists of 12 families, 19 genus and15 species with Hopea odorata constituting the largest number inside the area.Tree diameter distribution ranges from 4.2 cm to 65.7 cm with lots of deadtrees (75 trees) inside the area due to problem of waterlogging.
REFERENCES
ANo . 1999. The Morton Arboretum. http://www.mortonarb.org. 6p.
ANTENUCCI, j.C., B. KEY, L. C. PETER, j.K MICHAEL and A. HUGH. 1991. GeographicInformation System: A Guide to the Technology. ew York: Van Nostrand Reinhold.
BOK:E, S.G. 1995. Landscape Forestry. New York: John Wiley & Sons, Inc.
GooDWIN, D.W. 1996. A street tree inventory for Massachusetts using GIS. Journal ofArboricuUure 22 (1): 19-28.
HARRIs, R W. 1983. Arboriculture. Care of Trees, Shrubs and Vines in the Landscape. NewJersey: Practice-Hall Inc.
JAMES, .D.G. 1990. The Arboriculturalist's Companion. A Guide to the Care of Trees. UnitedKingdom: Basil Blackwell Ltd.
MINKLER, L.S. 1980. Woodland Ecology. Environmental Forestry for the SmaU Owner. NewYork: Syracuse University Press.
PertanikaJ. &i. & Techno\. Vo\. 10 No.2, 2002 199