Embed Size (px)
Citation preview
Accepted Manuscript
A simple finding on variable amplitude (Gassner) fatigue SN curves obtained
using Miner’s rule for unnotched or notched specimen
M. Ciavarella, P. D’Antuono, G.P. Demelio
PII: S0013-7944(17)30248-5
DOI: http://dx.doi.org/10.1016/j.engfracmech.2017.03.005
Reference: EFM 5430
To appear in: Engineering Fracture Mechanics
Received Date: 4 March 2017
Accepted Date: 7 March 2017
Please cite this article as: Ciavarella, M., D’Antuono, P., Demelio, G.P., A simple finding on variable amplitude
(Gassner) fatigue SN curves obtained using Miner’s rule for unnotched or notched specimen, Engineering Fracture
Mechanics (2017), doi: http://dx.doi.org/10.1016/j.engfracmech.2017.03.005
This is a PDF file of an unedited manuscript that has been accepted for publication. As a service to our customers
we are providing this early version of the manuscript. The manuscript will undergo copyediting, typesetting, and
review of the resulting proof before it is published in its final form. Please note that during the production process
errors may be discovered which could affect the content, and all legal disclaimers that apply to the journal pertain.
A simple finding on variable amplitude (Gassner) fatigue SN
curves obtained using Miner’s rule for unnotched or notched
specimen
M.Ciavarella, P.D’Antuono, G.P.Demelio
Politecnico di Bari, 70125 Bari, Italy. [email protected]
March 4, 2017
Abstract
In this note, starting from the SN curve under Constant Amplitude (CA) for the fatiguelife of the uncracked (plain) specimen, we obtain that Gassner curves for Variable Amplitude(VA) loading using the simple Palmgren-Miner’s law are simply shifted CA curves. Further,using the Critical Distance Method in a very clean and powerful form proposed by Susmeland Taylor for VA loading, we find similar result for notched specimen, the spectrum loadingresults in the same multiplicative term for notched, cracked and unnotched specimen. Hence,the present proposal can be considered as a simple empirical unified approach for rapidassessment of the notch effect under random loading, which simplifies the recent proposalby Susmel and Taylor. To their extensive validations, we add some specific comparison withexperimental data from the Literature on our further findings.
Keywords: Fatigue, notches, Medium-Cycle fatigue, critical distance approach, random loading
Nomenclature
a = notch or crack (half) size
N= number of cyclesN∞= number of cycles to failure for “infinite life” (fatigue limit)a0= El Haddad intrinsic crack size (infinite life)a0 (N)= “finite life” El Haddad intrinsic crack sizeC,m= Paris’ “material constants”Kf = fatigue strength reduction factor for infinite lifeKf (N)= “finite life” fatigue strength reduction factorKt = elastic stress concentration factor∆Kth = fatigue threshold for long cracksσg= remote nominal (gross) stress∆σL = plain specimen fatigue limit (in terms of stress range)R= stress ratio
1
α = geometric shape factork = inverse slope of the Wohler SN curveCA =Constant AmplitudeV A =Variable Amplitude
1 Introduction
The classical approach to fatigue (e.g. [1-4]), uses a number of heuristic but simple correctivefactors, mainly for infinite life (“safe-life” design approach), but also for “finite life”: one of theclassical examples being the suggestion to interpolate between a static strength, and a infinitelife value (fatigue limit), see e.g. Fuchs and Stephens [2]. Fracture Mechanics has introduced newmaterial constants (and ways to test materials) namely fatigue threshold, static toughness, Paris’law constants C,m, but this results in a separate perspective with respect to standard designapproaches. For infinite life, the connection between the classical approach and the new “fracturemechanics” is simple: Smith and Miller [5] suggested that notches behave like cracks if they arelarge and sharp (”crack-like” notches), their infinite life is ruled by ∆Kth, the threshold value ofthe stress intensity factor range for which long cracks do not propagate according to Paris’ law[6]1. For infinite life, an important transition is from short crack (fatigue-limit dominated) tolong-cracks (fatigue-threshold dominated) [7], occurring at crack sizes of the order of
a0 =1
π
(
∆Kth
∆σL
)2
(1)
where ∆σL fatigue limit range (at a given load R−ratio). This length is of the order of 100µmfor many metals (for typical values of R between 0 , −1). Kitagawa and Takahashi [8] introducedthe ∆σ − a diagram which bears now their name, and showed the transition in a clear way, andEl Haddad et al [9] simply added a0 as an ”intrinsic” additional crack size for the thresholdequation, resulting in a simple interpolating formulae for the infinite life strength ∆σ∞
∆σ∞ = ∆Kth/√
π (αa+ a0) (2)
where α is a geometrical factor introduced to correct the stress intensity factor with respect tothat used in defining a0 (usually, the central crack in the infinite plate). The El Haddad ideabelongs to the class of “critical distance” heuristic methods (see also the recent book by Taylor[10]) starting from the early suggestions by Neuber and Peterson for the fatigue knock-downfactor Kf . Ciavarella and Meneghetti [11] suggest a single criterion with the transition from“El Haddad” to “Lukas and Klesnil” Kf . When dealing with finite life, one could approachthe problem in various ways: we could integrate Paris’ law, which requires a correction for shortcracks, or try to derive a generalized “finite life” Kitagawa diagram as done in Ciavarella [12].
In particular, Ciavarella [12] defines “naturally” a power law for the “intrinsic” crack sizea0 (N) (dependent on life)
a0 (N) = a0
(
N∞
N
)2(1/r−1/k)
(3)
1However, in the case of large notches of sufficiently large tip radius, the fatigue limit is really fully controlled
by Kt and the notch is defined as “blunt” notch.
2
where a candidate for the exponent r is Paris’ constant m (hence, about 2-4 for metals, and 10or higher for ceramic materials).
This equation has similarities with the recent Susmel and Taylor [13,14,15,16] “critical dis-tance” (Point) method where the fatigue life is evaluated considering the stress at a single “point”whose distance from the stress raiser is indicated as L/2 (it corresponds to a0 (N) /2) also givenin a power law form
L(N) = ANB (4)
where ”the constants of the above equation are expected to be different for different materials and
different load ratios, R”. These constants (A,B) are determined by them as a best fit directlyon notched data or else from basic material properties depending on the variant of the method.In all cases, the stress useful for assessment of fatigue failure is that at a critical distance L(N)/2from the notch (or crack) vertex.
1.1 Variable amplitude loading
Recently, Susmel and Taylor [15] have suggested an extension of the critical distance method forfinite life of notches under Variable Amplitude (VA) loading, and have extensively validated theirapproach using numerous experimental results generated by testing notched cylindrical samplesof a commercial medium-carbon steel containing three different stress concentration levels, andtwo types of spectra (a conventional Rayleigh distribution, and another emphasizing cycles of lowstress amplitude). In [16], they further generalize the method to multiaxial loading, and againvalidate the accuracy and reliability of the technique against 124 experimental results testingnotched cylindrical samples of carbon steel C40 under three type of spectra.
The critical distance method under VA loading relies on two further (quite strong, in principle)assumptions:
• that the critical distance is independent on the spectrum, and depends only on the finallife of the specimen: this is, at least, the variant they propose for the generalization of themethod for multiaxial loading [16], and which we shall refer to in the present paper.
• that we can apply (Palmgren-)Miner’s law (linear damage rule), which suggests for a givenblock with a total number of cycles per block Nc that damage will be
D =∑ ni
Ni(5)
where ni is the number of cycles spent at level i on the stress amplitude, and Ni is the totalnumber of cycles the specimen could resist at that level of stress, according to the constantamplitude (CA) SN Wohler curve. Failure according to the Miner rule should occur atcritical damage of Dc = 1.
Although Miner’s linear rule can be quite approximate and on the unsafe side, it is by far themost well known and used damage summation law: the suggested strategy by handbooks is tosimply assume a lower Dc. FKM-Guideline [17] recommends Dc = 0.3 for steels, steel castings,aluminum alloys, while Dc = 1 for ductile iron, grey cast iron malleable cast iron. Sonsino [18, 19]and Schijve [20] suggest testing is always the best choice of course when possible (modern trends
3
to refer to “virtual testing” in fatigue are quite suspicious). However, even testing (aside fromthe obvious very large costs) is not obvious and involves an art on its own, which is developedin certification rules for safety-critical applications (now both for metals and composites [21])involving the concepts of Life Factors (LF) or Load Enhancement Factor (LEF): essentially,under a given service loading, a single test can assess a given same reliability (typically assuminga Weibull distribution) only increasing the load or the life with respect to the mission; the formerversion is preferred of course as it is much accelerated, although accelerated testing may introduceproblems if time-dependent phenomena affect fatigue process. Often small amplitude cycles areomitted for simplicity and accelerating testing (and similarly in the original Palmgren-Miner rulecycles below fatigue limit are omitted from computation of the damage), although in some designhandbooks, especially in welded joints, these are known to produce fatigue damage. Indeed,low amplitude cycles can be dealt with according to the “Palmgren–Miner–Elementary method”with prolongation of the Wohler curve below the knee point with the same slope, or accordingto Haibach [22] with a reduced slope — the former method is more conservative of all, and willbe adopted in the present note, without loss of generality. In other words, we assume the CA
SN Wohler curve to extend to infinity, for variable amplitude calculations. This is particularlytrue for materials which do not show a clear fatigue limit, like light alloys, for which Haibachcorrection would not be required anyway.
At the other extreme, it is often believed that high amplitude cycles may be beneficial asthey induce favorable residual stresses at notches – in order to avoid this, which would lead tounconservative estimates, also these are eliminated from the spectra in most testing. In oursimple calculation, instead, we don’t take any account of these effects, neither for cracks andnotches, as we are aiming at very simple “design level” results. Moreover, in many cases, it is stilldebatable whether load spectra are known with sufficient accuracy, if cycle-counting methods(such as rainflow) are reliable (i.e. if load-sequence effects are not important), so this is whyMiner’s law is still very much used, and this is why we cannot expect our results to substitutetesting by all means. They are just going to suggest better ways to plot Gassner curves thanwhat presently done, and what we may expect when applying Miner’s rule according to CriticalDistance Method in complex situations, perhaps coming from Finite Element results of the stressfields. In most cases, we expect to be able to avoid the Finite Element analysis.
2 Gassner curves with unnotched material
Let us start with assuming Basquin’s law holds
NS (σS)k= N∞ [σL]
k= N [σ (N)]
k= CW (6)
where we have written the law also at the extreme points at which Basquin holds, i.e. at somevalue σS close to static strength with very low number of cycles NS , and at at the “fatigue limit”σL at N∞. Once again, in the variable amplitude case, we disregard the existence of the fatiguelimit, and extend Wohler line to infinity.
According to Miner’s rule for a given block with a total number of cycles per block Nc, damagewill be (using (6))
D =∑
(
ni
Ni
)α
=∑ ni
Nc
Nc
Ni= Nc
∑ αi
Ni=
Nc
CW
∑
αiσki (7)
4
where αi =ni
Ncis the proportion of cycles spent at level i on the total number Nc. The life under
the sum of all i blocks is N∗,1
N∗=
D
Nc=
1
CW
∑
αiσki (8)
Therefore, normalizing the block with the peak tension of the block σmax, so that σ∗ = βσmax
and we change the factor β to obtain a full Gassner curve, it follows
1
N∗ (σ∗)=
σ∗k
CW
∑
αi
(
σi
σmax
)k
=σ∗k
CWG (9)
where
G =∑
αi
(
σi
σmax
)k
(10)
is a “spectrum factor” which shifts the Basquin curve in the log-log diagram, or else we have theBasquin law (6) with a new
CV AW = CW /G (11)
Obviously, with G = 1 we return to the CA Wohler curves. We can also write this as
N
[
σ∗ (N)
G−1/k
]k
= CW (12)
or else we can plot the Gassner curve as superposed to the Wohler curve, if we use instead of theusual σ∗ (N) scale, the scale
σ∗ (N)
G−1/k(13)
which indeed will be used in all our subsequent plots, because we will see that this result willhave very wide and interesting generalizations. But already in this simple form, and despite thesimplicity of this result, it is not known to the authors that this result has been obtained before.
3 Gassner curve with a crack
From the introduction, we have recognized that in many cases (crack-like notches), intuitivelywhen notches are sufficiently “sharp”, the behaviour of a notch is not too dissimilar from that ofa crack. Let us assume the limit case of a Griffith crack in a infinite plate for which it is possibleto derive very simple results, which will inspire further numerical tests. The stress field, for theasymptotic region r → 0 is given by
σ (r) =KI√2πr
=σg
√πa
√2πr
(14)
where σg is the remote stress. The critical distance local approach suggests we should use σ (r (N))to evaluate fatigue life. In other words, we have a spectrum of σ∞,i values, which give a spectrumof σ (r (N)) values, where we take (either Ciavarella [12] or Susmel-Taylor variants [13-16]) acritical distance of the form
r (N) =a0 (N)
2=
A
2NB (15)
5
which is calibrated according to either some tests if available, or with some material constants.Substituting (15) into (14),
σi (r) =KI,i√2πr
=σg,i
√πa
√πANB
(16)
and for a given block, using Miner’s rule
1
N∗=
D
Nc=
1
CW
∑
αi
σg,i√πa
√
πA (N∗)B
k
=1
CW
√πa
√
πA (N∗)B
k∑
αi (σg,i)k
(17)
Notice that this equation has unknown N∗ but it is simple to solve
(N∗)Bk2
−1=
1
CW
( a
A
)k/2 ∑
αi (σg,i)k
(18)
Therefore, normalizing the block with the peak tension of the block σg,max, so that σ∗
g =βσg,max we can plot the Gassner curve
(
N∗(
σ∗
g
))Bk2
−1=
(
σ∗
g
)k
CW
( a
A
)k/2 ∑
αi
(
σg,i
σg,max
)k
=
(
σ∗
g
)k
CW
( a
A
)k/2
G (19)
where G remains as for the unnotched specimen. However, notice that the new curve can bewritten as
[
σ∗
g
]
k
1−Bk2 N∗ =
[
( a
A
)k/2 G
CW
]1
Bk2
−1
(20)
and therefore would have the same slope as Basquin only if 1− Bk2 = 1 i.e. if a0 stayed constant.
Otherwise, the slope is changed for the notch and is
kn =k
1− Bk2
(21)
Obviously, a larger notch (bigger a) implies a short life. Notice that the same curve can be writtenas
σ∗
g (N∗)
1−Bk2
k =
[
( a
A
)k/2 G
CW
]
−1
k
(22)
where sometimes the notation − 1k = b is used, especially in Coffin-Manson version of the Basquin
law. Notice that this means that, in terms of stress amplitude, the SN curve is shifted exactly of
the same amount of the unnotched SN curve when obtaining VA data. This is a second result ofthe present paper, although at the moment it only appears in a rather limit case of a crack. Butwe shall see that this result holds with an excellent degree of approximation also in much moregeneral conditions.
6
4 Examples
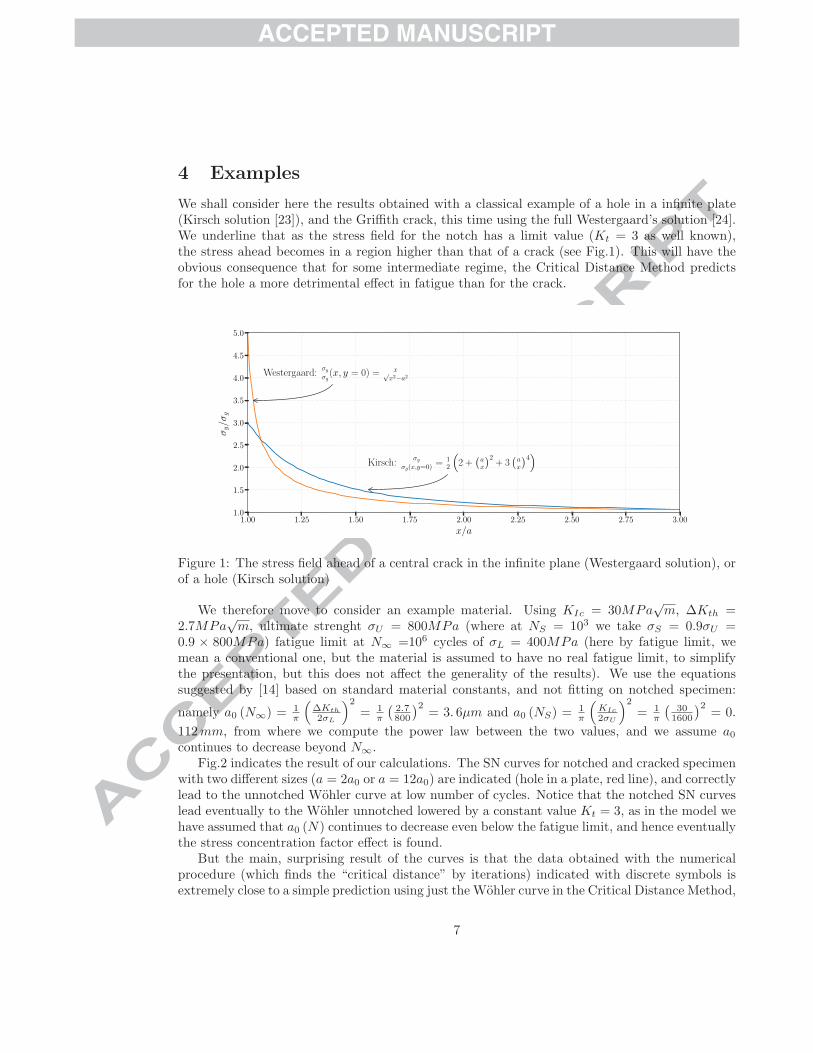
We shall consider here the results obtained with a classical example of a hole in a infinite plate(Kirsch solution [23]), and the Griffith crack, this time using the full Westergaard’s solution [24].We underline that as the stress field for the notch has a limit value (Kt = 3 as well known),the stress ahead becomes in a region higher than that of a crack (see Fig.1). This will have theobvious consequence that for some intermediate regime, the Critical Distance Method predictsfor the hole a more detrimental effect in fatigue than for the crack.
1.00 1.25 1.50 1.75 2.00 2.25 2.50 2.75 3.00
x/a
1.0
1.5
2.0
2.5
3.0
3.5
4.0
4.5
5.0
σy/σ
g
Kirsch:σy
σg(x,y=0)= 1
2
(
2 +(
ax
)2+ 3
(
ax
)4)
Westergaard:σyσg(x, y = 0) = x√
x2−a2
Figure 1: The stress field ahead of a central crack in the infinite plane (Westergaard solution), orof a hole (Kirsch solution)
We therefore move to consider an example material. Using KIc = 30MPa√m, ∆Kth =
2.7MPa√m, ultimate strenght σU = 800MPa (where at NS = 103 we take σS = 0.9σU =
0.9 × 800MPa) fatigue limit at N∞ =106 cycles of σL = 400MPa (here by fatigue limit, wemean a conventional one, but the material is assumed to have no real fatigue limit, to simplifythe presentation, but this does not affect the generality of the results). We use the equationssuggested by [14] based on standard material constants, and not fitting on notched specimen:
namely a0 (N∞) = 1π
(
∆Kth
2σL
)2
= 1π
(
2.7800
)2= 3. 6µm and a0 (NS) =
1π
(
KIc
2σU
)2
= 1π
(
301600
)2= 0.
112mm, from where we compute the power law between the two values, and we assume a0continues to decrease beyond N∞.
Fig.2 indicates the result of our calculations. The SN curves for notched and cracked specimenwith two different sizes (a = 2a0 or a = 12a0) are indicated (hole in a plate, red line), and correctlylead to the unnotched Wohler curve at low number of cycles. Notice that the notched SN curveslead eventually to the Wohler unnotched lowered by a constant value Kt = 3, as in the model wehave assumed that a0 (N) continues to decrease even below the fatigue limit, and hence eventuallythe stress concentration factor effect is found.
But the main, surprising result of the curves is that the data obtained with the numericalprocedure (which finds the “critical distance” by iterations) indicated with discrete symbols isextremely close to a simple prediction using just the Wohler curve in the Critical Distance Method,
7
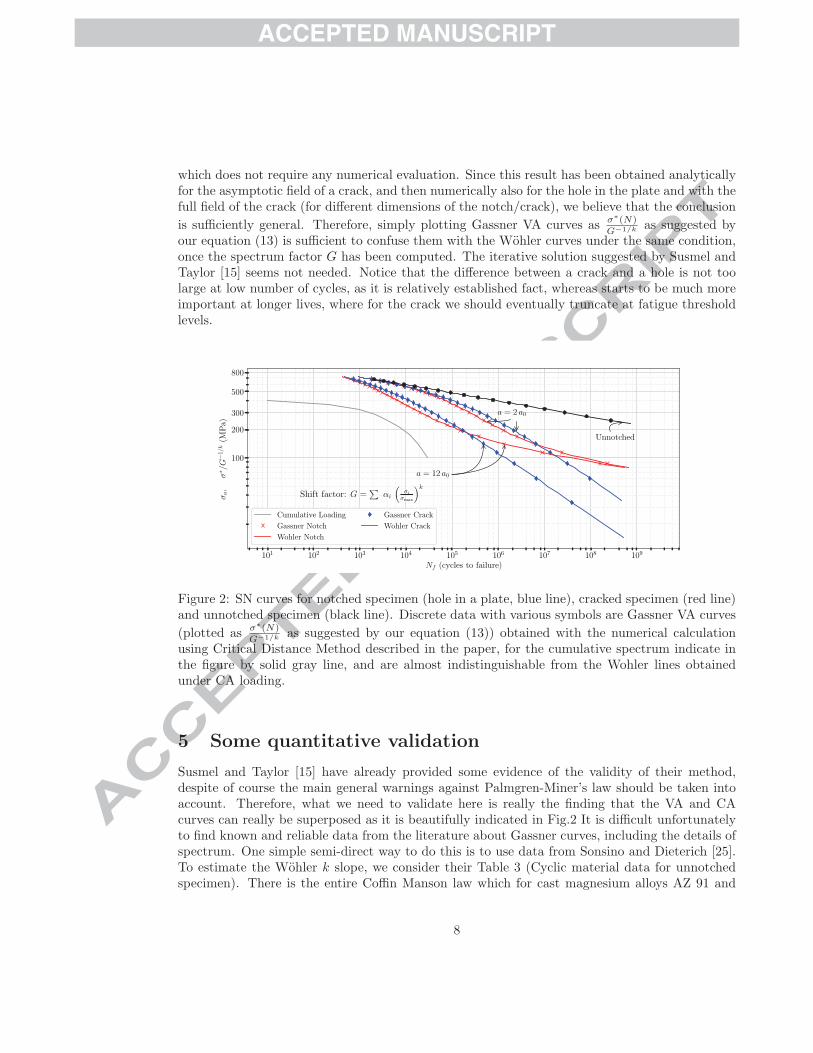
which does not require any numerical evaluation. Since this result has been obtained analyticallyfor the asymptotic field of a crack, and then numerically also for the hole in the plate and with thefull field of the crack (for different dimensions of the notch/crack), we believe that the conclusion
is sufficiently general. Therefore, simply plotting Gassner VA curves as σ∗(N)G−1/k as suggested by
our equation (13) is sufficient to confuse them with the Wohler curves under the same condition,once the spectrum factor G has been computed. The iterative solution suggested by Susmel andTaylor [15] seems not needed. Notice that the difference between a crack and a hole is not toolarge at low number of cycles, as it is relatively established fact, whereas starts to be much moreimportant at longer lives, where for the crack we should eventually truncate at fatigue thresholdlevels.
101 102 103 104 105 106 107 108 109
Nf (cycles to failure)
100
200
300
500
800
σa,
σ∗/G
−1/k(M
Pa)
Shift factor: G =∑
αi
(
σiσmax
)k
a = 2 a0
a = 12 a0
Unnotched
Cumulative Loading
Gassner Notch
Wohler Notch
Gassner Crack
Wohler Crack
Figure 2: SN curves for notched specimen (hole in a plate, blue line), cracked specimen (red line)and unnotched specimen (black line). Discrete data with various symbols are Gassner VA curves
(plotted as σ∗(N)G−1/k as suggested by our equation (13)) obtained with the numerical calculation
using Critical Distance Method described in the paper, for the cumulative spectrum indicate inthe figure by solid gray line, and are almost indistinguishable from the Wohler lines obtainedunder CA loading.
5 Some quantitative validation
Susmel and Taylor [15] have already provided some evidence of the validity of their method,despite of course the main general warnings against Palmgren-Miner’s law should be taken intoaccount. Therefore, what we need to validate here is really the finding that the VA and CAcurves can really be superposed as it is beautifully indicated in Fig.2 It is difficult unfortunatelyto find known and reliable data from the literature about Gassner curves, including the details ofspectrum. One simple semi-direct way to do this is to use data from Sonsino and Dieterich [25].To estimate the Wohler k slope, we consider their Table 3 (Cyclic material data for unnotchedspecimen). There is the entire Coffin Manson law which for cast magnesium alloys AZ 91 and
8
AM50 and strain ratio R = −1, 0 — gives a slope factors of very similar value k ' 5.60 to k ' 5.This is extremely close to the slope kn = 5 for the notched data (Kt = 2.5 in Fig.7,8,9 underboth R = −1, 0 ratio, for all alloys. We therefore notice:-
• the slope of Gassner curve for notched data is indeed unchanged from CA or VA loading, seeFig.6,8,9 of [25] i.e. in the entire set of data, and within the measured life intervals (obviouslynear static failure, we expect Wohler and Gassner curves to start off from virtually the samepoint). This confirms, independently, the (20) and (9) curve exponents
• From (21), 1 − Bk2 = k
kn= 5.6
5 = 1.12 or B = − 0.12×25.6 = −0.0429. This could be used to
further quantitative estimates.
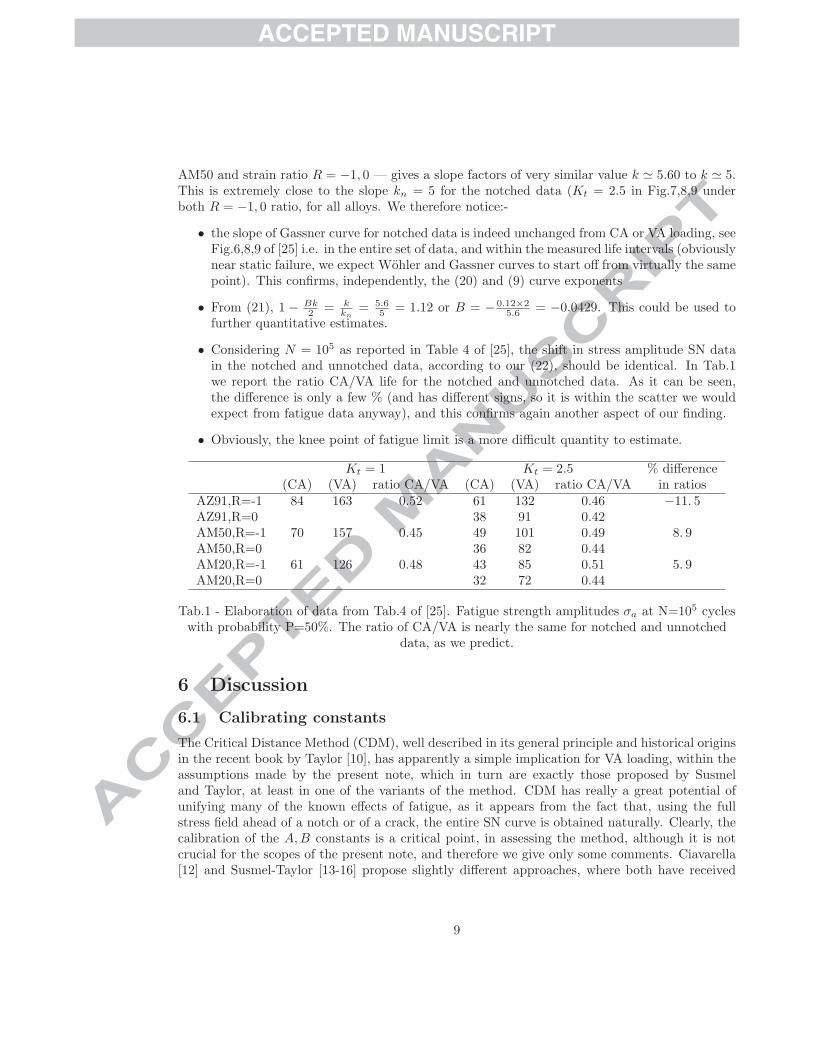
• Considering N = 105 as reported in Table 4 of [25], the shift in stress amplitude SN datain the notched and unnotched data, according to our (22), should be identical. In Tab.1we report the ratio CA/VA life for the notched and unnotched data. As it can be seen,the difference is only a few % (and has different signs, so it is within the scatter we wouldexpect from fatigue data anyway), and this confirms again another aspect of our finding.
• Obviously, the knee point of fatigue limit is a more difficult quantity to estimate.
Kt = 1 Kt = 2.5 % difference(CA) (VA) ratio CA/VA (CA) (VA) ratio CA/VA in ratios
AZ91,R=-1 84 163 0.52 61 132 0.46 −11. 5AZ91,R=0 38 91 0.42AM50,R=-1 70 157 0.45 49 101 0.49 8. 9AM50,R=0 36 82 0.44AM20,R=-1 61 126 0.48 43 85 0.51 5. 9AM20,R=0 32 72 0.44
Tab.1 - Elaboration of data from Tab.4 of [25]. Fatigue strength amplitudes σa at N=105 cycleswith probability P=50%. The ratio of CA/VA is nearly the same for notched and unnotched
data, as we predict.
6 Discussion
6.1 Calibrating constants
The Critical Distance Method (CDM), well described in its general principle and historical originsin the recent book by Taylor [10], has apparently a simple implication for VA loading, within theassumptions made by the present note, which in turn are exactly those proposed by Susmeland Taylor, at least in one of the variants of the method. CDM has really a great potential ofunifying many of the known effects of fatigue, as it appears from the fact that, using the fullstress field ahead of a notch or of a crack, the entire SN curve is obtained naturally. Clearly, thecalibration of the A,B constants is a critical point, in assessing the method, although it is notcrucial for the scopes of the present note, and therefore we give only some comments. Ciavarella[12] and Susmel-Taylor [13-16] propose slightly different approaches, where both have received
9
some validation with respect to experimental data. In the case of a large crack in a infinite plate,we derived in Ciavarella [12] that Susmel-Taylor best-fitting “free constants” would be
A =1
2πC
2/mK /C
2/kW (23)
B = 2 (1/r + 1/k) (24)
where CW is the Wohler-Basquin constant in (6), k is the slope of the Basquin SN curve, and thereis only one free parameter in our approach, namely the constant r, which we estimate roughly tobe of the order of Paris’ constant. Indeed, the other constant, CK came in Ciavarella [12] fromassuming a second power law
N ′
S (∆KIc)r= N ′
∞[∆Kth]
r= CK (25)
where r was therefore the Paris law constant. This is very close to the method Susmel-Taylorsuggest as we used in the example, by defining a power law between two values of a0.
Notice that some complications arise in the presence of fatigue limits. The true knee points canvary considerably in the presence of notches, and this where inevitably some approximation willappear. Equation (25) essentially replaces Paris’ law since it is equivalent to an integrated crackpropagation law, resulting in a SN curve. Notice however the absence in (25) of any informationon the size of the crack itself, in contrast to the established Paris’ law.
Obviously if we only make use of material constants, without calibration of notched fatiguedata, the approach is easier to use. It is possible however that calibrating with notched datacould be more precise (as Susmel-Taylor seem to suggest).
In some cases, the Gassner curve is seen to have a slope which differs from Wohler law — thismay be a sign of invalidity of the Palmgren Miner’s rule: indeed, the simple use of non-unitaryvalue of critical damage sum doesn’t change the slope of Gassner curves. Unfortunately, despitesome data are available in the literature indicating a (rather modest) change of slope [26], theyare not sufficiently detailed for us to comment on the frequency and relevance of this effect.
7 Conclusions
We show that the SN curves under CA or VA loading can be obtained by a simple shift factor,which depends on the spectrum histogram, within the assumptions of Palmgren-Miner’s law. Thisholds true for both unnotched and notched specimen, and seems confirmed by some experimentaldata taken from the Literature. The finding is based on a Critical Distance simple methodproposed and validated by Susmel-Taylor. However, in light of this result, there is no need toapply the iterative calculations Susmel-Taylor propose, as the VA curves can be obtained directlyfrom the CA curves, for which many proposals have already been put forward, also in closed form.Even the computation of the stress field from Finite Element Method does not seem necessaryin many cases, as it does not add much accuracy to a problem where the number of assumptionsis already quite strong, and more important, than the details of the stress field. As a firstapproximation, spectrum loading effects in notched or even cracked structures can be estimatedeasily from reduced amount of testing.
10
8 References
[1] Suresh S. (1998) Fatigue of Materials, 2nd Edition, Cambridge University Press, Cambridge.[2] Fuchs HO , Stephens RI , (1980), Metal Fatigue in Engineering, John Wiley & Sons, New
York.
[3] Radaj, D. Ermudungsfestigkeit (Fatigue strength, in German), 2nd edition, 2003. Springer,Berlin, Heidelberg, NewYork.
[4] Juvinall RC, Marshek, KM (2006), Fundamentals of Machine Component Design, 4thEdition, John Wiley & Sons, New York
[5] Smith, R.A. and Miller, K.J. (1978). Prediction of fatigue regimes in notched components.International Journal of Mechanical Sciences 20, 201–206
[6] Paris P. and Erdogan F. (1963), A critical analysis of crack propagation laws, Journalof Basic Engineering, Transactions of the American Society of Mechanical Engineers, December1963, 528-534.
[7] Nicholas T. , (2006). High Cycle Fatigue: A Mechanics of Materials Perspective, ElsevierScience.
[8] Kitagawa H. , Takahashi S. , (1976), Applicability of fracture mechanics to very smallcracks or cracks in the early stage. In Proc. 2nd Int. Conf. on Mech. behaviour of Matls, ASM,pp. 627-631.
[9] El Haddad MH , Dowling NE , Topper TH , Smith KN , (1980) J integral applicationsfor short fatigue cracks at notches, International Journal of Fracture Volume 16, Number 1 pag.15-30
[10] Taylor D (2007), The Theory of Critical Distances: a new perspective in fracture me-chanics. Amsterdam: Elsevier; 2007.
[11] Ciavarella M, Meneghetti G, (2004) On fatigue limit in the presence of notches: classicalvs. recent unified formulations, International Journal of Fatigue, Volume 26, Issue 3, Pages289-298
[12] Ciavarella, M. “A simple approximate expression for finite life fatigue behaviour in thepresence of ‘crack-like’or ‘blunt’notches.” Fatigue & Fracture of Engineering Materials & Struc-tures 35, no. 3 (2012): 247-256.
[13] Susmel L and Taylor D (2008) On the use of the theory of critical distances to predictstatic failures in ductile metallic materials containing different geometrical features, Engng FractMech. Volume 75, Issue 15, October 2008, Pages 4410-4421
[14] Susmel L and Taylor D (2007), A novel formulation of the theory of critical distances toestimate lifetime of notched components in the medium-cycle fatigue regime, Fat Fract Eng MatStruct 30, 567–581.
[15] Susmel, L., & Taylor, D. (2011). The Theory of Critical Distances to estimate lifetimeof notched components subjected to variable amplitude uniaxial fatigue loading. InternationalJournal of Fatigue, 33(7), 900-911.
[16] Susmel, L., & Taylor, D. (2012). A critical distance/plane method to estimate finite life of
notched components under variable amplitude uniaxial/multiaxial fatigue loading. InternationalJournal of Fatigue, 38, 7-24.
11
[17] Haibach E (2003) Analytical stress assessment of components in mechanical engineering,5th revised edition VDMA, Frankfurt.
[18] Sonsino, C. M. (2007). Fatigue testing under variable amplitude loading. InternationalJournal of Fatigue, 29(6), 1080-1089.
[19] Sonsino, C. M. (2005). Principles of variable amplitude fatigue design and testing. In Fa-tigue Testing and Analysis Under Variable Amplitude Loading Conditions. ASTM International.
[20] Schijve, J. Fatigue of structures and materials. Dordrecht: Kluwer Academic, 2001.[21] Tomblin, J., & Seneviratne, W. (2011). Determining the fatigue life of composite air-
craft structures using life and load-enhancement factors. Final report, Air Traffic Organization,Washington DC, USA.
[22] Haibach E. Betriebsfestigkeit-Verfahren und Daten zur Bauteiberechnung, Dusseldorf:VDI. 1989.
[23] Kirsch, E.G., (1898) Die Theorie der Elastizitat und die Bedurfnisse der Festigkeitslehre,Zeitschrift des Vereines deutscher Ingenieure, Vol. 42, pp. 797-807.
[24] Westergaard, H.M. (1939) “Bearing Pressures and Cracks,” Journal of Applied Mechanics,Vol. 6, pp. A49-53.
[25] Sonsino, C. M., & Dieterich, K. (2006). Fatigue design with cast magnesium alloys underconstant and variable amplitude loading. International journal of fatigue, 28(3), 183-193.
[26] Sonsino, C. M. (2007). Fatigue testing under variable amplitude loading. InternationalJournal of Fatigue, 29(6), 1080-1089.
12

!"#$%"#&$' ()* *+,"+-
! .+ )/&0"1 20''1+* 34*,+' 4'"1# &$+ '"56%+ 70%5#*+189"1+*:' %0- 01;7)"1& <*"&"30% ="'&013+ 9+&$);
! .+ >1; ?+"&$+* 010%@&"30%%@ )* 145+*"30%%@A 20''1+* 34*,+ 0*+ '"56%@'$"(&+; <B 34*,+'C
! D6+3&*45 %)0;"1# *+'4%&' "1 &$+ '05+ 54%&"6%"30&",+ &+*5 ()* 1)&3$+;E3*03F+; 01; 411)&3$+; '6+3"5+1C
! B '"56%+ +56"*"30% 41">+; 066*)03$ ()* *06"; 0''+''5+1& )( &$+ 1)&3$+G+3& 41;+* *01;)5 %)0;"1# "' 6*)6)'+;
! HI6+*"5+1&0% ;0&0 (*)5 &$+ J"&+*0&4*+ '++5 &) 3)1>*5 &$+'+ '"56%+ >1;8"1#'E ;+'6"&+ &$+ '&*)1# 0''456&")1'
! K$+ "&+*0&",+ ')%4&")1 '4##+'&+; /@ D4'5+% 01; K0@%)* '++5' 1)& 1++;+;C
L