Embed Size (px)
Citation preview
Int J Mater FormDOI 10.1007/s12289-013-1127-x
ORIGINAL RESEARCH
A simple ductile failure model with application to AA5182aluminium sheet forming
Holger Aretz · Stefan Keller · Olaf Engler ·Henk-Jan Brinkman
Received: 23 January 2013 / Accepted: 22 February 2013© Springer-Verlag France 2013
Abstract In the present work the recently introducedJoined Ductile Failure (JDF) model has been slightlyimproved and is applied to sheet forming of an AA5182 alu-minium alloy. Despite its simplicity the validation examplesdocumented in the present work reveal that the JDF model isable of accurately predicting the onset as well as the locationof ductile failure.
Keywords Necking · Post-necking · Fracture · Sheetforming · Finite element analysis
Introduction
Computational simulations based on the finite elementmethod (FEM) are nowadays routinely used to design sheetmetal forming operations. A sheet forming operation hasto be successful in the sense that the desired part can beproduced without defects. However, every material has alimited formability when being subjected to stretch forming,because at a critical strain the deformation becomes unsta-ble which leads to localized necking followed by fracture.For some alloys fracture is even observed without preced-ing necking, in particular for deformation under equibiaxialstretching (see e.g. [32, p. 322] and [28]) or when the thick-ness of the sheet increases due to mixed tensile-compressiveloading.
H. Aretz (�) · S. Keller · O. Engler · H.-J. BrinkmanHydro Aluminium Rolled Products GmbH,Research & Development, Georg-von-Boeselager-Str. 21,53117 Bonn, Germanye-mail: [email protected]
The onset of necking is affected by various parameters(see e.g. [24, 32, 52, 65]), of which some are discussed inthe following:
Initial yield strength: By means of a theoretical model itwas shown in [36] that the onset of necking is delayedwhen the initial yield strength is reduced. This findingcan be explained as follows. As a rough estimation offormability we use the well-known maximum force cri-terion of Considere [52]. In terms of the hardening curveexpressed in the true stress—true strain diagram the Con-sidere criterion states that necking sets in when the slopeof this curve intersects the hardening curve [33, pp. 68–69]. We consider now two materials ‘A’ and ‘B’, whichare basically identical, except for the hardening curveof ‘A’ which is assumed of being entirely shifted rela-tive to that of ‘B’ by a constant stress. The slope of thehardening curves is the same, because it is not alteredby a constant stress shift. The result is now that for thesofter material the slope curve intersects the correspond-ing hardening curve at larger plastic strains than for theharder material. That is, the softer the material the laternecking sets in.
This finding is very difficult to verify by means ofexperiments, because it is not easy to change the ini-tial yield strength without altering other material features(e.g. hardening rate) at the same time. It is worth men-tioning that the said findings are compatible with theexplanations of Emmens [24, pp. 99–100] regarding theinfluence of additive strain-rate hardening contribution.
The initial yield strength is inversely related to thegrain size by the well-known Hall-Petch relationship (cf.[33, p. 184]), i.e. the larger the grain size, the lowerthe initial yield strength. Thus, by increasing the grainsize one may reduce the initial yield strength, thereby
Int J Mater Form
improving formability, provided that the strain-hardeningbehavior is not unfavorably altered.
Strain-hardening behavior: In general, localized neck-ing is delayed when the strain-hardening modulus (i.e.the slope of the stress-strain curve) increases and viceversa, see e.g. [15, 24, 32, 52].
Yield surface shape: The influence of the shape of theyield surface was investigated in [15, 16, 19, 26]. Theyield surface shape has a marked influence on neckingonly for the biaxial stretching regime. That is, the morerounded the yield surface is, the later necking sets in. Forexample, Barlat [15] showed that necking occurs veryearly when the Tresca’s yield function is used, whereassignificantly higher limit strains are obtained by using thevon Mises yield function. Furthermore, the evolution ofthe yield surface shape plays also a crucial role on theonset of necking, see e.g. [5, 63, 67].
Strain-rate sensitivity: Chung and Wagoner [20] (seealso [65, pp. 185–186]) studied the effect of strain-ratesensitivity in uniaxial tensile tests. They found that themaximum load strain (i.e. the onset of diffuse necking)was almost unaffected by the strain-rate sensitivity of thematerial, whereas its influence on the post-uniform strainwas significant. That is, the higher the strain-rate sensitiv-ity exponent, the more increases the post-uniform strain,because the formation of a localized neck is delayed.Interestingly, the values reported in Table 1 of the paperof Chung and Wagoner [20] reveal that the influenceof strain-rate sensitivity on the maximum load straindoes not follow a unique trend, since in some casesthe maximum load strains declined while the strain-ratesensitivity parameter increased. The delaying effect ofpositive strain-rate sensitivity on localized necking wasalso found in the recent work of Signorelli et al. [58].
On the other hand, the theoretical analysis of Emmens[24, pp. 99–100] reveals that an additive strain-rate hard-ening contribution actually decreases the necking strainin uniaxial tension, whereas a multiplicative contributionleaves it unaltered. Thus, depending on the constitutivemodel and its associated material parameters additivestrain-rate hardening may be detrimental to formabil-ity, but this becomes only appreciable at extremely highstrain-rates beyond conventional sheet forming.
Sheet thickness: In a very interesting work Suh et al.[62] experimentally studied the influence of the sheetthickness on formability under uniaxial tension. Theyreduced the thickness of the investigated samples by etch-ing, which leaves the microstructure unchanged. Theyshowed that the fracture strain declines drastically whenthe sheet thickness decreases. Furthermore, in Fig. 4 oftheir paper [62] they showed that the orientation of theneck depends on the sheet thickness as well: for thinsheets (in their work below a thickness of 1.4 mm) the
neck orientation is inclined to the tensile axis, whichagrees qualitatively with Hill’s theory of localized neck-ing [31]. However, for larger thicknesses Suh et al. [62]observed that the neck is normal to the tensile axis, whichclearly contradicts Hill’s theory.
Relative grain size: As the ‘relative grain size’ we definethe (characteristical) grain size devided by the sheetthickness. The influence of the relative grain sizeincreases as either the sheet thickness decreases or thegrain size increases. For example, very thin aluminiumfoils in the soft-annealed condition (a typical product forliquid packaging applications) have a typical thicknessof about 6 − 7 μm and possess only about one grainacross the foil thickness. As a consequence, when strainlocalization takes place in a single grain, then this strainlocalization immediately affects the entire foil thickness,which leads to premature failure in tensile testing. Incontrast, in conventional polycrystalline sheet metals thestrain localization in a single grain does not immediatelycover the entire sheet thickness. Thus, for necking to takeplace in polycrystalline materials a necessary conditionseems to be that strain localizes in more than just onegrain across the thickness.
Contact normal pressure: Contact normal pressure dueto die contact can improve formability, because the neg-ative normal contact stress delays necking [14, 55]. Thereason for this is as follows: in order to satisfy the yieldcondition in rate-independent plasticity the presence ofnormal pressure forces the in-plane stresses to decline(see also [24, p. 42]). In other words, normal pressurecauses a ‘relaxation’ of the in-plane loading, therebyincreasing formability.
Due to its paramount practical importance the predictionof failure strains and stresses has a long history in vari-ous engineering disciplines, such as metal forming and civilengineering. In order to predict material failure in FEManalyses of sheet forming processes correctly a dedicatedmodel must be used. In the field of sheet metal forming acomprehensive failure model must be able to describe neck-ing, post-necking and fracture. As explained above neckingand fracture are not necessarily linked to each other. Thus,the failure model should be able to predict fracture evenwithout preceding necking.
In the context of modelling of localized necking themodel of Hill [31] for negative minor in-plane strains andthe model of Marciniak & Kuczynski [50, 51] for the regimeof positive minor in-plane strains are the most recognizedones. In [7, 10] an approach was developed to join bothmodels, which is also used in the present work.
Regarding modelling of ductile fracture a compilation ofnumerous models and, most importantly, a critical testingthereof may be found in the works of Clift et al. [22, 23],
Int J Mater Form
of Wierzbicki et al. [18, 45, 46, 66, 68], of Jain et al. [34],of Ozturk et al. [57] and of Oyane et al. [56]. Differentfracture modelling approaches, such as pheomenologicalmodels and models based on continuum damage mechanics,are summarized in the textbook of Lemaitre and Desmorat[44]. Most recently, a phenomenological ductile fracturemodel was proposed by Khan and Liu [37]; it is based ona quadratic function of the first invariant of the Cauchystress tensor. Further recent fracture models were proposedby Chung et al. [21], by Lou et al. [48] as well as by Grubenet al. [29]. A more comprehensive ductile failure modelthat connects necking and fracture was proposed in an ear-lier work of the present authors [6] as well as by Li et al.[45, 46] and by Stoughton and Yoon [61].
A remarkably simple phenomenological failure model,coined as the ‘Joined Ductile Failure’ (JDF) model, wasrecently developed by the present authors (cf. [9]). The JDFmodel was also used in the present work. A characteristicalfeature of the JDF model is that it links necking and fracture.Furthermore, unlike the approaches proposed in an earlierwork of the present authors [6] as well as the approach ofStoughton and Yoon [61] the applicability of the JDF modelis not limited to shell finite elements. That is, the JDF modelcan be as well used in conjunction with solid finite elements.The JDF model was designed on the basis of practical needs,in particular with respect to the constraints of (i) involvingas less model parameters as possible and (ii) a user-friendlycalibration. In [9] it was shown that the JDF model is able ofaccurately predicting failure in many practical cases for analuminium alloy of the AA6xxx series, but no claim is madethat it can describe all of the complicated details of ductilefracture. In the present work the JDF model is applied to analuminium alloy of the AA5xxx series.
The mentioned JDF model was implemented in the com-mercial FEM codes ABAQUS/Standard1 (implicit globalsolution scheme) and ABAQUS/Explicit (dynamic explicitglobal solution scheme) via the user material subroutines‘UMAT’ and ‘VUMAT’, respectively. In the present workall simulations were performed using ABAQUS/Explicit(version 6.12-1). Unless stated otherwise the results pre-sented in this paper were obtained using double precisionarithmetics.
Summary of the elastic-plastic constitutive model
In the present work the constitutive behavior of the sheetmetal is described by means of a rate-independent elastic-plastic constitutive model, which is briefly outlined in thefollowing. For further details the reader is referred to thereferences [3, 5, 7, 9].
1ABAQUS is a trademark of Dassault Systemes.
– The additive decomposition of the total strain increment�ε in an elastic portion �εe and a plastic one �εp isemployed [35, p. 70]:
�ε = �εe + �εp (1)
Note that a co-rotational finite strain framework isapplied, i.e. the strain and stress tensors are definedin a co-rotating material frame that remains orthonor-mal for all times. Throughout the present work the1-axis denotes the rolling direction, the 2-axis the sheettransverse direction and the 3-axis the sheet thicknessdirection.
– Assuming isotropic elasticity �εe is associated with astress increment given by the generalized Hooke law oflinear elasticity:
�σ = C(E, ν) : �εe (2)
with the Young modulus E and the Poisson ratio ν.Throughout the present work the symbol σ denotes thetensor of the Cauchy stress.
– The plastic strain increment �εp is obtained from thegeneral flow-rule (see e.g. [2, 4])
�εp = �ε · ∂σ
∂σ(3)
Herein, σ and �ε denote the equivalent stress and theequivalent plastic strain increment, respectively, whichare assumed to be work-conjugate in the sense
σ · �ε = σ : �εp (4)
Furthermore, the plastic deformation is assumed ofbeing isochoric [35, p. 70]:
�εp
11 + �εp
22 + �εp
33 = 0 (5)
– The domain of elastic stress-states is bounded by theyield surface. The yield surface, in turn, is mathe-matically described by means of the yield function F
defined as
F(σ , ε) = σ (σ ) − Yref(ε) ≤ 0, ε =∫
dε (6)
with the reference yield stress Yref and the accumulatedequivalent plastic strain ε.
– Post-yielding is described using the isotropic harden-ing theory [35, p. 79]. In the present work, the referenceyield stress Yref is represented by an extended Vocemodel (similar to [43]) given by
Yref(ε) = A + (B + C · ε)×(1 − exp(−D/B · ε))MPa, B �= 0 (7)
A, B, C, D denote material-dependent parameters thatcan be obtained by numerical regression of experimen-tal data.
Int J Mater Form
It is very common that rolled sheet metals are orthotropicwith respect to their plastic properties. In the present work,plastic orthotropy is modelled using the recent orthotropicyield function ‘Yld2011-27p’ [11, 12]. Accordingly, theequivalent stress σ is specified as follows [11, 12]:
σ (σ ) =⎧⎨⎩
1
ξ·⎡⎣ 3∑
i=1
3∑j=1
|S ′i + S ′′
j |m +3∑
i=1
|S ′′′i |m
⎤⎦
⎫⎬⎭
1/m
(8)
with
ξ = (4/3)m + 5 · (2/3)m + 6 · (1/3)m (9)
With respect to Eq. (8) the symbols S ′i , S ′′
i , S ′′′i , i = 1, 2, 3,
denote the principal values of the three linearly transformedstress-deviators
S ′ = C′ : s, S′′ = C′′ : s, S ′′′ = C′′′ : s (10)
Herein, s is the deviator of the Cauchy stress. In matrixnotation the linear transformations are defined as follows(cf. [1, 11, 12, 17]):⎧⎪⎪⎪⎪⎪⎪⎨⎪⎪⎪⎪⎪⎪⎩
S ′11
S ′22
S ′33
S ′23
S ′31
S ′12
⎫⎪⎪⎪⎪⎪⎪⎬⎪⎪⎪⎪⎪⎪⎭
=
⎡⎢⎢⎢⎢⎢⎢⎣
0 −c′12 −c′
13 0 0 0−c′
21 0 −c′23 0 0 0
−c′31 −c′
32 0 0 0 00 0 0 c′
44 0 00 0 0 0 c′
55 00 0 0 0 0 c′
66
⎤⎥⎥⎥⎥⎥⎥⎦
·
⎧⎪⎪⎪⎪⎪⎪⎨⎪⎪⎪⎪⎪⎪⎩
s11
s22
s33
s23
s31
s12
⎫⎪⎪⎪⎪⎪⎪⎬⎪⎪⎪⎪⎪⎪⎭
(11)
and likewise for the remaining two transformations. Con-vexity of the yield function is ensured for m ≥ 1.
An essential ingredient of the numerical implementationof elastic-plastic constitutive models is the computation ofthe stress state for a given strain increment. For details it isreferred to [3, 5, 7].
Summary of the ductile failure model
In what follows the main ingredients of the Joined Duc-tile Failure (JDF) model are summarized; for further detailssee [9].
In order to detect localized necking a calculated form-ing limit curve (FLC) in form of a look-up table is used(intermediate values are computed by means of linear inter-polation). The FLC is computed using the elastic-plasticnecking model described in [7, 10]. However, the conven-tional representation of the FLC in terms of the minor andmajor in-plane strain is strongly affected by the strain-path,see e.g. [28, 40, 41, 49, 53, 54]. Thus, a different represen-tation that is (at least almost) path-independent is prefer-able. A prominent alternative representation is the stress-based forming limit diagram, as advocated, for instance,by Stoughton [59, 60] and Arrieux [13]. However, as wasshown in [5], when the yield surface distorts during plastic
deformation the stress-based forming limit criterion shows astrong path-dependence as well. A path-independent form-ing limit criterion based on the equivalent plastic strain wasproposed in the work of Zeng et al. [69].
The utilized forming limit curve has the form “equivalentplastic strain at necking, εneck , as a function of the stresstriaxiality”, i.e.
εneck = f (σkk/σ ) (12)
This representation, which is very common in the context ofductile fracture modelling (see e.g. [42, p. 132] and [66]),has the following advantages:
1. It is path-independent if isotropic hardening applies,see [7].
2. It can be used in conjunction with both shell and con-tinuum finite elements, which is very convenient whenusers have to switch element types in their analyses.
In order to distinguish tensile and compressive loadingthe loading mode parameter α is defined according to
α := σ1 + σ2 + σ3
|σ1| + |σ2| + |σ3| , −1 ≤ α ≤ 1 (13)
σ1 ≥ σ2 ≥ σ3 denote the principal Cauchy stresses. Tensile(compressive) stress states are characterized by α = +1 (byα = −1), which is only possible when all principal stressesare positive (are negative). For −1 < α < 1 the stress stateis located between pure compression and pure tension. Inthe present work the loading mode parameter α plays animportant role in the detection of necking as well as in themodelling of fracture, see below.
Since necking can only take place under tensile loadinga specific strain measure is used to detect necking, namelythe equivalent plastic strain under tensile loading, denotedas εt . Accordingly, necking is said to occur when
εt
∣∣σkk/σ
≥ εneck(σkk/σ ) (14)
In contrast to the previous formulation in [9], the followingdefinition for εt is introduced in the present work:
εt =∫
dεt (15)
with
dεt ={
dε, if α ≥ 2/30, otherwise
(16)
The interpretation of Eq. (16) is as follows: the stress-stateis considered to be tensile when it is actually dominated bytensile stresses. In other words: the stress state is judged astensile only if there is much more tension than compres-sion. Note that a small contribution of compressive stressesshould be allowed to account, for example, for situationswhere normal pressure due to die contact is present, butnecking can not be ruled out in general. Compared to the
Int J Mater Form
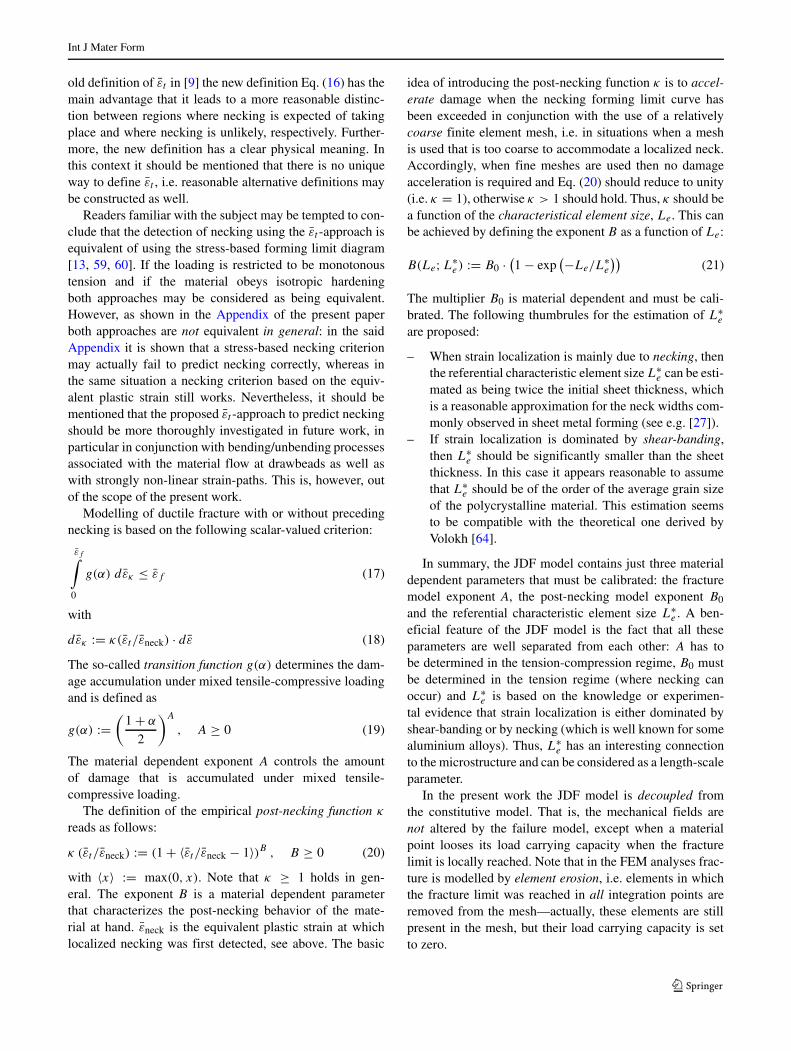
old definition of εt in [9] the new definition Eq. (16) has themain advantage that it leads to a more reasonable distinc-tion between regions where necking is expected of takingplace and where necking is unlikely, respectively. Further-more, the new definition has a clear physical meaning. Inthis context it should be mentioned that there is no uniqueway to define εt , i.e. reasonable alternative definitions maybe constructed as well.
Readers familiar with the subject may be tempted to con-clude that the detection of necking using the εt -approach isequivalent of using the stress-based forming limit diagram[13, 59, 60]. If the loading is restricted to be monotonoustension and if the material obeys isotropic hardeningboth approaches may be considered as being equivalent.However, as shown in the Appendix of the present paperboth approaches are not equivalent in general: in the saidAppendix it is shown that a stress-based necking criterionmay actually fail to predict necking correctly, whereas inthe same situation a necking criterion based on the equiv-alent plastic strain still works. Nevertheless, it should bementioned that the proposed εt -approach to predict neckingshould be more thoroughly investigated in future work, inparticular in conjunction with bending/unbending processesassociated with the material flow at drawbeads as well aswith strongly non-linear strain-paths. This is, however, outof the scope of the present work.
Modelling of ductile fracture with or without precedingnecking is based on the following scalar-valued criterion:
εf∫
0
g(α) dεκ ≤ εf (17)
with
dεκ := κ(εt /εneck) · dε (18)
The so-called transition function g(α) determines the dam-age accumulation under mixed tensile-compressive loadingand is defined as
g(α) :=(
1 + α
2
)A
, A ≥ 0 (19)
The material dependent exponent A controls the amountof damage that is accumulated under mixed tensile-compressive loading.
The definition of the empirical post-necking function κ
reads as follows:
κ (εt /εneck) := (1 + 〈εt /εneck − 1〉)B , B ≥ 0 (20)
with 〈x〉 := max(0, x). Note that κ ≥ 1 holds in gen-eral. The exponent B is a material dependent parameterthat characterizes the post-necking behavior of the mate-rial at hand. εneck is the equivalent plastic strain at whichlocalized necking was first detected, see above. The basic
idea of introducing the post-necking function κ is to accel-erate damage when the necking forming limit curve hasbeen exceeded in conjunction with the use of a relativelycoarse finite element mesh, i.e. in situations when a meshis used that is too coarse to accommodate a localized neck.Accordingly, when fine meshes are used then no damageacceleration is required and Eq. (20) should reduce to unity(i.e. κ = 1), otherwise κ > 1 should hold. Thus, κ should bea function of the characteristical element size, Le. This canbe achieved by defining the exponent B as a function of Le:
B(Le; L∗e ) := B0 · (
1 − exp(−Le/L
∗e
))(21)
The multiplier B0 is material dependent and must be cali-brated. The following thumbrules for the estimation of L∗
e
are proposed:
– When strain localization is mainly due to necking, thenthe referential characteristic element size L∗
e can be esti-mated as being twice the initial sheet thickness, whichis a reasonable approximation for the neck widths com-monly observed in sheet metal forming (see e.g. [27]).
– If strain localization is dominated by shear-banding,then L∗
e should be significantly smaller than the sheetthickness. In this case it appears reasonable to assumethat L∗
e should be of the order of the average grain sizeof the polycrystalline material. This estimation seemsto be compatible with the theoretical one derived byVolokh [64].
In summary, the JDF model contains just three materialdependent parameters that must be calibrated: the fracturemodel exponent A, the post-necking model exponent B0
and the referential characteristic element size L∗e . A ben-
eficial feature of the JDF model is the fact that all theseparameters are well separated from each other: A has tobe determined in the tension-compression regime, B0 mustbe determined in the tension regime (where necking canoccur) and L∗
e is based on the knowledge or experimen-tal evidence that strain localization is either dominated byshear-banding or by necking (which is well known for somealuminium alloys). Thus, L∗
e has an interesting connectionto the microstructure and can be considered as a length-scaleparameter.
In the present work the JDF model is decoupled fromthe constitutive model. That is, the mechanical fields arenot altered by the failure model, except when a materialpoint looses its load carrying capacity when the fracturelimit is locally reached. Note that in the FEM analyses frac-ture is modelled by element erosion, i.e. elements in whichthe fracture limit was reached in all integration points areremoved from the mesh—actually, these elements are stillpresent in the mesh, but their load carrying capacity is setto zero.
Int J Mater Form
Calibration of the material and the failure model
In the present work the material model outlined above wasapplied to an AA5182-O aluminium alloy (soft annealedcondition), which is typically used in automotive applica-tions. The experimental sampling points for the calibrationof the material model were determined by means of thefollowing experimental techniques:
– 7 uniaxial tensile tests in 0◦, 15◦, 30◦, . . . , 90◦ to theoriginal rolling direction. The initial yield stresses andr-values are used for the calibration of the materialmodel.
– 3 plane-strain tensile tests (using the specimen geome-try presented in [8]) in directions of 0◦, 45◦ and 90◦ tothe original rolling direction. The initial yield stressesare used for the calibration of the material model.
– 1 hydraulic bulge-test with full-field strain measure-ment (see [38] for details). The hardening curve aswell as the thickness strain at fracture are used for thecalibration of the material model.
The experimental data for the considered material are sum-marized in Table 1.
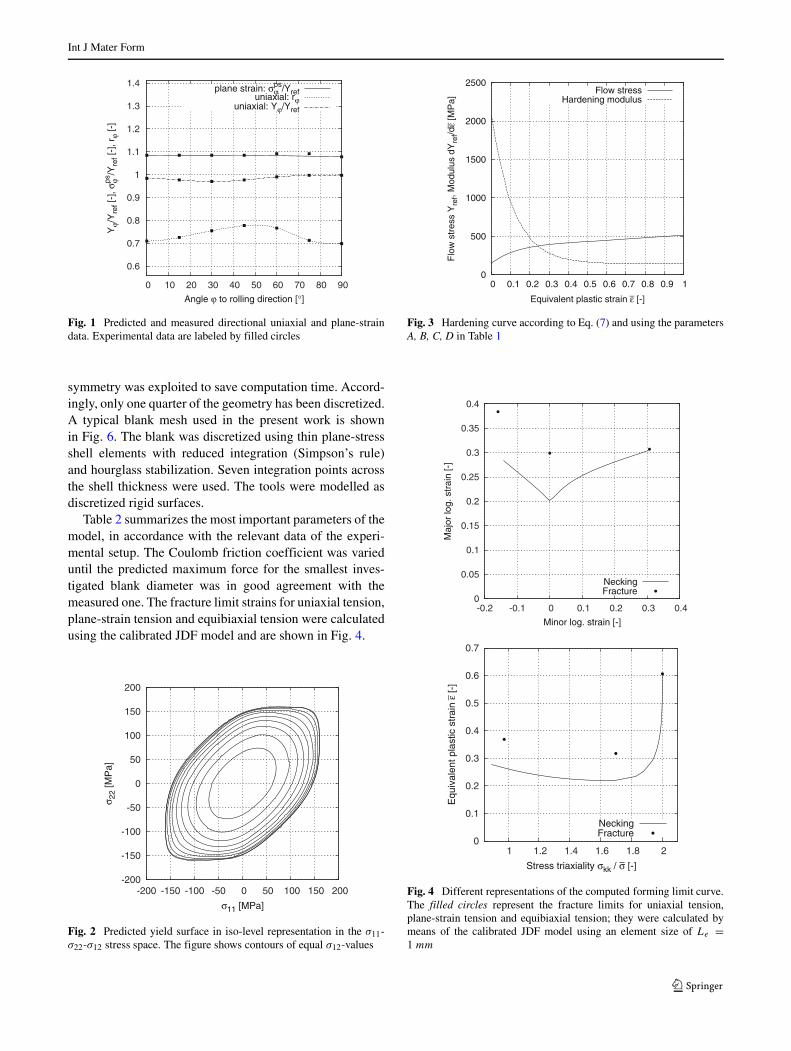
In the first step the yield function Yld2011 is calibratedto the experimental data in Table 1. It is seen in Fig. 1that the (weak) anisotropy of the material can be describedwith very good accuracy. The associated yield surface isshown in Fig. 2. A graphical representation of the harden-ing curve is provided in Fig. 3. By means of the localizednecking model proposed in [7, 10] the forming limit curvewas calculated for the present material (using a geometricalimperfection of 0.996 for the Marciniak-Kuczynski [50, 51]necking model). The predicted forming limit curve is shownin Fig. 4 using two equivalent representations. Note that inthe FEM analyses the representation in terms of the stresstriaxiality is used, as explained above.
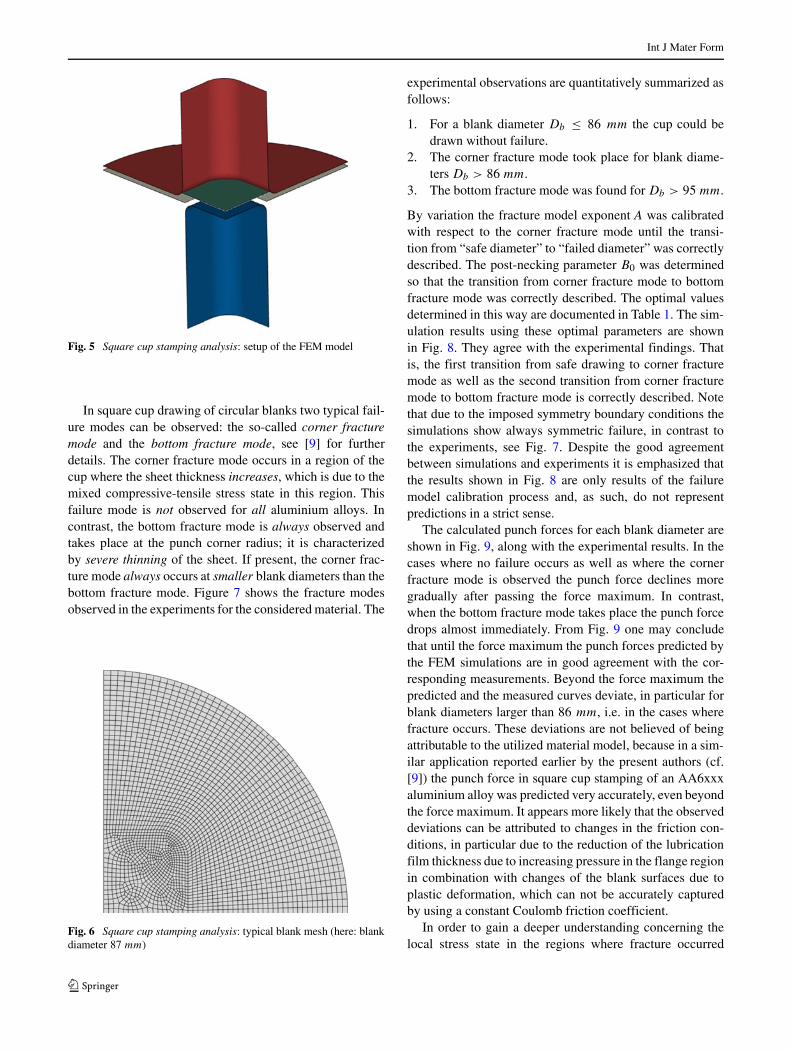
The calibration of the ductile failure model was per-formed using square cup stamping tests, as described in [9].In this procedure the diameter of the circular blank is incre-mentally increased in steps of 1 mm until failure occurs. Theblank-holder force is the same for all blank sizes. The setupof the FEM model is shown in Fig. 5. In the FEM analyses
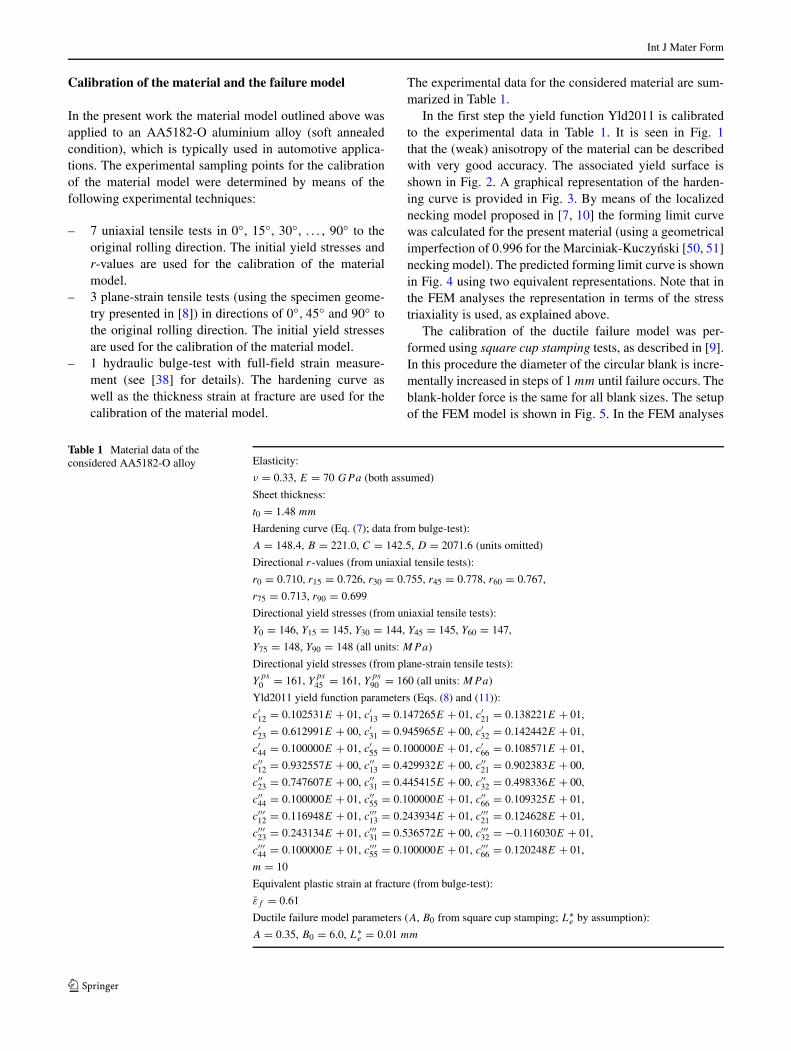
Table 1 Material data of theconsidered AA5182-O alloy Elasticity:
ν = 0.33, E = 70 GPa (both assumed)
Sheet thickness:
t0 = 1.48 mm
Hardening curve (Eq. (7); data from bulge-test):
A = 148.4, B = 221.0, C = 142.5, D = 2071.6 (units omitted)
Directional r-values (from uniaxial tensile tests):
r0 = 0.710, r15 = 0.726, r30 = 0.755, r45 = 0.778, r60 = 0.767,
r75 = 0.713, r90 = 0.699
Directional yield stresses (from uniaxial tensile tests):
Y0 = 146, Y15 = 145, Y30 = 144, Y45 = 145, Y60 = 147,
Y75 = 148, Y90 = 148 (all units: MPa)
Directional yield stresses (from plane-strain tensile tests):
Yps0 = 161, Y
ps45 = 161, Y
ps90 = 160 (all units: MPa)
Yld2011 yield function parameters (Eqs. (8) and (11)):
c′12 = 0.102531E + 01, c′
13 = 0.147265E + 01, c′21 = 0.138221E + 01,
c′23 = 0.612991E + 00, c′
31 = 0.945965E + 00, c′32 = 0.142442E + 01,
c′44 = 0.100000E + 01, c′
55 = 0.100000E + 01, c′66 = 0.108571E + 01,
c′′12 = 0.932557E + 00, c′′
13 = 0.429932E + 00, c′′21 = 0.902383E + 00,
c′′23 = 0.747607E + 00, c′′
31 = 0.445415E + 00, c′′32 = 0.498336E + 00,
c′′44 = 0.100000E + 01, c′′
55 = 0.100000E + 01, c′′66 = 0.109325E + 01,
c′′′12 = 0.116948E + 01, c′′′
13 = 0.243934E + 01, c′′′21 = 0.124628E + 01,
c′′′23 = 0.243134E + 01, c′′′
31 = 0.536572E + 00, c′′′32 = −0.116030E + 01,
c′′′44 = 0.100000E + 01, c′′′
55 = 0.100000E + 01, c′′′66 = 0.120248E + 01,
m = 10
Equivalent plastic strain at fracture (from bulge-test):
εf = 0.61
Ductile failure model parameters (A, B0 from square cup stamping; L∗e by assumption):
A = 0.35, B0 = 6.0, L∗e = 0.01 mm
Int J Mater Form
0.6
0.7
0.8
0.9
1
1.1
1.2
1.3
1.4
0 10 20 30 40 50 60 70 80 90
Yϕ/
Yre
f [-]
, σϕps
/Yre
f [-]
, rϕ
[-]
Angle ϕ to rolling direction [°]
plane strain: σϕps/Yref
uniaxial: rϕuniaxial: Yϕ/Yref
Fig. 1 Predicted and measured directional uniaxial and plane-straindata. Experimental data are labeled by filled circles
symmetry was exploited to save computation time. Accord-ingly, only one quarter of the geometry has been discretized.A typical blank mesh used in the present work is shownin Fig. 6. The blank was discretized using thin plane-stressshell elements with reduced integration (Simpson’s rule)and hourglass stabilization. Seven integration points acrossthe shell thickness were used. The tools were modelled asdiscretized rigid surfaces.
Table 2 summarizes the most important parameters of themodel, in accordance with the relevant data of the experi-mental setup. The Coulomb friction coefficient was varieduntil the predicted maximum force for the smallest inves-tigated blank diameter was in good agreement with themeasured one. The fracture limit strains for uniaxial tension,plane-strain tension and equibiaxial tension were calculatedusing the calibrated JDF model and are shown in Fig. 4.
-200
-150
-100
-50
0
50
100
150
200
-200 -150 -100 -50 0 50 100 150 200
σ 22
[MP
a]
σ11 [MPa]
Fig. 2 Predicted yield surface in iso-level representation in the σ11-σ22-σ12 stress space. The figure shows contours of equal σ12-values
0
500
1000
1500
2000
2500
0 0.1 0.2 0.3 0.4 0.5 0.6 0.7 0.8 0.9 1
Flo
w s
tres
s Y
ref,
Mod
ulus
dY
ref/d
ε−[M
Pa]
Equivalent plastic strain ε− [-]
Flow stressHardening modulus
Fig. 3 Hardening curve according to Eq. (7) and using the parametersA, B, C, D in Table 1
0
0.05
0.1
0.15
0.2
0.25
0.3
0.35
0.4
-0.2 -0.1 0 0.1 0.2 0.3 0.4
Maj
or lo
g. s
trai
n [-
]
Minor log. strain [-]
NeckingFracture
0
0.1
0.2
0.3
0.4
0.5
0.6
0.7
1 1.2 1.4 1.6 1.8 2
Equ
ival
ent p
last
ic s
trai
n ε−
[-]
Stress triaxiality σkk / σ− [-]
NeckingFracture
Fig. 4 Different representations of the computed forming limit curve.The filled circles represent the fracture limits for uniaxial tension,plane-strain tension and equibiaxial tension; they were calculated bymeans of the calibrated JDF model using an element size of Le =1 mm
Int J Mater Form
Fig. 5 Square cup stamping analysis: setup of the FEM model
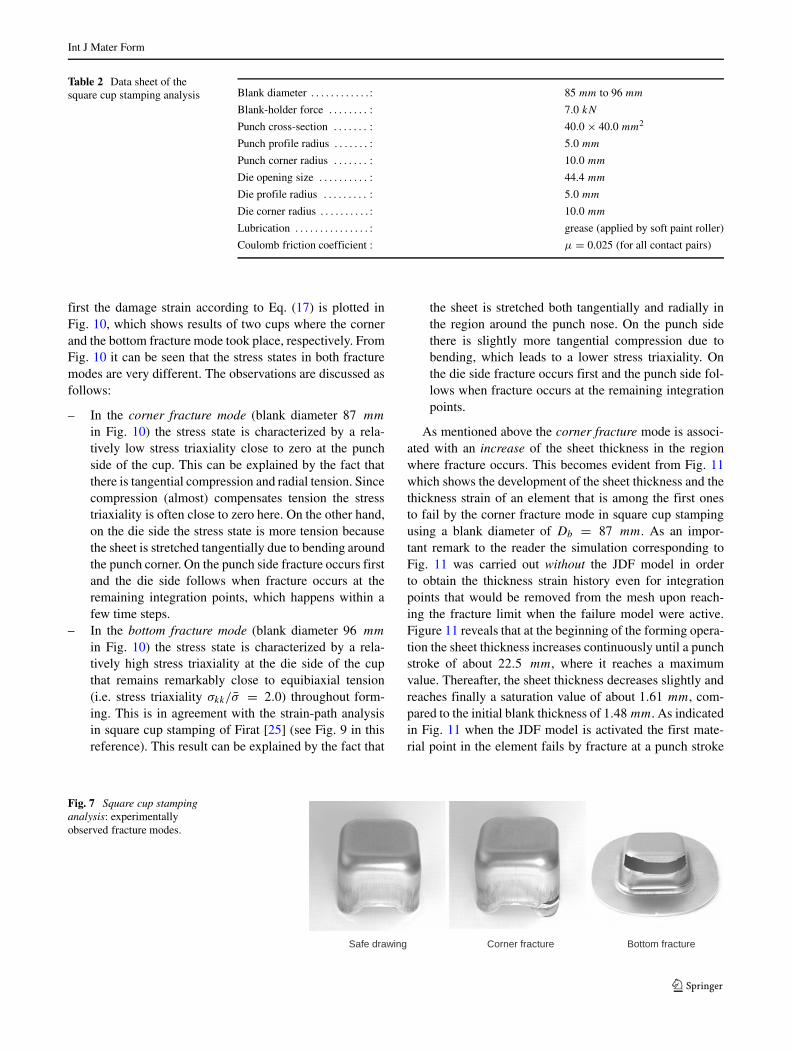
In square cup drawing of circular blanks two typical fail-ure modes can be observed: the so-called corner fracturemode and the bottom fracture mode, see [9] for furtherdetails. The corner fracture mode occurs in a region of thecup where the sheet thickness increases, which is due to themixed compressive-tensile stress state in this region. Thisfailure mode is not observed for all aluminium alloys. Incontrast, the bottom fracture mode is always observed andtakes place at the punch corner radius; it is characterizedby severe thinning of the sheet. If present, the corner frac-ture mode always occurs at smaller blank diameters than thebottom fracture mode. Figure 7 shows the fracture modesobserved in the experiments for the considered material. The
Fig. 6 Square cup stamping analysis: typical blank mesh (here: blankdiameter 87 mm)
experimental observations are quantitatively summarized asfollows:
1. For a blank diameter Db ≤ 86 mm the cup could bedrawn without failure.
2. The corner fracture mode took place for blank diame-ters Db > 86 mm.
3. The bottom fracture mode was found for Db > 95 mm.
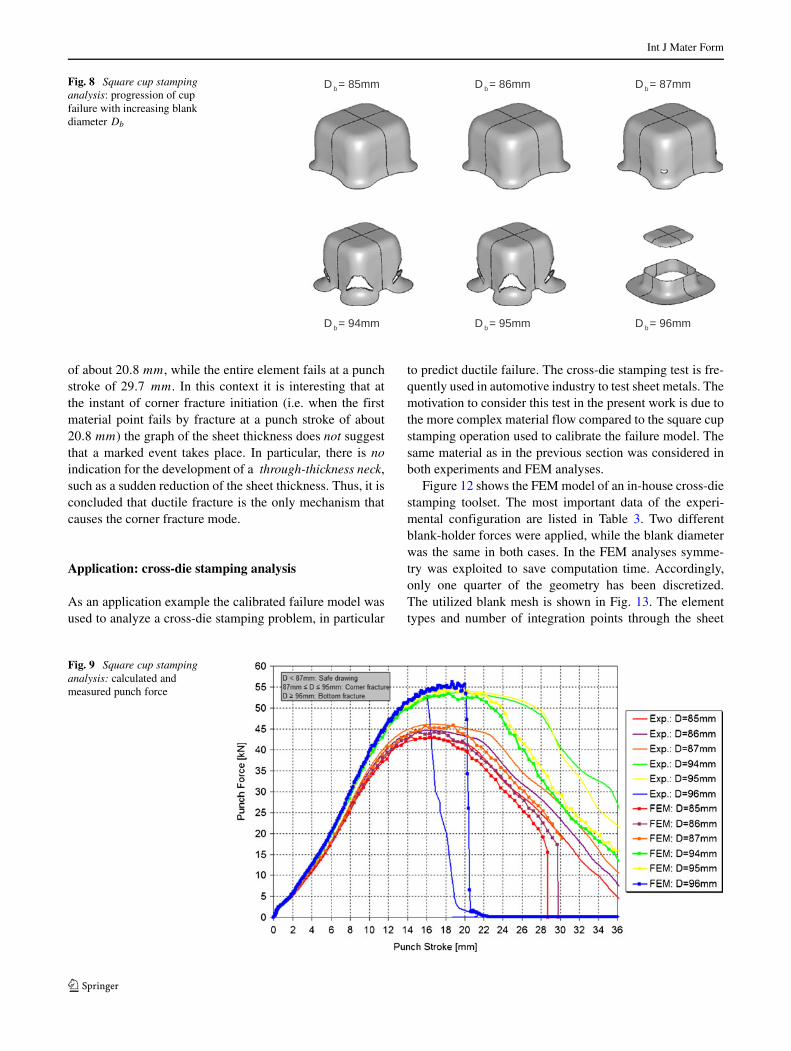
By variation the fracture model exponent A was calibratedwith respect to the corner fracture mode until the transi-tion from “safe diameter” to “failed diameter” was correctlydescribed. The post-necking parameter B0 was determinedso that the transition from corner fracture mode to bottomfracture mode was correctly described. The optimal valuesdetermined in this way are documented in Table 1. The sim-ulation results using these optimal parameters are shownin Fig. 8. They agree with the experimental findings. Thatis, the first transition from safe drawing to corner fracturemode as well as the second transition from corner fracturemode to bottom fracture mode is correctly described. Notethat due to the imposed symmetry boundary conditions thesimulations show always symmetric failure, in contrast tothe experiments, see Fig. 7. Despite the good agreementbetween simulations and experiments it is emphasized thatthe results shown in Fig. 8 are only results of the failuremodel calibration process and, as such, do not representpredictions in a strict sense.
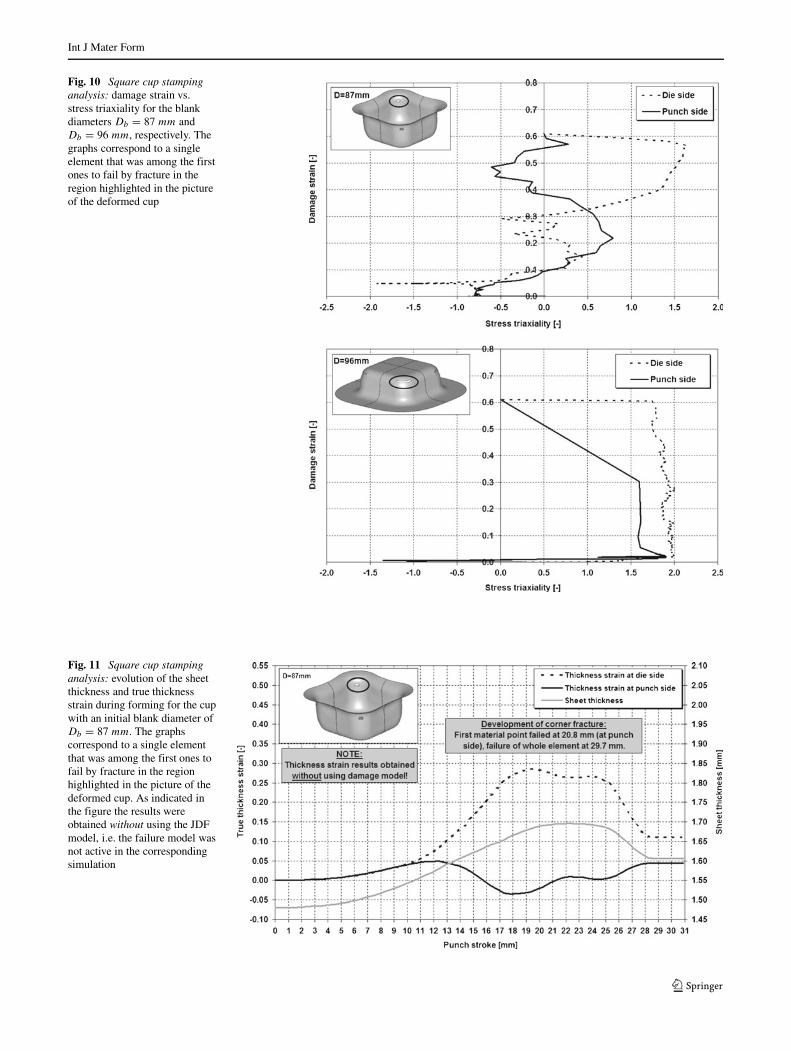
The calculated punch forces for each blank diameter areshown in Fig. 9, along with the experimental results. In thecases where no failure occurs as well as where the cornerfracture mode is observed the punch force declines moregradually after passing the force maximum. In contrast,when the bottom fracture mode takes place the punch forcedrops almost immediately. From Fig. 9 one may concludethat until the force maximum the punch forces predicted bythe FEM simulations are in good agreement with the cor-responding measurements. Beyond the force maximum thepredicted and the measured curves deviate, in particular forblank diameters larger than 86 mm, i.e. in the cases wherefracture occurs. These deviations are not believed of beingattributable to the utilized material model, because in a sim-ilar application reported earlier by the present authors (cf.[9]) the punch force in square cup stamping of an AA6xxxaluminium alloy was predicted very accurately, even beyondthe force maximum. It appears more likely that the observeddeviations can be attributed to changes in the friction con-ditions, in particular due to the reduction of the lubricationfilm thickness due to increasing pressure in the flange regionin combination with changes of the blank surfaces due toplastic deformation, which can not be accurately capturedby using a constant Coulomb friction coefficient.
In order to gain a deeper understanding concerning thelocal stress state in the regions where fracture occurred
Int J Mater Form
Table 2 Data sheet of thesquare cup stamping analysis Blank diameter . . . . . . . . . . . . : 85 mm to 96 mm
Blank-holder force . . . . . . . . : 7.0 kN
Punch cross-section . . . . . . . : 40.0 × 40.0 mm2
Punch profile radius . . . . . . . : 5.0 mm
Punch corner radius . . . . . . . : 10.0 mm
Die opening size . . . . . . . . . . : 44.4 mm
Die profile radius . . . . . . . . . : 5.0 mm
Die corner radius . . . . . . . . . . : 10.0 mm
Lubrication . . . . . . . . . . . . . . . : grease (applied by soft paint roller)
Coulomb friction coefficient : μ = 0.025 (for all contact pairs)
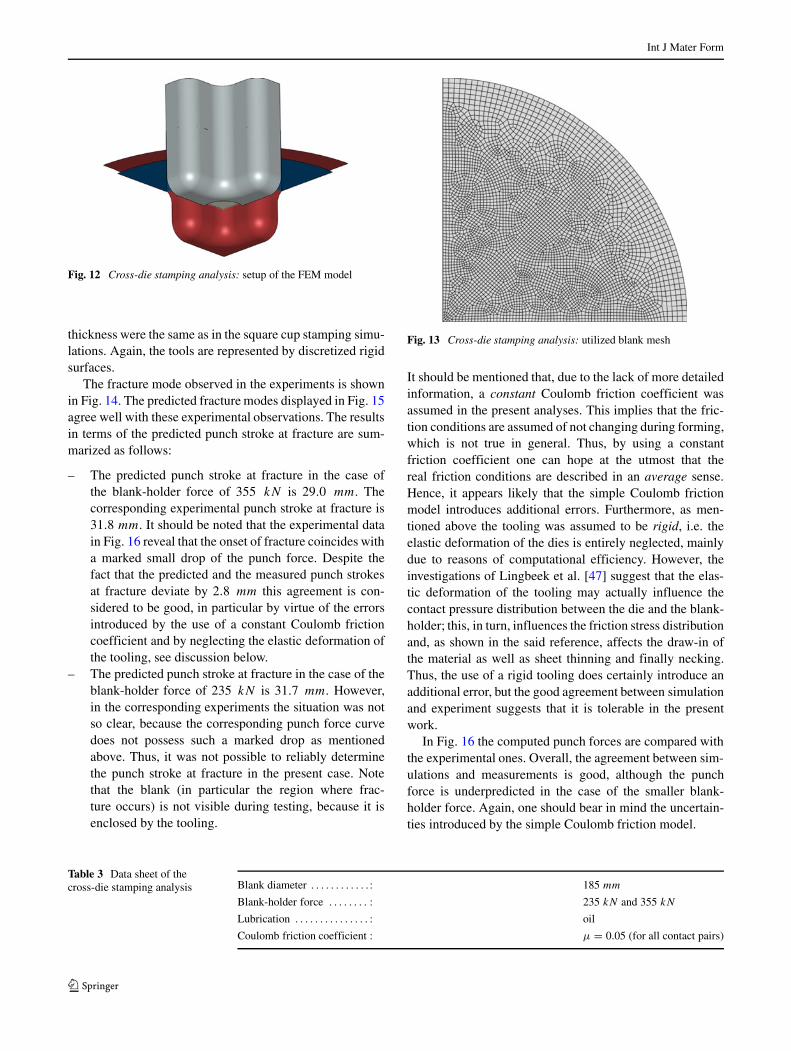
first the damage strain according to Eq. (17) is plotted inFig. 10, which shows results of two cups where the cornerand the bottom fracture mode took place, respectively. FromFig. 10 it can be seen that the stress states in both fracturemodes are very different. The observations are discussed asfollows:
– In the corner fracture mode (blank diameter 87 mm
in Fig. 10) the stress state is characterized by a rela-tively low stress triaxiality close to zero at the punchside of the cup. This can be explained by the fact thatthere is tangential compression and radial tension. Sincecompression (almost) compensates tension the stresstriaxiality is often close to zero here. On the other hand,on the die side the stress state is more tension becausethe sheet is stretched tangentially due to bending aroundthe punch corner. On the punch side fracture occurs firstand the die side follows when fracture occurs at theremaining integration points, which happens within afew time steps.
– In the bottom fracture mode (blank diameter 96 mm
in Fig. 10) the stress state is characterized by a rela-tively high stress triaxiality at the die side of the cupthat remains remarkably close to equibiaxial tension(i.e. stress triaxiality σkk/σ = 2.0) throughout form-ing. This is in agreement with the strain-path analysisin square cup stamping of Firat [25] (see Fig. 9 in thisreference). This result can be explained by the fact that
the sheet is stretched both tangentially and radially inthe region around the punch nose. On the punch sidethere is slightly more tangential compression due tobending, which leads to a lower stress triaxiality. Onthe die side fracture occurs first and the punch side fol-lows when fracture occurs at the remaining integrationpoints.
As mentioned above the corner fracture mode is associ-ated with an increase of the sheet thickness in the regionwhere fracture occurs. This becomes evident from Fig. 11which shows the development of the sheet thickness and thethickness strain of an element that is among the first onesto fail by the corner fracture mode in square cup stampingusing a blank diameter of Db = 87 mm. As an impor-tant remark to the reader the simulation corresponding toFig. 11 was carried out without the JDF model in orderto obtain the thickness strain history even for integrationpoints that would be removed from the mesh upon reach-ing the fracture limit when the failure model were active.Figure 11 reveals that at the beginning of the forming opera-tion the sheet thickness increases continuously until a punchstroke of about 22.5 mm, where it reaches a maximumvalue. Thereafter, the sheet thickness decreases slightly andreaches finally a saturation value of about 1.61 mm, com-pared to the initial blank thickness of 1.48 mm. As indicatedin Fig. 11 when the JDF model is activated the first mate-rial point in the element fails by fracture at a punch stroke
Fig. 7 Square cup stampinganalysis: experimentallyobserved fracture modes.
Int J Mater Form
Fig. 8 Square cup stampinganalysis: progression of cupfailure with increasing blankdiameter Db
of about 20.8 mm, while the entire element fails at a punchstroke of 29.7 mm. In this context it is interesting that atthe instant of corner fracture initiation (i.e. when the firstmaterial point fails by fracture at a punch stroke of about20.8 mm) the graph of the sheet thickness does not suggestthat a marked event takes place. In particular, there is noindication for the development of a through-thickness neck,such as a sudden reduction of the sheet thickness. Thus, it isconcluded that ductile fracture is the only mechanism thatcauses the corner fracture mode.
Application: cross-die stamping analysis
As an application example the calibrated failure model wasused to analyze a cross-die stamping problem, in particular
to predict ductile failure. The cross-die stamping test is fre-quently used in automotive industry to test sheet metals. Themotivation to consider this test in the present work is due tothe more complex material flow compared to the square cupstamping operation used to calibrate the failure model. Thesame material as in the previous section was considered inboth experiments and FEM analyses.
Figure 12 shows the FEM model of an in-house cross-diestamping toolset. The most important data of the experi-mental configuration are listed in Table 3. Two differentblank-holder forces were applied, while the blank diameterwas the same in both cases. In the FEM analyses symme-try was exploited to save computation time. Accordingly,only one quarter of the geometry has been discretized.The utilized blank mesh is shown in Fig. 13. The elementtypes and number of integration points through the sheet
Fig. 9 Square cup stampinganalysis: calculated andmeasured punch force
Int J Mater Form
Fig. 10 Square cup stampinganalysis: damage strain vs.stress triaxiality for the blankdiameters Db = 87 mm andDb = 96 mm, respectively. Thegraphs correspond to a singleelement that was among the firstones to fail by fracture in theregion highlighted in the pictureof the deformed cup
Fig. 11 Square cup stampinganalysis: evolution of the sheetthickness and true thicknessstrain during forming for the cupwith an initial blank diameter ofDb = 87 mm. The graphscorrespond to a single elementthat was among the first ones tofail by fracture in the regionhighlighted in the picture of thedeformed cup. As indicated inthe figure the results wereobtained without using the JDFmodel, i.e. the failure model wasnot active in the correspondingsimulation
Int J Mater Form
Fig. 12 Cross-die stamping analysis: setup of the FEM model
thickness were the same as in the square cup stamping simu-lations. Again, the tools are represented by discretized rigidsurfaces.
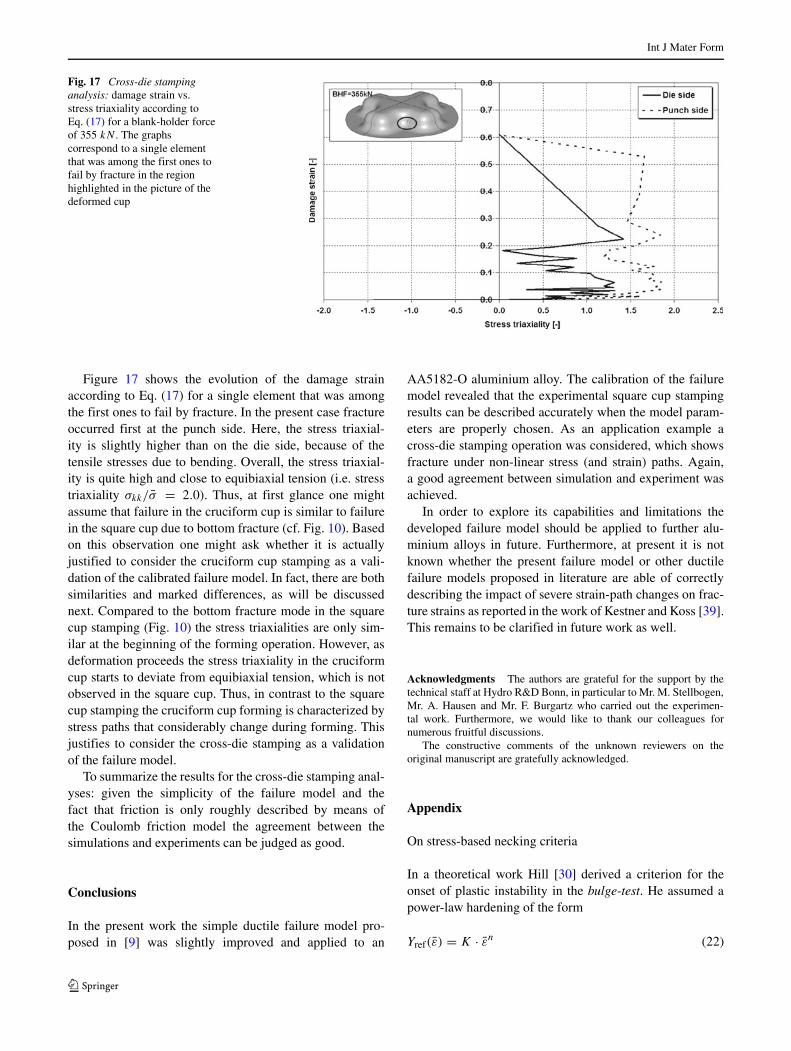
The fracture mode observed in the experiments is shownin Fig. 14. The predicted fracture modes displayed in Fig. 15agree well with these experimental observations. The resultsin terms of the predicted punch stroke at fracture are sum-marized as follows:
– The predicted punch stroke at fracture in the case ofthe blank-holder force of 355 kN is 29.0 mm. Thecorresponding experimental punch stroke at fracture is31.8 mm. It should be noted that the experimental datain Fig. 16 reveal that the onset of fracture coincides witha marked small drop of the punch force. Despite thefact that the predicted and the measured punch strokesat fracture deviate by 2.8 mm this agreement is con-sidered to be good, in particular by virtue of the errorsintroduced by the use of a constant Coulomb frictioncoefficient and by neglecting the elastic deformation ofthe tooling, see discussion below.
– The predicted punch stroke at fracture in the case of theblank-holder force of 235 kN is 31.7 mm. However,in the corresponding experiments the situation was notso clear, because the corresponding punch force curvedoes not possess such a marked drop as mentionedabove. Thus, it was not possible to reliably determinethe punch stroke at fracture in the present case. Notethat the blank (in particular the region where frac-ture occurs) is not visible during testing, because it isenclosed by the tooling.
Fig. 13 Cross-die stamping analysis: utilized blank mesh
It should be mentioned that, due to the lack of more detailedinformation, a constant Coulomb friction coefficient wasassumed in the present analyses. This implies that the fric-tion conditions are assumed of not changing during forming,which is not true in general. Thus, by using a constantfriction coefficient one can hope at the utmost that thereal friction conditions are described in an average sense.Hence, it appears likely that the simple Coulomb frictionmodel introduces additional errors. Furthermore, as men-tioned above the tooling was assumed to be rigid, i.e. theelastic deformation of the dies is entirely neglected, mainlydue to reasons of computational efficiency. However, theinvestigations of Lingbeek et al. [47] suggest that the elas-tic deformation of the tooling may actually influence thecontact pressure distribution between the die and the blank-holder; this, in turn, influences the friction stress distributionand, as shown in the said reference, affects the draw-in ofthe material as well as sheet thinning and finally necking.Thus, the use of a rigid tooling does certainly introduce anadditional error, but the good agreement between simulationand experiment suggests that it is tolerable in the presentwork.
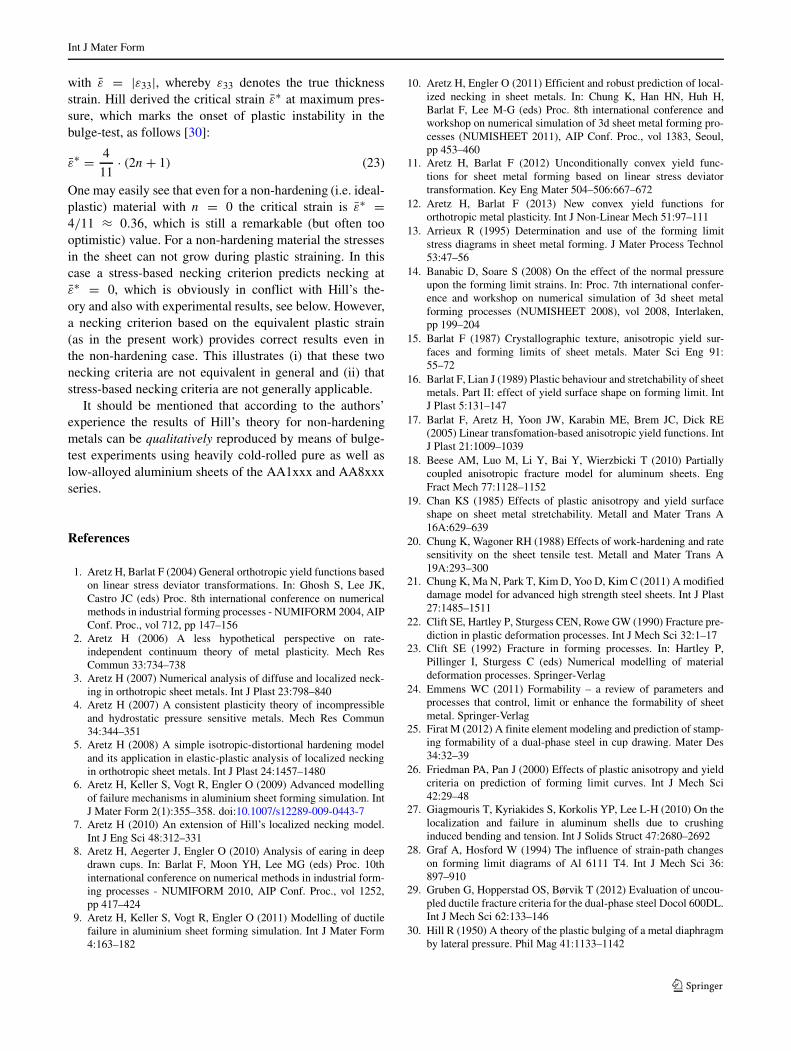
In Fig. 16 the computed punch forces are compared withthe experimental ones. Overall, the agreement between sim-ulations and measurements is good, although the punchforce is underpredicted in the case of the smaller blank-holder force. Again, one should bear in mind the uncertain-ties introduced by the simple Coulomb friction model.
Table 3 Data sheet of thecross-die stamping analysis Blank diameter . . . . . . . . . . . . : 185 mm
Blank-holder force . . . . . . . . : 235 kN and 355 kN
Lubrication . . . . . . . . . . . . . . . : oil
Coulomb friction coefficient : μ = 0.05 (for all contact pairs)
Int J Mater Form
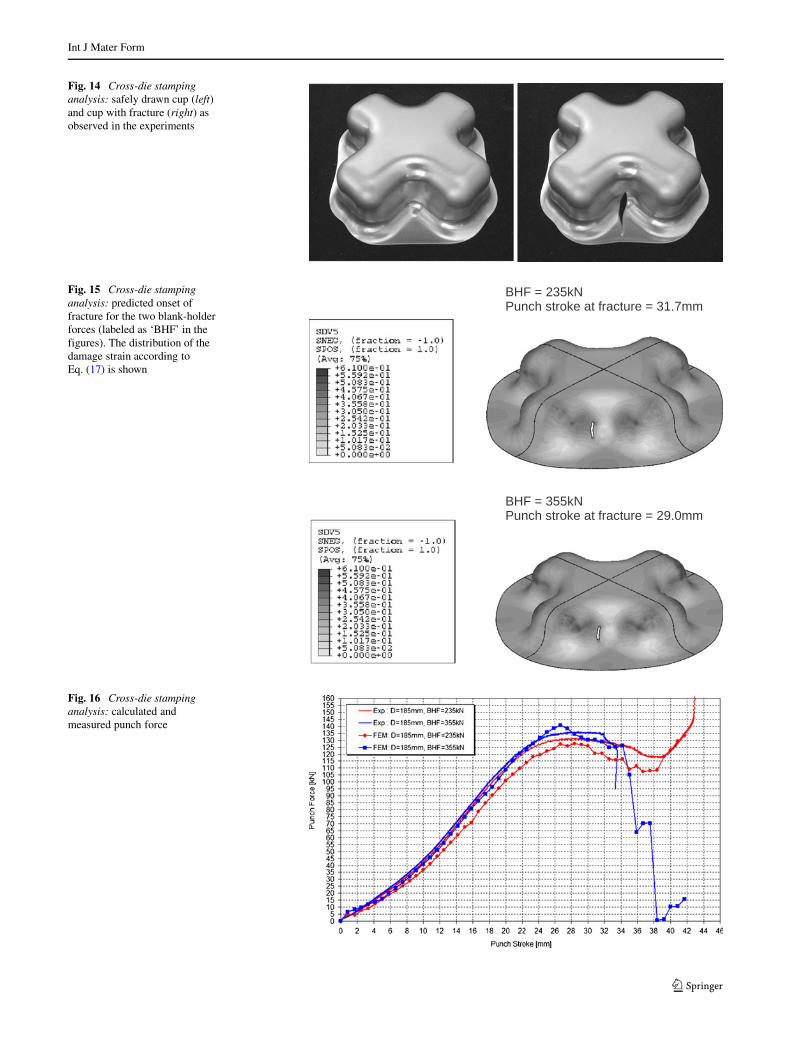
Fig. 14 Cross-die stampinganalysis: safely drawn cup (left)and cup with fracture (right) asobserved in the experiments
Fig. 15 Cross-die stampinganalysis: predicted onset offracture for the two blank-holderforces (labeled as ‘BHF’ in thefigures). The distribution of thedamage strain according toEq. (17) is shown
Fig. 16 Cross-die stampinganalysis: calculated andmeasured punch force
Int J Mater Form
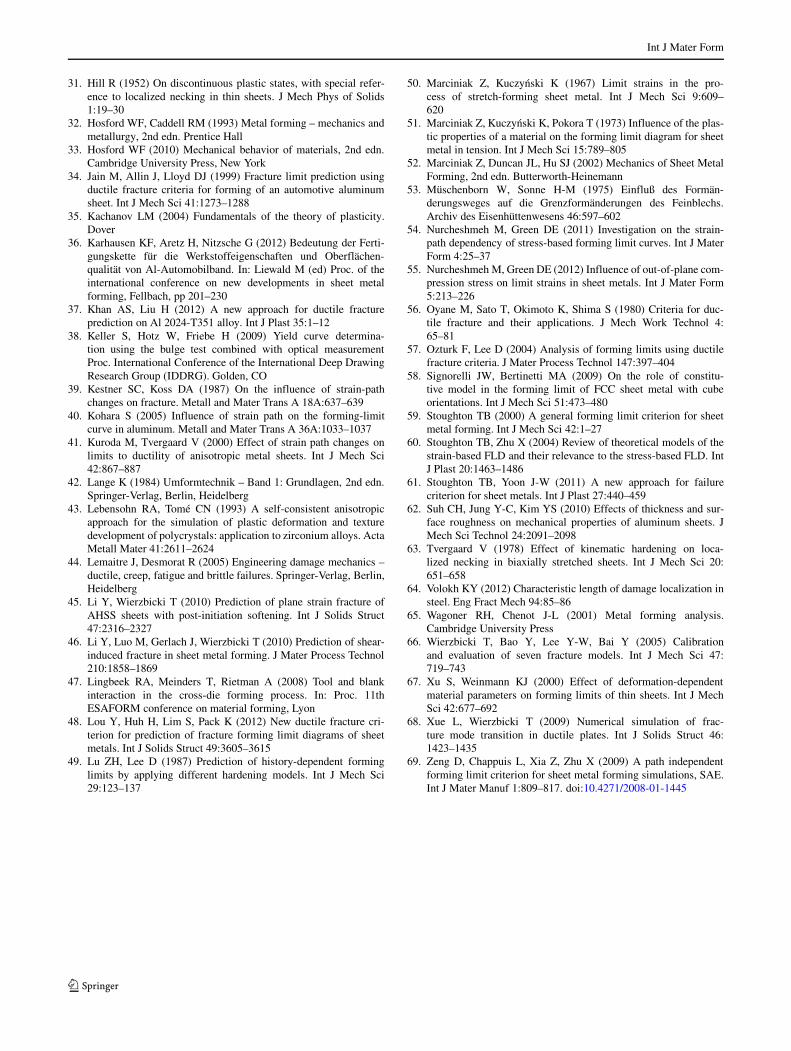
Fig. 17 Cross-die stampinganalysis: damage strain vs.stress triaxiality according toEq. (17) for a blank-holder forceof 355 kN . The graphscorrespond to a single elementthat was among the first ones tofail by fracture in the regionhighlighted in the picture of thedeformed cup
Figure 17 shows the evolution of the damage strainaccording to Eq. (17) for a single element that was amongthe first ones to fail by fracture. In the present case fractureoccurred first at the punch side. Here, the stress triaxial-ity is slightly higher than on the die side, because of thetensile stresses due to bending. Overall, the stress triaxial-ity is quite high and close to equibiaxial tension (i.e. stresstriaxiality σkk/σ = 2.0). Thus, at first glance one mightassume that failure in the cruciform cup is similar to failurein the square cup due to bottom fracture (cf. Fig. 10). Basedon this observation one might ask whether it is actuallyjustified to consider the cruciform cup stamping as a vali-dation of the calibrated failure model. In fact, there are bothsimilarities and marked differences, as will be discussednext. Compared to the bottom fracture mode in the squarecup stamping (Fig. 10) the stress triaxialities are only sim-ilar at the beginning of the forming operation. However, asdeformation proceeds the stress triaxiality in the cruciformcup starts to deviate from equibiaxial tension, which is notobserved in the square cup. Thus, in contrast to the squarecup stamping the cruciform cup forming is characterized bystress paths that considerably change during forming. Thisjustifies to consider the cross-die stamping as a validationof the failure model.
To summarize the results for the cross-die stamping anal-yses: given the simplicity of the failure model and thefact that friction is only roughly described by means ofthe Coulomb friction model the agreement between thesimulations and experiments can be judged as good.
Conclusions
In the present work the simple ductile failure model pro-posed in [9] was slightly improved and applied to an
AA5182-O aluminium alloy. The calibration of the failuremodel revealed that the experimental square cup stampingresults can be described accurately when the model param-eters are properly chosen. As an application example across-die stamping operation was considered, which showsfracture under non-linear stress (and strain) paths. Again,a good agreement between simulation and experiment wasachieved.
In order to explore its capabilities and limitations thedeveloped failure model should be applied to further alu-minium alloys in future. Furthermore, at present it is notknown whether the present failure model or other ductilefailure models proposed in literature are able of correctlydescribing the impact of severe strain-path changes on frac-ture strains as reported in the work of Kestner and Koss [39].This remains to be clarified in future work as well.
Acknowledgments The authors are grateful for the support by thetechnical staff at Hydro R&D Bonn, in particular to Mr. M. Stellbogen,Mr. A. Hausen and Mr. F. Burgartz who carried out the experimen-tal work. Furthermore, we would like to thank our colleagues fornumerous fruitful discussions.
The constructive comments of the unknown reviewers on theoriginal manuscript are gratefully acknowledged.
Appendix
On stress-based necking criteria
In a theoretical work Hill [30] derived a criterion for theonset of plastic instability in the bulge-test. He assumed apower-law hardening of the form
Yref(ε) = K · εn (22)
Int J Mater Form
with ε = |ε33|, whereby ε33 denotes the true thicknessstrain. Hill derived the critical strain ε∗ at maximum pres-sure, which marks the onset of plastic instability in thebulge-test, as follows [30]:
ε∗ = 4
11· (2n + 1) (23)
One may easily see that even for a non-hardening (i.e. ideal-plastic) material with n = 0 the critical strain is ε∗ =4/11 ≈ 0.36, which is still a remarkable (but often toooptimistic) value. For a non-hardening material the stressesin the sheet can not grow during plastic straining. In thiscase a stress-based necking criterion predicts necking atε∗ = 0, which is obviously in conflict with Hill’s the-ory and also with experimental results, see below. However,a necking criterion based on the equivalent plastic strain(as in the present work) provides correct results even inthe non-hardening case. This illustrates (i) that these twonecking criteria are not equivalent in general and (ii) thatstress-based necking criteria are not generally applicable.
It should be mentioned that according to the authors’experience the results of Hill’s theory for non-hardeningmetals can be qualitatively reproduced by means of bulge-test experiments using heavily cold-rolled pure as well aslow-alloyed aluminium sheets of the AA1xxx and AA8xxxseries.
References
1. Aretz H, Barlat F (2004) General orthotropic yield functions basedon linear stress deviator transformations. In: Ghosh S, Lee JK,Castro JC (eds) Proc. 8th international conference on numericalmethods in industrial forming processes - NUMIFORM 2004, AIPConf. Proc., vol 712, pp 147–156
2. Aretz H (2006) A less hypothetical perspective on rate-independent continuum theory of metal plasticity. Mech ResCommun 33:734–738
3. Aretz H (2007) Numerical analysis of diffuse and localized neck-ing in orthotropic sheet metals. Int J Plast 23:798–840
4. Aretz H (2007) A consistent plasticity theory of incompressibleand hydrostatic pressure sensitive metals. Mech Res Commun34:344–351
5. Aretz H (2008) A simple isotropic-distortional hardening modeland its application in elastic-plastic analysis of localized neckingin orthotropic sheet metals. Int J Plast 24:1457–1480
6. Aretz H, Keller S, Vogt R, Engler O (2009) Advanced modellingof failure mechanisms in aluminium sheet forming simulation. IntJ Mater Form 2(1):355–358. doi:10.1007/s12289-009-0443-7
7. Aretz H (2010) An extension of Hill’s localized necking model.Int J Eng Sci 48:312–331
8. Aretz H, Aegerter J, Engler O (2010) Analysis of earing in deepdrawn cups. In: Barlat F, Moon YH, Lee MG (eds) Proc. 10thinternational conference on numerical methods in industrial form-ing processes - NUMIFORM 2010, AIP Conf. Proc., vol 1252,pp 417–424
9. Aretz H, Keller S, Vogt R, Engler O (2011) Modelling of ductilefailure in aluminium sheet forming simulation. Int J Mater Form4:163–182
10. Aretz H, Engler O (2011) Efficient and robust prediction of local-ized necking in sheet metals. In: Chung K, Han HN, Huh H,Barlat F, Lee M-G (eds) Proc. 8th international conference andworkshop on numerical simulation of 3d sheet metal forming pro-cesses (NUMISHEET 2011), AIP Conf. Proc., vol 1383, Seoul,pp 453–460
11. Aretz H, Barlat F (2012) Unconditionally convex yield func-tions for sheet metal forming based on linear stress deviatortransformation. Key Eng Mater 504–506:667–672
12. Aretz H, Barlat F (2013) New convex yield functions fororthotropic metal plasticity. Int J Non-Linear Mech 51:97–111
13. Arrieux R (1995) Determination and use of the forming limitstress diagrams in sheet metal forming. J Mater Process Technol53:47–56
14. Banabic D, Soare S (2008) On the effect of the normal pressureupon the forming limit strains. In: Proc. 7th international confer-ence and workshop on numerical simulation of 3d sheet metalforming processes (NUMISHEET 2008), vol 2008, Interlaken,pp 199–204
15. Barlat F (1987) Crystallographic texture, anisotropic yield sur-faces and forming limits of sheet metals. Mater Sci Eng 91:55–72
16. Barlat F, Lian J (1989) Plastic behaviour and stretchability of sheetmetals. Part II: effect of yield surface shape on forming limit. IntJ Plast 5:131–147
17. Barlat F, Aretz H, Yoon JW, Karabin ME, Brem JC, Dick RE(2005) Linear transfomation-based anisotropic yield functions. IntJ Plast 21:1009–1039
18. Beese AM, Luo M, Li Y, Bai Y, Wierzbicki T (2010) Partiallycoupled anisotropic fracture model for aluminum sheets. EngFract Mech 77:1128–1152
19. Chan KS (1985) Effects of plastic anisotropy and yield surfaceshape on sheet metal stretchability. Metall and Mater Trans A16A:629–639
20. Chung K, Wagoner RH (1988) Effects of work-hardening and ratesensitivity on the sheet tensile test. Metall and Mater Trans A19A:293–300
21. Chung K, Ma N, Park T, Kim D, Yoo D, Kim C (2011) A modifieddamage model for advanced high strength steel sheets. Int J Plast27:1485–1511
22. Clift SE, Hartley P, Sturgess CEN, Rowe GW (1990) Fracture pre-diction in plastic deformation processes. Int J Mech Sci 32:1–17
23. Clift SE (1992) Fracture in forming processes. In: Hartley P,Pillinger I, Sturgess C (eds) Numerical modelling of materialdeformation processes. Springer-Verlag
24. Emmens WC (2011) Formability – a review of parameters andprocesses that control, limit or enhance the formability of sheetmetal. Springer-Verlag
25. Firat M (2012) A finite element modeling and prediction of stamp-ing formability of a dual-phase steel in cup drawing. Mater Des34:32–39
26. Friedman PA, Pan J (2000) Effects of plastic anisotropy and yieldcriteria on prediction of forming limit curves. Int J Mech Sci42:29–48
27. Giagmouris T, Kyriakides S, Korkolis YP, Lee L-H (2010) On thelocalization and failure in aluminum shells due to crushinginduced bending and tension. Int J Solids Struct 47:2680–2692
28. Graf A, Hosford W (1994) The influence of strain-path changeson forming limit diagrams of Al 6111 T4. Int J Mech Sci 36:897–910
29. Gruben G, Hopperstad OS, Børvik T (2012) Evaluation of uncou-pled ductile fracture criteria for the dual-phase steel Docol 600DL.Int J Mech Sci 62:133–146
30. Hill R (1950) A theory of the plastic bulging of a metal diaphragmby lateral pressure. Phil Mag 41:1133–1142
Int J Mater Form
31. Hill R (1952) On discontinuous plastic states, with special refer-ence to localized necking in thin sheets. J Mech Phys of Solids1:19–30
32. Hosford WF, Caddell RM (1993) Metal forming – mechanics andmetallurgy, 2nd edn. Prentice Hall
33. Hosford WF (2010) Mechanical behavior of materials, 2nd edn.Cambridge University Press, New York
34. Jain M, Allin J, Lloyd DJ (1999) Fracture limit prediction usingductile fracture criteria for forming of an automotive aluminumsheet. Int J Mech Sci 41:1273–1288
35. Kachanov LM (2004) Fundamentals of the theory of plasticity.Dover
36. Karhausen KF, Aretz H, Nitzsche G (2012) Bedeutung der Ferti-gungskette fur die Werkstoffeigenschaften und Oberflachen-qualitat von Al-Automobilband. In: Liewald M (ed) Proc. of theinternational conference on new developments in sheet metalforming, Fellbach, pp 201–230
37. Khan AS, Liu H (2012) A new approach for ductile fractureprediction on Al 2024-T351 alloy. Int J Plast 35:1–12
38. Keller S, Hotz W, Friebe H (2009) Yield curve determina-tion using the bulge test combined with optical measurementProc. International Conference of the International Deep DrawingResearch Group (IDDRG). Golden, CO
39. Kestner SC, Koss DA (1987) On the influence of strain-pathchanges on fracture. Metall and Mater Trans A 18A:637–639
40. Kohara S (2005) Influence of strain path on the forming-limitcurve in aluminum. Metall and Mater Trans A 36A:1033–1037
41. Kuroda M, Tvergaard V (2000) Effect of strain path changes onlimits to ductility of anisotropic metal sheets. Int J Mech Sci42:867–887
42. Lange K (1984) Umformtechnik – Band 1: Grundlagen, 2nd edn.Springer-Verlag, Berlin, Heidelberg
43. Lebensohn RA, Tome CN (1993) A self-consistent anisotropicapproach for the simulation of plastic deformation and texturedevelopment of polycrystals: application to zirconium alloys. ActaMetall Mater 41:2611–2624
44. Lemaitre J, Desmorat R (2005) Engineering damage mechanics –ductile, creep, fatigue and brittle failures. Springer-Verlag, Berlin,Heidelberg
45. Li Y, Wierzbicki T (2010) Prediction of plane strain fracture ofAHSS sheets with post-initiation softening. Int J Solids Struct47:2316–2327
46. Li Y, Luo M, Gerlach J, Wierzbicki T (2010) Prediction of shear-induced fracture in sheet metal forming. J Mater Process Technol210:1858–1869
47. Lingbeek RA, Meinders T, Rietman A (2008) Tool and blankinteraction in the cross-die forming process. In: Proc. 11thESAFORM conference on material forming, Lyon
48. Lou Y, Huh H, Lim S, Pack K (2012) New ductile fracture cri-terion for prediction of fracture forming limit diagrams of sheetmetals. Int J Solids Struct 49:3605–3615
49. Lu ZH, Lee D (1987) Prediction of history-dependent forminglimits by applying different hardening models. Int J Mech Sci29:123–137
50. Marciniak Z, Kuczynski K (1967) Limit strains in the pro-cess of stretch-forming sheet metal. Int J Mech Sci 9:609–620
51. Marciniak Z, Kuczynski K, Pokora T (1973) Influence of the plas-tic properties of a material on the forming limit diagram for sheetmetal in tension. Int J Mech Sci 15:789–805
52. Marciniak Z, Duncan JL, Hu SJ (2002) Mechanics of Sheet MetalForming, 2nd edn. Butterworth-Heinemann
53. Muschenborn W, Sonne H-M (1975) Einfluß des Forman-derungsweges auf die Grenzformanderungen des Feinblechs.Archiv des Eisenhuttenwesens 46:597–602
54. Nurcheshmeh M, Green DE (2011) Investigation on the strain-path dependency of stress-based forming limit curves. Int J MaterForm 4:25–37
55. Nurcheshmeh M, Green DE (2012) Influence of out-of-plane com-pression stress on limit strains in sheet metals. Int J Mater Form5:213–226
56. Oyane M, Sato T, Okimoto K, Shima S (1980) Criteria for duc-tile fracture and their applications. J Mech Work Technol 4:65–81
57. Ozturk F, Lee D (2004) Analysis of forming limits using ductilefracture criteria. J Mater Process Technol 147:397–404
58. Signorelli JW, Bertinetti MA (2009) On the role of constitu-tive model in the forming limit of FCC sheet metal with cubeorientations. Int J Mech Sci 51:473–480
59. Stoughton TB (2000) A general forming limit criterion for sheetmetal forming. Int J Mech Sci 42:1–27
60. Stoughton TB, Zhu X (2004) Review of theoretical models of thestrain-based FLD and their relevance to the stress-based FLD. IntJ Plast 20:1463–1486
61. Stoughton TB, Yoon J-W (2011) A new approach for failurecriterion for sheet metals. Int J Plast 27:440–459
62. Suh CH, Jung Y-C, Kim YS (2010) Effects of thickness and sur-face roughness on mechanical properties of aluminum sheets. JMech Sci Technol 24:2091–2098
63. Tvergaard V (1978) Effect of kinematic hardening on loca-lized necking in biaxially stretched sheets. Int J Mech Sci 20:651–658
64. Volokh KY (2012) Characteristic length of damage localization insteel. Eng Fract Mech 94:85–86
65. Wagoner RH, Chenot J-L (2001) Metal forming analysis.Cambridge University Press
66. Wierzbicki T, Bao Y, Lee Y-W, Bai Y (2005) Calibrationand evaluation of seven fracture models. Int J Mech Sci 47:719–743
67. Xu S, Weinmann KJ (2000) Effect of deformation-dependentmaterial parameters on forming limits of thin sheets. Int J MechSci 42:677–692
68. Xue L, Wierzbicki T (2009) Numerical simulation of frac-ture mode transition in ductile plates. Int J Solids Struct 46:1423–1435
69. Zeng D, Chappuis L, Xia Z, Zhu X (2009) A path independentforming limit criterion for sheet metal forming simulations, SAE.Int J Mater Manuf 1:809–817. doi:10.4271/2008-01-1445