Embed Size (px)
Citation preview
A SEAL / FISHERY INTERACTION MANAGEMENTSTRATEGY
BACKGROUND REPORT
Marine and Marine Industries Council
June 2002

Seal / Fishery Interaction Management Strategy – Background Report
i
Published by: Department of Primary Industries, Water andEnvironment, Tasmania
Citation: Marine and Marine Industries Council 2002. A Seal / FisheryInteraction Management Strategy: Background Report.
Available from: Executive Officer, Marine and Marine Industries Council,Department of Primary Industries, Water and Environment,GPO Box 44Hobart Tasmania 7001
Ph 03 6233 4038
AcknowledgementsPrepared by the DPIWE Project Team with advice and comments from members of theMarine and Marine Industries Council.
The report was independently reviewed by Dr Mark Hindell, of the TAFI-School ofZoology, University of Tasmania, with assistance from Prof Colin Buxton of the Marineand Marine Industries Council.
Seal / Fishery Interaction Management Strategy – Background Report
ii
© 2002 Crown in Right of the State of Tasmania
This work is copyright. Apart from any use permitted under the CommonwealthCopyright Act 1968, no part may be reproduced by any process without writtenpermission from the Department of Primary Industries, Water and Environment.Inquiries should be directed to the General Manager, Resource Management andConservation, Department of Primary Industries, Water and Environment, GPO Box 44,Hobart TAS 7001.
________________________________________________________________________
DISCLAIMER
Any representation, statement, opinion or advice expressed or implied in this publicationis made in good faith but on the basis that the Marine and Marine Industries Council andthe Crown in Right of the State of Tasmania, its agents and employees are not liable(whether by reason of negligence, lack of care or otherwise) to any person for anydamage or loss whatsoever which has occurred or may occur in relation to that persontaking or not taking (as the case may be) action in respect of any representation,statement, opinion or advice referred to above.
Seal / Fishery Interaction Management Strategy – Background Report
iii
PREFACE
In response to concerns raised by fishers regarding interactions between seals and thefishing and aquaculture industries, the Minister for Primary Industries, Water andEnvironment referred the matter to the Marine and Marine Industries Council byestablishing the Seals Term of Reference.
The Seals Term of Reference is the second reference for the Marine and MarineIndustries Council (MMIC), established by the Minister for Primary Industries, Waterand Environment in August 1999.
The members of the MMIC represent a range of key stakeholders, and have individualexpertise in areas such as marine conservation, management and utilisation. TheChairman of the Marine and Marine Industries Council is Mr Tony Harrison, a marinemanagement consultant.
The Seals Terms of Reference1 provided to MMIC required them to investigate andreport on:
• The extent of the seal problem and its economic impact in Tasmania.• Current trends in the seal population and the factors influencing population changes.• Current practices both locally and elsewhere in successfully dealing with the problem.
The problem was described as:
“The fishing and aquaculture industries believe that seals are having significantadverse economic impact on their commercial operations. However, seals are aprotected species and the management options in dealing with seals need to reflectthis status.”
The outcomes sought were:
• A management strategy which identifies best practice for dealing with the problem.• Identification of any legislative or policy changes addressing this issue.• A communications strategy to support the management plan.
.
1 A copy of the Terms of Reference can be found at Attachment 1.
Seal / Fishery Interaction Management Strategy – Background Report
iv
CONTENTSACKNOWLEDGEMENTS........................................................................................................... I
PREFACE ....................................................................................................................................III
CHAPTER 1 - INTRODUCTION ............................................................................................... 1REPORT STRUCTURE ................................................................................................................................... 1SCOPE......................................................................................................................................................... 1DEFINITION................................................................................................................................................. 2
CHAPTER 2 - SEAL ECOLOGY ............................................................................................... 3PHYSICAL CHARACTERISTICS ..................................................................................................................... 3
New Zealand fur seals........................................................................................................................... 3Australian fur seals ............................................................................................................................... 3
DISTRIBUTION, HABITAT AND BIOLOGY..................................................................................................... 3New Zealand fur seals........................................................................................................................... 3Australian fur seals ............................................................................................................................... 4New Zealand fur seal ............................................................................................................................ 6
Australian fur seal ............................................................................................................ 6CHAPTER 3 - THE EXTENT OF INTERACTIONS. ............................................................ 10
3.1 FISHING........................................................................................................................................... 103.1.1 Historical.............................................................................................................................. 103.1.2 Present.................................................................................................................................. 103.1.3 Scalefish Fishery................................................................................................................... 11
3.2 INTERACTIONS WITH SEALS IN RELATION TO FISHING METHOD ....................................................... 123.2.1 Gill Netting ........................................................................................................................... 123.2.2 Other fisheries ...................................................................................................................... 14
3.3 MARINE FARMING........................................................................................................................... 143.3.1 Salmonid farming ................................................................................................................. 143.3.2 Seal interactions with Salmon Farms ................................................................................... 18
3.4. TOURISM AND SOCIAL IMPACTS...................................................................................................... 19
CHAPTER 4 - THE ECONOMIC IMPACT OF THE INTERACTIONS. ........................... 204.1 FISHING........................................................................................................................................... 20
4.1.1 Tasmania ............................................................................................................................. 204.1.2 Elsewhere ............................................................................................................................. 21
4.1.2.1 Norway............................................................................................................................................. 214.1.2.2 USA ................................................................................................................................................. 214.1.2.3 Japan ................................................................................................................................................ 22
4.2 MARINE FARMING........................................................................................................................... 22
CHAPTER 5 - THE CONSERVATION IMPACT OF THE INTERACTIONS. ................. 245.1 FISHING OPERATIONS ...................................................................................................................... 245.2 FISHING AND FOOD FOR SEALS ........................................................................................................ 255.3 MARINE FARMING........................................................................................................................... 26
CHAPTER 6 - CURRENT TRENDS IN SEAL POPULATIONS AND FACTORSAFFECTING THEM. ....................................................................................................... 28
6.1 SEAL POPULATIONS ........................................................................................................................ 286.2 CONSERVATION MEASURES............................................................................................................. 28
Seal / Fishery Interaction Management Strategy – Background Report
v
6.2.1 National Measures................................................................................................................ 286.2.1.1 The Action Plan for Australian Seals (1999).................................................................................... 29
6.2.2 Tasmanian Measures............................................................................................................ 306.3 OTHER INFLUENCES ON SEAL POPULATIONS .................................................................................. 30
6.3.1 Environmental Factors ......................................................................................................... 306.3.2 Disease ................................................................................................................................. 316.3.3 Illegal taking of seals............................................................................................................ 31
CHAPTER 7 - MINIMISING THE IMPACT OF INTERACTIONS. .................................. 327.1 NON LETHAL METHODS.................................................................................................................. 32
7.1.1 Acoustic deterrents ............................................................................................................... 327.1.1.1 Seal crackers .................................................................................................................................... 327.1.1.2 Acoustic harassment devices (AHDs) .............................................................................................. 337.1.1.3 Acoustic deterrent devices (ADDs).................................................................................................. 33
7.1.2. Capture and relocation......................................................................................................... 347.1.3 Exclusion Methods................................................................................................................ 38
7.1.3.1 Predator Netting ............................................................................................................................... 387.1.3.2 Bag Enclosures................................................................................................................................. 39
7.1.4 Tactile Harassment............................................................................................................... 427.1.4.1 Rubber bullets .................................................................................................................................. 427.1.4.2 Beanbag loads .................................................................................................................................. 427.1.4.3 Cattle prods ...................................................................................................................................... 42
7.1.5 Other non lethal methods...................................................................................................... 427.1.5.1 SharkPOD (protective oceanic device) ............................................................................................ 427.1.5.2 Taste aversion .................................................................................................................................. 427.1.5.3 Vessel chase ..................................................................................................................................... 43
7.2 LETHAL METHODS.......................................................................................................................... 447.2.1 Culling .................................................................................................................................. 447.2.2 Shooting seals interfering with nets...................................................................................... 45
CHAPTER 8 - CURRENT PRACTICE IN MANAGING SEAL INTERACTIONS. .......... 488.1 WILD FISHERIES .............................................................................................................................. 48
8.1.1 Scalefish Fisheries................................................................................................................ 488.1.1.1 Seal Crackers.................................................................................................................................... 488.1.1.2 By-catch Mitigation ......................................................................................................................... 488.1.1.3 Attending Gear (gill nets)................................................................................................................. 488.1.1.4 Steaming away from Seals ............................................................................................................... 48
8.1.2 Rock lobster .......................................................................................................................... 498.2 SALMON FARMS.............................................................................................................................. 49
8.2.1 Tasmanian Practice .............................................................................................................. 498.2.1.1 Engineering Solutions ...................................................................................................................... 518.2.1.2 Trapping and relocation of seals ..................................................................................................... 51
8.2.1.2.1 Relocation Protocols ................................................................................................................... 518.2.1.2.2 On Farm and Trapping Protocols ................................................................................................ 51
8.2.2 Other Australian States ........................................................................................................ 518.2.2.1 South Australia - Tuna farms ........................................................................................................... 51
8.2.3 Overseas Practice................................................................................................................. 528.2.3.1 Canada ............................................................................................................................................ 526.2.3.2 Scotland ........................................................................................................................................... 538.2.3.3 New Zealand .................................................................................................................................... 548.2.3.4 Norway............................................................................................................................................. 548.2.3.5 Washington State ............................................................................................................................. 54
CHAPTER 9 - SUMMARY........................................................................................................ 55
CHAPTER 10 -REFERENCE.................................................................................................... 56
Seal / Fishery Interaction Management Strategy – Background Report
vi
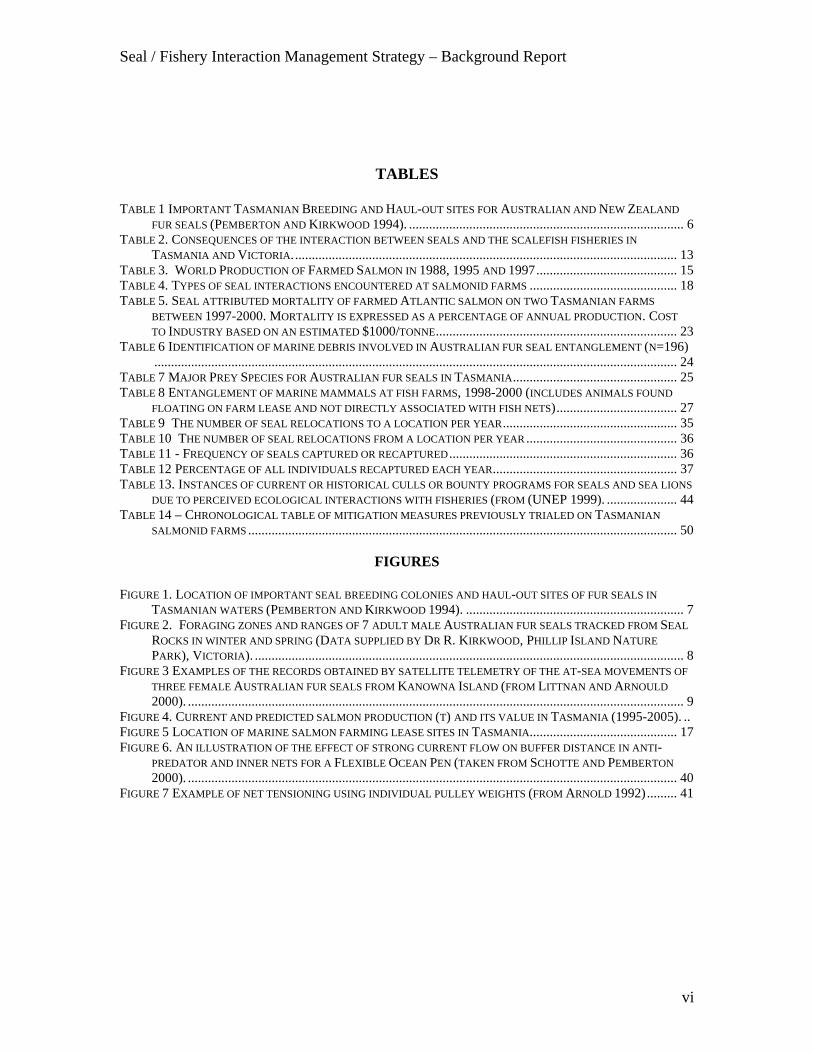
TABLES
TABLE 1 IMPORTANT TASMANIAN BREEDING AND HAUL-OUT SITES FOR AUSTRALIAN AND NEW ZEALANDFUR SEALS (PEMBERTON AND KIRKWOOD 1994). .................................................................................. 6
TABLE 2. CONSEQUENCES OF THE INTERACTION BETWEEN SEALS AND THE SCALEFISH FISHERIES INTASMANIA AND VICTORIA................................................................................................................... 13
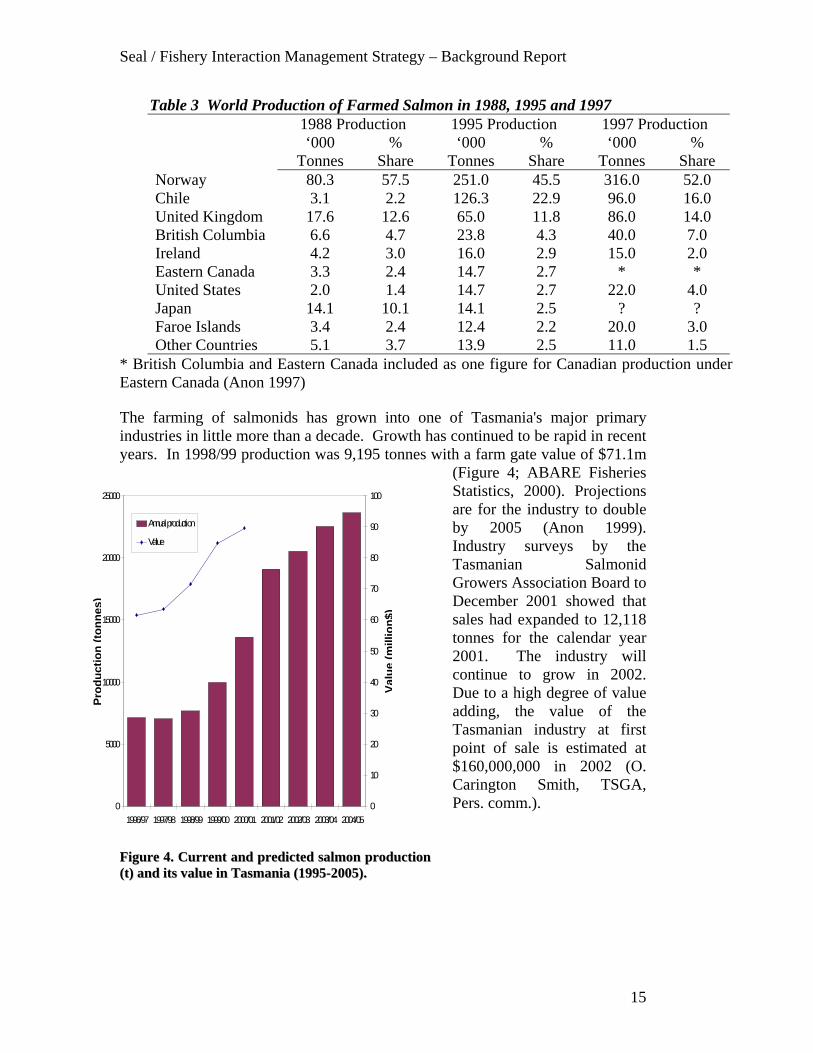
TABLE 3. WORLD PRODUCTION OF FARMED SALMON IN 1988, 1995 AND 1997.......................................... 15TABLE 4. TYPES OF SEAL INTERACTIONS ENCOUNTERED AT SALMONID FARMS ............................................ 18TABLE 5. SEAL ATTRIBUTED MORTALITY OF FARMED ATLANTIC SALMON ON TWO TASMANIAN FARMS
BETWEEN 1997-2000. MORTALITY IS EXPRESSED AS A PERCENTAGE OF ANNUAL PRODUCTION. COSTTO INDUSTRY BASED ON AN ESTIMATED $1000/TONNE........................................................................ 23
TABLE 6 IDENTIFICATION OF MARINE DEBRIS INVOLVED IN AUSTRALIAN FUR SEAL ENTANGLEMENT (N=196)............................................................................................................................................................ 24
TABLE 7 MAJOR PREY SPECIES FOR AUSTRALIAN FUR SEALS IN TASMANIA................................................. 25TABLE 8 ENTANGLEMENT OF MARINE MAMMALS AT FISH FARMS, 1998-2000 (INCLUDES ANIMALS FOUND
FLOATING ON FARM LEASE AND NOT DIRECTLY ASSOCIATED WITH FISH NETS).................................... 27TABLE 9 THE NUMBER OF SEAL RELOCATIONS TO A LOCATION PER YEAR.................................................... 35TABLE 10 THE NUMBER OF SEAL RELOCATIONS FROM A LOCATION PER YEAR ............................................. 36TABLE 11 - FREQUENCY OF SEALS CAPTURED OR RECAPTURED.................................................................... 36TABLE 12 PERCENTAGE OF ALL INDIVIDUALS RECAPTURED EACH YEAR....................................................... 37TABLE 13. INSTANCES OF CURRENT OR HISTORICAL CULLS OR BOUNTY PROGRAMS FOR SEALS AND SEA LIONS
DUE TO PERCEIVED ECOLOGICAL INTERACTIONS WITH FISHERIES (FROM (UNEP 1999). ..................... 44TABLE 14 – CHRONOLOGICAL TABLE OF MITIGATION MEASURES PREVIOUSLY TRIALED ON TASMANIAN
SALMONID FARMS ................................................................................................................................ 50
FIGURES
FIGURE 1. LOCATION OF IMPORTANT SEAL BREEDING COLONIES AND HAUL-OUT SITES OF FUR SEALS INTASMANIAN WATERS (PEMBERTON AND KIRKWOOD 1994). ................................................................. 7
FIGURE 2. FORAGING ZONES AND RANGES OF 7 ADULT MALE AUSTRALIAN FUR SEALS TRACKED FROM SEALROCKS IN WINTER AND SPRING (DATA SUPPLIED BY DR R. KIRKWOOD, PHILLIP ISLAND NATUREPARK), VICTORIA). ................................................................................................................................ 8
FIGURE 3 EXAMPLES OF THE RECORDS OBTAINED BY SATELLITE TELEMETRY OF THE AT-SEA MOVEMENTS OFTHREE FEMALE AUSTRALIAN FUR SEALS FROM KANOWNA ISLAND (FROM LITTNAN AND ARNOULD2000). .................................................................................................................................................... 9
FIGURE 4. CURRENT AND PREDICTED SALMON PRODUCTION (T) AND ITS VALUE IN TASMANIA (1995-2005). ..FIGURE 5 LOCATION OF MARINE SALMON FARMING LEASE SITES IN TASMANIA............................................ 17FIGURE 6. AN ILLUSTRATION OF THE EFFECT OF STRONG CURRENT FLOW ON BUFFER DISTANCE IN ANTI-
PREDATOR AND INNER NETS FOR A FLEXIBLE OCEAN PEN (TAKEN FROM SCHOTTE AND PEMBERTON2000). .................................................................................................................................................. 40
FIGURE 7 EXAMPLE OF NET TENSIONING USING INDIVIDUAL PULLEY WEIGHTS (FROM ARNOLD 1992)......... 41
Seal / Fishery Interaction Management Strategy – Background Report
vii
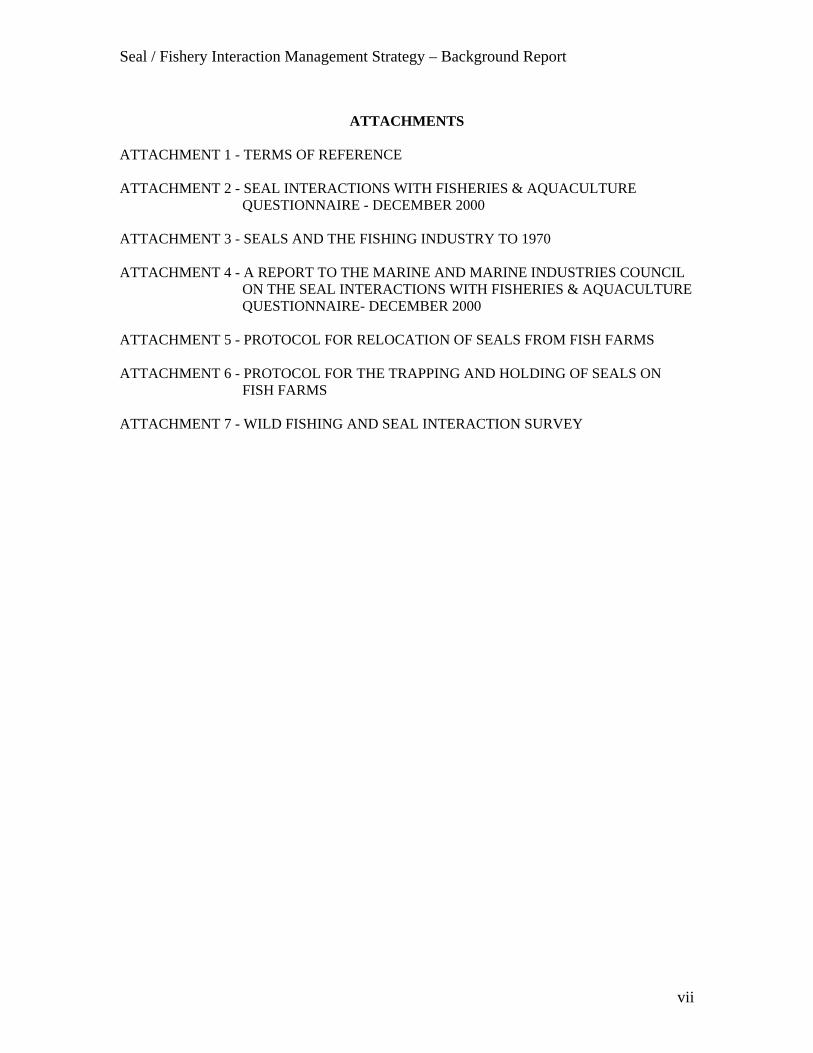
ATTACHMENTS
ATTACHMENT 1 - TERMS OF REFERENCE
ATTACHMENT 2 - SEAL INTERACTIONS WITH FISHERIES & AQUACULTUREQUESTIONNAIRE - DECEMBER 2000
ATTACHMENT 3 - SEALS AND THE FISHING INDUSTRY TO 1970
ATTACHMENT 4 - A REPORT TO THE MARINE AND MARINE INDUSTRIES COUNCILON THE SEAL INTERACTIONS WITH FISHERIES & AQUACULTUREQUESTIONNAIRE- DECEMBER 2000
ATTACHMENT 5 - PROTOCOL FOR RELOCATION OF SEALS FROM FISH FARMS
ATTACHMENT 6 - PROTOCOL FOR THE TRAPPING AND HOLDING OF SEALS ONFISH FARMS
ATTACHMENT 7 - WILD FISHING AND SEAL INTERACTION SURVEY
Seal / Fishery Interaction Management Strategy – Background Report
viii
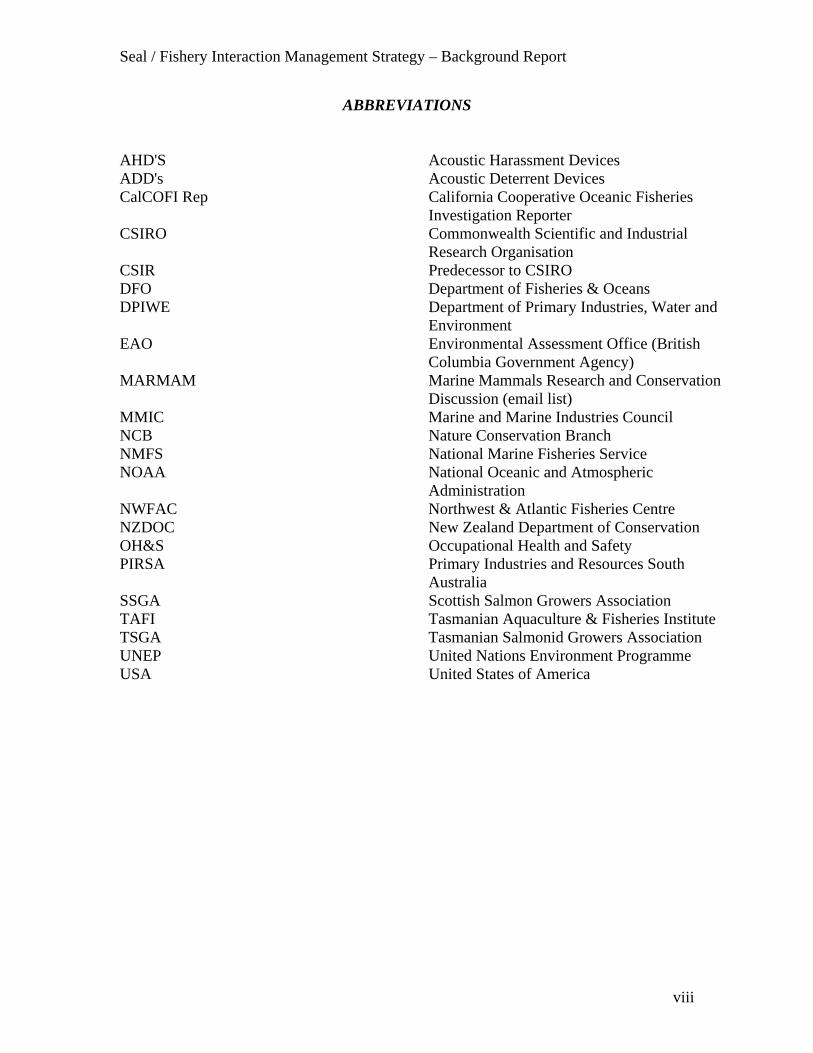
ABBREVIATIONS
AHD'S Acoustic Harassment DevicesADD's Acoustic Deterrent DevicesCalCOFI Rep California Cooperative Oceanic Fisheries
Investigation ReporterCSIRO Commonwealth Scientific and Industrial
Research OrganisationCSIR Predecessor to CSIRODFODPIWE
Department of Fisheries & OceansDepartment of Primary Industries, Water andEnvironment
EAO Environmental Assessment Office (BritishColumbia Government Agency)
MARMAM Marine Mammals Research and ConservationDiscussion (email list)
MMIC Marine and Marine Industries CouncilNCB Nature Conservation BranchNMFS National Marine Fisheries ServiceNOAA National Oceanic and Atmospheric
AdministrationNWFAC Northwest & Atlantic Fisheries CentreNZDOC New Zealand Department of ConservationOH&S Occupational Health and SafetyPIRSA Primary Industries and Resources South
AustraliaSSGA Scottish Salmon Growers AssociationTAFI Tasmanian Aquaculture & Fisheries InstituteTSGAUNEP
Tasmanian Salmonid Growers AssociationUnited Nations Environment Programme
USA United States of America
Seal / Fishery Interaction Management Strategy – Background Report
1
Chapter 1 - Introduction
Report structureThis Background Report summarises the current knowledge of seal interactions withfisheries and aquaculture in Tasmania. It is based on previous studies conducted by theTasmanian Government and other research institutions, information collected fromquestionnaires and follow-up interviews with fishers. It also provides a summary ofcurrent knowledge and experiences globally, in particular in South Africa, Canada, theUnited States of America, the United Kingdom, New Zealand and Japan.
A management strategy based on this information accompanies this report.
ScopeThe scope of the investigation is limited to Tasmania2, not including Macquarie Island asno interactions with fisheries under Tasmanian jurisdiction have occurred to date atMacquarie Island. Under Offshore Constitutional Settlements the CommonwealthGovernment is responsible for interactions with certain fisheries around Tasmania,notably trawling. It also conserves seals in waters adjacent to Tasmania, but beyond Statejurisdiction.
This report focuses on Australian fur seals (Arctocephalus pusillus) and New Zealand furseals (Arctocephalus fosteri), the two species primarily involved in interactions withcommercial and recreational fishing and/or aquaculture operations in Tasmania (hereafterreferred to as seal/fisheries interactions).
Seal/fisheries interactions are not unique to Tasmania as similar experiences are foundboth nationally and internationally. Despite this, the body of literature documentingseal/fisheries interactions (and in fact marine mammal/fisheries interactions in general) islimited. Descriptions of seal/fisheries interactions in Tasmania are summarised inrelation to each activity and concentrate on previously published studies, the opinions ofresearchers and fishers obtained through discussion and questionnaire responses3. Whererelevant, reference has been made to studies of marine mammal/fisheries interactions inother jurisdictions. The Report includes a brief summary of current and previouslytrialed mitigation measures.
2 Tasmania is defined as Tasmanian waters to three nautical miles, plus fisheries under Tasmanianjurisdiction3A copy of the 'Seal Interactions with Fisheries & Aquaculture Questionnaire – December 2000’ is atAttachment 2
Seal / Fishery Interaction Management Strategy – Background Report
2
DefinitionThere are two common types of seal/fisheries interactions:
1. Direct (Operational) interactions typically involve seals taking fish from lines or nets,damage or loss of the catch and fishing operations being disturbed. They can havenegative or positive effects on the marine mammal and/or the fishery (Pemberton et al.1995; Pemberton and Shaughnessy 1993; Northridge and Hofman 1999). Directinteractions also include seal mortality due to entanglement in discarded fishing gear,drowning in nets and being shot or maimed by fishers (Wickens et al. 1992; Pembertonet. al 1994).
2. Indirect (Biological) interactions refer to the competition between seals and fishersfor shared resources (Gulland 1986; Harwood 1984; 1987; Wickens et al. 1992).
In Tasmanian fisheries current concerns relate to direct interactions with seals. Fishersare primarily concerned with the taking and killing of fish by seals, damage to fishinggear, the effect of seal proximity on fish behaviour, risk to human safety and the loss ofpersonal income resulting from these interactions.
On the other hand, the Tasmanian salmonid farming industry is concerned with the directpredation of farmed fish stocks by seals, the entanglement of seals and other marinemammals in fish farm predator nets, a reduction in feeding rates of fish through stressassociated with seal presence, and injury to personnel.
Seal / Fishery Interaction Management Strategy – Background Report
3
Chapter 2 - Seal Ecology
There are three families of seals (pinnipeds): Phocidae (earless seals), Otariidae (fur sealsand sea lions) and Odobenidae (walruses). Of these, only seals from the Otariidae arecommonly found in Tasmanian waters. Southern elephant seals (Phocidae) breedoccasionally on Maatsuyker Island (and very rarely on mainland Tasmania). Australianand New Zealand fur seals, of the family Otariida, are known to interact with fishingoperations in Tasmanian waters, so further descriptions will be restricted to these species.
Physical characteristicsDistinguishing between New Zealand and Australian fur seals is problematic as the twospecies share many physical attributes, with differences in vocalisation, locomotion andthigmotactism (body contact) being the most useful distinguishing features (Goldsworthyet al. 1997).
New Zealand fur seals
The New Zealand fur seal, identified by a dog-like head with long whiskers and obviousexternal ears, has large fore and hind flippers which can bend forward enabling them toclimb across boulders and rock shelves when on land. This seal has grey to dark-brownfur and the adult males (or bulls) develop massive necks and a thick mane. Adult malesgrow to about 200 cm long and can weigh up to 180 kg. Females are smaller, reaching150 cm in length and 50 kg in weight.
Australian fur seals
The Australian fur seal also lives in Tasmanian waters but has light brown fur and lacksthe high-pitched aggression call of the New Zealand fur seal. Australian fur seals grow toabout 200 cm long with adult males weighing up to 280 kg and females 80 kg. Adultmales develop a mane of coarse light hair on the neck and shoulders. Adult females are aginger-brown to silver colour, and newborn pups are black.
Distribution, Habitat and Biology
New Zealand fur seals
The New Zealand fur seal occurs in Western Australian, South Australian, Tasmanianand New Zealand waters. In Tasmania the species only breeds off the south coast onMaatsuyker Island and two nearby islands, Walker and Little Witch (Table 1, Figure 1).Breeding colonies are located in small, boulder coves and around caves and crevices.Approximately 100 pups are born each year in Tasmanian waters. Females fertilised insummer suspend development of the embryo until April, so pups are born soon after thepregnant females arrive in the breeding area from early December until January. Pups,which weigh 4-6 kg at birth, are weaned at 8-10 months of age. Females start to breed at
Seal / Fishery Interaction Management Strategy – Background Report
4
about 6 years of age, while bulls are unlikely to hold a breeding harem and territory until9 years of age.
While New Zealand fur seals were relatively abundant in Tasmanian waters prior toEuropean sealing in the early 1800s, they now probably only number in the hundreds inthe Victorian and Tasmanian region. Many sites previously occupied by fur seals havenot been recolonised following their extirpation by sealers, and it is likely that many ofthese sites were New Zealand fur seal breeding colonies. Historical informationpresented by Warnecke (1982) indicates that the range of New Zealand fur seals extendedthrough Bass Strait including islands in the Furneaux group where it was abundant.
New Zealand fur seals are however more abundant in South Australia and WesternAustralia, where these populations are currently expanding (Shaughnessy et al. 1995;Gales et al. 2000) and there is potential for their breeding populations to increase, therebyincreasing the total seal abundance in the Victorian and Tasmanian region. There areinsufficient data on non-breeding, dispersing animals upon which to make anymeaningful assessment of population trends.
In Tasmania, New Zealand fur seals haul-out (come ashore to rest) at numerous islandsand shores around the coast but mainly in the southwest region. Breeding and haul-outareas are occupied all year round although the number of seals present at breeding sites ishighest from December to January and at haul-outs during autumn and winter.Occasionally individuals will come ashore on the mainland Tasmanian coastline. Theymay be resting, moulting or seeking new feeding sites and may stay in the area for daysto weeks until they have grown a new coat or are rested. Important haul-out (non-breeding) sites are listed in Table 1.
Australian fur seals
Australian fur seals are distributed along the coastline from New South Wales to SouthAustralia, and are the most commonly seen seal species in near-shore Tasmanian waters.Australian fur seals form dense territorial colonies during the breeding season, dominatedby individual males defending harems of up to 30 females. Females produce one pupevery one to two years, usually born during November to December. Pups, which weighbetween 5 and 12 kg at birth, usually suckle for 10-11 months, although some cows maysuckle a pup for up to four years. Females start to breed at about 5 years of age, whilemales will not typically hold a breeding territory until they are 8-13 years of age. Whenon land they prefer rocky islands and exposed reefs but forage widely in coastal seasextending over the continental shelf.
There are five breeding colonies of Australian fur seals in Tasmanian waters, all of whichare located in Bass Strait. Estimated pup production in Tasmanian waters was 3200 pupsin the 1999/2000 breeding season (Pemberton 2001). The Tasmanian pup productionrepresents on average less than a quarter of the overall production for the species, withthe most recent data from the Victorian colonies showing an annual pup production in theorder of 13,800 pups. The pup production rate for the species is then in the order of
Seal / Fishery Interaction Management Strategy – Background Report
5
17,000 pups giving a total population estimate of approximately 60,000 - 77,000Australian fur seals (Pemberton 2001).
Assessment of long-term population trends in Tasmanian colonies is rather speculativebecause of a paucity of historical data and inconsistency in survey methodology overtime and between areas. Estimates of seal numbers during the early years of sealing havebeen attempted using records of seal pelt cargoes. Such estimates are of dubious valuewhen one considers that multiple species and age classes were harvested and thereappears to have been considerable intentional misreporting and secrecy over harvestamounts. The estimates however suggest total seal and sea lion populations in the regionas being in the order of a few hundred thousand rather than millions of animals.
Surveys in the 1940's and 1970's yielded counts of about 11,000 individuals but it isdifficult to extrapolate actual abundance from these counts. Comparisons of aerialphotographs of breeding sites taken in the 1940’s with more recent photographs of thesame sites do not reveal differences in seal numbers or distribution of breeding animals atthe sites. A survey of Pedra Blanca in May 1949 yielded an estimate of seal populationon the island of 500 - 700 seals (A. M. Olsen, pers. comm.). Recent comparable surveyshave yielded similar figures (R. Gales, DPIWE, pers. comm). Estimates of the sealpopulation in the Victorian Bass Strait region by Dr Harold Thompson of CSIR in 1949were between 20,000 and 60,000 seals. These data do not show any compelling evidenceof population building or decline between the 1940s and more recent years when moresystematic survey work commenced.
Pup production in Tasmania in the 1991 season was estimated at 4500, considerably morethan the most recent estimate of 3200 in 1999 (both numbers were not corrected for earlypup mortality). Numbers at Tasmanian breeding sites are however quite variable fromyear to year so these data cannot be used to infer a decline over the period. Numbers atVictorian sites appear to have increased between 1991 and 1999 although the rate of thatincrease is variable between colonies. Best estimates of total (both Victorian andTasmanian) population in the region in 1991 were in the range of 47,000 to 60,000(about 13,300 pups) compared to the 60,000 to 77,000 estimate for 1999/2000. Careshould be taken when assessing the rate of change over this period, as the data are quitevariable from year to year.
It is important to appreciate that total population trends are perhaps more relevant thanlocal trends in Tasmania because there is clear evidence that seals breeding in Victoriaalso forage in Tasmanian waters. Overall, it appears that the total Australian fur sealpopulation in the region is increasing and may continue to do so as more territory isoccupied at the major Victorian breeding sites. A major increase would require theoccupation of breeding areas that have not been occupied since the 1800s. It is alsopossible that the already increasing New Zealand fur seal populations in WesternAustralia and South Australia may expand into Bass Strait increasing the overall numberof seals in the region. Predicting future population growth is heavily reliant uponassumptions about occupation of breeding sites and the impacts of weather on breedingsuccess. This makes further determinations of population trends difficult to verify.
Seal / Fishery Interaction Management Strategy – Background Report
6
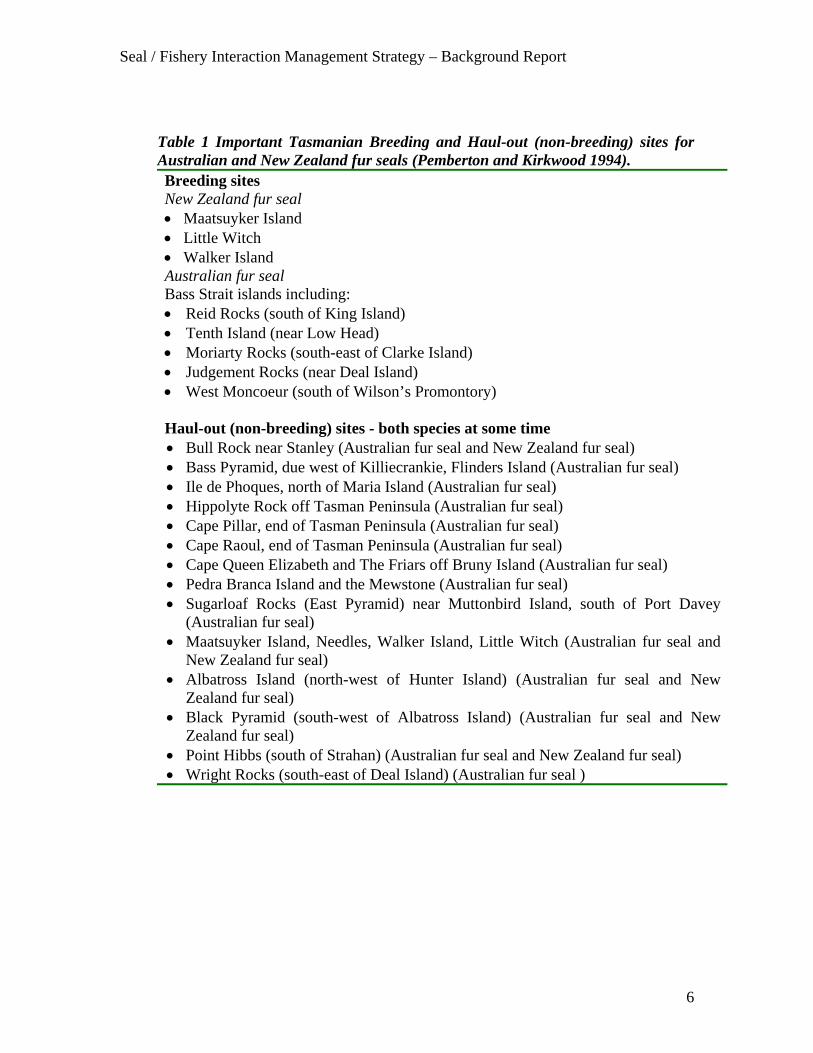
Table 1 Important Tasmanian Breeding and Haul-out (non-breeding) sites forAustralian and New Zealand fur seals (Pemberton and Kirkwood 1994).Breeding sitesNew Zealand fur seal• Maatsuyker Island• Little Witch• Walker IslandAustralian fur sealBass Strait islands including:• Reid Rocks (south of King Island)• Tenth Island (near Low Head)• Moriarty Rocks (south-east of Clarke Island)• Judgement Rocks (near Deal Island)• West Moncoeur (south of Wilson’s Promontory)
Haul-out (non-breeding) sites - both species at some time• Bull Rock near Stanley (Australian fur seal and New Zealand fur seal)• Bass Pyramid, due west of Killiecrankie, Flinders Island (Australian fur seal)• Ile de Phoques, north of Maria Island (Australian fur seal)• Hippolyte Rock off Tasman Peninsula (Australian fur seal)• Cape Pillar, end of Tasman Peninsula (Australian fur seal)• Cape Raoul, end of Tasman Peninsula (Australian fur seal)• Cape Queen Elizabeth and The Friars off Bruny Island (Australian fur seal)• Pedra Branca Island and the Mewstone (Australian fur seal)• Sugarloaf Rocks (East Pyramid) near Muttonbird Island, south of Port Davey
(Australian fur seal)• Maatsuyker Island, Needles, Walker Island, Little Witch (Australian fur seal and
New Zealand fur seal)• Albatross Island (north-west of Hunter Island) (Australian fur seal and New
Zealand fur seal)• Black Pyramid (south-west of Albatross Island) (Australian fur seal and New
Zealand fur seal)• Point Hibbs (south of Strahan) (Australian fur seal and New Zealand fur seal)• Wright Rocks (south-east of Deal Island) (Australian fur seal )
Seal / Fishery Interaction Management Strategy – Background Report
7
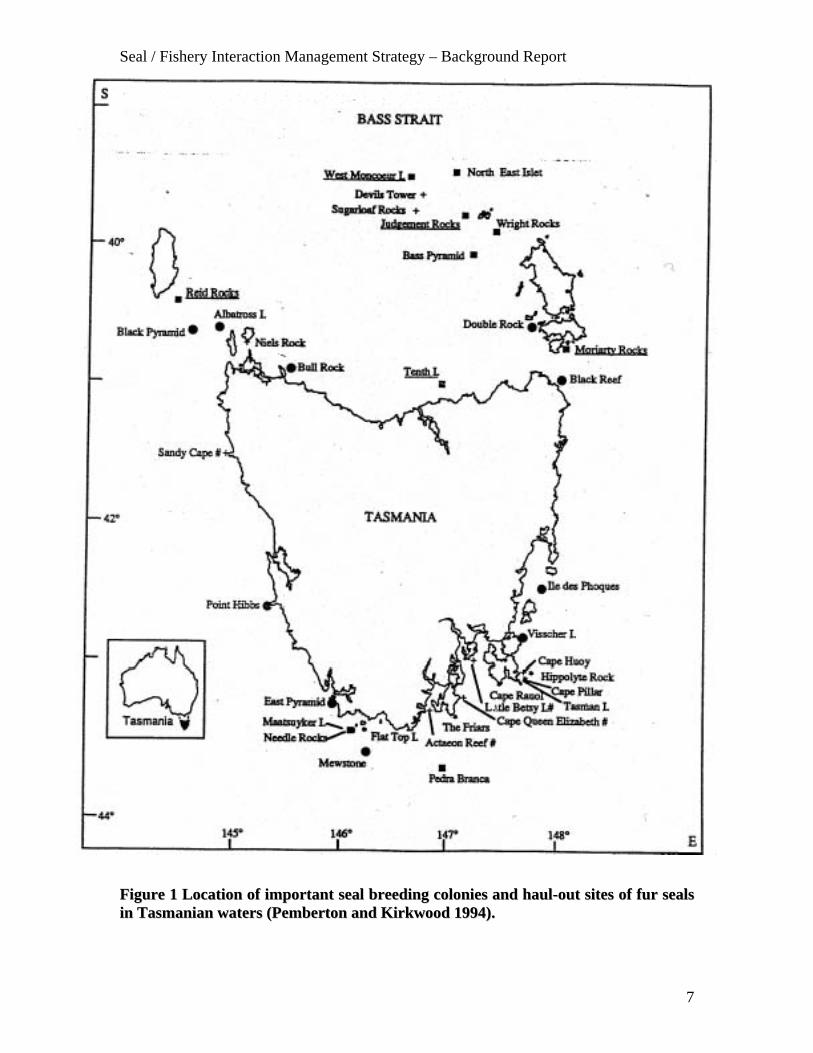
FFiigguurree 11 LLooccaattiioonn ooff iimmppoorrttaanntt sseeaall bbrreeeeddiinngg ccoolloonniieess aanndd hhaauull--oouutt ssiitteess ooff ffuurr sseeaallssiinn TTaassmmaanniiaann wwaatteerrss ((PPeemmbbeerrttoonn aanndd KKiirrkkwwoooodd 11999944))..
Seal / Fishery Interaction Management Strategy – Background Report
8
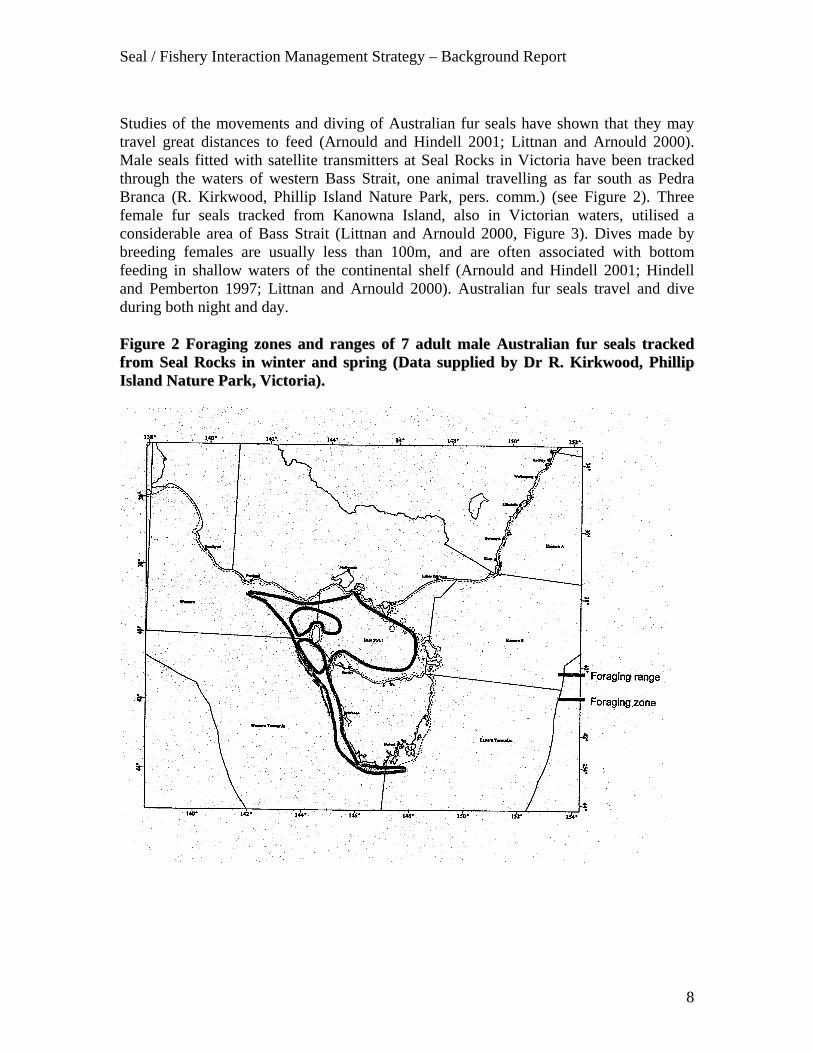
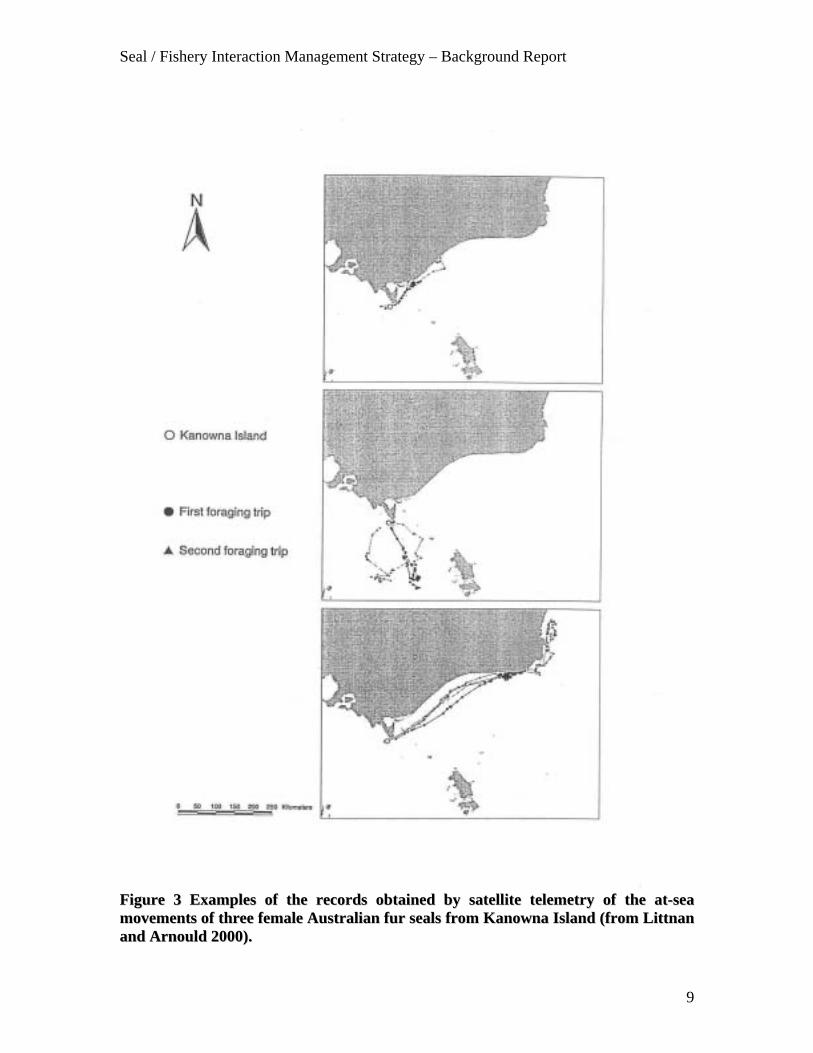
Studies of the movements and diving of Australian fur seals have shown that they maytravel great distances to feed (Arnould and Hindell 2001; Littnan and Arnould 2000).Male seals fitted with satellite transmitters at Seal Rocks in Victoria have been trackedthrough the waters of western Bass Strait, one animal travelling as far south as PedraBranca (R. Kirkwood, Phillip Island Nature Park, pers. comm.) (see Figure 2). Threefemale fur seals tracked from Kanowna Island, also in Victorian waters, utilised aconsiderable area of Bass Strait (Littnan and Arnould 2000, Figure 3). Dives made bybreeding females are usually less than 100m, and are often associated with bottomfeeding in shallow waters of the continental shelf (Arnould and Hindell 2001; Hindelland Pemberton 1997; Littnan and Arnould 2000). Australian fur seals travel and diveduring both night and day.
FFiigguurree 22 FFoorraaggiinngg zzoonneess aanndd rraannggeess ooff 77 aadduulltt mmaallee AAuussttrraalliiaann ffuurr sseeaallss ttrraacckkeeddffrroomm SSeeaall RRoocckkss iinn wwiinntteerr aanndd sspprriinngg ((DDaattaa ssuupppplliieedd bbyy DDrr RR.. KKiirrkkwwoooodd,, PPhhiilllliippIIssllaanndd NNaattuurree PPaarrkk,, VViiccttoorriiaa))..
Seal / Fishery Interaction Management Strategy – Background Report
9
FFiigguurree 33 EExxaammpplleess ooff tthhee rreeccoorrddss oobbttaaiinneedd bbyy ssaatteelllliittee tteelleemmeettrryy ooff tthhee aatt--sseeaammoovveemmeennttss ooff tthhrreeee ffeemmaallee AAuussttrraalliiaann ffuurr sseeaallss ffrroomm KKaannoowwnnaa IIssllaanndd ((ffrroomm LLiittttnnaannaanndd AArrnnoouulldd 22000000))..
Seal / Fishery Interaction Management Strategy – Background Report
10
Chapter 3 - The Extent of Interactions.
Seal interactions with wild fisheries and aquaculture are not unique to Tasmania, andmany other countries have similar problems. It is clear that there is no easy solution orfoolproof management strategy that could be adopted in Tasmania. Once it isacknowledged that some level of interaction will occur in the presence of fishing andaquaculture, the focus shifts from trying to eliminate the problem to the more effectivemanagement of the interactions.
In Tasmania, the nature of the interactions (and mitigation measures) has been the subjectof investigation by biologists over the last ten years (Pemberton and Shaughnessy 1993;Pemberton, Gales and Skira 1995; Schotte and Pemberton 2000).
3.1 Fishing
3.1.1 Historical
A brief scan of Tasmanian history reveals that seal/fisheries interactions occurredthroughout the 1900s. Seal/fisheries interactions are not a new phenomenon, nor areGovernment’s attempts to balance the conservation of seals with protecting the interestsof fishers.
There are well documented instances of fishers seeking Government help to control sealsinterfering with nets in the Tamar in 1916, around Flinders Island in the 1920s and in theTasmanian southeast in 1940 and 1949 (see Attachment 3).
3.1.2 Present
Cuthbertson (2000a) sets out in detail the interaction between seals and scale fishing insouth-east Tasmania4. He records the types of seals involved, typical behaviour patterns,and fishing related activities likely to attract seals.
To evaluate the current situation the MMIC conducted a survey of all commercial andrecreational fishers in Tasmania. A total of 153 questionnaire forms were returned.Commercial scale fishers accounted for 47% of surveys returned, 79% of fishers usinggrab-all netting. Fifty percent of those respondents experiencing seal interactions reporteddaily interactions with seals. Of these the most common type of interaction (77%) wasthe taking of fish from nets followed by net damage (24%). These two types ofinteraction were attributed equal economic importance by many fishers5.
4 Cuthbertson M, Jaws of Debt, Mark Cuthbertson, Saltwater River Tas.24p.5 Summary of questionnaire responses at Attachment 4.
Seal / Fishery Interaction Management Strategy – Background Report
11
Interactions with seals varied greatly in relation to season, location and fishing method.Further, within a fishery, some fishers record sporadic levels of interaction while othershad daily interactions when fishing. Many fishers were of the opinion that seal numbershad increased in the last decade and that for some fisheries, eg. commercial gill netting,rates of interaction had increased steadily over time. It is important to note that,regardless of any perceived increase in seal numbers, several cray-fishers suggested thatthe level of interaction at present is similar to that 15-20 years ago. Very few fisherscalled directly for a cull of seals, while about 10% of commercial scalefishers admitted toshooting seals interacting with their fishing gear.
It was evident from this survey that the impact on the commercial and recreational gillnet fishery far exceeded that on other fisheries.
3.1.3 Scalefish Fishery
Access to this fishery is restricted to those fishers who hold a fishing licence (scalefish)and fishing licence (vessel). The scalefish fishery, up until 1994, operated with minimalmanagement controls or limits on total catch and total effort. Other controls in thefishery include minimum size limits for key species and associated mesh size regulations.Areas closed to fishing apply principally in shark or fish nursery areas, and areasvulnerable to netting such as river mouths and estuaries. Limits on fishing gear alsoapply in some regions.
When the scalefish fishery management plan was introduced in 1998, controls andrestrictions on the amount of fishing gear that could be used in State waters were imposedon all scalefish fishers. Unlike the abalone and rock lobster fisheries, the scalefishfishery is predominantly managed by input (gear) controls, rather than output (catch)controls.
The principal fishing methods used for taking scalefish in Tasmanian waters are gillnets,multiple hooks deployed on longlines and various seine nets. Other methods such asdroplining, trolling, trapping, spearing and dipnetting are also used to take scalefish andcephalopods.
Key target species landed in the commercial fishery include blue and spotted warehou(Seriolella brama & S. punctata), silver trevally (Pseudocaranx dentex), various speciesof flathead (Platycephalus spp.) and flounder (mainly Pleuronectidae), jackass morwong(Nemadactylus macropterus), bastard and striped trumpeter (Latridopsis forsteri & Latrislineata), arrow squid (Nototodarus gouldi), Australian salmon (Arripis trutta) and garfish(Hyporhamphus melanochir). All are destined for the table fish market. Developments inmarkets and fish handling have recently seen significant increases in effort targeted atspecies such as banded morwong (Cheilodactylus spectablis) and wrasses (of the genusNotolabris). These rocky reef species are sold on the premium 'live fish' market.
The Tasmanian jack mackerel fishery has also operated under separate managementarrangements except for small scale operators (operators with boats less than 20m) whoare subject to the general scalefish management regime.
Seal / Fishery Interaction Management Strategy – Background Report
12
Other species taken as a significant bycatch or as a limited seasonal target species includeschool whiting (Sillago bassensis) and southern calamari (Sepioteuthis australis). Whilenot true 'scalefish', shark (particularly school shark (Galeorhinus galeus) and gummyshark (Mustelus antarcticus)) are an important part of the catch in State fishing waters interms of both volume and value.
In summary, the fleet is highly diverse and target species and configuration change bothseasonally and by area. The fleet is highly dynamic and responsive to changes in marketsand demand.
3.2 Interactions with seals in relation to fishing methodThe lack of available published data has made assessing the level of interaction and itsimpact on Tasmanian fishers difficult. For a comprehensive understanding of interactionswith seals it would be necessary to institute a formal and regular process of datagathering.
3.2.1 Gill Netting
Tasmanian gill net fishers report varying levels of interaction with seals. Seals may bepresent during fishing operations or follow boats to fishing areas. Interactions range fromno interaction through to the taking of fish from nets and/or the damage of fish, gear andnets. The incidental catch of seals in commercial gillnets has also been recorded by somefishers.
Seal interactions with the live fish gill net fishery were reported as a ‘serious problem’ byPemberton et al. (1998) after numerous fishers contacted Parks and Wildlife. Observersspent 22 days at sea on 38 commercial gill-netting trips May-July 1997 to investigaterates of interaction and prospects of solutions. Seals were observed on 15 occasions.Three seals damaged six nets on one day and seals were also observed throwing fish ontwo occasions (Pemberton et al. 1998).
Gill nets for live species are usually bottom set6. Underwater predation of fish is difficultto detect at depth, although seals are sighted taking fish while nets are hauled. Variablelosses of catch are attributed to seals. At least one fisher reported leaving the fishery,citing seals as the ‘last straw’. Many fishers report extreme frustration and personalstress at witnessing the taking of fish by seals. The negative economic impact of seals ongill net fishing is widely experienced within the industry.
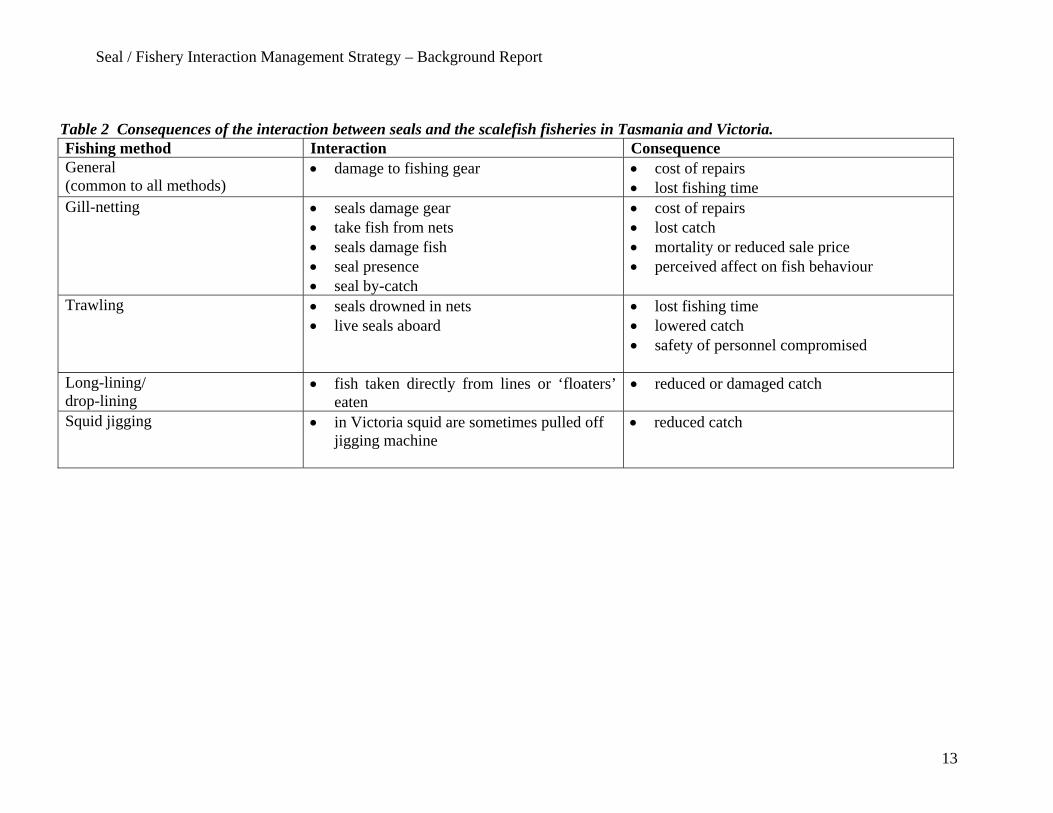
All scalefish fisheries are subject to natural variability within the marine environmentaffecting productivity, stock availability and recruitment. Some fisheries are weatherdependent (eg. drop-lining and gill-netting) while others can be subject to increasedfishing effort in some years. Other impacts affecting various methods of fishing forscalefish species are summarised in Table 2. 6 A weighted net is set vertically above a reef at depths of up to 20m
Seal / Fishery Interaction Management Strategy – Background Report
13
Table 2 Consequences of the interaction between seals and the scalefish fisheries in Tasmania and Victoria.Fishing method Interaction ConsequenceGeneral(common to all methods)
• damage to fishing gear • cost of repairs• lost fishing time
Gill-netting • seals damage gear• take fish from nets• seals damage fish• seal presence• seal by-catch
• cost of repairs• lost catch• mortality or reduced sale price• perceived affect on fish behaviour
Trawling • seals drowned in nets• live seals aboard
• lost fishing time• lowered catch• safety of personnel compromised
Long-lining/drop-lining
• fish taken directly from lines or ‘floaters’eaten
• reduced or damaged catch
Squid jigging • in Victoria squid are sometimes pulled offjigging machine
• reduced catch
Seal / Fishery Interaction Management Strategy – Background Report
14
3.2.2 Other fisheries
The extent of seal interaction with rock lobster fishing gear is difficult to assessbut is likely to be small. Many operators report having either no interactions withseals or low and sporadic levels of interaction. The most frequently reportedtypes of interactions include pulling bait out of savers, predation or damage toundersize rock lobsters whilst being released, or the eating of ‘softshellers’ duringthe non-fishing season. One rock lobster fisher on the West Coast of Tasmaniareported catching 2-3 juvenile fur seals per year drowned in rock lobster pots.Inadequate information precludes an accurate assessment of interactions, as rocklobster pots are often set overnight and at considerable depth. Therefore, whilesome bait loss may be attributable to seal predation, other predators (e.g. octopus)and the loosening of bait skewers during the setting of pots or rough weather maybe equally responsible.
Rock lobster catches may also be affected by octopus predation. Octopus willenter rock lobster pots and may kill all rock lobsters in a pot. Many fishersacknowledge that as octopus are a prey item of Australian fur seals, seal predationmay help regulate octopus numbers and therefore rock lobster mortality.
No interactions between giant crab fishing operations and seals have beenreported.
Very few abalone divers have reported negative interactions with seals. In arecent survey of fishers, however, one out of five abalone divers reportedaggressive behaviour encounters with seals. The majority of interactions includeplayful pulling of fins while diving, although in some cases divers have beenfrightened by large seals darting around at high speed.
3.3 Marine farming
3.3.1 Salmonid farming
Salmonid farming occurs in many temperate regions of the world, with themajority of production occurring in Norway, Chile, the United Kingdom(Scotland) and Canada (British Columbia) (Table 3). In many regions salmonidaquaculture overlaps with the breeding and/or foraging ranges of pinnipedspecies. However, only in British Columbia, Washington State (USA), Chile,New Zealand and Australia, do interactions occur with otariids (fur seals and sealions).
Seal / Fishery Interaction Management Strategy – Background Report
15
Table 3 World Production of Farmed Salmon in 1988, 1995 and 19971988 Production 1995 Production 1997 Production‘000
Tonnes%
Share‘000
Tonnes%
Share‘000
Tonnes%
ShareNorway 80.3 57.5 251.0 45.5 316.0 52.0Chile 3.1 2.2 126.3 22.9 96.0 16.0United Kingdom 17.6 12.6 65.0 11.8 86.0 14.0British Columbia 6.6 4.7 23.8 4.3 40.0 7.0Ireland 4.2 3.0 16.0 2.9 15.0 2.0Eastern Canada 3.3 2.4 14.7 2.7 * *United States 2.0 1.4 14.7 2.7 22.0 4.0Japan 14.1 10.1 14.1 2.5 ? ?Faroe Islands 3.4 2.4 12.4 2.2 20.0 3.0Other Countries 5.1 3.7 13.9 2.5 11.0 1.5
* British Columbia and Eastern Canada included as one figure for Canadian production underEastern Canada (Anon 1997)
The farming of salmonids has grown into one of Tasmania's major primaryindustries in little more than a decade. Growth has continued to be rapid in recentyears. In 1998/99 production was 9,195 tonnes with a farm gate value of $71.1m
(Figure 4; ABARE FisheriesStatistics, 2000). Projectionsare for the industry to doubleby 2005 (Anon 1999).Industry surveys by theTasmanian SalmonidGrowers Association Board toDecember 2001 showed thatsales had expanded to 12,118tonnes for the calendar year2001. The industry willcontinue to grow in 2002.Due to a high degree of valueadding, the value of theTasmanian industry at firstpoint of sale is estimated at$160,000,000 in 2002 (O.Carington Smith, TSGA,Pers. comm.).
FFiigguurree 44.. CCuurrrreenntt aanndd pprreeddiicctteedd ssaallmmoonn pprroodduuccttiioonn((tt)) aanndd iittss vvaalluuee iinn TTaassmmaanniiaa ((11999955--22000055))..
0
5000
10000
15000
20000
25000
1996/97 1997/98 1998/99 1999/00 2000/01 2001/02 2002/03 2003/04 2004/05
Prod
uctio
n(to
nnes
)
0
10
20
30
40
50
60
70
80
90
100
Valu
e(m
illio
n$)
Annual production
Value
Seal / Fishery Interaction Management Strategy – Background Report
16
The salmonid industry provided direct employment for 623 Full Time Equivalent(FTE) positions in 1999/2000 (Deloitte Touche Tohmatsu 2000). In 2001/2002FTEs have grown to 925 due to industry growth, higher levels of value addingand more employment required on farms to manage difficult environmentalconditions. Over 100 companies are now supplying goods and services to theindustry (O. Carington Smith, TSGA, Pers. comm.).
Seal / Fishery Interaction Management Strategy – Background Report
17
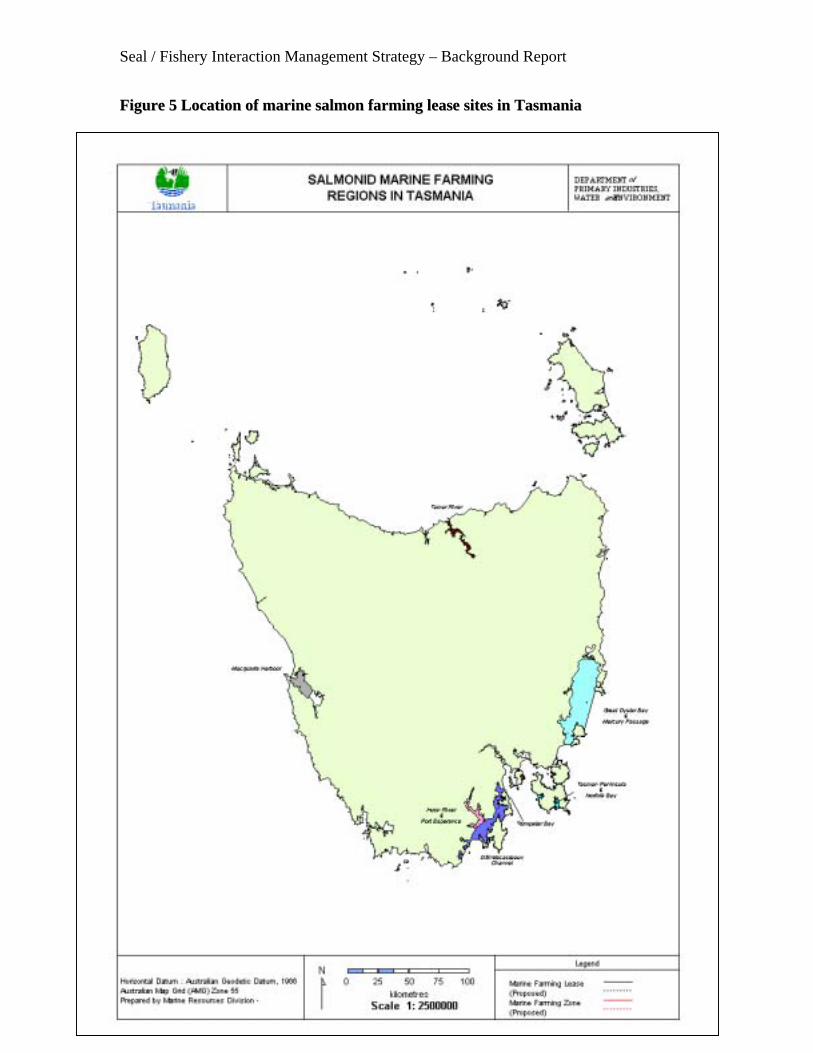
FFiigguurree 55 LLooccaattiioonn ooff mmaarriinnee ssaallmmoonn ffaarrmmiinngg lleeaassee ssiitteess iinn TTaassmmaanniiaa
Seal / Fishery Interaction Management Strategy – Background Report
18
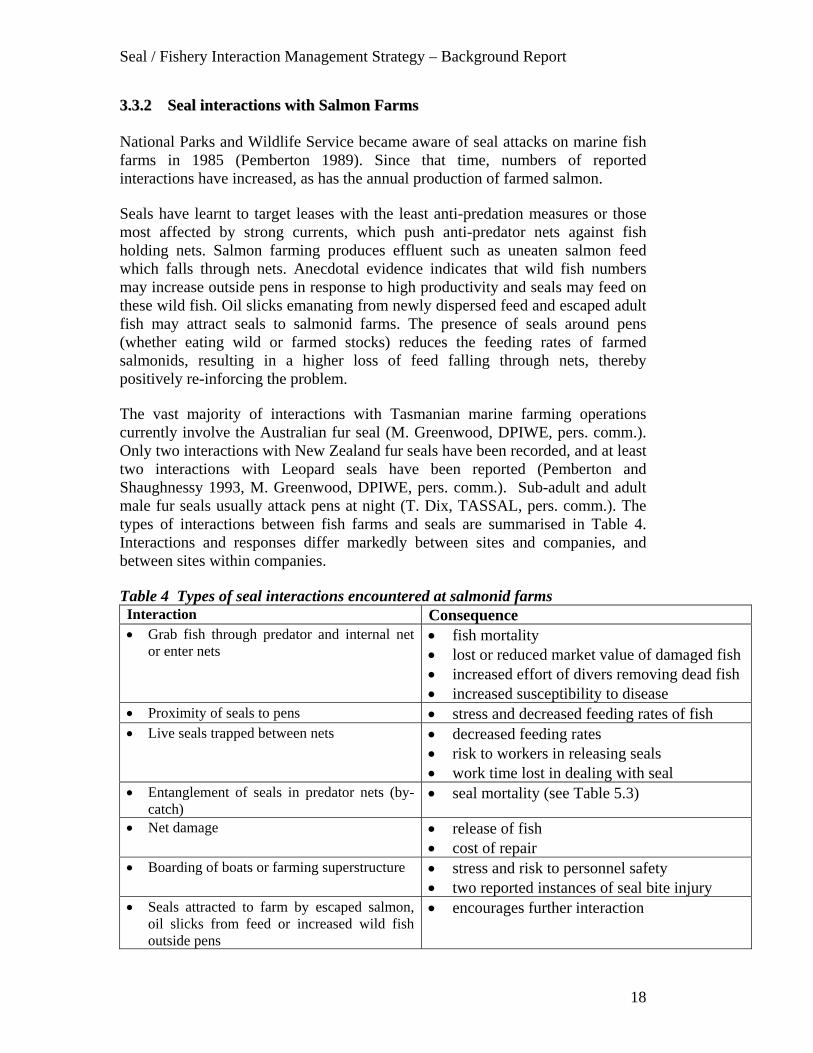
33..33..22 SSeeaall iinntteerraaccttiioonnss wwiitthh SSaallmmoonn FFaarrmmss
National Parks and Wildlife Service became aware of seal attacks on marine fishfarms in 1985 (Pemberton 1989). Since that time, numbers of reportedinteractions have increased, as has the annual production of farmed salmon.
Seals have learnt to target leases with the least anti-predation measures or thosemost affected by strong currents, which push anti-predator nets against fishholding nets. Salmon farming produces effluent such as uneaten salmon feedwhich falls through nets. Anecdotal evidence indicates that wild fish numbersmay increase outside pens in response to high productivity and seals may feed onthese wild fish. Oil slicks emanating from newly dispersed feed and escaped adultfish may attract seals to salmonid farms. The presence of seals around pens(whether eating wild or farmed stocks) reduces the feeding rates of farmedsalmonids, resulting in a higher loss of feed falling through nets, therebypositively re-inforcing the problem.
The vast majority of interactions with Tasmanian marine farming operationscurrently involve the Australian fur seal (M. Greenwood, DPIWE, pers. comm.).Only two interactions with New Zealand fur seals have been recorded, and at leasttwo interactions with Leopard seals have been reported (Pemberton andShaughnessy 1993, M. Greenwood, DPIWE, pers. comm.). Sub-adult and adultmale fur seals usually attack pens at night (T. Dix, TASSAL, pers. comm.). Thetypes of interactions between fish farms and seals are summarised in Table 4.Interactions and responses differ markedly between sites and companies, andbetween sites within companies.
Table 4 Types of seal interactions encountered at salmonid farmsInteraction Consequence• Grab fish through predator and internal net
or enter nets• fish mortality• lost or reduced market value of damaged fish• increased effort of divers removing dead fish• increased susceptibility to disease
• Proximity of seals to pens • stress and decreased feeding rates of fish• Live seals trapped between nets • decreased feeding rates
• risk to workers in releasing seals• work time lost in dealing with seal
• Entanglement of seals in predator nets (by-catch)
• seal mortality (see Table 5.3)
• Net damage • release of fish• cost of repair
• Boarding of boats or farming superstructure • stress and risk to personnel safety• two reported instances of seal bite injury
• Seals attracted to farm by escaped salmon,oil slicks from feed or increased wild fishoutside pens
• encourages further interaction
Seal / Fishery Interaction Management Strategy – Background Report
19
3.4. Tourism and Social ImpactsThe educational and recreational benefits of seal watching to the local economyhave spawned a new and growing industry. In Australia seal watching has grownrapidly with recent estimates of visitation to tourist sites amounting to nearly400,000 tourists per year (R. Kirkwood, Phillip Island Nature Park pers. com.).Ticket sales alone are estimated at approximately $5 million per annum and, withmultiplier effects, make this an important contributor to regional economies.Eight operators currently conduct seal watching tours in Tasmanian watersincluding the Friars (Bruny Island), Hippolyte Rock, Ile des Phoques, TasmanIsland, Tenth Island, Bull Rock and occasionally Moriarty Rocks. Estimatedvisitation in Tasmania is 624 tourists per year valued at $US9,360 in total.
Interactions between tourist operators and seals may on the other hand also benegative. This depends on the level of interaction and the time of year, forexample, close approaches by boat during the breeding season may be disruptive.Nature Conservation Branch Guidelines, DPIWE 7, are designed to minimise thiseffect.
7 Includes no landing on colonies and prescribes boat approach distances
Seal / Fishery Interaction Management Strategy – Background Report
20
Chapter 4 - The Economic Impact of the Interactions.
4.1 Fishing
4.1.1 Tasmania
In 2001, survey forms were sent to all holders of a fishing licence (personal), sothat information on seal interactions could be obtained from all current licenceholders that fished for commercial purposes in the last 12 months. The results ofthis survey are summarised in Attachment 7.
Of the 615 survey forms sent out, 216 were returned. In terms of sealinteractions, 147, or 68% of the respondents stated that their fishing operationshad been interfered with by a seal, either directly or simply due to their presence,in the previous 12 months.
Fishing activities were categorised into the following sectors:• Abalone diving• Rock lobster fishing• Rock lobster and scalefishing• Scalefishing (live fishing, general scalefishing and Commonwealth fisheries)
Of the respondents who had conducted both scalefishing and rock lobster fishingactivities over the last 12 months and had experienced some form of sealinterference, 77% indicated that seals had interfered with both their scalefishingand lobster potting. Of the respondents who had been involved in the live fish(banded morwong and wrasse) fisheries, 100% had experienced seal interferencewith their fishing activities. Abalone divers who had experienced sealinterference in the last 12 months had mainly been harassed by seals whilstdiving. There are difficulties in attempting to attribute costs to this form ofinterference.
Graball netting accounts for most of the commercial fishing interactions thatoccur with seals. The types of interactions for this method are mainly damage tothe gear (broken meshes), taking caught fish and damage to the fish. Geardamage doesn’t appear to be a significant factor for the line fisheries, where themajority of interactions are due to seals actively taking/damaging fish on the line.These types of interactions are significant and can present difficulties in terms ofattributing and estimating costs. Seal interactions with rock lobster potting tendsto be directly due to the seals attempting to take bait from the pots, causing geardamage to the pots and bait savers. Fishers have remedied this situation byimproving the way in which bait is secured in the pots.
Seal / Fishery Interaction Management Strategy – Background Report
21
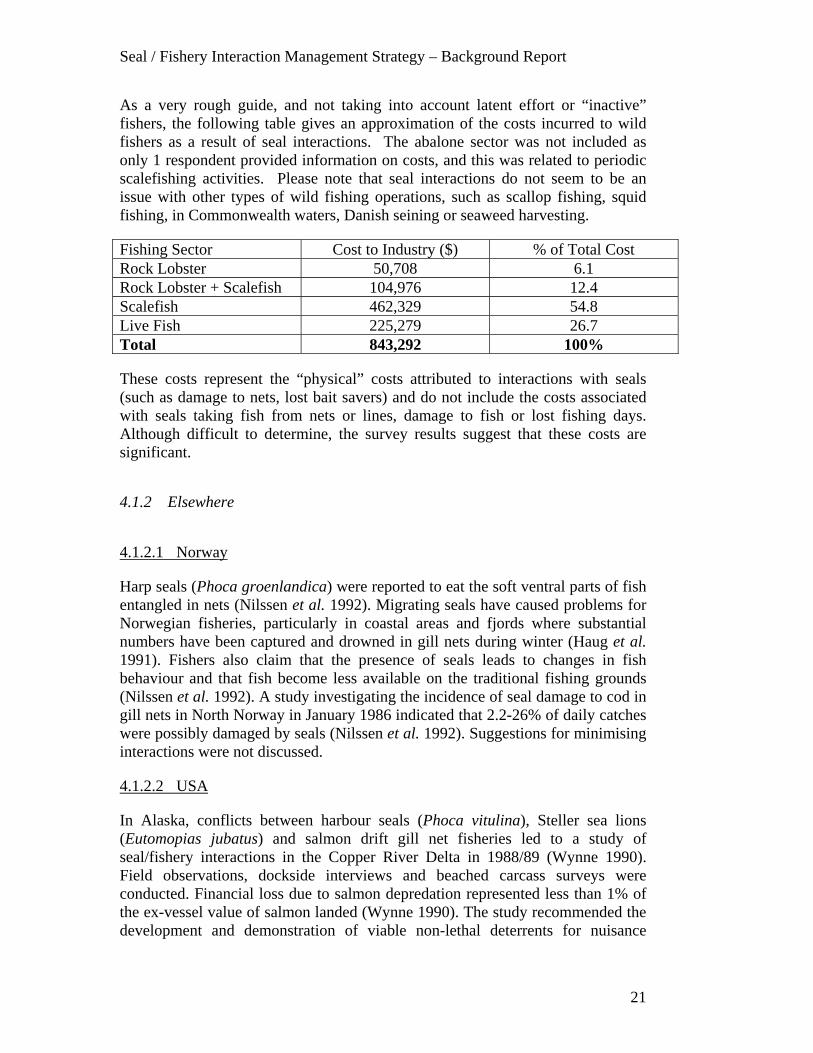
As a very rough guide, and not taking into account latent effort or “inactive”fishers, the following table gives an approximation of the costs incurred to wildfishers as a result of seal interactions. The abalone sector was not included asonly 1 respondent provided information on costs, and this was related to periodicscalefishing activities. Please note that seal interactions do not seem to be anissue with other types of wild fishing operations, such as scallop fishing, squidfishing, in Commonwealth waters, Danish seining or seaweed harvesting.
Fishing Sector Cost to Industry ($) % of Total CostRock Lobster 50,708 6.1Rock Lobster + Scalefish 104,976 12.4Scalefish 462,329 54.8Live Fish 225,279 26.7Total 843,292 100%
These costs represent the “physical” costs attributed to interactions with seals(such as damage to nets, lost bait savers) and do not include the costs associatedwith seals taking fish from nets or lines, damage to fish or lost fishing days.Although difficult to determine, the survey results suggest that these costs aresignificant.
4.1.2 Elsewhere
4.1.2.1 Norway
Harp seals (Phoca groenlandica) were reported to eat the soft ventral parts of fishentangled in nets (Nilssen et al. 1992). Migrating seals have caused problems forNorwegian fisheries, particularly in coastal areas and fjords where substantialnumbers have been captured and drowned in gill nets during winter (Haug et al.1991). Fishers also claim that the presence of seals leads to changes in fishbehaviour and that fish become less available on the traditional fishing grounds(Nilssen et al. 1992). A study investigating the incidence of seal damage to cod ingill nets in North Norway in January 1986 indicated that 2.2-26% of daily catcheswere possibly damaged by seals (Nilssen et al. 1992). Suggestions for minimisinginteractions were not discussed.
4.1.2.2 USA
In Alaska, conflicts between harbour seals (Phoca vitulina), Steller sea lions(Eutomopias jubatus) and salmon drift gill net fisheries led to a study ofseal/fishery interactions in the Copper River Delta in 1988/89 (Wynne 1990).Field observations, dockside interviews and beached carcass surveys wereconducted. Financial loss due to salmon depredation represented less than 1% ofthe ex-vessel value of salmon landed (Wynne 1990). The study recommended thedevelopment and demonstration of viable non-lethal deterrents for nuisance
Seal / Fishery Interaction Management Strategy – Background Report
22
animals. The systematic testing of acoustic deterrents, rubber bullets and crackershells was also recommended (Wynne 1990).
In California, National Marine Fisheries Service (NMFS) observers monitoredseal depredation in the halibut and angel shark set gill-net fishery during a four-year period (1990-1994), recording depredation in 19% of 60,967 sets (Beesonand Hanan 1996). Commercial fishermen reported that seals could damage 10-30% of daily catches, while individuals claimed losses of US$1000-$20,000annually in terms of gear damage and catch loss (Beeson and Hanan 1996).Marine mammal mortality was also estimated for the same period from NMFSobserver data, commercial fishers’ logbooks and receipts of landed fish sales(Julian and Beeson 1998). An estimated 729 to 3438 sea lions per year wereentangled in nets in these fisheries (Gearin et al. 1988a). This study alsorecommended killing habituated animals to decrease overall depredation, howeverinteractions in this instance involved endangered fish stocks.
4.1.2.3 Japan
In 1993, 1725 gill nets in the Hokkaido region were reportedly damaged bySteller sea lions (Eumetopias Jubatus). Gear damage in total (2173 incidents)was estimated to be worth 500 million yen (US$5 million) (Akamatsu et al.1996).
4.2 Marine farming in TasmaniaSome records of seal interactions and their impact have been collected byindustry, however as the information is not collected in a consistent form acrossindustry, comparisons are difficult. To assist in the quantification andqualification of seal interactions and their impact information must be collected ina consistent form.
In response to a request for information regarding interactions between seals andsalmonid marine farms, marine farmers provided a variety of information. Wherepossible, this information has been summarised and included in this report.
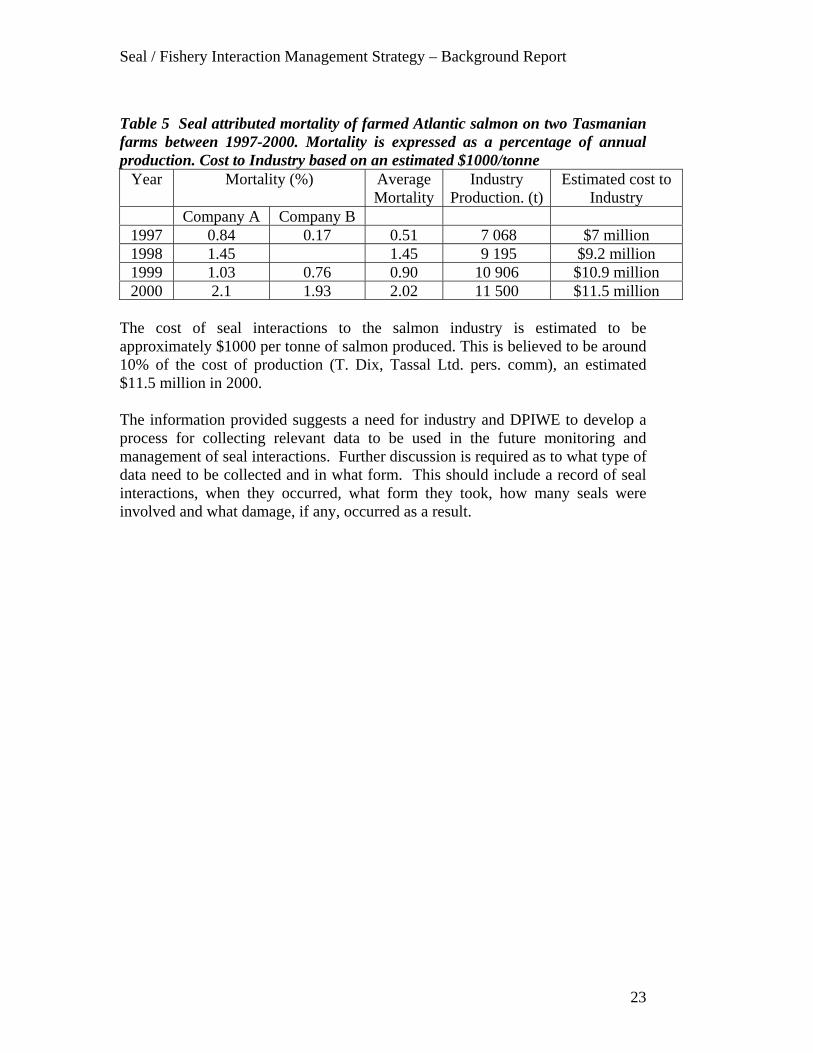
Table 5 summarises data provided by two Tasmanian companies on sealattributed mortality of farmed salmon.
Seal / Fishery Interaction Management Strategy – Background Report
23
Table 5 Seal attributed mortality of farmed Atlantic salmon on two Tasmanianfarms between 1997-2000. Mortality is expressed as a percentage of annualproduction. Cost to Industry based on an estimated $1000/tonne
Year Mortality (%) AverageMortality
IndustryProduction. (t)
Estimated cost toIndustry
Company A Company B1997 0.84 0.17 0.51 7 068 $7 million1998 1.45 1.45 9 195 $9.2 million1999 1.03 0.76 0.90 10 906 $10.9 million2000 2.1 1.93 2.02 11 500 $11.5 million
The cost of seal interactions to the salmon industry is estimated to beapproximately $1000 per tonne of salmon produced. This is believed to be around10% of the cost of production (T. Dix, Tassal Ltd. pers. comm), an estimated$11.5 million in 2000.
The information provided suggests a need for industry and DPIWE to develop aprocess for collecting relevant data to be used in the future monitoring andmanagement of seal interactions. Further discussion is required as to what type ofdata need to be collected and in what form. This should include a record of sealinteractions, when they occurred, what form they took, how many seals wereinvolved and what damage, if any, occurred as a result.
Seal / Fishery Interaction Management Strategy – Background Report
24
Chapter 5 - The Conservation Impact of the Interactions.
Biological interactions (such as competition for resources) between species inmarine ecosystems are very complex. Internationally, attention has focused onmarine mammals being perceived as major predators of some fisheries. Seals aremore visible than other marine predators and, because they can visibly interactand damage gear, are often seen as a ‘nuisance’ by fishers (Yodzis 2001). Anunderstanding of ecosystem complexity and seal ecology (including diet andenergy consumption) is necessary to determine the relationship between predatorsand the exploited fish stock. Only direct interactions between individual fishingmethods and seals have been described.
5.1 Fishing operationsAn unknown number of seals, and other marine mammals, in Tasmania aredrowned in gill netting by both commercial and amateur fishers. Results of theSeal/Fishery Interaction Questionnaire 2000 show that a minimum of 9% of 126commercial fishers recorded seal by-catch in their nets.
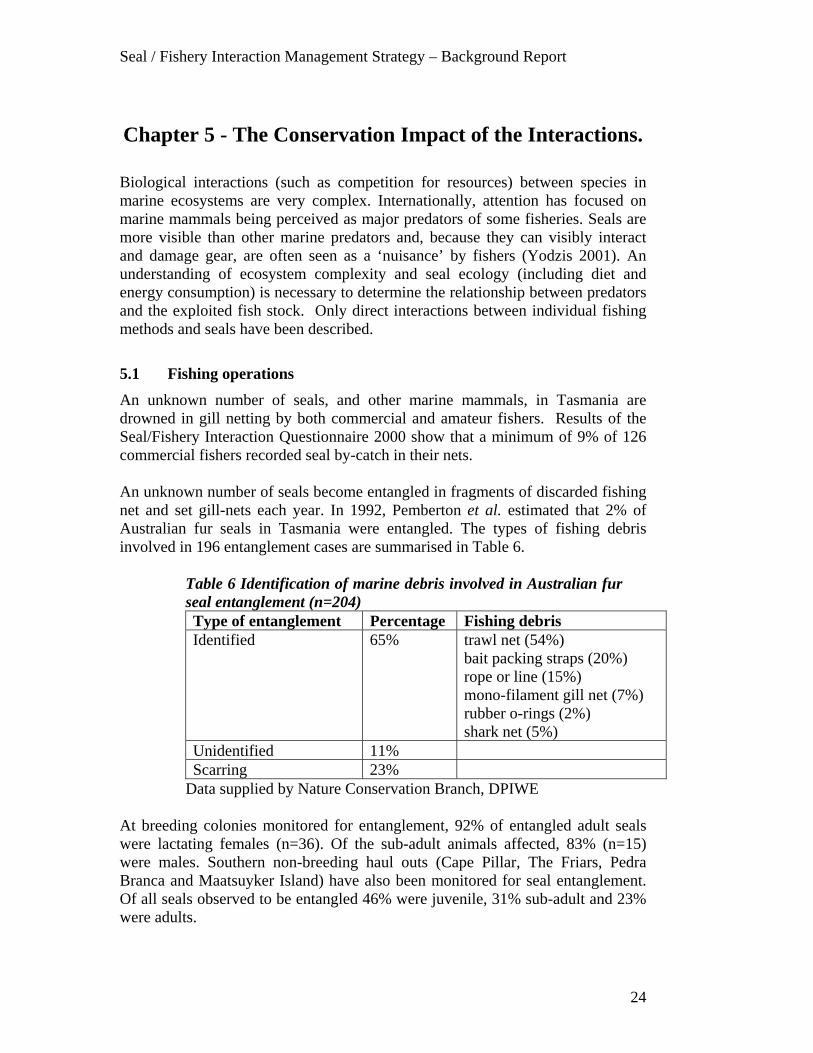
An unknown number of seals become entangled in fragments of discarded fishingnet and set gill-nets each year. In 1992, Pemberton et al. estimated that 2% ofAustralian fur seals in Tasmania were entangled. The types of fishing debrisinvolved in 196 entanglement cases are summarised in Table 6.
Table 6 Identification of marine debris involved in Australian furseal entanglement (n=204)Type of entanglement Percentage Fishing debrisIdentified 65% trawl net (54%)
bait packing straps (20%)rope or line (15%)mono-filament gill net (7%)rubber o-rings (2%)shark net (5%)
Unidentified 11%Scarring 23%
Data supplied by Nature Conservation Branch, DPIWE
At breeding colonies monitored for entanglement, 92% of entangled adult sealswere lactating females (n=36). Of the sub-adult animals affected, 83% (n=15)were males. Southern non-breeding haul outs (Cape Pillar, The Friars, PedraBranca and Maatsuyker Island) have also been monitored for seal entanglement.Of all seals observed to be entangled 46% were juvenile, 31% sub-adult and 23%were adults.
Seal / Fishery Interaction Management Strategy – Background Report
25
5.2 Fishing and food for seals
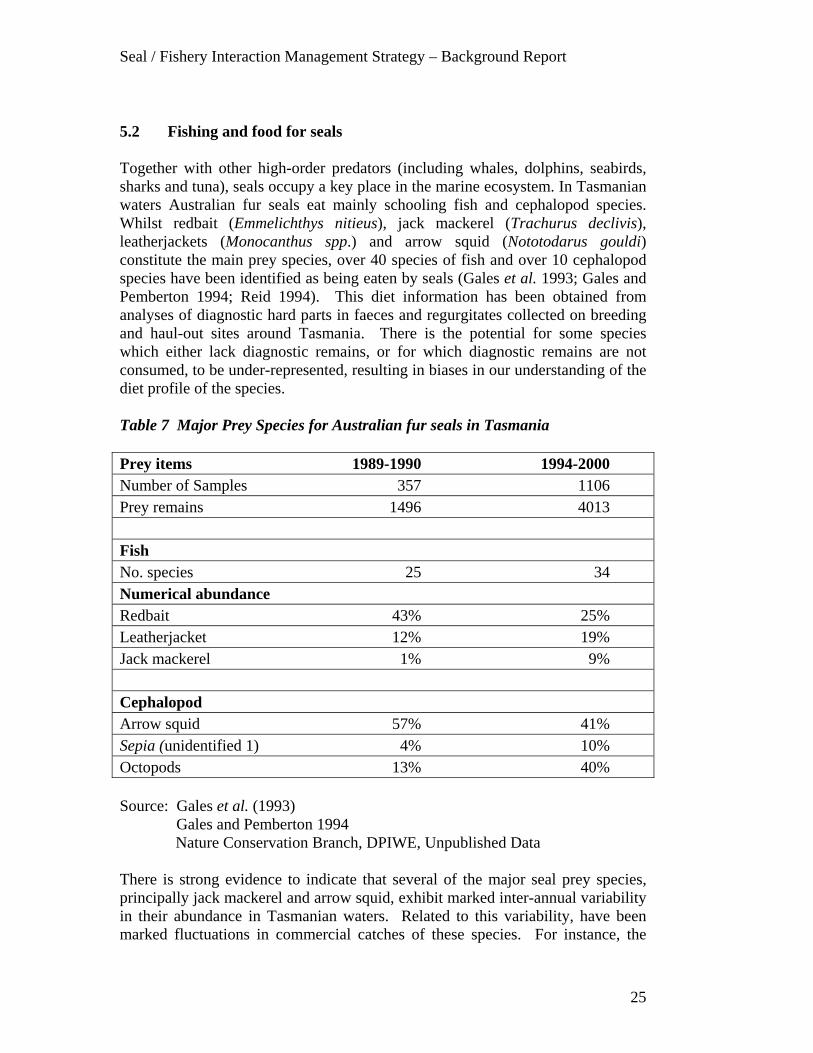
Together with other high-order predators (including whales, dolphins, seabirds,sharks and tuna), seals occupy a key place in the marine ecosystem. In Tasmanianwaters Australian fur seals eat mainly schooling fish and cephalopod species.Whilst redbait (Emmelichthys nitieus), jack mackerel (Trachurus declivis),leatherjackets (Monocanthus spp.) and arrow squid (Nototodarus gouldi)constitute the main prey species, over 40 species of fish and over 10 cephalopodspecies have been identified as being eaten by seals (Gales et al. 1993; Gales andPemberton 1994; Reid 1994). This diet information has been obtained fromanalyses of diagnostic hard parts in faeces and regurgitates collected on breedingand haul-out sites around Tasmania. There is the potential for some specieswhich either lack diagnostic remains, or for which diagnostic remains are notconsumed, to be under-represented, resulting in biases in our understanding of thediet profile of the species.
Table 7 Major Prey Species for Australian fur seals in Tasmania
Prey items 1989-1990 1994-2000Number of Samples 357 1106Prey remains 1496 4013
FishNo. species 25 34Numerical abundanceRedbait 43% 25%Leatherjacket 12% 19%Jack mackerel 1% 9%
CephalopodArrow squid 57% 41%Sepia (unidentified 1) 4% 10%Octopods 13% 40%
Source: Gales et al. (1993)Gales and Pemberton 1994
Nature Conservation Branch, DPIWE, Unpublished Data
There is strong evidence to indicate that several of the major seal prey species,principally jack mackerel and arrow squid, exhibit marked inter-annual variabilityin their abundance in Tasmanian waters. Related to this variability, have beenmarked fluctuations in commercial catches of these species. For instance, the
Seal / Fishery Interaction Management Strategy – Background Report
26
commercial fishery for jack mackerel developed rapidly off the east coast ofTasmania in the mid-1980s, with catches peaking at over 35,000 tonnes in1986/87 and 1987/88. In subsequent years, catches have only exceeded 20,000tonnes twice (1990/91 and 1991/92) and more recent landings have generallyremained between 5000 - 10,000 tonnes.
Significant commercial catches of Arrow squid were also reported by foreignvessels in 1978/79 and 1979/80 (over 3000 tonnes p.a.) and again in 1983/84 and1984/85 (1500-2300 tonnes), largely from Bass Strait (Willcox et al. 2001).Apart from 1973/74, when just over 150 tonnes of arrow squid was taken fromTasmanian coastal waters, local catches remained below about 30 tonnes up until1998/99. There has, however, been a recent expansion of the inshore squidfishery with an influx of automatic jig vessels. In 1998/99 about 95 tonnes wascaught from coastal waters while in 1999/2000 the harvest reached 430 tonnes.Availability of arrow squid was poor in 2000/01, with less than 40 tonnes caught,despite extensive effort. It is noteworthy that arrow squid catch rates off Victoriawere reported to be very high in 2000/01 (final catch figures are not yetavailable).
In terms of the broader commercial scalefish fishery, inshore production hasremained relatively stable over the past three decades, ranging between 1000 –2500 tonnes (Lyle and Jordan 1999, Lyle and Hodgson 2001).
Given the apparent magnitude of natural variability in abundance of the key preyspecies and the sporadic nature of the fisheries based on these species coupledwith general stability in overall inshore scalefish fishery, a clear link between sealinteractions on farms and reduced availability of prey (due to fishing) is notevident.
5.3 Marine farmingShellfish farms are thought to have no impact on seals. Finfish farms may have anett positive effect on individual seals by boosting food availability, however withthe approval of DPIWE, seals posing serious problems around farms may betrapped for relocation and some mortality is associated with this trapping.
Figures for the entanglement of New Zealand and Australian fur seals at marinefish farms from 1998-2000 are summarised in Table 8. The large increase in sealentanglement mortality in 2000 was due in part to the changing of the mesh sizeof the corral net by one farm. No further deaths have been recorded by that farmsince the introduction of a 100mm mesh size net for the corral area (MikeGreenwood, DPIWE, pers. comm.).
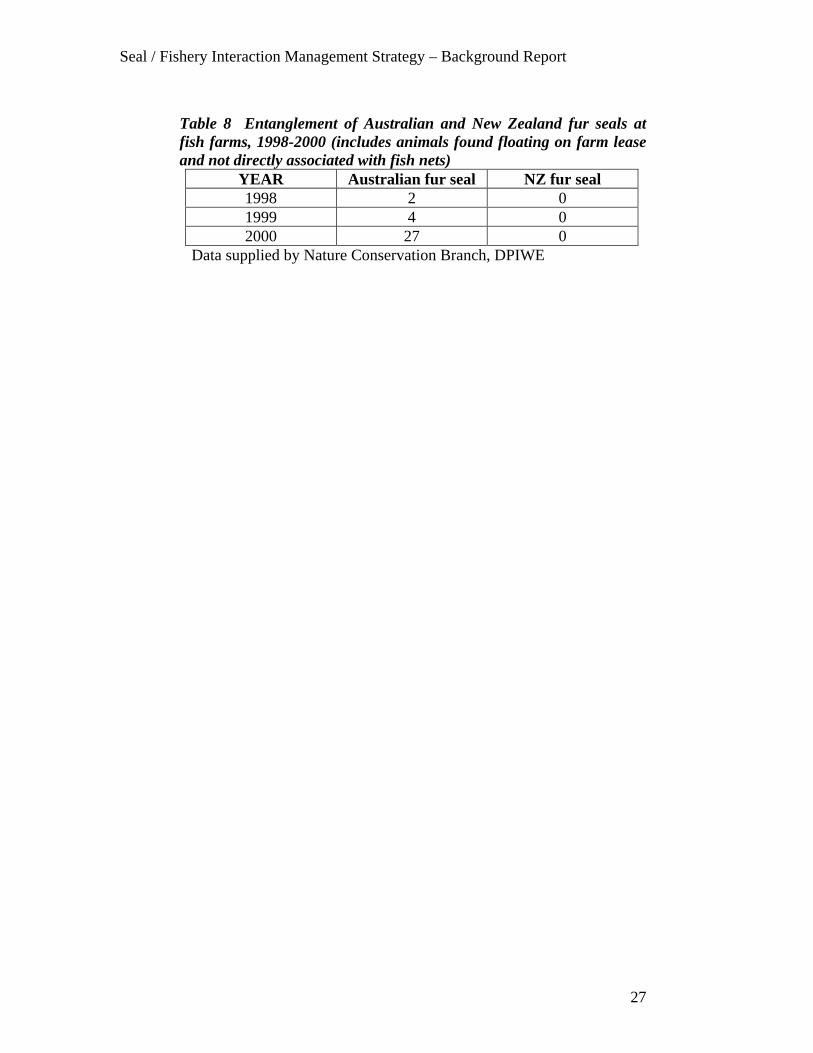
Seal / Fishery Interaction Management Strategy – Background Report
27
Table 8 Entanglement of Australian and New Zealand fur seals atfish farms, 1998-2000 (includes animals found floating on farm leaseand not directly associated with fish nets)
YEAR Australian fur seal NZ fur seal1998 2 01999 4 02000 27 0
Data supplied by Nature Conservation Branch, DPIWE
Seal / Fishery Interaction Management Strategy – Background Report
28
Chapter 6 - Current Trends in Seal Populations andFactors Affecting Them.
6.1 Seal PopulationsNew Zealand fur seals have not re-established substantial breeding populations inthe Tasmanian region following sealing activities in the early 1800's. Althoughcurrently uncommon in Tasmanian waters, New Zealand fur seals are increasingin number in Western Australia and South Australia They are listed as rare andthe Tasmanian Government's conservation objective is to protect the population,its habitat and breeding sites so as to allow the population to continue to rebuild.
Australian fur seals are presumed to be less abundant now than prior to Europeansealing activities, judging by the relatively restricted number of breeding sitespresently occupied. There is evidence that, although the Tasmanian populationsare relatively stable, the overall Bass Strait population of Australian fur seals isincreasing, due to increases at several Victorian sites. The TasmanianGovernment's conservation objective for this species is to protect the population,its habitat and breeding sites to allow current population levels to be maintainedand potentially increase if additional breeding sites are colonised.
No active intervention measures are proposed to facilitate population rebuilding.
6.2 Conservation measuresStates are responsible for seals in waters up to 3 nautical miles off-shore and onland where seals haul out, moult, rest and breed. The Commonwealth isresponsible for seals in the waters of the Continental Shelf outside State Coastalwaters and within the Australian Exclusive Economic Zone (EEZ) up to 200nautical miles off shore (Shaughnessy 1999).
The management tools currently in use are a mix of management plans/actionplans, legislation and protocols. There are two primary aims of seal management:conservation and protection of seal species, and the regulation of human/sealinteractions.
6.2.1 National Measures
Seals in and around Tasmania form part of large populations that extend wellbeyond the jurisdiction of the State. The New Zealand and Australian fur seals areprotected under the Environment Protection and Biodiversity Conservation Act1999 and an action plan. They are included in the list of marine speciesestablished by the Minister under the Act.
Seal / Fishery Interaction Management Strategy – Background Report
29
Section 254A provides for strict liability for killing or injuring a member of listedmarine species. A person is guilty of an offence if:
(a) the person takes an action; and(b) the action results in the death or injury of a member of a marine species; and(c) the member is a member of a listed marine species; and(d) the member is in or on a Commonwealth area.
All of the elements of the offence must be present before a person is found guiltyof that offence.
6.2.1.1 The Action Plan for Australian Seals (1999)
In 1999 the Action Plan for Australian Seals (‘the Action Plan’) was released(Shaughnessy 1999). The Action Plan reviews the conservation status of the 10seal species inhabiting Australian waters, including the waters of the AustralianAntarctic Territory. It summarises the current knowledge on the biology,abundance and distribution of seals, identifies threats and recommends researchand management actions required for their conservation.
All ten species of seal were assessed against the International Union for theConservation of Nature and Natural Resources (IUCN), now The WorldConservation Union Red List Categories8. New Zealand fur seals and Australianfur seals are considered to be at lower risk, but conservation dependant becausethe cessation of a ‘habitat specific conservation programme’ could lead to each ofthem qualifying for a threatened category if ready access by humans to breedingsites were permitted during the breeding season.
The Action Plan identifies conservation objectives, conservation actions alreadyinitiated, and conservation actions required. Each of these is broken down intoresearch and management initiatives. Research priorities in relation to both theNew Zealand fur seal and the Australian fur seal include:
• studies of genetic relatedness;• population size, diet, behaviour, movements and feeding; and• interaction between seals and fisheries.
This information is crucial to the proper management of these species. Themanagement actions required are aimed at protecting the species whilstminimising seals’ association with fishing vessels and set gear as a food source.It promotes the adoption of improved fishing practices, such as a protocol fordumping baits and discards (offal, unwanted catch and under-size catch), and animprovement in the use of exclusion nets on marine farms.
8 The Categories are as follows: Extinct; Extinct in the Wild; Critically Endangered; Endangered; Vulnerable; and LowerRisk. The Lower Risk category is separated into three subcategories : Conservation Dependent; Never Threatened; andLeast Concern.
Seal / Fishery Interaction Management Strategy – Background Report
30
6.2.2 Tasmanian Measures
Seals have been protected under Tasmanian legislation since 1891. At presentAustralian fur seals are protected under the Wildlife Regulations 1999, whichprovide that it is illegal to injure, kill, destroy, collect, damage, buy, sell or havepossession of any such seal (or part thereof) without a permit. The New Zealandfur seal is similarly protected under the Wildlife Regulations 1999. In addition,the New Zealand fur seal is listed as rare under the Threatened Species ProtectionAct 1995. This listing prevents any person from knowingly, without a permit take,trade in or process New Zealand fur seals (“take” includes kill, injure, catch,damage, destroy and collect). For each listing under the Threatened SpeciesProtection Act 1995, a listing statement must be prepared9. A listing statementfor the New Zealand fur seal has not yet been prepared.
There has been no trade in Tasmanian seal products for more than 60 years.
The different protection status at a State and Commonwealth level, even thoughboth use the IUCN criteria, is due to the scale on which they are assessed. At theCommonwealth level assessment is undertaken on a national basis, i.e. includesseal populations in all State and Commonwealth waters, whereas at a State levelassessment is based upon the seal population in Tasmania’s State waters.
6.3 Other Influences on Seal PopulationsVarious factors may affect the status of seal populations, such as climatic events,disease and human activities including various fishing operations and the illegaltaking of seals. Sections 5.1 and 5.3 describe how fishing and marine farmingoperations generate seal mortality. This section summarises other factors thatmay negatively affect seal populations in Tasmanian waters, the scale andconsequences of which are unknown.
6.3.1 Environmental Factors
Variability within the marine environment, such as climatic conditions, affectsseal populations in several ways. Storm events in Bass Strait reduce pupproduction at certain breeding colonies by up to 90% in some years (Hume 2000),as large swells wash breeding colonies. Population growth at some sites can besignificantly affected depending on the frequency of these storm events.
Oceanographic variability, for example changes in primary productivity and seasurface temperature, may lead to changes in prey availability. One study in North 9 The listing statement specifies:
(a) a description, the distribution and the habitat of the taxon; and(b) its conservation status with reasons; and(c) management objectives; and(d) management issues; and(e) actions that need to be taken for the purposes of management and conservation of the taxon; and(f) threats to the taxon; and(g) any information relating to the taxon that is available in published references.
Seal / Fishery Interaction Management Strategy – Background Report
31
America (Hanan et al. 1989) found reduced seal interaction and depredation(predation of commercial species) rates following an El Niño event, possiblyresulting from reduced prey availability and a reduction in seal numbers (Beesonand Hanan 1996). Reductions in prey availability may also lead to declines inbody condition, longer search times for prey and lower foraging success(Castellini in Anon 1994).
The relationship between the diet of Australian fur seals and fluctuations in theoceanic environment is not clearly understood.
6.3.2 Disease
In common with seal populations around the world, Tasmanian populations ofAustralian fur seals are known to carry some viruses, including tuberculosis(Woods et al. 1995).
In 1988 approximately 17,000 seals were killed by the phocine distemper virusaround the British Isles. In Lincolnshire and Norfolk, surveys conducted by theSea Mammal Research Unit at the University of St Andrews show that animals inthis area suffered high mortality in the 1988 phocine distemper virus epizootic,and that numbers are steadily increasing but have not yet reached their pre-epizootic level (web site for the Sea Mammal Research Unit, http://www.smru.st-and.ac.uk).
6.3.3 Illegal taking of seals
Human-related impacts on pinnipeds (apart from prey depletion) occur as a resultof entanglement in net or lines, internal and external embedding of hooks,shooting or other trauma (Angliss and DeMaster 1998). It is extremely difficult todetermine cause of death as projectiles are hard to find without whole body x-rays. Seals are usually quite decomposed upon discovery, and if intentionallydrowned (in a trap), it is impossible to determine cause of death (R. Gales,DPIWE, pers. comm.).
The number of seals shot in Tasmanian waters each year is unknown, howeverDPIWE has numerous reports of seal shooting. A recent survey on seal/fisheriesinteractions in Tasmania (Attachment 4) has revealed that approximately 10% offishers that responded admitted to shooting seals. However, there have been onlyfive successful prosecutions in the last ten years. Those prosecuted have beenwithin the aquaculture and commercial fisheries industries.
Seal / Fishery Interaction Management Strategy – Background Report
32
Chapter 7 - Minimising the Impact of Interactions.
Mitigation of seal/fisheries interactions has been the subject of research bygovernment agencies worldwide for more than 20 years. Interactions varydepending on the type of fisheries operations, species involved, season,environmental variability and many other factors. Mitigation measures can bedescribed as modification to fishing practices and/or equipment (Brothers et al.1999) in order to reduce interactions between pinnipeds and fisheries operations.Mitigation measures need to be tailored to suit the behaviour of seals, particularlyif they learn to circumvent measures.
Possible solutions include modifications to fishing equipment, methods andlocation; the use of devices that repel marine mammals from fishing areas orcondition them to avoid these areas; and the removal of individual seals bycapture and translocation or killing (Mate and Harvey 1987, Reeves et al. 1996).Mitigation measures can be divided into two groups – lethal and non-lethal.
7.1 Non Lethal Methods
7.1.1 Acoustic deterrents
7.1.1.1 Seal crackers10
Seal crackers or underwater firecrackers are explosive devices, which are throwninto the water where they explode under the surface. They have been used inTasmania in an attempt to deter seals and whales from interacting with fishingoperations. Reports from Canada indicate that while seal crackers may initiallybe effective, with repeated use seals become accustomed to them relativelyquickly (Fraker et al. 1998). Seal crackers have been effective on a short-termbasis in other situations, (NMFS 1997) but in the long-term, and with continuoususe, seals learn to ignore or avoid the noise (Fraker et al. 1998; Gearin et al. 1986;NMFS 1997). However, the flash from the crackers continues to be effective atnight time if crackers are used skilfully by the operator (O. Carington Smith,TSGA, pers. comm.). One Tasmanian fisher reported that if used sparingly, sealcrackers were effective for deterring the juvenile/sub-adult seals from interactingwith grab-all nets set off the East Coast of Tasmania during winter (M.Cuthbertson, pers. comm.).
10 Presently seal crackers cost $2.50 (plus GST) per unit. Delivery time from the USA is normally3-6 months.
Seal / Fishery Interaction Management Strategy – Background Report
33
From a management perspective, there are a range of issues concerning the use ofseal crackers, these include (but are not limited to) animal ethics, permits,occupational health and safety, regulation and enforcement.
7.1.1.2 Acoustic harassment devices (AHDs)
Acoustic devices have been developed with the two-fold aim of 1) alerting marinemammals to the presence of fishing gear to reduce by-catch and 2) acousticallyharassing marine mammals to prevent depredation of fishing gear (Reeves et al.1996). Devices are often accused of attracting seals (‘dinner bell’ effect (Mate andHarvey 1987)) to nets rather than deterring them. While AHDs might proveeffective in the short term, acoustic habituation of seals to installed AHDs iscommon (Arnold 1992; Beeson and Hanan 1996; Morris 1996).
7.1.1.3 Acoustic deterrent devices (ADDs)
The ADDs are modified AHDs with omni-directional or uni-directional arraysproducing periodic sound emissions centred at higher decibel levels than AHDs(Reeves et al. 1996). In the past 4-5 years an ADD barrier at the Ballard Locks,USA, has successfully reduced the number of Californian sea lions feeding onsteelhead migrating up stream (Pat Gearin pers. comm.; NMFS 1997). TheBallard Locks are, however, a closed estuarine environment with predation byseals on a free-swimming endangered fish stock, a situation not directlyapplicable to Tasmanian seal/fisheries interactions.
A recent report to the Canadian Salmon Aquaculture Review recommended thatADDs be phased out of all intensive fish culture operations over 2 years as thelong term impacts of high intensity signals on marine mammals are not known.Seals appear to be undeterred by ADDs but may experience hearing damage atclose range (Iwama et al. 1997).
Improved acoustic deterrents currently being developed will decrease at a rate of20dB every ten-fold increase from the source, thereby allowing seals to becomeannoyed well before injury could occur (New Zealand King Salmon Company,pers. comm.). Any acoustic system should be well designed and tested, as sealsare able to locate acoustically silent tunnels (J. Temte on MARMAM).
An experiment was designed in Japan to quantify the escape behaviour of 10captive Steller sea lions in response to underwater sounds (Akamatsu et al. 1996).Adult sea lions were repelled only by impulsive sounds transmitted at high sourcelevels (210dB re 1µPa at 1m) or pure tone sounds (165dB source level). However,sea lions appeared to acclimatise to repeated sound projections and a soundpressure level below 165 dB did not appear to repel Steller sea lions from afishing net (Akamatsu et al. 1996).
Seal / Fishery Interaction Management Strategy – Background Report
34
A report of a workshop on Physical Countermeasures against Predation by Sealsand Sea Lions at Salmon farms held in 1997 in BC Canada, reported that there isevidence that high-amplitude ADD's disturb harbour porpoises under short-termexperimental conditions (Fraker et al. 1998). Other non-target species of marinemammals may also be disturbed by high-amplitude ADDs (Fraker et al. 1998).The evidence of effects on non-target marine mammals is inadequate for Canada'sDepartment of Fisheries and Oceans to consider revoking the licenses for salmonfarmers to use high-amplitude ADDs. Notwithstanding, the Salmon Aquaculturereview undertaken by the BC Environmental Assessment Office recommendedthat high-amplitude ADDs be phased out by 1999 (Fraker et al. 1998)
7.1.2. Capture and relocation
Trapping and relocation of fur seals that repeatedly attack fish farms wasintroduced in Tasmania in 1990 to assist fish farmers whilst improved predatornet designs were being developed (Hume et al. unpublished data). This non-lethalmethod of mitigation involves removing the offending seal from an area. While63% of seals are not recaptured, some seals have been trapped and transported onrepeated occasions (Hume et al. unpublished data). This method is most effectivewhen used in very specific circumstances when seals have entered pens (seeProtocols – Attachment 5).
Relocated seals were previously tagged but this was discontinued due to high tagloss rates, and they are now marked with PIT transponders.
Routine biological samples are taken from the following seals:(i) Any "new" seal that has not been trapped in the previous 12 months.(ii) Seals where species identification (Australian fur seal or New Zealand fur
seal) has not been confirmed.(iii) Seals which look "unwell", or have signs of injury.(iv) All New Zealand fur seals, leopard or elephant seals.(v) Any "repeat offender" animals with dramatic weight loss since previous
capture.
This practice yields sufficient sera for adequate disease surveillance (tuberculosis,leptospirosis, brucellosis and morbillivirus) and is also critical for animal welfareissues. Faecal samples (in traps) are collected for parasitological analysis.
In 2001, seal relocations were greater than at any time over the past five years. Atotal of 585 seal relocations took place in 2001, compared to 471 relocations in2000, 58 in 1999 and approximately 160 in each of the previous two years (Table9). This data is summarised by area in Table 10. Further analysis of the datashows that over the period January 1997 to December 2001, 1441 relocationsoccurred. Of these 1441, 667 individual seals were relocated, the balance beingrecaptures. The number of times individual seals were recaptured is provided inTable 11, and the percentage frequency of recaptures each year is shown in Table12.
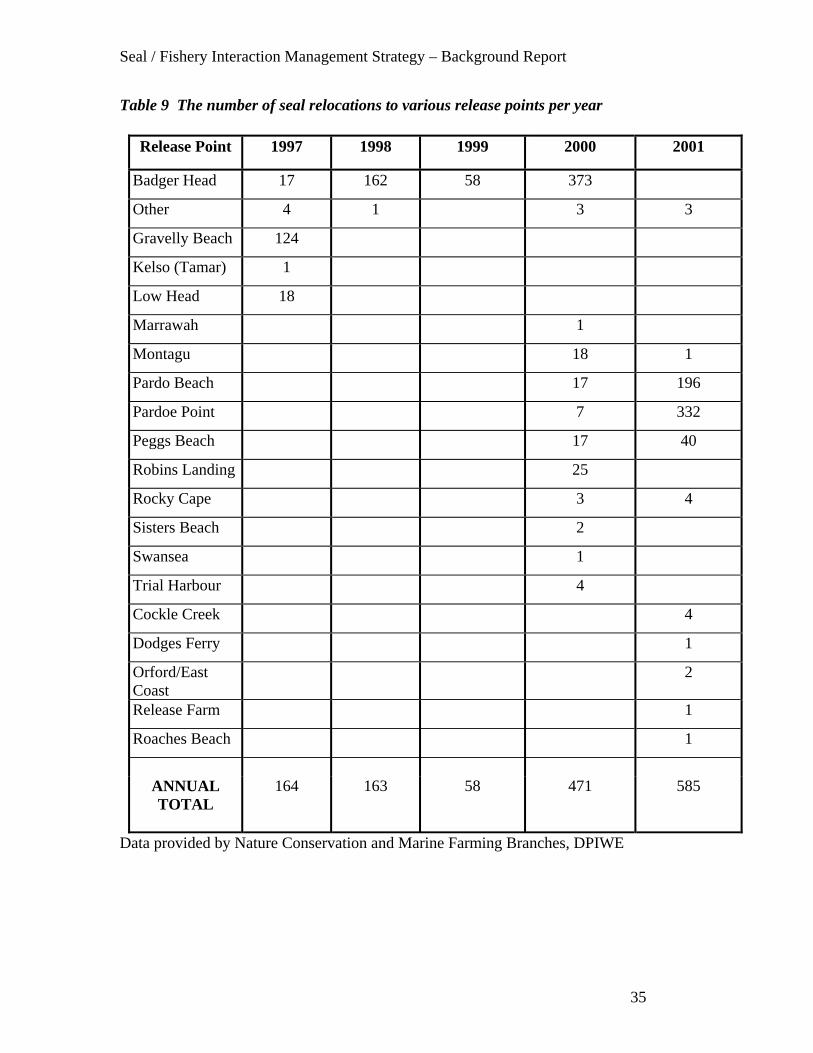
Seal / Fishery Interaction Management Strategy – Background Report
35
Table 9 The number of seal relocations to various release points per year
Release Point 1997 1998 1999 2000 2001
Badger Head 17 162 58 373
Other 4 1 3 3
Gravelly Beach 124
Kelso (Tamar) 1
Low Head 18
Marrawah 1
Montagu 18 1
Pardo Beach 17 196
Pardoe Point 7 332
Peggs Beach 17 40
Robins Landing 25
Rocky Cape 3 4
Sisters Beach 2
Swansea 1
Trial Harbour 4
Cockle Creek 4
Dodges Ferry 1
Orford/EastCoast
2
Release Farm 1
Roaches Beach 1
ANNUALTOTAL
164 163 58 471 585
Data provided by Nature Conservation and Marine Farming Branches, DPIWE
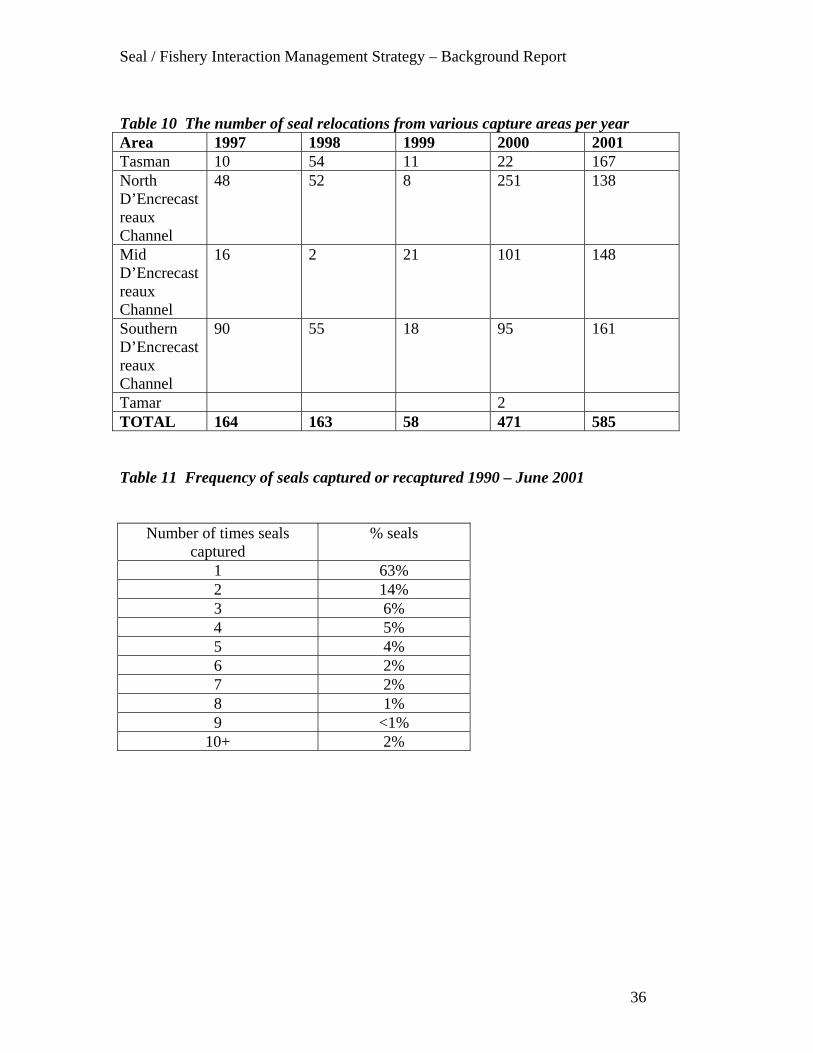
Seal / Fishery Interaction Management Strategy – Background Report
36
Table 10 The number of seal relocations from various capture areas per yearArea 1997 1998 1999 2000 2001Tasman 10 54 11 22 167NorthD’EncrecastreauxChannel
48 52 8 251 138
MidD’EncrecastreauxChannel
16 2 21 101 148
SouthernD’EncrecastreauxChannel
90 55 18 95 161
Tamar 2TOTAL 164 163 58 471 585
Table 11 Frequency of seals captured or recaptured 1990 – June 2001
Number of times sealscaptured
% seals
1 63%2 14%3 6%4 5%5 4%6 2%7 2%8 1%9 <1%
10+ 2%
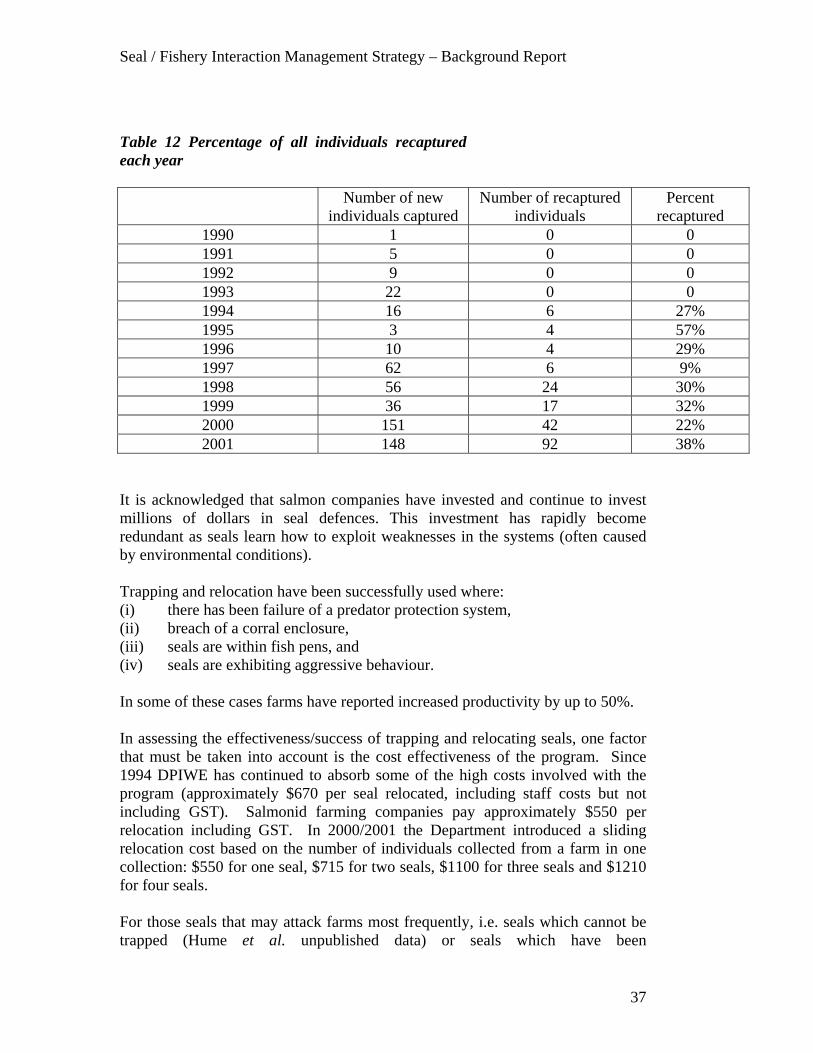
Seal / Fishery Interaction Management Strategy – Background Report
37
Table 12 Percentage of all individuals recapturedeach year
Number of newindividuals captured
Number of recapturedindividuals
Percentrecaptured
1990 1 0 01991 5 0 01992 9 0 01993 22 0 01994 16 6 27%1995 3 4 57%1996 10 4 29%1997 62 6 9%1998 56 24 30%1999 36 17 32%2000 151 42 22%2001 148 92 38%
It is acknowledged that salmon companies have invested and continue to investmillions of dollars in seal defences. This investment has rapidly becomeredundant as seals learn how to exploit weaknesses in the systems (often causedby environmental conditions).
Trapping and relocation have been successfully used where:(i) there has been failure of a predator protection system,(ii) breach of a corral enclosure,(iii) seals are within fish pens, and(iv) seals are exhibiting aggressive behaviour.
In some of these cases farms have reported increased productivity by up to 50%.
In assessing the effectiveness/success of trapping and relocating seals, one factorthat must be taken into account is the cost effectiveness of the program. Since1994 DPIWE has continued to absorb some of the high costs involved with theprogram (approximately $670 per seal relocated, including staff costs but notincluding GST). Salmonid farming companies pay approximately $550 perrelocation including GST. In 2000/2001 the Department introduced a slidingrelocation cost based on the number of individuals collected from a farm in onecollection: $550 for one seal, $715 for two seals, $1100 for three seals and $1210for four seals.
For those seals that may attack farms most frequently, i.e. seals which cannot betrapped (Hume et al. unpublished data) or seals which have been
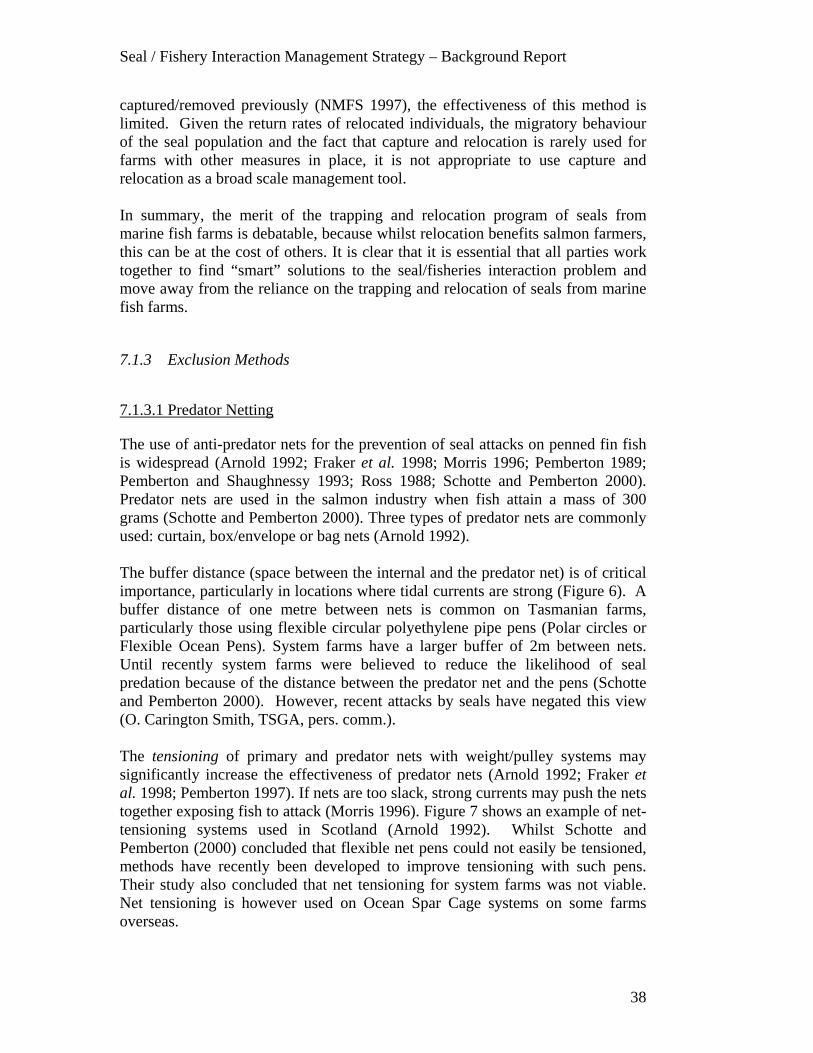
Seal / Fishery Interaction Management Strategy – Background Report
38
captured/removed previously (NMFS 1997), the effectiveness of this method islimited. Given the return rates of relocated individuals, the migratory behaviourof the seal population and the fact that capture and relocation is rarely used forfarms with other measures in place, it is not appropriate to use capture andrelocation as a broad scale management tool.
In summary, the merit of the trapping and relocation program of seals frommarine fish farms is debatable, because whilst relocation benefits salmon farmers,this can be at the cost of others. It is clear that it is essential that all parties worktogether to find “smart” solutions to the seal/fisheries interaction problem andmove away from the reliance on the trapping and relocation of seals from marinefish farms.
7.1.3 Exclusion Methods
7.1.3.1 Predator Netting
The use of anti-predator nets for the prevention of seal attacks on penned fin fishis widespread (Arnold 1992; Fraker et al. 1998; Morris 1996; Pemberton 1989;Pemberton and Shaughnessy 1993; Ross 1988; Schotte and Pemberton 2000).Predator nets are used in the salmon industry when fish attain a mass of 300grams (Schotte and Pemberton 2000). Three types of predator nets are commonlyused: curtain, box/envelope or bag nets (Arnold 1992).
The buffer distance (space between the internal and the predator net) is of criticalimportance, particularly in locations where tidal currents are strong (Figure 6). Abuffer distance of one metre between nets is common on Tasmanian farms,particularly those using flexible circular polyethylene pipe pens (Polar circles orFlexible Ocean Pens). System farms have a larger buffer of 2m between nets.Until recently system farms were believed to reduce the likelihood of sealpredation because of the distance between the predator net and the pens (Schotteand Pemberton 2000). However, recent attacks by seals have negated this view(O. Carington Smith, TSGA, pers. comm.).
The tensioning of primary and predator nets with weight/pulley systems maysignificantly increase the effectiveness of predator nets (Arnold 1992; Fraker etal. 1998; Pemberton 1997). If nets are too slack, strong currents may push the netstogether exposing fish to attack (Morris 1996). Figure 7 shows an example of net-tensioning systems used in Scotland (Arnold 1992). Whilst Schotte andPemberton (2000) concluded that flexible net pens could not easily be tensioned,methods have recently been developed to improve tensioning with such pens.Their study also concluded that net tensioning for system farms was not viable.Net tensioning is however used on Ocean Spar Cage systems on some farmsoverseas.
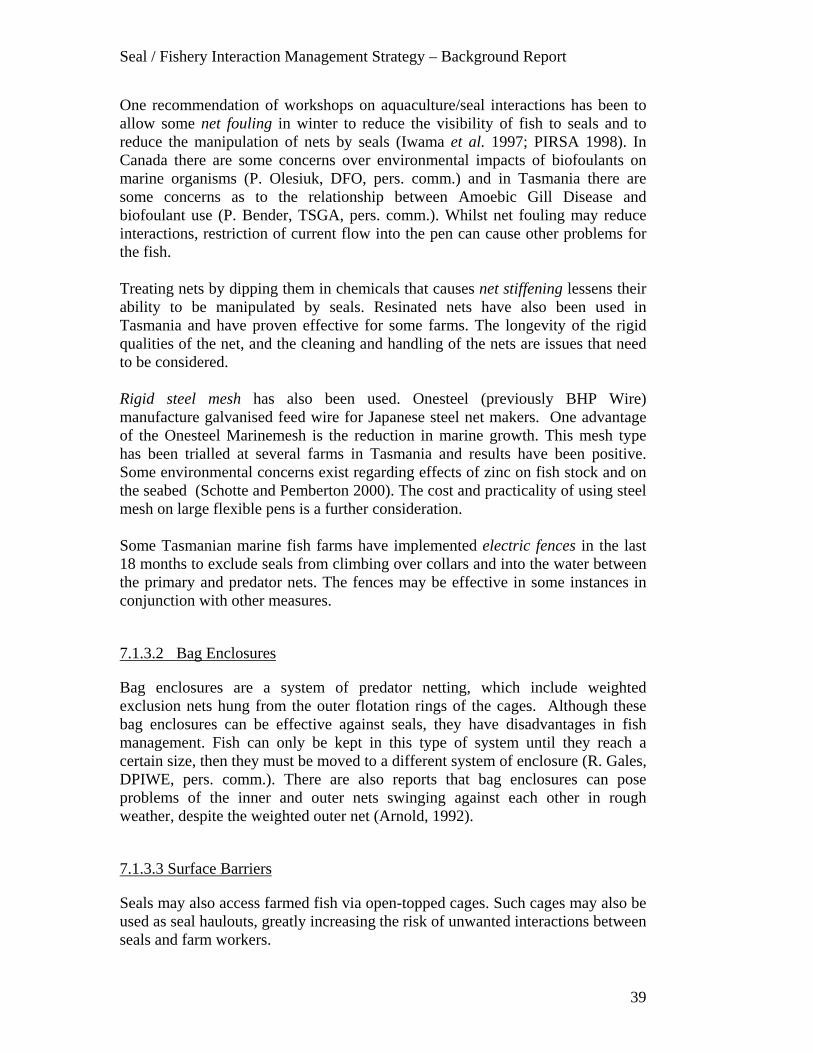
Seal / Fishery Interaction Management Strategy – Background Report
39
One recommendation of workshops on aquaculture/seal interactions has been toallow some net fouling in winter to reduce the visibility of fish to seals and toreduce the manipulation of nets by seals (Iwama et al. 1997; PIRSA 1998). InCanada there are some concerns over environmental impacts of biofoulants onmarine organisms (P. Olesiuk, DFO, pers. comm.) and in Tasmania there aresome concerns as to the relationship between Amoebic Gill Disease andbiofoulant use (P. Bender, TSGA, pers. comm.). Whilst net fouling may reduceinteractions, restriction of current flow into the pen can cause other problems forthe fish.
Treating nets by dipping them in chemicals that causes net stiffening lessens theirability to be manipulated by seals. Resinated nets have also been used inTasmania and have proven effective for some farms. The longevity of the rigidqualities of the net, and the cleaning and handling of the nets are issues that needto be considered.
Rigid steel mesh has also been used. Onesteel (previously BHP Wire)manufacture galvanised feed wire for Japanese steel net makers. One advantageof the Onesteel Marinemesh is the reduction in marine growth. This mesh typehas been trialled at several farms in Tasmania and results have been positive.Some environmental concerns exist regarding effects of zinc on fish stock and onthe seabed (Schotte and Pemberton 2000). The cost and practicality of using steelmesh on large flexible pens is a further consideration.
Some Tasmanian marine fish farms have implemented electric fences in the last18 months to exclude seals from climbing over collars and into the water betweenthe primary and predator nets. The fences may be effective in some instances inconjunction with other measures.
7.1.3.2 Bag Enclosures
Bag enclosures are a system of predator netting, which include weightedexclusion nets hung from the outer flotation rings of the cages. Although thesebag enclosures can be effective against seals, they have disadvantages in fishmanagement. Fish can only be kept in this type of system until they reach acertain size, then they must be moved to a different system of enclosure (R. Gales,DPIWE, pers. comm.). There are also reports that bag enclosures can poseproblems of the inner and outer nets swinging against each other in roughweather, despite the weighted outer net (Arnold, 1992).
7.1.3.3 Surface Barriers
Seals may also access farmed fish via open-topped cages. Such cages may also beused as seal haulouts, greatly increasing the risk of unwanted interactions betweenseals and farm workers.
Seal / Fishery Interaction Management Strategy – Background Report
40
Experience in Washington State, USA, demonstrates that some seals (for exampleharbour seals and Stellers sea lions) can be effectively excluded from fish farmsusing properly tensioned predator nets to prevent underwater attacks. The cages inWashington State are generally located in areas where the tidal range and tidalcurrents are much greater than those experienced by Tasmanian fish farms.
Above-water access to cage structures is also effectively prevented by light nylonnetting supported by a light frame structure combined with a single strand electricfence. The top of this net extends to approximately 3.5 m above the water, whilethe wire for the electric fence is located about 40 cm below the top of the mesh.
These exclusion methods have been successful in mitigating seal problems insome farms in Washington State (J. Bryan, Tasmanian Conservation Trust, pers.comm.).
Some Tasmanian fish farms have trialed surface barriers, including electricfences, with limited success (O. Carington Smith, TSGA, pers. comm.).
FFiigguurree 66 AAnn iilllluussttrraattiioonn ooff tthhee eeffffeecctt ooff ssttrroonngg ccuurrrreenntt ffllooww oonn bbuuffffeerr ddiissttaannccee iinnaannttii--pprreeddaattoorr aanndd iinnnneerr nneettss ffoorr aa FFlleexxiibbllee OOcceeaann PPeenn ((ttaakkeenn ffrroomm SScchhoottttee aannddPPeemmbbeerrttoonn 22000000))..
Seal / Fishery Interaction Management Strategy – Background Report
41
FFiigguurree 77 EExxaammppllee ooff nneett tteennssiioonniinngguussiinngg iinnddiivviidduuaall ppuulllleeyy wweeiigghhttss ((ffrroommAArrnnoolldd 11999922))
Seal / Fishery Interaction Management Strategy – Background Report
42
7.1.4 Tactile Harassment
7.1.4.1 Rubber bullets
The firing of rubber bullets at California sea lions feeding on spring Chinook inOregon, USA, has had mixed results as a deterrent. Field trials concluded thatrubber buckshot could probably be used safely and effectively if fired at distancesof 5-15m at an angle of 25º or greater (Gearin et al. 1988b).
7.1.4.2 Beanbag loads
Trials in the use of beanbag loads are currently under way in conjunction with theBallistics section of the Tasmanian Police Department. They can be loaded in anordinary shotgun and targeted at seals to scare them away from fishing operations.There are environmental concerns associated with the projectiles used as theyconsist of a nylon bag filled with lead shot.
7.1.4.3 Cattle prods
Cattle prods which discharge a low-wattage shock have been used at someTasmanian marine salmonid farms with little success as seals tend to ignore theshock (M. Greenwood, DPIWE, pers. comm.).
7.1.5 Other non lethal methods
7.1.5.1 SharkPOD (protective oceanic device)
The SharkPOD creates an electrical field around divers and is marketed as a sharkrepellent (POD Holdings Ltd, Rochdale Park, South Africa). These devices havebeen trialed by divers at Tenth Island as a possible method of protection for diversat salmonid farms (Parks and Wildlife Service). Results were encouraging withseals appearing to flee from the SharkPOD. The possibility of using a similartechnology around salmon pens has been assessed by a CSIRO electrical engineerand is considered worth pursuing. TASSAL's experience is that these areineffective (T. Dix, TASSAL, pers. comm.).
7.1.5.2 Taste aversion
Taste aversion is a form of negative conditioning, which involves the applicationof an unpleasant or painful stimulus to train animals to avoid a specific behaviour(NMFS 1997). For seals, one method is to inject baits, such as salmon, with an
Seal / Fishery Interaction Management Strategy – Background Report
43
emetic such as Lithium chloride, which induces nausea. The aim is that seals willthen associate eating salmon with a negative reaction.
This technique has been tested on captive sea lions (Kuljis 1985) and on free-ranging Australian fur seals in Tasmania (Pemberton 1989). Taste aversion wasalso field tested on California sea lions at Ballard Locks, USA, using tetheredsalmon where it proved to be inconclusive (Gearin et al. 1988b).
This method was thought to be impractical for year-round use (Morris 1996) butmay prove useful at particular times of the year (e.g. prior to net-changing).Pemberton (1989) suggested the use of a sacrificial cage of salmon or trout withemetics positioned on the farm such that seals would have a good chance ofencountering it before other cages. The negative stimulus of the emetic may bemost effectively coupled with a negative reinforcer (e.g. acoustic signal,Pemberton 1989).
7.1.5.3 Vessel chase
High-powered boats may be used to chase, scare and harass seals. One companyin SE Tasmania chases seals during net changes. The use of boats was found to bemore effective than shooting at seals (Pemberton 1989). Tribal gill net fishermenin Puget Sound (Washington, USA) also used ‘boat hazing’ and firecrackers whilefishing for Steelhead and coho salmon, for very short-term effect (Gearin et al.1988a). This measure may be most effective if used sporadically during activitieswhere the likelihood of interactions is high (eg. summer net changes of fishfarms).
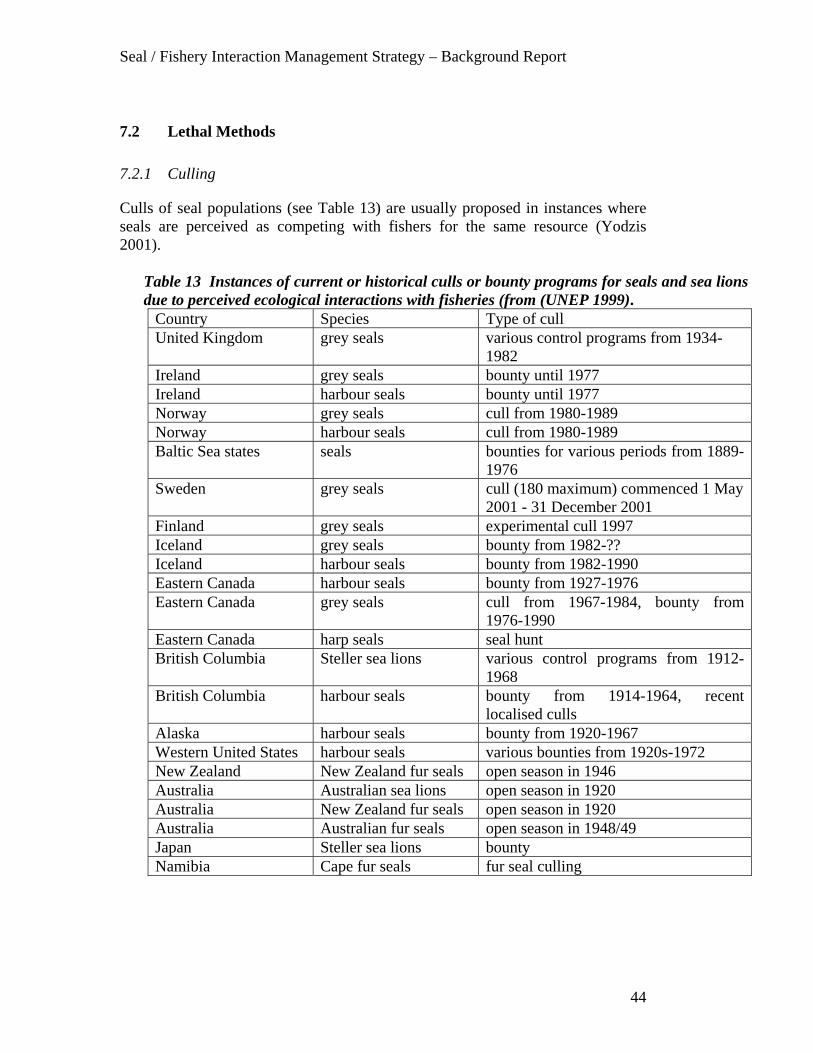
Seal / Fishery Interaction Management Strategy – Background Report
44
7.2 Lethal Methods
7.2.1 Culling
Culls of seal populations (see Table 13) are usually proposed in instances whereseals are perceived as competing with fishers for the same resource (Yodzis2001).
Table 13 Instances of current or historical culls or bounty programs for seals and sea lionsdue to perceived ecological interactions with fisheries (from (UNEP 1999).
Country Species Type of cullUnited Kingdom grey seals various control programs from 1934-
1982Ireland grey seals bounty until 1977Ireland harbour seals bounty until 1977Norway grey seals cull from 1980-1989Norway harbour seals cull from 1980-1989Baltic Sea states seals bounties for various periods from 1889-
1976Sweden grey seals cull (180 maximum) commenced 1 May
2001 - 31 December 2001Finland grey seals experimental cull 1997Iceland grey seals bounty from 1982-??Iceland harbour seals bounty from 1982-1990Eastern Canada harbour seals bounty from 1927-1976Eastern Canada grey seals cull from 1967-1984, bounty from
1976-1990Eastern Canada harp seals seal huntBritish Columbia Steller sea lions various control programs from 1912-
1968British Columbia harbour seals bounty from 1914-1964, recent
localised cullsAlaska harbour seals bounty from 1920-1967Western United States harbour seals various bounties from 1920s-1972New Zealand New Zealand fur seals open season in 1946Australia Australian sea lions open season in 1920Australia New Zealand fur seals open season in 1920Australia Australian fur seals open season in 1948/49Japan Steller sea lions bountyNamibia Cape fur seals fur seal culling
Seal / Fishery Interaction Management Strategy – Background Report
45
Culling is an emotive issue in the eyes of the general public, conservation andanimal welfare organisations. The effectiveness of culling has also beenquestioned (Harwood 1984; Kellert et al. 1995; Richey 2000; Yodzis 2001). InSouth Africa the complex Benguela ecosystem has been modelled to predict theimpact of culling seals on hake stocks and on the seal population (Punt andButterworth 1995; Wickens et al. 1992). The benefits of future culls were foundto be small or even detrimental for reasons related to the cannibalistic nature ofthe hake species (Punt and Butterworth 1995). It has also been stated thatpredatory and cannibalistic fishes consume vastly greater amounts ofcommercially valuable fish than do marine mammals (NOAA publication cited inWaves, 2000).
In the UK where grey seal (Halichoerus grypus) populations have been subject tovarious control programmes from 1934-1982, the last large scale cull in 1963proved ineffective over the long-term with seal numbers more than doublingwithin 20 years (Harwood 1984).
Recently, the Scientific Advisory Committee of the United Nations EnvironmentProgramme - Marine Mammals Action Plan developed the “Protocol for thescientific evaluation of proposals to cull marine mammals” (UNEP 1999). Theprotocol summarises requirements for data and analysis necessary for the analysisof culling questions related to the management of multi-species fishery situations.
In the case of direct interactions between seals and fisheries, where only a fewindividuals are likely to be involved, it has been suggested that indiscriminateculling will not be successful at controlling predation unless virtually all the localpopulation is killed (Fraker and Mate 1999). Targetted culling may, however,provide a localised, short term solution, especially in dealing with problemanimals.
7.2.2 Shooting seals interfering with nets
In 1916 the Royal Commissioner Prof. T. T. Flynn found that fisheries in theTamar were ‘becoming exhausted’. Fishermen complained that seals were partlyto blame. Although he conceded that the population of seals at Barranjoey Islandhad increased and there were now ‘several hundreds’ of them, Prof Flynn couldnot agree with the fishers. He entertained the idea of ‘thinning’ the population, butnot until after ‘an investigation of at least a year’ to discover the quantity and typeof fish the seals were eating.11 In 1920 the Fisheries Commission investigated theincrease of seals around Flinders Island and issued licences for a limited harvestof young males. In 1926 the new Sea Fisheries Board investigated the exportmarket for seal skins but there was no significant harvest.
In 1949 when commercial fishermen complained about the impact of increasedseal numbers, the Minister for Fisheries asked Dr. Harold Thompson of CSIR 11 Report of Fisheries Commissioners for 1916-7 P&P Parl. Tas. No.76.
Seal / Fishery Interaction Management Strategy – Background Report
46
(Fisheries Division) to investigate the issue. CSIR reported that lucrative fisheriescoexisted in other places with seal populations far bigger than then existed aroundTasmania. They estimated that in the Victorian Bass Strait region there were20,000 to 60,000 seals and doubted that culling would assist fishermen. CSIR’sTasmanian based biologist, A. M. Olsen, visited Pedra Blanca in May 1949 andestimated the seal population to be between 500 and 700. However, he thoughtthat permitting fishermen to kill individual seals damaging their nets or disturbingschools of fish was justified. Thereafter, on rare occasions, the Minister forFisheries did give such permission.12 After 1960 such permits were limited to theoperators of marine aquaria.
After seals became the responsibility for the National Parks and Wildlife Service,permits to scare or kill offending seals at marine fish farms in Tasmania weregranted to fish farm operators from 1987 to 1995. This option was available as alast resort only if all other non-lethal measures had proven to be ineffective. Thistemporary policy was implemented while the improvement of structural barrierswas undertaken (Hume et al. unpublished data). A total of 33 seals were shotusing the permit system in 1987/88. The last permit was issued on 30 November1990. The method was considered to be dangerous to personnel and ineffective,as many seals were not properly shot (Pemberton 1989).
Seals interfering with fishing operations in Great Britain may be shot providingmethods approved under the Seal Conservation Act 1970 are used. Seals and sealions interacting with salmon farms in Canada may also be shot by permit holders.Permits are granted only when proof is shown that lethal removal was the lastresort. Recent increases in the number of kills (38% increase per year) has led to areview of predator control measures currently in use on Canadian fish farms (P.Olesiuk pers. comm.).
Two species of seal are found in Britain's coastal waters: the grey seal and thecommon seal. Both are protected under the Conservation of Seals Act 1970,which provides closed seasons during which it is an offence to take or kill anyseal except under licence in certain particular circumstances. The Act provides ageneral exception which makes it lawful to kill a seal to prevent it from causingdamage to a fishing net or tackle or to any fish in the net, providing the seal is inthe vicinity of the net or tackle at the time (SSGA 1990). The effect of the closedseason can be extended by the Secretary of State where it appears necessary forthe proper conservation of seals. From 1995-99 inclusive, under the Conservationof Seals Act 1970 a total of 31 applications for licences to shoot seals duringclosed seasons were lodged. 24 of these applications were granted (ScottishParliament web site - http://www.scottish.parliament.uk/official_report/wa-oo/wa0803.htm).
12 Department of Agriculture File 18/28
Seal / Fishery Interaction Management Strategy – Background Report
47
The number of grey seals in British waters in 1999 was estimated to be 109,100,nearly three times the size of the 1984 population, indicating a populationincrease of approximately 6% per year (Northridge and Hofman 1999).
Shooting of seals carried with it a number of risks from both a practical andethical perspective. In many circumstances seals present a difficult target andstrict protocols are typically required to reduce risks of human injury and the riskof wounding seals rather than killing outright. Wounded seals present animalwelfare concerns as well as potential public safety risks. Killing of wildlife isalso regarded as a serious ethical issue by some sections of the community.
Seal / Fishery Interaction Management Strategy – Background Report
48
Chapter 8 - Current practice in managing sealinteractions.
8.1 Wild fisheries
8.1.1 Scalefish Fisheries
Cuthbertson (2000a) has published a guide to fishing around seals that providesdetailed advice to both recreational and commercial fishers on how to minimiseinteractions with seals. This advice is based on identifying the type of sealinvolved and the behaviour being exhibited.
8.1.1.1 Seal Crackers
Seal crackers are available from Parks and Wildlife to fishers, but theireffectiveness is dependent on proper use.
8.1.1.2 By-catch Mitigation
By-catch mitigation includes the regulation of mesh sizes, net strengths, thetensioning of nets and attending gear are all factors which may effectively reducemarine mammal by-catch associated with marine fish farming and commercialwild fishing operations (Arnold 1992; Pemberton 1997; PIRSA 1998).
Trials using different buoy colourings and shapes to gauge their effect on rates ofseal predation have been carried out by a commercial fisher (Cuthbertson 2000b).Preliminary results indicate that the size and shape of buoys may influence fishingsuccess when seals are present, however further trials are required.
8.1.1.3 Attending Gear (gill nets)
One of the most important methods of reducing depredation is for fishers to staynear and tend their gear (Gearin et al. 1988a). A study of Californian sea liondepredation on gill netting in Puget Sound recommended that fishers considerpulling their nets during times they cannot be actively checked or at night, citingunattended nets as the main source of net losses (Gearin et al. 1988a).
8.1.1.4 Steaming away from Seals
Some commercial gill netters and trawlers motor away from groups of seals athigh speed for periods up to 15-20 minutes before setting their gear in an effort tominimise interactions.
Seal / Fishery Interaction Management Strategy – Background Report
49
8.1.2 Rock Lobster Fisheries
Oblong-shaped, wooden slat pots are used in Western Australia, and if they arewinched in quickly the rock lobster collect at one end. The rock lobster tails hangout of the pot and are easily taken by sea lions. In some years, rock lobster fishingmay occur on the continental shelf not far from colonies while sea lion pups arelearning to forage. By-catch fatalities while sporadic, may be significant to suchsmall populations (Dr Nick Gales, Australian Antarctic Division, pers. comm.).
Bait saver devices were introduced primarily to reduce bait loss and increase thecatching time of rock lobster pots. Bait savers have the added benefit of reducingthe possibility of bait loss due to seal predation. Currently no regulations limit thedistance rock lobster pots are set from seal haul outs or colonies.
There are few reported accounts of interactions between seals and lobster/crabfishing operations. In California, where mesh traps are used, sea lions damage anddestroy lobster traps in attempts to remove baits (Beeson and Hanan 1996).
8.2 Salmon Farms
8.2.1 Tasmanian Practice
Practical and scientific research into methods of reducing seal interactions hasbeen undertaken jointly by industry and government since 1985. (Pemberton1989; Pemberton et al. 1991; Pemberton and Shaughnessy 1993). Table 14 listschronologically the types of mitigation measures trialed in Tasmania since 1985and their relative effectiveness.
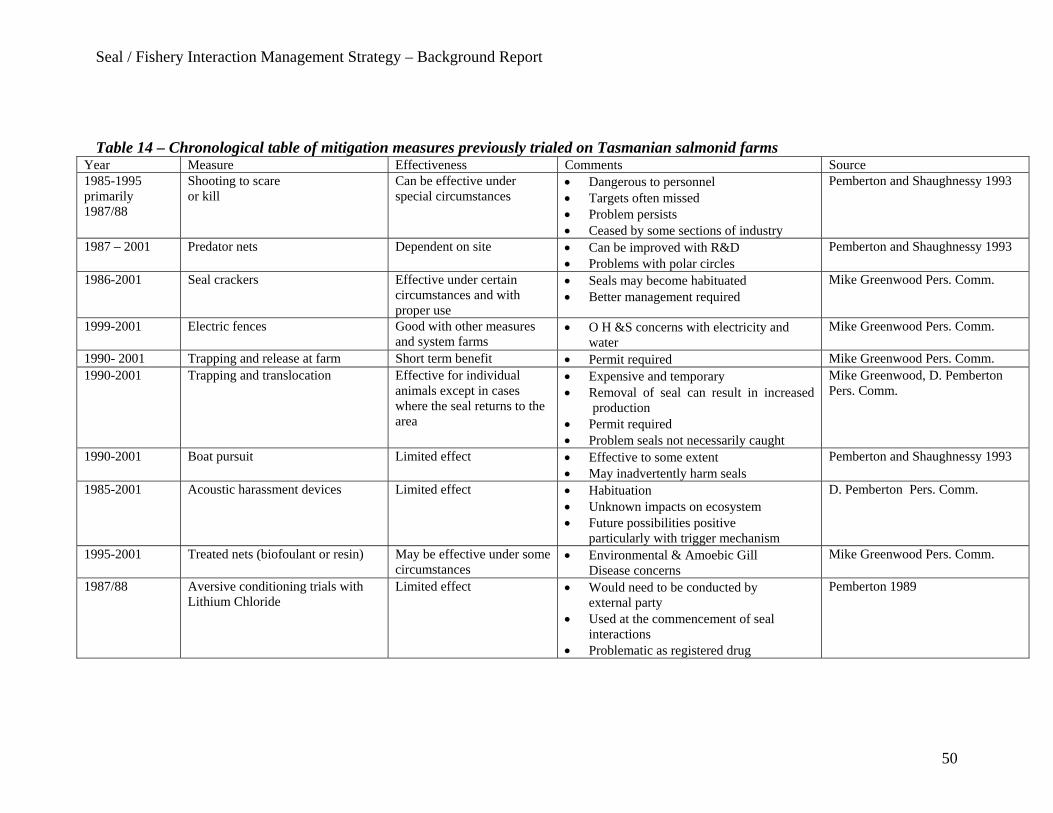
Seal / Fishery Interaction Management Strategy – Background Report
50
Table 14 – Chronological table of mitigation measures previously trialed on Tasmanian salmonid farmsYear Measure Effectiveness Comments Source1985-1995primarily1987/88
Shooting to scareor kill
Can be effective underspecial circumstances
• Dangerous to personnel• Targets often missed• Problem persists• Ceased by some sections of industry
Pemberton and Shaughnessy 1993
1987 – 2001 Predator nets Dependent on site • Can be improved with R&D• Problems with polar circles
Pemberton and Shaughnessy 1993
1986-2001 Seal crackers Effective under certaincircumstances and withproper use
• Seals may become habituated• Better management required
Mike Greenwood Pers. Comm.
1999-2001 Electric fences Good with other measuresand system farms
• O H &S concerns with electricity and water
Mike Greenwood Pers. Comm.
1990- 2001 Trapping and release at farm Short term benefit • Permit required Mike Greenwood Pers. Comm.1990-2001 Trapping and translocation Effective for individual
animals except in caseswhere the seal returns to thearea
• Expensive and temporary• Removal of seal can result in increased
production• Permit required• Problem seals not necessarily caught
Mike Greenwood, D. PembertonPers. Comm.
1990-2001 Boat pursuit Limited effect • Effective to some extent• May inadvertently harm seals
Pemberton and Shaughnessy 1993
1985-2001 Acoustic harassment devices Limited effect • Habituation• Unknown impacts on ecosystem• Future possibilities positive
particularly with trigger mechanism
D. Pemberton Pers. Comm.
1995-2001 Treated nets (biofoulant or resin) May be effective under somecircumstances
• Environmental & Amoebic Gill Disease concerns
Mike Greenwood Pers. Comm.
1987/88 Aversive conditioning trials withLithium Chloride
Limited effect • Would need to be conducted by external party
• Used at the commencement of seal interactions
• Problematic as registered drug
Pemberton 1989
Seal / Fishery Interaction Management Strategy – Background Report
8.2.1.1 Engineering Solutions
A recent Fisheries Research and Development Corporation (FRDC) engineering studyexamining structural options for the reduction of seal interactions (Schotte and Pemberton2000) concluded that low tension through the base of predator nets and insufficient bufferdistance between stock and predator nets were the primary areas of weakness. This reportcontains detailed analyses on the advantages and disadvantages of particular net-basedmitigation measures and should be referred to for technical information.
8.2.1.2 Trapping and relocation of seals
The Tasmanian Parks and Wildlife Service/Nature Conservation Branch introduced thetrapping and relocation of seals from fish farms in 1990 at the request of the aquacultureindustry. Relocation was intended to be a temporary method of controlling the problem.
There are currently two protocols in place relating to the farm trapping and relocation of furseals. The protocols have been modified several times to reflect changes in managementprinciples. In 1998 a system of accreditation was introduced and only farms meeting certainstandards are permitted to trap seals.
8.2.1.2.1 Relocation Protocols
The objective of relocating seals from fish farms is to remove trapped seals in a safe andethical manner in order to reduce the risk of potential damage to fish stocks.
The Protocols specify the manner in which seals are to be relocated, how they are processed,how they are dealt with if they are sick or injured, and where they are to be relocated(Attachment 5).
8.2.1.2.2 Trapping and Holding Protocols
The objective of trapping and holding seals on fish farms is to humanely reduce the risk ofpotential damage to fish stocks and facilitate their relocation by the Parks and WildlifeService.
The Protocols specify the traps to be used, the bait to be used and how it is to be contained,the manner in which seals are trapped and held, including where the cage is to be located onland, and how the seal is to be looked after in the cage (Attachment 6).
8.2.2 Other Australian States
8.2.2.1 South Australia - Tuna farms
Interactions, including both the entanglement of seals in nets and the damaging of large tuna,have occurred with New Zealand fur seals and Australian sea lions at tuna farms in SouthAustralia (Pemberton 1997).The Spencer Gulf Aquaculture Management Plan currently states
Seal / Fishery Interaction Management Strategy – Background Report
that ‘all marine mammals are protected under the National Parks and Wildlife Act 1972. Forthis reason aquaculture has been sited away from known breeding, nursery and haul outareas’. The Plan requires that all fin-fish cages have an anti-predator net at least 1m awayfrom cage netting. By-catch is also addressed, and fisheries operators must notify SAFisheries of any animals enmeshed in predator nets.
A Marine Animal Interaction Working Group Workshop was held by the Fisheries andAquaculture section of Primary Industries and Resources South Australia in May 1998(PIRSA 1998). Marine biologists and government and industry representatives agreed onseveral outcomes:• A protocol be drafted to address the actions and responsibilities of individuals in the event
that a marine animal is accidentally trapped;• Four members be appointed to deal specifically with the issue of seal interaction with at-
sea fish farms; and• The outcomes be applied to the code of practice of tuna farm operators in South Australia.
Preventative measures suggested for the reduction of seal predation on farmed tuna included:• The hanging of exclusion nets outside fish holding nets (at least 1m);• The use of heavy weight netting to hold fish;• Weed growth on nets to reduce visibility of fish to seals;• Aerial nets and extended barriers above water surface; and• The siting of tuna farming pens away from seal colonies and haul-outs (PIRSA 1998).
8.2.3 Overseas Practice
[ Note. While some measures employed to mitigate interactions with phocids in Scotland andCanada are relevant to the situation in Tasmania, phocid seals can have different behavioursto otariid species.]
8.2.3.1 Canada
Canada is the world’s fourth largest producer of salmon (Table 3). Interactions betweenfarms and harbour seals, California sea lions, or Steller sea lions are common. Workshopsheld between salmon farmers, biologists and government agencies have cited netcage systems(system farming method) as the most effective means of anti-predator control (Fraker et al.1998)13. Salmon growers in British Columbia are currently able, as a last resort, to apply forpermits to shoot seals feeding on captive salmon. However, several groups are concerned atthe increase in numbers of seals shot in recent years, particularly at some sites (P. Olesiukpers. comm.).
The findings of a report to the Canadian Environment Assessment Office on marinemammal/salmonid farming interactions (Iwama et al. 1997) included:
• The effectiveness of acoustic deterrent devices (ADDs) is variable among sites in BC andappears to diminish with time. Pinniped attacks still occur even with the use of ADDs;
13 The workshop that was the basis of the report by Fraker et al was on Physical Countermeasures againstPredation by Seals and Sea Lions at Salmon farms held in 1997 in BC Canada
Seal / Fishery Interaction Management Strategy – Background Report
• The long-term impacts of high intensity signals from ADDs on marine mammals are notknown, however, pinnipeds that are not deterred by ADDs may experience hearingdamage at close range;
• The population effect of the practice of killing mammal predators around salmon farms isnot known, given current information limitations. The Department of Fisheries andOceans records show large numbers of individuals killed over short time intervals; and
• Improvements to and the maintenance of physical barriers between farm fish andpredators should provide a long-term effective means of predator control. It is importantto install such systems from the beginning of farm operations, before aquatic mammalsestablish predatory behaviour.
Recommendations from the report were;
• All existing salmon farms should be required to develop and implement a “predationcontrol plan” within two years, and incorporate approved predation control plans into theaquaculture operating licence;
• ADDs should be phased out of use in all intensive fish culture operations over two years;• Killing of predators at farm sites should be strictly controlled; and• Siting of fish farms should be at an appropriate distance from seal and sea lion haul-out
sites.
Many of these recommendations are relevant to the situation in Tasmania, although the sealsinvolved behave quite differently. The siting of farms is perhaps less of an issue in Tasmaniagiven the mobility and migration patterns of fur seals.
8.2.3.2 Scotland
Scotland (UK) is the third largest producer of farmed salmon globally (Table 3). In 1998salmon were farmed at 330 sites (Scottish Executive 1998), and production was estimated tobe worth £0.5 billion, providing over 6000 jobs (Scottish Executive 1998 fromhttp://www.scotland.gov.uk/consultations/agriculture/).
Interactions between grey or common seals and fish farm operators are common in Scotland.In 1990 estimated predation losses were $2 million. The most effective non-lethal method ofreducing seal damage to fish pens has been the introduction of heavy weights to maximisetautness on all nets (Iwama et al. 1997). A net-tensioning system had been installed at 9marine farms in Shetland by 1992, completely removing the need for operators to shoot sealson these farms (Arnold 1992).
A summary of recommendations listed by the Scottish Salmon Growers Association Code ofPractice (1990) and Arnold (1992) include:• The siting of new farms should not occur close to concentrations of predators (Arnold
1992; Ross 1988; SSGA 1990).• Adequate preventative measures should be incorporated into all farms at the planning
stage;• Salmon farm management is responsible for proper procedures to reduce the impact of
predators on farmed stock (SSGA 1990);• the most effective measures available are underwater anti-predator nets, scaring devices
(SSGA 1990) and net tensioning systems (Arnold 1992).
Seal / Fishery Interaction Management Strategy – Background Report
8.2.3.3 New Zealand
Salmon farming occurs on the South Island of New Zealand and Stewart Island either in seacages or in freshwater race-ways. Annual production of salmon has remained stable overrecent years at around 5000 tonnes green weight. The FOB (Free on Board) value of salmonexported from New Zealand was $35 million in 1999 (NZ Ministry of Fisheries).
New Zealand fur seal interactions with salmon farming operations have been experienced inMarlborough Sound. The New Zealand approach has been to promote exclusion methods.Predator proof netting developed by the King Salmon Co. Ltd appears to be effective inexcluding seals. Giga nets that envelop groups of four salmon cages are currently being testedby the New Zealand King Salmon Company and are proving effective (Andrew Baxter, NZDept. of Conservation, pers. comm.).
Electronic scarers have been tested but were not very successful. A 6-month trial of sealtranslocation also took place during which time 11 seals were translocated, however morethan 50% of seals returned. The government, NZ salmon farming companies, local Maori andtourist operators are not prepared to list shooting of seals as a viable management option.(Andrew Baxter, NZ Dept. of Conservation, pers. comm.).
8.2.3.4 Norway
Whilst being the largest producer of marine farmed salmon, Norway has relatively fewproblems with grey and harbour seal interactions. Little documentation exists regarding theinteractions between seals and the salmonid farming industry (Kjell-Tormod Nilssen pers.comm). Although salmon farming concession holders may shoot five (5) seals each per year(V. Wadley, TSGA, pers. comm.), few cases have been reported (Iwama et al. 1997).
8.2.3.5 Washington State
In Washington State system cages are provided with suitably tensioned predator nets toprevent underwater attacks. Seals are excluded from above water access to cage structures bylight nylon netting supported by a light framed structure combined with a single strandelectric fence. The top of this net extends to approximately 3.5 metres above the water whilethe wire for electric fence is located about 40 cm below the top of the mesh. The cages inWashington State are generally located in areas where the tidal range and tidal currents aremuch greater than those experienced by Tasmanian fish farms.
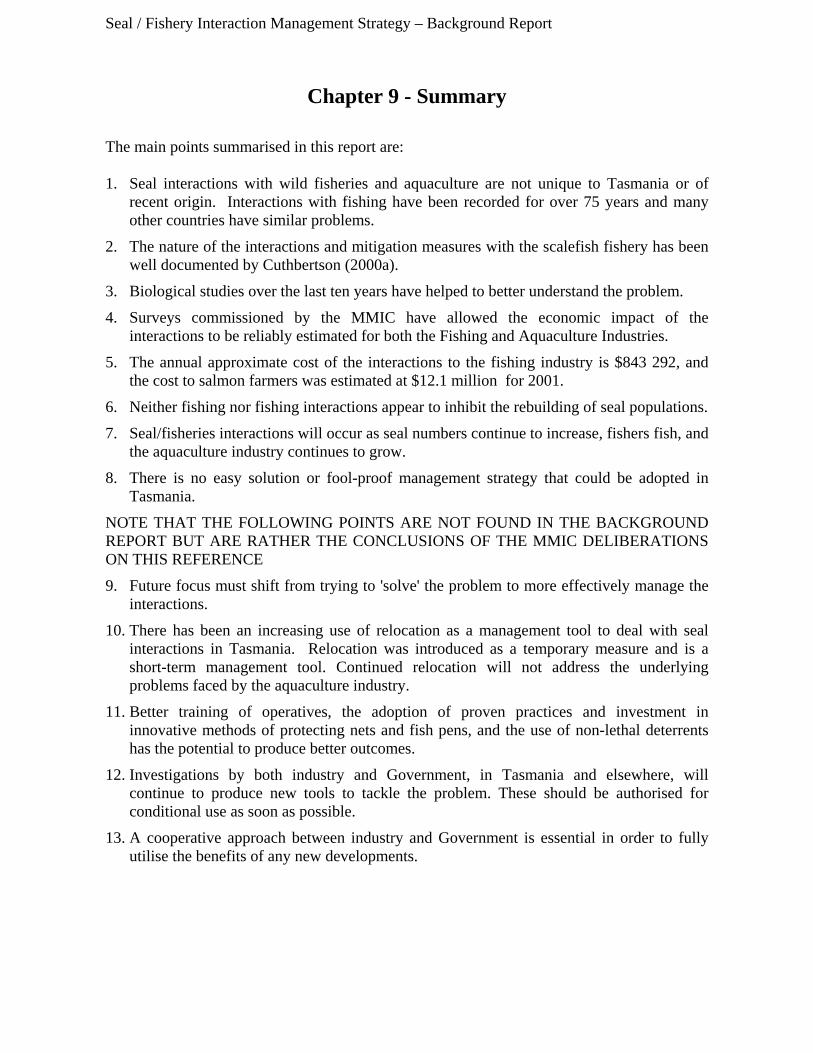
Seal / Fishery Interaction Management Strategy – Background Report
Chapter 9 - Summary
The main points summarised in this report are:
1. Seal interactions with wild fisheries and aquaculture are not unique to Tasmania or ofrecent origin. Interactions with fishing have been recorded for over 75 years and manyother countries have similar problems.
2. The nature of the interactions and mitigation measures with the scalefish fishery has beenwell documented by Cuthbertson (2000a).
3. Biological studies over the last ten years have helped to better understand the problem.
4. Surveys commissioned by the MMIC have allowed the economic impact of theinteractions to be reliably estimated for both the Fishing and Aquaculture Industries.
5. The annual approximate cost of the interactions to the fishing industry is $843 292, andthe cost to salmon farmers was estimated at $12.1 million for 2001.
6. Neither fishing nor fishing interactions appear to inhibit the rebuilding of seal populations.
7. Seal/fisheries interactions will occur as seal numbers continue to increase, fishers fish, andthe aquaculture industry continues to grow.
8. There is no easy solution or fool-proof management strategy that could be adopted inTasmania.
NOTE THAT THE FOLLOWING POINTS ARE NOT FOUND IN THE BACKGROUNDREPORT BUT ARE RATHER THE CONCLUSIONS OF THE MMIC DELIBERATIONSON THIS REFERENCE
9. Future focus must shift from trying to 'solve' the problem to more effectively manage theinteractions.
10. There has been an increasing use of relocation as a management tool to deal with sealinteractions in Tasmania. Relocation was introduced as a temporary measure and is ashort-term management tool. Continued relocation will not address the underlyingproblems faced by the aquaculture industry.
11. Better training of operatives, the adoption of proven practices and investment ininnovative methods of protecting nets and fish pens, and the use of non-lethal deterrentshas the potential to produce better outcomes.
12. Investigations by both industry and Government, in Tasmania and elsewhere, willcontinue to produce new tools to tackle the problem. These should be authorised forconditional use as soon as possible.
13. A cooperative approach between industry and Government is essential in order to fullyutilise the benefits of any new developments.
Seal / Fishery Interaction Management Strategy – Background Report
Chapter 10 - Reference
Akamatsu, T., K. Nakamura, H. Nitto and M. Watabe 1996. Effects of underwater sounds onescape behaviour of Steller sea lions. Fisheries Science 62: 503-510.
Angliss, R. P. and D. P. DeMaster 1998. Differentiating serious and non-serious injury ofmarine mammals taken incidental to commercial fishing operations: report of theSerious Injury Workshop 1-2 April 1997, Silver Spring, Maryland, US Department ofCommerce. NOAA Tech. Memo., NMFS-OPR-13, 48p.
Anon 1994. Is it food? Addressing marine mammal and seabird declines - Workshopsummary, Alaska Sea Grant College Program. Alaska Sea Grant Report, 93-01, 59p.
Anon 1997. Salmon Aquaculture Review, Volume 1, Report to the EnvironmentalAssessment Office, British Columbia Environmental Assessment Office.
Anon 1999. Tasmanian Industry Audit, a shared vision - agriculture, aquaculture, fisheries,food and beverages, State Government of Tasmania.
Arnold, H. 1992. Experimental predator control measures on marine salmon farms inShetland. Submission to Planning and Coordinating Committee of the MarineMammal Action Plan, UN Environ. Prog., Greenpeace UK, 25p.
Arnould, J. P. Y. and M. A. Hindell 2001. Dive behaviour, foraging locations, and maternal-attendance patterns of Australian fur seals (Arctocephalus pusillus doriferus).Canadian Journal of Zoology 79: 35-48.
Beeson, M. J. and D. A. Hanan 1996. An evaluation of pinniped-fishery interactions inCalifornia. A Report to the Pacific States Marine Fisheries Commission (PSMFC),California Department of Fish and Game, 22p.
Brothers, N. P., J. Cooper and S. Lokkeborg 1999. The incidental catch of seabirds bylongline fisheries: worldwide review and technical guidelines for mitigation. Rome,Food and Agriculture Organization, United Nations. FAO Fisheries Circular, No. 937,100p.
Cuthbertson, M. 2000a. Jaws of Debt. Saltwater River Tas. p24.
Cuthbertson, M. 2000b. Seal/net fishery 'predatation' buoy trials - collected data and findings,unpublished report, 14p.
Deloitte Touche Tohmatsu 2000 Tasmanian Farmed Aquaculture Survey 2000 HobartTasmania
Fraker, M. A., W. Duval and J. A. Kerr 1998. Physical counter measures against predation byseals and sea lions at salmon farms: Report of a workshop held 17 September 1997 atCampbell River, British Columbia, Canada, Terramar Environmental Research Ltd.Unpublished Report for BC Salmon Farmers Association, Vancouver, BC, 40p.
Seal / Fishery Interaction Management Strategy – Background Report
Gales, N. J., B. Haberly and P. Collins 2000. Changes in the abundance of New Zealand furseals, Arctocephalus forsteri, in Western Australia. Wildlife Research 17: 165-168
Gales, R. and D. Pemberton 1994. Diet of the Australian fur seal in Tasmania. AustralianJournal of Marine and Freshwater Research 45: 653-664.
Gales, R., D. Pemberton, C. C. Lu and M. R. Clarke 1993. Cephalopod diet of the Australianfur seal: variation due to location, season and sample type. Australian Journal ofMarine and Freshwater Resources 44: 657-71.
Gearin, P. J., R. L. DeLong and B. D. Ebberts 1988a. Pinniped interactions with tribalsteelhead and coho fisheries in Puget Sound, Unpublished. manuscript, 23p.
Gearin, P., R. Pfeifer, S. J. Jeffries, R. L. DeLong and M. A. Johnson 1988b. Results of the1986-87 California sea lion - Steelhead Trout predation control program at the HiramM. Chittenden Locks, Northwest and Alaska Fisheries Centre, Natl. Mar. Fish. Serv.NWAFC Processed Rep., 88-30, 111p.
Gearin, P., R. Pfiefer and S. Jeffries 1986. Control of California sea lion predation of winter-run steelhead at Hiram M. Chittenden Locks, Seattle, December 1985- April 1986,Washington Dept. Game. Fishery Manage. Rep., 86-20, 108p.
Goldsworthy, S. D., D. Pemberton and R. M. Warneke 1997. Field identification ofAustralian and New Zealand fur seals, Arctocephalus spp., based on externalcharacters. In: M. Hindell and C. Kemper (eds) Marine mammal research in theSouthern hemisphere volume 1: status, ecology and medicine: Surrey Beatty & Sons,Chipping Norton, Number of 63-71.
Gulland, J. A. 1986. Marine mammal - fisheries interactions. Ambio 15: 152-154.
Hanan, D. A., L. M. Jones and R. B. Read 1989. California Sea Lion interaction anddepredation rates with the commercial passenger fishing vessel fleet near San Diego.CalCOFI Rep. 30: 122-126.
Harwood, J. 1984. Seals and fisheries. Marine Pollution Bulletin 15: 426-429.
Harwood, J. 1987. Competition between seals and fisheries. Sci. Prog., Oxf. 71: 429-437.
Haug, T., A. B. Krøyer, K. T. Nilssen, K. I. Ugland and P. E. Aosholm 1991. Harp seal(Phoca groenlandica) invasions of North Norwegian coastal waters: age compositionand feeding habits. ICES Journal of Marine Sciences 48.
Hindell, M. A. and D. Pemberton 1997. Successful use of a translocation program toinvestigate diving behaviour in a male Australian fur seal, Arctocephalus pusillusdoriferus. Marine Mammal Science 13: 219-228.
Hume, F. 2000. Seals, storms and statistics. Tasmanian Fishing Today. 13: 30-31.
Seal / Fishery Interaction Management Strategy – Background Report
Hume, F., D. Pemberton, R. Gales, T Reid, N. Brothers and M. Greenwood (Unpublished).An assessment of the trapping and relocation of seals from salmonid fish farms inTasmania, 1990-2000.
Iwama, G., L. Nichol and J. Ford 1997. Salmon Aquaculture Review Part E AquaticMammals and other species discussion paper. British Columbia, EAO.
Julian, F. and M. Beeson 1998. Estimates of marine mammal, turtle, and seabird mortality fortwo California gillnet fisheries: 1990-1995. Fishery Bulletin 96: 271-284.
Kellert, S. R., J. P. Gibbs and T. J. Wohlgenant 1995. Canadian perceptions of commercialfisheries management and marine mammal conservation in the Northwest AtlanticOcean. Anthrozoos 8: 20-30.
Kuljis, B. A. 1985. Report of food aversion conditioning in sea lions (Zalophuscalifornianus), Southwest Fisheries Center, NMFS, 18p.
Littnan, C. L. and J. P. Y. Arnould 2000. Satellite tracking of female Australian fur seals fromKanowna Island, Department of Natural Resources and Environment, Victoria.Unpublished report, 18p.
Lyle, J. M. and A.R. Jordan 1999. Tasmanian scalefish fishery assessment – 1998. TAFIFishery Assessment Report, 88p.
Lyle, J. M. and K. Hodgson 2001. Tasmanian scalefish fishery assessment – 2000. TAFITechnical Report No. 19, 70p.
Mate, B. R. and J. T. E. Harvey 1987. Acoustical deterrents in marine mammal conflicts withfisheries. Report on a workshop held February 17-18, 1986 in Newport, Oregon.Corvallis, Oregon State University. Sea Grant College Program, Publ. No. ORESU-W-86-001, 116p.
Morris, D. S. 1996. Seal predation at salmon farms in Maine, an overview of the problem andpotential solutions. Marine Technology Society Journal 30: 39-43.
Nilssen, K. T., P. E. Grotnes and T. Haug 1992. The effect of invading harp seals (Phocagroenlandica) on local coastal fish stocks of North Norway. Fisheries Research 13:25-37.
NMFS 1997. Investigation of scientific information on the impacts of California sea lions andPacific harbor seals on salmonids and on the coastal ecosystems of Washington,Oregon and California, National Marine Fisheries Service, US Dept. of Commerce.NOAA Tech. Memo., NMFS-NWFSC-28, 172p.
Northridge, S. P. and R. J. Hofman 1999. Marine mammal interactions with fisheries. In: J.R. J. Twiss and R. R. Reeves (eds) Conservation and management of marinemammals, Smithsonian Institution Press, Washington, Number of 99-119.
Pemberton, D. 1989. The interaction between seals and fish farms in Tasmania. Hobart,Department of Lands, Parks and Wildlife, Tasmania. Unpublished report, 96p.
Seal / Fishery Interaction Management Strategy – Background Report
Pemberton, D. 1995. Princess Melikoff Trust Marine Mammal Research Report 1994-95,Parks and Wildlife Service Tasmania. Unpublished report.
Pemberton, D. 1997. Port Lincoln tuna farms, dolphins, seals, sharks and seabirds. PortLincoln, Parks and Wildlife Service, Tasmania, Unpublished report, 8p.
Pemberton, D., N. Brothers and G. Copson 1991. Predators on marine fish farms in Tasmania.Papers and Proceedings of the Royal Society of Tasmanian 125: 33-35.
Pemberton, D., R. Gales and F. Hume 1998. Princess Melikoff Trust Marine MammalResearch Report 1997/98, Parks and Wildlife Service Tasmania. Unpublished report.
Pemberton, D. 2001. Australian fur seals, Arctocephalus pusillus doriferus: pup numbers atTasmanian breeding colonies and a synthesis of the species population status. Draft,unpublished report to Nature Conservation Branch, DPIWE, Tasmania, Australia.
Pemberton, D., N. Brothers and R. Kirkwood 1992 Entanglement of Australian fur seals inman-made debris in Tasmanian waters. Wildife Research 19: 151-159.
Pemberton, D. and P. D. Shaughnessy 1993. Interaction between seals and marine fish-farmsin Tasmania, and management of the problem. Aquatic Conservation: Marine andFreshwater Ecosystems 3: 72.1-72.10.
Pemberton, D., B. Merdsoy, R. Gales and D. Renouf 1994. The interaction between offshorecod trawlers and harp Phoca groenlandica and hooded Cystophora cristata seals offNewfoundland, Canada. Biological Conservation 68: 123-127.
Pemberton, D., R. Gales and I. Skira 1995. Interactions between Seals and Fisheries: A Clashof Vertebrate Predators. Proceedings of 10th Australian Vertebrate Pest ControlConference, Tasmania May 1995: pp 249-254
PIRSA 1998. Primary Industries and Resources South Australia: Marine Animal InteractionWorking Group Workshop, Spencer Institute of TAFE, Port Lincoln.
Punt, A. E. and D. S. Butterworth 1995. The effects of future consumption by the Cape furseal on catches and catch rates of the Cape hakes. 4. Modelling the biologicalinteraction between cape fur seals Arctocephalus pusillus pusillus and the Cape hakesMerluccius capensis and M. paradoxus. South African Journal of Marine Science 16:255-285.
Reeves, R. R., R. J. Hofman, G. K. Silber and D. Wilkinson 1996. Acoustic deterrence ofharmful marine mammal-fishery interactions: proceedings of a workshop held inSeattle, Washington, 20-22 March 1996, US Dept. of Commerce. NOAA Tech. Memo,NMFS-OPR-10, 68p.
Reid, G. 1994. An assessment of the potential competition between the Australian fur seal,Arctocephalus pusillus doriferus, and Tasmanian fisheries. Honours, University ofTasmania, Hobart, 51.
Richey, S. 2000. TFIC President's Report. Tasmanian Fishing Today. 13: 8.
Seal / Fishery Interaction Management Strategy – Background Report
Ross, A. 1988. Controlling nature's predators on fish farms, Marine Conservation Society,Ross-on-Wye, UK, 96p.
Schotte, R. and D. Pemberton 2000. Anti-predator stock protection research project - Finalreport, FRDC 99/361, 84p.
Shaughnessy, P. D. 1999. The Action Plan for Australian Seals, Environment Australia, 116p.
Shaughnessy, P. D., Goldsworthy, S. D., and Libke, J.A 1995. Changes in the abundance ofNew Zealand fur seals, Arctocephalus forsteri, on Kangaroo island South Australia.Wildlife Research 22: 201-215
SSGA 1990. Salmon farming and predatory wildlife - a code of practice, Scottish SalmonGrowers Association.
UNEP 1999. The scientific evaluation of proposals to cull marine mammals, United NationsEnvironmental Programme (UNEP). A report of the Scientific Advisory Committeeof the UNEP Marine Mammal Action Plan, 28p.
Warnecke, R. M.1982. The distribution and abundance of seals in the Australasian region,with summaries of biological and current research. Mammals of the Seas, Vol. IV,Small Cetaceans, Seals, Sirenains and Otters. FAO Fisheries Series No. 5, Food andAgricultural Organisation, Rome, pp. 431-475
Wickens, P. A., D. W. Japp, P. A. Shelton, F. Kriel, P. C. Goosen, B. Rose, C. J. Augustyn, C.A. R. Bross, A. J. Penney and R. G. Krohn 1992. Seals and fisheries in South Africa -competition and conflict. South African Journal of Marine Science 12: 773-789.
Willcox, S., J. Lyle, and M. Steer 2001. Tasmanian arrow squid fishery – Status report 2001.TAFI Internal Report, 17p.
Woods, R., D. V. Cousins, R. Kirkwood and D. L. Obendorf 1995. Tuberculosis in a wildAustralian fur seal (Arctocephalus pusillus doriferus) form Tasmania. Journal ofWildlife Diseases 31: 83-86.
Wynne, K. 1990. Marine mammal interactions with the salmon drift gillnet fishery on theCopper River Delta, Alaska 1988-1989, Alaska sea Grant College Program,University of Alaska Fairbanks, 36p.
Yodzis, P. 2001. Must top predators be culled for the sake of fisheries? Trends in Ecology andEvolution 16: 78-84.
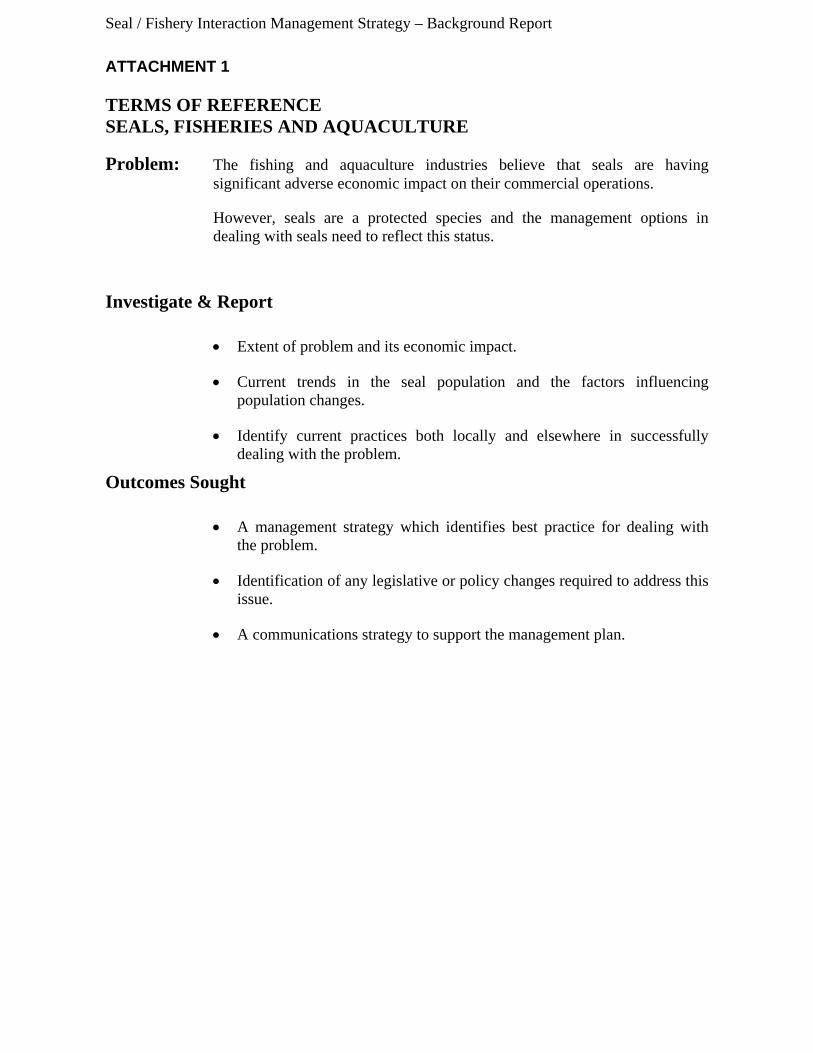
Seal / Fishery Interaction Management Strategy – Background Report
ATTACHMENT 1
TERMS OF REFERENCESEALS, FISHERIES AND AQUACULTURE
Problem: The fishing and aquaculture industries believe that seals are havingsignificant adverse economic impact on their commercial operations.
However, seals are a protected species and the management options indealing with seals need to reflect this status.
Investigate & Report
• Extent of problem and its economic impact.
• Current trends in the seal population and the factors influencingpopulation changes.
• Identify current practices both locally and elsewhere in successfullydealing with the problem.
Outcomes Sought
• A management strategy which identifies best practice for dealing withthe problem.
• Identification of any legislative or policy changes required to address thisissue.
• A communications strategy to support the management plan.
Seal / Fishery Interaction Management Strategy – Background Report
ATTACHMENT 3
Seals and the Fishing Industry to 1970
Tony Harrison
A brief scan of Tasmanian history reveals that seal/fisheries interactions have been a commontheme. Since the late 1880s and throughout the 1900s governments have been asked to solvethis perennial problem. The following provides a snap shot of the issues raised and how theyhave been dealt with in the past.
In 1890 the Government appointed a new Board of 23 Commissioners to hold "the generalsuperintendence, management, and protection of the Fisheries in the Colony, includingShellfish, Crustaceans, Seals, and other Fish." These honorary part time officials retained therole until 1926.
Sealing as an industry was dying by 1825. Gov Arthur reported in 1827 that 'many of therocks and islands which once afforded a rich harvest are now entirely deserted.'14 A smallcargo from Bass Strait was exported in 1832. Despite the end of the industry families that hadbeen sealers continued to live on some Bass Strait islands and kill seals.
Regulations were gazetted in 1891 to ban the killing of all seals in Tasmanian watersincluding Macquarie Island15. Although the initial ban was for three years it continued inforce until 1908 when it was incorporated into the first set of consolidated FisheriesRegulation. Regulation 9 (of 305 of 1905) protected all fur seals and seals of all kinds on orwithin three miles of Tenth or Barranjoey Island off the Tamar. The regulation described theFur seal as Arctocephalus cinerus but clearly applied to both the Australian and New Zealandfur seals. Seals were now protected by law and stocks began to recover.
When Prof. T. T. Flynn conducted a Royal Commission into Tasmanian fisheries in 1916 herecorded that fisheries in the Tamar where 'becoming exhausted'. Fishermen complained thatseals from Barranjoey Island were partly to blame. Although Flynn was not impressed by theattitude of these fishermen he conceded that the population of seals had increased and therewere now 'several hundreds' of them. He entertained the idea of 'thinning' the population butnot until after 'an investigation of at least a year' to discovered the quantity and type of fishthe seals were eating16.
In 1920 police in Launceston seized a quantity of seal skins. The owners claimed they werefrom the hair seal and thus not illegal. Following this action 'residents of the islands in BassStrait' sought permission to again legally take seals. The Commissioners investigated andconcluded that 'seals were now becoming numerous in Bass Strait' and properly managed mayin future 'form the basis of a profitable industry'. But to allow them to be 'indiscriminatelyslaughtered would be a mistake' and refused the request17.
14 HRA S 3 vol 5 p 70015 Regulation (357 of 1891) and March 11 189116 Report of Fisheries Commissioners for 1916-7 P&P Parl. Tas. No.7617 Report of Fisheries Commissioners for 1920-1 P&P Parl. Tas. No.46
Seal / Fishery Interaction Management Strategy – Background Report
The Commissioners continued their investigations and in their report for 1921-2 confirmedthat numbers had increased but there was 'no substantiation of the statements that seals wereresponsible for any depletion of edible fishing grounds'. This advice had come from thepolice officer on Flinders Island 'who had an intimate knowledge of the habits of seals' in thatarea. He recommended that and a fishing season in May and June for young male seals('wigs') be introduced but all other seals be fully protected. All skins produced must beinspected by police and a fee of £2 per boat be charged. The Commissioners implemented therecommendation18.
In its report for the following year the Commissioners reprinted a report by the CanadianCommissioner for Fisheries, Prof. Prince, for the New Zealand Government, and drewattention to the similarity between the state of seals there and around Tasmania. Princerecommended a continuing ban on sealing and then a strictly controlled harvest. 'There is noforce in the argument that fur seals are reducing the supplies of fish in the neighborhood ofrookeries..(it) is well known that in the Behring Sea the presence of enormous herds of sealshas no effect on the great abundance of valuable fish.'
The Commissioners used Prince's report to reject the petition of 16 Tamar fishermen for 'acontinuous open season' in order to reduce 'the destruction done to their nets by seals and thelarge quantities of edible fish consumed by them.' The commissioners sought furtherjustification by claiming that the 'seal rookery on the island known as White rock, to the northof Maria island, has in no way interfered with the supplies of edible fish that abound in thatlocality19.
The fishermen then sought intervention from the Attorney General A.G. Ogilvie who took akeen interest in the management of fisheries. Ogilvie got 'numerous petitions andrepresentations' on the subject and proposed to the Commissioners that they change theseason from May June to December - January. Several members took umbrage at the'Attorney-Generals interference', but he had the power to amend the Regulations without theirconsent20. The more cogent response came from Clive Lord, the Curator of the Museum, whobelieved that killing seals in the breeding season would 'exterminate' the population. Lordthen read a letter he had received from a resident of Cape Barren island describing anddeplorable behaviour of other residents on the island in ignoring conservation rules andkilling seals and geese. With the Commissioners resolutely opposed to any change, theyresolved to send the Chairman to meet with the Attorney-General.
In 1925 Ogilvie introduced new legislation placing sea fisheries under the control of a fourmember Sea Fisheries Board chaired by the Commissioner of Police. Another member wasT.T. Flynn, the Professor of Biology at the University of Tasmania.
It is likely that some seals were taken under licences issued by the Sea Fisheries Board in1926. The Board referred to the fur seal as Arctocephalus tasmanicus and it sent three pelts toEngland for evaluation. It soon found that there was no viable export market. The subsequentharvests were so small they never appeared in statistics and there was no further references toseals in subsequent reports of the Sea Fisheries Board.
18 Report of Fisheries Commissioners for 1921-2 P&P Parl. Tas No.5119 Report of Fisheries Commissioners for 1922-3 P&P Parl. Tas No.4620 Mercury 21 Nov 1923
Seal / Fishery Interaction Management Strategy – Background Report
Intermittently through the years after the seal fishery ended fishermen complained of theimpact of seals on their fishing. Following the episode in the 1920s another occurred in 1949.The President of the southern branch of the licensed Fishermen's Association, B.T.Cuthbertson claimed 'they should all be exterminated.' He favoured the Navy using depthcharges21. The claim demanded a response from the Minister and Challenger22 provided abriefing. While he admitted that seals were a nuisance to fishermen he did not think theyharmed the fishery overall. In his experience squid were a far bigger predator and he was notin favour 'of disturbing the balance of nature'. He estimated only 'a few thousand sealsremain'. Nevertheless he recommended that 'a fair amount of revenue' would accrue fromtaking 3000 seals from the southwest, 2000 from the east coast and 1000 from the northeast,without depleting the population. No one spent more time observing the operation offishermen in Tasmanian waters between 1918 and 1950 than T J Challenger. In 1950 hedescribed the question of seals and fishermen in a radio broadcast; the Tasmanian Journal ofAgriculture published the text in February 1951.
Challenger's opinion was referred to CSIRO. Harold Thompson23 replied that lucrativefisheries coexisted with seal populations far bigger than then existed. He estimated that in theVictorian Bass Strait region there were 20,000 to 60,000 seals he doubted that culling wouldassist fishermen. A.M. Olsen24 visited Pedra Branca in May 1949 and estimated the sealpopulation to be between 500 and 700. However he thought that permitting fishermen to killindividual seals damaging their nets or disturbing schools of fish was justified. Thereafter, onrare occasions, the Minister did give such permission.25
In the 1960s and 1970s a very small number of licenses were issued to marine aquaria to takethree or four live seals.�
21 Examiner 17 Mar 194922 T J Challenger was the Fisheries Inspector in the 1920s and 1930s. He was the only person employedregarding fisheries.23 Founding chief of what is known as the CSIRO's Division of Fisheries24 CSIRO fisheries officer based in Hobart25 Department of Agriculture File 18/28
Seal / Fishery Interaction Management Strategy – Background Report
ATTACHMENT 4
A REPORT TO THE MARINE AND MARINE INDUSTRIES COUNCILON THE SEAL INTERACTIONS WITH FISHERIES &AQUACULTURE QUESTIONNAIRE – DECEMBER 2000
Summary of findingsQuestionnaires were distributed by mail in Fishing Today magazine to fishers in Tasmania,inter-state fishers working Tasmanian waters and to recreational fishers via Fishcarevolunteers and the Marine Recreational Fishery Council. 153 questionnaire forms had beenreturned by the specified return date to the Department or were completed during docksideinterviews.
The results of this questionnaire should be interpreted with care as several similar surveysconducted overseas have recorded discrepancies between questionnaire responses andfisheries observer data of interactions (Wickens 1994, Wynne 1990). Although much of theinformation is qualitative in nature, several trends have emerged. Marine fish farmers werethe only sector of the marine farming industry affected by seals. Commercial scale fishersaccounted for 47% of surveys returned, 79% of which fish using grab-all netting. Fiftypercent of those respondents experiencing seal interaction, reported daily interactions withseals. The most common type of interaction (77%) for those fishers encountering dailyinteractions with seals was the taking of fish from nets, followed by net damage (24%). Thesetwo types of interaction were attributed equal importance by many fishers.
In talking to fishers around the State it was apparent that interactions with seals varied greatlyin relation to season, location, and fishing method. Responses varied greatly within a fisherywith some fishers recording sporadic levels of interaction while others encounteredinteractions daily when fishing. Many fishers were of the opinion that seal numbers haveincreased in the last decade, and that for some fisheries, eg. commercial gill netting, rates ofinteraction increased steadily. It is important to note also that several Cray fishers havingfished for 15-20 years recorded similar levels of interaction today, regardless of any perceivedincrease in seal numbers. Very few fishers called directly for a cull of seals, while areasonable proportion (9.5% of commercial scalefishers) admitted to shooting sealsinteracting with their fishing gear.
It is evident from this survey that there are particular types of fishing method that are morecommonly affected by seals than others eg. marine fish farming and commercial gill-netting.Fisheries of future concern include the squid-jigging industry, which was identified as havinginteractions with seals in Victorian waters. Of equal concern are the numbers of seals whichare drowned in gill-nets each year as by-catch.
The results of this questionnaire have provided an insight into the types, frequency andlocation of interactions with seals experienced by different fisheries in Tasmanian waters, andhave identified areas which warrant further objective data collection, future monitoring andresearch, and trialing of mitigation measures.
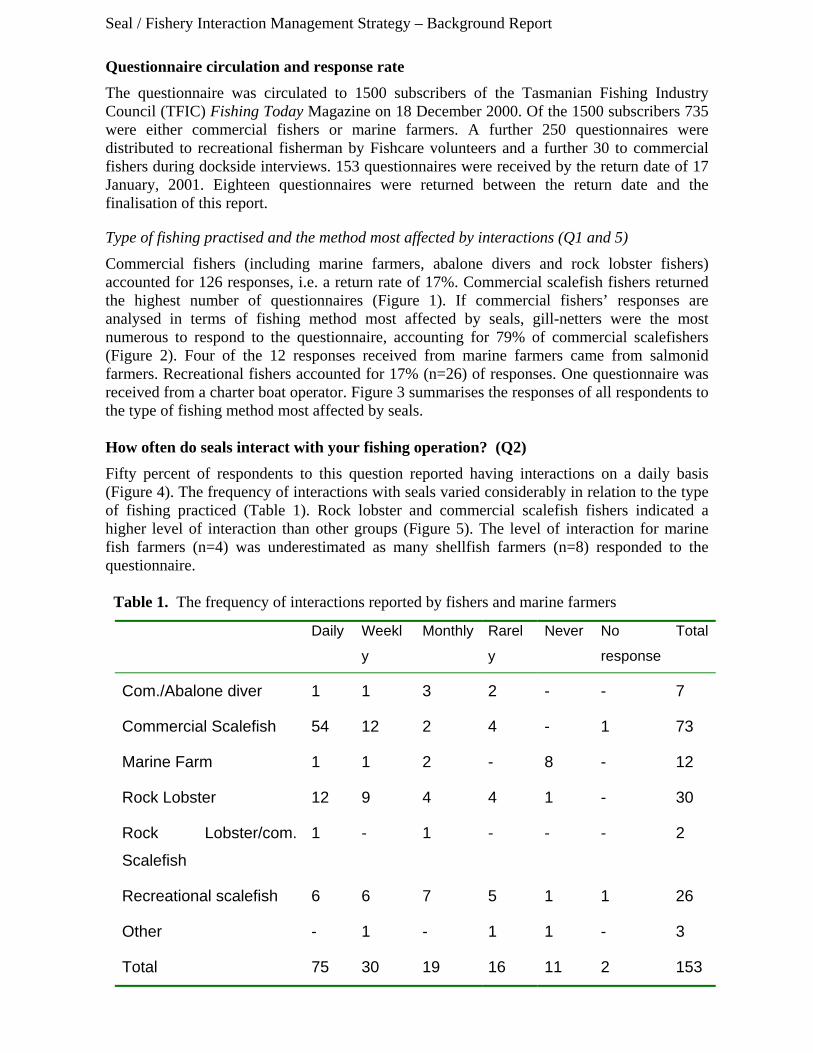
Seal / Fishery Interaction Management Strategy – Background Report
Questionnaire circulation and response rateThe questionnaire was circulated to 1500 subscribers of the Tasmanian Fishing IndustryCouncil (TFIC) Fishing Today Magazine on 18 December 2000. Of the 1500 subscribers 735were either commercial fishers or marine farmers. A further 250 questionnaires weredistributed to recreational fisherman by Fishcare volunteers and a further 30 to commercialfishers during dockside interviews. 153 questionnaires were received by the return date of 17January, 2001. Eighteen questionnaires were returned between the return date and thefinalisation of this report.
Type of fishing practised and the method most affected by interactions (Q1 and 5)
Commercial fishers (including marine farmers, abalone divers and rock lobster fishers)accounted for 126 responses, i.e. a return rate of 17%. Commercial scalefish fishers returnedthe highest number of questionnaires (Figure 1). If commercial fishers’ responses areanalysed in terms of fishing method most affected by seals, gill-netters were the mostnumerous to respond to the questionnaire, accounting for 79% of commercial scalefishers(Figure 2). Four of the 12 responses received from marine farmers came from salmonidfarmers. Recreational fishers accounted for 17% (n=26) of responses. One questionnaire wasreceived from a charter boat operator. Figure 3 summarises the responses of all respondents tothe type of fishing method most affected by seals.
How often do seals interact with your fishing operation? (Q2)Fifty percent of respondents to this question reported having interactions on a daily basis(Figure 4). The frequency of interactions with seals varied considerably in relation to the typeof fishing practiced (Table 1). Rock lobster and commercial scalefish fishers indicated ahigher level of interaction than other groups (Figure 5). The level of interaction for marinefish farmers (n=4) was underestimated as many shellfish farmers (n=8) responded to thequestionnaire.
Table 1. The frequency of interactions reported by fishers and marine farmers
Daily Weekl
y
Monthly Rarel
y
Never No
response
Total
Com./Abalone diver 1 1 3 2 - - 7
Commercial Scalefish 54 12 2 4 - 1 73
Marine Farm 1 1 2 - 8 - 12
Rock Lobster 12 9 4 4 1 - 30
Rock Lobster/com.
Scalefish
1 - 1 - - - 2
Recreational scalefish 6 6 7 5 1 1 26
Other - 1 - 1 1 - 3
Total 75 30 19 16 11 2 153
Seal / Fishery Interaction Management Strategy – Background Report
Types of interactions (Q3)On average, the taking of fish by seals was seen as the most common type of interaction(Figure 6). Of those respondents experiencing daily interactions, the majority rated the takingof fish as the most frequent form of interaction, followed by net damage (Table 2). Somerespondents rated more than one interaction type as occurring with equal frequency.
Table 2. Most frequent type of interaction recorded by fishers encountering seals daily
Taking fish Feeding ondiscards
NetDamage
StressFish
BoardBoat Playful
Debaitskewers
Daily
interaction 58 7 18 6 0 7 3
Seal By-catchNine respondents (7% of commercial fishers) reported seal by-catch as an interaction. Sevenof the nine were commercial gill-net fishers. One rock lobster fisher reported catching anaverage of 2-3 juvenile seals per year with their heads stuck in Cray pots on the West coast,and a recreational game fisher reported the occasional hook up of lines on seals. Seal by-catchis known to occur at marine fish farms but was not listed in questionnaire responses.
Numbers of seals present per interaction (Q6)The majority of respondents indicated that on average, 1-2 seals were involved inseal/fisheries interactions. Groups of more than 5 seals appeared to be rarely involved ininteractions with fishing operations (Figure 7).
The timing and location interactions (Q8-11)The timing of seal interactions as recorded by respondents tends to indicate a greateroccurrence of seal interactions in summer months in the north and north west of the state(Figure 8), while fishers in the south and east reported a greater frequency of interactions inwinter and spring (Jun-Nov). The trend was less apparent for respondents fishing in thesoutheast. These reports are consistent with the migratory behaviour of male Australian furseals. The lack of a trend in the southeast may be due to a constant number of seal interactionsin this region or a greater number and diversity of fishing practices. Figure 9 illustrates theclassification of the Statewide regions.
The timing of interactions (Q12)Table 3. summarises the timing of seal/fisheries interactions in relation to the fishing methodused. The majority of fishers indicated that interactions with seals could occur at anytime orduring the day. This question is complicated both by the fact that the answer is dependentupon the timing of fishing and the fact that seals are more difficult to see at night (their usualforaging time).
Seal / Fishery Interaction Management Strategy – Background Report
Table 3. The timing of seal interactions in relation to fishing method.Fishingmethod
Night-time
Dawn Daytime Dusk Any-time
Dusk &dawn
NoResponse
Total
Abalone/Com.diving
3 1 4
Drop lining 1 4 5 10Fish farming 1 2 1 4Fishtrapping
1 1
Gill-netting 2 3 15 1 48 2 2 73Gill-net/Long-line
1 1
Handline 2 1 1 5 9Inshoretrawling
1 1
Long lining 1 1Oyster farm 1 1Purse seine 1 1RockLobster
1 1 3 15 1 21
RockLobster/GN
3 3
Sharkhooking
1 1
Squidjigging
1 1
Sharknetting
2 2
Spearing 1 1Trawling 1 1Trolling 1 1Other 2 2No response 2 1 11 14Total 8 6 34 2 86 2 15 153
Injuries caused by seals (Q14)This question referred to Occupational Health and Safety issues regarding incidents withseals. However, many respondents were confused by the question, as indicated by the lowresponse rate and the types of responses recorded. Seven respondents cited stress as aninjury, one commercial gill net fisher recorded bruised hands and skin loss while pullingnets as a result of seals pulling the nets, while another stated that a seal tried to grab hisarm. One marine farmer recorded an instance of a seal bite.
Feeding of seals (Q15)
Seal / Fishery Interaction Management Strategy – Background Report
This question was answered by 88% of respondents. Most of the respondents (n=128)never feed seals. Several fishers admitted to feeding seals occasionally either for pleasureor to see if the seals were hungry. One rock lobster fisher fed seals unused bait on a dailybasis.
Dealing with seal interactions (Q16)The most common method of dealing with interactions was a change in fishing practice(eg. moving, n=83), followed by ignoring the seals (n=38) or a combination of changingfishing practice or ceasing to fish (n=31). Shooting was listed as one method of dealingwith seal interactions by 12 respondents (9.5% of commercial fishers).
FIGURES
Figure 1. Categorisation of responses by principal type of fishingpracticed.
CommercialScalefish
47%
AbaloneDivers
3%
MarineFarming
8%
RecreationalDiving
1%
Rock Lobster21%
Commercial Divers
1%
RecreationalScalefish
17%
No response1%
Charter BoatOperator
1%
99% answered
Drop lining9%
Trawling1%
Long-line1%
Squidjigging
1%
Fish trapping
1%
Sharknet 3%Shark hook
1%
Hand line3%
Inshoretrawl
1%
Seal / Fishery Interaction Management Strategy – Background Report
Figure 2. Breakdown of commercial scale fish respondents by fishingmethod.
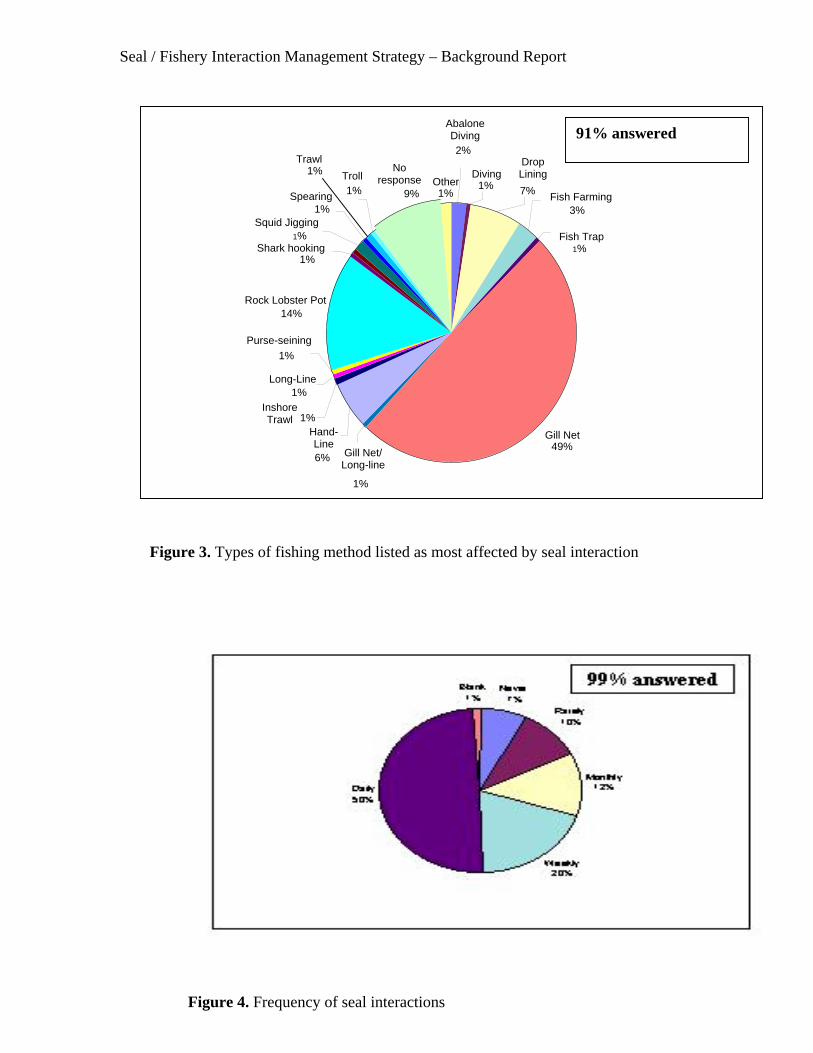
Seal / Fishery Interaction Management Strategy – Background Report
Gill Net49%
Troll1%
Other1%
Fish Trap1%
Fish Farming3%
DropLining7%
Shark hooking1%
Purse-seining1%
InshoreTrawl 1%
Long-Line1%
Rock Lobster Pot14%
Hand-Line6% Gill Net/
Long-line
1%
Trawl1%
Spearing1%
AbaloneDiving2%
Diving1%
Noresponse
9%
Squid Jigging1%
91% answered
Figure 3. Types of fishing method listed as most affected by seal interaction
Figure 4. Frequency of seal interactions
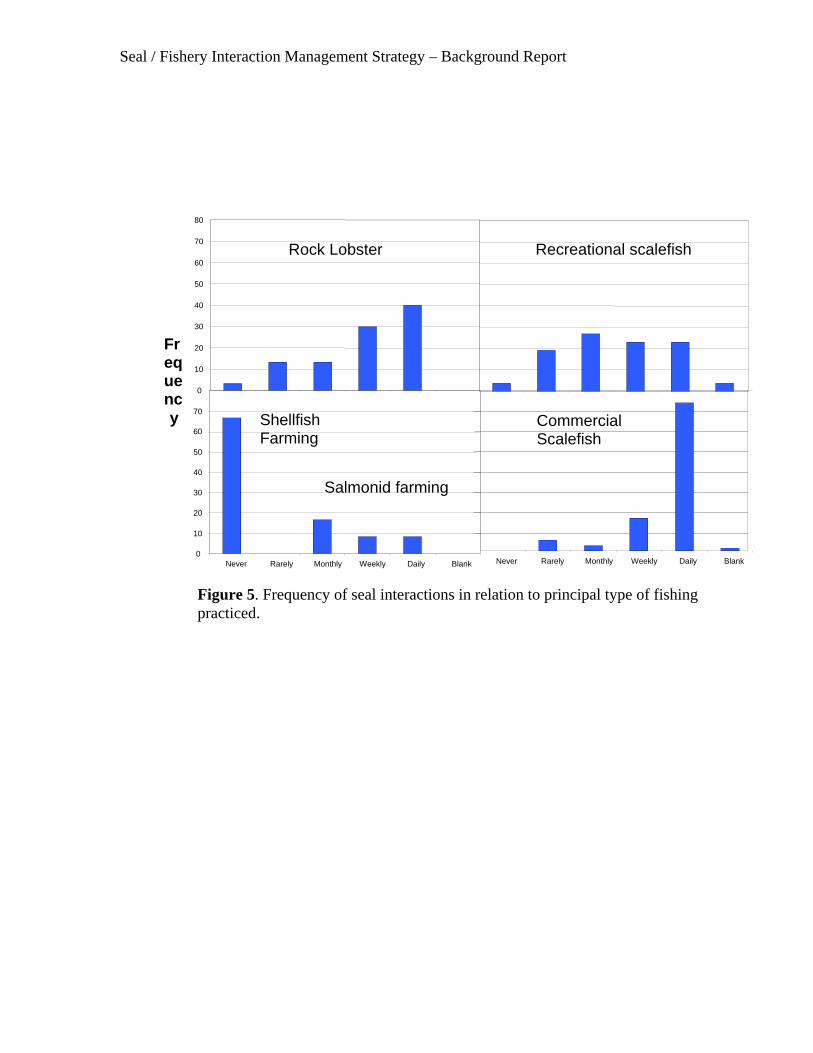
Seal / Fishery Interaction Management Strategy – Background Report
Figure 5. Frequency of seal interactions in relation to principal type of fishingpracticed.
Rock Lobster
ShellfishFarming
CommercialScalefish
Never Rarely Monthly Weekly Daily Blank0
10
20
30
40
50
60
70
Never Rarely Monthly Weekly Daily Blank
0
10
20
30
40
50
60
70
80
Recreational scalefish
Salmonid farming
Frequency
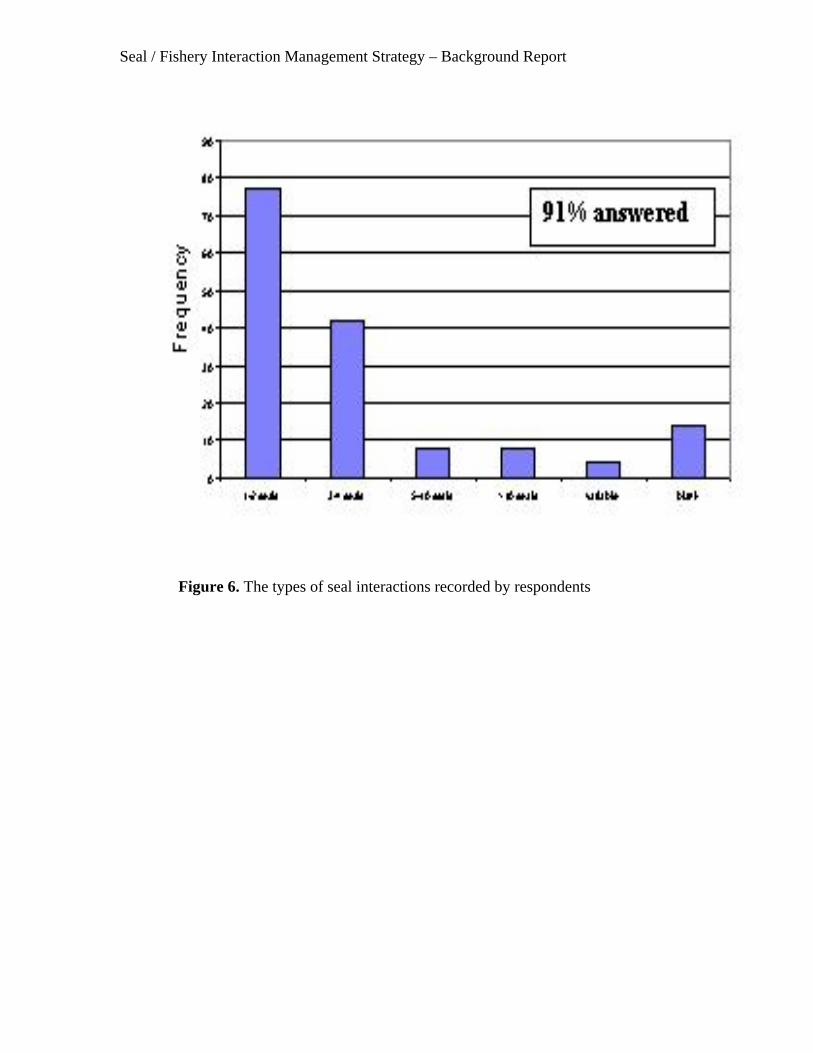
Seal / Fishery Interaction Management Strategy – Background Report
Figure 6. The types of seal interactions recorded by respondents
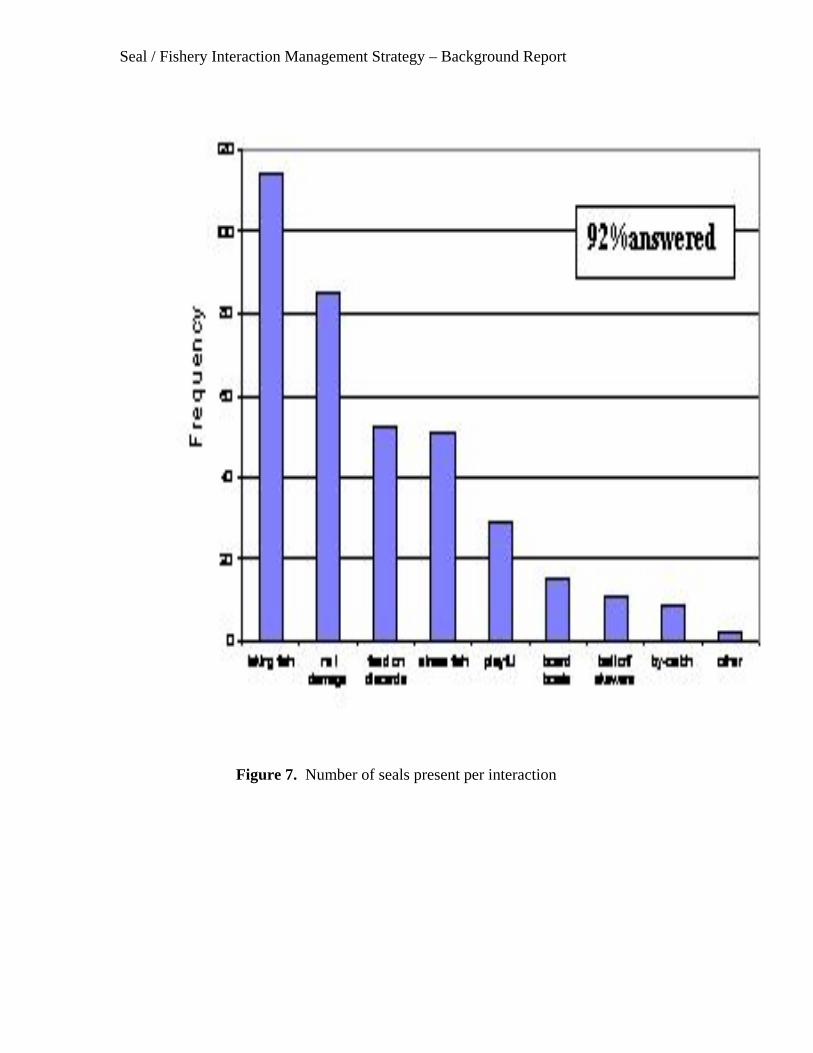
Seal / Fishery Interaction Management Strategy – Background Report
Figure 7. Number of seals present per interaction
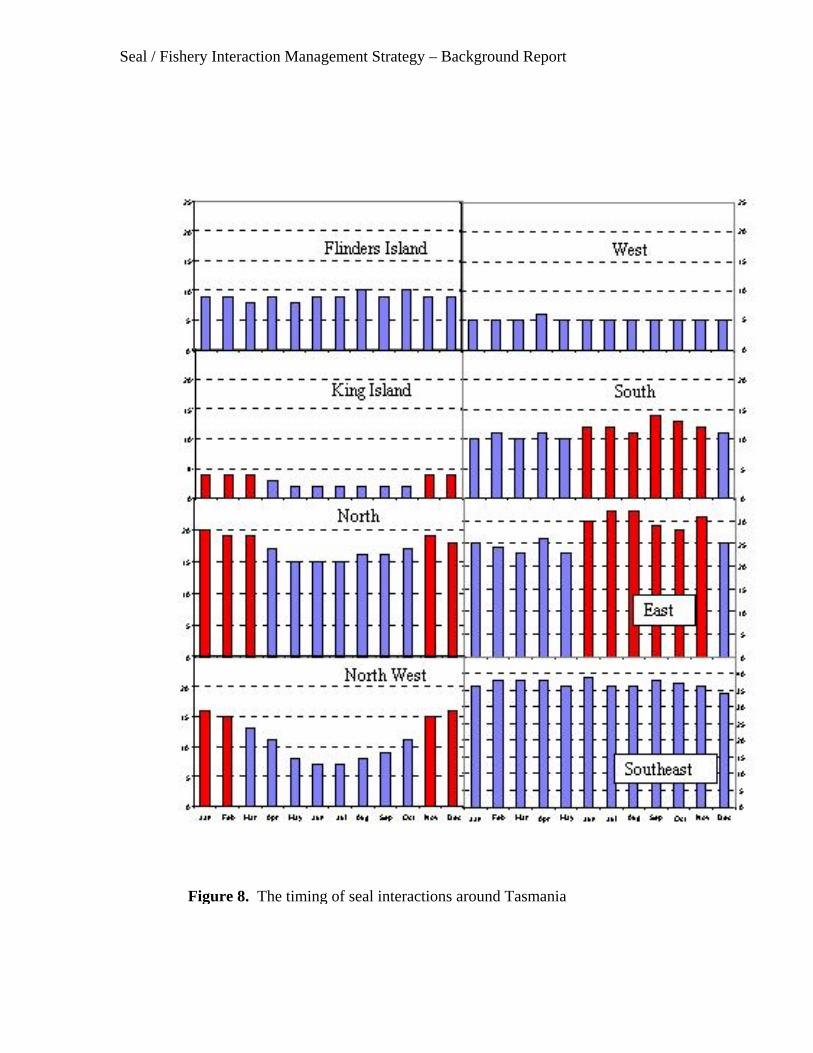
Seal / Fishery Interaction Management Strategy – Background Report
Figure 8. The timing of seal interactions around Tasmania
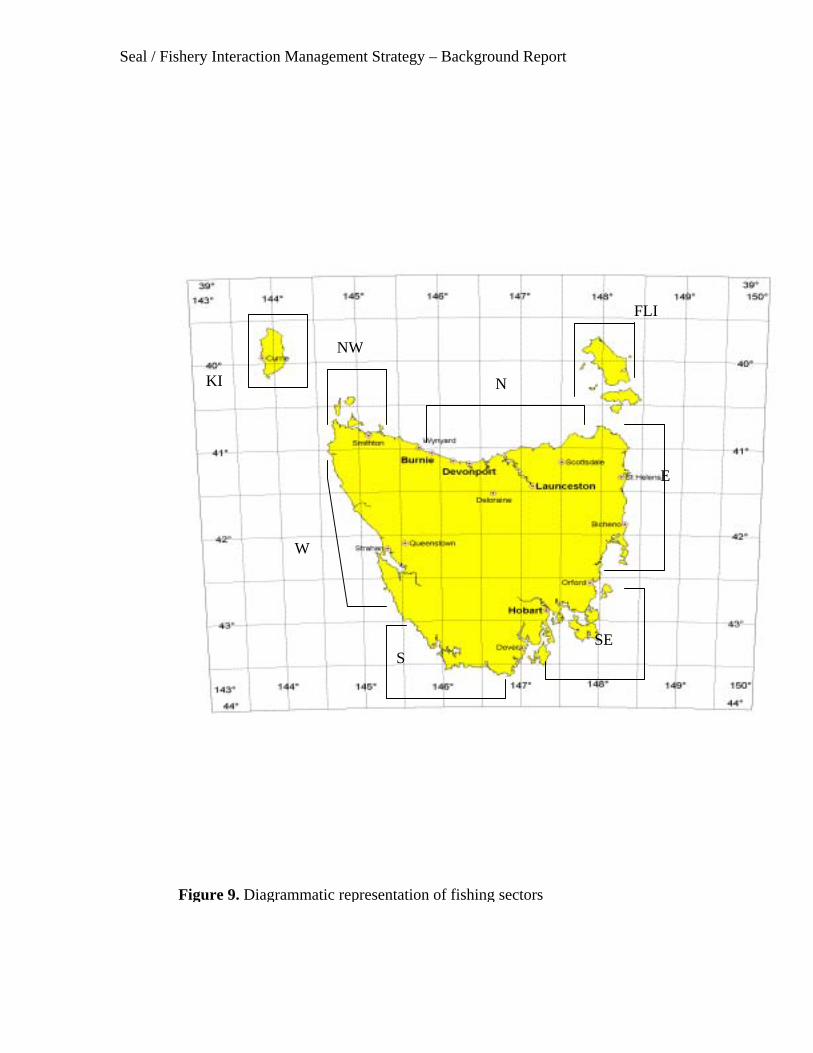
Seal / Fishery Interaction Management Strategy – Background Report
N
E
SES
W
NW
KI
FLI
Figure 9. Diagrammatic representation of fishing sectors
Seal / Fishery Interaction Management Strategy – Background Report
ADDITIONAL COMMENTS RECEIVED FROM QUESTIONNAIRERESPONDENTS
A small number of respondents to the questionnaire took the opportunity to provideadditional comments. They ranged from: leaving the industry due to seals, supportingculling, shooting seals, supporting commercial hunting of the seal, through to enjoyingdiving with seals and reports of dead seals.
The following is a snapshot of the comments received.
Rock lobster fishers
1. “Seals forced me out of the inshore gill net fishery into cray fishing. Seals can pullbait out of cray pots, and have been known to eat under sized crays being returned, bynipping the tail and flipping the head off. They are not usually a problem, unless onefollows you and pulls all your bait out.
Gill net, however, is a real problem. The seals play with fish caught in your net. I couldnot continue gill netting, had to move into crays …culling and relocation are not theanswer. A small scale sealing industry may be the answer.”
2. “Loves diving with seals. Doesn’t have a problem with all seals, just ‘rogues’. Shootsthe ring leader seal (maybe 2-3 per month on average). Asked by other fisherman toshoot seals for them sometimes.”
3. “Don’t want to cull – waste of resources – shoot seals commercially.”
Commercial scalefishers
1. “I have gone broke directly from the seal problem.”
2. “Sold licence early 2000 – owing partly to seal interaction – 15 years gill netexperience.”
“I was ‘A Class’ scalefish operator. Could not afford all the net damage and costs. Soldout and will operate a ‘C class’ on a small scale.”
3. “Cull particular problem animals, they seem to be related to salmon farming.”
4. Population of seals is 5-10% above sustainable population. Problem population less
than 5%. Supportive of culling. Sustainable environmental protection will only ever be
Seal / Fishery Interaction Management Strategy – Background Report
achieved by adopting good management practices. Over-protection creates imbalance in
nature.
More seals on haul outs. It is individual ‘problem seals’ targeting gear. Large numbers
moving North. But less than 1% interact.
Let nature take its course. Manage don’t protect.
5. “Electronic mitigating device - a good FRDC research Project.” (Commercialscalefisher)
6. Squid-jigger: “I have not encountered seals in Tasmanian waters, although there aremany animals around Portland, Vic. If a seal tries to pull baits off the jigging machine Ithrow it a few squid and then there’s no more problem”.“ I don’t think shooting seals will solve anything”.
7. “I’ve seen juvenile seals with their heads in cray pots while diving and I’ve beenunderwater when a ‘seal bomb’ has exploded and had a head-ache for a month!”
8. “This is a complete waste of time as nothing ever gets done about fisherman being ableto protect his own gear and living”.
9. There should be a minimum level of training for all fishers. A code of practice isrequired for gill-netting fishers: long soak times, night setting of nets and laziness need tostop.
10. “Night shooting of gill nets without clearing gear attracts seals”.
Several commercial gill-netting fishers expressed a keenness to be involved in futuretrials of newly developed seal deterrents and offered their time in testing them. Some ofthese same fishers expressed a reluctance to shoot seals while at the same time feelingextreme frustration during interactions. Variability in targeted fish stock availability wasalso listed as reason for decreased catch rates in some instances (eg. reduced levels ofBlue Warehou and mackerel this year)..
Abalone/commercial divers
1. “Abalone diving for 7 years and 6 years as deckhand for a diver. I have noticed adramatic increase in seal population in the last five years. I dive mainly in SE corner. Iam concerned that the seals seem to be attracted by fish farms, thus creating more activitywith sharks, particularly white pointers.” He was forced to move from Nubeena becauseof seal and shark sightings.” DPIWE should consider regular culling of seals, which inthe past, net fisherman have done. DPIWE creates fish farms but does not look at thebigger picture when granting leases. Need a balance between farming and what it does toattract unwanted marine life.
Seal / Fishery Interaction Management Strategy – Background Report
1. “ I enjoy the seals and they cause me no problems”
2. “ I only have playful interactions with seals underwater and they cause me noproblems”
Recreational scalefishers
1. “As a scuba diver seals have provided the most memorable encounters of my life.This has far outweighed any minor problem with seal holes found in nets on rareoccasions. Several seals have been found dead on the beach-combing walks around theBruny shoreline, Roberts Point, Woodcutter Point, Bligh Point.”
2. On the subject of feeding seals: “We like to see the seals having a feed even if theyhave already helped themselves to the net”.
Marine salmonid farmers
1. “Seals rarely take fish from nets since the introduction of a superior predator net.
Seal / Fishery Interaction Management Strategy – Background Report
ATTACHMENT 5
DEPARTMENT OF PRIMARY INDUSTRIES, WATER & ENVIRONMENT
JANUARY 2001
PROTOCOL FOR RELOCATION OF SEALS FROM FISH FARMS
OBJECTIVE To relocate seals trapped at fish farms in a safe and ethical manner inorder to reduce the risk of potential damage to fish stocks.
TASK To maximise the effective relocation of trapped seals, specifically,the collection and releasing. Where appropriate the 48-hour intervalmay be exploited. This will enable all staff OHS obligations to bemet and coincide with veterinary access if available.
Any circumstances arising that prevent adherence to the followingmust be discussed with contact officers prior to deviation from thisprocedure.
(a) During transfer from the approved fish farm holding cage tothe DPIWE seal relocation cage, the seal must not be harassedby forceful striking or loud noise and the minimum number ofpeople are to be involved to minimise stress on the animal.One person from DPIWE and up to two staff from the fishfarm (one to hold up the door of the holding cage and the otherbeing the fork lift driver) are usually all that are required.
(b) All seals relocated will be processed accordingly. Each newlycaptured animal must be taken to a veterinarian (where everpractical).
Seals which are trapped and relocated and which should beseen by a vet (and sampled where appropriate) include:1. any “new” seal that has not been trapped and checked by avet in the previous 12 months,2. seals where species identification (AFS or NZFS) has notbeen confirmed by staff,3. seals which look “unwell”, or have signs of injury,4. all NZ fur seals, Leopard seal or Elephant seal ,5. any “retrapped” animals with dramatic weight loss sinceprevious capture should be checked – (greater than 15% lossin weight)
Seal / Fishery Interaction Management Strategy – Background Report
Following veterinary clearance (where appropriate) transportto the approved relocation site may occur. Each trappedanimal will receive an identification microchip, photographed,sex determined and their species ID verified by staff (newseals). All seals will be painted with specific coded colour andweighed. Blood samples to be taken in accordance withspecific sampling size, determined by NCB staff inconsultation with DPIWE veterinary advice. Weighing to bedone with the portable trailer scales which must be checkedagainst commercial weighbridge reading at approximately 10seal intervals. Alternative weighbridge sites if portable scalesfail are K&D Mitre 10 Kingston and the Wood Barn,Brighton.
(c) Leopard and Elephant seals are weighed and only marked bypaint on the back. All these seals must be examined by a vetand NCB staff. Handling time and procedures must beminimised. Each recapture animal where possible is weighed(and length measured) irrespective of when last caught. Therelocation site for these species is Recherche Bay (SouthernTasmania), unless advised otherwise on professional(veterinary/ethics) advice. These animals must be transportedsingly.
If the species is identified as a New Zealand fur seal and afterfull processing, the contact officer will determine therelocation site on the East Coast for this species. It is arequirement that this species is transported individually fromother species.
(d) An injured or sick seal in chronically poor condition must beinspected by a Veterinarian without delay. NCB marinebiologist staff must also be contacted. After consultation adecision will be made and direction given to the SealRelocation Officer.
(e) All Australian Fur seals will be relocated to Pardoe, APPMmill lane near Wrights Island, Rocky Cape and Pegg’s Beachin Northern Tasmania on a rotation system. It is thereforenecessary for the relocating officer to keep relevant staffinformed of re-trap events routinely.
(f) At this stage Michael Greenwood or Chris Parker are to beadvised and the option of selecting an alternative relocation
Seal / Fishery Interaction Management Strategy – Background Report
site will be considered if an animal has been trapped for thethird time in a season. Alternative sites are to be RobinsLanding, Marrawah, and Trail Harbour. This is subject toconsideration of the current pressures of the relocationschedule.
All standard OHS procedures must be followed when handling seals.
Seal / Fishery Interaction Management Strategy – Background Report
ATTACHMENT 6
DEPARTMENT OF PRIMARY INDUSTRIES, WATER & ENVIRONMENTJANUARY 2001
PROTOCOL FOR THE TRAPPING AND HOLDING OFSEALS ON FISH FARMS
OBJECTIVE To humanely trap and hold seals at fish farms in order to reduce therisk of potential damage to fish stocks. In facilitating their relocationby DPIWE staff the trapping process and protocol aims to minimisecontact and familiarity of seals with humans and human-relatedactivities.
RECOMMENDATIONS
1) No free feeding of seals should occur (including from within themarine fish farm lease).
2) Traps where ever practicable should not be baited with captive-bred aquaculture produce. All bait used must be containedwithin an agreed bait saver.
TASK
(a) The fish farm is required to notify DPIWE immediately (seecontact procedure) once it knows that a seal has been trapped.If more than one seal has been trapped on the same day, theseal that has been the longest in captivity should be removedfirst.
(b) If the seal has been trapped between 6 p.m. (18:00 h) and 6a.m. (06:00 h) then the fish farm must remove the trap with theseal from the water and take it to land within 6 hours, andnotify the DPIWE contact officer of the capture by no laterthan 7 a.m. (07:00 h). The seal should then be transferred to anapproved designed holding cage. If the seal is trapped duringthe day (06:00 h until 18:00 h) then the removal of the trap andseal from the water, and the notification of the contact officermust be immediate. The seal should then be transferred to anapproved design holding cage.
(c) Once on land, the holding cage must be located to an approvedquiet zone and covered with an approved black-out tarpaulin to
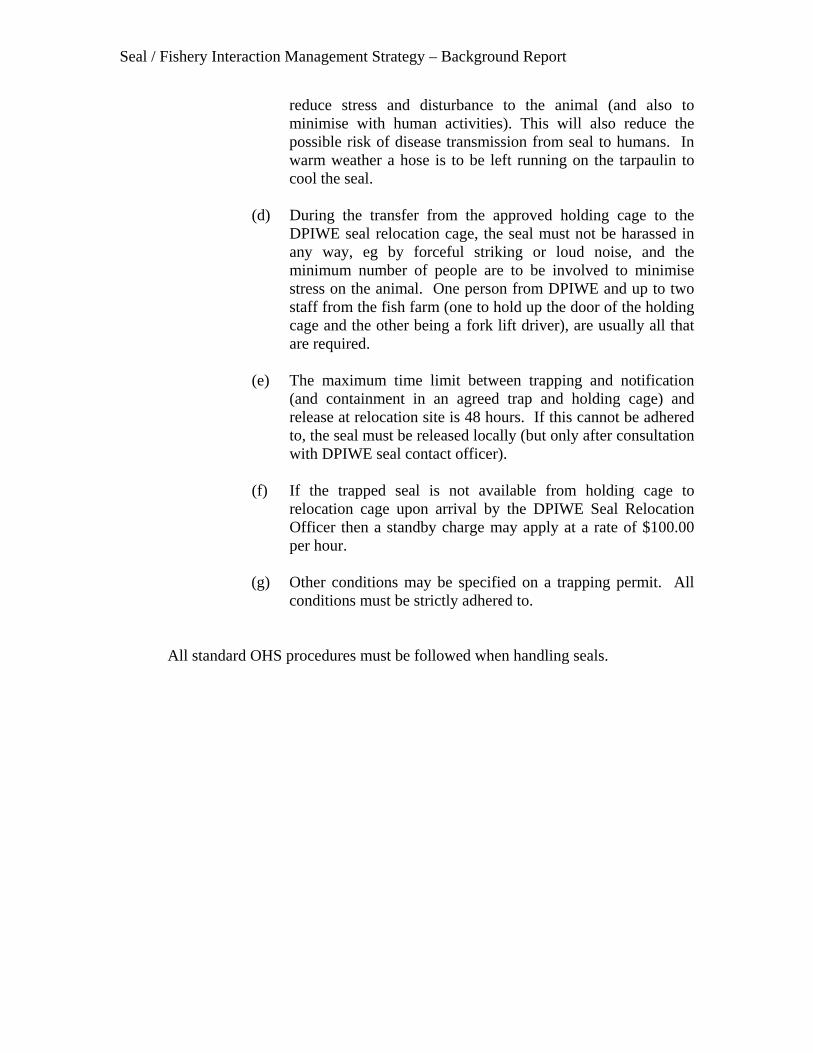
Seal / Fishery Interaction Management Strategy – Background Report
reduce stress and disturbance to the animal (and also tominimise with human activities). This will also reduce thepossible risk of disease transmission from seal to humans. Inwarm weather a hose is to be left running on the tarpaulin tocool the seal.
(d) During the transfer from the approved holding cage to theDPIWE seal relocation cage, the seal must not be harassed inany way, eg by forceful striking or loud noise, and theminimum number of people are to be involved to minimisestress on the animal. One person from DPIWE and up to twostaff from the fish farm (one to hold up the door of the holdingcage and the other being a fork lift driver), are usually all thatare required.
(e) The maximum time limit between trapping and notification(and containment in an agreed trap and holding cage) andrelease at relocation site is 48 hours. If this cannot be adheredto, the seal must be released locally (but only after consultationwith DPIWE seal contact officer).
(f) If the trapped seal is not available from holding cage torelocation cage upon arrival by the DPIWE Seal RelocationOfficer then a standby charge may apply at a rate of $100.00per hour.
(g) Other conditions may be specified on a trapping permit. Allconditions must be strictly adhered to.
All standard OHS procedures must be followed when handling seals.
Seal / Fishery Interaction Management Strategy – Background Report
ATTACHMENT 7
A SUMMARY OF RESULTS FROM THE WILD FISHING AND SEALINTERACTION SURVEY
• Survey forms were sent to all holders of a fishing licence (personal), so thatinformation on seal interactions could be obtained from all current licence holdersthat fished for commercial purposes in the last 12 months.
• The objective of this survey was to assess the economic impact that seals have onwild fishing activities. Information relating to seal interactions as well as the natureof fishing activities was requested to identify particular areas, fishing methods orfisheries that are particularly susceptible to seal interactions.
• Of the 615 survey forms sent out, 216 were returned. In terms of seal interactions,147, or 68% of the respondents stated that their fishing operations had been interferedwith by a seal, either directly or simply due to their presence, in the previous 12months.
• Fishing activities were categorised into the following sectors:Abalone divingRock lobster fishingRock lobster and scalefishingScalefishing (live fishing, general scalefishing and Commonwealth fisheries)
• The following table summarises responses for wild fishing activities where fishershad either experienced some or no seal interference in the previous 12 month period.Information from 5 respondents could not be analysed, or was not relevant to thisstudy.
AbaloneDiving
RockLobster
RockLobster +Scalefish
Scalefish LiveFishing
SealInterference
13 (6%) 18 (8%) 44 (21%) 51 (24%) 21 (10%)
Nointerference
21 (10%) 27 (13%) 5 (2%) 11 (5%) 0
Points of interest include:
i. Of the respondents who had conducted both scalefishing and rock lobster fishingactivities over the last 12 months and had experienced some form of sealinterference, 77% indicated that seals had interfered with both theirscalefishing and lobster potting.
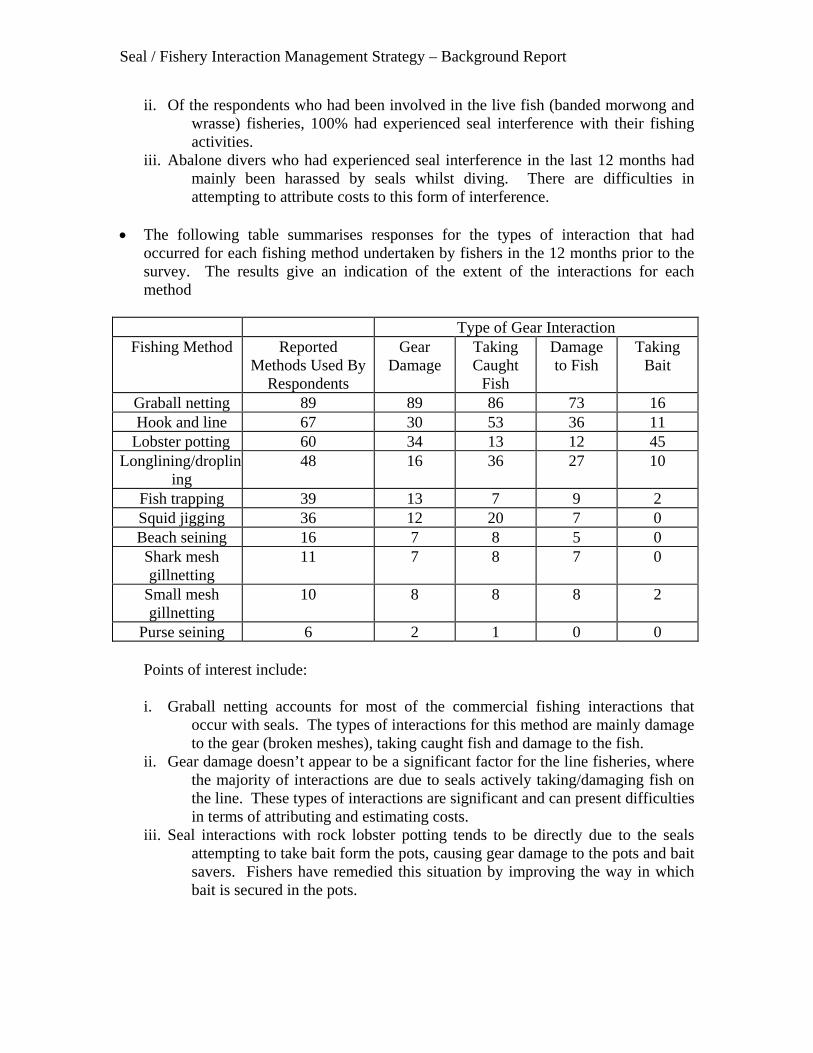
Seal / Fishery Interaction Management Strategy – Background Report
ii. Of the respondents who had been involved in the live fish (banded morwong andwrasse) fisheries, 100% had experienced seal interference with their fishingactivities.
iii. Abalone divers who had experienced seal interference in the last 12 months hadmainly been harassed by seals whilst diving. There are difficulties inattempting to attribute costs to this form of interference.
• The following table summarises responses for the types of interaction that hadoccurred for each fishing method undertaken by fishers in the 12 months prior to thesurvey. The results give an indication of the extent of the interactions for eachmethod
Type of Gear InteractionFishing Method Reported
Methods Used ByRespondents
GearDamage
TakingCaught
Fish
Damageto Fish
TakingBait
Graball netting 89 89 86 73 16Hook and line 67 30 53 36 11
Lobster potting 60 34 13 12 45Longlining/droplin
ing48 16 36 27 10
Fish trapping 39 13 7 9 2Squid jigging 36 12 20 7 0Beach seining 16 7 8 5 0Shark meshgillnetting
11 7 8 7 0
Small meshgillnetting
10 8 8 8 2
Purse seining 6 2 1 0 0
Points of interest include:
i. Graball netting accounts for most of the commercial fishing interactions thatoccur with seals. The types of interactions for this method are mainly damageto the gear (broken meshes), taking caught fish and damage to the fish.
ii. Gear damage doesn’t appear to be a significant factor for the line fisheries, wherethe majority of interactions are due to seals actively taking/damaging fish onthe line. These types of interactions are significant and can present difficultiesin terms of attributing and estimating costs.
iii. Seal interactions with rock lobster potting tends to be directly due to the sealsattempting to take bait form the pots, causing gear damage to the pots and baitsavers. Fishers have remedied this situation by improving the way in whichbait is secured in the pots.
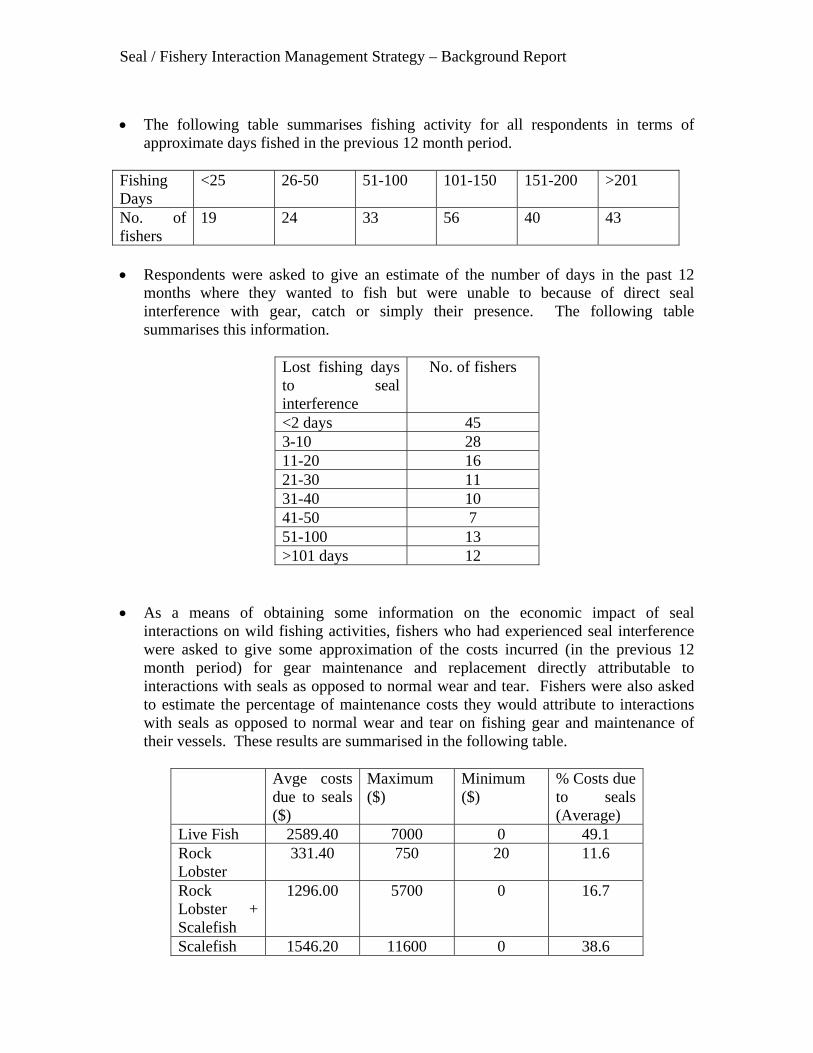
Seal / Fishery Interaction Management Strategy – Background Report
• The following table summarises fishing activity for all respondents in terms ofapproximate days fished in the previous 12 month period.
FishingDays
<25 26-50 51-100 101-150 151-200 >201
No. offishers
19 24 33 56 40 43
• Respondents were asked to give an estimate of the number of days in the past 12months where they wanted to fish but were unable to because of direct sealinterference with gear, catch or simply their presence. The following tablesummarises this information.
Lost fishing daysto sealinterference
No. of fishers
<2 days 453-10 2811-20 1621-30 1131-40 1041-50 751-100 13>101 days 12
• As a means of obtaining some information on the economic impact of sealinteractions on wild fishing activities, fishers who had experienced seal interferencewere asked to give some approximation of the costs incurred (in the previous 12month period) for gear maintenance and replacement directly attributable tointeractions with seals as opposed to normal wear and tear. Fishers were also askedto estimate the percentage of maintenance costs they would attribute to interactionswith seals as opposed to normal wear and tear on fishing gear and maintenance oftheir vessels. These results are summarised in the following table.
Avge costsdue to seals($)
Maximum($)
Minimum($)
% Costs dueto seals(Average)
Live Fish 2589.40 7000 0 49.1RockLobster
331.40 750 20 11.6
RockLobster +Scalefish
1296.00 5700 0 16.7
Scalefish 1546.20 11600 0 38.6
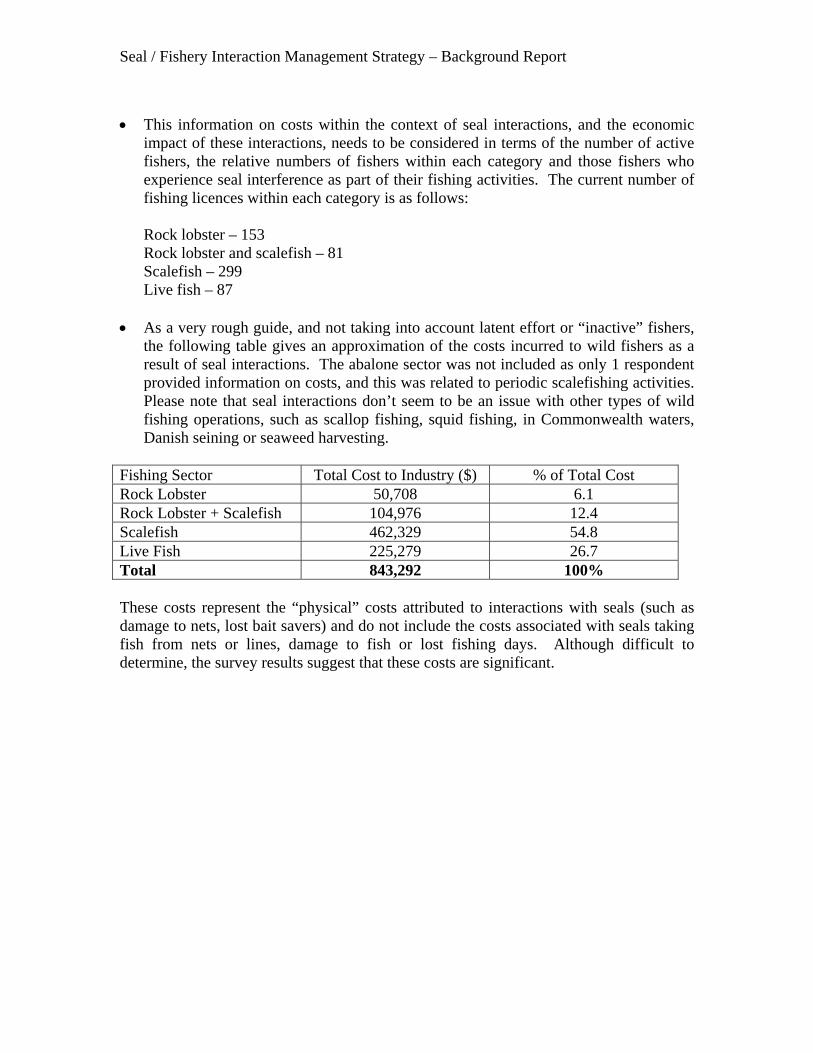
Seal / Fishery Interaction Management Strategy – Background Report
• This information on costs within the context of seal interactions, and the economicimpact of these interactions, needs to be considered in terms of the number of activefishers, the relative numbers of fishers within each category and those fishers whoexperience seal interference as part of their fishing activities. The current number offishing licences within each category is as follows:
Rock lobster – 153Rock lobster and scalefish – 81Scalefish – 299Live fish – 87
• As a very rough guide, and not taking into account latent effort or “inactive” fishers,the following table gives an approximation of the costs incurred to wild fishers as aresult of seal interactions. The abalone sector was not included as only 1 respondentprovided information on costs, and this was related to periodic scalefishing activities.Please note that seal interactions don’t seem to be an issue with other types of wildfishing operations, such as scallop fishing, squid fishing, in Commonwealth waters,Danish seining or seaweed harvesting.
Fishing Sector Total Cost to Industry ($) % of Total CostRock Lobster 50,708 6.1Rock Lobster + Scalefish 104,976 12.4Scalefish 462,329 54.8Live Fish 225,279 26.7Total 843,292 100%
These costs represent the “physical” costs attributed to interactions with seals (such asdamage to nets, lost bait savers) and do not include the costs associated with seals takingfish from nets or lines, damage to fish or lost fishing days. Although difficult todetermine, the survey results suggest that these costs are significant.