Embed Size (px)
Citation preview

New England Industrial Trawl Fishery
The industrial trawl fishery in the broad sense began in New England during the late 40's. That part of the fishery that contributed so heavily to New England landings during the last decade existed primarily because of the sizeable demand for protein animal food supplements. For a time, 1954-1959, landings averaged over one hundred million pounds a year. This fishery declined rapidly coincident with the development of the Peruvian anchovy fishery and the local decrease in abundance of menhaden. Another segment of the industrial fishery, that for pet and mink food, has continued to develop at a slow but steady pace, landing at present about 25 million pounds a year.
The animal food protein supplement industry used all species caught and landed. The fishery depended largely upon the red hake, an abundant and otherwise unutilized species. The silver hake contributed significantly to the catch from Gulf of Maine grounds making up about 25 percent of the total catch by weight, and less than 15 percent from southern New England areas, while the red hake made up about 50 percent and 70 percent of the total catch respectively. The remainder of the catch included a variety of species, most of which had little or no commercial value.
The fishery has been described in the following short papers:
Edwards, R. L. and F. E. Lux. 1958. New England's Industrial Fishery. CFR, Vol. 20, No.5.
Edwards, R. L., 1958. Gloucester's Trawl Fishery for Industrial Fish. CFa, Vol. 20, No.8.
The species composition of the catches has been reported in the following Special Scientific Reports:
Edwards, R. L., 1958. Species composition of industrial trawl landings in New England, 1957. SSR 266,
Edwards, R. L. and L. Lawday, 1960. Species composition of industrial trawl landings in New England, 1958. SSR 346,
At the present time the industrial fishery shows signs of increasing activity, Mink food landings, the catch is sorted to remove everything but red and silver hake, average around 25 million pounds a year. ~uaker Oats has set up a pet food plant in New Bedford with the capability of handling about 1 million pounds a week. In the summer of 1963, approximately 71 million pounds of unsorted trawl species were landed for reduction at Amagansett, Long Island.

10 COMMERCIAL FISHERIES REVIEW Vol. 20, No.8
GLOUCESTER'S TRAWL FISHERY FOR INDUSTRIAL FISH By Robert L. Edwards':'
DISCUSSION AND SUMMARY
The Gloucester trawl industrial fishery is based primarily on a whiting economy, in contrast to that of southern New England which is based on a flounder econ-0my. Red hake are the principal species landed for reduction at Gloucester, with whiting ranking second in quantity. On southern New England grounds, skates make
up a considerable portion of the trawl industrial landings, but in the Gulf of Maine, several spe-
GLOUCESTER cies, depending on area and season, take third place. These include the angler, eelpout, and
NAUSET
Fig. 1 - The three pri;Kipal areas fished by Gloucester trawl fleet fishing for industrial fish.
alewife. Only very small quantities of food fish are landed in the industrial catch at New Bedford and Pt. Judith from southern grounds while consistent small percentages of haddock, dab, and white hake show up in Gulf of Maine landings.
The term "industrial fish" as used here refers to those species commonly taken by trawlers and referred to as "trash fish." They are taken along with desired food species and sold separately for reduction to fishery byproducts or meal plants.
Menhaden are industrial fish in the strict sense of the word, but they are the object of a highly specialized purse-seine fishery
and they are not covered in this article. plants prefer menhaden since they yield useful only as a source of meal be
Because of their high oil content, reduction both meal and oil. Industrial trawl fish are
cause they contain only very small amounts of oil.
The tra wI fishery for industrial fish started in Gloucester as elsewhere inNew England in 1949. The Gloucester landings of this fishery have not been very consistent or large, although in recent years a slow but steady increase has occurred. As a result of the very poor landings of menhaden in 1957, the Gloucester landings of trawl industrial fish more than doubled, amount
. TaOle 1 - Gloucester Trawl Industrial Fish and Menhaden Landmgs by Month, 1955 to 1957
1957 1956 1955 Months Trawl Men Trawl Men- Trawl Men
Fish haden Fish haden Fish haden
January ........ " " ""T" " " " " n,n:ILo.", " " ",,; " " " " "
February ....... 65 24 344 March· ........ 25 54 66 April .......... 8 100 272 May .......... 1,762 735 2,110 June .......... 3,330 1,513 1,775 8,384 609 5,558. July .......... 4,540 13,300 1,100 36,236 254 20,577 August ........ 6,117 3,577 2,175 17,832 2,925 21,371 September ...... 7,454 2,311 3,348 3,957 1,399 12,672 October ........ 7,362 2,009 2,519 1,102 November . ..... 5,500 2,400 2,022 December· ..... 1,351 2,163 1,290
Totals 37,641 20,701 15,983 66,409 14,224 61,280
ing to over 37 million pounds (see table 1). During this same year, over 42 million pounds were landed at New Bedford and almost 100 million pounds landed at Ft. Judith. ':' FiShery ResearCh Biologist, NOrth Atlantic FiShery Investigations, Divisio-;:' of Biological Research, U. S. Bureau of
Commercial Fisheries, Woods Hole, Mass.

August 1958 COMMERCIAL FET1ERIES REVIEW 11
The Gulf of Maine and southern New England trawl industrial fisheries differ in their emphasis on food species. In general, the southern New England fishery is based on a flounder economy, directing its effort toward the capture of yellowtail flounder, fluke, and blackbackflounder, inaddi-Hon to red hake and other "trash" species. The Gloucester whitingindustrial fishery is primarily for whiting with secondary inter-est in such groundfish as haddock, ~
cod, white hake, and pollock. The ~ Gloucester whiting-industrial w fishery may be said to be based on ~ a whiting economy.
FISHING AREAS
The trawl industrial fish landed at Gloucester are mainly taken from three grounds (see fig. 1), the Nauset area along Cape Cod's outer shore, Stellwagen Bank, and the local grounds around Cape Ann. The loca Hon
~ z w u a: w a..
NUMBER OF SAMPLES
20
IO~M~A~Y~~J~U~N~E~J~U~L~Y~~A~U~G~~SE~P~T~~~~~N~OV~
LEGEND
~ ~
ALL OTHERS
iii WHITING .. Wh.HAKE
BIG SKATE
~ HADDOCK
~ DABS ~ ~
ALEWIVES
Btl r • ""~Ji
EEL POUT
RED HAKE --------------------------------~
of the fleet depends upon weather, the season, and the relative abundance of fish, especially whiting. Although the fleet is occasionally found concentrated on the local
Fig. 2 - Percentage by weight species composition of trawl industrial fish landings at Gloucester from the Nauset area. Data for 1956 and 1957 have been combined.
Gloucester grounds or Stellwagen Bank, the Nauset area contributes 80-90 percent of the total landings. Stell wagen Bank contributes the second largest share, and the local Gloucester grounds contribute the least.
If the demand for trawl industrial fish continues to increase, the amount of fishing on these various grounds will certainly change, and additional areas will be ex
T~ble :l - P~rcentage .~Y Weig~t of Species Composition o~ the Trawl Industrial Fish Landings at Gloucester from the Three Principal
Areas for the Entire Period for Which Information is Available
Species
Red hake ....... . Whiting ....... . Eelpout ............. . Alewife ............. . Haddock ............ . Herring ............. . White hake ...•........ Big skate ............ . Spiny dogfish ......... . Dab ................ . Little skate .......... . Longhorn sculpin ...... . Shad .......... . Sea raven ........... . Barndoor ............ . Fourspot flounder ...... . Rockling ............ . Yellowtail ........... . Cod Sea eel .. Ocean perch .... . Pollock ............ . All others ......... . Angler .... . Blackback .. .
Area an Peria overe Nauset stell wagen I ~_loucester
(May-Nov.) (June-Jan.) (May-Nov.) 57.5 JJ.H 4J.9 21.7 39.1 13.3
5.1 1.6 2.6 3.4 2.6 9.3 2.7 1.8 2.9 2.7 2.2 2.0 1.7 1.0 0.8 1.6 0.5 1.5 1.9 3.0 1.1 5.1 3.7 0.4 0.5 1.0 0.4 0.3 0.2 0.3 0.2 2.0 0.3 0.1 0.2 0.1 0.1 0.1 0.1 0.1 0.1 0.1 0.1 0.3
2.1
2.2
0.3
0.3
1.3
ploited to supply this demand. Concentrations of red hake will be sought in addition to whiting.
SPECIES COMPOSITION
The species composition of the landings is presented graphically for each fishing gr~)Und (figs. 2-4). Upwards of 20 species may be included in individual catches in significant quantities, depending on the season and the area fished. To keep the graphs reasonably simple, only those species that appear consistently and in some quantity are plotted. The "all others" category on the graphs does not include significant quantities of species of particular interest here.
Figure 2, the percentage by weight of species composition of landings from
the Nauset area, indicates that the red hake (Urophycis chuss) makes up the bulk
0.1 0.6 1.2 0.1 0.5 4.3 0.1 0.5 Grey sole ....... .
63
0.1 10.2
0.2 0.2
Number 0 Sam les
of the fish landed, being approximately 55 percent of the total for the entire period.

12 COMMERCIAL FISHERIES REVIEW Vol. 20, No.8
The whiting, or silver hake (Merluccius eilinearis), makes up about 22 percent of the landings, with the eelpout (Macrozoarces americanus) ranking as a poor third,
NUMBER OF SAMPLES or about 5 percent of the total. It should be observed that only three food species (other than
90
whiting), haddock (MelanogramD mus aegelefinus), dab (Hippoglos
ALL OTHERS soides platessoides), and white
LEGEND
80
f- 70 :r: (!)
w 60 ;;:
>-CD 50
f-Z w 40 U 0: W CL 30
20
10
o JUNE JULY AUG SEPT OCT
-WHITING
ANGLER -HERRING -HADDOCK -DABS -ALEWIVES
D RED HAKE -RED FISH
NOV DEC '---------------------------------------' Fig. 3 - Percentage by weight species composition of trawl indus
trial fish landings at Gloucester from Stellwag en Bank. Data for 1956 and 1957 have been combined.
hake (UrophyclS tenuis) appear in any number and constitute only a very small part of the landings, in all less than 6 percent.
The composition of the landings from Stell wagen Bank (fig. 3) is quite different. Red hake do not make up the bulk of the landings until fall and early winter in sharp contrast to the other areas. Whiting dominate the catch in the summer and fall. The red hake and whiting together make up approximately 73 percent of the total catch. Dabs are present in significant quantities, making up about 5 percent of the total landings. The white hake and haddock appear consistently but make up a very small part of the total catch.
The local Gloucester grounds, Ipswich Bay, Isle of Shoals, Thatchers (fig. 4), and other nearby fishing grounds present roughly the same picture as that of the Nauset area. Red hake predominate, making up about 45 percent of the total, whiting are second in quantity, contributing about 13 percent to the catch. Angler (Lophius
'Table 3 - Catch per Hour of Trawl Industrial nSh. Round_ Whiting. alld Uther ~:OOd yiSh oy the Gloucester Fleet on Nauset Grounas. Data for 1956 and 1957 are Combined
Catch Per Hour Average Catch per Trip ana
Month No. of Percentage of Total Trip Trips Industrial Round All Other Industrial Kouna _ All ,:,ther
Whiting Food Species Whitinl-( Food Species ......... . . \1"'t~~~s, ...... i:io . l~s . Percent ~. ~ ~s. !:ercent
May .......... I
34 1,600 30~0 ~ 2~0 5. 2,500 ---r.s-June ......... 31 4,080 2,130 100 46,200 64.6 24,200 33.8 1,100 1.6 July .......... 35 7,720 360 240 78,700 92.4 3,700 4.3 2,800 3.3
August .......... [ 36 4,930 1,170 50 56,600 80.2 13,400 19.0 600 0.9 September ...... . 71 3,050 1,590 180 39,000 63.4 20,300 33.0 2,300 3.7 October .... ..... 26 2,180 1,130 370 31,300 63.2 14,500 29.4 3,700 7.5 November .... .... 38 1,440 890 330 24,600 54.4 15,200 33.5 5,500 12.2
americanus) are in third place, making up about 10 percent of the total. Dabs and haddock together make up a consistent but relatively small (about 6 percent) contribution to the total catch.
Table 2 lists the percentages by weight of all species landed as trawl industrial fish from each of the three areas discussed. These figures are based on all the samples available and are not weighted according to the landings of individual months. They represent only an approximation, therefore, of the actual breakdown in percentage by weight of the landings.
The species composition picture presented for these grounds differs considerably from that of the landings at New Bedford and Pt. Judith (Edwards and Lux 1938). In southern New England waters, red hake are clearly the predominant species for almost the entire year. On the average, they make up over 60 percent of the entire

August 1958 COMMERCIAL FISHERIES REVIEW 13
catch. Whiting rank second, about 20 percent. Little skate (Raja erinacea) and its relatives, big skate (R. ocellata), and the barndoor skate (R. laevis), make up about 10 percent of the totar, in sharp - ---contrast to the Gloucester land- NUMBER OF SAMPLES
ings. 100~~~~r+rrTr~TT~~~TT~~+O~
ABUNDANCE
Adequate interviewing for abundance studies beg a n in Gloucester early in 1956, The interviewers obtained information for each trip, on the number of tows made and the average length of tow. The catch per unit of effort was obtained by simply dividing the landings by the actual number of hours that the net was fishing. The fleet is made up mostly of vessels with an average gross tonnage of about 50 tons, and no corrections were made (or were felt necessary at this stage) for individual boats, actual vessel size, or gear. Since most of the landings come from the Nauset area, the following discussions will be limited to that area.
Figure 5 shows the sea
90
~ I (!)
W ;:
>-CD
~ Z W Q a:: w a.. 30
20
10
o MAY JUNE JULY AUG. SEPT. OCT NOV.
I77l l.LLJ
ALL OTHERS
WHITING
~ ANGLER
III HADDOCK
~ DABS
ALEWIVES
RED HAKE
Fig. 4 - Percentage by weight species composition of trawl industrial fish landings at Gloucester from the local Gloucester grounds. Data for 1956 and 1957 have been combined.
sonal variation in abundance as measured by catch in pounds per hour for the peri-0d May through November. All data available for 1956 and 1957 have been combined to elicit the general seasonal pattern. A fisherman may expect to catch about 4,000 pounds per hour in May, with the catch increasing rapidly to over 8,000 pounds per hour in July. The decline in August and early September to about 6,000 pounds per hour is followed by a low level of 2,500 pounds per hour in October and November.
Figure 6 demonstrates that two species, red hake and whiting, account for most of the significant changes observed. The changes in the abundance of red hake are marked and reflect all of the general changes in figure 5~ Red hake reach their peak of abundance in July (fig. 6), when the average vessel catch is about 5,000 pounds an hour. Whiting catches of over 3,000 pounds an hour were made in June. In general, whiting are present at levels of at least 1,000 pounds an hour, usually more.
The graph of the catch per hour of whiting (fig. 6) includes both the fish landed for reduction and as human food. Figure 6 also demonstrates that the proportion of whiting landed for reduction is directly related to the abundance of red hake rather than to the whiting's own level of abundance. In figure 6 the industrial portion of the whiting catch expressed in percentage of the total whiting catch is plotted against the catch per hour of red hake. As the catch of red hake increases, it is easier to get a full boatland more quickly, and a fisherman needs to do less culling of fish of higher value to have a successful trip. When "trash fish" are abundant a good trip can be made very quickly. Apparently, the price differential is not sufficient to make it worthwhile for the fishermen to cull out the whiting intensively for the food market under these conditions ..

14 COMMERCIAL FISHERIES REVIEW Vol. 20, No.8
The over-all picture of the Nauset landings is summarized in table 3. Here listed are the statistics on the various portions of the catch for the months of May
[Table 4 - Landings of Food FISh by the Gloucester WhIting-industria Fish P' eet iri'Septemoerl!l!)lj. Total Quanttty Land;;;r,catchPerHour. and Averaae Catch Per Trip of Food Species (by Market Cate~orv) . _
Sept. 1-10 Sept. 1-10 Sept. 21-30 Totals for Month 15 Trips, 195.5 Hours Fishing 24 Trips, 299.5 Hours Fishing 15 Trips, 242 Hours Fishing 54 Trips, 737 Hours Fishing
Species olal Calch Trip ota -eaten "Tnp --Total -eaten ,!'rtp "Totar Jo:aten Trtp Landings Iper Hour Averaite Landin£s I per Hour Average Landine:s er Hour Average Landinltsl per Hour AveraSfe
. . . . • • ("ounds) .....• . . . . • • '. (Pounds) ...... 734,200 2,364.5 30,600.0
...... ' (Pounds) ...... i' .... ·OI(Pouna.J .•..... 357,000 I 1,477.3 23,800.0 1,240,600 1,683.3 21,700.0 Round whitin~ •.••• 148.900 761.6 9,900.0
I~: 400 2.05 26.7 580 1.9 2.4 360 1.49 24.0 1,340 1.82 24.8
~:::::::: 2 675 13.68 178.4 2 425 8.10 101.0 1,850 7.64 123.3 6,950 9.43 128.7 H :
857.71 21,80~i Scrod' •••. : : : :
1,720 8.80 114.7 7,218 24.10 300.8 12,865 53.16 29.58 403.8 5650 28.90 376.7 16 205 53.50 675.2 34 265 141.59 2 284.3 56 120 76.15 1 039.3
~hake: 34~1 Large ......... 315 1.61 21.0 30 0.10 1.2 - - - 0.47 6.4 Market ........ 990 5.06 66.0 2810 9.38 117.1 2800 11.57 186.7 6,600 B.96 122,2
Pollock .••••.... 1.355 6.93 90.3 2,m n~ 1 .1 3.125 12.9\ 208. 6,660 9.04 123.3 Gray sole - - - 13.8 3,470 14.34 231.3 3.800 5.16 70.4 Dabs, .......... 10 0.05 0.7 560 1.87 23.3 485 2.00 32.3 1,055 1.:ilL 19.5 Yellowtail .•....• 125 0.64 8.3 - - - -
;.031 - 125 0.17 2.3
Butterfish ... , , .. - - - 600 2.00 25.0 250 16.7 850 1.15 _...1ll
through November. It should be noted that the number of trips is not the total number made during this period but represents only those trips for which adequate interview data were available to perform the analysis.
FOOD-FISH LANDINGS
The month of September 1956 has been chosen to illustrate the nature of the food -fish landings from the Nauset grounds because of an abundance of data and because they illustrate some important problems associated with this fishery. The
8
<J) 7 0 Z « en ::l 6 0 I I-z
5 :::::. a: ::l 0 I 4 a: w 0..
<J) 3 0 z ::l @ 0 a. 2
MAY JUNE JULY AUG SEPT OCT
Fig. 5 " Catch per hour of all species on the Nauset grounds for May through November. Number of interviewed trips for each period is circled. Data for 1956 and 1957 have been combined.
data were broken down into three periods and are summarized in table 4. The average boat, aside from its industrial
l-Ien 1
0 .Z
<I: en ::> 0 :I: l-
Z
a: 100 <!) ::> 0 z I i= a: S0i: w 3: 0..
en 60 \5 0 z ::> 1-' 0 z a. 40 W
u a: w
200..
Fig. 6 - Catch in pounds per hour of red hake and Whiting in Gloucester landings from tile Nauset area. Wlliting data are based on the amount landed for reduction plus that landed as food. Data are for May through Novem·,;er. Data for 19S( a"d 195/ have been co",~i·'ed. Sc:perilnposed on the red hake histogralu is th.e srapll \.If the percentage of the total whiting catch sold for reduction.
catch, lands more whiting than anything else. Various gadoids, haddock, cod, white hake, and pollock make up most of the rest of the food -fish hails. Flounders make up only a small percentage of the total.

August 1958 COMMERCIAL FISHERIES REVIEW 15
Landings of both market categories of cod--large and market--decreased during September 1956. The average monthly catch per hour was 9.43 pounds for market, decreasing from 13.68 pounds for the first ten days to 7.64 pounds for the last ten days of the month. While landings of large white hake in September 1956 decreased from a catch per hour of 1.61 pounds to nothing, market hake substantially increased, in fact landings doubled from the first to the last period. A curious fact worthy of further study is the similarity between the catches per hour of the white hake and the pollock. The gray sole and dab catches both substantially increased, while yellowtail flounder was captured only during the first 10-day period.
The amount of whiting landed for reduction by the trawl industrial fleet at Gloucesi.t·r is directly related to the abundance of red hake rather than to the abundance of whiting itself. This situation is probably caused by the relatively small price differential between whiting and industrial fish.
The trawl industrial fishery also lands various groundfish for the food market, including haddock, cod, white hake, pollock, dab, yellowtail, and gray sole.
Only small percentages of valuable food species are going to the reduction plants at this time. An exp"1nsion of Gloucester's trawl industrial fishery should be possible without forese?ahle undue impact on the stocks of valuable food species, considering present practi·~es. The whiting is a possible exception to this since it is in demand for both food and reduction.
The data for haddock are particularly interesting, the catch per hour increasing markedly for both categories. During the last lv-day period the average trip of the two market categories of haddock combined was in excess of 3,000 pounds, in contrast to only 500 pounds during the first 10 days.
LITERATURE CITED
Edwards, Robert L. and Lux, Fred E. 1958. New England's Industrial Fishery. Commercial Fisheries Review, vol. 20, No.5 (May), pp. 1-6.
(Also Separate No. 509.)
---.----_ .• -
- -~

CRUISE SCHEDULES AND CRUISE RECORDS
This report contains the cruise schedules
of the Albatross ill (1948 - 1959), Delaware
(1951, 1959, 1960), !...- 79 (1956 - 1958), and
commercial charters (1952 - 1959).
All the data available from each cruise
are tabulated on a check list.
Prepared by:
Samuel R. Nickerson
Marine Technician

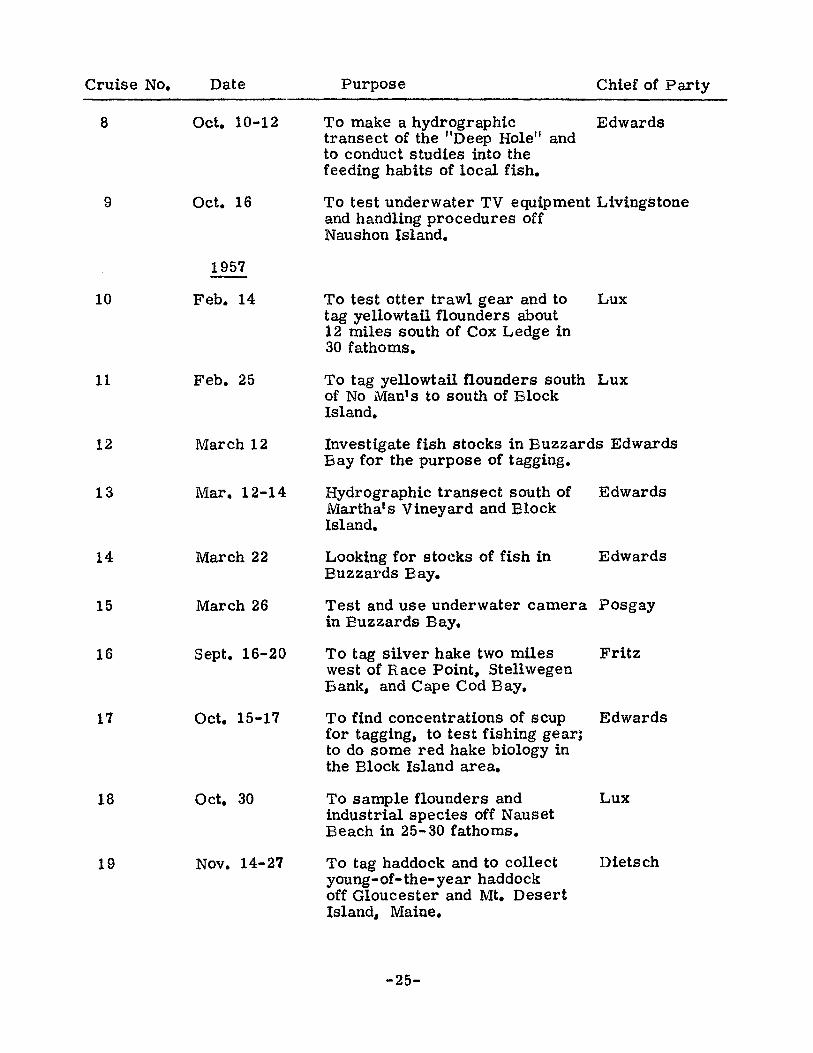
SCHEDULE OF ALBATROSS ill CRUISES Numbers 1-128, May 1948 to Feb. 19# 1959
Cruise Chief of No. Dates Purpose of Cruise and Area Covered Part~
1 May 17-20 Study of effects of waste disposal off Royce New York (National Research Council contract)
2 May 25-27 Tagging yellowtail flounders north Royce along Cape Cod and in Cape Cod Bay
3 June 7-10 To test, by tagging, survival of Vvebster haddock which pass through meshes of savings cod end. Georges Bank
4 June 21-29 To test, by tagging, survival of Webster haddock which pass through meshes of savings cod end and to compare efficiency of a standard commercial otter trawl with rollers and V-D gear and a modified trawl without rollers and V - D gear. Georges Bank
5 July 13-21 Census of groundfish popUlations on Royce Georges Bank
6 July 28-Aug. 5 Census of groundfish populations on Royce southern New England banks and to test new oceanographic instruments with cooperating WHOI scientists
7 Aug. 5-25 Census of groundfish populations on VJebster Georges Bank
8 September 1 Demonstration Cruise, Woods Hole
9 Sept. 8"'10 Census of groundfish populations in Webster South Channel area and experi-ments on the refrigeration of fish at sea
10 Sept. 29-0ct. 6 Census of groundfish populations in Webster South Channel area
-1-

Cruise No. Dates Purpose of Cruise and Area Covered
11
12
13
14
15
16
17
18
19
1948
Oct. 14 ... 19 Census of groundfish populations in South Channel area
Oct. 28-Nov. 6 Census of groundfish populations on the southern New England banks, tests of hydrographic gear by WHOI personnel, continuation of the study of the effect of waste acid disposal off New York City
Nov. 18-19 To test action of double-trousered trawl and to compare size selectivity of 4-5/8" stretched mesh and regular commercial mesh. VI estern side of South Channel
Dec. 1-9 Census of groundfish populations
1949
in the west central part of the Gulf of Maine
Jan. 10-13 To test action of double-trousered trawl and to undertake mesh selectivity experiments. Western side of South Channel
Jan. 17-19 To test action of double-trousered trawl and to undertake mesh selectivity experiments. Western side of South Channel
Feb. 28 To measure horizontal and vertical of census net. Falmouth outer harbor
May 17-21 To determine distribution of temperature, salinity. and density between Cape Hatteras and Cape Lookout (Cooperative agreement with the Univ. of North Carolina Institute of Fisheries Research)
May 24"'June 3 Census of groundfish populations and hydrographic survey of area
between Cape Lookout and Cape Fear (Cooperative agreement with the Univ. of North Carolina Institute of Fisheries Research)
-2-
Chief of Party
vVebster
Royce
Stringer
Webster
Stringer
Stringer
Royce
Royce
Buller

Cruise No. Date Purpose of Cruise and Area Covered
Chief of Party
20
21
22
23
24
25
26
27
28
29
30
-----1949
June 7
June 8-12
June 14-17
June 23-29
July 11-19
July 25
Demonstration cruise out of Moorhead City, N. C.
To determine the distribution of Royce shrimp eggs and larvae and fish and make a hydrographic survey in the area between Cape Lookout and Cape Fear
Census of groundfish populations and Royce hydrographic survey area between Cape Lookout and Cape Hatteras
Mesh selectivity studies and tagging Schuck experiments on Georges and Browns Banks
Mesh selectivity studies and underwater Stringer camera experiments by VI/HOI personnel. Georges Bank and South Channel
Demonstration Cruise
July 27 - Aug. 5 Census of groundfish populations on Georges Bank
Buller
Aug. 11-15
Sept. 7-16
Sept. 23-29
1950
Jan. 4-13
Census of groundfish populations, South Buller Channel, Cape Cod Bay, and southern New England banks
Census of groundfish populations in the Buller Gulf of Maine
Mesh selectivity experiments on Stringer haddock and redfts.h. Georges Bank and Gulf of Maine
Hydrographic survey of continental shelf Royce between Long Island, N. Y., and Little River Inlet, N. C. (In cooperation with ~v\lHOI and Univ. of North Carolina)
-3-

Cruise Chief of No. Date Purpose of Cruise and Area Covered Partl:
1950
31A Jan. 16-24 To determine trawlability of bottom Buller 31B Jan. 16-24 and availability of food fish on the Buller 3lC Feb. 6-12 continental shelf between Cape Fear Arnold 31D Feb. 25- Mar. 6 and Cape Lookout (Cooperative Arnold
Agreement with the Univ. of North Carolina)
32 Feb. 25- Mar. 6 Hydrographic survey of area between Arnold Little River Inlet and Oregon Inlet (Cooperative agreement with the Univ. of North Carolina)
33 Mar. 15-30 Census of groundfish populations on Buller Georges Bank
34 Apr. 24- May 5 Exploratory fishing and census of Royce groundfish populations on the western Nova Scotian Banks
35 May 11-18 Census of groundfish populations Yfith Schroeder special study of fluke and yellowtail flounders near the continental edge of Southern New England. (Cooperative project with V\lHOI)
36 June 6-23 "Operation Cabot" Gulf Stream Study Colton (Cooperative project, U. S. Navy, WHOI, Canadian Research Estab-lishment, F-ivS, Scripps Inst. of Oceanog. )
37 July 6-12 Census of groundfish populations on Royce Georges Bank
37A July 31-Aug. 10 Census of groundfish populations on Buller Georges Bank, Browns Bank, and the Gulf of Maine
38 Aug. 21-31 Census of groundfish populations, Buller South Channel and Southern New England banks. Studies of the gas content in the swim bladder CdHOI personnel)
39 Sept. 6-15 Tagging of scrod and large-sized Schuck haddock on Georges and western
Nova Scotian Banks
-4-

Cruise Chief of No. Date Purpose of Cruise and Area Covered Party
40-44 Feb. 9, 1951 Operating under ONR contract for to ·WHOI (Jezebel Program 1f'8961)
June 25, 1952
June 1952 Jezebel Program #8961 (operating to-- out of Bayonne, N. J.; to Eermuda"
Feb. 1953 Morehead City, N. C.
1953
45 Mar. 3-11 To study vertical and horizontal Kelly distribution of redfish in the Gulf of Maine
46 Mar. 19-Apr. 2 To determine the distribution of Colton haddock eggs and larvae, temp-erature, and salinity; and the general circulation pattern in the Gulf of lViaine-Georges Bank Area
47A Apr. 9-13 To determine the characteristics of Taylor a fish school: area, density, and relation to the bottom, Georges Bank
47B Apr. 15-21 - - - - - -do - - - - - - - - Taylor
48 Apr. 24-May 6 To determine the distribution of Colton haddock eggs and larvae, temp-erature and salinity; and the general circulation pattern in the Gulf of Maine-Georges Eank area
49 May 14-21 Mesh selectivity experiments on Clark haddock. Southeast and southwest parts of Georges Bank
50 May 25-June 3 To determine the distribution of Colton haddock eggs and larvae, temp-erature and salinity; and the general circulation pattern in the Gulf of Maine-Georges Bank area
51 June 8-17 Mesh selectivity experiments on Clark haddock. ViCinity of Jeffries Ledge, Gulf of Maine; Southeast part of Georges Bank
52 July 20-29 Mesh selectivity experiments on Clark haddock. Southeast and southwest parts of Georges Bank
-5-

Cruise Chief of No. Date Purpose of Cruise and Area Covered Party
1953
53 Aug. 10-21 Studies of the distribution of redfish Kelly in the Gulf of Maine, southern edge of Georges E ank and Nantucket Shoals
54 Sept. 1-14 Studies of the distribution of pre-recruit Colton haddock in the Gulf of Maine-Georges Bank area
55 Sept. 22-25 Studies of the distribution of pre-recruit Colton haddock on the Southern New' Engl and Banks
Sept. 26, 1953 to Laid up for lack of funds
Jan. 31, 1955
1955
56 Feb. 1-13 Studies of the distribution of Clark groundfish on Georges Bank
57 Feb. 21-Mar. 9 To determine the distribution of Colton haddock eggs and larvae, temp-erature and salinity; and the general circulation pattern in the Gulf of Maine-Georges Bank area
58 Mar. 19-Apr. 1 - - - - - - -do - - ~ - - - - - - Colton
59 April 6-12 Mesh selectivity studies LaHave E ank Clark
60 April 19- May 3 To determine the distribution of Marak haddock eggs and larvae, temp-erature and salinity; and the general circulation pattern in the Gulf of Maine-Georges Bank area
61 !\Cay 16-28 - - - - - - do - -- - - - - - - - Colton
62 June 6-18 Studies of the distribution of Clark groundfish on Georges and Browns Banks
63 Aug. 15-19 Studies of the horizontal and vertical Kelly distribution of redfish in the Gulf of Maine and South Channel
64 Aug. 23-Sept. 2 Mesh selectivity studies. Sable Clark Island
-6-

Cruise No. ---
a5
66
67
68
69
70
71
72
73
74
75
76
77
Date 1955
Sept,. 7-16
Sept. 21-28
Oct. 3-5
Oct. 12-28
Nov. 15-23
Dec. 6-19
1956 Feb. 20-Mar. 2
Mar. 21-31
April 17-28
May 2-10
May 16-29
June 11-24
July 5-11
Purpose of Cruise and Area Covered
Studies of the distribution of prerecruit haddock in the Julf of MaineGeorge s Bank area
Studies of the distribution of prerecrui t haddock on George s and the southern New England banks
Experiment with 6 types of bottom sample r s. South of Martha's Vineyard
Mesh selectivity studies. Joint cruise with Delaware. Georges Bank
Bottom survey to sample benthic fauna on southern part of Georges Bank and Nantucket Shoals.
Bottom survey of benthic fauna and to tag scallops on southern part of Georges Bank and Nantucket Shoals
To determine the distribution of haddock eggs and larvae, temp. and salinity; and the general circulation pattern in the Gulf of Maine-Georges Bank area
---------do---------
---------do---------
Mesh selectivity studies, Georges Bank
To determine the distribution of haddock eggs and larvae, temp. and salinity; and the general circulation pattern in the Gulf of Maine-Georges Bank area
---------do---------
Survey of sea scallop beds on George s Bank
- 7 -
Chief of Party
Colton
Colton
-ligley
Clark
\iVigley
,liligley
Marak
Colton
Colton
Clark
Colton
Marak
Posgay

Cruise ~o._
78
79
80
81
82
83
84
85
86
87
88
89
90
Date 1955
July 16-17
July 23-Aug. 4
Aug. 9-17
Nov. 2-10
Nov. 13-21
Nov. 27-30
Dec. 6-14
Dec. 19-20
1957 Jan. 21-23
Jan. 3D-Feb. 2
Feb. 19-28
Mar. 21-Apr. 5
April 11-17
Purpose of Cruise and Area Covered
Underwater TV testing# Buzzards Bay
Mesh selectivity studies with Delaware (#23)# Georges Bank
Bottom survey of benthic fauna on Georges Bank
Studie s of the distribution of prerecruit haddock and whiting in the Gulf of Maine-Georges Bank area and the southern New England banks
---------do---------
Studies of the behavior and escape-ment of fish through the cod end of a commercial otter trawl with UTV. Provincetown# Cape Cod Bay # and No Man IS
Codfish and haddock tagging. Georges Bank
Comparison of 5MBA (CPS Emitron) and USFVlS (Image-Orthicon) UTV equipment. Vicinity of "'fiVoods Hole
Studies of the mid-water distribution of red hake in respect to depth and temperature. South of Martha I s Vineyard
To study the behavior of trawl-caught haddock with UTV. .Jeorges Bank
To determine the distribution of herring larvae# temp. and salinity; and the general circulation pattern in the Gulf of Maine# Georges Bank and Bay of Fundy area
To test the efficiency of various tags to tag cod# and study groundfish behavior with UTV. Georges Bank# Browns Bank
To study in detail the nontidal drift pattern on Georges Bank with relation to the drift of haddock eggs and larvae
-8-
Chief of Party
Clark
Clark
WIgley
Conover
Conover
Li vingstone
Wise
Li ving stone
Edwards
Livingstone
Farrin
Livingstone
Colton

Cruise Chief of No. Date Purpose of Cruise and Area 80vered Party
1957 91 Apr. 22-23 To test and calibrate 601b multiplane Colton
kite-otter. South of Martha's Vineyard
92 Apr. 25-May 2 To study in detail the nontidal drift pat- Colton tern on Georges Bank with relation to the drift of haddock eggs and larvae
93 May 8-16 -~~-~----do--------- Marak
94 May 22-29 ---------do--------- Colton
95 June 5-12 ---------do--------- Colton
96 June 19-26 Study of the behavior of fish with UTV Livingstone Cape Cod Bay and South Channel
97 July 10-13 To study the behavior of whiting in Clark trawls with UTV. South Channel
98 July 14-19 Silver hake tagging northwest of the Fritz Cultivator whistle buoy
99 July 25-Aug. 2 Vertical distribution of redfish and Kelly haddock fry in the Gulf of Maine
100 Aug. 15 Demonstration Cruise out of Boston
101 Aug. 21-30 Bottom survey of benthic fauna on 'TJ:rigley Georges Bank. South Channel and Browns Bank
102 Sept. 5-11 Vertical distribution of postlarval Kelly redfish in Gulf of Maine
103 Sept. 18-26 Dredging. tagging. and observing spawn- Posgay ing of sea scallops. Georges Bank
104 Oct. 9-20 Haddock and cod tagging on George s Jensen and Browns Banks
105 Oct. 28-N'ov. 8 Haddock and cod tagging in the Gulf 'Wise of Maine and on Browns Bank
106 Dec. 3-20 To determine the distribution of her- Temple ring larvae. temp. and salinity; and the general circulation pattern in the Gulf of Maine. Georges Bank and Bay of Fundy area
... 9 ..

Cruise No. Date
1958 107 Jan. 7 .. 24
108 Mar. 26-Apr. 9
109 Apr. 21-25
110 Apr. 30-May 8
111 May 19-28
112 June 9-13
113 June 19-26
114 July 7-16
115 July 23
116 Jul. 28.-Aug. 1
117 Sept. 9-16
118 Sept. 22-0ct. 2
119 Oct. 6 .. 17
Purpose of Cruise and Area Covered Chief of Party
To determine the distribution of herring Temple larvae, temp. and salinity; and the gen-eral circulation pattern in the Qulf of Maine, Georges Bank and Bay of Fundy area
To tag haddock and occupy IGY hydro- Jensen graphic section. Georges and Browns Banks
To study the behavior of fish and use of Livingstone UTV for estimating population sizes of fish. Cape Cod fishing grounds
Testing new high .. speed sampler and Marak calibration trials of multiplane kite-otter. Georges Bank
To study vertical distribution of fish Colton eggs and larvae. Georges Bank
Studies of the behavior and orientation Livingstone of groundfish with UTV. Stellwagen Bank and Massachusetts Bay
Sea scallop tagging and bottom photo- Posgay graphy. Georges Bank
\tVhiting tagging. Georges Bank and Fritz New England Coast.
Demonstration Cruise out of Boston Stellwagen Bank
Study the vertical distribution of post- Kelly larval redfish in the southwest part of the Gulf of Maine.
Study the vertical distribution of red- Kelly fish and occupy IGY hydrographic sec-tion. 3eorges Bank, Browns Bank, and southwe st part of Gulf of Maine
Studies of the distribution of prere- Colton cruit haddock in the Gulf of Maine-Georges Bank area
Studies of the distribution of prere- Marak cruit haddock on Georges Bank
.. 10 -

Cruise Chief of No. Date Purpose of Cruise and Area Covered Par~
1958 120 Oct. 20-28 Studies of the distribution of prere- Colton
cruit haddock on the southern New England banks
121 Nov. 4-7 To test current and temperature instru- Li vingstone mentation used in conjunction with UTV. Cape Cod Bay
122 Nov. 17-26 Haddock tagging and populations stu- Clark dies on the Highland Grounds east of Stellwagen Bank and Cape Cod
123 Dec. 4-11 Sampling silver hake and yellowtail Fritz flounder south of Martha's Vineyard and off Nauset Light and Bell Tele-phone exercise
124A Dec. 13 To test high-speed planktpn sampler. Miller Southeast of Block Island
124B Dec. 16-17 To test bottom fauna sampler and Wigley evaluate efficiency of the natural-ist's dredge... Vineyard Sound and Buzzards Ba y
1959 125 Jan. 13-15 Industrial fish survey off Block Island Fritz
Sound
126 Jan. 21-Feb. 4 To study the role of temperature in fish Edwards distribution. Cape Cod to Cape Hatteras
127 Feb. 10-11 To recover recording buoy on Hiller Georges Bank
128 Feb. 15-20 Bell Telephone Laboratory Exercise Hiller
Fe-b. 27 Departed 'J\Toods Hole for East Boston for lay uP.
- 11 -

Cruise No. Date
1959
59-3 Mar. 18-27
59-4 Apr. 2-17
59-9 Aug. 6-12
SCHEDULE OF DELA"VARE CRUISES
Fiscal Years 1959 and 1960
Purpose of Cruise and Area Covered Chief of Party
To catch yellowtail flounder for tagging. Lux South of Martha's Vineyard to south of Block Island
To determine vertical distribution of spawning haddock. Browns shoals
Obtaining samples of substrates for benthic fauna. Southern Gulf of Maine and Browns Bank
Clark
Wigley
59-12 Sept. 23-0ct. 7 Studying the distribution of young-of- '~nse year and older haddock. Browns and Georges Banks, and the Gulf of Maine
59-13 Oct. 13-27 Studying the distribution of young-of- Jensen year and older haddock. Browns and Georges Banks, Gulf of Maine and the offing of New York
59-14 Dec. 1-10 Survey techniques. Southeast of Fritz
1960
60-2 Feb. 10-29
60- 3 Mar. 8-19
Martha's Vineyard
Conduct hydrographic and fishing Fritz survey. Continental Shelf from Martha's Vineyard to Cape Hatteras
Conduct a fishing survey and determine Skerry the vertical movements of the silver and American hake. Continental Shelf along the eastern side of Georges Bank
60-4 Mar. 23-Apr. 3 Conduct a survey of the spawning habits Wise of haddock. Georges and Browns Banks
60-5 Apr. 6-12
60-7 May 11-22
60-8 May 23-29
To collect adult haddock and haddock Wheeler eggs and to make designated bathy-thermograph transects. Georges and Browns Banks
Survey techniques. South of Block MerrUl Island to Cape Hatteras
To compile data relating to the popula- Posgay tion structure and density of the sea scallop beds. Georges Bank
-12-

Cruise No. Date
1960
60-10 July 5-9
60-12 May 2-21
1961
SCHEDULE OF DELAT'7vARE CRUISES
Fiscal Years 1959 and 1960
Purpose of Cruise and Area Covered
This cruise, the first of a series, is a survey of the inshore distribution and the possible incidental take of young-of-the-year and l-year-old haddock by the whiting and industrial fishing fieets. Area between Cape Ann and Isles of Shoals, Stellwagen Bank, and area off Nauset Beach.
To determine the distribution and relative abundance of young-of-theyear haddock and other fishes occurring in the Gulf of Maine, Georges Ban~, and Browns Bahk
Chief of Party
Fritz
Skerry
61-4 Mar. 16-27 To investigate the vertical movements Fritz of silver and American hake east of Delaware Bay
61-5 Mar. 30-Apr. 7 To tag fluke in an area between Veatch and Hudson Canyons in 50 to 80 fathoms of water
61-7 May 3-10
61-9 June 12-16
To collect quantitative lengthfrequency samples of the sea scallop population. Georges Bank
Inshore haddock survey between Isles of Shoals, Stellwagen Bank, and Nauset
Lux
Merrill
Fritz
61-10 June 20-30 Obtain samples of bottom sediments Wigley and benthic fauna. Central and northern portions of the Gulf of Maine
61-12 July 20-Aug. 3 To conduct whiting selection Fritz experiments. Ipswich Bay, Stellwagen Bank, Nauset
61-13 Aug. 10-19 To perform scallop gear selection MerrW experiments. Georges Bank
-13-

Cruise Chief of No. Date Purpose of Cruise and Area Covered Part~
1961
61-16 Sept. 22-30 To collect data on abundance and Posgay distribution of sea scallops. Georges Bank
61-17 Oct. 3-6 To conduct a groundfish survey on Fritz the northern edge at Georges Bank
61-19 Oct. 25-Nov. 6 To determine distribution and abundance Fritz Nov. 8 -20 of young-of-the-year haddock and Miller
other fishes from Bay of Fundy south to Hudson Canyon.
1962
62-3 Mar. 15-22 To conduct a serological survey at Cumming selected stations from Massachusetts Bay to Browns Bank via Nauset and Georges Bank
62-6 May 28-June 6 To collect data on the distribution and Merrill abundance of sea scallops. Georges Bank
62-7 June 11-20 To sample the benthic fauna and bottom Wigley sediments at designated localities in Great South Channel, Georges Bank, and the region south of Nantucket and Marthas Vineyard
62-8 June 25-28 Collect live specimens of the common Wheeler offshore species for aquarium exhibits. To make a groundfish survey south Fritz of Marthas Vineyard.
62-10 Sept. 11-20 To collect data on distribution and Merrill abundance of sea scallops on Georges Bank
62-12 Oct. 9-20 To determine distribution and Fritz abundance of young-of-the-year haddock and other fishes from the Bay of Fundy southward to Hudson Canyon.
62-13 Oct. 25-Nov. 4 - - • - - M do - ~ - ~ - - - - - - Jensen
-14-

CRUISE RECORDS
Cruise Salling Supple- Cruise Press Trawl B. T. Loran Admin. Bottom No. Order ment Report Release Cards Cards Logs SuPP. Trace
Albatross m
1 X X X 0 X X 0 0 0 2 X X X 0 X X 0 0 0 3 X X 0 0 X X 0 0 0 4 X X X 0 X X 0 0 0 5 X X X 0 X X 0 0 X 6 X X X 0 X X 0 0 X 7 X X X 0 X X 0 0 X 8 X X X 0 Oem. Cr. 0 0 0 0 9 X X X 0 X 0 0 0 X
10 X X X 0 X X 0 0 0 11 X X X 0 X X 0 0 X 12 X X X X X X 0 0 X 13 X X X 0 X 0 0 0 X 14 X X X 0 X 0 0 0 X 15 X X X X X 0 0 0 X 16 X X X X X 0 0 0 X 17 X X 0 0 0 0 0 0 0 18 X X X X X WHOI X 0 0 19 X X X 0 X WHOI X 0 0 20 X X X 0 nero. .Cr. WHOI X 0 0 21 X X X 0 X WHOI X 0 0 22 X X X 0 X WHOI X 0 0 23 X X X 0 X WHOI X 0 X 24 X X X 0 X 0 0 0 0 25 X X X 0 Oem. Cr. 0 0 0 0 26 X X X 0 X X X 0 X 27 X X X 0 X X X 0 X 28 X X X 0 X X X 0 X 29 X X X 0 X 0 0 0 0 30 0 X 0 0 0 WHOI X 0 0 31A X X X 0 X WHOI X 0 0 31B X X X 0 X WHOI X 0 0 31C X X X 0 X WHOI X 0 0 310 X X X 0 X WHOI 0 0 0 32 X X X 0 0 WHOI X 0 0 33 X X X 0 X X X 0 0 34 X X X 0 X X 0 0 0 35 X X X 0 X X X 0 0 36 X X X 0 0 X 0 0 0 37 X X X 0 X X 0 0 0 37A X X 0 0 X X X 0 0 38 X X X 0 X X X 0 0 39 X X X 0 X 0 0 0 0 Delaware
1 X X X 0 0 0 0 0 0 2 X X X 0 X X 0 0 0 3 X X X 0 X X 0 0 0
-15-

CRUISE RECORDS (Continued)
Cruise Sailing Supple- Cruise Press Trawl B. T. Loran Admin. Bottom No. Order ment Report Release Cards Cards Logs SuPP. Trace
Albatross III
40-44 Operating for vVHOI VVHOI 45 X X X 0 X X 0 0 0 46 X X X X 0 X 0 0 0 47A X X X X 0 X 0 0 0 47B X X X X 0 X 0 0 0 48 X X X 0 0 X 0 0 0 49 X X X 0 0 X 0 0 0 50 X X X 0 0 X 0 0 0 51 X 0 X 0 0 WHOI 0 0 0 51A 0 0 0 0 X WHOI 0 0 0 52 X 0 X 0 0 WHOI 0 0 0 53 X X X 0 X ~\JVHOI 0 0 0 54 X X X 0 X X 0 0 0 55 X X X 0 X X 0 0 0 56 X X X 0 X X 0 0 0 57 X X X 0 0 X 0 0 0 58 X X X 0 0 X 0 0 0 59 X X X 0 0 0 0 0 0 60 X X X 0 0 X 0 0 0 61 X X X 0 0 X 0 0 0 62 X X X 0 X X 0 0 0 63 X X X 0 X X 0 0 0 64 X X X 0 0 0 0 0 0 65 X X X 0 X X 0 0 0 66 X X X 0 X X 0 0 0 67 X X X 0 0 0 0 0 0 68 X X X 0 0 0 0 0 0 69 X X X 0 0 X 0 0 0 70 X X X 0 0 X 0 0 0 71 X X X 0 0 X 0 0 0 72 X X X 0 0 X 0 0 0 73 X X X 0 0 X 0 0 0 74 X X X 0 0 0 0 0 0 75 X X X 0 0 X 0 0 0 76 X X X 0 0 X 0 0 0 77 X X X 0 0 X 0 0 0 78 ~.T
.i:'" 0 X 0 0 0 0 0 0 79 X X X 0 0 0 0 0 0 80 '"'7
"':... X X 0 0 X 0 0 0 81 X X X 0 X X 0 0 0 82 X X X 0 X ~r
.A- 0 0 0 83 X 0 X 0 0 0 0 0 X 84 X 0 X 0 0 0 0 0 X 85 X 0 X 0 0 0 0 0 0 86 X 0 X 0 0 X 0 0 X 87 X X X 0 0 X 0 0 0 88 X X X 0 0 X 0 0 X 89 X X X 0 X X 0 0 X 90 X X X 0 0 X 0 0 0
-16-

CR UISE RECORDS (Continued)
Cruise Sailing Supple- Cruise Press Trawl B. T. Loran Admin. Bottom No. Order ment Report Release Cards Cards Logs SuPP. Trace
Albatross III
91 X X X 0 0 v a a 0 .L:"
92 -v- X X X a "".,.. a 0 0 ,t:.. .. 0.
93 -.;r "''!It.. X X a 0 x 0 0 0
94 X X v 0 a x 0 a 0 ,t:..
95 X X X 0 a ""r 0 0 0 .t'lt..
96 X 0 X 0 0 0 0 0 0 97 X 0 X 0 0 0 0 0 X 98 X 0 X 0 a 0 0 a X 99 X X X 0 X X 0 a X
100 X X X 0 Dem. Cr. a a a a 101 "<,.. 0 X 0 0 0 0 a a Ll.
102 v X X 0 X X a a a ,t:..
103 X 0 X 0 0 "<,.. 0 a 0 .t:..
104 v X X 0 X X 0 0 0 .L)"
105 X X X 0 X X 0 0 a 106 x X x 0 0 v a a a .L:"
107 X X X X 0 X 0 a 0 108 X X X 0 X "<'" 0 a a .t'!lt..
109 ,,<r X X "<,.. 0 .... ,.. 0 0 a ,t:" ... :.. .L:"
110 v X X 0 a x 0 0 0 .L)..
111 X X X 0 0 x 0 0 0 112 X X X 0 0 x 0 a 0 113 X X X 0 0 ... ,..
.i).. 0 0 a 114 X X X 0 X "<,.. 0 0 X .L)..
115 X X X 0 Dem. Cr. a 0 0 a 116 x X x 0 X X 0 a X 117 X X X 0 X X 0 0 X 118 X X 0 X X "<T .L)" 0 0 X 119 X X a x X "<,..
.l)" 0 a X 120 X X 0 X X ... r 0 a x ,t)..
121 X X X 0 0 x 0 0 X 122 X X X a 0 x 0 a 0 123 X X X 0 X X 0 a a 124 x 0 x 0 0 0 0 a 0 125 X X X 0 X X 0 0 0 126 X X X 0 X X 0 0 X 127 X 0 a 0 0 v 0 0 0 .L'lt..
128 X X 0 0 0 x 0 0 a Delaware
59-3 X X X 0 0 X 0 a 0 59-4 X X a 0 0 x 0 a 0 59-9 X a X 0 0 x 0 0 a 59-12 X X X 0 X X 0 a a 59-13 X X X 0 X X 0 0 a 59-14 x X X X X ... r 0 0 0 .t)..
-17-

CR UISE RECORDS (Continued)
Cruise Sailing Supple- Cruise Press Trawl B. T. Loran Admin. Bottom No. Order ment Report Release Cards Cards Logs SuPP. Trace
Delaware
60-2 X X ... ,. Ll>. 0 X X 0 0 0
60-3 X X X 0 X ... r 0 0 0 .il>.
60-4 X X X 0 X X 0 0 0 60-5 X 0 X 0 X X 0 0 0 60-7 X X X 0 0 X 0 0 0 60 ... 8 X X X 0 0 "<T 0 0 0 .i!.
60-10 X X X ..,r X X 0 X X .i:"
Key: X = Available; 0 = Missing.
-18 ...

Cruise Schedule for
COMMERCIAL CHARTERS AND T-79
Vessel Dates
1952
VJe Three May 6
Michigan June 4-12
Michigan June 15-23
U. S. Fish Sept. 10-12 & Wildlife Launch
Caryn Oct. 2-3
Wisconsin Oct. 14-23
1953
Capln Blli II July 10-17
Priscilla V 1 Nov. 9-11
Purpose
To sample small redfish with a Petersen small fish trawl, a line trawl, and a gill net in the area East of Cape Porpoise in 60 fathoms
To determine the selectivity of sizes of haddock by an otter trawl of various mesh sizes. Georges Bank
- - - - - do - - - - - - - -
To fish experimentally for small redfish and handline for large redfish in the deep water off Gloucester harbor
To trawl with a fine mesh net (1/4" square) for scattering layer organis ms and for young redfish. South of Marthas Vineyard, 70-100 fathoms
To determine the selectivity of sizes of haddock by an otter trawl of various mesh sizes. Georges Bank
Exploratory fishing on the edge of the Continental Shelf to determine the fauna present in the 200 fathom to 700 fathom depths. Block Island to Corsair Canyon
To sample young-of-the ... year redfish from New Scrantum station 25 miles east of Gloucester for validation of otolith year zones.
-19-
Chief of Party
Kelly
Clark
Clark
Kelly
Kelly
Clark
W. Schroeder
Kelly

Chief of Vessel Dates Purpose Party
1954
Priscilla V 2 Feb. 5-8 - - - - ~ do - - - - - - - - Kelly
Priscilla V 3 Apr. 20-23 - - - - - do - - - - - - - - Kelly
Priscilla V 4 Aug. 3 .. 10 - - - - - do - - - - - - - - Kelly
Priscilla V 5 Sept. 13- Whiting mesh selection Cape Clark Nov. 2 Cod Bay and Jeffrey's Ledge
Priscilla V 6 Nov. 17-23 Redfish mesh selection. Clark Cashes Ledge
1955 No charters
1956
Huckleberry To observe the behavior of fish Livingstone Finn Oct. 29- while being captured by an otter William Nov. 1 trawl in the Amagansett area Cheesebrough off Long Island, New York
1957
Canadian May 15-18 To recapture redfish tagged at Kelly R. /V. Harengus Eastport, Maine, between
Grand Manan and Campobello Island
Whaling 1 June 13-23 To test the relative efficiency Posgay City of scallop dredges with 2",
3", 3 1/2", and 4" rings in the bag and to determine the selection points of the various ring sizes. Cultivator and Northeast Peak
vVhaling 2 Aug. 8-17 To develop gear selection curves Posgay City for scallop dredges with 3",
3 1/2", and 4" rings. Georges Bank
1958
Jacquelyn 1 May 21 A series of cruises to obtain Edwards periodic data for life history studies of industrial fish and sea scallops around Block Island
-20-

Chief of Vessel Dates Purpose Party
1958
Jacquelyn 2 June 12 - - - - - do - ~ - - - - Edwards
Jacquelyn 3 July 18 To sample at the regular fishing Merrill and scallop stations.
Jacquelyn 4 Aug. 18 To sample at the regular fishing Merrill and scallop stations.
Jacquelyn 5 Sept. 23 To census scallop and fish Edwards populations and to take samples of this material for detaUed study at the Woods Hole Laboratory.
Dartmouth Sept. 9-16 To compare selectivity of scallop dredges made of 3, and 3 1/2,
Nichy
and 4 inch rings (inside diameter) with 2 inch I. D. dredge. Census scallop stocks, test metered roller and make spawning observations. Georges Bank
1959
Whaling 3 May 13-20 To collect length frequency and Posgay City age frequency samples from the
Georges Bank sea scallop beds.
Whaling 4 Sept. 12-18 - - - - - do - - - ~ - - Merrill City
1960
Capln 1 BUlm
Aug. 22-26 Inshore haddock survey between Isle of Shoals, Stellwegen Bank,
Skerry
and Nauset
Capln 2 Bill In Sept. 19-23 - - - - - do - ~ - - - - Skerry
Noah A 1 Sept. 30 To census a scallop population Merrill and take samples for analysis at Woods Hole Laboratory. Three mUes northwest of Billingsgate Buoy, Cape Cod Bay
-21-

Vessel Dates
1960
Noah A 2 Oct. 9
Noah A 3 Oct. 23
Noah A 4 Nov. 13
1961
Charlotte 1 Sept. 1
Charlotte 2 Oct. 16
Charlotte 3 Nov. 14
1962
Charlotte 4 Jan. 16
Charlotte 5 April 7
Purpose
To check spawning and bring back unspawned scallops to Laboratory for experiments and to make underwater observations on the efficiency of scallop gear. Three miles northwest of Billingsgate Buoy, Cape Cod Bay
To check sea scallop spawning, to observe and take underwater motion pictures of the operation of sea scallop gear. Three miles north of Sandy Neck, Cape Cod Bay
To check spawning, and to perform experiments to determine the efficiency of scallop gear. Three miles northwest of Billingsgate Buoy, Cape Cod Bay
To locate beds of scallops in sufficient quantities for later experiments on scallop gear efficiency. Two to five miles northv~est of Sandwich, Mass.
To check the spawning of the sea scallop. Two to five miles northwest of Sandwich, Mass.
To check the spawning of the sea scallop. Two to five miles northwest of Sandwich, Mass.
To obtain live scallops for laboratory tank experiments; to observe gonad development of sea scallops. Two to four mUes northwest of Sandwich, Mass.
- - - - - do - - - - - -
-22-
Chief of Party
Merrill
Merrill
Merrill
Merrill
Merrill
Merrill
Haynes
Haynes

Cruise No.
1
2
3
4
5
6
7
8
9
10
11
12
MONTHLY }>~DDOCK CRUISES
Silver Mink and Shirley-Roland
High Grounds NNE of Cape Cod Light
Date Purpose
Feb. 12, 1958 To make observations and collect data for haddock ecology study
Mar. 9, 1958 - - - - - do - - - - - -
Apr. 11, 1958 - - - - - do - - - - - -
May 12, 1958 - - - - - do - - - - - -
June 8, 1958 - - - - - do - - - - - -
July 12, 1958 - - - - - do - - - - - -
Aug. 9, 1958 - - - - - do - - - - - -
Sept. 14, 1958 - - - - - do - - - - - -
Oct. 14, 1958 - - - - - do - - - - ~ -
Nov. 13, 1958 - - - - - do - - - - - -
Dec. 11, 1958 - - - - - do - - - - - -
Jan. 15, 1959 - - - - - do - - - - - -
-23-
Chief of Party
Clark
Clark
Clark
Jensen
Jensen
Jensen
Clark
Clark
Jensen
Clark
Clark
Jensen

Cruise No.
1
2
3
4
5
6
7
T-79 CRUISE SCHEDULE
Date
1956
May 25-27
Purpose Chief of Party
Shake-down cruise to test Clark suitability of T-79 as a fisheries research vessel, to test the fishing gear and hauling equipment and to tag haddock 18 miles southwest of Pollock Rip Lightship.
June 28-July 14 To tag fish in the Gulf of Maine. Clark
August 22
August 29
August 31
Sept. 12-14
Oct. 5
To collect spawning butterfish southeast of No Man's.
To test trawling gear on the Middle Ground.
To collect spawning butterfish in an area 10 miles south of No Man's.
1. To sample species composition of fishes on various grounds.
2. To determine diurnal periodicity of feeding habits of the commoner species of fish.
3. To determine the abundance of and the species of the
Colton
Colton
Colton
Edwards
various common bottom organisms, and
4. To tag skates and some other species of fish if they are sufficiently abundant on the grounds fished. Area - Southern New England fishing grounds.
To test underwater television equipment under tow in Falmouth Harbor.
-24-
Livingstone
Cruise No. Date Purpose Chief of Party
8 Oct. 10-12 To make a hydrographic Edwards transect of the "Deep Hole" and to conduct studies into the feeding habits of local fish.
9 Oct. 16 To test underwater TV equipment Livingstone and handling procedures off Naushon Island.
1957
10 Feb. 14 To test otter trawl gear and to Lux tag yellowtail flounders about 12 miles south of Cox Ledge in 30 fathoms.
11 Feb. 25 To tag yellowtail flounders south Lux of No Man's to south of Block Island.
12 March 12 Investigate fish stocks in Buzzards Edwards Bay for the purpose of tagging.
13 Mar. 12-14 Hydrographic transect south of Edwards Martha's Vineyard and Block Island.
14 March 22 Looking for stocks of fish in Edwards Buzzards Bay.
15 March 26 Test and use underwater camera Posgay in Buzzards Bay.
16 Sept. 16-20 To tag silver hake two miles Fritz west of Race Point, Stellwegen Bank, and Cape Cod Bay.
17 Oct. 15-17 To find concentrations of scup Edwards for tagging, to test fishing gear; to do some red hake biology in the Block Island area.
18 Oct. 30 To sample flounders and Lux industrial species off Nauset Beach in 25- 30 fathoms.
19 Nov. 14-27 To tag haddock and to collect Dietsch young-of-the-year haddock off Gloucester and Mt. Desert Island, Maine.
-25-

Cruise No. Date Purpose Chief of Party
1958
20 Jan. 21 To sample yellowtail flounder Lux 25- 30 miles southwest of No Man's Land.
21 Jan. 28-31 Calibration of multiplane kite Colton otter and high-speed plankton sampler off Provincetown and Murray Basin.
22 Aug. 11 To return vessel T-79 to Army authorities at Army Transportation Depot, Charleston, South Carolina.
In charge: Captain Samuel Vincent
-26-

Cruise Records
for
COMMERCIAL CHARTERS AND T-79
Sailing Supple- Cruise Trawl BT Vessel Order ment Report Cards Logs Cards
We Three 0 "r X 0 0 0 .L~
Michigan 1 Original Rough logs X X 0 0 Michigan 2 Original Rough logs X X 0 0 U. S. F-IJI/ Launch 0 0 X X 0 0 Caryn 0 0 X 0 0 0 Wisconsin Original Rough logs X' X 0 0 Cap'n Bill II 0 0 X 0 0 0 Priscilla V 1 Priscilla V 2 Age and Grovvth of the Redfish in the Gulf of Maine Friscilla V 3 Fishery Bulletin 156 Priscilla V 4 Priscilla V 5 Original Rough logs 0 0 0 0 Priscilla V 6 Hucldeberry Finn 0 0 X 0 0 0 vililliam Cheesebrough Harengus 0 0 X 0 0 0 Whaling City 1 0 0 X 0 0 0 VI! haling City 2 0 0 X 0 0 0 Jacquelyn 1 0 0 X X 0 X Jacquelyn 2 0 0 X "'r 0 X A
Jacquelyn 3 0 0 X X 0 X Jacquelyn 4 0 0 X X 0 X Jacquelyn 5 0 0 X ~ 0 X .L)..
Dartmouth X 0 X 0 0 0 Whaling City 3 Z X X 0 0 0 Whaling City 4 X X -.;r 0 0 X .L~
Silver Mink and Shirley and BT Roland Cruises Records
1 0 0 X X 0 X 2 0 0 X 'V" 0 X A
3 0 0 X X 0 X 4 0 0 X X 0 X 5 0 0 X X 0 X 6 0 0 X X 0 X 7 0 0 X "r 0 X .L'>.
8 0 0 X X 0 X 9 0 0 X X 0 X
10 0 0 X X 0 X 11 0 0 X X 0 X 12 0 0 X X 0 X
T-79 Cruises
1 0 0 X 0 0 X 2 X 0 X 0 0 0
-27-

Cruise Records (Continued)
for
COMMERCIAL CHARTERS AND T-79
Sailing Supple- Cruise Trawl BT Vessel Order ment Report Cards Logs Cards
T-79 Cruises
3 X 0 X 0 0 0 4 X 0 0 0 0 0 5 X 0 X 0 0 0 6 X X X 0 0 0 7 X 0 X 0 0 0 8 X "V" X X 0 X "0,,
9 X 0 X X 0 0 10 X 0 X 0 0 X 11 X 0 X 0 0 X 12 X 0 X 0 0 X 13 X 0 X 0 0 X 14 X 0 X r-. 0 0 'J
15 X 0 X 0 0 0 16 X 0 X 0 0 0 17 0 0 X X 0 X 18 X 0 X X 0 0 19 X ,7
.b. X 0 0 0 20 X 0 X 0 0 X 21 X X X 0 0 0 22 X 0 0 0 0 0
-28-

R. V. ALBATROSS IV
The R. V. Albatross IV arrived in Woods Hole November 28, 1962,
on her maiden voyage from the Southern Shipbuilding Corporation at Slidell,
Louisiana. From that time, until her first official cruise, several
training cruises were made to familiarize the officers, crew, and scientists
with the vessel. The "Kort type" nozzle was modified with the addition of
fins, and various types of gear were either added or altered to insure a
smooth working operation.
On May 9, 1963, the Albatross IV was commissioned at Woods Hole,
Massachusetts. Secretary of the Interior Stewart Udall and other distinguished
guests were present at the ceremonies.
May 13, 1963, the Albatross N sailed on her first official cruise to
collect quantitative samples of the sea scallop population on Georges Bank.
At the present time the stability, ease of handling all types of gear,
and other facilities of the Albatross N would be hard to exceed by any vessel
of similar size.
-29-

FURTHER CONSIDERATION OF GROUNDFISH MINIIvIDM MESH SIZE.
H. VI. Graham
Introduction.
In ICNAF there is considerable interest in extending mesh regulation where feasable to all species of groundfish in all Subareas. At the present time there are either regulations or Commission recommendations for regulation for 4-1/2 inch minimum mesh size for all species of groundfish in Subareas 1 and 2; for all species of groundfish in Subarea 3 except for redfish in divisions 3N, 30, and 3F; for cod, haddock, and flounders in Subarea 4; and for cod and haddock in Subarea 5.
The present report discusses the possible effect of extending mesh regulation to species other than cod and haddock in Subarea 5. The relative importance, in terms of pounds landed, of the various species taken in the Subarea is presented in Table 1. It will be noted that industrial species rank high in this list even though the industrial plants were running at a much lower level in 1960 than in previous years. We have no analysis of the species composition of the industrial landings for that year, but the data for 1958, when the plants were running at greater capacity, will serve to indicate the relative importance of the different species in the New England industrial trawl fishery. 'rhese are presented in Table 2.
Sizes of mesh now in use.
The Boston haddock fleet composed of large trawlers regularly uses 4-1/2 inch mesh under the international mesh regUlation. Smaller vessels out of Boston and other ports may engage primarily in haddock fishing on some trips and for redfish or whiting or industrial species on other trips. In this case they may register as haddock boats and use 4-1/2 inch mesh for the haddock trips; then cancel their certificates and use smaller mesh nets to engage in other fisheries. In the case of whiting fishing they are likely to catch haddock and cod as well as whiting as these species are frequently found together. Under present regulations a vessel fishing with small mesh may land 5,000 pounds or 10 percent of its trip in cod or haddock or, if it is appropriately registered, land any amount of haddock per trip provided its total landings for the year do not exceed 10 percent haddock and 10 percent cod.
Large mesh is also used on vessels directing their fishing for yellowtaU and other flounders, in this case voluntarily. However, here too we have a mixed fish problem. Some vessels engage variously in fishing for yellowtail and for smaller species such as scup, butterfish, and whiting which are used for human food, and for whiting and other smaller species such as red hake which are used for industrial purposes. These vessels usually carry small mesh nets in order to retain these smaller species.

Table 1. --Landings of the more important species of groundfish in United States from Subarea 5 in a typical year (1962).
OOO's of pounds (Round, fresh)
Haddock 119,957
Silver Hake 97,448
Yellowtail 56, 301
Industrial 53,702
Cod 41,063
Redffsh 27,648
Winter Flounder 15,536
Pollock 12,236
Scup 8,659
Red Hake 5,448
YJhite Hake 5,179
American Plaice 4,248
Fluke 3,339
~v7itch 2,152
2
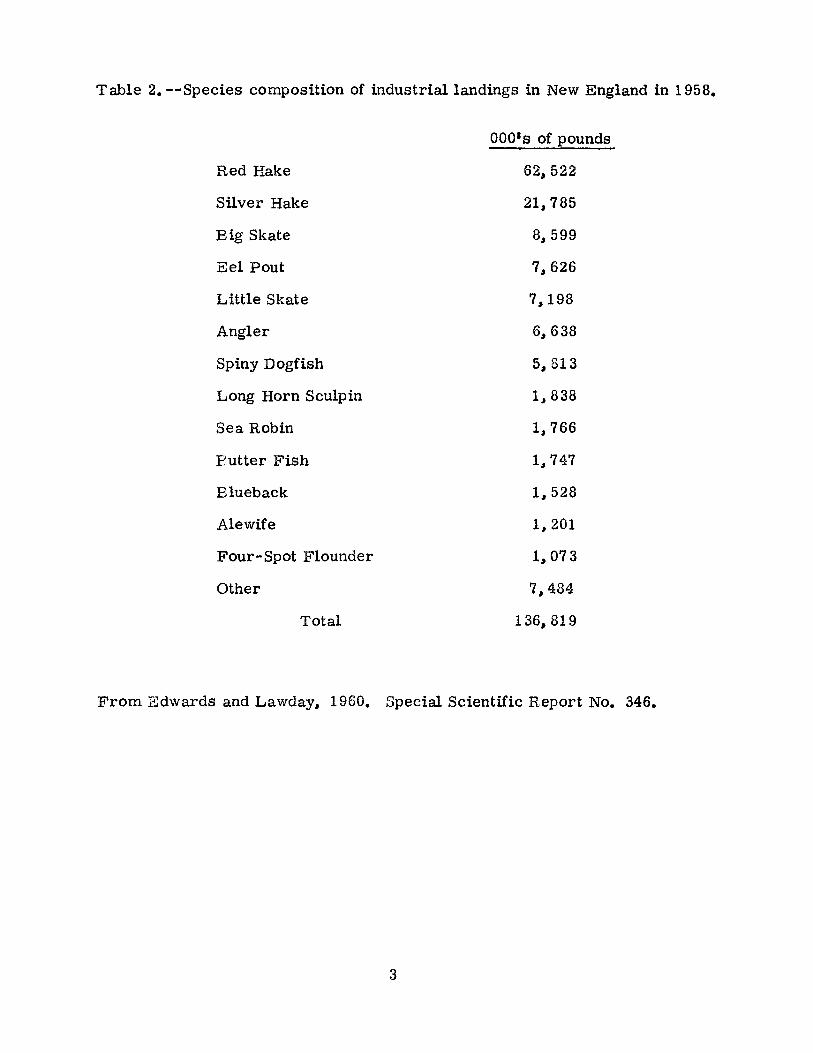
Table 2. --Species composition of industrial landings in New England in 1958.
Red Hake
Stiver Hake
Big Skate
Eel Pout
Little Skate
Angler
Spiny Dogfish
Long Horn Sculpin
Sea Robin
Eutter Fish
Blueback
Alewife
Four-Spot Flounder
Other
Total
OOO's of pounds
62,522
21,785
8,599
7,626
7,198
6,638
5,813
1" 838
1,766
1,747
1,528
1,201
1,073
7,484
136,819
From Edwards and Lawday, 1960. Special Scientific Report No. 346.
3

Extend the 4-1/2 inch mesh regulation?
One may say at the start that extending the 4-1/2 inch mesh regulation to all species of groundfish in Subarea 5 cannot be seriously considered. This size is too large to provide ma..··dmum sustained yield for such important species as redfish and whiting, and would seriously reduce the catch. Although it would have little effect on vessels fishing specifically for yellowtail flounder, it could not be applied to the yellowtail flounder fishery without causing serious complications with vessels that fish variously for yellowtail and other species, a problem already encountered in the haddock regulation.
Apply a smaller minimum mesh size?
Although extension of the 4-1/2 inch minimum mesh regulation to other species cannot be considered for Subarea 5, it is worthwhile looking into the possible effects of applying some smaller minimum mesh size for the Subarea for species other than cod and haddock. In studying this problem it was found that aminimum mesh size of 3-1/2 inches (double manila) for species other than cod and haddock has considerable merit. It would provide a cleaner catch of all species now taken with smaller meshes, reduce the quantity of undesirably small fish caught but not now landed for the food market, reduce the discard of haddock by the mixed groundfish fishery, and would probably increase the long term yield of whiting.
Silver Hake
This species is marketed for human food, animal food, and for industrial purposes. It is fished with small mesh of different sizes, but mostly below three inches. If we assume present average mesh size to be 2-1/2 inches (double manila); increases to 3" 3-1/2" or 4 inches would have long term benefits after some initial loss. In Table 3 these benefits and losses are tabulated for the total catch of whiting. Since the food fishery is not interested in the smaller sizes of whiting these estimates of initial losses would not apply. They would apply, however, to the industrial fishery. The immediate loss to the landings of silver hake for food would be 8 percent for a 3-1/2 inch (double manila). The long term gains would not be achieved for several years. It would take 8 to 10 years to compensate for the immediate losses.
Figures 1b, 3a, and 3b compare the size compositions of present landings of silver hake with size composition to be expected if a 3-1/2 inch (double manila) net were used.
Table 3. --Effect of increasing mesh size in silver hake nets.
Change in mesh size inches fTom 2-1/2 to
3 inches 3-1/2 inches 4 inches
4
Percent change in catch Immediate Long term
- 4 -22 -47
+ 4 +13 +17

Red Hake.
This species is taken almost entirely for industrial purposes and comprises some 45 percent of the trawl fish industrial catch in New England when this industry is active (Table 2).
Figure 2a. shows the average size frequency of the catch compared with the expected frequency with a 3-1/2 inch mesh. The initial loss would be about 13 percent by weight. Long term benefits are not known.
Redfish.
This fishery currently uses nets with mesh size of about 2-3/4 inches (double manila). Our own studies, and that of ICNAF's Assessment Group have not furnished useable estimates of the effects of increasing mesh size on yields of this species. Figure 1a. presents the length-frequency curve of landings for the present fleet compared with length frequency to be expected under 3-1/2 inch regulation. There is very little discarding and the 3-1/2 inch double manila would apparently decrease the immediate landings by about 7 percent by weight. Note that the losses would be in the sizes considered undesirable by the food market. There is some evidence that the large commercial sized catches would reduce considerably the calculated escape rate in which case the initial losses would be less than 7 percent. Long term benefits cannot be estimated at the present time.
Flounders.
Figure 4 presents length frequencies of the landings for the four l$1'ger species of flounder taken in Subarea 5. The 50% selection point of the 3-1/2 inch mesh for these species is considerably below the smallest sizes landed in 1957-59. The inclusion of these species under a 3-1/2 minimum mesh regulation would have little immediate effect on landings. In some years when flounders are unusually abundant and there is a glut on the market, large quantities of small fish are said to be caught and discarded at sea even by vessels using large mesh nets (4-1/2 to 5 inches). The extent of this discard and the viability of flounder under these conditions are unknown. In any case the institution of a 3-1/2 inch mesh regulation is not likely to change either the immediate or long term yield for these four species.
The situation is different as regards one of the smaller species of flounder, the dab. Figure 2b. compares the size distribution of dab caught in 1956-59 with that to be expected if 3-1/2 inch (double manila) mesh were sued. In the case of this species the catch would suffer a 21 percent immediate loss. The 3-1/2 inch mesh WOuld, however, retain all fish of a size desirable for food. Whether any long term benefits would accrue is not known. Dab is, of course, one of the minor species in the total New England landings. About 1. 8 million pounds were landed in 1960.
5

Haddock.
As mentioned above there is some quantity of haddock taken by vessels using small mesh nets. Some of these vessels are seeking haddock while others are catching them incidentally to the catch of other species such as whiting. In any case, they land under some exemption to the haddock regulation. The disposition of these haddock catches depends upon whether or not the industrial plants are operating and accepting trawl fish. The haddock catch is culled on board. The larger sizes are sold to the food market and the smaller ones are either sold as trash or, if the trash plants are not operating. discarded at sea. Discarded haddock are not viable and are lost to the fishery.
The magnitude of the catch of under sized haddock (i. e., haddock below the sizes taken by the regulation 4-1/2 inch me sh) is difficult to determine as obtaining data on this involves sampling the discard of the small mesh fleet which is composed of smaller vessels and sampling the industrial landings. During the period 1957-59 when the industrial fishery was operating actively in New England, the average landings of haddock for industrial purpose was 3 million pounds per year. These were all undersized fish as defined above, the food market size having been culled out.
Although the industrial fishery is not now operating fully. there is heavy fishing in areas where small haddock abound. In 1962 about 25 percent of the haddock landed in the U. S. (representing about 26 million pounds) was landed under some exemption and, therefore, was presumably caught with small mesh (Table 3). The vessels concerned were in general the same fleets that participated in the industrial fisheries in 1957 -59, and generally fish the same grounds. Thus, it is only reasonable to suppose that they are taking undersized haddock as well as larger sizes. Since the food market does not normally accept haddock under 38 cm., the 50 percent selection size of the 4-1/2 inch mesh, the undersized haddock apparently are now being discarded at sea.
No mesh size under 4-1/2 inches will completely eliminate this discard, but a 3-1/2 inch mesh would materially reduce it (Table 4). General use of a 3-1/2 inch mesh by these vessels would reduce the catch of undersized haddock by 80 percent. This would serve to increase the sustained yield of haddock from Subarea 5.
6

Table 4. --Analysis of haddock landings by type of certificate for Subarea 5
and for all Subareas, 1962. !I
Subarea 5 All Subareas
Haddock Landed 0/0 Haddock Haddock Landed % Haddock 0001 s pounds 000' s pounds
(gutted weight) (gutted weight)
Registered 78,740 75.0 88,019 74.9 Cod and Haddock Vessels
Non-Registered 26,261 25.0 29,440 25.1 Vessels
Totals 105,001 100 117,459 100
Non-Registered Vessels Breakdown
10% Annual 3,834 3.7 4,088 3.5 Exempted
Trip 19,724 18.7 22,649 19.3 Exempted
Other gear 2,703 2.6 2,703 2.3
Totals 26,261 25.0 29,440 25.1
];./--On a trip basis.
7

Table 5. Sizes of haddock landed by Gloucester industrial fiSbery.1957-5g!/
Length Ipswich Bay Stellwagen Bay Nausets Total (cm. ) number number number Number Percent
>9 4 4
9 9 9 1
12 1 5 9 15 1
15 4 30 5 39 3
18 16 29 23 68 5
21 35 28 85 148 12
24 33 41 117 191 15
27 35 84 141 260 21
30 19 142 103 264 21
B B ----------------------------------33 27 78 65 170 14
36 17 12 27 56 4
A A ----------------------------------39 10 3 7 20 2
42 3 1 4
45 1 -- 1
48 1 1
51 1 1
Total 1.251 100
1/ From Edwards and Skerry, 1961.
A-A = 500/0 selection point of 4-1/2 inch mesh.
B-B = 50% selection point of 3-1/2 inch mesh.
8

Conclusions.
1. Extension of the 4-1/2 inch minimum mesh size regulation in Subarea 5 to all species other than cod and haddock is not desirable as it cannot be shown to be beneficial from a conservation standpoint and would be injurious to a number of fisheries.
2. Adoption of a minimum mesh size of 3-1/2 inches (double manila) for species other than cod and haddock is of some merit and is worth considering. It would materially reduce the destruction of undersized haddock; produce cleaner catches of all species by reducing the debris in the net; reduce the quantity of undesirable sizes of many species; and increase the long term yield of whiting. On the negative side it would immediately reduce the amounts landed of red hake (8 percent)and silver hake (21 percent) and possibly some other industrial species unless some exemptions were worked out for these.
9

IMMEDIATE LOSS=7%
REDFISH
1957-59 SA5
-CATCH,PRESENT MESH 2-112"
S. HAKE
1957-59 GLOUCESTER FOOD FISH
IMMEDIATE LOSS = 8%

3
2
R. HAKE 1955-57
p~ JUDITH-NEW BEDFORD INDUSTRIAL
-CATCH,PRESENT MESH 2·1/2"
IMMEDIATE LOSS=13%
DAB 1956-59
GLOUCESTER TOTAL CATCH
IMMEDIATE LOSS =21%
CATCH,PRESENT MESH
I I I ,
I I ,
I
r ../"'J-CATCH, 3-1/2" MESH
/ /~.../
-"-./ r--"
Flg.2b.
55
40

h.. :t (!) .......
6
4
2
~ 0
~ :::::.. ...... h.. "'{ 8 ....J ~ Q:
6
4
2
S. HAKE 1956-59
PT. JUDITH TOTAL CATCH
IMMEDIATE LOSS:: 24°10
II r .......... CATCH,PRESENT MESH 2-1/2 - I -,
,./
;-
/ ;-_-1
/./ /'
/ /-CATCH, 3-112
11
MESH /'
I ~ I ~
J \';:
Fig.30.
~-J~_L_ -.-l.. ___ L _ -L __ L_ GLOUCESTER TOTAL CATCH Fig. 3b.
IMMEDIATE LOSS:: 2.4%
/ /
/
/ /
/ /
/
-CATCH, PRESENT MESH 2-11211
/--~
I' \ I
/ /
/ /-CATCH, 3-1/2" MESH
o1'=-o-=:===?:15:---"'::::::::::::..----=2l::o---~25=----:3:-'::O:------=3~5----4-:l0~----J45 LENGTH (CENTIMETERS)

(f)
0:: w CD ~ :J z z
w ~ <l ~ z w u 0:: w a..
256
24
224
208
192
176
16
144
128
112
96
80 -
64
48
32
16
, I , I f I I I f f I I I f f I
A , \ I '
I \
I ' \ , \
\ , \ \ \ \
r-\\ / \,\
\
: I \, \ ! / \\ 1/ ~ • I ~ .
I',! \--.
. \\ ~
FLOUNDERS 1957-1959
\" ~ " "
Fig.4.
SUMMER FLOUNDER
------ WINTER FLOUNDER
YELLOWTAIL GRAYSOLE
0 L-...L-L---'----"--L-l--L--L.-L-.L-l I ! ! I I I ...... -.-.--~---
I I I ! _1 I I I I! .. , .... ; Li~i~l--±=t==r:=r 25 30 35 40 45 50 55 60 65 70 75
LENGTH (CENTIMETERS)