Embed Size (px)
Citation preview

David C. RadleyJesse C. BaumgartnerSara R. CollinsLaurie ZephyrinEric C. Schneider
Achieving Racial and Ethnic Equity in U.S. Health CareA Scorecard of State Performance
NOVEMBER 2021
E M B A R G O E DNot for release before 12:01 a.m. ET
Thursday, November 18, 2021
NOVEMBER 2021
Achieving Racial and Ethnic Equity in U.S. Health CareA Scorecard of State Performance
INTRODUCTION
Profound racial and ethnic disparities in health and well-being have long been the norm in the United States.
Black and American Indian/Alaska Native (AIAN) people live fewer years, on average, than white people.1 They are also more likely to die from treatable conditions; more likely to die during or after pregnancy and to suffer serious pregnancy-related complications; and more likely to lose children in infancy.2 Black and AIAN people are also at higher risk for many chronic health conditions, from diabetes to hypertension.3 The COVID-19 pandemic has only made things worse, with average life expectancies for Black, Latinx/Hispanic, and, in all likelihood, AIAN people falling more sharply compared to white people.4
People’s health also varies markedly across and within states, as does access to health services and overall quality of care.5 Large racial and ethnic health inequities, driven by factors both inside and outside the health care delivery system, are common. In many communities of color, poverty rates are higher than average, residents tend to work in lower-paying industries, and residents are more likely to live in higher-risk environments — all contributors to COVID-19’s disproportionate impact.6
Issues around cost, affordability, and access to care also contribute to inequities. Black, Latinx/Hispanic, and AIAN populations are less likely to have health insurance, more likely to face cost-related barriers to getting care, and more likely to incur medical debt.7 It is also less common for individuals from these groups to have a usual source of care or to regularly receive preventive services like vaccinations.8 In addition, many people of color contend with interpersonal racism and discrimination when dealing with clinicians and more often receive lower-value or suboptimal care.9
E M B A R G O E DNot for release before 12:01 a.m. ET
Thursday, November 18, 2021

commonwealthfund.org Report November 2021
Achieving Racial and Ethnic Equity in U.S. Health Care: A Scorecard of State Performance 3
Decades of policy choices made by federal, state, and local leaders have led to structural economic suppression, unequal educational access, and residential segregation, all of which have contributed in their own ways to worse health outcomes for many people of color.10 The failure to ensure all Americans have reliable health coverage has paved the way to inequitable access to health care. Dramatic disparities in the quality of health care, meanwhile, are tolerated. And while the effects of structural racism persist in all states,11 policy leaders in some states are reluctant to take actions that could mitigate health inequities, like expanding eligibility for Medicaid as provided for under federal law.12
The Commonwealth Fund’s State Scorecard on Health System Performance has long tracked the functioning of each state’s health care system, with the goal of motivating actions to improve their residents’ health and health care. But assessing how well a state’s health system performs on average can mask profound underlying inequities.
In this report, we evaluate health equity across race and ethnicity, both within and between states, to illuminate how state health systems perform for Black, white, Latinx/Hispanic, AIAN, and Asian American, Native Hawaiian, and Pacific Islander (AANHPI) populations. Our hope is that policymakers and health system leaders will use this tool to investigate the impact of past policies on health across racial and ethnic groups, and that they will begin to take steps to ensure an equitable, antiracist health care system for the future.
How We Measure Performance of States’ Health Care Systems for Racial and Ethnic GroupsOur measurement strategy was designed to produce a state health system performance score for each of five racial and ethnic groups in every state where direct comparisons are possible among those groups as well as among groups in other states.
We started by collecting data for 24 indicators of health system performance, stratified by state and by race and ethnicity. Indicators were grouped into three performance domains: 1) health outcomes, 2) health care access, and 3) quality and use of health care services.
Scoring method. For each of the 24 indicators, we calculate a standardized z-score for each state/population group with sufficient data. As an example, for adult uninsured rates, we calculate standardized scores using point estimates for 191 pairs of state racial and ethnic groups (51 white, 48 Latinx/Hispanic, 39 Black, 37 AANHPI, 16 AIAN) with sufficient data.
Within each performance domain, we combined indicator values to create a summary score. We then combined the domain summary scores to create a composite state health system performance score for each racial and ethnic group within a state — Black (non-Latinx/Hispanic), white (non-Latinx/Hispanic), AIAN (non-Latinx/Hispanic), AANHPI (non-Latinx/Hispanic), and Latinx/Hispanic (any race). The ability to generate these scores is dependent on having a sufficient population sample size for analysis.
Based on the overall composite scores, each racial/ethnic group within each state received a percentile score providing both national and state-level context on the performance of a state health system for that population. The percentile scoring, from 1 (worst) to 100 (best), reflects the observed distribution of health system performance for all groups measured in this report and enables comparisons within and across states. For example, a state health system score of 50 for Latinx individuals in California indicates that the health system is performing better for those residents than Latinx/Hispanic people in Florida, who have a score of 38, but worse than white residents in California, who have a score of 89. It is important to note that because scores are set relative to one another rather than to a predefined benchmark, there is still room for improvement in health system performance at or near the 100th percentile.
Use of racial/ethnic data categories. The five racial and ethnic data categories we include in this report often group together populations with different experiences, cultures, immigration barriers, and other socioeconomic factors. This includes a wide range of culturally distinct Latinx/Hispanic communities and Asian American communities. Such groupings are imperfect, as they mask significant and important differences. For example, past research has shown variability in health insurance coverage rates among Asian American subpopulations and between Asian Americans and Native Hawaiians or Pacific Islanders.13
Use of these categories is necessary to obtain sufficient sample sizes for analysis. But states and localities should interpret the findings within the context of their own communities, using them as a starting point to help guide more targeted research and policy solutions.
Refer to the appendix for complete study methods, list of indicators, and health system performance scores for each state’s and racial and ethnic populations.

commonwealthfund.org Report November 2021
Achieving Racial and Ethnic Equity in U.S. Health Care: A Scorecard of State Performance 4
FINDINGS
Racial and ethnic inequities are pervasive across all state health systems.Both across states and within states, health care system performance varies widely by race and ethnicity, as shown in Exhibit 1. Mirroring the nation as a whole, substantial health and health care disparities exist between white and Black, Latinx/Hispanic, and AIAN communities in nearly all states.
Even in states that achieve high performance overall, racial and ethnic disparities can be dramatic. For example, Minnesota, which ranked third in the Commonwealth Fund’s most recent State Scorecard on Health System Performance, has some of the largest disparities between white and Black, Latinx/Hispanic, AANHPI, and AIAN communities.14 Some states, like Mississippi, demonstrate relatively poor performance for all groups.
In the small number of U.S. states where AIAN communities represent a sizeable portion of the nonwhite population — such as South Dakota and Alaska — wide performance gaps are also apparent. While the health system in many states tends to perform better for AANHPI populations, performance is lower in New York and Texas, home to two of the country’s largest AANHPI populations.
The overall health system score for each group within a state represents the aggregate performance across three dimensions: Health Outcomes, Health Care Access, and Quality and Use of Health Care Services. Below we describe findings for each of these domains.
Health OutcomesHealth outcomes, as measured primarily by mortality rates and the prevalence of health-related problems, differ significantly by race and ethnicity. In most states, Black and AIAN populations tend to fare worse than white, Latinx/Hispanic, and AANHPI populations. While enduring lower life expectancies for Black and AIAN individuals in the U.S. can be attributed in large part to generations of structural racism, oppression, and other factors beyond health care delivery, the health care system nevertheless has a crucial and often unfulfilled role in mitigating disparities.15
We can get a glimpse of the care delivery system’s role in these unequal outcomes by looking at the frequency of deaths before age 75 from preventable and treatable conditions — a measure known as mortality amenable to health care that is highly correlated with life expectancy.16 In nearly every state, Black people are more likely than white people to die early from preventable causes (Exhibit 2). Latinx/Hispanic individuals, however, generally have lower preventable mortality rates, despite their comparatively poor access to health care. These lower rates could be related to immigration factors, to a younger average age, or to lower rates of risky health behaviors like smoking.17 Still, recent research shows increasing mortality and prevalence of chronic conditions for Latinx/Hispanic populations.18 There are also differences in outcomes between different Latinx communities.19
We also see distinct regional patterns. For example, preventable mortality rates are higher for both Black and white residents of many southeastern states compared to other parts of the country, while rates among AIAN people tend to be higher in the upper Midwest and northern Plains states. Among Latinx/Hispanic people, premature mortality rates are higher — and align more closely with rates among white people — in several southwestern and mountain states, including Arizona, Colorado, New Mexico, Oklahoma, Texas, and Wyoming.
Diabetes is an example of a disease that can often be effectively managed — for example, with consistent blood glucose monitoring and proven medications — but is nonetheless associated with profound racial and ethnic disparities in outcomes. Black and AIAN individuals are much more likely to die from diabetes-related complications (Exhibit 3) than people of other races and ethnicities. Health systems striving for equity should bolster disease management resources among these communities to achieve better outcomes.
Online viewers can use the interactive exhibits to see which states perform best and worst and to focus on specific racial and ethnic groups. State and group-specific profiles are available for download.

commonwealthfund.org Report November 2021
Achieving Racial and Ethnic Equity in U.S. Health Care: A Scorecard of State Performance 5
Notes: Scores are based on the percentile distribution of each group’s final composite z-score across all indicators/dimensions; rank-ordered for each individual group. Grey dots represent the highest score achieved in each state by any of the five groups (if no grey dot is visible, the highlighted group has the top score). The 50th percentile represents the median health performance score among all the groups measured. Summary performance scores not available for all racial and ethnic groups in all states; states without group-specific scores not shown. AANHPI = Asian American, Native Hawaiian, and Pacific Islander; AIAN = American Indian/Alaska Native.Data: Commonwealth Fund 2021 Health System Performance Scores.
Exhibit 1. Profound racial and ethnic inequities in health and health care exist across and within states.
Asian American, Native Hawaiian, and Pacific Islander
Black
Latinx/Hispanic
White
American Indian/Alaska Native
Health system performance scores, by state and race/ethnicity
0102030405060708090
100
MA
MD PA MI
CA HI
NJ
CT
WA VA CO NY FL IL OR AZ NV
GA
NC
OH
MN TX
UT
Lowe
r pe
rform
ance
Hig
her
perfo
rman
ce
ALL GROUP MEDIAN
Best score achieved in stateAANHPI
0102030405060708090
100
CA
NM
WA
NC
OK
MI
AK MN
AZ FL SD ND
MT
WY
Lowe
r pe
rform
ance
Hig
her
perfo
rman
ce
ALL GROUP MEDIAN
Best score achieved in stateAIAN
0102030405060708090
100
RI MA
MD CT
NY
WA
VA PA DC
NJ
CA
CO
MN
DE
KY NC
IA AR AZ GA
SC OH
TN FL NE
TX AL IL LA NV
IN WI
WV
MI
KS MO
MS
OK
Lowe
r pe
rform
ance
Hig
her
perfo
rman
ce
ALL GROUP MEDIAN
Best score achieved in stateBlack
0102030405060708090
100
MA HI
MI
CT
PA NY RI WA
OR CA
NM
NJ
CO
IL MT
OH
MD
IA FL VA UT
LA AZ MO
DE
AL ID NV
WI
MN
KS KY IN SC GA
NC
AR NE
OK
TX WY
TN
Lowe
r pe
rform
ance
Hig
her
perfo
rman
ce
ALL GROUP MEDIAN
Best score achieved in stateLatinx/Hispanic
0102030405060708090
100
DC
MA CT RI HI
MD
MN NY NJ
CA
NH
CO DE
WA IA VT PA VA WI
MI
NE IL NC UT
OR
ME AZ ND SD KS NM SC MT
OH FL GA AK TX NV TN AL IN LA MO ID KY AR WY
WV
OK
MS
Lowe
r pe
rform
ance
Hig
her
perfo
rman
ce
ALL GROUP MEDIAN
Best score achieved in stateWhite

commonwealthfund.org Report November 2021
Achieving Racial and Ethnic Equity in U.S. Health Care: A Scorecard of State Performance 6
Source: David C. Radley et al., Achieving Racial and Ethnic Equity in U.S. Health Care: A Scorecard of State Performance (Commonwealth Fund, Nov. 2021).
0
50
100
150
200
Verm
ont
Mai
neId
aho
Haw
aii
New
Ham
pshi
reM
assa
chus
etts
Rho
de Is
land
Con
nect
icut
Ore
gon
Col
orad
oN
ew M
exic
oW
ashi
ngto
nAl
aska
Wyo
min
gAr
izon
aM
aryl
and
Virg
inia
Del
awar
eFl
orid
aN
ew Y
ork
Uta
hN
ew J
erse
yN
orth
Car
olin
aM
inne
sota
Cal
iforn
iaG
eorg
iaIn
dian
aKa
nsas
Iow
aPe
nnsy
lvan
iaKe
ntuc
kySo
uth
Car
olin
aW
est V
irgin
iaTe
xas
Ohi
oAl
abam
aN
evad
aIll
inoi
sW
isco
nsin
Mis
sour
iLo
uisi
ana
Dis
trict
of C
olum
bia
Mic
higa
nTe
nnes
see
Neb
rask
aAr
kans
asM
onta
naO
klah
oma
Nor
th D
akot
aSo
uth
Dak
ota
Mis
siss
ippi
Black White AIAN
Notes: States arranged in rank order based on highest rate in each state. Missing dots for a particular group indicate that there are insufficient data for that state. Data for AANHPI and Latinx/Hispanic populations available in online exhibit and state profile documents. AIAN = American Indian/Alaska Native.
Data: CDC, 2018 and 2019 National Vital Statistics System (NVSS), All-County Micro Data, Restricted Use Files.
2: In most states where data are available, Black people and AIAN people are more likely than white people to die early in life from conditions that are treatable with timely access to high-quality health care.
Mortality amenable to health care, deaths per 100,000 population, by state and race/ethnicity
Notes: States arranged in rank order based on highest rate in each state. Missing dots for a particular group indicate that there are insufficient data for that state. Data for AANHPI and Latinx/Hispanic populations available in online exhibit and state profile documents. AIAN = American Indian/Alaska Native.Data: CDC, 2018 and 2019 National Vital Statistics System (NVSS), All-County Micro Data, Restricted Use Files.
Exhibit 2. In most states where data are available, Black people and AIAN people are more likely than white people to die early in life from conditions that are treatable with timely access to high-quality health care.
Source: David C. Radley et al., Achieving Racial and Ethnic Equity in U.S. Health Care: A Scorecard of State Performance (Commonwealth Fund, Nov. 2021).
0
100
50
150
AANHPI AIAN Black Latinx White
3: In nearly all the states where data are available, Black people and AIAN people are more likely than AANHPI, Latinx/Hispanic, and white people to die from complications of diabetes.
Notes: Dots represent states. Missing dots for a particular group indicate that there are insufficient data for that state. AANHPI = Asian American, Native Hawaiian, and Pacific Islander; AIAN = American Indian/Alaska Native.
Data: CDC, 2018 and 2019 National Vital Statistics System (NVSS).
Diabetes-related age-adjusted deaths per 100,000 population, by state and race/ethnicity
Utah32.5
Michigan 10
South Dakota135.3
Texas10.2
Connecticut26.9
West Virginia64.4
Maryland10.8
Wyoming38.2
District of Columbia4.3
West Virginia35.9
Dots represent statesSee online graphic for state detail
Note: Dots represent states. Missing dots for a particular group indicate that there are insufficient data for that state. AANHPI = Asian American, Native Hawaiian, and Pacific Islander; AIAN = American Indian/Alaska Native.Data: CDC, 2018 and 2019 National Vital Statistics System (NVSS).
Exhibit 3. In nearly all the states where data are available, Black people and AIAN people are more likely than AANHPI, Latinx/Hispanic, and white people to die from complications of diabetes.

commonwealthfund.org Report November 2021
Achieving Racial and Ethnic Equity in U.S. Health Care: A Scorecard of State Performance 7
We also see sizeable disparities when looking at mortality rates for other treatable conditions. Breast cancer, for example, is often considered treatable when detected early but is more likely to be diagnosed at later stages in Black women, who have much higher age-adjusted death rates for the disease across most states compared to other women (Exhibit 4).20 Across all education levels, infant and maternal mortality rates are higher for Black and AIAN residents than for others.21
States can perpetuate disparities by not removing barriers to people receiving preventive services, getting effective treatment for chronic conditions like diabetes and high blood pressure, and receiving coordinated care. These barriers range from poor insurance coverage, lack of a usual source of care, and unaffordable medications, to clinicians who prescribe less-effective services or fail to provide timely care for a chronic disease.22 Sometimes differential outcomes also can reflect unequal access to higher-performing providers, but disparities in care occur even within the same provider facilities.23
Health Care AccessLarge disparities in access to care between white and most nonwhite populations are apparent across states. Latinx/Hispanic people typically face the highest barriers to care, although, as noted above, they also tend to have better health outcomes than many other groups (despite variations by geographic region).
A key contributor to these access inequities is lack of comprehensive insurance coverage, or any coverage at all. Insurance alone cannot guarantee access, but it is necessary for getting needed health care without incurring substantial or even catastrophic financial risk.
Americans get their health coverage either from commercial insurance plans offered by employers or sold in the individual market, or from public insurance programs like Medicaid, Medicare, and the Children’s Health Insurance Program. Prior to the Affordable Care Act (ACA)’s major coverage expansions in 2014, limited access to employer health benefits, more restricted eligibility for Medicaid, and often unaffordable individual market plans created significant inequities in coverage among adults.
Source: David C. Radley et al., Achieving Racial and Ethnic Equity in U.S. Health Care: A Scorecard of State Performance (Commonwealth Fund, Nov. 2021).
0
5
10
15
20
25
30
35
40
Nor
th D
akot
aM
aine
Mas
sach
uset
tsM
onta
naIo
wa
Verm
ont
Rho
de Is
land
Alas
kaN
ew H
amps
hire
Sout
h D
akot
aW
yom
ing
Ore
gon
Uta
hC
olor
ado
Was
hing
ton
Idah
oN
ew M
exic
oH
awai
iKa
nsas
Flor
ida
Con
nect
icut
New
Yor
kN
orth
Car
olin
aG
eorg
iaM
inne
sota
Arka
nsas
Indi
ana
Mar
ylan
dO
hio
Mis
sour
iKe
ntuc
kyM
issi
ssip
piSo
uth
Car
olin
aN
ew J
erse
yVi
rgin
iaAl
abam
aPe
nnsy
lvan
iaM
ichi
gan
Loui
sian
aC
alifo
rnia
Wis
cons
inTe
xas
Del
awar
eO
klah
oma
Tenn
esse
eAr
izon
aIll
inoi
sN
evad
aD
istri
ct o
f Col
umbi
aN
ebra
ska
Wes
t Virg
inia
Black White
Notes: States arranged in rank order based on highest rate in each state. Missing dots for a particular group indicates that there are insufficient data for that state. Data for AIAN, AANHPI and Latinx/Hispanic populations available in online exhibit and state profile documents.
Data: CDC, 2018 and 2019 National Vital Statistics System (NVSS).
4: Black women are more likely than white women to be diagnosed with breast cancer at later stages and to die, even though the disease is often considered treatable when detected early.
Breast cancer age-adjusted deaths per 100,000 female population, by state and race/ethnicity
Notes: States arranged in rank order based on highest rate in each state. Missing dots for a particular group indicates that there are insufficient data for that state. Data for AIAN, AANHPI and Latinx/Hispanic populations available in online exhibit and state profile documents.Data: CDC, 2018 and 2019 National Vital Statistics System (NVSS).
Exhibit 4. Black women are more likely than white women to be diagnosed with breast cancer at later stages and to die, even though the disease is often considered treatable when detected early.

commonwealthfund.org Report November 2021
Achieving Racial and Ethnic Equity in U.S. Health Care: A Scorecard of State Performance 8
After the health law’s coverage expansions, adult uninsured rates fell across all racial and ethnic groups. Still, in nearly all states, uninsured rates continue to be higher for Black, Latinx/Hispanic, and AIAN people than they are for whites (Exhibit 5).
Some Latinx/Hispanic and AANHPI populations continue to face immigration-related barriers to getting enrolled in coverage through Medicaid or the ACA marketplaces. While American Indians and Alaska Natives can obtain certain health care services through the Indian Health Service (IHS), lack of insurance coverage can hinder access to needed care outside of persistently underfunded IHS facilities.24
The ACA created a federal standard for comprehensive insurance and provides for subsidized coverage through marketplace plans and Medicaid. But 12 states have yet to take advantage of the law’s expansion of Medicaid eligibility,
which has significantly improved equity in coverage and access and has helped health care facilities in underserved communities (including IHS providers) become more financially stable.25 Further, Black and Latinx/Hispanic communities are disproportionally represented in states that have not expanded Medicaid: 43 percent of Black and 36 percent of Latinx people live in the 12 nonexpansion states.
When people are uninsured, experience gaps in coverage, or are in private plans that do not provide comprehensive coverage, they often avoid getting care when they need it or pay high out-of-pocket costs when they do seek care.26 This is particularly burdensome for individuals with lower income and little wealth — disproportionately people of color.27 Because of these costs, Black, Latinx/Hispanic, and AIAN people are more likely to avoid getting care when they need it, more often have higher out-of-pocket costs, and are more prone to incur medical debt at all income levels.28
Source: David C. Radley et al., Achieving Racial and Ethnic Equity in U.S. Health Care: A Scorecard of State Performance (Commonwealth Fund, Nov. 2021).
0
20
10
40
50
30
AANHPI AIAN Black Latinx White
5: Although the ACA’s coverage expansion improved inequities, state uninsured rates are generally higher and more variable for Black, Latinx/Hispanic, and AIAN adults compared to AANHPI and white adults.
Notes: Dots represent states. Missing dots for a particular group indicate that there are insufficient data for that state. AANHPI = Asian American, Native Hawaiian, and Pacific Islander; AIAN = American Indian/Alaska Native. ACA = Affordable Care Act.
Data: American Community Survey Public Use Micro Sample (ACS-PUMS) 2019 1-year file.
Percent of adults ages 19–64 who are uninsured, by state and race/ethnicity Dots represent statesSee online graphic for state detail
Mississippi22.8
Massachusetts 3.5
Wyoming51.3
South Carolina11.7
Utah26.8
District of Columbia6.7
Tennessee50.7
District of Columbia6.7
Oklahoma16.9
District of Columbia1.7
Note: Dots represent states. Missing dots for a particular group indicate there are insufficient data for that state. AANHPI = Asian American, Native Hawaiian, and Pacific Islander; AIAN = American Indian/Alaska Native. ACA = Affordable Care Act.Data: American Community Survey Public Use Micro Sample (ACS-PUMS) 2019 1-year file.
Exhibit 5. Although the ACA’s coverage expansion improved inequities, state uninsured rates are generally higher and more variable for Black, Latinx/Hispanic, and AIAN adults compared to AANHPI and white adults.

commonwealthfund.org Report November 2021
Achieving Racial and Ethnic Equity in U.S. Health Care: A Scorecard of State Performance 9
The proportion of white people reporting cost as a barrier to receiving needed care ranges from 6 percent in the District of Columbia and Hawaii to 14 percent in Georgia, Oklahoma, Alabama, and Mississippi. But among Latinx/Hispanic people, state rates vary between 10 percent in Hawaii to a high of 30 percent in Tennessee (Exhibit 6).
Many people of color in the U.S. are also less likely to have a usual source of care, an important point of contact with the health system that can help people get treatment when they need it. Lack of a regular care provider often goes hand in hand with high uninsured rates and high patient cost sharing. But it also reflects low Medicaid payment rates that limit the network of participating providers and hospitals, a lower concentration of providers and health facilities in neighborhoods where people of color reside, and
language and cultural communication barriers.29 For AIAN communities in rural areas, who are among the least likely to have a usual source care, geographic barriers can also be a key factor.30
Quality and Use of Health Care ServicesRacial and ethnic disparities in the quality of care and the use of services have also been extensively documented. Across and within most states, white populations overall receive better care than Black, Latinx/Hispanic, American Indian/Alaska Native (AIAN), and, often, Asian American, Pacific Islander, and Native Hawaiian (AANHPI) individuals.
Source: David C. Radley et al., Achieving Racial and Ethnic Equity in U.S. Health Care: A Scorecard of State Performance (Commonwealth Fund, Nov. 2021).
20
10
0
30
40
AANHPI AIAN Black Latinx White
6: White people are less likely than other population groups to face cost-related barriers in most states.
Notes: Dots represent states. Missing dots for a particular group indicate that there are insufficient data for that state. AANHPI = Asian American, Native Hawaiian, and Pacific Islander; AIAN = American Indian/Alaska Native.
Data: Behavioral Risk Factor Surveillance System (BRFSS), 2019–20.
Percent of adults age 18 and older who went without care because of cost in the past year, by state and race/ethnicity
Dots represent statesSee online graphic for state detail
South Carolina22.9
Arizona 5.2
New Hampshire37.1
Alaska 8.8
Missouri22.1
California 8.6
Tennessee30.3
Hawaii 9.8
Mississippi13.9
Hawaii 5.9
Note: Dots represent states. Missing dots for a particular group indicate there are insufficient data for that state. AANHPI = Asian American, Native Hawaiian, and Pacific Islander; AIAN = American Indian/Alaska Native.Data: Behavioral Risk Factor Surveillance System (BRFSS), 2019–20.
Exhibit 6. White people are less likely than other population groups to face cost-related barriers in most states.

commonwealthfund.org Report November 2021
Achieving Racial and Ethnic Equity in U.S. Health Care: A Scorecard of State Performance 10
Primary care clinicians play an especially critical role in providing people with high-value services, including preventive care like cancer screenings and vaccines, as well as chronic disease management. When there are barriers to obtaining primary care, people are more likely to get care in more intense and costly care settings, particularly an emergency department (ED).
On two measures of primary care effectiveness, Black Medicare beneficiaries are more likely than white beneficiaries to be hospitalized for acute exacerbations of treatable and manageable chronic illnesses and to seek and receive care in an ED for conditions that are nonurgent or treatable by a primary care provider (Exhibit 7). For both Black and white Medicare beneficiaries, more primary care spending is associated with less use of the ED for treatable conditions and fewer hospital admissions.31
Primary care settings are also where the majority of vaccinations in the U.S. have taken place, and they play an important role in COVID-19 vaccination efforts. On average,
Black and Latinx people are less likely than white people to have received recommended vaccines. In 2019, Black and Latinx children were less likely than white children to have received all of seven key vaccines by age 35 months, but differences were relatively small. Conversely, less than half of all adults received an annual flu shot in 2019–20, and racial/ethnic inequities are apparent (Exhibit 8). Strong federal policy can help close these gaps. For example, the Vaccines for Children program run by the Centers for Disease Control and Prevention (CDC) promotes early childhood vaccination and makes vaccines available at no cost to a partner network of state and local health departments. This, along with state polices regulating vaccination, have proven successful for raising vaccination levels for all children.32
Expanded access to primary care improves health outcomes. And given the relatively lower use of primary care by Black, Latinx/Hispanic, and AIAN people, these groups in particular are likely to see a greater health impact from improved access and quality.
Source: David C. Radley et al., Achieving Racial and Ethnic Equity in U.S. Health Care: A Scorecard of State Performance (Commonwealth Fund, Nov. 2021).
20
40
60
80
500
400
300
200
100
Black White Black White
7: Black Medicare beneficiaries are more likely than white beneficiaries to be admitted to a hospital or to seek care in an emergency department for conditions typically manageable through good primary care.
Notes: Dots represent states. Missing dots for a particular group indicates that there are insufficient data for that state. Race data only available for Black and white populations—ethnicity is unknown.
Data: Centers for Medicare and Medicaid Services, 2019 Limited Data Set (LDS) 5% sample. Analysis by Westat.
Admissions for ambulatory care–sensitive conditions, per 1,000 Medicare beneficiaries
Avoidable emergency department visits, per 1,000 Medicare beneficiaries
Missouri89.4
Arkansas 37.2
Kentucky51.8
Colorado 20.2
Vermont505.1
Hawaii113.9
West Virginia236.1
Nebraska142.5
Notes: Dots represent states. Missing dots for a particular group indicates that there are insufficient data for that state. Race data only available for Black and white populations—ethnicity is unknown.Data: Centers for Medicare and Medicaid Services, 2019 Limited Data Set (LDS) 5% sample. Analysis by Westat.
Exhibit 7. Black Medicare beneficiaries are more likely than white beneficiaries to be admitted to a hospital or to seek care in an emergency department for conditions typically manageable through good primary care.

commonwealthfund.org Report November 2021
Achieving Racial and Ethnic Equity in U.S. Health Care: A Scorecard of State Performance 11
Source: David C. Radley et al., Achieving Racial and Ethnic Equity in U.S. Health Care: A Scorecard of State Performance (Commonwealth Fund, Nov. 2021).
30
40
20
10
0
50
70
60
AANHPI AIAN Black Latinx White
8: Black, AIAN, and Latinx/Hispanic adults are less likely than AANHPI and white adults to receive an annual flu shot.
Notes: Dots represent states. Missing dots for a particular group indicate that there are insufficient data for that state. AANHPI = Asian American, Native Hawaiian, and Pacific Islander; AIAN = American Indian/Alaska Native.
Data: Behavioral Risk Factor Surveillance System (BRFSS), 2019–20.
Vermont 64.0
Alaska33.5
Rhode Island52.8
South Carolina14.3
Rhode Island50.6
Nevada 22.0
Mississippi53.4
Georgia 25.4
District of Columbia65.3
Wyoming 39.1
Percent of adults age 18 and older with a seasonal flu shot in the past year Dots represent statesSee online graphic for state detail
Notes: Dots represent states. Missing dots for a particular group indicate that there are insufficient data for that state. AANHPI = Asian American, Native Hawaiian, and Pacific Islander; AIAN = American Indian/Alaska Native.Data: Behavioral Risk Factor Surveillance System (BRFSS), 2019–20.
Exhibit 8. Black, AIAN, and Latinx/Hispanic adults are less likely than AANHPI and white adults to receive an annual flu shot.

commonwealthfund.org Report November 2021
Achieving Racial and Ethnic Equity in U.S. Health Care: A Scorecard of State Performance 12
DISCUSSION Racial and ethnic disparities in health outcomes and health care are pervasive both across and within states. Transformative change will depend on policy and practice changes to make access to care more equitable and to ensure equal treatment in the delivery of care.
What Policy Changes Are Needed to Bridge the Gap?While health systems alone cannot address all the structural inequities that contribute to differential health outcomes, there are a number of policy options for addressing unequal access to care and unequal treatment within health care facilities.
We group these federal and state policy priorities into four areas:
Ensuring universal, affordable, and equitable health coverage. Nearly 30 million people in the United States are still uninsured, and they are disproportionately people of color. Even those who have some coverage face rising levels of financial risk. Policy options include:
• Make the marketplace premium subsidies provided by the American Rescue Plan Act (ARPA) permanent and close the Medicaid coverage gap in the 12 states that have not expanded eligibility for the program. These two reforms, which are included in the Build Back Better bill currently before Congress, are estimated to reduce the number of uninsured people overall by 7 million,33 the number of uninsured Black Americans under age 65 by 1.2 million, and the number of uninsured Latinx/Hispanic people under age 65 by 1.7 million.
• Reduce deductibles and out-of-pocket costs for marketplace insurance plans. The pending legislation would reduce cost-sharing to almost zero for people with incomes under 138 percent of poverty in the marketplaces, lowering household spending on health care and improving access to needed care. Another bill, currently in the Senate, would increase eligibility for marketplace subsidies and eliminate or reduce deductibles for some marketplace plan enrollees by as much as $1,650.34
• Allow more workers in expensive employer health plans to become eligible for subsidized marketplace plans. Under current law, enrollees in employer coverage whose premiums exceed 9.8 percent of income are eligible for subsidized marketplace plans. The Build Back Better bill lowers that threshold to 8.5 percent of income.
• Mount aggressive, targeted outreach and enrollment efforts to reach the remaining uninsured, most of whom are eligible for Medicaid or subsidized private insurance.35 Tracking low enrollment by demographic group, like California does, could help in targeting outreach efforts more effectively.
• Lower immigration-related barriers to coverage. An estimated 3 million uninsured cannot enroll in Medicaid or subsidized marketplace plans because of their immigration status.36 The federal government could allow certain groups of undocumented, low-income immigrant adults and children to enroll in Medicaid or other affordable coverage, as several states already have done.37
• Promote more equitable treatment of enrollees in commercial insurance plans. Policymakers could require commercial insurers to: collect and report information on race and ethnicity during enrollment and make it linkable to claims data;38 meet ACA requirements for including essential community providers in their networks;39 and obtain health equity accreditation.
Strengthening primary care and improving the delivery of services. Communities that are predominantly Black and Latinx/Hispanic tend to have fewer primary care providers and lower-quality health care facilities than communities that are mostly white.40 Federal and state policymakers could start to reverse these inequities by raising payment for primary care providers and transitioning primary care reimbursement to value-based payment that enables investment in health promotion, disease prevention, and chronic disease management.41 For example, North Carolina now has a prospective Medicaid payment model that emphasizes primary care–based population health management, while Oregon and Washington are linking Medicaid payments to performance on equity measures.42

commonwealthfund.org Report November 2021
Achieving Racial and Ethnic Equity in U.S. Health Care: A Scorecard of State Performance 13
There are also opportunities to change how care is delivered and who delivers it:
• Ensure that telemedicine remains an option. The pandemic has already shown that telemedicine is an effective strategy for providing patients with convenient access to care.43
• Modernize medical licensing. Allow health care professionals to more easily practice across state lines.44
• Develop community-based health care workforces focused on team care. Offer financial assistance, such as loan repayment, to providers who serve in medically underserved communities. Expand community health worker programs to train individuals to provide basic health-related services and support within their communities.
Reducing inequitable administrative burdens affecting patients and providers. Americans seeking health care face far higher administrative hurdles than residents of other high-income nations.45 Recent research points to the negative impact these barriers have on access to care for lower-income individuals, including many people of color.46 Autoenrollment is one reform that could reduce the application burden associated with state Medicaid programs; it could help people get, and stay enrolled in, public coverage.47 If poorly designed, the quality reporting, care management, utilization review, and prior authorization programs instituted by public and private insurers can create unnecessary red tape and even financial penalties for underresourced providers. Administrators could audit oversight and accountability programs for their disproportionate impact on providers serving communities of color.
Investing in social services. The U.S. spends less on economic and social supports for children and working-age adults than most other high-income countries, and the lack of adequate investment in this area likely contributes significantly to racial and ethnic inequities in health outcomes.48 Federal and state policymakers could expand economic support for lower-income families by implementing unemployment compensation and Earned Income Tax Credit and child tax credit programs, as well as childcare, food security, and targeted wealth-building
programs.49 Additional investments in affordable housing, public transportation, early childhood development, and affordable higher education also could help reduce racial and ethnic health inequities.50
CONCLUSIONRacial and ethnic equity in health care should be a top priority of federal and state policymakers. A good start would be to identify policies and proposed legislation that impede progress toward health equity.
Given that structural racism has played a significant role in shaping those policies that have spawned widespread health inequities, leaders at the federal, state, and local levels should reexamine existing laws and regulations for their impact on people of color’s access to quality care. And new reforms to ensure good insurance coverage and timely access to primary and specialty care need to target communities across the United States that have long been ignored.
Equally important is the development and use of equity-focused measures to monitor the progress of efforts intended to advance health equity and to engender accountability for achieving desired outcomes. And systems are needed to track whether states, health systems, and health plans are reducing racial disparities in clinical outcomes, coverage, access to clinicians, and a host of other health-related gaps.
Too often in the U.S., race and ethnicity are correlated with access to health care, quality of care, health outcomes, and overall well-being. This is a legacy of structural, institutional, and individual racism that predated the country’s founding and that has persisted to the present day, in large part through federal and state policy. By pursuing new policies that center racial and ethnic equity, expand access to high-quality, affordable care, and bolster the primary care workforce, we as a nation can ensure that the health care system fulfills its mission to serve all Americans.

commonwealthfund.org Report November 2021
Achieving Racial and Ethnic Equity in U.S. Health Care: A Scorecard of State Performance 14
NOTES1. Elizabeth Arias et al., Provisional Life Expectancy
Estimates for 2020 (NCHS Vital Statistics Rapid Release, July 2021); and Elizabeth Arias et al., “Mortality Profile of the Non-Hispanic American Indian or Alaska Native Population, 2019,” National Vital Statistics Reports 70, no. 12 (Nov. 2021).
2. “Mortality amenable to health care,” Commonwealth Fund Health Systems Data Center and calculations from 2018–19 CDC National Vital Statistics System (NVSS); Eugene Declercq and Laurie Zephyrin, Maternal Mortality in the United States: A Primer (Commonwealth Fund, Dec. 2020); “Infant Mortality,” Commonwealth Fund Health Systems Data Center, n.d.; and “Infant Mortality,” CDC, 2021.
3. Jesse C. Baumgartner et al., Inequities in Health and Health Care in Black and Latinx/Hispanic Communities: 23 Charts (Commonwealth Fund, June 2021; and “Disparities Fact Sheet,” Indian Health Service, Oct. 2019.
4. Arias et al., Provisional Life Expectancy, 2021; Jessica Arrazola et al., “COVID-19 Mortality Among American Indian and Alaska Native Persons — 14 States, January–June 2020,” Morbidity and Mortality Weekly Report (MMWR) 69, no. 49 (Dec. 2020): 1853–56.
5. David C. Radley, Sara R. Collins and Jesse C. Baumgartner, 2020 Scorecard on State Health System Performance (Commonwealth Fund, Sept. 2020).
6. Gina Kolata, “Social Inequities Explain Racial Gaps in Pandemic, Studies Find,” New York Times, Dec. 9, 2020; Samrachana Adhikari et al., “Assessment of Community-Level Disparities in Coronavirus Disease 2019 (COVID-19) Infections and Deaths in Large U.S. Metropolitan Areas,” JAMA Network Open 3, no. 7 (July 2020): e2016938; and Nancy Krieger, Pamela D. Waterman, and Jarvis T. Chen, “COVID-19 and Overall Mortality Inequities in the Surge in Death Rates by Zip Code Characteristics: Massachusetts, January 1 to May 19, 2020,” American Journal of Public Health 110, no. 12 (Dec. 2020): 1850–52.
7. Shiwani Mahajan et al., “Trends in Differences in Health Status and Health Care Access and Affordability by Race and Ethnicity in the United States, 1999–2018,” JAMA 326, no. 7 (Aug. 17, 2021): 637–48; Health Insurance Coverage and Access to Care
for American Indians and Alaska Natives: Current Trends and Key Challenges (ASPE, July 2021); and Sara R. Collins, Gabriella N. Aboulafia, and Munira Z. Gunja, As the Pandemic Eases, What Is the State of Health Care Coverage and Affordability in the U.S.? Findings from the Commonwealth Fund Health Care Coverage and COVID-19 Survey, March–June 2021 (Commonwealth Fund, July 2021).
8. Mahajan et al., “Trends in Differences,” 2021; Jesse C. Baumgartner, Sara R. Collins, and David C. Radley, Racial and Ethnic Inequities in Health Care Coverage and Access, 2013–2019 (Commonwealth Fund, June 2021). See Appendix A2.
9. Brian D. Smedley, Adrienne Y. Stith, and Alan R. Nelson, Unequal Treatment: Confronting Racial and Ethnic Disparities in Health Care (Institute of Medicine, 2003); Kiran Clair et al., “Disparities by Race, Socioeconomic Status, and Insurance Type in the Receipt of NCCN Guideline-Concordant Care for Select Cancer Types in California,” Journal of Clinical Oncology 38, no. 15 suppl. (May 20, 2020): 7031; and William L. Schpero et al., “For Selected Services, Blacks and Hispanics More Likely to Receive Low-Value Care Than Whites,” Health Affairs 36, no. 6 (June 2017): 1065–69.
10. Zinzi D. Bailey, Justin M. Feldman, and Mary T. Bassett, “How Structural Racism Works — Racist Policies as a Root Cause of U.S. Racial Health Inequities,” New England Journal of Medicine 384, no. 8 (Feb. 25, 2021): 768–73; and Jamila Taylor, Racism, Inequality, and Health Care for African Americans (Century Foundation, Dec. 2019).
11. Bailey, Feldman, and Bassett, “How Structural Racism Works,” 2021.
12. Jennifer Karas Montez et al., “U.S. State Policies, Politics, and Life Expectancy,” Milbank Quarterly 98, no. 3 (Sept. 2020): 668–99; and Jamila Michener, “Race, Politics, and the Affordable Care Act,” Journal of Health Politics, Policy and Law 45, no. 4 (Aug. 2020): 547–66.
13. Munira Z. Gunja et al., Gap Closed: The Affordable Care Act’s Impact on Asian Americans’ Health Coverage (Commonwealth Fund, July 2020).
14. Radley, Collins and Baumgartner, 2020 Scorecard, 2020.

commonwealthfund.org Report November 2021
Achieving Racial and Ethnic Equity in U.S. Health Care: A Scorecard of State Performance 15
15. Elizabeth Arias and Jiaquan Xu, United States Life Tables, 2018 (National Vital Statistics Reports, Nov. 2020); and “Disparities Fact Sheet,” 2019.
16. The state-level correlation between mortality amenable to health care and life expectancy holds for all racial and ethnic groups analyzed in this report. Commonwealth Fund analysis using 2018 and 2019 data from the CDC’s National Vital Statistics System (NVSS); and 2021 County Health Rankings: Data and Documentation (University of Wisconsin Population Health Institute, n.d.). See also: Stephen C. Schoenbaum et al., “Mortality Amenable to Health Care in the United States: The Roles of Demographics and Health Systems Performance,” Journal of Public Health Policy 32, no. 4 (Nov. 2011): 407–29; and Margaret E. Kruk et al., “Mortality Due to Low-Quality Health Systems in the Universal Health Coverage Era: A Systematic Analysis of Amenable Deaths in 137 Countries,” The Lancet 392, no. 10160 (Nov. 17, 2018): 2203–12.
17. For discussion, see Eduardo Velasco-Mondragon et al., “Hispanic Health in the USA: A Scoping Review of the Literature,” Public Health Reviews 37 (Dec. 2016): 31.
18. Steven H. Woolf et al., “Changes in Midlife Death Rates Across Racial and Ethnic Groups in the United States: Systematic Analysis of Vital Statistics,” BMJ 362 (Aug. 2018): k3096.
19. Kimberly D. Miller et al., “Cancer Statistics for Hispanics/Latinos, 2018,” CA: A Cancer Journal for Clinicians 68, no. 6 (Nov./Dec. 2018): 425–45; and Velasco-Mondragon et al., “Hispanic Health,” 2016.
20. Carol E. DeSantis et al., “Cancer Statistics for African Americans, 2019,” CA: A Cancer Journal for Clinicians 69, no. 3 (May/June 2019): 211–33.
21. Declercq and Zephyrin, Maternal Mortality Primer, 2020; “Infant Mortality,” Commonwealth Fund Health Systems Data Center, n.d.; Danielle M. Ely and Anne K. Driscoll, “Infant Mortality in the United States, 2018: Data From the Period Linked Birth/Infant Death File,” National Vital Statistics Reports, 69, no. 7 (NVSS, July 2020); and Gopal K. Singh and Stella M. Yu, “Infant Mortality in the United States,
1915–2017: Large Social Inequalities Have Persisted for Over a Century,” International Journal of Maternal and Child Health and AIDS 8, no. 1 (2019): 19–31.
22. Sherry A. Glied and Benjamin Zhu, Not So Sweet: Insulin Affordability over Time (Commonwealth Fund, Sept. 2020); Clair et al., “Disparities by Race,” 2020; Schpero et al., “For Selected Services,” 2017; and Ziad Obermeyer et al., “Dissecting Racial Bias in an Algorithm Used to Manage the Health of Populations,” Science 366, no. 6464 (Oct. 25, 2019): 447–53.
23. Elizabeth A. Howell et al., “Black–White Differences in Severe Maternal Morbidity and Site of Care,” American Journal of Obstetrics and Gynecology 214, no. 1 (Aug. 2015): 122. e1–122.e7; and Elizabeth A. Howell et al., “Race and Ethnicity, Medical Insurance, and Within-Hospital Severe Maternal Morbidity Disparities,” Obstetrics & Gynecology 135, no. 2 (Feb. 2020): 285–93.
24. Mark Walker, “For Tribal Members in Oklahoma, Medicaid Expansion Improves Access to Specialty Care,” New York Times, Sept. 4, 2021; and Eric Whitney, “Native Americans Feel Invisible in U.S. Health Care System,” NPR, Dec. 12, 2017.
25. Baumgartner, Collins, and Radley, Racial and Ethnic Inequities, 2021; Walker, “For Tribal Members,” 2021; and Corinne Lewis et al., The Role of Medicaid Expansion in Care Delivery at Community Health Centers (Commonwealth Fund, Apr. 2019).
26. Sara R. Collins, Munira Z. Gunja, and Gabriella N. Aboulafia, U.S. Health Insurance Coverage in 2020: A Looming Crisis in Affordability — Findings from the Commonwealth Fund Biennial Health Insurance Survey (Commonwealth Fund, Aug. 2020).
27. William Darity Jr. et al., What We Get Wrong About Closing the Racial Wealth Gap (Duke University, Samuel Dubois Cook Center on Social Equity, Apr. 2018).
28. “Individuals with high out-of-pocket medical spending,” Commonwealth Fund Health Systems Data Center, n.d.; Collins, Aboulafia and Gunja, As the Pandemic Eases, 2021.
commonwealthfund.org Report November 2021
Achieving Racial and Ethnic Equity in U.S. Health Care: A Scorecard of State Performance 16
29. Nancy Beaulieu et al., “Primary Care Delivery Systems and Segregation in a Medicaid Population,” Harvard University, 2020; Roosa S. Tikkanen et al., “Hospital Payer and Racial/Ethnic Mix at Private Academic Medical Centers in Boston and New York City,” International Journal of Health Services 47, no. 3 (July 2017): 460–76; Elizabeth J. Brown et al., “Racial Disparities in Geographic Access to Primary Care in Philadelphia,” Health Affairs 35, no. 8 (Aug. 2016): 1374–81; Darrell J. Gaskin et al., “Residential Segregation and the Availability of Primary Care Physicians,” Health Services Research 47, no. 6 (Dec. 2012): 2353–76; and Emily P. Terlizzi et al., “Reported Importance and Access to Health Care Providers Who Understand or Share Cultural Characteristics with Their Patients Among Adults, by Race and Ethnicity,” HHS National Health Statistics Reports 130 (Oct. 2019).
30. Medicaid’s Role in Health Care for American Indians and Alaska Natives (Medicaid and CHIP Payment and Access Commission, Feb. 2021); “Profile: American Indian/Alaska Native,” U.S. HHS Office of Minority Health, Sept. 2021.
31. Correlation between primary care spending, expressed as a share of total per beneficiary spending, and hospital admissions for primary-care sensitive conditions was stronger among Black beneficiaries (r = –0.49) than among white beneficiaries (r = –0.22). Similarly, higher levels of primary care spending were associated with lower levels of emergency department use for nonemergent conditions, with a stronger correlation among Black beneficiaries (r = –0.40) than white beneficiaries (r = –0.24).
32. Cynthia G. Whitney et al., “Benefits from Immunization During the Vaccines for Children Program Era—United States, 1994–2013,” Morbidity and Mortality Weekly Report (MMWR) 63, no. 16 (Apr. 25, 2014): 352–55; Allison T. Walker, Philip J. Smith, and Maureen Kolasa, “Reduction of Racial/ Ethnic Disparities in Vaccination Coverage, 1995–2011,” Morbidity and Mortality Weekly Report (MMWR) 63, no. 1 (Apr. 18, 2014): 7–12.
33. Jessica S. Banthin, Michael Simpson, and Andrew Green, The Coverage and Cost Effects of Key Health Insurance Reforms Being Considered by Congress (Commonwealth Fund, Sept. 2021, updated Oct. 5, 2021).
34. Improving Health Insurance Affordability Act of 2021, S. 499, 117th Cong. (2021). See Linda J. Blumberg et al., From Incremental to Comprehensive Health Insurance Reform: How Various Reform Options Compare on Coverage and Costs (Urban Institute, Oct. 2019).
35. Sara R. Collins and Gabriella N. Aboulafia, “Will the American Rescue Plan Reduce the Number of Uninsured Americans?,” To the Point (blog), Commonwealth Fund, Mar. 22, 2021.
36. Collins and Aboulafia, “Will the American Rescue Plan?,” 2021.
37. Melody Gutierrez, “California Expands Medi-Cal, Offering Relief to Older Immigrants Without Legal Status,” Los Angeles Times, July 27, 2021; and Kelly Whitener, “COVID-19 and Immigrant Health,” Say Ahhh! (blog), Georgetown University Center for Children and Families, Apr. 10, 2020.
38. Kevin McAvey and Alisha Reginal, Unlocking Race and Ethnicity Data to Promote Health Equity in California (Manatt Health, Apr. 2021).
39. Katie Keith, “How Insurers Can Advance Health Equity Under the Affordable Care Act,” To the Point (blog), Commonwealth Fund, Aug. 10, 2021.
40. Brown et al., “Racial Disparities,” 2016; Gaskin et al., “Residential Segregation,” 2012; and Howell et al., “Black–White,” 2015.
41. Diane Alexander and Molly Schnell, “The Impacts of Physician Payments on Patient Access, Use, and Health,” NBER Working Paper 26095 (July 2019); and Commonwealth Fund Task Force on Payment and Delivery System Reform, Six Policy Imperatives to Improve Quality, Advance Equity, and Increase Affordability (Commonwealth Fund, Nov. 2020).
42. Mandy Cohen et al., “Buying Health, Not Just Health Care: North Carolina’s Pilot Effort,” To the Point (blog), Commonwealth Fund, Jan. 27, 2020; and Sophia Tripoli et al., “To Advance Health Equity, Federal Policy Makers Should Build on Lessons from State Medicaid Experiments,” Health Affairs Blog, Apr. 14, 2021.
43. Brenda Gleason and Laurie Zephryin, “Improving Access to Telematernity Services After the Pandemic,” To the Point (blog), Commonwealth Fund, Aug. 17, 2021.

commonwealthfund.org Report November 2021
Achieving Racial and Ethnic Equity in U.S. Health Care: A Scorecard of State Performance 17
44. Commonwealth Fund Task Force, Six Policy Imperatives, 2020; and Donnie L. Bell and Mitchell H. Katz, “Modernize Medical Licensing, and Credentialing, Too — Lessons From the COVID-19 Pandemic,” JAMA Internal Medicine 181, no. 3 (Jan. 2021):312–15.
45. Eric C. Schneider et al., Mirror, Mirror 2021 — Reflecting Poorly: Health Care in the U.S. Compared to Other High-Income Countries (Commonwealth Fund, Aug. 2021).
46. Michael Anne Kyle and Austin B. Frakt, “Patient Administrative Burden in the U.S. Health Care System,” Health Services Research 56, no. 5 (Oct. 2021): 755–65.
47. Linda J. Blumberg, John Holahan, and Jason Levitis, How Auto-Enrollment Can Achieve Near-Universal Coverage: Policy and Implementation Issues (Commonwealth Fund, June 2021).
48. Roosa S. Tikkanen and Eric C. Schneider, “Social Spending to Improve Population Health — Does the United States Spend as Wisely as Other Countries?,” New England Journal of Medicine 382, no. 10 (Mar. 5, 2020): 885–87.
49. Montez et al., “U.S. State Policies,” 2020; Divya Amladi, The Best and Worst States to Work in During COVID-19 (Oxfam America, Sept. 2020); Erica Williams, Samantha Waxman, and Julian Legendre, States Can Adopt or Expand Earned Income Tax Credits to Build a Stronger Future Economy (Center on Budget and Policy Priorities, Mar. 2020); and Shera Avi-Yonah and Danielle Moran, “NYC, Connecticut Start ‘Baby Bond’ Programs to Shrink Inequality,” Bloomberg, July 8, 2021.
50. Schneider et al., Mirror, Mirror, 2021.

commonwealthfund.org Report November 2021
Achieving Racial and Ethnic Equity in U.S. Health Care: A Scorecard of State Performance 18
ABOUT THE AUTHORSDavid C. Radley, Ph.D., M.P.H., is a senior scientist for the Commonwealth Fund’s Tracking Health System Performance initiative. Dr. Radley and his team develop national, state, and substate regional analyses on health care system performance and related insurance and care system market structure analyses. He is also a senior study director at Westat, a research firm that supports the Scorecard project. Dr. Radley joined the Fund in July 2010 from Abt Associates where he was associate in Domestic Health Policy. His methodological expertise is in small-area analysis and in the design, implementation, and interpretation of observational studies that take advantage of large administrative and survey-based datasets. Dr. Radley received his Ph.D. in Health Policy from the Dartmouth Institute for Health Policy and Clinical Practice. He holds a B.A. from Syracuse University and an M.P.H. from Yale University.
Jesse C. Baumgartner, M.P.H., joined the Commonwealth Fund in 2019 as a research associate in the Health Care Coverage and Access program and the Tracking Health System Performance initiative. Before joining the Fund, he worked as a technology development/licensing manager at Memorial Sloan Kettering Cancer Center (2016–2018), a life sciences consultant at Stern Investor Relations (2012–2016), and earlier in his career as a reporter for the Lewiston Tribune in Idaho. Baumgartner earned his B.A. in journalism and history from the University of North Carolina at Chapel Hill, where he was elected Phi Beta Kappa, and his M.P.H. in Health Policy and Management at the CUNY Graduate School of Public Health and Health Policy. He is also a CFA® charterholder.
Sara R. Collins, Ph.D., is vice president for Health Care Coverage and Access at the Commonwealth Fund. An economist, Dr. Collins directs the Health Care Coverage and Access program as well as the Fund’s research initiative on Tracking Health System Performance. Since joining the Fund in 2002, Dr. Collins has led several multiyear national surveys on health insurance and authored numerous reports, issue briefs, and journal articles on health insurance coverage, health reform, and the Affordable Care Act. She has provided invited testimony before several Congressional committees and subcommittees. Prior to joining the Fund, Dr. Collins was associate director/senior research associate at the New York Academy of Medicine, Division of Health and Science
Policy. Earlier in her career, she was an associate editor at U.S. News & World Report, a senior economist at Health Economics Research, and a senior health policy analyst in the New York City Office of the Public Advocate. She holds an A.B. in economics from Washington University and a Ph.D. in economics from George Washington University.
Laurie Zephyrin, M.D., M.P.H., M.B.A., is vice president for Advancing Health Equity at the Commonwealth Fund. Dr. Zephyrin has extensive experience leading the vision, design, and delivery of innovative health care models across national health systems. From 2009–2018, she was the first national director of the Reproductive Health Program at the Department of Veterans Affairs. In 2016–2017, she served as acting assistant deputy under secretary for Health for Community Care, and later in 2017, as acting deputy under secretary for Health for Community Care. As part of the Community Care leadership team, she represented the VA before Congress and other internal and external stakeholders. Dr. Zephyrin is a board-certified clinician. She is a clinical assistant professor of Obstetrics and Gynecology at NYU Langone School of Medicine (2013–present) and was previously an assistant professor at Columbia University, College of Physicians and Surgeons (2007–2012). She earned her M.D. from the New York University School of Medicine, M.B.A. and M.P.H. from Johns Hopkins University, and B.S. in Biomedical Sciences from the City College of New York. She completed her residency training at Harvard’s Integrated Residency Program at Brigham and Women’s Hospital and Massachusetts General Hospital.
Eric C. Schneider, M.D., M.Sc., is senior vice president for policy and research at the Commonwealth Fund. A member of the Fund’s executive management team, Dr. Schneider provides strategic guidance to the organization’s research on topics in policy, health services delivery, and public health as well as scientific review of initiatives, grants, projects, and publications. Prior to joining the Fund, Dr. Schneider was principal researcher at the RAND Corporation and he held the RAND Distinguished Chair in Health Care Quality. From 1997, he was a faculty member of the Harvard Medical School and Harvard School of Public Health, where he taught health policy and quality improvement in health care and practiced primary care internal medicine at the Phyllis Jen Center for Primary Care at Brigham and Women’s Hospital in Boston. Dr. Schneider has held several leadership roles

commonwealthfund.org Report November 2021
Achieving Racial and Ethnic Equity in U.S. Health Care: A Scorecard of State Performance 19
including editor-in-chief of the International Journal for Quality in Health Care, cochair of the Committee for Performance Measurement of the National Committee for Quality Assurance, member of the editorial board of the National Quality Measures and Guidelines Clearinghouses, as a member of the scientific advisory board of the Institute for Healthcare Improvement, as chair of the Performance Measurement Committee of the American College of Physicians, and as a methodologist on the executive committee of the Physician Consortium for Performance Improvement of the American Medical Association. Dr. Schneider holds an M.Sc. from the University of California, Berkeley, and an M.D. from the University of California, San Francisco. He is an elected fellow of the American College of Physicians.
Editorial support was provided by Christopher Hollander.
ACKNOWLEDGMENTSWe owe our sincere appreciation to the four member advisory panel who provided crucial feedback and review throughout development of the methods used in this report — the group included Cara James, Ph.D. (Grantmakers In Health); Zinzi Bailey, Sc.D., M.S.P.H. (University of Miami Miller School of Medicine); Dolores Acevedo-Garcia, Ph.D., M.P.A.-U.R.P. (Brandeis University); and Marc Elliott Ph.D., M.A. (RAND Corporation).
We would also like to thank the researchers who developed indicators and conducted data analyses for this scorecard. These include: Michael E. Chernew, Ph.D., and Andrew Hicks, Department of Health Care Policy, Harvard Medical School; Sherry Glied, Ph.D., and Mikaela Springsteen, New York University Robert F. Wagner Graduate School of Public Service; and Angelina Lee and Kevin Neipp, Westat.
We would like to thank the following Commonwealth Fund staff: David Blumenthal, M.D., Melinda Abrams, and Rachel Nuzum for providing constructive guidance throughout; and the Fund’s communications and support teams, including Barry Scholl, Chris Hollander, Deborah Lorber, Bethanne Fox, Josh Tallman, Jen Wilson, Paul Frame, Naomi Leibowitz, Samantha Chase, Relebohile Masitha, Arnav Shah, Aimee Cicchiello, Christina Ramsay, Alexandra Bryan, Sara Federman, Munira Gunja, and Celli Horstman for their guidance, editorial and production support, and public dissemination efforts.
Finally, the authors wish to acknowledge Maya Brod of Burness Communications for her assistance with media outreach, and Westat for its support of the research unit, which enabled the analysis and development of the scorecard report.
For more information about this report, please contact:
David C. RadleySenior ScientistTracking Health System PerformanceThe Commonwealth [email protected]
Achieving Racial and Ethnic Equity in U.S. Health Care: A Scorecard of State Performance 20
commonwealthfund.org Report November 2021
STUDY METHODSThis report, modeled on the Commonwealth Fund’s annual Scorecard on State Health System Performance,1 evaluates state health system performance for five racial and ethnic groups on 24 indicators representing three dimensions:
• Health Outcomes: Eight indicators related to premature death, health status, and health risk behaviors.
• Health Care Access: Five indicators related to insurance coverage for children and adults, access to health care providers, out-of-pocket expenses for medical care, and cost-related barriers to receiving care.
• Quality and Use of Health Care Services: Eleven indicators related to receipt of preventive care, hospital and emergency department use that might have been reduced with timely and effective care, and estimates of spending on primary care as a share of total Medicare spending.
The racial and ethnic groups included in the analysis are: Black (non-Latinx/Hispanic); white (non-Latinx/Hispanic); Latinx/Hispanic (any race); Asian American, Native Hawaiian, or Pacific Islander (non-Latinx/Hispanic); and American Indian or Alaska Native (non-Latinx/Hispanic).
Guiding Principles
Performance metrics: Nearly all 24 metrics in the report are those used for the 2020 Scorecard on State Health System Performance. We selected them because they represent important dimensions and measurable aspects of health care system performance, and because they can be stratified by race and ethnicity within each state (see Appendix C for a full list of indicators and the available racial and ethnic groups within each data source).
Data sources: We selected the metrics from publicly available sources, including government-sponsored surveys, publicly reported quality indicators, vital statistics, mortality data, and administrative databases. The most current data available were used wherever possible. To increase the number of data points for different racial and
ethnic populations within states, we aggregated data across the two most recent years for 17 of the 24 indicators (e.g., 2019–20). Appendix C identifies the data source and time frame used for each indicator.
Data inclusion: Each data source used has its own guidance for suppressing estimates based on sample size. For example, guidance from the Centers for Disease Control and Prevention (CDC) for deriving estimates from the Behavioral Risk Factor Surveillance System (BRFSS) advises that subpopulation estimates be suppressed when the relative standard error (standard error divided by the estimate) is less than 30 percent. The CDC also advises that rates derived from the restricted-use detailed mortality files used for our preventable mortality measure be suppressed when there are fewer than 10 underlying deaths. In all instances, we followed each data source’s suppression guidance; in some cases, we used even stricter suppression criteria to ensure the stability of our estimates (e.g., we suppressed preventable mortality rates if there were fewer than 20 deaths).
To further ensure data stability, we did not include any estimates for a state population group in our scoring calculations if: a) they did not make up at least 2 percent of the state’s total population, and b) there were less than 40,000 people estimated to be in that group.
Scoring methodology: For each of the 24 performance indicators, we gather all available point estimates for the racial and ethnic populations in each state (including the District of Columbia as if it were a state) and calculated a standardized z-score for each state population group (e.g., all Texas residents who identify as Latinx/Hispanic). To illustrate, for adult uninsured rates, we have point estimates available for 191 state population groups (51 white, 48 Latinx/Hispanic, 39 Black, 37 AANHPI, 16 AIAN). For each group, we calculate the z-score by subtracting the average uninsured rate across all 191 groups from the uninsured rate for the specific group and then dividing by the standard deviation of all observed group rates. This approach is similar to the method used in our Scorecard on State Health System Performance, but it is applied to each population group within each state rather than to the full state population.

Achieving Racial and Ethnic Equity in U.S. Health Care: A Scorecard of State Performance 21
commonwealthfund.org Report November 2021
The standardized z-scores for each state population group were averaged across all indicators within the performance dimension (Outcomes, Access, Quality/Use), and then dimension scores were averaged to generate an overall health system performance score for that particular group. A group did not receive a dimension score (or scores for individual indicators within a dimension) if it was missing data for more than 50 percent of the indicators within that dimension. A group that was missing a dimension score did not receive a final overall health system performance score.
Finally, we took the overall composite z-scores for each state population group and assigned a 1–100 percentile score (we also assigned percentile scores for each of the three dimensions). The percentile scoring reflects the observed distribution of health system performance for all the groups measured. It enables users to make comparisons both across states (e.g., the health system performance for Black residents of Massachusetts compared to Black residents of Georgia) and within states (e.g., the gap in health system performance for Black and white Michigan residents).
It is important to note that because the scores are set relative to one another rather than to a predefined benchmark, groups at or near the 100th percentile still have room for improvement.
Data limitations: Not all data sources supported state-level estimates for all racial and ethnic groups featured in this report. For example, the Medicare LDS, used to create several utilization indicators, can reliably support estimates only for Black and white race but not for ethnicity.
For several populations (particularly AIAN and AANHPI), many states have insufficient data to produce an overall health system performance score or point estimates for many of the individual indicators. However, we do publish all point estimates meeting data-source suppression criteria within our individual state profiles.
Finally, it is important to note that the five racial and ethnic categories used for this report often group together populations with different experiences, cultures, immigration barriers, and other socioeconomic factors. For example, there is a wide range of culturally distinct Latinx/Hispanic communities and Asian American communities across the United States. Such groupings are imperfect and
can mask significant differences. For example, past research has shown variability in health insurance coverage rates among Asian American subpopulations and between Asian Americans and Native Hawaiians or Pacific Islanders.2 While use of these categories is necessary to obtain sufficient data sample sizes, states and localities should interpret the findings within the context of their own communities, using them as a starting point to guide more targeted research and policy solutions.
ACKNOWLEDGMENTSThis report was developed with feedback and review from an advisory group that included Cara James, Ph.D. (Grantmakers In Health); Zinzi Bailey, Sc.D., M.S.P.H. (University of Miami Miller School of Medicine); Dolores Acevedo-Garcia, Ph.D., M.P.A.-U.R.P. (Brandeis University); and Marc Elliott Ph.D., M.A. (RAND Corporation). We are extremely grateful to this group for their feedback and recommendations, as well as their prior work around equity measurement which helped guide the methods for this analysis.3 All final decisions around the methods and data indicators used were made by the Commonwealth Fund.
NOTES TO METHODS1. David C. Radley, Sara R. Collins, and Jesse C.
Baumgartner, 2020 Scorecard on State Health System Performance (Commonwealth Fund, Sept. 2020).
2. Munira Z. Gunja et al., Gap Closed: The Affordable Care Act’s Impact on Asian Americans’ Health Coverage (Commonwealth Fund, July 2020).
3. Dolores Acevedo-Garcia et al., “Racial and Ethnic Inequities in Children’s Neighborhoods: Evidence from the New Child Opportunity Index 2.0,” Health Affairs 39, no. 10 (Oct. 2020): 1693–1701; Denis Agniel et al., “Incentivizing Excellent Care to At-Risk Groups with a Health Equity Summary Score,” Journal of General Internal Medicine 36, no. 7 (July 2021): 1847–57; and Cara V. James et al., Putting Women’s Health Care Disparities on the Map: Examining Racial and Ethnic Disparities at the State Level (Henry J. Kaiser Family Foundation, June 2009).

Achieving Racial and Ethnic Equity in U.S. Health Care: A Scorecard of State Performance 22
commonwealthfund.org Report November 2021
Indicator Data years Database
1 Mortality amenable to health care, deaths per 100,000 population 2018–19 CDC National Vital Statistics System (NVSS): Restricted Use Mortality
Microdata
2 Infant mortality, deaths per 1,000 live births 2017–18 CDC National Vital Statistics System (NVSS): WONDER
3 Breast cancer deaths per 100,000 female population 2018–19 CDC National Vital Statistics System (NVSS): WONDER
4 Colorectal cancer deaths per 100,000 population 2018–19 CDC National Vital Statistics System (NVSS): WONDER
5 30-day hospital readmissions, Medicare beneficiaries age 65 and older, per 1,000 beneficiaries 2019 CMS Limited Data Set (LDS)
6 Adults age 18 and older who smoke 2019–20 Behavioral Risk Factor Surveillance System (BRFSS)
7 Adults ages 18–64 who are obese (BMI >= 30) 2019–20 Behavioral Risk Factor Surveillance System (BRFSS)
8 Adults ages 18–64 who have lost six or more teeth because of tooth decay, infection, or gum disease 2018/20 Behavioral Risk Factor Surveillance System (BRFSS)
9 Adults ages 19–64 uninsured 2019 American Community Survey, Public Use Microdata Sample (ACS PUMS)
10 Children ages 0–18 uninsured 2019 American Community Survey, Public Use Microdata Sample (ACS PUMS)
11 Adults age 18 and older who went without care because of cost in past year 2019–20 Behavioral Risk Factor Surveillance System (BRFSS)
12 Individuals under age 65 with high out-of-pocket medical costs relative to their annual household income 2019–20 Current Population Survey Annual Social and Economic Supplement
(CPS ASEC)
13 Adults age 18 and older with a usual source of care 2019–20 Behavioral Risk Factor Surveillance System (BRFSS)
14Hospital admissions for ambulatory care–sensitive conditions, Medicare beneficiaries age 65 and older, per 1,000 beneficiaries
2019 CMS Limited Data Set (LDS)
15 Potentially avoidable emergency department visits, Medicare beneficiaries age 65 and older, per 1,000 beneficiaries 2019 CMS Limited Data Set (LDS)
16 Adult women ages 50–74 who received a mammogram in the past two years 2018/20 Behavioral Risk Factor Surveillance System (BRFSS)
17 Adult women ages 25–64 who received a cervical cancer screening test in the past three years 2018/20 Behavioral Risk Factor Surveillance System (BRFSS)
18 Adults ages 50–74 with a recent colon cancer screening test 2018/20 Behavioral Risk Factor Surveillance System (BRFSS)
19 Adults age 18 and older who received a flu shot in the past year 2019–20 Behavioral Risk Factor Surveillance System (BRFSS)
20 Adults age 65 and older who have ever gotten a pneumonia vaccine 2019–20 Behavioral Risk Factor Surveillance System (BRFSS)
21 Children with age-appropriate medical and dental preventive care visits in the past year 2019–20 National Survey of Children’s Health (NSCH)
22 Children ages 19–35 months who received all recommended doses of seven key vaccines 2019 National Immunization Survey (NIS)
23 Adults age 18 and older without a dental visit in past year 2018/20 Behavioral Risk Factor Surveillance System (BRFSS)
24 Primary care spending as share of total health care spending, Medicare beneficiaries age 65 and older 2019 CMS Limited Data Set (LDS)
Appendix A1. State Equity Report, Data Years and Databases
Health Outcomes
Health Care Access
Quality and Use of Health Care Services
APPENDIX A1. State Equity Report Performance Indicators, Data Years, and Databases
A downloadable Excel data file with all indicators for all state populations is available in the online version of the report.

Achieving Racial and Ethnic Equity in U.S. Health Care: A Scorecard of State Performance 23
commonwealthfund.org Report November 2021
IndicatorData year
U.S. average
rate AIAN rateAANHPI
rate Black rate
Latinx/Hispanic
rate White rate
1 Mortality amenable to health care, deaths per 100,000 population 2018–19 8844..22 107.6 49.3 153.1 66.9 78.2
2 Infant mortality, deaths per 1,000 live births 2017–18 55..77 8.7 3.9 10.9 5.0 4.7
3 Breast cancer deaths per 100,000 female population 2018–19 1199..66 14.9 11.9 27.7 13.6 19.6
4 Colorectal cancer deaths per 100,000 population 2018–19 1133..22 13.1 9.0 17.3 10.7 13.3
5 30-day hospital readmissions, Medicare beneficiaries age 65 and older, per 1,000 beneficiaries 2019 3377..66 — — 60.2 — 36.5
6 Adults age 18 and older who smoke 2019–20 1155%% 28% 8% 17% 12% 15%
7 Adults ages 18–64 who are obese (BMI >= 30) 2019–20 3322%% 40% 13% 42% 36% 31%
8Adults ages 18–64 who have lost six or more teeth because of tooth decay, infection, or gum disease 2018/20 99%% 18% 3% 11% 7% 10%
9 Adults ages 19–64 uninsured 2019 1133%% 25% 8% 14% 26% 9%
10 Children ages 0–18 uninsured 2019 66%% 14% 4% 5% 9% 4%
11 Adults age 18 and older who went without care because of cost in past year 2019–20 1122%% 17% 9% 15% 19% 10%
12 Individuals under age 65 with high out-of-pocket medical costs relative to their annual household income 2019–20 66%% 7% 5% 7% 6% 6%
13 Adults age 18 and older with a usual source of care 2019–20 7777%% 71% 75% 78% 60% 81%
14 Hospital admissions for ambulatory care–sensitive conditions, Medicare beneficiaries age 65 and older, per 1,000 beneficiaries 2019 3399..44 — — 59.0 — 38.7
15 Potentially avoidable emergency department visits, Medicare beneficiaries age 65 and older, per 1,000 beneficiaries 2019 118855..33 — — 289.9 — 179.7
16 Adult women ages 50–74 who received a mammogram in the past two years 2018/20 7799%% 72% 76% 85% 79% 78%
17 Adult women ages 25–64 who received a cervical cancer screening test in the past three years 2018/20 7777%% 72% 72% 83% 79% 76%
18 Adults ages 50–74 with a recent colon cancer screening test 2018/20 7700%% 61% 63% 71% 59% 73%
19 Adults age 18 and older who received a flu shot in the past year 2019–20 4455%% 39% 47% 37% 35% 49%
20 Adults age 65 and older who have ever gotten a pneumonia vaccine 2019–20 7711%% 62% 67% 61% 55% 74%
21 Children with age-appropriate medical and dental preventive care visits in the past year 2019–20 6666%% — — 63% 61% 70%
22 Children ages 19–35 months who received all recommended doses of seven key vaccines 2019 7733%% — — 66% 70% 76%
23 Adults age 18 and older without a dental visit in past year 2018/20 3355%% 44% 33% 40% 43% 31%
24 Primary care spending as share of total health care spending, Medicare beneficiaries age 65 and older 2019 66%% — — 5% — 6%
Health Outcomes
Health Care Access
Quality and Use of Health Care Services
Appendix A2. National Rates, by Race and Ethnicity, for State Equity Report Health System Performance Indicators
Notes: “—” indicates stratification by race or ethnicity is not available. AIAN = American Indian and Alaska Native; AANHPI = Asian American, Native Hawaiian, and Pacific Islander.
APPENDIX A2. National Rates, by Race and Ethnicity, for State Equity Report Health System Performance Indicators
Notes: “—” indicates stratification by race or ethnicity is not available. AIAN = American Indian/Alaska Native; AANHPI = Asian American, Native Hawaiian, and Pacific Islander.

Achieving Racial and Ethnic Equity in U.S. Health Care: A Scorecard of State Performance 24
commonwealthfund.org Report November 2021
Appendix B1a. Summary of Overall State Health System Performance Across Populations
AIAN
AANHPI
BlackLatin
x/Hispanic
WhiteState
Alabama — — 4 3 2
Alaska 4 — — — 2
Arizona 4 2 3 3 1
Arkansas — — 3 4 2
California 2 1 3 3 1
Colorado — 1 3 3 1
Connecticut — 1 2 2 1
Delaware — — 3 3 1
District of Columbia — — 3 — 1
Florida 4 2 4 3 2
Georgia — 2 3 4 2
Hawaii — 1 — 1 1
Idaho — — — 3 2
Illinois — 2 4 3 1
Indiana — — 4 4 2
Iowa — — 3 3 1
Kansas — — 4 4 2
Kentucky — — 3 4 2
Louisiana — — 4 3 2
Maine — — — — 1
Maryland — 1 2 3 1
Massachusetts — 1 2 1 1
Michigan 4 1 4 2 1
Minnesota 4 2 3 4 1
Mississippi — — 4 — 3
Missouri — — 4 3 2
Montana 4 — — 3 2
Nebraska — — 4 4 1
Nevada — 2 4 3 2
New Hampshire — — — — 1
New Jersey — 1 3 3 1
New Mexico 3 — — 3 2
New York — 2 2 2 1
North Carolina 4 2 3 4 1
North Dakota 4 — — — 1
Ohio — 2 3 3 2
Oklahoma 4 — 4 4 3
Oregon — 2 — 2 1
Pennsylvania — 1 3 2 1
Rhode Island — — 1 2 1
South Carolina — — 3 4 2
South Dakota 4 — — — 2
Tennessee — — 3 4 2
Texas — 2 4 4 2
Utah — 3 — 3 1
Vermont — — — — 1
Virginia — 1 3 3 1
Washington 4 1 3 2 1
West Virginia — — 4 — 3
Wisconsin — — 4 3 1
Wyoming 4 — — 4 2
Notes: Color shades represent the quartile distribution of health system performance for all state/population groups, with lighter gray representing stronger performance and darker gray weaker performance. “—” means that an overall performance score could not be produced for that state/population group. AIAN = American Indian and Alaska Native; AANHPI = Asian American, Native Hawaiian, and Pacific Islander.
APPENDIX B1A. Summary of Overall State Health System Performance Across Populations
Notes: Color shades represent the quartile distribution of health system performance for all state/population groups, with lighter shades representing stronger performance and darker shades weaker performance. “—” means that an overall performance score could not be produced for that state/population group. AIAN = American Indian/Alaska Native; AANHPI = Asian American, Native Hawaiian, and Pacific Islander.
LEGEND
Top quartile
2nd quartile
3rd quartile
Bottom quartile
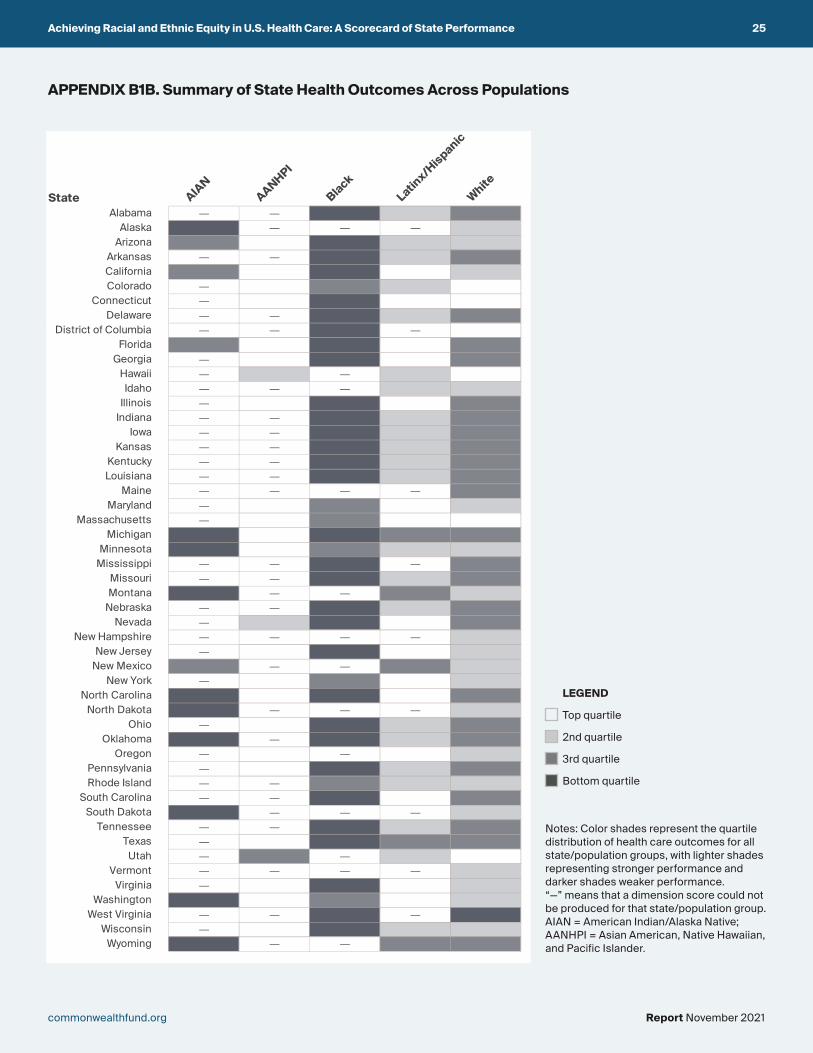
Achieving Racial and Ethnic Equity in U.S. Health Care: A Scorecard of State Performance 25
commonwealthfund.org Report November 2021
APPENDIX B1B. Summary of State Health Outcomes Across Populations
Notes: Color shades represent the quartile distribution of health care outcomes for all state/population groups, with lighter shades representing stronger performance and darker shades weaker performance. “—” means that a dimension score could not be produced for that state/population group. AIAN = American Indian/Alaska Native; AANHPI = Asian American, Native Hawaiian, and Pacific Islander.
Appendix B1b. Summary of State Health Outcomes Across Populations
AIAN
AANHPI
BlackLatin
x/Hispanic
WhiteState
Alabama — — 4 2 3
Alaska 4 — — — 2
Arizona 3 1 4 2 2
Arkansas — — 4 2 3
California 3 1 4 1 2
Colorado — 1 3 2 1
Connecticut — 1 4 1 1
Delaware — — 4 2 3
District of Columbia — — 4 — 1
Florida 3 1 4 1 3
Georgia — 1 4 1 3
Hawaii — 2 — 2 1
Idaho — — — 2 2
Illinois — 1 4 1 3
Indiana — — 4 2 3
Iowa — — 4 2 3
Kansas — — 4 2 3
Kentucky — — 4 2 3
Louisiana — — 4 2 3
Maine — — — — 3
Maryland — 1 3 1 2
Massachusetts — 1 3 1 1
Michigan 4 1 4 3 3
Minnesota 4 1 3 2 2
Mississippi — — 4 — 3
Missouri — — 4 2 3
Montana 4 — — 3 2
Nebraska — — 4 2 3
Nevada — 2 4 1 3
New Hampshire — — — — 2
New Jersey — 1 4 1 2
New Mexico 3 — — 3 2
New York — 1 3 1 2
North Carolina 4 1 4 1 3
North Dakota 4 — — — 2
Ohio — 1 4 2 3
Oklahoma 4 — 4 2 3
Oregon — 1 — 1 2
Pennsylvania — 1 4 2 3
Rhode Island — — 3 2 2
South Carolina — — 4 1 3
South Dakota 4 — — — 2
Tennessee — — 4 2 3
Texas — 1 4 3 3
Utah — 3 — 2 1
Vermont — — — — 2
Virginia — 1 4 1 2
Washington 4 1 3 1 2
West Virginia — — 4 — 4
Wisconsin — 1 4 2 2
Wyoming 4 — — 3 3
Notes: Color shades represent the quartile distribution of health care outcomes for all state/population groups, with lighter gray representing stronger performance and darker gray weaker performance. “—” means that a dimension score could not be produced for that state/population group. AIAN = American Indian and Alaska Native; AANHPI = Asian American, Native Hawaiian, and Pacific Islander.
LEGEND
Top quartile
2nd quartile
3rd quartile
Bottom quartile

Achieving Racial and Ethnic Equity in U.S. Health Care: A Scorecard of State Performance 26
commonwealthfund.org Report November 2021
APPENDIX B1C. Summary of State Health Care Access Across PopulationsAppendix B1c. Summary of State Health Care Access Across Populations
AIANAANHPI
BlackLatin
x/Hispanic
WhiteState
Alabama — — 3 4 2
Alaska 3 — — 4 2
Arizona 4 2 2 3 2
Arkansas — — 2 4 2
California 1 1 1 3 1
Colorado — 2 3 4 2
Connecticut — 1 1 3 1
Delaware — — 2 4 1
District of Columbia — — 1 2 1
Florida 4 2 3 3 2
Georgia — 3 3 4 2
Hawaii — 1 — 1 1
Idaho — — — 4 3
Illinois — 2 2 3 1
Indiana — 3 3 4 2
Iowa — 3 2 4 1
Kansas — 4 4 4 1
Kentucky — — 3 4 2
Louisiana — 4 3 4 2
Maine — — — — 1
Maryland — 1 1 4 1
Massachusetts — 1 1 2 1
Michigan 2 1 2 2 1
Minnesota 3 2 3 4 1
Mississippi — — 3 4 3
Missouri — 3 3 4 2
Montana 4 — — 3 2
Nebraska — — 3 4 1
Nevada — 3 3 4 2
New Hampshire — — — 3 1
New Jersey — 1 2 3 1
New Mexico 4 — — 3 1
New York 3 1 1 3 1
North Carolina 4 2 3 4 2
North Dakota 4 — 4 4 2
Ohio — 3 2 3 1
Oklahoma 4 3 3 4 2
Oregon — 3 2 3 1
Pennsylvania — 1 1 3 1
Rhode Island — — 1 3 1
South Carolina — 4 3 4 2
South Dakota 4 — — 4 2
Tennessee — — 2 4 2
Texas 4 2 3 4 2
Utah — 3 — 4 2
Vermont — — — — 1
Virginia — 2 2 4 1
Washington 3 1 2 4 1
West Virginia — — 2 — 1
Wisconsin — — 2 4 1
Wyoming 4 — — 4 3
Notes: Color shades represent the quartile distribution of health care access for all state/population groups, with lighter gray representing stronger performance and darker gray weaker performance. “—” means that a dimension score could not be produced for that state/population group. AIAN = American Indian and Alaska Native; AANHPI = Asian American, Native Hawaiian, and Pacific Islander.
Notes: Color shades represent the quartile distribution of health care access for all state/population groups, with lighter shades representing stronger performance and darker shades weaker performance. “—” means that a dimension score could not be produced for that state/population group. AIAN = American Indian/Alaska Native; AANHPI = Asian American, Native Hawaiian, and Pacific Islander.
LEGEND
Top quartile
2nd quartile
3rd quartile
Bottom quartile

Achieving Racial and Ethnic Equity in U.S. Health Care: A Scorecard of State Performance 27
commonwealthfund.org Report November 2021
APPENDIX B1D. Summary of State Quality and Use of Health Care Services Across PopulationsAppendix B1d. Summary of State Quality and Use of Health Care Services Across Populations
AIAN
AANHPI
BlackLatin
x/Hispanic
WhiteState
Alabama — 2 3 2 2
Alaska 3 4 2 4 3
Arizona 4 3 4 4 1
Arkansas — 2 2 4 2
California 3 1 3 4 1
Colorado — 2 3 2 1
Connecticut — 3 2 2 1
Delaware — 4 3 3 1
District of Columbia — 3 2 1 1
Florida 4 3 3 4 1
Georgia — 3 3 4 1
Hawaii — 1 — 1 1
Idaho — — — 4 3
Illinois — 3 3 4 1
Indiana — 4 4 4 2
Iowa — 3 3 3 1
Kansas — 4 3 4 1
Kentucky — 4 2 4 2
Louisiana — 2 3 3 2
Maine — — — — 1
Maryland — 1 2 3 1
Massachusetts — 1 2 1 1
Michigan 4 1 4 1 1
Minnesota 3 4 3 4 1
Mississippi — — 4 2 2
Missouri — 4 3 4 2
Montana 3 — — 3 2
Nebraska — 4 2 4 1
Nevada — 2 4 4 2
New Hampshire — 2 — 2 1
New Jersey — 2 3 4 1
New Mexico 3 — — 3 1
New York 2 4 3 3 1
North Carolina 2 4 2 4 1
North Dakota 3 — — 2 1
Ohio — 4 3 3 2
Oklahoma 2 3 3 4 2
Oregon — 2 3 3 1
Pennsylvania — 1 2 1 1
Rhode Island — 3 1 3 1
South Carolina — 4 2 4 1
South Dakota 2 — — 2 1
Tennessee — 2 3 4 1
Texas 4 4 3 4 2
Utah — 3 — 2 1
Vermont — — — — 1
Virginia — 1 2 3 1
Washington 2 2 2 3 1
West Virginia — — 4 — 2
Wisconsin — 1 4 4 1
Wyoming 4 — — 4 3
Notes: Color shades represent the quartile distribution of quality and use of health care services performance for all state/population groups, with lighter gray representing stronger performance and darker gray weaker performance. “—” means that a dimension score could not be produced for that state/population group. AIAN = American Indian and Alaska Native; AANHPI = Asian American, Native Hawaiian, and Pacific Islander.
Notes: Color shades represent the quartile distribution of quality and use of health care services performance for all state/population groups, with lighter shades representing stronger performance and darker shades weaker performance. “—” means that a dimension score could not be produced for that state/population group. AIAN = American Indian/Alaska Native; AANHPI = Asian American, Native Hawaiian, and Pacific Islander.
LEGEND
Top quartile
2nd quartile
3rd quartile
Bottom quartile

Achieving Racial and Ethnic Equity in U.S. Health Care: A Scorecard of State Performance 28
commonwealthfund.org Report November 2021
State
Percentilescore
(1–100)
Rank among AIAN
populations(14 states)
Percentilescore
(1–100)
Rank among AIAN
populations(14 states)
Percentilescore
(1–100)
Rank among AIAN
populations(16 states)
Percentilescore
(1–100)
Rank among AIAN
populations(16 states)
Alabama — — — — — — — —Alaska 7 7 4 9 43 4 27 11Arizona 5 9 29 4 13 13 3 15Arkansas — — — — — — — —California 56 1 41 1 76 1 37 7Colorado — — — — — — — —Connecticut — — — — — — — —Delaware — — — — — — — —District of Columbia — — — — — — — —Florida 4 10 36 3 14 12 2 16Georgia — — — — — — — —Hawaii — — — — — — — —Idaho — — — — — — — —Illinois — — — — — — — —Indiana — — — — — — — —Iowa — — — — — — — —Kansas — — — — — — — —Kentucky — — — — — — — —Louisiana — — — — — — — —Maine — — — — — — — —Maryland — — — — — — — —Massachusetts — — — — — — — —Michigan 8 6 8 8 51 2 9 12Minnesota 6 8 3 11 49 3 34 8Mississippi — — — — — — — —Missouri — — — — — — — —Montana 2 13 2 13 11 14 31 10Nebraska — — — — — — — —Nevada — — — — — — — —New Hampshire — — — — — — — —New Jersey — — — — — — — —New Mexico 34 2 39 2 25 7 45 6New York — — — — 32 6 58 3North Carolina 14 4 9 7 20 9 71 1North Dakota 3 12 1 14 18 11 33 9Ohio — — — — — — — —Oklahoma 12 5 12 6 20 9 64 2Oregon — — — — — — — —Pennsylvania — — — — — — — —Rhode Island — — — — — — — —South Carolina — — — — — — — —South Dakota 3 11 3 10 9 15 58 3Tennessee — — — — — — — —Texas — — — — 24 8 4 14Utah — — — — — — — —Vermont — — — — — — — —Virginia — — — — — — — —Washington 21 3 14 5 33 5 54 5West Virginia — — — — — — — —Wisconsin — — — — — — — —Wyoming 1 14 2 12 2 16 9 13
Notes: “—” indicates insufficient data to produce an overall or dimension-specific score. Groups missing at least one dimension score were not eligible for an overall performance score. “Percentile score” is the 1–100 percentile that the state/population group falls in among the full distribution of all groups with available data. Refer to Appendix C for methodological detail.
Appendix B2a. Summary of State Health System Performance Rankings and Scores for American Indian and Alaska Native Populations
Overall Access Quality and UseOutcomes
APPENDIX B2A. Summary of State Health System Performance Rankings and Scores for American Indian/Alaska Native Populations
Notes: “—” indicates insufficient data to produce an overall or dimension-specific score. Groups missing at least one dimension score were not eligible for an overall performance score. “Percentile score” is the 1–100 percentile that the state/population group falls in among the full distribution of all groups with available data. Refer to Study Methods for methodological detail.

Achieving Racial and Ethnic Equity in U.S. Health Care: A Scorecard of State Performance 29
commonwealthfund.org Report November 2021
State
Percentilescore
(1–100)
Rank among AANHPI
populations(23 states)
Percentilescore
(1–100)
Rank among AANHPI
populations(24 states)
Percentilescore
(1–100)
Rank among AANHPI
populations(30 states)
Percentilescore
(1–100)
Rank among AANHPI
populations(41 states)
Alabama — — — — — — 68 12Alaska — — — — — — 1 41Arizona 69 16 86 19 63 14 43 22Arkansas — — — — — — 55 17California 95 5 93 11 92 6 77 8Colorado 85 11 97 6 67 12 64 14Connecticut 92 8 99 3 93 4 39 24Delaware — — — — — — 16 34District of Columbia — — — — — — 41 23Florida 74 13 91 16 63 13 46 21Georgia 64 18 89 18 42 22 37 25Hawaii 94 6 72 22 96 2 96 1Idaho — — — — — — — —Illinois 73 14 94 10 62 15 30 27Indiana — — — — 44 21 22 31Iowa — — — — 34 25 49 19Kansas — — — — 22 28 23 30Kentucky — — — — — — 14 36Louisiana — — — — 13 30 72 9Maine — — — — — — — —Maryland 99 2 95 8 93 4 88 3Massachusetts 99 1 100 1 98 1 84 4Michigan 96 4 98 5 81 9 84 4Minnesota 57 21 85 20 55 18 21 32Mississippi — — — — — — — —Missouri — — — — 40 23 13 37Montana — — — — — — — —Nebraska — — — — — — 14 35Nevada 67 17 72 22 49 19 70 10New Hampshire — — — — — — 70 10New Jersey 94 6 98 4 95 3 59 16New Mexico — — — — — — — —New York 75 12 95 8 77 10 19 33North Carolina 61 19 91 15 56 16 8 39North Dakota — — — — — — — —Ohio 61 19 93 12 34 25 25 29Oklahoma — — — — 38 24 33 26Oregon 73 14 89 17 46 20 62 15Pennsylvania 98 3 99 2 82 8 84 4Rhode Island — — — — — — 26 28South Carolina — — — — 18 29 9 38South Dakota — — — — — — — —Tennessee — — — — — — 55 17Texas 53 22 92 13 56 16 3 40Utah 43 23 46 24 28 27 48 20Vermont — — — — — — — —Virginia 89 10 92 13 70 11 79 7Washington 92 8 96 7 82 7 65 13West Virginia — — — — — — — —Wisconsin — — 78 21 — — 94 2Wyoming — — — — — — — —
Notes: “—” indicates insufficient data to produce an overall or dimension-specific score. Groups missing at least one dimension score were not eligible for an overall performance score. “Percentile score” is the 1–100 percentile that the state/population group falls in among the full distribution of all groups with available data. Refer to Appendix C for methodological detail.
Appendix B2b. Summary of State Health System Performance Rankings and Scores for Asian American, Native Hawaiian, and Pacific Islander Populations
Overall Access Quality and UseOutcomes
APPENDIX B2B. Summary of State Health System Performance Rankings and Scores for Asian American, Native Hawaiian, and Pacific Islander Populations
Notes: “—” indicates insufficient data to produce an overall or dimension-specific score. Groups missing at least one dimension score were not eligible for an overall performance score. “Percentile score” is the 1–100 percentile that the state/population group falls in among the full distribution of all groups with available data. Refer to Study Methods for methodological detail.

Achieving Racial and Ethnic Equity in U.S. Health Care: A Scorecard of State Performance 30
commonwealthfund.org Report November 2021
State
Percentilescore
(1–100)
Rank among Black
populations(38 states)
Percentilescore
(1–100)
Rank among Black
populations(38 states)
Percentilescore
(1–100)
Rank among Black
populations(40 states)
Percentilescore
(1–100)
Rank among Black
populations(40 states)
Alabama 19 27 13 26 46 27 30 28Alaska — — — — — — 53 12Arizona 30 19 25 9 54 20 15 37Arkansas 31 18 11 29 59 17 59 10California 40 11 18 20 90 4 26 32Colorado 40 11 38 1 39 29 35 25Connecticut 55 4 25 8 84 6 59 9Delaware 35 14 23 12 70 11 28 29District of Columbia 43 9 13 27 83 7 60 8Florida 23 24 23 12 31 35 38 24Georgia 30 19 23 12 35 31 43 18Hawaii — — — — — — — —Idaho — — — — — — — —Illinois 18 28 6 35 64 13 27 31Indiana 16 31 16 23 48 23 11 39Iowa 32 17 16 22 61 14 44 16Kansas 14 34 20 16 19 39 48 15Kentucky 34 15 18 20 47 25 67 5Louisiana 18 29 9 32 47 24 28 29Maine — — — — — — — —Maryland 64 3 26 7 94 3 72 3Massachusetts 70 2 33 2 95 2 74 2Michigan 14 34 5 37 72 9 13 38Minnesota 36 13 31 4 35 31 43 18Mississippi 8 37 8 33 38 30 18 36Missouri 9 36 10 31 31 35 31 26Montana — — — — — — — —Nebraska 22 25 19 17 28 37 54 11Nevada 18 29 19 17 47 25 11 40New Hampshire — — — — — — — —New Jersey 42 10 23 11 72 9 43 18New Mexico — — — — — — — —New York 53 5 28 6 80 8 44 16North Carolina 33 16 19 17 44 28 66 6North Dakota — — — — 1 40 — —Ohio 26 22 11 30 57 19 39 23Oklahoma 6 38 7 34 27 38 26 32Oregon — — — — 61 14 39 22Pennsylvania 45 8 15 25 87 5 53 13Rhode Island 80 1 32 3 98 1 92 1South Carolina 27 21 16 23 32 34 61 7South Dakota — — — — — — — —Tennessee 26 22 12 28 53 21 41 21Texas 22 25 21 15 33 33 31 26Utah — — — — — — — —Vermont — — — — — — — —Virginia 48 6 24 10 61 14 68 4Washington 48 6 31 4 53 21 53 13West Virginia 15 33 5 38 68 12 23 35Wisconsin 16 32 6 35 58 18 24 34Wyoming — — — — — — — —
Notes: “—” indicates insufficient data to produce an overall or dimension-specific score. Groups missing at least one dimension score were not eligible for an overall performance score. “Percentile score” is the 1–100 percentile that the state/population group falls in among the full distribution of all groups with available data. Refer to Appendix C for methodological detail.
Appendix B2c. Summary of State Health System Performance Rankings and Scores for Black Populations
Overall Access Quality and UseOutcomes
Notes: “—” indicates insufficient data to produce an overall or dimension-specific score. Groups missing at least one dimension score were not eligible for an overall performance score. “Percentile score” is the 1–100 percentile that the state/population group falls in among the full distribution of all groups with available data. Refer to Study Methods for methodological detail.
APPENDIX B2C. Summary of State Health System Performance Rankings and Scores for Black Populations

Achieving Racial and Ethnic Equity in U.S. Health Care: A Scorecard of State Performance 31
commonwealthfund.org Report November 2021
State
Percentilescore
(1–100)
Rank among Latinx/Hispanic
populations(42 states)
Percentilescore
(1–100)
Rank among Latinx/Hispanic
populations(42 states)
Percentilescore
(1–100)
Rank among Latinx/Hispanic
populations(48 states)
Percentilescore
(1–100)
Rank among Latinx/Hispanic
populations(48 states)
Alabama 28 26 53 36 8 37 57 10Alaska — — — — 15 29 22 28Arizona 32 23 55 34 26 17 21 29Arkansas 12 36 74 17 7 39 6 44California 50 10 76 14 42 5 15 36Colorado 45 13 56 33 23 20 51 13Connecticut 68 4 79 12 40 8 75 6Delaware 30 25 74 17 10 35 30 25District of Columbia — — — — 62 3 78 4Florida 38 19 76 15 26 17 22 27Georgia 16 35 81 10 4 45 16 35Hawaii 82 2 52 37 87 1 86 2Idaho 28 26 68 24 14 30 19 31Illinois 45 13 82 8 30 13 14 37Indiana 21 33 72 19 17 25 5 46Iowa 41 17 67 25 23 20 37 20Kansas 24 30 61 30 12 31 21 29Kentucky 23 32 55 35 16 27 12 38Louisiana 36 22 66 27 16 27 46 16Maine — — — — — — — —Maryland 41 17 90 1 12 32 34 23Massachusetts 86 1 79 11 75 2 93 1Michigan 69 3 45 39 59 4 80 3Minnesota 24 30 75 16 17 25 7 42Mississippi — — — — 7 38 51 12Missouri 32 24 62 29 21 23 18 33Montana 45 13 35 42 37 11 48 14Nebraska 11 38 72 19 6 40 6 43Nevada 27 28 86 5 19 24 4 47New Hampshire — — — — 30 13 60 9New Jersey 47 12 81 9 31 12 17 34New Mexico 50 10 42 40 41 7 45 18New York 56 6 79 12 39 9 46 17North Carolina 12 36 88 3 3 47 8 41North Dakota — — — — 22 22 71 7Ohio 42 16 67 25 26 16 33 24Oklahoma 10 39 72 19 4 44 11 39Oregon 51 9 83 7 27 15 36 21Pennsylvania 66 5 58 32 42 5 77 5Rhode Island 54 7 64 28 37 10 48 14South Carolina 19 34 84 6 5 42 19 31South Dakota — — — — 3 46 57 10Tennessee 2 42 68 23 2 48 2 48Texas 9 40 48 38 6 40 10 40Utah 37 20 72 19 11 33 62 8Vermont — — — — — — — —Virginia 37 20 88 2 9 36 40 19Washington 52 8 87 4 24 19 36 21West Virginia — — — — — — — —Wisconsin 26 29 61 30 10 34 25 26Wyoming 5 41 40 41 5 43 6 44
Notes: “—” indicates insufficient data to produce an overall or dimension-specific score. Groups missing at least one dimension score were not eligible for an overall performance score. “Percentile score” is the 1–100 percentile that the state/population group falls in among the full distribution of all groups with available data. Refer to Appendix C for methodological detail.
Appendix B2d. Summary of State Health System Performance Rankings and Scores for Latinx/Hispanic Populations
Overall Access Quality and UseOutcomes
Notes: “—” indicates insufficient data to produce an overall or dimension-specific score. Groups missing at least one dimension score were not eligible for an overall performance score. “Percentile score” is the 1–100 percentile that the state/population group falls in among the full distribution of all groups with available data. Refer to Study Methods for methodological detail.
APPENDIX B2D. Summary of State Health System Performance Rankings and Scores for Latinx/Hispanic Populations

Achieving Racial and Ethnic Equity in U.S. Health Care: A Scorecard of State Performance 32
commonwealthfund.org Report November 2021
State
Percentilescore
(1–100)
Rank among white
populations(51 states)
Percentilescore
(1–100)
Rank among white
populations(51 states)
Percentilescore
(1–100)
Rank among white
populations(51 states)
Percentilescore
(1–100)
Rank among white
populations(51 states)
Alabama 60 41 32 45 66 38 75 36Alaska 63 37 75 7 54 45 50 49Arizona 76 27 58 18 73 31 81 29Arkansas 52 47 28 48 65 39 61 46California 89 10 74 8 90 10 85 25Colorado 87 12 85 2 74 29 90 17Connecticut 97 3 80 5 96 6 99 3Delaware 87 12 47 30 88 14 96 8District of Columbia 100 1 96 1 99 2 100 1Florida 67 34 44 33 55 44 78 34Georgia 66 36 39 39 57 43 79 33Hawaii 95 5 84 3 88 13 98 5Idaho 57 45 61 16 48 49 50 49Illinois 79 22 49 27 84 18 82 27Indiana 60 41 33 44 75 28 67 42Iowa 85 15 48 29 89 12 93 12Kansas 74 30 40 38 80 21 82 27Kentucky 54 46 26 50 74 29 63 44Louisiana 58 43 34 43 71 32 65 43Maine 77 25 46 31 80 21 85 25Maryland 93 6 61 16 97 4 98 5Massachusetts 98 2 77 6 99 3 99 2Michigan 81 20 41 37 90 10 88 20Minnesota 92 7 74 8 86 15 96 9Mississippi 38 51 27 49 45 50 53 48Missouri 58 43 37 40 57 42 70 41Montana 70 33 65 11 68 35 71 40Nebraska 81 20 50 26 77 25 95 10Nevada 62 39 37 40 65 39 73 39New Hampshire 89 11 58 19 91 9 91 15New Jersey 90 8 63 12 94 7 90 17New Mexico 72 31 51 24 76 26 77 35New York 90 8 63 12 97 4 87 22North Carolina 79 22 45 32 70 34 98 5North Dakota 76 28 63 12 71 32 81 29Ohio 67 34 35 42 78 23 73 38Oklahoma 46 50 29 47 51 48 57 47Oregon 77 25 62 15 78 24 80 31Pennsylvania 83 17 42 36 92 8 92 13Rhode Island 96 4 53 22 100 1 98 4South Carolina 72 31 44 33 62 41 90 16South Dakota 75 29 51 24 67 36 86 23Tennessee 62 39 31 46 67 36 80 31Texas 63 38 44 33 52 46 74 37Utah 78 24 82 4 51 47 87 21Vermont 84 16 55 21 86 15 90 17Virginia 83 18 52 23 81 20 94 11Washington 86 14 66 10 83 19 92 13West Virginia 48 49 21 51 76 26 63 44Wisconsin 83 18 56 20 85 17 86 23Wyoming 51 48 49 27 36 51 49 51
Notes: “—” indicates insufficient data to produce an overall or dimension-specific score. Groups missing at least one dimension score were not eligible for an overall performance score. “Percentile score” is the 1–100 percentile that the state/population group falls in among the full distribution of all groups with available data. Refer to Appendix C for methodological detail.
Appendix B2e. Summary of State Health System Performance Rankings and Scores for White Populations
Overall Access Quality and UseOutcomes
Notes: “—” indicates insufficient data to produce an overall or dimension-specific score. Groups missing at least one dimension score were not eligible for an overall performance score. “Percentile score” is the 1–100 percentile that the state/population group falls in among the full distribution of all groups with available data. Refer to Study Methods for methodological detail.
APPENDIX B2E. Summary of State Health System Performance Rankings and Scores for White Populations

Achieving Racial and Ethnic Equity in U.S. Health Care: A Scorecard of State Performance 33
commonwealthfund.org Report November 2021
APPENDIX C. Indicator Descriptions and Source Notes
ABBREVIATIONSACS PUMS = American Community Survey, Public Use Micro Sample
BRFSS = Behavioral Risk Factor Surveillance System
CDC = Centers for Disease Control and Prevention
CMS = Centers for Medicare and Medicaid Services
CPS ASEC = Current Population Survey, Annual Social and Economic Supplement
LDS = Limited Data Set
NCCDPHP = National Center for Chronic Disease Prevention and Health Promotion
NCHS = National Center for Health Statistics
NCIRD = National Center for Immunization and Respiratory Diseases
NIS-PUF = National Immunization Survey, Public Use Data File
NSCH = National Survey of Children’s Health
NVSS-I = National Vital Statistics System–Linked Birth and Infant Death Data
NVSS-M = National Vital Statistics System–Mortality Data
WONDER = Wide-ranging Online Data for Epidemiologic Research
Definitions for Indicators
HEALTH OUTCOMES1. Mortality amenable to health care, deaths per 100,000
population: Number of deaths before age 75 per 100,000 population that resulted from causes considered at least partly treatable or preventable with timely and appropriate medical care (see list), as described in Ellen Nolte and Martin McKee, “Measuring the Health of Nations: Analysis of Mortality Amenable to Health Care,” BMJ 327, no. 7424 (Nov. 13, 2003): 1129–32. Authors’ analysis of mortality data from CDC restricted-use Multiple Cause-of-Death file (NCHS) and U.S. Census Bureau population data, 2018–2019.
Causes of death (ages)Intestinal infections (0–14)
Tuberculosis (0–74)
Other infections (diphtheria, tetanus, septicaemia, poliomyelitis) (0–74)
Whooping cough (0–14)
Measles (1–14)
Malignant neoplasm of colon and rectum (0–74)
Malignant neoplasm of skin (0–74)
Malignant neoplasm of breast (0–74)
Malignant neoplasm of cervix uteri (0–74)
Malignant neoplasm of cervix uteri and body of uterus (0–44)
Malignant neoplasm of testis (0–74)
Hodgkin’s disease (0–74)
Leukemia (0–44)
Diseases of the thyroid (0–74)
Diabetes mellitus (0–49)
Epilepsy (0–74)
Chronic rheumatic heart disease (0–74)
Hypertensive disease (0–74)
Cerebrovascular disease (0–74)
All respiratory diseases (excluding pneumonia and influenza) (1–14)
Influenza (0–74)
Pneumonia (0–74)

Achieving Racial and Ethnic Equity in U.S. Health Care: A Scorecard of State Performance 34
commonwealthfund.org Report November 2021
Peptic ulcer (0–74)
Appendicitis (0–74)
Abdominal hernia (0–74)
Cholelithiasis and cholecystitis (0–74)
Nephritis and nephrosis (0–74)
Benign prostatic hyperplasia (0–74)
Maternal death (all ages)
Congenital cardiovascular anomalies (0–74)
Perinatal deaths, all causes, excluding stillbirths (all ages)
Misadventures to patients during surgical and medical care (all ages)
Ischemic heart disease: 50% of mortality rates included (0–74)
2. Infant mortality, deaths per 1,000 live births: Authors’ analysis of NVSS-I, 2017–2018 (NCHS), retrieved using CDC WONDER.
3. Breast cancer age-adjusted deaths per 100,000 female population: Authors’ analysis of NVSS–M, 2018–19 (NCHS), retrieved using CDC WONDER.
4. Colorectal cancer age-adjusted deaths per 100,000 population: Authors’ analysis of NVSS–M, 2018–19 (NCHS), retrieved using CDC WONDER.
5. Thirty-day hospital readmissions for adults age 65 and older, per 1,000 Medicare beneficiaries: All hospital admissions among fee-for-service Medicare beneficiaries age 65 and older who were readmitted within 30 days of an acute hospital stay for any cause. A correction was made to account for likely transfers between hospitals. Analysis of the 2019 LDS 5% sample of Medicare claims (CMS) by Angelina Lee and Kevin Neipp, Westat. Race data only available for Black and white populations—ethnicity is unknown.
6. Adults who smoke: Percent of adults ages 18 and older who ever smoked 100 or more cigarettes (five packs) and currently smoke every day or some days. Authors’ analysis of 2019–20 BRFSS (CDC, NCCDPHP).
7. Adults who are obese: Percent of adults ages 18–64 who are obese (Body Mass Index [BMI] ≥ 30). BMI was calculated based on reported height and weight. Authors’ analysis of 2019–20 BRFSS (CDC, NCCDPHP).
8. Adults who have lost six or more teeth: Percent of adults ages 18–64 who have lost 6 or more teeth due to tooth decay, infection, or gum disease. Authors’ analysis of 2018 and 2020 BRFSS (CDC, NCCDPHP).
HEALTH CARE ACCESS9. Adults ages 19–64 uninsured: Percent of adults ages
19–64 without health insurance coverage. Authors’ analysis of 2019 one-year ACS PUMS (U.S. Census Bureau).
10. Children ages 0–18 uninsured: Percent of children ages 0–18 without health insurance coverage. Authors’ analysis of 2019 one-year ACS PUMS (U.S. Census Bureau).
11. Adults who went without care because of cost in the past year: Percent of adults age 18 and older who reported a time in the past 12 months when they needed to see a doctor but could not because of cost. Authors’ analysis of 2019–20 BRFSS (CDC, NCCDPHP).
12. Individuals with high out-of-pocket medical spending: Percent of individuals residing in households where all residents are under age 65 with out-of-pocket medical spending that equaled 10 percent or more of income, or 5 percent or more of income if low-income (under 200% of federal poverty level), not including over-the-counter drug costs or health insurance premiums. This measure is limited to individuals who are insured and is different from a similar measure reported in the Commonwealth Fund State Scorecard that includes insured and uninsured individuals. Two years of data are combined to ensure adequate sample size for state-level estimation. Analysis of 2019 and 2020 CPS ASEC (U.S. Census Bureau) by Mikaela Springsteen, Robert F. Wagner School of Public Service, New York University.
13. Adults with a usual source of care: Percent of adults ages 18 and older who had one (or more) person they think of as their personal health care provider. Authors’ analysis of 2019–20 BRFSS (CDC, NCCDPHP).
QUALITY AND USE OF HEALTH CARE SERVICES14. Admissions for ambulatory care–sensitive conditions
for adults age 65 and older, per 1,000 Medicare beneficiaries: Hospital admissions for one of the following eight ambulatory care–sensitive (ACS) conditions: long-term diabetes complications, lower extremity amputation among patients with diabetes, asthma or chronic obstructive pulmonary disease, hypertension, congestive heart failure, dehydration, bacterial pneumonia, and urinary tract infection. Analysis of the 2019 LDS 5 percent sample of Medicare claims (CMS) by Angelina Lee and Kevin Neipp, Westat. Race data only available for Black and white populations—ethnicity is unknown.
15. Potentially avoidable emergency department (ED) visits for adults age 65 and older, per 1,000 Medicare beneficiaries: Potentially avoidable ED visits were those that, based on diagnoses recorded during the visit and the
APPENDIX C. Indicator Descriptions and Source Notes (continued)

Achieving Racial and Ethnic Equity in U.S. Health Care: A Scorecard of State Performance 35
commonwealthfund.org Report November 2021
health care service the patient received, were considered to be either nonemergent (care was not needed within 12 hours), or emergent (care needed within 12 hours) but that could have been treated safely and effectively in a primary care setting. This definition excludes any ED visit that resulted in an admission, as well as ED visits where the level of care provided in the ED was clinically indicated. This approach uses the New York University Center for Health and Public Service Research emergency department algorithm developed by John Billings, Nina Parikh, and Tod Mijanovich (see: Emergency Room Use—The New York Story, Commonwealth Fund, Nov. 2000). Analysis of the 2019 LDS 5 percent sample of Medicare claims (CMS) by Angelina Lee and Kevin Neipp, Westat. Race data only available for Black and white populations—ethnicity is unknown.
16. Adult women who received a mammogram: Percent of women ages 50–74 who received a mammogram in the past two years. Authors’ analysis of 2018 and 2020 BRFSS (CDC, NCCDPHP).
17. Adult women who received a cervical cancer screening test: Percent of women ages 25–64 who received a pap smear in the past three years. Authors’ analysis of 2018 and 2020 BRFSS (CDC, NCCDPHP).
18. Adults who received a colon cancer screening test: Percent of adults ages 50–74 who received a sigmoidoscopy or a colonoscopy in the past 10 years or a fecal occult blood test in the past two years. Authors’ analysis of 2018 and 2020 BRFSS (CDC, NCCDPHP).
19. Adults who received a recent flu vaccine: Percent of adults age 18 and older who received a flu shot in the past year. Authors’ analysis of 2019–20 BRFSS (CDC, NCCDPHP).
20. Older adults who received the pneumonia vaccine: Percent of adults age 65 and older who ever received a pneumonia vaccine. Authors’ analysis of 2019–20 BRFSS (CDC, NCCDPHP).
21. Children with a medical and dental preventive care visit in the past year: Percent of children ages 0–17 who had a preventive medical visit and, if ages 1–17, a preventive dental visit in the past year, according to parents’ reports. For more information, see www.childhealthdata.org. Authors’ analysis of 2019–20 NSCH (U.S. Census Bureau & Data Resource Center for Child and Adolescent Heath). Race/ethnicity data available for this report for Black (non-Latinx/Hispanic), white (non-Latinx/Hispanic) and Latinx/Hispanic (any race) populations.
22. Children ages 19–35 months who received all recommended vaccines: Percent of children ages 19–35 months who received at least 4 doses of diphtheria, tetanus, and accellular pertussis (DTaP/DT/DTP) vaccine; at least 3 doses of poliovirus vaccine; at least one dose of measles-containing vaccine (including measles-mumps-rubella (MMR) vaccine); the full series of Haemophilus influenza type b (Hib) vaccine (three or four doses depending on product type); at least three doses of hepatitis B vaccine (HepB); at least one dose of varicella vaccine, and at least four doses of pneumococcal conjugate vaccine (PCV). Data from the 2019 NIS-PUF (CDC, NCIRD). Race/ethnicity data available for this report for Black (non-Latinx/Hispanic), white (non-Latinx/Hispanic) and Latinx/Hispanic (any race) populations.
23. Adults without a dental visit in past year: Percent of adults age 18 and older who did not visit a dentist or dental clinic within the past year. Authors’ analysis of 2018 and 2020 BRFSS (CDC, NCCDPHP).
24. Primary care as a share of total Medicare spending for adults age 65 and older, Medicare beneficiaries: Share of Medicare fee-for-service health care spending attributed to primary care for each population group within a state. We based our approach on the method used by Reid, Damberg, and Friedberg (JAMA 2019) that characterizes a “broad” definition for primary care provider types and a “broad” definition of included services. Under this “broad/broad” definition, we include all professional services billed by physicians, physician assistants, and nurse practitioners in family medicine, internal medicine, general practice, geriatric medicine, and obstetrics and gynecology; hospitalists are excluded. Analysis of the 2019 LDS 5 percent sample of Medicare claims (CMS) by Angelina Lee and Kevin Neipp, Westat. Race data only available for Black and white populations—ethnicity is unknown.
APPENDIX C. Indicator Descriptions and Source Notes (continued)

About the Commonwealth FundThe mission of the Commonwealth Fund is to promote a high-performing health care system that achieves better access, improved quality, and greater efficiency, particularly for society’s most vulnerable, including low-income people, the uninsured, and people of color. Support for this research was provided by the Commonwealth Fund. The views presented here are those of the authors and not necessarily those of the Commonwealth Fund or its directors, officers, or staff.


![Performance Measure Congruity and the Balanced Scorecard · Performance Measure Congruity and the Balanced Scorecard ... Contrary to Kaplan and Norton’s [1996] intention for scorecard](https://img.pdfslide.us/doc/110x75/5e32821d40504757394a2662/performance-measure-congruity-and-the-balanced-scorecard-performance-measure-congruity.jpg)